Optimización de la quimioterapia y la radioterapia en cuanto a las neoplasias secundarias y la supervivencia general y libre de evolución para pacientes con linfoma de Hodgkin que no han sido tratados: análisis de datos de pacientes individuales
Referencias
References to studies included in this review
References to studies excluded from this review
Additional references
References to other published versions of this review
Characteristics of studies
Characteristics of included studies [ordered by study ID]
Ir a:
| Methods | Late randomisation at CR after chemotherapy Recruited 1995 to 1998 | |
| Participants | Sites: not given Stage: I, II, III, IV Age: under 21 | |
| Interventions | (4 to 6 COPP/ABVD or 2 intensive multidrug chemotherapy) versus (4 to 6 COPP/ABVD or 2 intensive multidrug chemotherapy + IF.RT), choice of chemotherapy depending on stage | |
| Outcomes | Event‐free survival, OS, SMN | |
| Study Question | Chemotherapy alone or plus radiotherapy (SQ1) | |
| Median Year of Recruitment | ||
| Numbers of participants randomised (analysed) per arm | 250 (250) versus 251 (251) | |
| Notes | ||
| Risk of bias | ||
| Bias | Authors' judgement | Support for judgement |
| Random sequence generation (selection bias) | Unclear risk | Not reported. |
| Allocation concealment (selection bias) | Unclear risk | Patients were allocated "in a randomized fashion" |
| Blinding (performance bias and detection bias) | High risk | No blinding of patients or treating physicians. |
| Blinding of outcome assessment (detection bias) | Low risk | We assume that death is objectively and completely reported. |
| Blinding of outcome assessment (detection bias) | High risk | These events may not be absolutely objectively and completely reported. |
| Incomplete outcome data (attrition bias) | Low risk | No dropouts reported. |
| Other bias | Low risk | None found. |
| Methods | Randomised Recruited 1999 to 2006 | |
| Participants | Multicentre US intergroup (ECOG, CALG‐B, Canadain NCIC); bulky mediastinal disease or advanced stage | |
| Interventions | 6 to 8 cycles ABVD + RT (bulky mediastinal only) versus Stanford V + RT (all bulky disease) | |
| Outcomes | SMN, OS, Failure‐free survival | |
| Study Question | Intensified CT (SQ5) | |
| Median Year of Recruitment | ||
| Numbers of participants randomised (analysed) per arm | 428 (395) versus 426 (399) | |
| Notes | Study not found in 2010 search; results summarised in review text but not included in meta‐analysis. | |
| Risk of bias | ||
| Bias | Authors' judgement | Support for judgement |
| Random sequence generation (selection bias) | Unclear risk | Randomised with two stratification factors (IPS: 0‐2 vs 3‐7; locally extensive vs advanced‐stage disease); method not stated. |
| Allocation concealment (selection bias) | Unclear risk | Method not stated. |
| Blinding (performance bias and detection bias) | High risk | No blinding of patients or treating physicians. |
| Blinding of outcome assessment (detection bias) | Low risk | We assume that death is objectively and completely reported. |
| Blinding of outcome assessment (detection bias) | High risk | These events may not be absolutely objectively and completely reported. |
| Incomplete outcome data (attrition bias) | High risk | 60 patients excluded after randomisation due to pathology review (21) or other ineligibility. |
| Other bias | Low risk | None found. |
| Methods | Late randomisation at CR after 4 to 6 cycles Recruited 1989 to 2000 | |
| Participants | Sites: multi‐centre Europe (EORTC: B, D, E, F, I, NL, PL, PT) Stage: III to IV Age: 15 to 70 | |
| Interventions | Pts. attaining CR: (6 to 8 cycles MOPP/ABV) versus (6 to 8 cycles MOPP/ABV + IF.RT) | |
| Outcomes | SMN, OS, PFS | |
| Study Question | Chemotherapy alone or plus radiotherapy (SQ1) | |
| Median Year of Recruitment | 1994 | |
| Numbers of participants randomised (analysed) per arm | 161 (161) versus 172 (172) | |
| Notes | ||
| Risk of bias | ||
| Bias | Authors' judgement | Support for judgement |
| Random sequence generation (selection bias) | Low risk | Minimisation method. |
| Allocation concealment (selection bias) | Low risk | "...randomization performed at the Department of Biostatistics and Epidemiology....Treatment assignments were provided by telephone or fax machine." |
| Blinding (performance bias and detection bias) | High risk | No blinding of patients or treating physicians. |
| Blinding of outcome assessment (detection bias) | Low risk | We assume that death is objectively and completely reported. |
| Blinding of outcome assessment (detection bias) | High risk | These events may not be absolutely objectively and completely reported. |
| Incomplete outcome data (attrition bias) | Low risk | "...the diagnosis of HL was...excluded in 20 (patients)... These patients were equally distributed among the five subgroups of patients." Unclear how or whether those patients are included in the analyses. |
| Other bias | Low risk | None found. |
| Methods | Randomisation to 3 groups Recruited 1993 to 1999 | |
| Participants | Sites: multi‐centre Europe (EORTC and GELA: B, E, F, I, NL, PL, PT, SLO) Stage: I and II supradiaphragmatic unfavourable Age: 15 to 70 | |
| Interventions | (6 MOPP/ABV + IF.RT) versus (4 MOPP/ABV + IF.RT) versus (4 MOPP/ABV + TNI) | |
| Outcomes | SMN, OS, PFS | |
| Study Question | RT field (SQ2); number of CT cycles (SQ4) | |
| Median Year of Recruitment | 1996 | |
| Numbers of participants randomised (analysed) per arm | 336 (329) versus 333 (331) versus 327 (324) | |
| Notes | Each study question used data from 2 of the 3 treatment groups | |
| Risk of bias | ||
| Bias | Authors' judgement | Support for judgement |
| Random sequence generation (selection bias) | Low risk | Block randomisation, stratified by centre. |
| Allocation concealment (selection bias) | Low risk | "central randomization by Clinical Research Unit" |
| Blinding (performance bias and detection bias) | High risk | No blinding of patients or treating physicians. |
| Blinding of outcome assessment (detection bias) | Low risk | We assume that death is objectively and completely reported. |
| Blinding of outcome assessment (detection bias) | High risk | These events may not be absolutely objectively and completely reported. |
| Incomplete outcome data (attrition bias) | Low risk | Few outcomes of restaging at end of chemotherapy and end of treatment are missing in all 3 study groups. No explanation given. |
| Other bias | Low risk | None found. |
| Methods | Randomisation to 3 groups Recruited 1998 to 2004 | |
| Participants | Sites: multi‐centre Europe (EORTC and GELA) Stage: I and II supradiaphragmatic favourable | |
| Interventions | (6 EBVP + IF.RT 36 Gy) versus (6 EBVP + IF.RT 20 Gy) versus (6 EBVP) | |
| Outcomes | SMN, OS, PFS | |
| Study Question | Chemotherapy alone or plus radiotherapy (SQ1); RT dose (SQ3) | |
| Median Year of Recruitment | 2001 | |
| Numbers of participants randomised (analysed) per arm | 239 (239) versus 209 (209) versus 130 (130) | |
| Notes | Early termination of no‐RT group in 2002 due to stopping rules (poor results). SQ1 used data from all groups; SQ3 used data from the first 2 groups. | |
| Risk of bias | ||
| Bias | Authors' judgement | Support for judgement |
| Random sequence generation (selection bias) | Unclear risk | No information. |
| Allocation concealment (selection bias) | Unclear risk | No information. Other studies with central randomisation by clinical research unit. |
| Blinding (performance bias and detection bias) | High risk | No blinding of patients or treating physicians. |
| Blinding of outcome assessment (detection bias) | Low risk | We assume that death is objectively and completely reported. |
| Blinding of outcome assessment (detection bias) | High risk | These events may not be absolutely objectively and completely reported. |
| Incomplete outcome data (attrition bias) | Low risk | Data complete. |
| Other bias | Low risk | None found. |
| Methods | Randomisation to 3 groups Recruited 1998 to 2002 | |
| Participants | Sites: multi‐centre Europe (EORTC and GELA) Stage: I and II supradiaphragmatic unfavourable | |
| Interventions | (6 ABVD + IF.RT) versus (4 ABVD + IF.RT) versus (4 BEACOPP baseline + IF.RT) | |
| Outcomes | SMN, OS, PFS | |
| Study Question | Number of CT cycles (SQ4) | |
| Median Year of Recruitment | 2000 | |
| Numbers of participants randomised (analysed) per arm | 276 (276) versus 277 (277) versus 255 (‐) | |
| Notes | Used data from first 2 groups only (unconfounded) | |
| Risk of bias | ||
| Bias | Authors' judgement | Support for judgement |
| Random sequence generation (selection bias) | Unclear risk | No information. |
| Allocation concealment (selection bias) | Unclear risk | No information. Other studies with central randomisation by clinical research unit. |
| Blinding (performance bias and detection bias) | High risk | No blinding of patients or treating physicians. |
| Blinding of outcome assessment (detection bias) | Low risk | we assume that death is objectively and completely reported. |
| Blinding of outcome assessment (detection bias) | High risk | These events may not be absolutely objectively and completely reported. |
| Incomplete outcome data (attrition bias) | Low risk | Data complete. |
| Other bias | Low risk | None found. |
| Methods | Randomisation to 2 groups Recruited 1992 to 1996 | |
| Participants | Sites: 28 sites in Germany Stage: advanced stage, IIB‐IV | |
| Interventions | (4 double cycles standard COPP/ABVD) vs. (dose‐ and time‐intensified COPP/ABVD with growth‐factor support) | |
| Outcomes | Response rate, survival (unspecified) | |
| Study Question | Intensified CT (SQ5) | |
| Median Year of Recruitment | ||
| Numbers of participants randomised (analysed) per arm | 264 (238) in total (numbers per arm not available), 119 vs. 119 | |
| Notes | ||
| Risk of bias | ||
| Bias | Authors' judgement | Support for judgement |
| Random sequence generation (selection bias) | Unclear risk | Patients were randomised, no further information given. |
| Allocation concealment (selection bias) | Unclear risk | Patients were randomised, no further information given. |
| Blinding (performance bias and detection bias) | High risk | No blinding of patients or treating physicians. |
| Blinding of outcome assessment (detection bias) | Unclear risk | OS not given. |
| Blinding of outcome assessment (detection bias) | High risk | These events may not be absolutely objectively and completely reported |
| Incomplete outcome data (attrition bias) | High risk | Preliminary data were published with response rates only. 238 of 264 included patients were evaluable, reasons not given. |
| Other bias | Low risk | None found. |
| Methods | Randomisation to 4 groups (2 x 2 factorial) Recruited 1998 to 2003 | |
| Participants | Sites: multi‐centre (GHSG: mainly Germany) Stage: I and II favourable Age: 16 to 75 | |
| Interventions | (4 ABVD + IF.RT 30 Gy) versus (4 ABVD + IF.RT 20 Gy) versus (2 ABVD + IF.RT 30 Gy) versus (2 ABVD + IF.RT 20 Gy) | |
| Outcomes | SMN, OS, PFS | |
| Study Question | RT dose (SQ3); number of CT cycles (SQ4) | |
| Median Year of Recruitment | 2000 | |
| Numbers of participants randomised (analysed) per arm | 346 (298) versus 340 (298) versus 341 (295) versus 343 (299) | |
| Notes | Each study question used data from all 4 treatment groups (2 versus 2). Exclusions from analysis due to wrong initial staging (133), HL not centrally confirmed (30) or other exclusion criteria (17) as described in GHSG HD10. | |
| Risk of bias | ||
| Bias | Authors' judgement | Support for judgement |
| Random sequence generation (selection bias) | Low risk | Stratified randomisation using minimisation (site, age, B‐symptoms, infradiaphragmatic disease, albumin). |
| Allocation concealment (selection bias) | Low risk | Central randomisation by phone. |
| Blinding (performance bias and detection bias) | High risk | No blinding of patients or treating physicians. |
| Blinding of outcome assessment (detection bias) | Low risk | We assume that death is objectively and completely reported. |
| Blinding of outcome assessment (detection bias) | High risk | These events may not be absolutely objectively and completely reported. |
| Incomplete outcome data (attrition bias) | Low risk | Data complete. |
| Other bias | Low risk | None found. |
| Methods | Randomisation to 4 groups (2 x 2 factorial) Recruited 1998 to 2002 | |
| Participants | Sites: multi‐centre (GHSG: mainly Germany) Stage: I and II favourable Age: 16 to 75 | |
| Interventions | (4 ABVD + IF.RT 30 Gy) versus (4 ABVD + IF.RT 20 Gy) versus (4 BEACOPP baseline + IF.RT 30 Gy) versus (4 BEACOPP baseline + IF.RT 20 Gy) | |
| Outcomes | SMN, OS, PFS | |
| Study Question | RT dose (SQ3) | |
| Median Year of Recruitment | 2000 | |
| Numbers of participants randomised (analysed) per arm | 386 (343) versus 395 (339) versus 394 (332) versus 395 (337) | |
| Notes | Uses data from all 4 treatment groups (2 versus 2) Exclusions from analysis due to wrong initial staging (134), HL not centrally confirmed (19), other exclusion criteria (12) or dropout before starting RT (44) as described in GHSG HD11 | |
| Risk of bias | ||
| Bias | Authors' judgement | Support for judgement |
| Random sequence generation (selection bias) | Low risk | Minimisation method. |
| Allocation concealment (selection bias) | Low risk | Central randomisation by phone. |
| Blinding (performance bias and detection bias) | High risk | No blinding of patients or treating physicians. |
| Blinding of outcome assessment (detection bias) | Low risk | We assume that death is objectively and completely reported. |
| Blinding of outcome assessment (detection bias) | High risk | These events may not be absolutely objectively and completely reported. |
| Incomplete outcome data (attrition bias) | Low risk | Data complete. |
| Other bias | Low risk | None found. |
| Methods | Late randomisation at CR after 6 cycles CT to further CT or RT Recruited 1984 to 88 | |
| Participants | Sites: multi‐centre (GHSG: mainly Germany) Stage: IIIB and IV Age: 15 to 60 | |
| Interventions | (6 COPP/ABVD + IF.RT) versus (8 COPP/ABVD) | |
| Outcomes | SMN, OS, PFS | |
| Study Question | Chemotherapy alone or plus radiotherapy (SQ1) | |
| Median Year of Recruitment | 1985 | |
| Numbers of participants randomised (analysed) per arm | 51 (51) versus 49 (49) | |
| Notes | Confounded | |
| Risk of bias | ||
| Bias | Authors' judgement | Support for judgement |
| Random sequence generation (selection bias) | Low risk | Stratified block randomisation. |
| Allocation concealment (selection bias) | Low risk | Central randomisation by phone. |
| Blinding (performance bias and detection bias) | High risk | No blinding of patients or treating physicians. |
| Blinding of outcome assessment (detection bias) | Low risk | We assume that death is objectively and completely reported. |
| Blinding of outcome assessment (detection bias) | High risk | These events may not be absolutely objectively and completely reported. |
| Incomplete outcome data (attrition bias) | Low risk | Data complete. |
| Other bias | Low risk | None found. |
| Methods | Randomisation (at initial staging); analysis set for RT comparison restricted to Pts. starting RT. Recruited 1993 to 1998 | |
| Participants | Sites: multi‐centre (GHSG: mainly Germany) Stage: I and II unfavourable Age: 15 to 75 | |
| Interventions | (4 COPP/ABVD + EF.RT) versus (4 COPP/ABVD + IF.RT) | |
| Outcomes | SMN, OS, PFS | |
| Study Question | RT field (SQ2) | |
| Median Year of Recruitment | 1996 | |
| Numbers of participants randomised (analysed) per arm | 602 (532) versus 602 (532) | |
| Notes | Exclusions from analysis due to wrong initial staging (33), HL not centrally confirmed (25), other exclusion criteria (10) or dropout before starting RT (72) as described in GHSG HD8 | |
| Risk of bias | ||
| Bias | Authors' judgement | Support for judgement |
| Random sequence generation (selection bias) | Low risk | "..using a computerised random number generator", minimisation |
| Allocation concealment (selection bias) | Low risk | Central randomisation by phone. |
| Blinding (performance bias and detection bias) | High risk | No blinding of patients or treating physicians. |
| Blinding of outcome assessment (detection bias) | Low risk | We assume that death is objectively and completely reported. |
| Blinding of outcome assessment (detection bias) | High risk | These events may not be absolutely objectively and completely reported. |
| Incomplete outcome data (attrition bias) | Low risk | Data complete. |
| Other bias | Low risk | None found. |
| Methods | Randomisation to 3 groups Recruited 1993 to 1998 | |
| Participants | Sites: multi‐centre (GHSG: mainly Germany) Stage: I and II unfavourable Age: 15 to 65 | |
| Interventions | (8 COPP/ABVD +/‐ local RT) versus (8 BEACOPP baseline +/‐ local RT) versus (8 BEACOPP escalated +/‐ local RT) | |
| Outcomes | SMN, OS, PFS | |
| Study Question | Intensified CT (SQ5) | |
| Median Year of Recruitment | 1995 | |
| Numbers of participants randomised (analysed) per arm | 288 (261) versus 496 (466) | |
| Notes | Used data from all 3 groups: (COPP/ABVD and BEACOPP baseline) versus BEACOPP escalated. Exclusions from analysis due to HL not centrally confirmed (27), other exclusion criteria (26) or loss to follow‐up (4) as described in GHSG HD9 and Engert 2009 | |
| Risk of bias | ||
| Bias | Authors' judgement | Support for judgement |
| Random sequence generation (selection bias) | Low risk | Minimisation; randomisation probabilities repeatedly adjusted because of changing circumstances: 3. group started 1 year later because of completion of the dose‐finding‐study for medication, 1. group stopped because of inferiority after planned interim analysis. |
| Allocation concealment (selection bias) | Low risk | Central randomisation by phone and computer. |
| Blinding (performance bias and detection bias) | High risk | No blinding of patients or treating physicians. |
| Blinding of outcome assessment (detection bias) | Low risk | We assume that death is objectively and completely reported. |
| Blinding of outcome assessment (detection bias) | High risk | These events may not be absolutely objectively and completely reported. |
| Incomplete outcome data (attrition bias) | Low risk | Data complete. |
| Other bias | Low risk | None found. |
| Methods | Randomisation to 3 groups Recruited 2000 to 2007 | |
| Participants | Sites: multi‐centre (Gruppo Italiano per la Studio dei Linfomi, Italy) Stage: IIB to IV Age: older than 16 | |
| Interventions | (6 ABVD + local RT) versus (4 escalated + 2 baseline BEACOPP + local RT) versus (6 CEC + local RT) | |
| Outcomes | SMN, OS, PFS | |
| Study Question | Intensified CT (SQ5) | |
| Median Year of Recruitment | 2003 | |
| Numbers of participants randomised (analysed) per arm | 103 (99) versus 204 (196) | |
| Notes | Used data from all 3 groups: ABVD versus (BEACOPP and CEC). Exclusions from analysis due to revised histology (1), withdrawn consent (1) or missing data (10) as described in GISL_HD2000 | |
| Risk of bias | ||
| Bias | Authors' judgement | Support for judgement |
| Random sequence generation (selection bias) | Unclear risk | "Randomization was stratified..." |
| Allocation concealment (selection bias) | Unclear risk | "Randomization was stratified..." |
| Blinding (performance bias and detection bias) | High risk | No blinding of patients or treating physicians. |
| Blinding of outcome assessment (detection bias) | Low risk | We assume that death is objectively and completely reported. |
| Blinding of outcome assessment (detection bias) | High risk | These events may not be absolutely objectively and completely reported. |
| Incomplete outcome data (attrition bias) | Low risk | Data complete. |
| Other bias | Low risk | None found. |
| Methods | Randomisation to 3 groups Recruited 1996 to 2000 | |
| Participants | Sites: multi‐centre (Intergruppo Italiano Linfomi, Italy) Stage: IIB to IV Age: 15 to 65 | |
| Interventions | (6 ABVD + local RT) versus (Stanford V + local RT) versus (6 MEC + local RT) | |
| Outcomes | SMN, OS, PFS | |
| Study Question | Intensified CT (SQ5) | |
| Median Year of Recruitment | 1998 | |
| Numbers of participants randomised (analysed) per arm | 126 (122) versus 228 (213) | |
| Notes | Used data from all 3 groups: ABVD versus (Stanford V and MEC) Exclusions from analysis due to withdrawn consent (7), emigration (1) or missing data (11) as described in IIL_HD9601 | |
| Risk of bias | ||
| Bias | Authors' judgement | Support for judgement |
| Random sequence generation (selection bias) | Low risk | Randomisation by centrally managed lists. |
| Allocation concealment (selection bias) | Low risk | Central randomisation by phone. |
| Blinding (performance bias and detection bias) | High risk | No blinding of patients or treating physicians. |
| Blinding of outcome assessment (detection bias) | Low risk | We assume that death is objectively and completely reported. |
| Blinding of outcome assessment (detection bias) | High risk | These events may not be absolutely objectively and completely reported. |
| Incomplete outcome data (attrition bias) | Low risk | 19 patients reported without data after randomisation not in database. Otherwise data complete. |
| Other bias | Low risk | None found. |
| Methods | Randomised Recruited 2000 to 2007 | |
| Participants | Sites: multi‐centre (Italy, 3 cooperative groups) Stage: IIB to IV Age: 17 to 60 | |
| Interventions | (6 to 8 ABVD +/‐ local RT) versus (4 escalated + 4 baseline BEACOPP + local RT) | |
| Outcomes | SMN, OS, PFS | |
| Study Question | Intensified CT (SQ5) | |
| Median Year of Recruitment | 2004 | |
| Numbers of participants randomised (analysed) per arm | 168 (168) versus 163 (163) | |
| Notes | ||
| Risk of bias | ||
| Bias | Authors' judgement | Support for judgement |
| Random sequence generation (selection bias) | Unclear risk | "stratified and randomised", method not stated. |
| Allocation concealment (selection bias) | Unclear risk | "stratified and randomised", method not stated. |
| Blinding (performance bias and detection bias) | High risk | No blinding of patients or treating physicians. |
| Blinding of outcome assessment (detection bias) | Low risk | We assume that death is objectively and completely reported. |
| Blinding of outcome assessment (detection bias) | High risk | These events may not be absolutely objectively and completely reported. |
| Incomplete outcome data (attrition bias) | Low risk | Data complete. |
| Other bias | Low risk | None found. |
| Methods | Randomised Recruited 1990 to 1996 | |
| Participants | Sites: Milan, Italy Stage: I and IIA Age: 16 to 70 | |
| Interventions | (4 ABVD + STNI) versus (4 ABVD + IF.RT) | |
| Outcomes | SMN, OS, PFS | |
| Study Question | RT field (SQ2) | |
| Median Year of Recruitment | 1992 | |
| Numbers of participants randomised (analysed) per arm | 68 (68) versus 72 (72) | |
| Notes | ||
| Risk of bias | ||
| Bias | Authors' judgement | Support for judgement |
| Random sequence generation (selection bias) | Unclear risk | "randomized study" with stratification |
| Allocation concealment (selection bias) | Unclear risk | Not stated. |
| Blinding (performance bias and detection bias) | High risk | No blinding of patients or treating physicians. |
| Blinding of outcome assessment (detection bias) | Low risk | We assume that death is objectively and completely reported. |
| Blinding of outcome assessment (detection bias) | High risk | These events may not be absolutely objectively and completely reported. |
| Incomplete outcome data (attrition bias) | Low risk | Exclusions and drop‐outs reported. Otherwise data complete. |
| Other bias | Low risk | None found. |
| Methods | Late randomisation at CR/PR after CT Recruited 1986 to 1992 | |
| Participants | Sites: 52 POG institutions Stage: I,IIA, IIIA, HD Age: 3 to 20 | |
| Interventions | (6 MOPP/ABVD) versus (4 MOPP/ABVD + 2 IF.RT) | |
| Outcomes | Event‐free‐survival (EFS), OS, SMN | |
| Study Question | Chemotherapy alone or plus radiotherapy (SQ1) | |
| Median Year of Recruitment | ||
| Numbers of participants randomised (analysed) per arm | 169 in total, (78) versus (81) | |
| Notes | Regimen changed during study due to shortage of supply | |
| Risk of bias | ||
| Bias | Authors' judgement | Support for judgement |
| Random sequence generation (selection bias) | Low risk | Randomisation balanced by stage, M/T ratio, CR/PR response to chemotherapy. |
| Allocation concealment (selection bias) | Low risk | Allocated by call to statistical office. |
| Blinding (performance bias and detection bias) | High risk | No blinding of patients or treating physicians. |
| Blinding of outcome assessment (detection bias) | Low risk | We assume that death is objectively and completely reported. |
| Blinding of outcome assessment (detection bias) | High risk | These events may not be absolutely objectively and completely reported. |
| Incomplete outcome data (attrition bias) | Unclear risk | Exclusions and dropouts reported. |
| Other bias | High risk | Regimen changed during study due to shortage of supply. |
| Methods | Late randomisation at CR/PR after CT Recruited 1998 to 2001 | |
| Participants | Sites: Rome, Italy Stage: II and IIIA Age: 15 to under 75 | |
| Interventions | (4 ABVD + EF.RT) versus (4 ABVD + IF.RT) | |
| Outcomes | SMN, OS, PFS | |
| Study Question | RT field (SQ2) | |
| Median Year of Recruitment | 1995 | |
| Numbers of participants randomised (analysed) per arm | 102 (102) versus 107 (107) | |
| Notes | ||
| Risk of bias | ||
| Bias | Authors' judgement | Support for judgement |
| Random sequence generation (selection bias) | High risk | Sequential randomisation: uneven/even patients in groups 1/2. A model for the selection process was analysed and showed no significant influence of known confounding or risk factors. |
| Allocation concealment (selection bias) | High risk | No concealment, see above. |
| Blinding (performance bias and detection bias) | High risk | No blinding of patients or treating physicians. |
| Blinding of outcome assessment (detection bias) | Low risk | We assume that death is objectively and completely reported. |
| Blinding of outcome assessment (detection bias) | High risk | These events may not be absolutely objectively and completely reported. |
| Incomplete outcome data (attrition bias) | Low risk | Data complete. |
| Other bias | Low risk | None found. |
| Methods | Randomised Recruited 1993 to 1996 | |
| Participants | Sites: Mumbai, India Stage: I to IV Age: under 70 | |
| Interventions | (6 ABVD) versus (6 ABVD + RT) | |
| Outcomes | OS, Event‐free survival | |
| Study Question | Chemotherapy alone or plus radiotherapy (SQ1) | |
| Median Year of Recruitment | ||
| Numbers of participants randomised (analysed) per arm | 84 (84) versus 95 (95) | |
| Notes | ||
| Risk of bias | ||
| Bias | Authors' judgement | Support for judgement |
| Random sequence generation (selection bias) | Low risk | "Patients ... were randomly assigned using computer software for randomization." |
| Allocation concealment (selection bias) | Unclear risk | Not stated. |
| Blinding (performance bias and detection bias) | High risk | No blinding of patients or treating physicians. |
| Blinding of outcome assessment (detection bias) | Low risk | We assume that death is objectively and completely reported. |
| Blinding of outcome assessment (detection bias) | High risk | These events may not be absolutely objectively and completely reported. |
| Incomplete outcome data (attrition bias) | Low risk | Data complete. |
| Other bias | Low risk | None found. |
| Methods | Randomised Recruited 1998 to 2006 | |
| Participants | Sites: multi‐centre (United Kingdom Lymphoma Group, UK) Stage: I to IIA unfavourable or IIIB‐IV Age: 18 to 60 | |
| Interventions | (6 to 8 ABVD +/‐ local RT) versus (Stanford V +/‐ local RT) | |
| Outcomes | SMN, OS, PFS | |
| Study Question | Intensified CT (SQ5) | |
| Median Year of Recruitment | 2003 | |
| Numbers of participants randomised (analysed) per arm | 261 (261) versus 259 (259) | |
| Notes | ||
| Risk of bias | ||
| Bias | Authors' judgement | Support for judgement |
| Random sequence generation (selection bias) | Low risk | Stratified block randomisation. |
| Allocation concealment (selection bias) | Low risk | Central randomisation by phone. |
| Blinding (performance bias and detection bias) | High risk | No blinding of patients or treating physicians. |
| Blinding of outcome assessment (detection bias) | Low risk | We assume that death is objectively and completely reported. |
| Blinding of outcome assessment (detection bias) | High risk | These events may not be absolutely objectively and completely reported. |
| Incomplete outcome data (attrition bias) | Low risk | Data complete. |
| Other bias | Low risk | None found. |
| Methods | Randomised Recruited 1998 to 2001 | |
| Participants | Sites: multi‐centre UK Stage: I to II with B‐symptoms or > 3 sites or bulky disease, and stage III to IV Age: 16 and above | |
| Interventions | (6 or 8 ABVD +/‐ IF.RT) versus (6 or 8 alternating ChlVPP/PABlOE +/‐ IF.RT) | |
| Outcomes | SMN, OS, PFS | |
| Study Question | Intensified CT (SQ5) | |
| Median Year of Recruitment | 1999 | |
| Numbers of participants randomised (analysed) per arm | 295 (287) versus 287 (282) | |
| Notes | Centres which opted for alternating regimen a priori. Use of further cycles and/or RT depended on interim response. Exclusions from analysis due to non‐HL diagnosis (13) as described in UKLG_LY09_Alt | |
| Risk of bias | ||
| Bias | Authors' judgement | Support for judgement |
| Random sequence generation (selection bias) | Low risk | "...minimization‐based methods with 5 stratification factors..." |
| Allocation concealment (selection bias) | Low risk | Central allocation. |
| Blinding (performance bias and detection bias) | High risk | No blinding of patients or treating physicians. |
| Blinding of outcome assessment (detection bias) | Low risk | We assume that death is objectively and completely reported. |
| Blinding of outcome assessment (detection bias) | High risk | These events may not be absolutely objectively and completely reported. |
| Incomplete outcome data (attrition bias) | Low risk | Data complete. |
| Other bias | Low risk | None found. |
| Methods | Randomised Recruited 1998 to 2001 | |
| Participants | Sites: multi‐centre UK Stage: I to II with B‐symptoms or > 3 sites or bulky disease, and stage III to IV Age: 16 and above | |
| Interventions | (6 or 8 ABVD +/‐ IF.RT) versus (6 or 8 hybrid ChlVPP/EVA +/‐ IF.RT) | |
| Outcomes | SMN, OS, PFS | |
| Study Question | Intensified CT (SQ5) | |
| Median Year of Recruitment | 1999 | |
| Numbers of participants randomised (analysed) per arm | 111 (107) versus 114 (112) | |
| Notes | Centres which opted for hybrid regimen a priori. Use of further cycles and/or RT depended on interim response. Exclusions from analysis due to non‐HL diagnosis (6) as described in UKLG_LY09_Hyb | |
| Risk of bias | ||
| Bias | Authors' judgement | Support for judgement |
| Random sequence generation (selection bias) | Low risk | "...minimization‐based methods with 5 stratification factors..." |
| Allocation concealment (selection bias) | Low risk | Central allocation. |
| Blinding (performance bias and detection bias) | High risk | No blinding of patients or treating physicians. |
| Blinding of outcome assessment (detection bias) | Low risk | We assume that death is objectively and completely reported. |
| Blinding of outcome assessment (detection bias) | High risk | These events may not be absolutely objectively and completely reported. |
| Incomplete outcome data (attrition bias) | Low risk | Data complete. |
| Other bias | Low risk | None found. |
CR = complete remission; Pts. = patients; HL = Hodgkin lymphoma; IF.RT = involved field radiotherapy; SMN = secondary malignant neoplasms; OS = overall survival; PFS = progression‐free survival; CT = chemotherapy; RT = radiotherapy; EF.RT = extended field radiotherapy; PR = partial remission; STNI = subtotal nodal irradiation category; TNI = total nodal irradiation category.
MOPP/ABV = mechlorethamine, vincristine, procarbazine, prednisone/adriamycin, bleomycin, vinblastine
EBVP = epirubicin, bleomycin, vinblastine, prednisone
ABVD = adriamycin, bleomycin, vinblastine, dacarbazine
BEACOPP = bleomycin, etoposide, adriamycin, cyclophosphamide, vincristine, procarbazine, prednisone
COPP/ABVD = cyclophosphamide, vincristine, procarbazine, prednisone/adriamycin, bleomycin, vinblastine, dacarbazine
CEC = COPPEBVCAD = cyclophosphamide, lomustine, vindesine, melphalan, prednisone, epidoxorubicin, vincristine, procarbazine, vinblastine, bleomycin
MEC = MOPP/EBV/CAD = mechlorethamine, vincristine, procarbazine, prednisone, epidoxorubicin, bleomycin, vinblastine, lomustine, adriamycin, vindesine
Stanford V = adriamycin, vinblastine, mechlorethamine, vincristine, bleomycin, etoposide, prednisone
ChlVPP/PABlOE = chlorambucil, vinblastine, procarbazine, prednisolone/prednisolone, adriamycin, bleomycin, vincristine, etoposide
ChlVPP/EVA = chlorambucil, vinblastine, procarbazine, prednisolone/etoposide, vincristine, adriamycin
Study Groups: EORTC = European Organisation for Research and Treatment of Cancer, GELA = Groupe d'Etudes des Lymphomes Adulte, GHSG = German Hodgkin Study Group
Countries: B = Belgium, E=Spain, F = France, I = Italy, NL = Netherlands, PL = Poland, PT = Portugal, SLO = Slovenia, UK = United Kingdom
Characteristics of excluded studies [ordered by study ID]
Ir a:
| Study | Reason for exclusion |
| Recruited past 2007 | |
| Recruited well past 2007 |
Data and analyses
| Outcome or subgroup title | No. of studies | No. of participants | Statistical method | Effect size |
| 1 secondary malignant neoplasms Show forest plot | 3 | 1011 | Peto Odds Ratio (95% CI) | 0.43 [0.23, 0.82] |
| Analysis 1.1  Comparison 1 additional radiotherapy, Outcome 1 secondary malignant neoplasms. | ||||
| 1.1 advanced stages | 2 | 433 | Peto Odds Ratio (95% CI) | 0.41 [0.21, 0.81] |
| 1.2 early stages | 1 | 578 | Peto Odds Ratio (95% CI) | 0.67 [0.10, 4.40] |
| 2 overall survival Show forest plot | 3 | 1011 | Hazard Ratio (Fixed, 95% CI) | 0.71 [0.46, 1.11] |
| Analysis 1.2  Comparison 1 additional radiotherapy, Outcome 2 overall survival. | ||||
| 2.1 advanced stages | 2 | 433 | Hazard Ratio (Fixed, 95% CI) | 0.64 [0.40, 1.02] |
| 2.2 early stages | 1 | 578 | Hazard Ratio (Fixed, 95% CI) | 1.97 [0.47, 8.22] |
| 3 progression‐free survival Show forest plot | 3 | 1011 | Hazard Ratio (Fixed, 95% CI) | 1.31 [0.99, 1.73] |
| Analysis 1.3  Comparison 1 additional radiotherapy, Outcome 3 progression‐free survival. | ||||
| 3.1 advanced stages | 2 | 433 | Hazard Ratio (Fixed, 95% CI) | 0.74 [0.51, 1.08] |
| 3.2 early stages | 1 | 578 | Hazard Ratio (Fixed, 95% CI) | 2.56 [1.70, 3.85] |
| Outcome or subgroup title | No. of studies | No. of participants | Statistical method | Effect size |
| 1 secondary malignant neoplasms Show forest plot | 4 | 2397 | Peto Odds Ratio (95% CI) | 0.86 [0.64, 1.16] |
| Analysis 2.1  Comparison 2 radiotherapy field, Outcome 1 secondary malignant neoplasms. | ||||
| 2 overall survival Show forest plot | 4 | 2397 | Hazard Ratio (Fixed, 95% CI) | 0.89 [0.70, 1.12] |
| Analysis 2.2  Comparison 2 radiotherapy field, Outcome 2 overall survival. | ||||
| 3 progression‐free survival Show forest plot | 4 | 2397 | Hazard Ratio (Fixed, 95% CI) | 0.99 [0.81, 1.21] |
| Analysis 2.3  Comparison 2 radiotherapy field, Outcome 3 progression‐free survival. | ||||
| Outcome or subgroup title | No. of studies | No. of participants | Statistical method | Effect size |
| 1 secondary malignant neoplasms Show forest plot | 3 | 2962 | Peto Odds Ratio (95% CI) | 1.03 [0.71, 1.50] |
| Analysis 3.1  Comparison 3 radiotherapy dose, Outcome 1 secondary malignant neoplasms. | ||||
| 2 overall survival Show forest plot | 3 | 2962 | Hazard Ratio (Fixed, 95% CI) | 0.91 [0.65, 1.28] |
| Analysis 3.2  Comparison 3 radiotherapy dose, Outcome 2 overall survival. | ||||
| 3 progression‐free survival Show forest plot | 3 | 2962 | Hazard Ratio (Fixed, 95% CI) | 1.20 [0.97, 1.48] |
| Analysis 3.3  Comparison 3 radiotherapy dose, Outcome 3 progression‐free survival. | ||||
| Outcome or subgroup title | No. of studies | No. of participants | Statistical method | Effect size |
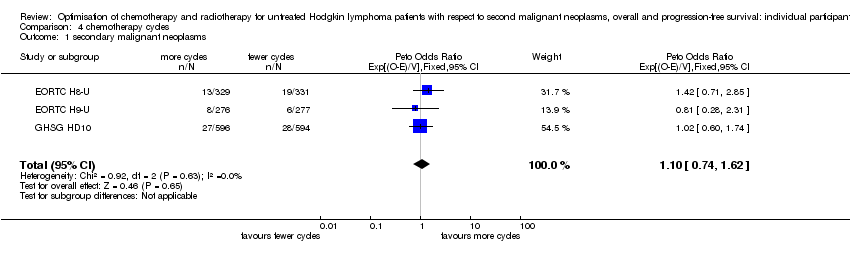
| 1 secondary malignant neoplasms Show forest plot | 3 | 2403 | Peto Odds Ratio (95% CI) | 1.10 [0.74, 1.62] |
| Analysis 4.1  Comparison 4 chemotherapy cycles, Outcome 1 secondary malignant neoplasms. | ||||
| 2 overall survival Show forest plot | 3 | 2403 | Hazard Ratio (Fixed, 95% CI) | 0.99 [0.73, 1.34] |
| Analysis 4.2  Comparison 4 chemotherapy cycles, Outcome 2 overall survival. | ||||
| 3 progression‐free survival Show forest plot | 3 | 2403 | Hazard Ratio (Fixed, 95% CI) | 1.15 [0.91, 1.45] |
| Analysis 4.3  Comparison 4 chemotherapy cycles, Outcome 3 progression‐free survival. | ||||
| Outcome or subgroup title | No. of studies | No. of participants | Statistical method | Effect size |
| 1 secondary malignant neoplasms Show forest plot | 7 | 2996 | Peto Odds Ratio (95% CI) | 1.37 [0.89, 2.10] |
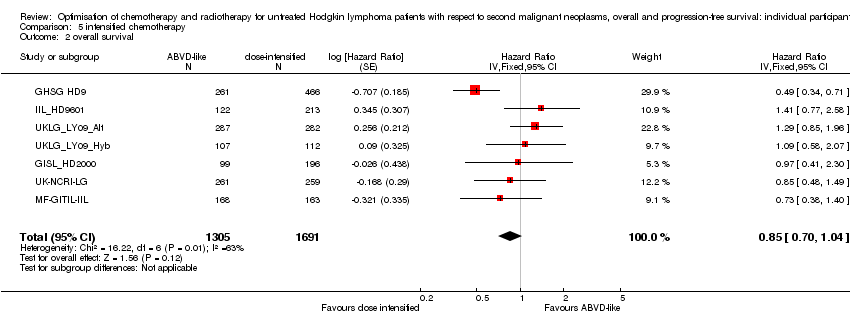
| Analysis 5.1  Comparison 5 intensified chemotherapy, Outcome 1 secondary malignant neoplasms. | ||||
| 2 overall survival Show forest plot | 7 | 2996 | Hazard Ratio (Fixed, 95% CI) | 0.85 [0.70, 1.04] |
| Analysis 5.2  Comparison 5 intensified chemotherapy, Outcome 2 overall survival. | ||||
| 3 progression‐free survival Show forest plot | 7 | 2996 | Hazard Ratio (Fixed, 95% CI) | 0.82 [0.70, 0.95] |
| Analysis 5.3  Comparison 5 intensified chemotherapy, Outcome 3 progression‐free survival. | ||||
| Outcome or subgroup title | No. of studies | No. of participants | Statistical method | Effect size |
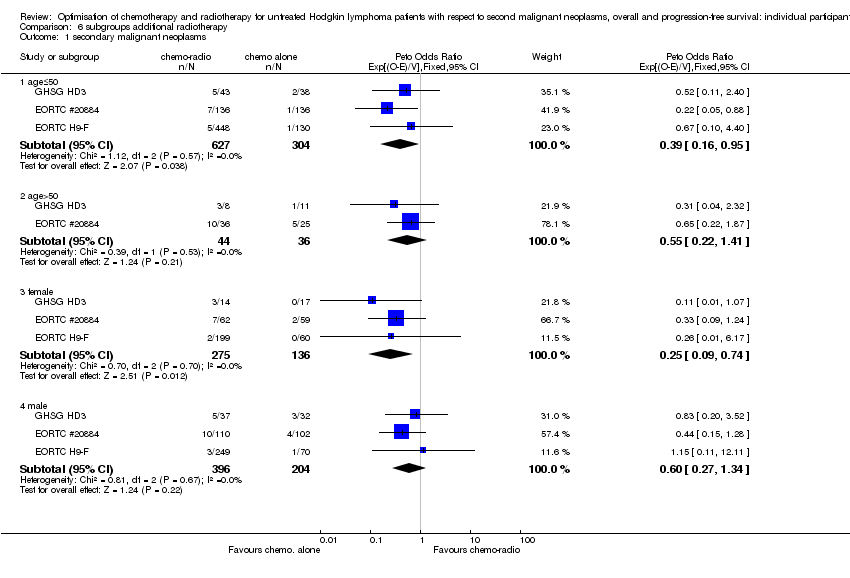
| 1 secondary malignant neoplasms Show forest plot | 3 | Peto Odds Ratio (95% CI) | Subtotals only | |
| Analysis 6.1  Comparison 6 subgroups additional radiotherapy, Outcome 1 secondary malignant neoplasms. | ||||
| 1.1 age≤50 | 3 | 931 | Peto Odds Ratio (95% CI) | 0.39 [0.16, 0.95] |
| 1.2 age>50 | 2 | 80 | Peto Odds Ratio (95% CI) | 0.55 [0.22, 1.41] |
| 1.3 female | 3 | 411 | Peto Odds Ratio (95% CI) | 0.25 [0.09, 0.74] |
| 1.4 male | 3 | 600 | Peto Odds Ratio (95% CI) | 0.60 [0.27, 1.34] |
| 2 overall survival Show forest plot | 3 | Hazard Ratio (Fixed, 95% CI) | Subtotals only | |
| Analysis 6.2  Comparison 6 subgroups additional radiotherapy, Outcome 2 overall survival. | ||||
| 2.1 age≤50 | 3 | 930 | Hazard Ratio (Fixed, 95% CI) | 0.82 [0.48, 1.42] |
| 2.2 age>50 | 2 | 80 | Hazard Ratio (Fixed, 95% CI) | 0.62 [0.28, 1.38] |
| 2.3 female | 3 | 411 | Hazard Ratio (Fixed, 95% CI) | 0.48 [0.20, 1.18] |
| 2.4 male | 3 | 600 | Hazard Ratio (Fixed, 95% CI) | 0.88 [0.52, 1.49] |
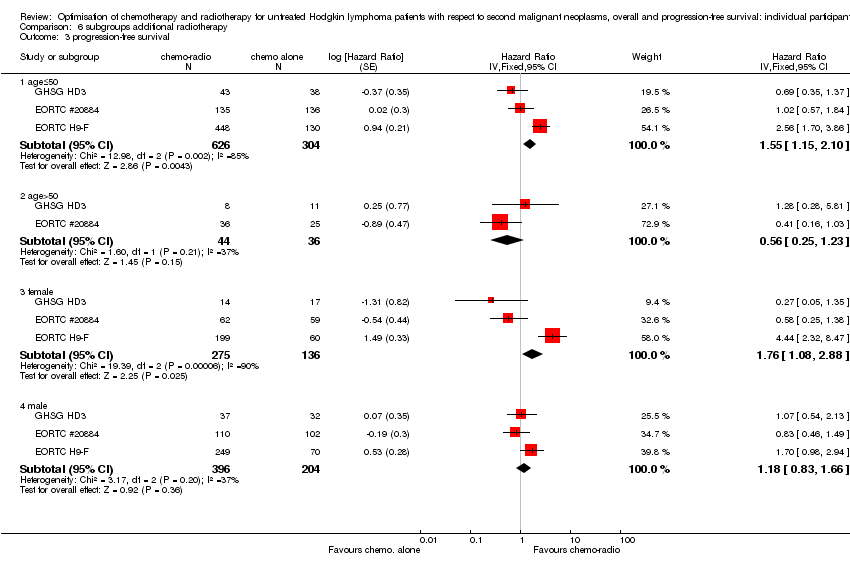
| 3 progression‐free survival Show forest plot | 3 | Hazard Ratio (Fixed, 95% CI) | Subtotals only | |
| Analysis 6.3  Comparison 6 subgroups additional radiotherapy, Outcome 3 progression‐free survival. | ||||
| 3.1 age≤50 | 3 | 930 | Hazard Ratio (Fixed, 95% CI) | 1.55 [1.15, 2.10] |
| 3.2 age>50 | 2 | 80 | Hazard Ratio (Fixed, 95% CI) | 0.56 [0.25, 1.23] |
| 3.3 female | 3 | 411 | Hazard Ratio (Fixed, 95% CI) | 1.76 [1.08, 2.88] |
| 3.4 male | 3 | 600 | Hazard Ratio (Fixed, 95% CI) | 1.18 [0.83, 1.66] |
| Outcome or subgroup title | No. of studies | No. of participants | Statistical method | Effect size |
| 1 secondary malignant neoplasms Show forest plot | 4 | Peto Odds Ratio (95% CI) | Subtotals only | |
| Analysis 7.1  Comparison 7 subgroups radiotherapy field, Outcome 1 secondary malignant neoplasms. | ||||
| 1.1 age≤50 | 4 | 2013 | Peto Odds Ratio (95% CI) | 0.84 [0.59, 1.21] |
| 1.2 age>50 | 4 | 384 | Peto Odds Ratio (95% CI) | 0.82 [0.48, 1.39] |
| 1.3 female | 4 | 1295 | Peto Odds Ratio (95% CI) | 1.03 [0.66, 1.59] |
| 1.4 male | 4 | 1102 | Peto Odds Ratio (95% CI) | 0.74 [0.50, 1.11] |
| 2 overall survival Show forest plot | 4 | Hazard Ratio (Fixed, 95% CI) | Subtotals only | |
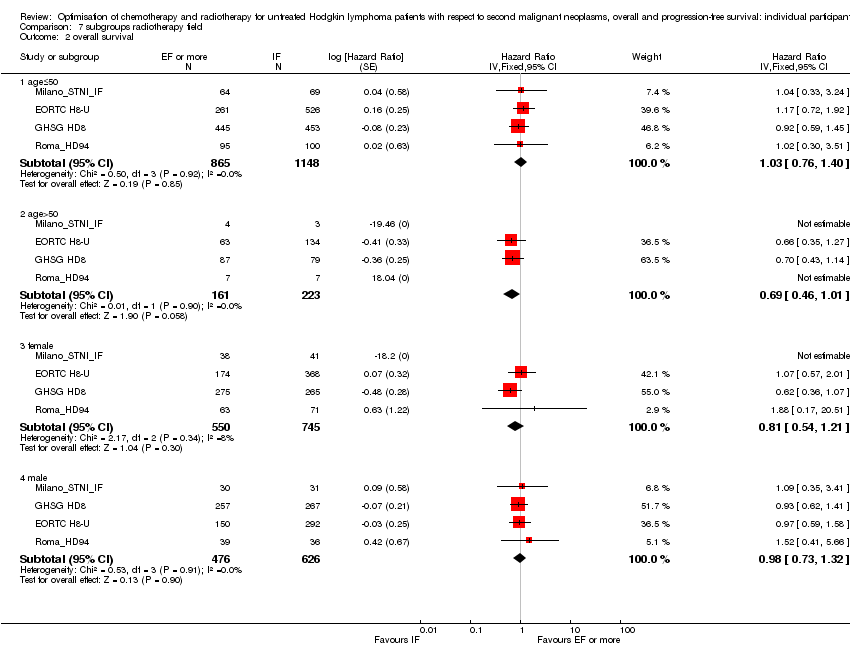
| Analysis 7.2  Comparison 7 subgroups radiotherapy field, Outcome 2 overall survival. | ||||
| 2.1 age≤50 | 4 | 2013 | Hazard Ratio (Fixed, 95% CI) | 1.03 [0.76, 1.40] |
| 2.2 age>50 | 4 | 384 | Hazard Ratio (Fixed, 95% CI) | 0.69 [0.46, 1.01] |
| 2.3 female | 4 | 1295 | Hazard Ratio (Fixed, 95% CI) | 0.81 [0.54, 1.21] |
| 2.4 male | 4 | 1102 | Hazard Ratio (Fixed, 95% CI) | 0.98 [0.73, 1.32] |
| 3 progression‐free survival Show forest plot | 4 | Hazard Ratio (Fixed, 95% CI) | Subtotals only | |
| Analysis 7.3  Comparison 7 subgroups radiotherapy field, Outcome 3 progression‐free survival. | ||||
| 3.1 age≤50 | 4 | 2013 | Hazard Ratio (Fixed, 95% CI) | 1.13 [0.88, 1.44] |
| 3.2 age>50 | 4 | 384 | Hazard Ratio (Fixed, 95% CI) | 0.69 [0.48, 1.00] |
| 3.3 female | 4 | 1295 | Hazard Ratio (Fixed, 95% CI) | 0.87 [0.63, 1.19] |
| 3.4 male | 4 | 1102 | Hazard Ratio (Fixed, 95% CI) | 1.09 [0.84, 1.42] |
| Outcome or subgroup title | No. of studies | No. of participants | Statistical method | Effect size |
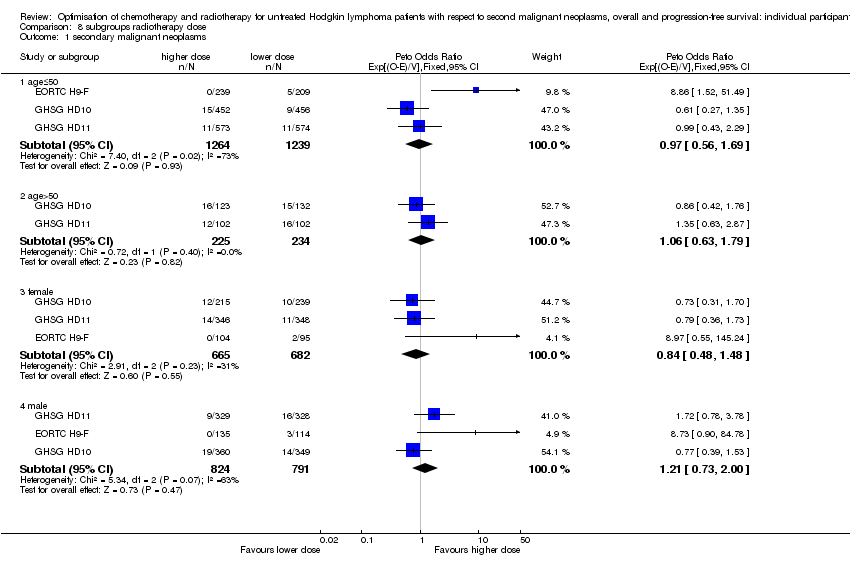
| 1 secondary malignant neoplasms Show forest plot | 3 | Peto Odds Ratio (95% CI) | Subtotals only | |
| Analysis 8.1  Comparison 8 subgroups radiotherapy dose, Outcome 1 secondary malignant neoplasms. | ||||
| 1.1 age≤50 | 3 | 2503 | Peto Odds Ratio (95% CI) | 0.97 [0.56, 1.69] |
| 1.2 age>50 | 2 | 459 | Peto Odds Ratio (95% CI) | 1.06 [0.63, 1.79] |
| 1.3 female | 3 | 1347 | Peto Odds Ratio (95% CI) | 0.84 [0.48, 1.48] |
| 1.4 male | 3 | 1615 | Peto Odds Ratio (95% CI) | 1.21 [0.73, 2.00] |
| 2 overall survival Show forest plot | 3 | Hazard Ratio (Fixed, 95% CI) | Subtotals only | |
| Analysis 8.2  Comparison 8 subgroups radiotherapy dose, Outcome 2 overall survival. | ||||
| 2.1 age≤50 | 3 | 2503 | Hazard Ratio (Fixed, 95% CI) | 0.90 [0.56, 1.45] |
| 2.2 age>50 | 2 | 459 | Hazard Ratio (Fixed, 95% CI) | 0.88 [0.55, 1.41] |
| 2.3 female | 3 | 1347 | Hazard Ratio (Fixed, 95% CI) | 0.97 [0.56, 1.66] |
| 2.4 male | 3 | 1615 | Hazard Ratio (Fixed, 95% CI) | 0.90 [0.59, 1.38] |
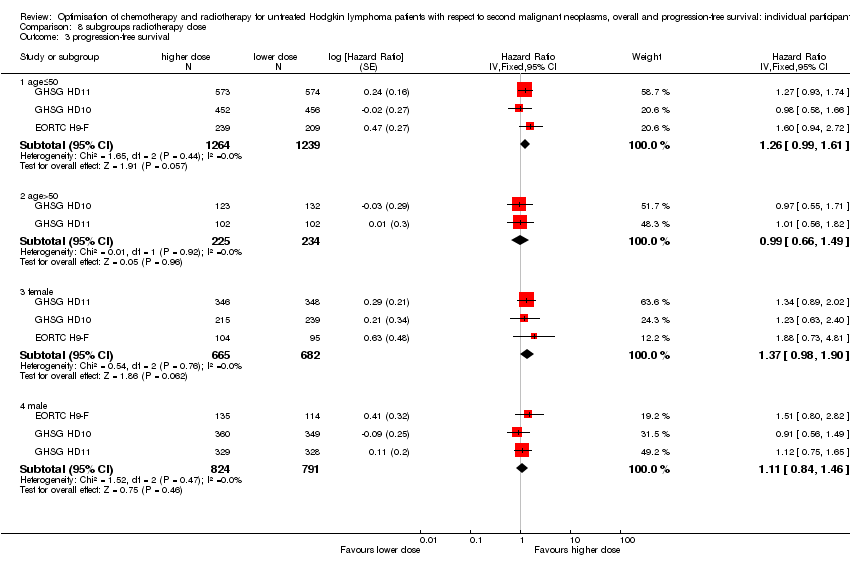
| 3 progression‐free survival Show forest plot | 3 | Hazard Ratio (Fixed, 95% CI) | Subtotals only | |
| Analysis 8.3  Comparison 8 subgroups radiotherapy dose, Outcome 3 progression‐free survival. | ||||
| 3.1 age≤50 | 3 | 2503 | Hazard Ratio (Fixed, 95% CI) | 1.26 [0.99, 1.61] |
| 3.2 age>50 | 2 | 459 | Hazard Ratio (Fixed, 95% CI) | 0.99 [0.66, 1.49] |
| 3.3 female | 3 | 1347 | Hazard Ratio (Fixed, 95% CI) | 1.37 [0.98, 1.90] |
| 3.4 male | 3 | 1615 | Hazard Ratio (Fixed, 95% CI) | 1.11 [0.84, 1.46] |
| Outcome or subgroup title | No. of studies | No. of participants | Statistical method | Effect size |
| 1 secondary malignant neoplasms Show forest plot | 3 | Peto Odds Ratio (95% CI) | Subtotals only | |
| Analysis 9.1  Comparison 9 subgroups chemotherapy cycles, Outcome 1 secondary malignant neoplasms. | ||||
| 1.1 age≤50 | 3 | 1897 | Peto Odds Ratio (95% CI) | 0.88 [0.51, 1.52] |
| 1.2 age>50 | 3 | 506 | Peto Odds Ratio (95% CI) | 1.44 [0.82, 2.54] |
| 1.3 female | 3 | 1117 | Peto Odds Ratio (95% CI) | 1.09 [0.61, 1.95] |
| 1.4 male | 3 | 1286 | Peto Odds Ratio (95% CI) | 1.09 [0.64, 1.86] |
| 2 overall survival Show forest plot | 3 | Hazard Ratio (Fixed, 95% CI) | Subtotals only | |
| Analysis 9.2  Comparison 9 subgroups chemotherapy cycles, Outcome 2 overall survival. | ||||
| 2.1 age≤50 | 3 | 1897 | Hazard Ratio (Fixed, 95% CI) | 0.94 [0.62, 1.44] |
| 2.2 age>50 | 3 | 506 | Hazard Ratio (Fixed, 95% CI) | 1.07 [0.68, 1.68] |
| 2.3 female | 3 | 1117 | Hazard Ratio (Fixed, 95% CI) | 0.86 [0.53, 1.40] |
| 2.4 male | 3 | 1286 | Hazard Ratio (Fixed, 95% CI) | 1.07 [0.72, 1.59] |
| 3 progression‐free survival Show forest plot | 3 | Hazard Ratio (Fixed, 95% CI) | Subtotals only | |
| Analysis 9.3  Comparison 9 subgroups chemotherapy cycles, Outcome 3 progression‐free survival. | ||||
| 3.1 age≤50 | 3 | 1897 | Hazard Ratio (Fixed, 95% CI) | 1.19 [0.90, 1.59] |
| 3.2 age>50 | 3 | 506 | Hazard Ratio (Fixed, 95% CI) | 1.10 [0.74, 1.63] |
| 3.3 female | 3 | 1117 | Hazard Ratio (Fixed, 95% CI) | 1.12 [0.78, 1.61] |
| 3.4 male | 3 | 1286 | Hazard Ratio (Fixed, 95% CI) | 1.17 [0.87, 1.59] |
| Outcome or subgroup title | No. of studies | No. of participants | Statistical method | Effect size |
| 1 secondary malignant neoplasms Show forest plot | 7 | Peto Odds Ratio (95% CI) | Subtotals only | |
| Analysis 10.1  Comparison 10 subgroups intensified chemotherapy, Outcome 1 secondary malignant neoplasms. | ||||
| 1.1 age≤50 | 7 | 2499 | Peto Odds Ratio (95% CI) | 2.11 [1.17, 3.79] |
| 1.2 age>50 | 7 | 497 | Peto Odds Ratio (95% CI) | 0.78 [0.41, 1.47] |
| 1.3 female | 7 | 1252 | Peto Odds Ratio (95% CI) | 1.86 [0.97, 3.58] |
| 1.4 male | 7 | 1744 | Peto Odds Ratio (95% CI) | 1.06 [0.60, 1.87] |
| 1.5 BEACOPP | 3 | 1255 | Peto Odds Ratio (95% CI) | 1.06 [0.60, 1.88] |
| 1.6 Stanford | 2 | 749 | Peto Odds Ratio (95% CI) | 0.90 [0.27, 2.95] |
| 1.7 EBVCAD | 2 | 425 | Peto Odds Ratio (95% CI) | 6.03 [1.71, 21.30] |
| 1.8 CHlVPP | 2 | 788 | Peto Odds Ratio (95% CI) | 2.14 [0.87, 5.29] |
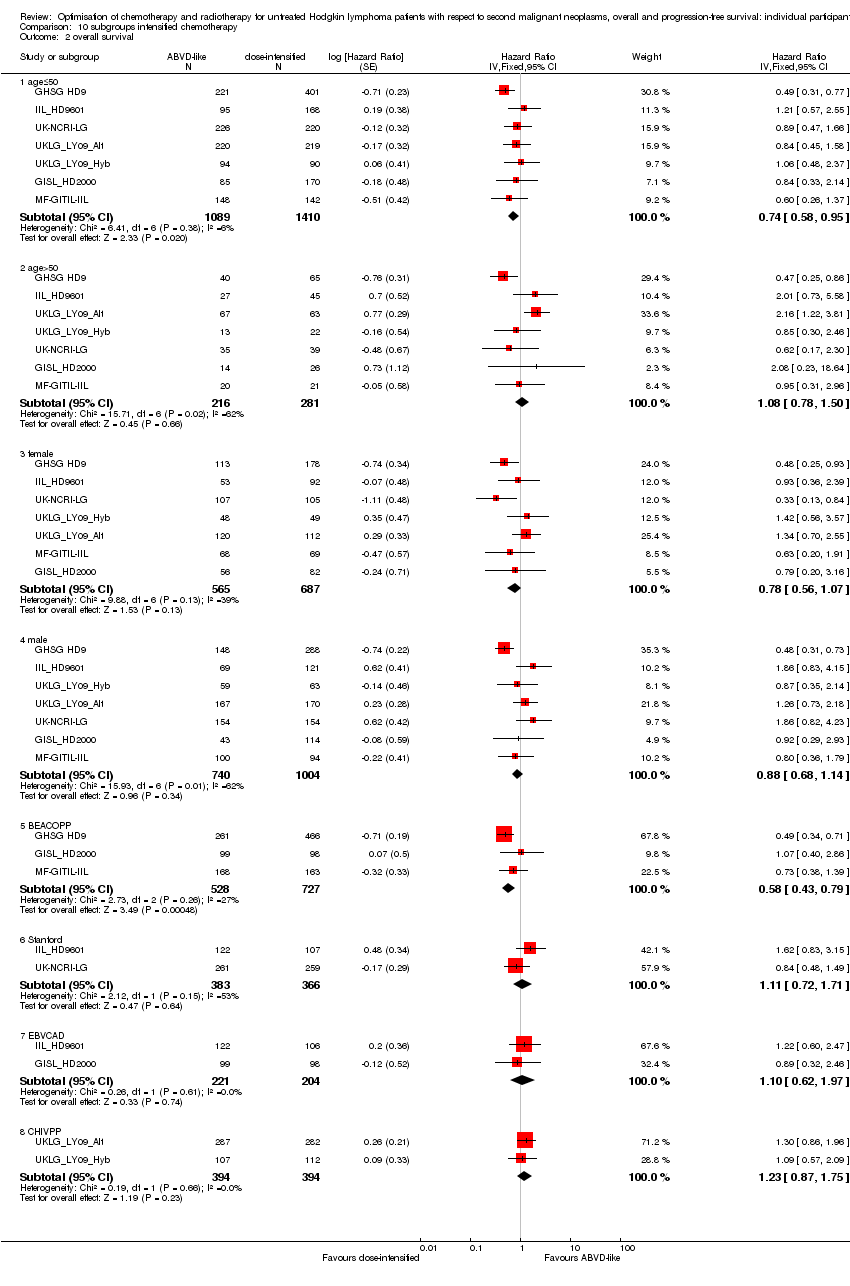
| 2 overall survival Show forest plot | 7 | Hazard Ratio (Fixed, 95% CI) | Subtotals only | |
| Analysis 10.2  Comparison 10 subgroups intensified chemotherapy, Outcome 2 overall survival. | ||||
| 2.1 age≤50 | 7 | 2499 | Hazard Ratio (Fixed, 95% CI) | 0.74 [0.58, 0.95] |
| 2.2 age>50 | 7 | 497 | Hazard Ratio (Fixed, 95% CI) | 1.08 [0.78, 1.50] |
| 2.3 female | 7 | 1252 | Hazard Ratio (Fixed, 95% CI) | 0.78 [0.56, 1.07] |
| 2.4 male | 7 | 1744 | Hazard Ratio (Fixed, 95% CI) | 0.88 [0.68, 1.14] |
| 2.5 BEACOPP | 3 | 1255 | Hazard Ratio (Fixed, 95% CI) | 0.58 [0.43, 0.79] |
| 2.6 Stanford | 2 | 749 | Hazard Ratio (Fixed, 95% CI) | 1.11 [0.72, 1.71] |
| 2.7 EBVCAD | 2 | 425 | Hazard Ratio (Fixed, 95% CI) | 1.10 [0.62, 1.97] |
| 2.8 CHlVPP | 2 | 788 | Hazard Ratio (Fixed, 95% CI) | 1.23 [0.87, 1.75] |
| 3 progression‐free survival Show forest plot | 7 | Hazard Ratio (Fixed, 95% CI) | Subtotals only | |
| Analysis 10.3  Comparison 10 subgroups intensified chemotherapy, Outcome 3 progression‐free survival. | ||||
| 3.1 age≤50 | 7 | 2499 | Hazard Ratio (Fixed, 95% CI) | 0.72 [0.61, 0.86] |
| 3.2 age>50 | 7 | 497 | Hazard Ratio (Fixed, 95% CI) | 1.15 [0.86, 1.55] |
| 3.3 female | 7 | 1252 | Hazard Ratio (Fixed, 95% CI) | 0.75 [0.60, 0.96] |
| 3.4 male | 7 | 1744 | Hazard Ratio (Fixed, 95% CI) | 0.85 [0.70, 1.02] |
| 3.5 BEACOPP | 3 | 1255 | Hazard Ratio (Fixed, 95% CI) | 0.47 [0.37, 0.60] |
| 3.6 Stanford | 2 | 749 | Hazard Ratio (Fixed, 95% CI) | 1.46 [1.09, 1.96] |
| 3.7 EBVCAD | 2 | 425 | Hazard Ratio (Fixed, 95% CI) | 0.96 [0.61, 1.49] |
| 3.8 CHlVPP | 2 | 788 | Hazard Ratio (Fixed, 95% CI) | 1.03 [0.79, 1.34] |

Search results and inclusion of studies (IPD = individual patient data). Numbers are cumulative over the original (2010) and repeat (2015 and 2017) searches.
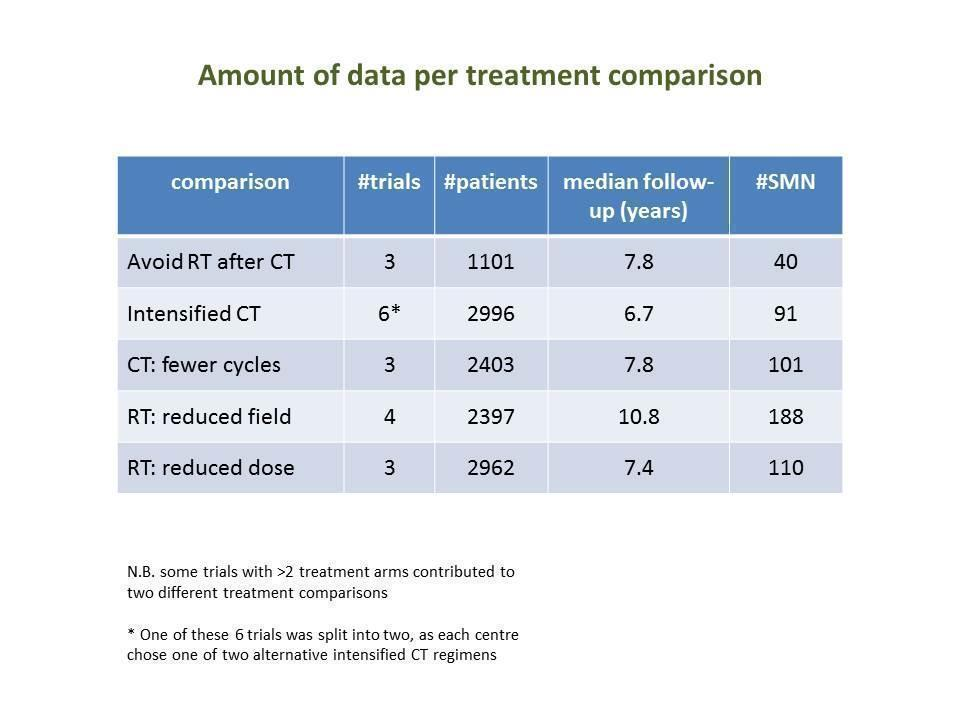
Numbers of trials and patients analysed for each study question
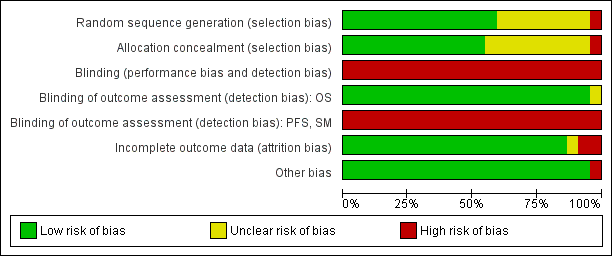
Risk of bias graph: review authors' judgements about each risk of bias item presented as percentages across all included studies.

Risk of bias summary: review authors' judgements about each risk of bias item for each included study.
(the two entries UKLG‐LY09‐Alt and UKLG‐LY09‐Hyb are in fact a single trial but were analysed as two trials)
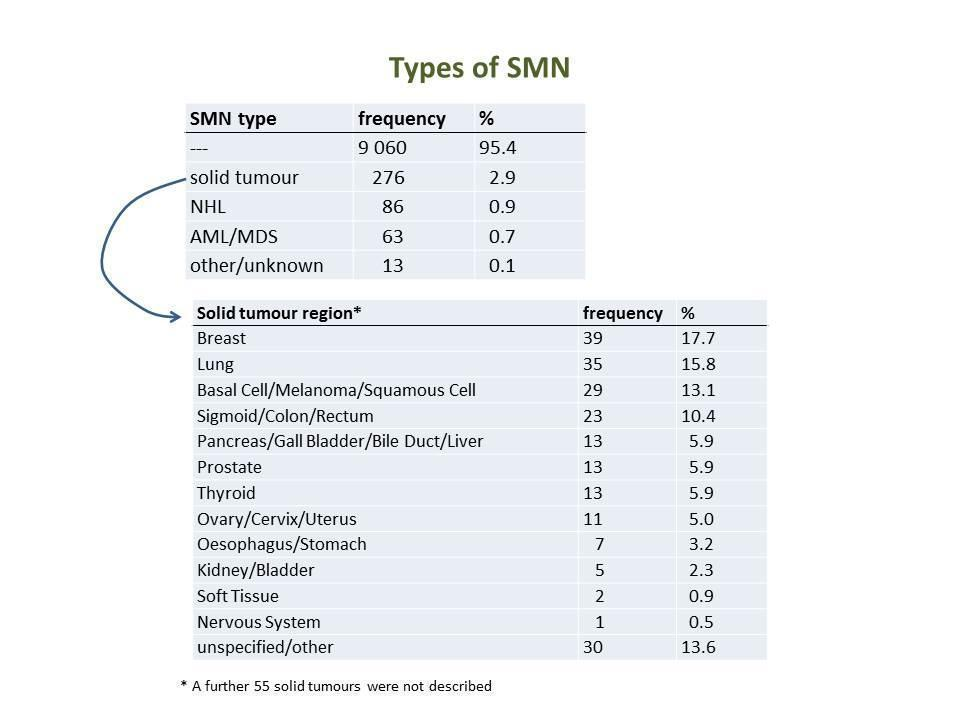
Frequencies of SMN types and solid tumour locations

SMN cumulative incidence plot (Peto estimates): avoidance of additional irradiation

SMN cumulative incidence plot (Peto estimates): intensified chemotherapy
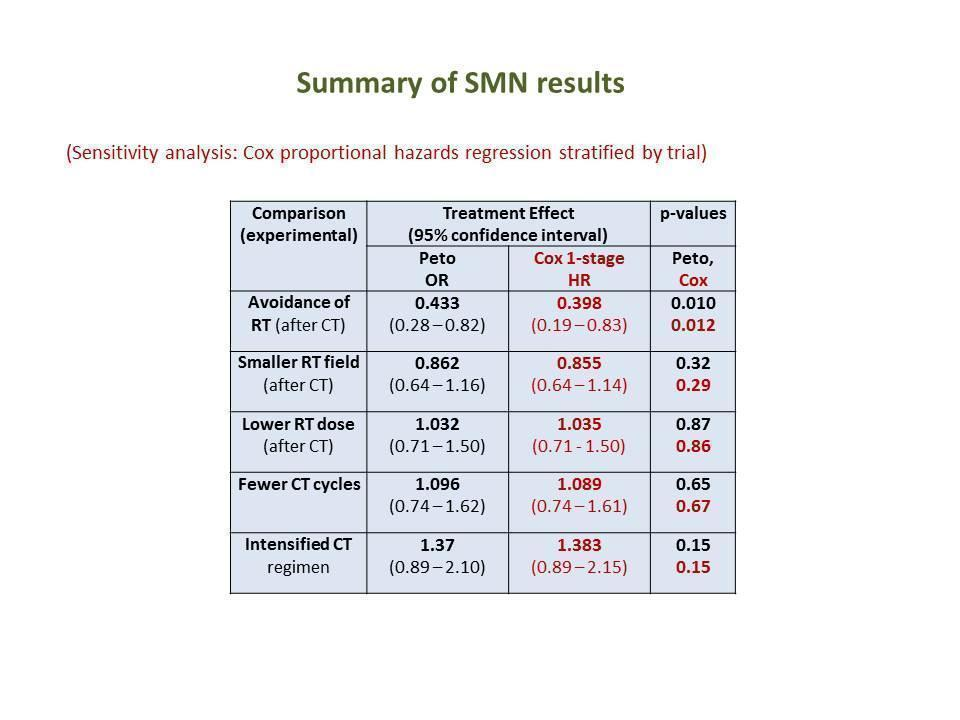
Table of main results for outcome SMN (OR odds ratio, HR hazard ratio, RT radiotherapy, CT chemotherapy)

Table of results for each type of SMN (OR odds ratio, RT radiotherapy, CT chemotherapy)
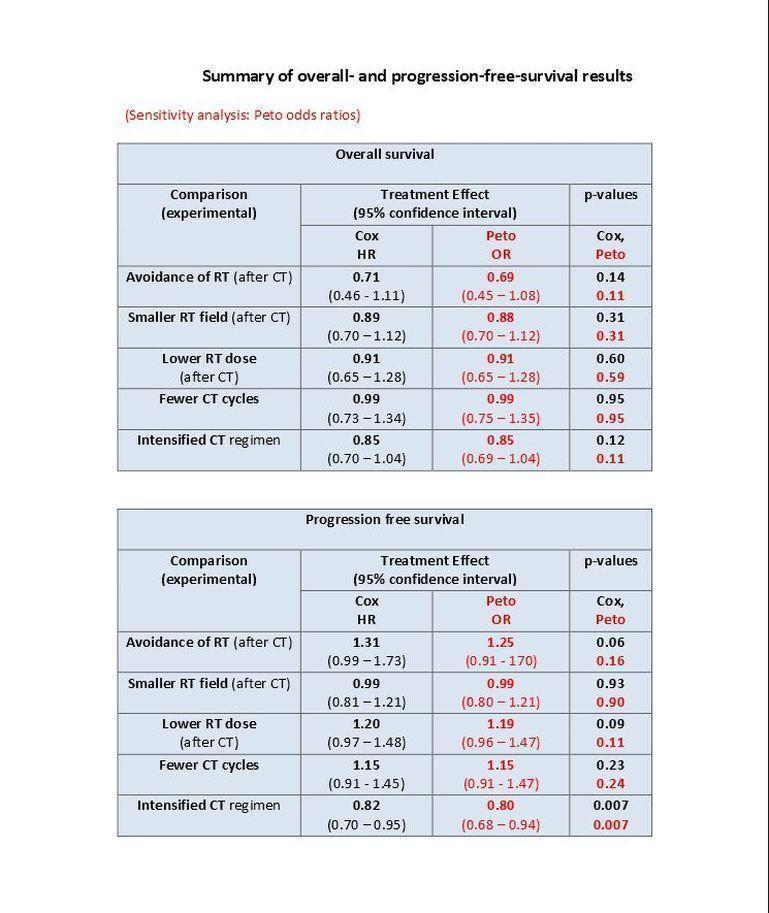
Table of main results for outcome OS and PFS (OR odds ratio, HR hazard ratio, RT radiotherapy, CT chemotherapy)

Comparison 1 additional radiotherapy, Outcome 1 secondary malignant neoplasms.

Comparison 1 additional radiotherapy, Outcome 2 overall survival.
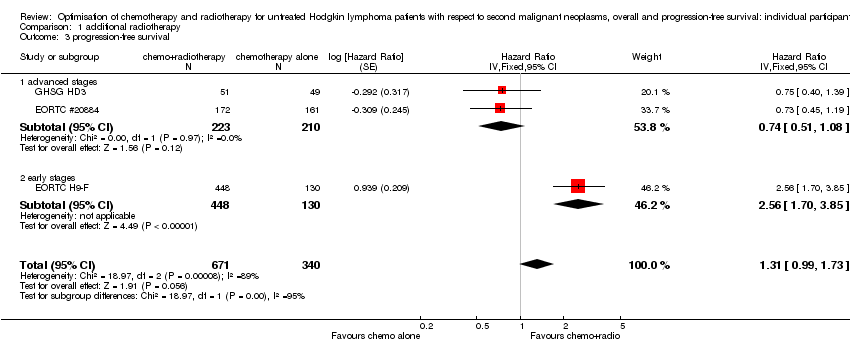
Comparison 1 additional radiotherapy, Outcome 3 progression‐free survival.

Comparison 2 radiotherapy field, Outcome 1 secondary malignant neoplasms.
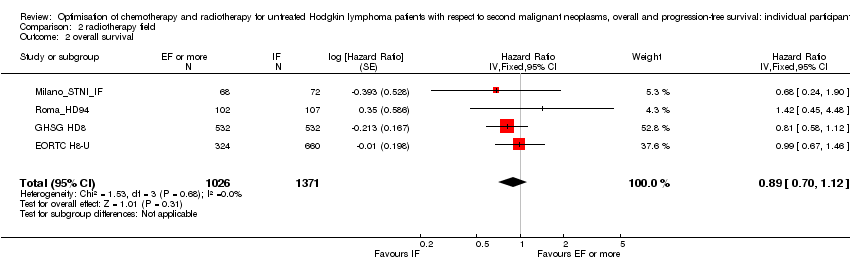
Comparison 2 radiotherapy field, Outcome 2 overall survival.
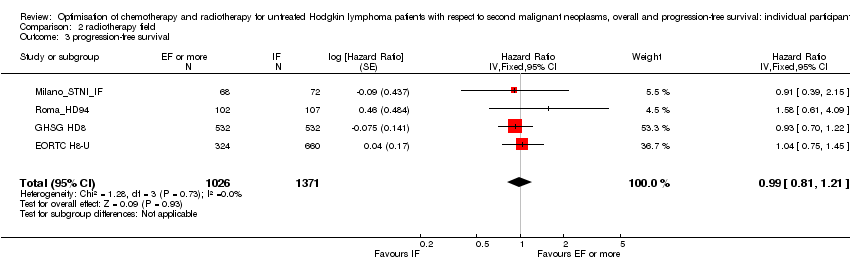
Comparison 2 radiotherapy field, Outcome 3 progression‐free survival.

Comparison 3 radiotherapy dose, Outcome 1 secondary malignant neoplasms.

Comparison 3 radiotherapy dose, Outcome 2 overall survival.

Comparison 3 radiotherapy dose, Outcome 3 progression‐free survival.
Comparison 4 chemotherapy cycles, Outcome 1 secondary malignant neoplasms.

Comparison 4 chemotherapy cycles, Outcome 2 overall survival.

Comparison 4 chemotherapy cycles, Outcome 3 progression‐free survival.

Comparison 5 intensified chemotherapy, Outcome 1 secondary malignant neoplasms.
Comparison 5 intensified chemotherapy, Outcome 2 overall survival.

Comparison 5 intensified chemotherapy, Outcome 3 progression‐free survival.
Comparison 6 subgroups additional radiotherapy, Outcome 1 secondary malignant neoplasms.

Comparison 6 subgroups additional radiotherapy, Outcome 2 overall survival.
Comparison 6 subgroups additional radiotherapy, Outcome 3 progression‐free survival.

Comparison 7 subgroups radiotherapy field, Outcome 1 secondary malignant neoplasms.
Comparison 7 subgroups radiotherapy field, Outcome 2 overall survival.

Comparison 7 subgroups radiotherapy field, Outcome 3 progression‐free survival.
Comparison 8 subgroups radiotherapy dose, Outcome 1 secondary malignant neoplasms.

Comparison 8 subgroups radiotherapy dose, Outcome 2 overall survival.
Comparison 8 subgroups radiotherapy dose, Outcome 3 progression‐free survival.

Comparison 9 subgroups chemotherapy cycles, Outcome 1 secondary malignant neoplasms.

Comparison 9 subgroups chemotherapy cycles, Outcome 2 overall survival.

Comparison 9 subgroups chemotherapy cycles, Outcome 3 progression‐free survival.

Comparison 10 subgroups intensified chemotherapy, Outcome 1 secondary malignant neoplasms.
Comparison 10 subgroups intensified chemotherapy, Outcome 2 overall survival.

Comparison 10 subgroups intensified chemotherapy, Outcome 3 progression‐free survival.
| Chemotherapy alone versus same chemotherapy plus radiotherapy | ||||||
| Patient or population: Patients with untreated Hodgkin lymphoma (early and advanced stages) | ||||||
| Outcomes | Illustrative comparative risks* (95% CI) | Relative effect | No of Participants | Quality of the evidence | Comments | |
| Assumed risk | Corresponding risk | |||||
| Chemotherapy plus radiation | Chemotherapy alone | |||||
| Secondary malignant neoplasms | Low1 | OR 0.43 | 1011 | ⊕⊕⊝⊝ | ||
| 4 per 100 | 2 per 100 | |||||
| Moderate1 | ||||||
| 8 per 100 | 4 per 100 | |||||
| High1 | ||||||
| 12 per 100 | 6 per 100 | |||||
| Death | Low1 | HR 0.71 | 1011 | ⊕⊕⊕⊝ | reported as 'Overall Survival' | |
| 5 per 100 | 4 per 100 | |||||
| Moderate1 | ||||||
| 10 per 100 | 7 per 100 | |||||
| High1 | ||||||
| 20 per 100 | 15 per 100 | |||||
| Progression/relapse | Low1 | HR 1.31 | 1011 | ⊕⊕⊕⊝ | reported as 'PFS' | |
| 15 per 100 | 19 per 100 | |||||
| Moderate1 | ||||||
| 20 per 100 | 25 per 100 | |||||
| High1 | ||||||
| 25 per 100 | 31 per 100 | |||||
| *The basis for the assumed risk (e.g. the median control group risk across studies) is provided in footnotes. The corresponding risk (and its 95% confidence interval) is based on the assumed risk in the comparison group and the relative effect of the intervention (and its 95% CI). | ||||||
| GRADE Working Group grades of evidence | ||||||
| 1 'Moderate' control risks are based on overall estimated rate at median observation time. 'Low' and 'high' control risks were chosen to represent the range of risks seen in the individual studies. 5 Follow‐up too short, in particular for assessment of solid tumour risk: downgrade by 1 point | ||||||
| Chemotherapy plus involved‐field radiation versus same chemotherapy plus extended‐field radiation | ||||||
| Patient or population: Patients with untreated Hodgkin lymphoma (early stages) | ||||||
| Outcomes | Illustrative comparative risks* (95% CI) | Relative effect | No of Participants | Quality of the evidence | Comments | |
| Assumed risk | Corresponding risk | |||||
| Extended‐field radiation | Involved field radiation (after chemotherapy) | |||||
| Secondary malignant neoplasms | Low1 | OR 0.86 | 2397 | ⊕⊕⊝⊝ | ||
| 5 per 100 | 4 per 100 | |||||
| Moderate1 | ||||||
| 10 per 100 | 9 per 100 | |||||
| High1 | ||||||
| 15 per 100 | 13 per 100 | |||||
| Death | Low1 | HR 0.89 | 2397 | ⊕⊕⊕⊕ | reported as 'Overall Survival' | |
| 10 per 100 | 9 per 100 | |||||
| Moderate1 | ||||||
| 15 per 100 | 13 per 100 | |||||
| High1 | ||||||
| 20 per 100 | 18 per 100 | |||||
| Progression/relapse | Low1 | HR 0.99 | 2397 | ⊕⊕⊕⊕ | reported as 'PFS' | |
| 15 per 100 | 15 per 100 | |||||
| Moderate1 | ||||||
| 20 per 100 | 20 per 100 | |||||
| High1 | ||||||
| 25 per 100 | 25 per 100 | |||||
| *The basis for the assumed risk (e.g. the median control group risk across studies) is provided in footnotes. The corresponding risk (and its 95% confidence interval) is based on the assumed risk in the comparison group and the relative effect of the intervention (and its 95% CI). | ||||||
| GRADE Working Group grades of evidence | ||||||
| 1 'Moderate' control risks are based on overall estimated rate at median observation time. 'Low' and 'high' control risks were chosen to represent the range of risks seen in the individual studies. | ||||||
| Chemotherapy plus lower‐dose radiation versus same chemotherapy plus higher‐dose radiation | ||||||
| Patient or population: Patients with untreated Hodgkin lymphoma (early stages) | ||||||
| Outcomes | Illustrative comparative risks* (95% CI) | Relative effect | No of Participants | Quality of the evidence | Comments | |
| Assumed risk | Corresponding risk | |||||
| Control | A lower radiotherapy dose | |||||
| Secondary malignant neoplasms | Low1 | OR 1.03 | 2962 | ⊕⊕⊝⊝ | ||
| 2 per 100 | 2 per 100 | |||||
| Moderate1 | ||||||
| 4 per 100 | 4 per 100 | |||||
| High1 | ||||||
| 8 per 100 | 8 per 100 | |||||
| Death | Low1 | HR 0.91 | 2962 | ⊕⊕⊕⊕ | reported as 'Overall Survival' | |
| 3 per 100 | 3 per 100 | |||||
| Moderate1 | ||||||
| 6 per 100 | 5 per 100 | |||||
| High1 | ||||||
| 12 per 100 | 11 per 100 | |||||
| Progression/relapse | Low1 | HR 1.2 | 2962 | ⊕⊕⊕⊕ | reported as 'PFS' | |
| 8 per 100 | 10 per 100 | |||||
| Moderate1 | ||||||
| 12 per 100 | 14 per 100 | |||||
| High1 | ||||||
| 16 per 100 | 19 per 100 | |||||
| *The basis for the assumed risk (e.g. the median control group risk across studies) is provided in footnotes. The corresponding risk (and its 95% confidence interval) is based on the assumed risk in the comparison group and the relative effect of the intervention (and its 95% CI). | ||||||
| GRADE Working Group grades of evidence | ||||||
| 1 'Moderate' control risks are based on overall estimated rate at median observation time. 'Low' and 'high' control risks were chosen to represent the range of risks seen in the individual studies. | ||||||
| Fewer versus more courses of chemotherapy | ||||||
| Patient or population: Patients with untreated Hodgkin lymphoma (early stages) | ||||||
| Outcomes | Illustrative comparative risks* (95% CI) | Relative effect | No of Participants | Quality of the evidence | Comments | |
| Assumed risk | Corresponding risk | |||||
| Control | Fewer chemotherapy cycles | |||||
| Secondary malignant neoplasms | Low1 | OR 1.10 | 2403 | ⊕⊕⊕⊝ | ||
| 2 per 100 | 2 per 100 | |||||
| Moderate1 | ||||||
| 4 per 100 | 4 per 100 | |||||
| High1 | ||||||
| 8 per 100 | 9 per 100 | |||||
| Death | Low1 | HR 0.99 | 2403 | ⊕⊕⊕⊕ | reported as 'Overall Survival' | |
| 3 per 100 | 3 per 100 | |||||
| Moderate1 | ||||||
| 6 per 100 | 6 per 100 | |||||
| High1 | ||||||
| 12 per 100 | 12 per 100 | |||||
| Progression/relapse | Low1 | HR 1.15 | 2403 | ⊕⊕⊕⊕ | reported as 'PFS' | |
| 8 per 100 | 9 per 100 | |||||
| Moderate1 | ||||||
| 12 per 100 | 14 per 100 | |||||
| High1 | ||||||
| 16 per 100 | 18 per 100 | |||||
| *The basis for the assumed risk (e.g. the median control group risk across studies) is provided in footnotes. The corresponding risk (and its 95% confidence interval) is based on the assumed risk in the comparison group and the relative effect of the intervention (and its 95% CI). | ||||||
| GRADE Working Group grades of evidence | ||||||
| 1 'Moderate' control risks are based on overall estimated rate at median observation time. 'Low' and 'high' control risks were chosen to represent the range of risks seen in the individual studies. | ||||||
| Dose‐intensified chemotherapy versus ABVD‐like chemotherapy | ||||||
| Patient or population: Patients with untreated Hodgkin lymphoma (advanced stages) | ||||||
| Outcomes | Illustrative comparative risks* (95% CI) | Relative effect | No of Participants | Quality of the evidence | Comments | |
| Assumed risk | Corresponding risk | |||||
| ABVD‐like chemotherapy | Intensified chemotherapy | |||||
| Secondary malignant neoplasms | Low1 | OR 1.37 | 2996 | ⊕⊕⊝⊝ | ||
| 2 per 100 | 3 per 100 | |||||
| Moderate1 | ||||||
| 4 per 100 | 5 per 100 | |||||
| High1 | ||||||
| 8 per 100 | 11 per 100 | |||||
| Death | Low1 | HR 0.85 | 2996 | ⊕⊕⊕⊝ | reported as 'Overall Survival' | |
| 10 per 100 | 9 per 100 | |||||
| Moderate1 | ||||||
| 15 per 100 | 13 per 100 | |||||
| High1 | ||||||
| 20 per 100 | 17 per 100 | |||||
| Progression/relapse | Low1 | HR 0.82 | 2996 | ⊕⊕⊕⊝ | reported as 'PFS' | |
| 20 per 100 | 17 per 100 | |||||
| Moderate1 | ||||||
| 30 per 100 | 25 per 100 | |||||
| High1 | ||||||
| 40 per 100 | 34 per 100 | |||||
| *The basis for the assumed risk (e.g. the median control group risk across studies) is provided in footnotes. The corresponding risk (and its 95% confidence interval) is based on the assumed risk in the comparison group and the relative effect of the intervention (and its 95% CI). | ||||||
| GRADE Working Group grades of evidence | ||||||
| 1 'Moderate' control risks are based on overall estimated rate at median observation time. 'Low' and 'high' control risks were chosen to represent the range of risks seen in the individual studies. 4 Follow‐up too short, in particular for assessment of solid tumour risk: downgrade by 1 point | ||||||
| Publication | Characteristics | Number of incident cases | Treatment groups | Analysis methods | Conclusions (all types) | Conclusions solid tumours | Conclusions (AML) | Conclusions (NHL) |
| 15 centres (USA, Manchester, Amsterdam); 1955‐1986; MFU = 11.4 yrs.; N = 1 380 (children < 16 yrs.) | 88 SMN (+9 excluded non‐melanoma skin cancers); 24 AML (+2 other leukaemias), 47 ST, 9 NHL | RT, CT, RT+CT (total treatment) | Cox regression separately for ST, AML, NHL | All ST: no differences; breast cancer only: RT dose (RR 5.9 for dose > 20 Gy) | No differences reported | Higher risk with more alkylating agents | ||
| 1 centre (Florence); 1960‐1988; N = 1 121 | 73 SMN (+5 excluded basocellular skin cancers); 60 ST, 11 AML (MDS excluded), 2 NHL | (A) RT, CT, RT+CT, CRT; total treatment. (B) RT, CT, CRT (primary treatment only), censored at relapse | Cox regression | Higher risk after primary CT compared with IF/M alone; higher risk with CT+(S)TNI compared with IF/M alone | Same trend as for all SM | Higher risk with primary CT (±RT); higher risk with more cycles of CT | ||
| Embedded case‐control study; 14 Canadian and US centres; 1940‐1987; MFU = 7 yrs.; N = 10 472 (9 280 followed for at least one year) | 560 SMN; 403 ST, 122 AML, 35 NHL | RT, CT as time‐dependent variables, primary and salvage RT, CT | Cox regression with splenectomy, RT, CT as time‐dependent covariates | Significantly more with CT than without CT (ST and NHL analysed together) | Significantly more with CT than without CT (more with MOPP than with ABVD) | |||
| 1 centre (France); 1960‐1983; N = 892 (continuously disease‐free HD only) | N = 56 (first FU ‐year excluded); 37 ST (excluding bcc), 11 ANLL/MDS, 8 NHL | RT versus CRT; Mantle‐RT versus EF‐RT; SM before progression/relapse only | Cox regression; All RR compared with IF (= MF/inverted Y‐RT) | Significant excess only with MOPP+EF (RR 10.86, P < 0.001) and MOPP+IF (RR 4.99, P = 0.015). | Same tendency as for SM, but significant only for MOPP+EF | Increased risk only for MOPP+EF (RR 16.55, P = .004) | No difference in treatment | |
| 16 US and European cancer registries; 1935‐1995; N = 32 591 | 2 153 SMN; 1 726 ST, 169 ANLL, 162 NHL | RT versus CT versus CRT (primary treatment) | No direct comparison between treatment groups: all results as RR according to primary treatment compared with normal population. | Significantly higher RR with CRT (95% CI 2.6‐3.6) compared with either RT alone (2.1‐2.4) or CT alone (1.5‐1.9). Digestic tract and female breast: Significantly higher risks with RT than without RT. | ||||
| 1 centre (Oslo); 1968‐1985; MFU = 8 yrs.; N = 1 152 | 68 SMN (+6 excluded non‐melanoma skin cancers); 9 AML, 8 NHL, 51 ST | RT, CT, CT+RT (total treatment) | Cox regression | Greater risk of SM for pts. who received both CT and RT | ||||
| SEER registry database; 1988.2006; N = 12 247 | ca. 650 SMN (5.3%) | RT versus no RT (primary treatment) | Kaplan‐Meier; no explicit comparison | no increase due to RT | ||||
| 1 centre (JCRT Boston, USA); 1969‐1988; N = 794 | 72 SMN; 53 ST, 8 AML, 10 NHL | RT(no relapse), RT‐relapse‐CT, CRT; total treatment | RRs compared with normal population, no direct treatment comparisons | RT alone RR 4.1, RT+CT RR 9.75, P < 0.05 | Same effect as with all SMN | Same effect as with all SMN | ||
| 4 centres (all affil. to Harvard); 1969‐1997; MFU = 12 yrs.; N = 1319 (mainly early stages); (996 pts. with fu > 10 years were included in analysis of treatment effect) | 181 SMN (N = 162 for pts. with fu > 10 yrs.); 131 ST, 23 AML, 24 NHL | RT, CRT (total treatment); also separate analyses of non‐relapsed cases and relapsed cases | RRs calculated relative to normal population (age/sex‐specific); CI from Poisson distribution | RR higher with CRT than RT alone (6.1 versus 4.0, P = 0.015); (non‐relapsed cases only: 5.9 versus 3.7, P = 0.016). Analysed by radiation field size, this effect was only significant for TNI (±CT). RR higher with CT+TNI than for CT+Mantle/EF | ||||
| 1 centre (M.D. Anderson, Houston, USA); 1966‐1987; N = 1 013 | 66 SMN (first FU‐year excluded); 38 ST, 14 AML/MDS, 14 NHL | IF versus EF (+MOPP); CT versus CRT; RT versus CRT. Total therapy | Cox regression | RT versus CRT: no difference (P = 0.37). CT versus CRT: less SM with CRT (P = 0.001). But less courses of CT with CRT than with CT only! | ||||
| Multi‐centre (mainly Germany); 1978‐1998); N = 5 357 | 67 AML, 97 NHL | Primary: RT, conventional CT for intermediate stage, conventional CT for advanced stage, escalated BEACOPP | Parametric model; separate effects of primary and salvage treatment | Higher risk with escalated BEACOPP than conventional CT | No differences | |||
| > 60 BNLI centres, UK; 1970‐1987; N = 2 846 | 113 SMN; 80 ST, 16 AML, 17 NHL | Alkyl. CT, Alkyl. CT +RT, IF‐RT (+/‐ nonalk. CT), EF‐RT (+/‐ nonalk. CT) (total treatment) | Poisson regression | No difference overall (nor for lung ca. alone) | More with CT or CRT (similar) than with RT | No differences | ||
| BNLI, Royal Marsden, St. Bartholomews; 1963‐1993; N = 5 519 | 322 SMN; 228 ST, 44 AML, 50 NHL | CT, RT, CRT (total treatment) | Poisson regression. RR compared with normal population, no direct treatment comparisons | Higher RR for CRT (SIR 3.9, 95% CI 3.2 ‐ 4.6) than for CT (SIR 2.6, 95% CI 2.1 ‐ 3.2) or RT (SIR 2.3, 95% CI 1.9 ‐ 2.8). | Higher risk for CRT (SIR 38.1, 95% CI 24.6‐55.9) or CT (SIR 31.6, 95% CI 19.7‐47.6) than for RT (SIR 1.2, 95% CI 0.1‐5.2) | No significant differences | ||
| UK, 1963‐2001 | 459 SMN; 302 ST, 75 AML, 82 NHL | CT, CRT | Higher risk for CRT than for CT alone | |||||
| Stanford UMC; 1968 ‐ ?(year needed); N = 1 507 | 83 SMN (first FU‐year excluded); 46 ST, 28 AML, 9 NHL | RT, RT+adj. CT, RT+salvage CT, RT+intravenous‐gold, CT (total treatment) | Kaplan‐Meier, Gehan test | No differences (except: more with radiotherapy + intravenous‐gold) | Higher risk with CT than RT | No differences | ||
| 2 centres (the Netherlands); 1966‐1986; MFU = 9 yrs.; N = 1 939 | 146 SMN; 93 ST, 31 AML, 23 NHL | CT, RT, CRT (total treatment) | (A) Person‐years analysis. (B) Cox regression | B: for lung cancer only: trend to more for RT (P = 0.08) or CRT (P = 0.07) than for CT. Otherwise no differences | A: AML not increased for RT; large increase for CT (CT similar to CRT). B: AML more for CT (P = 0.009) or CRT (P = 0.04) than for RT | B: trend to more for CRT than for either CT or RT (P = 0.06) | ||
| AML = acute myeloid leukaemia; ANLL = acute nonlymphocytic leukemia; CT = chemotherapy; CRT = chemotherapy plus radiotherapy combined; NHL = non‐Hodgkin lymphoma; FU = follow‐up; HD = Hodgkins disease; MFU = median follow‐up | ||||||||
| Publication | Characteristics | Number of solid tumours / NHL | Treatment groups | Analysis methods | Conclusions (solid tumours) | Conclusions (NHL) |
| Multi‐centre (mainly Germany); 1983‐98; N = 5 367 | 127 | CT, RT, CT+EF, CT+IF/local | RR compared with general population. No direct treatment comparisons. | |||
| Stanford UMC (USA); 1961‐1994; MFU = 10.9 yrs.; N = 2 441 | 25 gastrointestinal cancers | RT, CRT (total treatment) | RR compared with general population. No direct treatment comparisons. | Risk of gastrointestinal cancer not significantly greater with CRT (RR 3.9, 95% CI 2.2 to 5.6) than with RT (RR 2.0, CI 1.0 to 3.4) | ||
| 5 centres (the Netherlands); 1965‐1995; N = 1 122 | 120 breast cancers | RT field and CT regimen in women under 41 years with supradiaphragmatic irradiation (N = 782) | Cox regression | Significantly greater risk of breast cancer with mantle RT than mediastinal RT | ||
| Rome, Italy; 1972‐1996; MFU = 84 months; N = 391 | 20 NHL | (A) RT, CT, CRT (initial treatment) censored at relapse. (B) RT, CT, CRT (total treatment) | Kaplan‐Meier and Cox regression | No difference between treatment modalities | ||
| 1 centre (Oslo); 1968‐1985; MFU = 14 yrs.; N = 1 024 | 26 lung, 23 breast, 31 NHL | RT, CT, CRT (total treatment) | RR compared with general population. No direct treatment comparison | Tendency to greater lung and breast cancer risk with RT or CRT versus CT | No difference between treatment modalities | |
| Stanford UMC (USA); 1961‐1990; MFU = 10 yrs.; N = 885 | 25 breast cancers | RT, CRT (total treatment) | RR compared with general population. No direct treatment comparisons | RT versus CRT: Tendency of more breast cancers with CRT, but not significant. | ||
| 13 cancer registries; 1970‐2001, 5‐year survivors; N = 18 862 | 1 490 ST | RT, CT, CRT (primary treatment, RT supra‐ or infradiaphragmatic according to SMN site) | RR by Poisson regression | significantly greater risk of breast cancer and other supradiaphragmatic cancer with RT or CRT versus CT | ||
| Case‐control study; 12 cancer registries (Europe, Canada), 6 large hospitals (Europe); from 1960 onwards; N = 25 665 | 98 lung cancers | RT, CT, CRT | Standard case‐control study methods. RR compared with RT | Higher risk with CT, risk increase with number of CT cycles and RT dose to the lung. | ||
| One centre (Florence, Italy); 1060‐2003; N = 1 538 | 39 breast cancers | RT, CT, CRT (primary treatment); RT field; CT regimen | Cox regression | No significant differences (breast) | ||
| Nested case‐control study; multi‐centre (Britain); 1963‐1995; N = 5 519 | 88 lung cancers | RT, CT, CRT (total treatment) | Conditional logistic regression | No significant differences in lung cancer risk between RT, CT, CRT. (exception: adenocarcinomas ‐ greater risk with CT than without.) Risk greater with MOPP than without MOPP | ||
| UK, 1956 ‐ 2003 | 373 breast cancers | RT, CRT | Breast cancer standardised incidence ratio (SIR) is highest among patients receiving RT at a young age | |||
| Embedded case‐control study; 7 cancer registries; 1965‐1994; N = 19 046 | 222 lung cancers | RT, alkylating CT, RT with alk. CT, RT + salvage alk. CT, neither (total treatment) | Conditional logistic regression | Lung cancer risk increases with RT dose to the lung and with use of alkylating agents | ||
| Embedded case‐control study; 6 cancer registries; 1965‐1994; N = 3 817 women | 105 breast cancers | RT, alkylating CT, RT with alk. CT, RT + salvage alk. CT, neither (total treatment) | Conditional logistic regression | Breast cancer risk increases with RT dose to breast and decreases with use of alkylating CT and with radiation of ovaries | ||
| Embedded case‐control study; 2 centres (the Netherlands); 1966‐1986; N = 1 939 | 30 lung cancers | RT, CT, CRT. RT dose to lung (total treatment) | Conditional logistic regression | Risk of lung cancer tended to increase with increasing RT dose (P = 0.01); RR(> 9 Gy versus 0) = 9.6. No significant differences between RT, CT, CRT | ||
| Embedded case‐control study; 4 centres (the Netherlands); 1965‐88; N = 2 637 | 48 breast cancers | RT, CRT. RT dose to breast, ovary. CT cycles, dose of alkylating agents | Conditional logistic regression | Breast cancer risk increases with RT dose and decreases with modality CRT; no CT dose effect | ||
| CT = chemotherapy; CRT = chemotherapy plus radiotherapy combined; NHL = non‐Hodgkin lymphoma; FU = follow‐up; HD = Hodgkins disease; MFU = median follow‐up | ||||||
| Publication | Characteristics | Number of AML/MDS | Treatment groups | Analysis methods | Conclusions (AML/MDS) |
| 2 centres (Italy); 1975‐1992; MFU = 10 yrs.; N = 1 659 | 36 AML/MDS | RT, CT, CT+RT. Total treatment | A.Log‐rank tests (univariate) to compare treatment groups | A. Higher risk after CT than RT (P = 0.04); higher risk with CT than with CRT (P = 0.05); higher risk with MOPP+RT than with MOPP/ABVD or with ABVD+RT (P = 0.002); higher risk with EF + MOPP than with IF+MOPP (P = 0.01) | |
| GHSG HD7‐HD15, PROFE, BEACOPP‐14 (1993‐2009); MFU: 72 months, N = 11 952 | 106 AML/MDS | RT, CT, CRT | Significantly higher risk after 4 or more cycles of escalated BEACOPP | ||
| Multi‐centre (GHSG (Germany) HD1‐HD9); 1981‐1998; MFU = 55 months; N = 5 411 | 46 AML/MDS | CT, RT, CRT, HDCT with SCT. Primary treatment, not censored at relapse | Kaplan‐Meier. No direct treatment comparison | No significant differences between treatment protocols | |
| Case‐control study; 12 cancer registries (Europe, Canada), 6 large hospitals (Europe); 1960‐?(year needed); N = 29 552 | 149 AML/MDS (at least one year after HD diagnosis) | RT, CT, CRT. Total treatment | Standard case‐control study methods. RR compared with RT | Higher risk with CT than with RT (RR 9.0; CI 4.1‐20); higher risk with CRT than with RT (RR 7.7; CI 3.9‐15). No difference in CT versus CRT; but there was a dose‐related increase in the risk in pts. who received RT alone | |
| Stanford (1974‐2003); N = 754 | 24 AML/MDS | RT, CT, CRT | Increased risk with higher doses of alkylating agents | ||
| 1 centre (Copenhagen); 1970‐1981; N = 391 | 20 ANLL/preleukaemia | Low, intermediate, or high dose of alkylating agents. Total treatment | Cox regression | Risk increases with increasing (total) log dose of alkylating agents (P = 0.0024, regr. coefft. = 0.69) | |
| Embedded case‐control study; 2 centres (Netherlands); 1966‐1986; N = 1 939 | 44 Leukemias (incl. 32 ANLL, 12 MDS) | RT, CT, RT+CT. Total treatment | Conditional logistic regression | More risk with CT than with RT alone; <= 6 cycles: P = 0.08, RR = 8.5; > 6 cycles: P < 0.001, RR = 44 | |
| AML = acute myeloid leukaemia; ANLL = acute nonlymphocytic leukemia; CT = chemotherapy; CRT = chemotherapy plus radiotherapy combined; NHL = non‐Hodgkin lymphoma; FU = follow‐up; HD = Hodgkins disease; MFU = median follow‐up | |||||
| Comparison | Excluded SMN (standard arm : experimental arm) | OR | P value |
| Avoidance of RT (after CT) | 0 : 1 | 0.398 | 0.0054 |
| Smaller RT field (after CT) | 5 : 8 | 0.824 | 0.21 |
| Lower RT dose (after CT) | 1 : 4 | 0.976 | 0.90 |
| Fewer CT cycles | 3 : 0 | 0.967 | 0.87 |
| Intensified CT regimen | 0 : 0 | no change | |
| SMN = secondary malignant neoplasms | |||
| Comparison | Numbers of censored SMN (standard arm : experimental arm) | Peto odds ratio | P value |
| Avoidance of RT (after CT) | 4 : 3 | 0.348 | 0.0031 |
| Smaller RT field (after CT) | 37 : 39 | 0.842 | 0.38 |
| Lower RT dose (after CT) | 4 : 4 | 1.033 | 0.87 |
| Fewer CT cycles | 8 : 10 | 0.849 | 0.46 |
| Intensified CT regimen | 10 : 19 | 1.365 | 0.24 |
| CT = chemotherapy; RT = radiotherapy | |||
| Comparison | Numbers of progressions (standard arm : experimental arm) | Hazard ratio | P value |
| Avoidance of RT (after CT) | 80 : 66 | 1.77 | 0.0006 |
| Smaller RT field (after CT) | 117 : 171 | 1.08 | 0.51 |
| Lower RT dose (after CT) | 127 : 147 | 1.2 | 0.14 |
| Fewer CT cycles | 114 : 107 | 0.94 | 0.62 |
| Intensified CT regimen | 281 : 276 | 0.74 | 0.0008 |
| CT = chemotherapy | |||
| Comparison | Numbers of deaths (standard arm : experimental arm) | Hazard ratio | P value |
| Avoidance of RT (after CT) | 32 : 22 | 0.84 | 0.54 |
| Smaller RT field (after CT) | 84 : 112 | 0.97 | 0.81 |
| Lower RT dose (after CT) | 53 : 51 | 1.01 | 0.96 |
| Fewer CT cycles | 63 : 68 | 1.09 | 0.64 |
| Intensified CT regimen | 141 : 161 | 0.83 | 0.12 |
| CT = chemotherapy; OS = overall survival | |||
| Outcome or subgroup title | No. of studies | No. of participants | Statistical method | Effect size |
| 1 secondary malignant neoplasms Show forest plot | 3 | 1011 | Peto Odds Ratio (95% CI) | 0.43 [0.23, 0.82] |
| 1.1 advanced stages | 2 | 433 | Peto Odds Ratio (95% CI) | 0.41 [0.21, 0.81] |
| 1.2 early stages | 1 | 578 | Peto Odds Ratio (95% CI) | 0.67 [0.10, 4.40] |
| 2 overall survival Show forest plot | 3 | 1011 | Hazard Ratio (Fixed, 95% CI) | 0.71 [0.46, 1.11] |
| 2.1 advanced stages | 2 | 433 | Hazard Ratio (Fixed, 95% CI) | 0.64 [0.40, 1.02] |
| 2.2 early stages | 1 | 578 | Hazard Ratio (Fixed, 95% CI) | 1.97 [0.47, 8.22] |
| 3 progression‐free survival Show forest plot | 3 | 1011 | Hazard Ratio (Fixed, 95% CI) | 1.31 [0.99, 1.73] |
| 3.1 advanced stages | 2 | 433 | Hazard Ratio (Fixed, 95% CI) | 0.74 [0.51, 1.08] |
| 3.2 early stages | 1 | 578 | Hazard Ratio (Fixed, 95% CI) | 2.56 [1.70, 3.85] |
| Outcome or subgroup title | No. of studies | No. of participants | Statistical method | Effect size |
| 1 secondary malignant neoplasms Show forest plot | 4 | 2397 | Peto Odds Ratio (95% CI) | 0.86 [0.64, 1.16] |
| 2 overall survival Show forest plot | 4 | 2397 | Hazard Ratio (Fixed, 95% CI) | 0.89 [0.70, 1.12] |
| 3 progression‐free survival Show forest plot | 4 | 2397 | Hazard Ratio (Fixed, 95% CI) | 0.99 [0.81, 1.21] |
| Outcome or subgroup title | No. of studies | No. of participants | Statistical method | Effect size |
| 1 secondary malignant neoplasms Show forest plot | 3 | 2962 | Peto Odds Ratio (95% CI) | 1.03 [0.71, 1.50] |
| 2 overall survival Show forest plot | 3 | 2962 | Hazard Ratio (Fixed, 95% CI) | 0.91 [0.65, 1.28] |
| 3 progression‐free survival Show forest plot | 3 | 2962 | Hazard Ratio (Fixed, 95% CI) | 1.20 [0.97, 1.48] |
| Outcome or subgroup title | No. of studies | No. of participants | Statistical method | Effect size |
| 1 secondary malignant neoplasms Show forest plot | 3 | 2403 | Peto Odds Ratio (95% CI) | 1.10 [0.74, 1.62] |
| 2 overall survival Show forest plot | 3 | 2403 | Hazard Ratio (Fixed, 95% CI) | 0.99 [0.73, 1.34] |
| 3 progression‐free survival Show forest plot | 3 | 2403 | Hazard Ratio (Fixed, 95% CI) | 1.15 [0.91, 1.45] |
| Outcome or subgroup title | No. of studies | No. of participants | Statistical method | Effect size |
| 1 secondary malignant neoplasms Show forest plot | 7 | 2996 | Peto Odds Ratio (95% CI) | 1.37 [0.89, 2.10] |
| 2 overall survival Show forest plot | 7 | 2996 | Hazard Ratio (Fixed, 95% CI) | 0.85 [0.70, 1.04] |
| 3 progression‐free survival Show forest plot | 7 | 2996 | Hazard Ratio (Fixed, 95% CI) | 0.82 [0.70, 0.95] |
| Outcome or subgroup title | No. of studies | No. of participants | Statistical method | Effect size |
| 1 secondary malignant neoplasms Show forest plot | 3 | Peto Odds Ratio (95% CI) | Subtotals only | |
| 1.1 age≤50 | 3 | 931 | Peto Odds Ratio (95% CI) | 0.39 [0.16, 0.95] |
| 1.2 age>50 | 2 | 80 | Peto Odds Ratio (95% CI) | 0.55 [0.22, 1.41] |
| 1.3 female | 3 | 411 | Peto Odds Ratio (95% CI) | 0.25 [0.09, 0.74] |
| 1.4 male | 3 | 600 | Peto Odds Ratio (95% CI) | 0.60 [0.27, 1.34] |
| 2 overall survival Show forest plot | 3 | Hazard Ratio (Fixed, 95% CI) | Subtotals only | |
| 2.1 age≤50 | 3 | 930 | Hazard Ratio (Fixed, 95% CI) | 0.82 [0.48, 1.42] |
| 2.2 age>50 | 2 | 80 | Hazard Ratio (Fixed, 95% CI) | 0.62 [0.28, 1.38] |
| 2.3 female | 3 | 411 | Hazard Ratio (Fixed, 95% CI) | 0.48 [0.20, 1.18] |
| 2.4 male | 3 | 600 | Hazard Ratio (Fixed, 95% CI) | 0.88 [0.52, 1.49] |
| 3 progression‐free survival Show forest plot | 3 | Hazard Ratio (Fixed, 95% CI) | Subtotals only | |
| 3.1 age≤50 | 3 | 930 | Hazard Ratio (Fixed, 95% CI) | 1.55 [1.15, 2.10] |
| 3.2 age>50 | 2 | 80 | Hazard Ratio (Fixed, 95% CI) | 0.56 [0.25, 1.23] |
| 3.3 female | 3 | 411 | Hazard Ratio (Fixed, 95% CI) | 1.76 [1.08, 2.88] |
| 3.4 male | 3 | 600 | Hazard Ratio (Fixed, 95% CI) | 1.18 [0.83, 1.66] |
| Outcome or subgroup title | No. of studies | No. of participants | Statistical method | Effect size |
| 1 secondary malignant neoplasms Show forest plot | 4 | Peto Odds Ratio (95% CI) | Subtotals only | |
| 1.1 age≤50 | 4 | 2013 | Peto Odds Ratio (95% CI) | 0.84 [0.59, 1.21] |
| 1.2 age>50 | 4 | 384 | Peto Odds Ratio (95% CI) | 0.82 [0.48, 1.39] |
| 1.3 female | 4 | 1295 | Peto Odds Ratio (95% CI) | 1.03 [0.66, 1.59] |
| 1.4 male | 4 | 1102 | Peto Odds Ratio (95% CI) | 0.74 [0.50, 1.11] |
| 2 overall survival Show forest plot | 4 | Hazard Ratio (Fixed, 95% CI) | Subtotals only | |
| 2.1 age≤50 | 4 | 2013 | Hazard Ratio (Fixed, 95% CI) | 1.03 [0.76, 1.40] |
| 2.2 age>50 | 4 | 384 | Hazard Ratio (Fixed, 95% CI) | 0.69 [0.46, 1.01] |
| 2.3 female | 4 | 1295 | Hazard Ratio (Fixed, 95% CI) | 0.81 [0.54, 1.21] |
| 2.4 male | 4 | 1102 | Hazard Ratio (Fixed, 95% CI) | 0.98 [0.73, 1.32] |
| 3 progression‐free survival Show forest plot | 4 | Hazard Ratio (Fixed, 95% CI) | Subtotals only | |
| 3.1 age≤50 | 4 | 2013 | Hazard Ratio (Fixed, 95% CI) | 1.13 [0.88, 1.44] |
| 3.2 age>50 | 4 | 384 | Hazard Ratio (Fixed, 95% CI) | 0.69 [0.48, 1.00] |
| 3.3 female | 4 | 1295 | Hazard Ratio (Fixed, 95% CI) | 0.87 [0.63, 1.19] |
| 3.4 male | 4 | 1102 | Hazard Ratio (Fixed, 95% CI) | 1.09 [0.84, 1.42] |
| Outcome or subgroup title | No. of studies | No. of participants | Statistical method | Effect size |
| 1 secondary malignant neoplasms Show forest plot | 3 | Peto Odds Ratio (95% CI) | Subtotals only | |
| 1.1 age≤50 | 3 | 2503 | Peto Odds Ratio (95% CI) | 0.97 [0.56, 1.69] |
| 1.2 age>50 | 2 | 459 | Peto Odds Ratio (95% CI) | 1.06 [0.63, 1.79] |
| 1.3 female | 3 | 1347 | Peto Odds Ratio (95% CI) | 0.84 [0.48, 1.48] |
| 1.4 male | 3 | 1615 | Peto Odds Ratio (95% CI) | 1.21 [0.73, 2.00] |
| 2 overall survival Show forest plot | 3 | Hazard Ratio (Fixed, 95% CI) | Subtotals only | |
| 2.1 age≤50 | 3 | 2503 | Hazard Ratio (Fixed, 95% CI) | 0.90 [0.56, 1.45] |
| 2.2 age>50 | 2 | 459 | Hazard Ratio (Fixed, 95% CI) | 0.88 [0.55, 1.41] |
| 2.3 female | 3 | 1347 | Hazard Ratio (Fixed, 95% CI) | 0.97 [0.56, 1.66] |
| 2.4 male | 3 | 1615 | Hazard Ratio (Fixed, 95% CI) | 0.90 [0.59, 1.38] |
| 3 progression‐free survival Show forest plot | 3 | Hazard Ratio (Fixed, 95% CI) | Subtotals only | |
| 3.1 age≤50 | 3 | 2503 | Hazard Ratio (Fixed, 95% CI) | 1.26 [0.99, 1.61] |
| 3.2 age>50 | 2 | 459 | Hazard Ratio (Fixed, 95% CI) | 0.99 [0.66, 1.49] |
| 3.3 female | 3 | 1347 | Hazard Ratio (Fixed, 95% CI) | 1.37 [0.98, 1.90] |
| 3.4 male | 3 | 1615 | Hazard Ratio (Fixed, 95% CI) | 1.11 [0.84, 1.46] |
| Outcome or subgroup title | No. of studies | No. of participants | Statistical method | Effect size |
| 1 secondary malignant neoplasms Show forest plot | 3 | Peto Odds Ratio (95% CI) | Subtotals only | |
| 1.1 age≤50 | 3 | 1897 | Peto Odds Ratio (95% CI) | 0.88 [0.51, 1.52] |
| 1.2 age>50 | 3 | 506 | Peto Odds Ratio (95% CI) | 1.44 [0.82, 2.54] |
| 1.3 female | 3 | 1117 | Peto Odds Ratio (95% CI) | 1.09 [0.61, 1.95] |
| 1.4 male | 3 | 1286 | Peto Odds Ratio (95% CI) | 1.09 [0.64, 1.86] |
| 2 overall survival Show forest plot | 3 | Hazard Ratio (Fixed, 95% CI) | Subtotals only | |
| 2.1 age≤50 | 3 | 1897 | Hazard Ratio (Fixed, 95% CI) | 0.94 [0.62, 1.44] |
| 2.2 age>50 | 3 | 506 | Hazard Ratio (Fixed, 95% CI) | 1.07 [0.68, 1.68] |
| 2.3 female | 3 | 1117 | Hazard Ratio (Fixed, 95% CI) | 0.86 [0.53, 1.40] |
| 2.4 male | 3 | 1286 | Hazard Ratio (Fixed, 95% CI) | 1.07 [0.72, 1.59] |
| 3 progression‐free survival Show forest plot | 3 | Hazard Ratio (Fixed, 95% CI) | Subtotals only | |
| 3.1 age≤50 | 3 | 1897 | Hazard Ratio (Fixed, 95% CI) | 1.19 [0.90, 1.59] |
| 3.2 age>50 | 3 | 506 | Hazard Ratio (Fixed, 95% CI) | 1.10 [0.74, 1.63] |
| 3.3 female | 3 | 1117 | Hazard Ratio (Fixed, 95% CI) | 1.12 [0.78, 1.61] |
| 3.4 male | 3 | 1286 | Hazard Ratio (Fixed, 95% CI) | 1.17 [0.87, 1.59] |
| Outcome or subgroup title | No. of studies | No. of participants | Statistical method | Effect size |
| 1 secondary malignant neoplasms Show forest plot | 7 | Peto Odds Ratio (95% CI) | Subtotals only | |
| 1.1 age≤50 | 7 | 2499 | Peto Odds Ratio (95% CI) | 2.11 [1.17, 3.79] |
| 1.2 age>50 | 7 | 497 | Peto Odds Ratio (95% CI) | 0.78 [0.41, 1.47] |
| 1.3 female | 7 | 1252 | Peto Odds Ratio (95% CI) | 1.86 [0.97, 3.58] |
| 1.4 male | 7 | 1744 | Peto Odds Ratio (95% CI) | 1.06 [0.60, 1.87] |
| 1.5 BEACOPP | 3 | 1255 | Peto Odds Ratio (95% CI) | 1.06 [0.60, 1.88] |
| 1.6 Stanford | 2 | 749 | Peto Odds Ratio (95% CI) | 0.90 [0.27, 2.95] |
| 1.7 EBVCAD | 2 | 425 | Peto Odds Ratio (95% CI) | 6.03 [1.71, 21.30] |
| 1.8 CHlVPP | 2 | 788 | Peto Odds Ratio (95% CI) | 2.14 [0.87, 5.29] |
| 2 overall survival Show forest plot | 7 | Hazard Ratio (Fixed, 95% CI) | Subtotals only | |
| 2.1 age≤50 | 7 | 2499 | Hazard Ratio (Fixed, 95% CI) | 0.74 [0.58, 0.95] |
| 2.2 age>50 | 7 | 497 | Hazard Ratio (Fixed, 95% CI) | 1.08 [0.78, 1.50] |
| 2.3 female | 7 | 1252 | Hazard Ratio (Fixed, 95% CI) | 0.78 [0.56, 1.07] |
| 2.4 male | 7 | 1744 | Hazard Ratio (Fixed, 95% CI) | 0.88 [0.68, 1.14] |
| 2.5 BEACOPP | 3 | 1255 | Hazard Ratio (Fixed, 95% CI) | 0.58 [0.43, 0.79] |
| 2.6 Stanford | 2 | 749 | Hazard Ratio (Fixed, 95% CI) | 1.11 [0.72, 1.71] |
| 2.7 EBVCAD | 2 | 425 | Hazard Ratio (Fixed, 95% CI) | 1.10 [0.62, 1.97] |
| 2.8 CHlVPP | 2 | 788 | Hazard Ratio (Fixed, 95% CI) | 1.23 [0.87, 1.75] |
| 3 progression‐free survival Show forest plot | 7 | Hazard Ratio (Fixed, 95% CI) | Subtotals only | |
| 3.1 age≤50 | 7 | 2499 | Hazard Ratio (Fixed, 95% CI) | 0.72 [0.61, 0.86] |
| 3.2 age>50 | 7 | 497 | Hazard Ratio (Fixed, 95% CI) | 1.15 [0.86, 1.55] |
| 3.3 female | 7 | 1252 | Hazard Ratio (Fixed, 95% CI) | 0.75 [0.60, 0.96] |
| 3.4 male | 7 | 1744 | Hazard Ratio (Fixed, 95% CI) | 0.85 [0.70, 1.02] |
| 3.5 BEACOPP | 3 | 1255 | Hazard Ratio (Fixed, 95% CI) | 0.47 [0.37, 0.60] |
| 3.6 Stanford | 2 | 749 | Hazard Ratio (Fixed, 95% CI) | 1.46 [1.09, 1.96] |
| 3.7 EBVCAD | 2 | 425 | Hazard Ratio (Fixed, 95% CI) | 0.96 [0.61, 1.49] |
| 3.8 CHlVPP | 2 | 788 | Hazard Ratio (Fixed, 95% CI) | 1.03 [0.79, 1.34] |