Antidepresivos de segunda generación para el tratamiento del trastorno afectivo estacional
Resumen
Antecedentes
El trastorno afectivo estacional (TAE) es un modelo estacional de episodios depresivos recurrentes que se suele tratar con antidepresivos de segunda generación (ASG), fototerapia o psicoterapia.
Objetivos
Evaluar la eficacia y la seguridad de los antidepresivos de segunda generación (ASG) para el tratamiento del trastorno afectivo estacional (TAE) en adultos en comparación con placebo, fototerapia, otros ASG o psicoterapia.
Métodos de búsqueda
Esta es una actualización de una revisión anterior publicada por primera vez en 2011. Se realizaron búsquedas en el Registro Cochrane central de ensayos controlados (Cochrane Central Register of Controlled Trials, CENTRAL; 2020, número 1) en la Cochrane Library (todos los años), Ovid MEDLINE, Embase y PsycINFO (2011 a enero de 2020), junto con el Registro de ensayos controlados del Grupo Cochrane de Trastornos mentales comunes (Cochrane Common Mental Disorders) (todos los años disponibles), para obtener informes de ensayos controlados aleatorizados (ECA). Se realizaron búsquedas manuales en las listas de referencias de todos los estudios incluidos y en otras revisiones sistemáticas. Se realizaron búsquedas en ClinicalTrials.gov de ensayos no publicados/en curso. Se realizó una búsqueda separada de actualización de informes de eventos adversos en las bases de datos Ovid.
Criterios de selección
Para la eficacia se incluyeron ECA de ASG en comparación con otros ASG, placebo, fototerapia o psicoterapia en participantes adultos con TAE. Para los eventos adversos también se incluyeron estudios no aleatorizados.
Obtención y análisis de los datos
Dos autores de la revisión revisaron los resúmenes y las publicaciones de texto completo en función de los criterios de inclusión. La extracción de los datos y la evaluación del "riesgo de sesgo" se realizaron de forma individual. Los datos se agruparon para realizar el metanálisis cuando los grupos de participantes eran similares y cuando los estudios evaluaron los mismos tratamientos con el mismo comparador y tenían definiciones similares de las medidas de desenlace durante un período de tratamiento similar.
Resultados principales
En esta actualización no se identificaron ECA nuevos sobre la efectividad de los ASG en pacientes con TAE. Se incluyeron dos estudios observacionales adicionales de un solo brazo que informaron sobre los eventos adversos de los ASG.
Para la eficacia se incluyeron tres ECA de entre cinco y ocho semanas de duración con un total de 204 participantes. Para los eventos adversos se incluyeron dos ECA y cinco estudios observacionales (no aleatorizados) de cinco a ocho semanas de duración con un total de 249 participantes. Todos los participantes cumplían los criterios del DSM (Diagnostic and Statistical Manual of Mental Disorders) para el TAE. La edad promedio varió entre los 34 y los 42 años, y la mayoría de los participantes eran mujeres (66% al 100%).
Los resultados de un ensayo con 68 participantes mostraron que la fluoxetina (20/36) fue numéricamente superior al placebo (11/32) en el logro de la respuesta clínica; sin embargo, el intervalo de confianza (IC) incluyó tanto un efecto beneficioso potencial como ningún efecto beneficioso de la fluoxetina (razón de riesgos [RR] 1,62; IC del 95%: 0,92 a 2,83; evidencia de certeza muy baja). El número de eventos adversos fue similar en ambos grupos (evidencia de certeza muy baja).
Dos ensayos con un total de 136 participantes compararon la fluoxetina con la fototerapia. El metanálisis mostró que la fluoxetina y la fototerapia son aproximadamente iguales en el tratamiento de la depresión estacional: RR de respuesta 0,98 (IC del 95%: 0,77 a 1,24, evidencia de certeza baja), RR de remisión 0,81 (IC del 95%: 0,39 a 1,71, evidencia de certeza muy baja). El número de eventos adversos fue similar en ambos grupos (evidencia de certeza baja).
No se identificaron estudios elegibles que compararan un ASG con otro ASG o con la psicoterapia.
Dos ECA y cinco estudios no aleatorizados informaron datos de los eventos adversos en un total de 249 participantes que recibieron bupropión, fluoxetina, escitalopram, duloxetina, nefazodona, reboxetina, fototerapia o placebo. Sólo fue posible obtener las tasas brutas de eventos adversos, por lo que se recomienda precaución en la interpretación de esta información. Entre el 0% y el 100% de los participantes que recibieron un ASG presentaron un evento adverso, y entre el 0% y el 25% de los participantes se retiraron del estudio debido a eventos adversos.
Conclusiones de los autores
La evidencia de la efectividad de los ASG está limitada a un ensayo pequeño de la fluoxetina comparada con placebo, que muestra un efecto no significativo a favor de la fluoxetina, y dos ensayos pequeños que compararon la fluoxetina con la fototerapia, que indicaron una equivalencia entre las dos intervenciones. La falta de evidencia disponible impidió establecer conclusiones generales sobre el uso de los ASG para el TAE. Se necesitan ECA adicionales y más grandes para ampliar y fortalecer la base de evidencia sobre este tema, y también deben incluir comparaciones con la psicoterapia y con otros ASG.
Los datos sobre los eventos adversos fueron escasos y no fue posible realizar un análisis comparativo. Por lo tanto, los datos obtenidos sobre los eventos adversos no son consistentes y la confianza en los datos es limitada. En general, hasta el 25% de los participantes tratados con ASG para el TAE se retiraron de los estudios de forma precoz debido a los eventos adversos.
Resumen en términos sencillos
Antidepresivos de segunda generación para la depresión invernal
Antecedentes
El trastorno afectivo estacional (depresión invernal) es un tipo de depresión que reaparece en el otoño y se prolonga hasta la primavera. Sus síntomas son similares a los de la depresión normal, salvo que los que lo presentan suelen estar muy cansados y tienen un aumento del apetito. Es más común en los países con pocas horas de luz natural en el invierno. Uno de los pilares del tratamiento de todos los tipos de depresión, incluida la depresión invernal, son los antidepresivos de segunda generación (ASG) como los inhibidores selectivos de la recaptación de serotonina (ISRS) y los inhibidores de la recaptación de serotonina y norepinefrina (IRSN). No está claro lo bien que funcionan estos fármacos ni cómo se comparan entre sí o con otros tipos de tratamiento para la depresión invernal, como la fototerapia.
Resultados
Se encontraron tres ensayos con un total de 204 participantes que consideraron un ASG (fluoxetina) en comparación con placebo (píldora simulada) o fototerapia. Un ensayo (68 participantes) comparó la fluoxetina con el placebo, aunque los participantes que recibieron fluoxetina tuvieron más probabilidades de responder al tratamiento, no hubo suficientes datos para tener la seguridad de cualquier diferencia con el placebo. Aproximadamente el mismo número de participantes en ambos grupos presentó un efecto secundario.
Se encontraron dos ensayos con 136 participantes en total que compararon la fluoxetina con la fototerapia. Cuando se combinaron los resultados de estos dos ensayos, se encontró que los dos tratamientos tenían efectos similares: aproximadamente 66 de 100 personas mejoraron en el grupo de fluoxetina y en el de fototerapia. El número de participantes con efectos secundarios también fue aproximadamente el mismo en los grupos de fluoxetina y de fototerapia.
Se encontraron cinco estudios adicionales que proporcionaron información sobre la seguridad de los ASG para el tratamiento de la depresión invernal. Estos estudios informaron efectos secundarios de los ASG bupropión, fluoxetina, escitalopram, duloxetina, nefazodona y reboxetina. No fue posible comparar los fármacos directamente, pero se puede señalar que entre el 0% y el 25% de las personas abandonaron el estudio antes de tiempo debido a los efectos secundarios, y los efectos secundarios más frecuentes fueron náuseas, diarrea, trastornos del sueño, disminución del deseo sexual, sequedad de la boca y agitación. No fue posible comparar las tasas de efectos secundarios en las personas que recibieron ASG en comparación con placebo, lo que significa que la confianza en la información sobre los efectos secundarios es limitada.
Certeza de la evidencia
La certeza de la evidencia de la efectividad y la seguridad de la fluoxetina en comparación con el placebo fue muy baja. La certeza de la evidencia de la efectividad y la seguridad de la fluoxetina en comparación con la fototerapia fue baja.
Authors' conclusions
Summary of findings
| Fluoxetine compared with placebo for seasonal affective disorder | |||||
| Patient or population: adults with seasonal affective disorder Settings: outpatients Intervention: fluoxetine Comparison: placebo | |||||
| Outcomes | Illustrative comparative risks* (95% CI) | Relative effect | No. of participants | Certainty of the evidence | |
|---|---|---|---|---|---|
| Assumed risk | Corresponding risk | ||||
| Placebo | Fluoxetine | ||||
| Response (> 50% improvement on 29‐item HAM‐D SIGH‐SAD) 5 weeks | 34 per 100
| 56 per 100
| RR 1.62 (0.92 to 2.83) | 68 | ⊕⊝⊝⊝ |
| Clinical Global Impression – Improvement score | No evidence identified. | ||||
| Quality of life | No evidence identified. | ||||
| Remission | No evidence identified. | ||||
| Speed of onset of response | No evidence identified. | ||||
| Overall adverse events 5 weeks | 91 per 100
| 97 per 100
| RR 1.07 (0.95 to 1.21) | 68 | ⊕⊝⊝⊝ |
| *The basis for the assumed risk (e.g. the median control group risk across studies) is the rate in the placebo group. The corresponding risk (and its 95% CI) is based on the assumed risk in the fluoxetine group and the relative effect of the intervention (and its 95% CI). CI: confidence interval; HAM‐D SIGH‐SAD: Structured Interview Guide for the Hamilton Depression Rating Scale ‐ Seasonal Affective Disorder Version; RR: risk ratio | |||||
| GRADE Working Group grades of evidence High certainty: We are very confident that the true effect lies close to that of the estimate of the effect Moderate certainty: We are moderately confident in the effect estimate: The true effect is likely to be close to the estimate of the effect, but there is a possibility that it is substantially different Low certainty: Our confidence in the effect estimate is limited: The true effect may be substantially different from the estimate of the effect Very low certainty: We have very little confidence in the effect estimate: The true effect is likely to be substantially different from the estimate of effect | |||||
| 1Downgraded by one level because the trial has an unclear risk of bias in all but one 'Risk of bias' domains, and two levels for serious imprecision due to the small number of participants in the trial and because the confidence interval includes both benefit and no effect. | |||||
| Fluoxetine compared with light therapy for seasonal affective disorder | ||||||
| Patient or population: adults with seasonal affective disorder Settings: outpatients Intervention: fluoxetine Comparison: light therapy | ||||||
| Outcomes | Illustrative comparative risks* (95% CI) | Relative effect | No. of participants | Certainty of the evidence | Comments | |
|---|---|---|---|---|---|---|
| Assumed risk | Corresponding risk | |||||
| Light therapy | Fluoxetine | |||||
| Response (> 50% improvement on 24‐item HAM‐D SIGH‐SAD) 5 to 8 weeks | 68 per 100 | 67 per 100 | RR 0.98 (0.77 to 1.24) | 136 | ⊕⊕⊝⊝ | |
| Clinical Global Impression – Improvement score | No evidence identified. | |||||
| Quality of life (SF‐20 and Q‐LES‐Q) 8 weeks | SF‐20: The mean change from baseline was 7.82 Q‐LES‐Q:The mean change from baseline was 20.26 | SF‐20: The mean change from baseline was 1.56 higher (4.2 lower to 7.32 higher) Q‐LES‐Q:The mean change from baseline was 1.21 higher (4.87 lower to 7.29 higher) | ‐ | 96 (1 study, Lam 2006) | ⊕⊕⊝⊝ | mean difference of change from baseline self calculated by review authors |
| Remission (response plus end score 8 or less) 5 to 8 weeks | 68 per 100 | 55 per 100 | RR 0.81 (0.39 to 1.71) | 136 | ⊕⊝⊝⊝ | |
| Time to onset of response | No evidence identified | |||||
| Adverse events (at least 1 treatment‐emergent adverse event) 8 weeks | 77 per 100 | 75 per 100 | RR 0.97 (0.78 to 1.22) | 96 (1 study, Lam 2006) | ⊕⊕⊝⊝ | |
| *The basis for the assumed risk (e.g. the median control group risk across studies) is the response rate in the light therapy groups in the 2 included trials. The corresponding risk (and its 95% CI) is based on the assumed risk in the fluoxetine group and the relative effect of the intervention (and its 95% CI). CI: confidence interval; HAM‐D SIGH‐SAD: Structured Interview Guide for the Hamilton Depression Rating Scale ‐ Seasonal Affective Disorder Version; NR: not reported; Q‐LES‐Q: Quality of Life Enjoyment and Satisfaction Questionnaire; RR: risk ratio; SF‐20: 20‐Item Short Form Health Survey | ||||||
| GRADE Working Group grades of evidence High certainty: We are very confident that the true effect lies close to that of the estimate of the effect Moderate certainty: We are moderately confident in the effect estimate: The true effect is likely to be close to the estimate of the effect, but there is a possibility that it is substantially different Low certainty: Our confidence in the effect estimate is limited: The true effect may be substantially different from the estimate of the effect Very low certainty: We have very little confidence in the effect estimate: The true effect is likely to be substantially different from the estimate of effect | ||||||
| 1Downgraded by one level because the risk of bias was high in one study, and one level for imprecision because the optimal information size was not reached (too few participants). | ||||||
Background
Description of the condition
Seasonal affective disorder (SAD) is a seasonal pattern of recurrent major depressive episodes that occur during autumn or winter and remit in spring or summer (Rosenthal 1984). In addition to the predictable seasonal pattern of depression, people suffering from SAD experience atypical symptoms including hypersomnia, carbohydrate craving with increased appetite and weight gain, and extreme fatigue (Sohn 2005). The prevalence of SAD ranges from 1.5% to 10%, with higher prevalence rates in more northern latitudes (Byrne 2008; Levitt 2000; Wirz‐Justice 2018).
SAD is a multifactorial condition. Chronobiological mechanisms related to circadian rhythms, melatonin, alterations of the serotonergic neurotransmitter system, and photoperiodism (length of dark hours relative to light hours in a 24‐hour period) are all thought to play a role in SAD (Ciarleglio 2011; Levitan 2007; Oldham 2014). Although it is commonly believed that a seasonal pattern of depression occurs almost exclusively in locations with very few hours of daylight in winter (Moscovitch 2004), a Canadian study on the prevalence of SAD over eight degrees of latitude did not support this theory (Levitt 2002). It is assumed that the major monoaminergic neurotransmitters serotonin, norepinephrine, and dopamine are fundamental to the pathology of SAD, and that the condition results from the interaction of genetic vulnerability and environmental factors (Gonda 2020; Levitan 2007).
Description of the intervention
Since their introduction to the market in the late 1980s, second‐generation antidepressants (SGAs) have established themselves as a dominant form of pharmacotherapy for depressive disorders (Gartlehner 2011, Gartlehner 2017).
In general, SGAs work through their effect on neurotransmitters in the central nervous system. SGAs can be classified into three groups: selective serotonin reuptake inhibitors (SSRIs); serotonin and norepinephrine reuptake inhibitors (SNRIs); and others. The SSRIs (citalopram, escitalopram, fluoxetine, fluvoxamine, paroxetine, and sertraline) act by selectively inhibiting the reuptake of serotonin (5‐hydroxy‐tryptamine, 5‐HT) at the presynaptic neuronal membrane. The SNRIs (desvenlafaxine, duloxetine, levomilnacipran, milnacipran, and venlafaxine) are potent inhibitors of serotonin and norepinephrine reuptake. Some SSRIs and SNRIs may also exert dopamine reuptake inhibition, but this is not essential to their categorisation. Other SGAs include mirtazapine, which is an antagonist at presynaptic alpha‐2 autoreceptors (which disinhibits norepinephrine release) and a 5‐HT2 receptor antagonist (Gartlehner 2008; Hansen 2009). Bupropion is an inhibitor of the neuronal uptake of norepinephrine and dopamine (Khan 2016). Reboxetine is a norepinephrine reuptake inhibitor that does not act on serotonin (Kent 2000). Similarly, agomelatine is a melatonin‐1 (MT1) and MT2 receptor agonist and 5‐HT2C receptor antagonist (Hickie 2011). Vortioxetine is a 5‐HT transporter inhibitor, an agonist at the 5‐HT1A receptor, a partial agonist at the 5‐HT1B receptor and an antagonist at the 5‐HT1D, 5‐HT3 and 5‐HT7 receptor. Vilazodon acts as an SSRI together with agonism at the 5‐HT1A receptor (Wagner 2018).
Clinical guidelines recommend SGAs for the treatment of SAD (DGPPN 2015; NICE 2009). The German depression guideline and the Royal Australian and New Zealand College of Psychiatrists clinical practice guidelines for mood disorders recommend early‐morning bright‐light therapy for SAD (DGPPN 2015, Malhi 2021), whilst the National Institute for Health and Care Excellence (NICE) also recommends psychotherapy for the condition (NICE 2009). We therefore investigated the efficacy and adverse events of SGAs when used for the treatment of SAD and included other treatment alternatives like light therapy and psychotherapy as comparators.
How the intervention might work
Much research into the aetiology of SAD has focused on the role of circadian rhythms and melatonin (Lam 2006), and early‐morning bright‐light exposure is a common and effective treatment for SAD (Golden 2005; Pjrek 2020). On the neurochemical level, changes in both the serotonergic and catecholaminergic neurotransmitter systems seem to play a key role in the disorder (Neumeister 2001). Targeting these systems with serotonin or norepinephrine reuptake inhibition, or both, provides the biological plausibility for the mechanism of action of the SGAs. Indeed, the therapeutic action of SGAs in SAD is similar to that in non‐seasonal depression, even though the role of daylight and circadian rhythms in the pathogenesis of SAD might be different to non‐seasonal depression (Ciarleglio 2011; Pjrek 2005).
Why it is important to do this review
Bright‐light therapy is considered to be an effective treatment for seasonal affective disorder (Pjrek 2020), and is recommended in clinical guidelines (DGPPN 2015; Kennedy 2001). Indeed, one systematic review and meta‐analysis suggested that effect sizes for light therapy in SAD are comparable to those seen in trials of SGAs (Golden 2005). Also, the last version of this review found similar effects of light therapy and SGAs in SAD treatment (Thaler 2011). Unfortunately, light therapy is time intensive; typical regimens suggest at least 30 minutes of light exposure immediately after waking (Lam 2006), which may result in poor adherence to therapy (Michalak 2002; Nussbaumer‐Streit 2018). Hence, it was important to determine the efficacy of SGAs in treating SAD, in particular in comparison to light therapy. Furthermore, interest in the comparative efficacy of SGAs is still high, with many reviews seeking to provide guidance to physicians about the most appropriate SGA for depression (Cipriani 2018; Gartlehner 2011; Monden 2018; Wagner 2018). The original version of this review was published in 2011 and required an update (Thaler 2011).
Objectives
To assess the efficacy and safety of second‐generation antidepressants (SGAs) for the treatment of seasonal affective disorder (SAD) in adults in comparison with placebo, light therapy, other SGAs, or psychotherapy.
Methods
Criteria for considering studies for this review
Types of studies
Efficacy (beneficial effects)
We included randomised controlled trials (RCTs) of at least four weeks' duration. We included cluster‐RCTs, with data from cross‐over trials eligible up to the point of crossing over.
Adverse events
We included both experimental and observational (non‐randomised) studies (Barbui 2009; Higgins 2020):
-
RCTs of SGAs for SAD, of at least four weeks' duration;
-
controlled and uncontrolled non‐randomised studies of SGAs for SAD, of at least four weeks' duration.
Types of participants
We included studies involving adults (at least 18 years of age) with a DSM‐IV (Diagnostic and Statistical Manual of Mental Disorders, Fourth Edition) (APA 2000), or equivalent diagnosis of SAD (major depressive disorder (MDD) with a seasonal pattern). Studies that enrolled SAD participants with bipolar depression were excluded; because patients with bipolar disorders are primarily treated with mood stabilisers, not with antidepressants, while SGAs are the first line treatment for patients with unipolar depression. Studies with participants with secondary co‐morbidities were considered for inclusion.
Types of interventions
Experimental interventions
We considered trials of the following SGAs:
-
SSRIs: citalopram, escitalopram, fluoxetine, fluvoxamine, paroxetine, sertraline;
-
SNRIs: desvenlafaxine, duloxetine, milnacipran, mirtazapine, venlafaxine;
-
other: agomelatine, bupropion, nefazodone, reboxetine, trazodone, levomilnacipran, vilazodone, vortioxetine.
Comparison interventions
We compared any SGA with another SGA, placebo, light therapy, or psychotherapy as a comparator. Commonly used psychological therapy approaches include behavioural therapy, cognitive behavioural therapy, and psychodynamic therapy. Placebo could be pills that look like an SGA but have no therapeutic value (sugar pill), or light therapy devices that emit little lux and therefore have no therapeutic value.
Types of outcome measures
Primary outcomes
The primary outcome is the proportion of participants achieving a clinical response, calculated from the number of participants randomised (intention‐to‐treat analysis). Clinical response was defined by the trial authors and included:
-
the proportion of participants experiencing a greater than 50% improvement on the Hamilton Depression Scale (HAM‐D) (Hamilton 1980), combined with the eight‐item supplementary scale for seasonal affective disorder (Structured Interview Guide for the Hamilton Depression Rating Scale ‐ Seasonal Affective Disorder Version (SIGH‐SAD)) (Williams 1988);
-
the proportion of participants experiencing a greater than 50% improvement on the HAM‐D.
Secondary outcomes
-
Proportion of participants reporting a Clinical Global Impression – Improvement (CGI‐I) score of 1 or 2 (much improved or very much improved) (Guy 1970).
-
Improvement in quality of life (QOL), as measured by a validated QOL tool (e.g. 36‐item Short Form Health Survey (SF‐36)) (Ware 1992).
-
Remission, as defined by the study authors.
-
Speed of onset of response.
-
Occurrence of adverse events, such as suicidality (suicidal thinking or behaviour), sexual side effects, seizures, biochemical adverse events (e.g. hyponatraemia), weight change, and gastrointestinal symptoms, as well as withdrawals attributable to adverse events and serious adverse events.
Search methods for identification of studies
Electronic searches
An Information Specialist with the Cochrane Common Mental Disorders Group ran an updated search on the following databases to identify reports of RCTs (29 January 2020) (Appendix 1):
-
Cochrane Central Register of Controlled Trials (CENTRAL; 2020, Issue 1) in the Cochrane Library (all years);
-
Ovid MEDLINE (2011 to 29 January 2020);
-
Ovid Embase (2011 to 29 January 2020);
-
Ovid PsycINFO (2011 to 29 January 2020);
-
Cochrane Common Mental Disorders Controlled Trials Register (CCMDCTR) (archived database) (2011 to June 2016 only).
International trial protocols registered on the US National Institutes of Health Ongoing Trials Register ClinicalTrials.gov and the World Health Organization International Clinical Trials Registry Platform (WHO ICTRP) were captured via CENTRAL on the Cochrane Library.
The Information Specialist also ran a separate search for adverse events (Ovid databases) (24 February 2020) (Appendix 2).
We applied no restrictions to language or publication status.
Searches for the earlier version of this review, published in 2011, are shown in Appendix 3.
Searching other resources
In addition, we handsearched the references of all included studies and pertinent review articles. We ran a separate search of the US National Institutes of Health Ongoing Trials Register ClinicalTrials.gov (www.clinicaltrials.gov/) to detect ongoing or unpublished studies. Finally, we contacted experts in the field of SAD to ensure that we were aware of all published and unpublished trials.
Data collection and analysis
Selection of studies
Two review authors (BNS, KT, AC, TP, AS, or GG) independently reviewed the titles and abstracts of records identified by the search. We retrieved full‐text copies of all studies that potentially met the inclusion criteria based on abstract review, and two review authors (BNS, KT, AC, TP, AS, or GG) independently reviewed these to determine their eligibility. Any disagreements between review authors were discussed with and resolved by a third party (BNS or GG). We used Covidence software to facilitate title/abstract and full‐text screening (Covidence).
No studies published only as abstracts were considered for inclusion in the review, hence there was no need to contact trial authors for information required to permit an appraisal of trial quality.
Data extraction and management
Two review authors (BNS, KT) independently abstracted data from the included trials. A third review author (AC) checked the data for accuracy and completeness. Any discrepancies were resolved by consensus or by involving a third review author.
We extracted the following study characteristics.
-
Methods: study design, duration of study, duration of treatment period, number of study centres, Country.
-
Participants: number of participants, age (mean or range), proportion of women, diagnostic criteria, inclusion and exclusion criteria.
-
Interventions: intervention, comparison.
-
Outcomes: primary and secondary outcomes specified.
-
Notes: funding for studies and conflicts of interest of authors.
All possible comparisons based on our inclusion criteria were as follows.
-
SGAs versus placebo
-
SGAs versus light therapy
-
SGAs versus other SGAs
-
SGAs versus psychotherapy
In the case of missing data, we would have contacted the study authors, but this was not necessary.
Assessment of risk of bias in included studies
We assessed the risk of bias of randomised trials using the Cochrane 'Risk of bias' tool, as described in the Cochrane Handbook for Systematic Reviews of Interventions (Higgins 2009). The tool includes assessment of: random sequence generation; allocation concealment; blinding of participants, personnel, and outcome assessors; incomplete outcome data; selective outcome reporting; and other potential threats to validity. Specifically, we assessed attrition (loss of participants during a study) in the trials and the reasons for it, particularly where the attrition rates between two groups in a trial were substantially different. In addition, we assessed whether all relevant outcomes for the trial were reported in the published articles. We assessed each domain as low, high, or unclear risk of bias.
For non‐randomised studies, we used criteria involving selection of cases or cohorts and controls, adjustment for confounders, methods of outcomes assessment, length of follow‐up, and statistical analysis (Deeks 2003). We entered our 'Risk of bias' assessment into the standard 'Risk of bias' tables (used to generate figures in the report), as well as in an Additional table (Table 1; Table 2; Table 3; Table 4; Table 5). Two review authors (BNS, KT) independently assessed the risk of bias. Any discrepancies were resolved by consensus or by involving a third review author.
| Domain | Authors' judgement | Support for judgement |
|---|---|---|
| How did allocation occur? Was there concealment of allocation? | High risk | All participants received active therapy with bupropion. No concealment of allocation |
| Blinding? (participants) | High risk | Open‐label |
| Follow‐up equal and complete? | High risk | 33% attrition |
| Baseline comparability of groups? | Unclear | Only 1 group |
| Intention‐to‐treat analysis | High risk | Intention‐to‐treat analysis not employed. |
| Intervention clearly specified? | Low risk | Intervention clearly described. |
| Outcomes clearly specified? | High risk | Outcome of interest (adverse events) not clearly specified. |
| Interpretation based on results? | Low risk | Yes |
| Domain | Authors' judgement | Support for judgement |
|---|---|---|
| How did allocation occur? Was there concealment of allocation? | High risk | All participants received active therapy with escitalopram. No concealment of allocation |
| Blinding? (participants) | High risk | Open‐label |
| Follow‐up equal and complete? | Low risk | 10% attrition |
| Baseline comparability of groups? | Unclear | Only 1 group |
| Intention‐to‐treat analysis | Low risk | Intention‐to‐treat analysis employed. |
| Intervention clearly specified? | Low risk | Intervention clearly described. |
| Outcomes clearly specified? | Low risk | Outcomes clearly specified, including prospective adverse events recording with Udvalg for Kliniske Undersogelser |
| Interpretation based on results? | Low risk | Yes |
| Domain | Authors' judgement | Support for judgement |
|---|---|---|
| How did allocation occur? Was there concealment of allocation? | High risk | All participants received active therapy with duloxetine. No concealment of allocation |
| Blinding? (participants) | High risk | Open‐label |
| Follow‐up equal and complete? | High risk | 23% attrition |
| Baseline comparability of groups? | Unclear | Only 1 group |
| Intention‐to‐treat analysis | High risk | LOCF analysis employed. |
| Intervention clearly specified? | Low risk | Intervention clearly described. |
| Outcomes clearly specified? | Low risk | Outcomes clearly specified, including prospective adverse events recording with Udvalg for Kliniske Undersogelser |
| Interpretation based on results? | High risk | No, due to high attrition and use of LOCF approach for missing data |
LOCF: last observation carried forward
| Domain | Authors' judgement | Support for judgement |
|---|---|---|
| How did allocation occur? Was there concealment of allocation? | High risk | All participants received active therapy with reboxetine. No concealment of allocation |
| Blinding? (participants) | High risk | Open‐label |
| Follow‐up equal and complete? | High risk | 27% attrition |
| Baseline comparability of groups? | Unclear | Only 1 group |
| Intention‐to‐treat analysis | High risk | LOCF analysis employed. |
| Intervention clearly specified? | Low risk | Intervention clearly described. |
| Outcomes clearly specified? | Low risk | Outcomes clearly specified, including prospective adverse events recording with Udvalg for Kliniske Undersogelser |
| Interpretation based on results? | High risk | No, due to high attrition and use of LOCF approach for missing data |
LOCF: last observation carried forward
| Domain | Authors' judgement | Support for judgement |
|---|---|---|
| How did allocation occur? Was there concealment of allocation? | High risk | All participants received active therapy with nefazodone. No concealment of allocation |
| Blinding? (participants) | High risk | Open‐label |
| Follow‐up equal and complete? | High risk | 33% attrition |
| Baseline comparability of groups? | Unclear | Only 1 group |
| Intention‐to‐treat analysis | High risk | No intention‐to‐treat analysis employed. |
| Intervention clearly specified? | Low risk | Intervention clearly described. |
| Outcomes clearly specified? | High risk | For adverse events a questionnaire was used (no details about the questionnaire). |
| Interpretation based on results? | High risk | Adverse events are reported vaguely without presentation of absolute numbers. |
Measures of treatment effect
We used the extracted data from the original studies to construct 2 x 2 tables (e.g. clinical response versus no response for antidepressant versus comparator). Where multiple studies allowed for pooling, we calculated the risk ratio (RR) with 95% confidence intervals (CI) for each outcome. We planned to calculate the number needed to treat for an additional beneficial outcome (NNTB) and risk difference (RD). In addition, we planned to pool continuous data using the mean difference (MD) or standardised mean difference (SMD).
Unit of analysis issues
For any included trials with multiple treatment groups (e.g. differing doses of one SGA versus placebo or multiple SGAs versus placebo), we would include the data for the treatment arms and halve the data from the placebo arm, or collapse the data for different doses into one group where this was considered to be clinically appropriate (Hansen 2009). We planned to include data from cluster‐randomised studies and from the first period of cross‐over studies.
Dealing with missing data
We used an intention‐to‐treat analysis where data were missing from participants who dropped out of trials before completion, assuming in such cases that participants did not achieve a clinical response or remission. We planned that where data regarding an assessed outcome were not reported, we would contact authors of publications or pharmaceutical companies to obtain the missing results, but this was not necessary. We have reported the proportion of participants for whom no outcome data were obtained (because of attrition) in the 'Risk of bias' assessment of each trial, and considered the potential impact of the missing data in our interpretation of the results.
Assessment of heterogeneity
We used the Cochran Chi2 test (Q‐test) to assess heterogeneity, considering a P value less than 0.10 as statistically significant. We used the I2 statistic to estimate the degree of heterogeneity, which describes the percentage of total variation across studies that results from heterogeneity rather than chance. We interpreted the importance of any heterogeneity in terms of its magnitude and the direction of effects. We did not consider thresholds, instead adopting the overlapping bands suggested in the Cochrane Handbook. For example, we considered an I2 of:
-
0% to 40% as probably not important;
-
30% to 60% as representing moderate heterogeneity;
-
50% to 90% as substantial heterogeneity;
-
75% to 100% as considerable heterogeneity (Higgins 2020).
Assessment of reporting biases
Had we found more than 10 studies, we would have undertaken an analysis of a funnel plot, which is a graph used to detect publication bias. We wanted to know whether the largest studies were near the average with small studies spread on both sides of the average. Variations from this assumption can indicate the existence of publication bias, but asymmetry may not necessarily be caused by publication bias.
Data synthesis
We analysed data using Review Manager 5 (Review Manager 2020). We pooled data for meta‐analysis where the participant groups were similar, and the studies assessed the same treatments with the same comparator and had similar definitions of outcome measures over a similar duration of treatment. We used a fixed‐effect model because we expected studies to be very similar. Studies reporting dichotomous data were weighted using the Mantel‐Haenszel method. We rated the strength of the evidence based on the system developed by the GRADE Working Group (Guyatt 2011).
We performed a narrative analysis of data on adverse events comparing crude rates. We planned to conduct quantitative analysis of the rate of adverse events only if we located a sufficient number of prospective observational studies or randomised trials that contained data on adverse events suitable for pooling.
Subgroup analysis and investigation of heterogeneity
We planned to perform subgroup analyses of SSRIs and SNRIs, but this was not possible due to the limited number of identified studies.
Sensitivity analysis
We performed sensitivity analysis using a random‐effects model to see if this would change the pooled results. We planned to conduct additional sensitivity analyses excluding small studies, studies with a high risk of bias, and studies published in abstract form; however, due to the limited number of trials available it was not possible to perform these analyses.
Summary of findings and assessment of the certainty of the evidence
Two review authors (BNS, KT) assessed the certainty of evidence using the GRADE approach, which considers risk of bias, inconsistency, indirectness, imprecision, and publication bias for each outcome. Evidence from RCTs starts at a level of high certainty. Concerns about any of the aforementioned domains would result in downgrading of the evidence by one or two levels; explanations for our decisions would be provided in the 'Summary of findings' tables. For example, we would downgrade one level for imprecision if the 95% CI included both a beneficial or non‐beneficial effect. We assessed the certainty of the evidence as high, moderate, low, or very low according to the GRADE approach (Guyatt 2011). We created two 'Summary of findings' tables, one for the comparison SGAs versus placebo (summary of findings Table 1), and one for SGAs versus light therapy (summary of findings Table 2).
Results
Description of studies
Results of the search
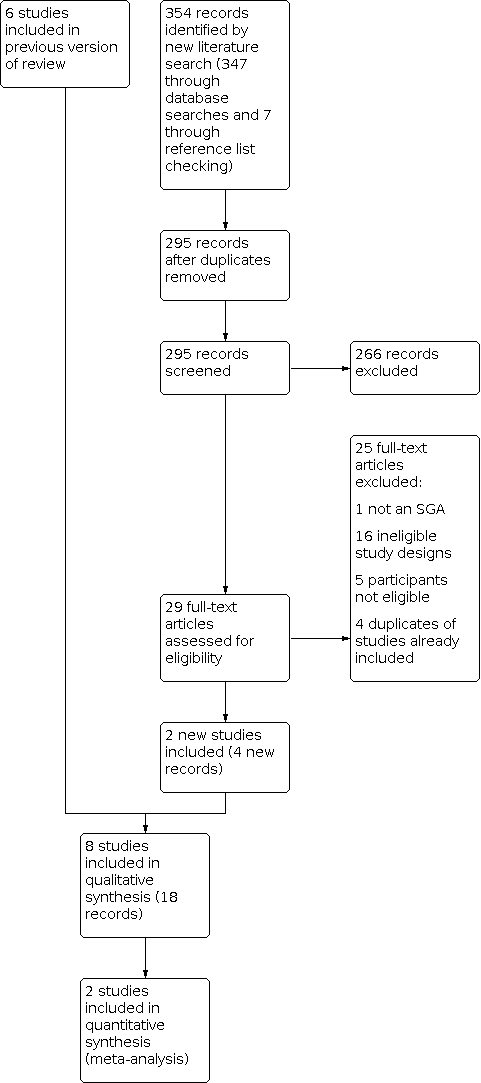
We conducted searches for efficacy and for adverse events separately. The 2020 update search retrieved 168 records for efficacy and 179 records for adverse events. After additional de‐duplication in Covidence, 295 records remained for screening. We considered 29 citations to be relevant after title and abstract screening. We obtained all 29 full‐text publications, of which 25 were excluded for the following reasons: ineligible study design (15 articles), ineligible population (5 articles), wrong intervention (1 article), wrong outcomes (1 article), and duplicates of records already included in the original version of this review (3 articles). For detailed information on the results of the search of the original review, see Thaler 2011. Finally, we included three RCTs (five publications) that had already been included in the original version of this review (Lam 1995; Lam 2006; Ruhrmann 1998), and five observational studies providing additional information on adverse events (eight publications) (Dilsaver 1992; Pjrek 2007; Pjrek 2008; Pjrek 2009; Shen 2005) (see Figure 1). Dilsaver 1992 and Shen 2005 were newly identified in this update.

Study flow diagram.
Included studies
Randomised controlled trials
We included three RCTs of an SGA versus placebo or light therapy for SAD (Lam 1995; Lam 2006; Ruhrmann 1998). The three trials included a total of 204 participants and provided evidence on two comparisons:
-
fluoxetine versus placebo (68 participants) (Lam 1995);
-
fluoxetine versus light therapy (136 participants) (Lam 2006; Ruhrmann 1998).
The trials had a treatment duration of five to eight weeks, and all trials incorporated an initial placebo wash‐out period. Two trials were sponsored by pharmaceutical companies (Lam 1995; Ruhrmann 1998), and one trial was funded by the Canadian Institute of Health Research (Lam 2006).
Trials were generally small (40 to 96 participants) and recruited participants in Canada and Germany. All participants met DSM‐III‐R (Diagnostic and Statistical Manual of Mental Disorders, Third Edition, Revised) or DSM‐IV criteria for depression with a seasonal pattern. Trials typically had more females than males (66% to 78% females), and the average age ranged from 39 to 41 years.
All SGAs were prescribed orally and taken at recommended doses. Light therapy was at 3000 lux or 10,000 lux.
All trials provided data on the HAM‐D 17‐item or 21‐item, with the supplementary seven‐ or eight‐item subscale for SAD (SIGH‐SAD or SUPP). One trial provided quality of life data (Lam 2006).
Non‐randomised studies
We also included five prospective, single‐arm, open‐label observational studies of bupropion, escitalopram, duloxetine, nefazodone, and reboxetine for data on adverse events. These studies included between 9 and 26 participants and recruited participants with a DSM‐III‐R or DSM‐IV‐TR (Diagnostic and Statistical Manual of Mental Disorders, Fourth Edition, Text Revision) diagnosis of SAD at the Medical University of Vienna, Austria, in the USA, and in Canada. The studies lasted five (Dilsaver 1992), six (Pjrek 2009), or eight weeks (Pjrek 2007; Pjrek 2008; Shen 2005). About 70% to 100% of participants were female, and the average age ranged from 34 to 42 years. Adverse events were recorded weekly or bi‐weekly using the Udvalg for Kliniske Undersogelser (UKU) Side Effect Rating Scale (Pjrek 2007; Pjrek 2008; Pjrek 2009), or collected with a self‐reported questionnaire (Shen 2005), or unsystematically assessed without specifying the exact method of assessment (Dilsaver 1992).
For further details on the included studies, see Characteristics of included studies.
Excluded studies
Overall, we excluded 33 studies on full‐text level in the original review, and 25 in this update. In the following section we provide detailed exclusion reasons only for those records that a reader might plausibly expect to see amongst the included studies.
We excluded three studies where participants were randomised to bupropion or placebo for the prevention of SAD because the population did not meet our inclusion criteria (GlaxoSmithKline 2003; GlaxoSmithKline 2003a; GlaxoSmithKline 2004), that is the participants did not have symptoms of SAD at the time of enrolment.
We excluded two studies because the population did not meet our inclusion criteria (Moscovitch 2004; Seo 2013). One study was reported in a journal article and two conference abstracts. The study was a multicentre, eight‐week, randomised trial of sertraline versus placebo in 187 participants with a DSM‐III‐R diagnosis of major depression or bipolar disorder with a seasonal pattern, which did not meet our inclusion criteria (Moscovitch 2004). The second trial assessed the effect of bupropion hydrochloride extended‐release in people with major depressive disorder with atypical features not specifically in people with SAD (Seo 2013).
Finally, a six‐week study of 183 participants with major depression randomised to 20 to 40 mg/day of fluoxetine or 300 to 450 mg/day of moclobemide presented separate results for the 34 SAD participants included in the trial (Partonen 1996). We excluded this study because the comparator was moclobemide (our eligibility criteria specified we would only include comparisons with other SGAs, light therapy, psychotherapy, or placebo).
For further information regarding the excluded studies, see Characteristics of excluded studies.
Ongoing studies
We did not identify any ongoing studies.
Risk of bias in included studies
Whilst one well‐conducted and well‐reported trial had an overall low risk of bias (Lam 2006), overall the risk of bias in the included RCTs was high. The major source of bias was incomplete outcome data (high overall or differential attrition). The risk of bias in the non‐randomised studies (assessed using the Cochrane 'Risk of bias' tool and the Deeks 2003 criteria) was high, primarily due to small sample size, lack of blinding, and high attrition. See Characteristics of included studies for further details on the risk of bias of the included studies, and Figure 2 and Figure 3 for an overview of the risk of bias.

Risk of bias graph: review authors' judgements about each risk of bias item presented as percentages across all included studies.

Risk of bias summary: review authors' judgements about each risk of bias item for each included study.
In the following section we describe the risk of bias for the three included RCTs. Details on risk of bias for the non‐randomised studies are provided in Other potential sources of bias.
Allocation
One trial described computer‐generated randomisation techniques and was assessed as at low risk of bias for random sequence generation (Lam 2006). Otherwise, the method of random sequence generation was not described. Similarly, an adequate method of allocation concealment (using opaque envelopes) was reported in only one trial (Lam 2006), which was assessed as at low risk of bias.
Blinding
All three trials were described as 'double‐blind'. In the two trials that compared an SGA with light therapy, the authors went to great lengths to maintain the blinding of participants in the placebo light‐therapy treatment by disguising the dim light control or by informing participants that the purpose of the trial was to determine the appropriate wavelength of light (Lam 2006; Ruhrmann 1998); furthermore, the blinding of raters (assessors) was clearly described. We assessed these two trials as at low risk of performance and detection bias.
Incomplete outcome data
In one trial of fluoxetine versus light therapy, there was a high rate of differential attrition: 20% in the bright‐light group compared with 5% in the fluoxetine group (Ruhrmann 1998). We assessed this trial as at high risk of attrition bias.
Selective reporting
None of the trials had a protocol available; however, all trials provided detailed reporting of the results as described in the respective methods sections.
Other potential sources of bias
All five observational studies were conducted prospectively (Dilsaver 1992; Pjrek 2007; Pjrek 2008; Pjrek 2009; Shen 2005). Nonetheless, the authors did not report how the allocation to the particular SGA was decided. All five studies were open‐label, and no attempt was made to blind participants, personnel, or outcome assessors. The interventions and outcomes were clearly described in all studies, and the evaluation in the published articles was based on the results, except for in two studies (Dilsaver 1992; Shen 2005): Dilsaver 1992 did not specify how adverse events were defined or assessed, and Shen 2005 did not report results on adverse events numerically. All five studies were small (12 to 26 participants), and four suffered high attrition: 23% (Pjrek 2008), 27% (Pjrek 2009), 33% (Shen 2005), and 33% (Dilsaver 1992). Overall, the high attrition and small study size resulted in a judgement of high risk of other bias for these studies. The analysis of the risk of bias of the non‐randomised studies is presented in tabular format in Table 1, Table 2, Table 3, Table 4, and Table 5.
Effects of interventions
See: Summary of findings 1 Fluoxetine compared with placebo for seasonal affective disorder; Summary of findings 2 Fluoxetine compared with light therapy for seasonal affective disorder
In this section we present the efficacy and adverse event results for our two main comparisons: SGAs versus placebo and SGAs versus light therapy. We also present a narrative summary of adverse events data for SGAs.
Fluoxetine versus placebo
Primary outcome
1.1 Fifty per cent improvement on the Hamilton Depression Scale (HAM‐D) combined with the eight‐item supplementary scale for seasonal affective disorder (Structured Interview Guide for the Hamilton Depression Rating Scale ‐ Seasonal Affective Disorder Version (SIGH‐SAD))
One five‐week trial of 68 participants randomised participants to 20 mg/day of fluoxetine or placebo (Lam 1995). The risk ratio for clinical response was 1.62 (95% confidence interval (CI) 0.92 to 2.83) (Analysis 1.1). We rated the certainty of evidence as very low.
1.2 Fifty per cent improvement on the HAM‐D
No data available.
Secondary outcomes
1.3 Clinical Global Impression – Improvement (CGI‐I) score of 1 or 2 (much improved or very much improved)
No data available.
1.4 Improvement of quality of life (QOL) as measured by a validated QOL tool
No data available.
1.5 Remission, as defined by the study authors
No data available.
1.6 Speed of onset of response
No data available.
1.7 Occurrence of adverse events
Overall, 35 of 36 participants in the fluoxetine group suffered an adverse event, compared with 29 out of 32 in the placebo group. This corresponds to a risk ratio of 1.07 (95% CI 0.95 to 1.21) (Analysis 1.2). We rated the certainty of evidence as very low. The authors reported no statistically significant differences between groups for any specific adverse event such as headache, insomnia, and dyspepsia, but did not report the exact number of participants in each arm that experienced these adverse events. Adverse events are presented in Table 6.
| Study ID | Lam 2006 | Lam 1995 | Dilsaver 1992 | Pjrek 2007 | Pjrek 2008 | Pjrek 2009 | Shen 2005 | ||
|---|---|---|---|---|---|---|---|---|---|
| Study design | RCT | RCT | Open‐label observational study | Open‐label observational study | Open‐label observational study | Open‐label observational study | Open‐label observational study | ||
| SGA | Fluoxetine | Light therapy | Fluoxetine | Placebo | Bupoprion | Escitalopram | Duloxetine | Reboxetine | Nefazodone |
| Number of participants (N) | N = 48 | N = 48 | N = 36 | N = 32 | N = 15 | N = 20 | N = 26 | N = 15 | N = 9 |
| Overall AEs (%) | 75 | 77 | 97 | 91 | 0 | 55 | 100 | ||
| Withdrawal due to AEs (%) | 25 | 23 | 6 | 3 | 0 | 15.4 | 13.3 | ||
| Gastrointestinal | |||||||||
| Abdominal pain (%) | 8.3 | 6.3 | |||||||
| Nausea (%) | 10.4 | 4.2 | 40 | 53.8 | 20 | ||||
| Diarrhoea (%) | 10.4 | 4.2 | 5 | 23.1 | 0.0 | ||||
| Constipation (%) | 6.3 | 8.3 | 5 | 11.5 | 26.7 | ||||
| Decreased appetite (%) | 14.6 | 14.6 | 5 | 6.7 | |||||
| Increased appetite (%) | 14.6 | 8.3 | 3.8 | ||||||
| Weight loss (%) | 6.3 | 2.1 | 3.8 | ||||||
| Central nervous system | |||||||||
| Anxiety (%) | 25.0 | 12.5 | |||||||
| Nervousness (%) | 10.4 | 12.5 | |||||||
| Agitation (%) | 12.5 | 0 | |||||||
| Dizziness (%) | 5 | 0.0 | |||||||
| Tremor (%) | 6.3 | 2.1 | 3.8 | 33.3 | |||||
| Irritability (%) | 8.3 | 4.2 | |||||||
| Sleepiness (%) | 12.5 | 8.3 | 3.8 | 26.7 | |||||
| Increased sleep (%) | 18.8 | 12.5 | 6.7 | ||||||
| Decreased sleep (%) | 20.8 | 22.9 | |||||||
| Sleep disturbance (%) | 29.2 | 2.1 | 7.7 | 44.4 | |||||
| Headache (%) | 10.4 | 16.7 | 5 | 7.7 | 13.3 | 0 | |||
| Paraesthesia (%) | 20.0 | ||||||||
| Sexual dysfunction | |||||||||
| Decreased sex drive (%) | 16.7 | 14.6 | 20 | 0 | |||||
| Male erection problems (%) | 6.3 | 4.7 | |||||||
| Female delayed orgasm (%) | 6.3 | 0 | |||||||
| Other | |||||||||
| Feeling faint (%) | 0 | 6.3 | |||||||
| Palpitations (%) | 10.4 | 0 | 3.8 | 60.0 | |||||
| Sweating (%) | 10.4 | 6.3 | 11.5 | 73.3 | |||||
| Flushing (%) | 4.2 | 6.3 | |||||||
| Muscle pain (%) | 12.5 | 12.5 | |||||||
| Weakness/fatigue (%) | 16.7 | 16.5 | |||||||
| Rash (%) | 6.3 | 0 | |||||||
| Dry mouth (%) | 14.6 | 18.8 | 11.5 | 86.7 | 0 | ||||
| Hypersalivation (%) | 6.7 | ||||||||
| Dry eyes (%) | 6.7 | ||||||||
| Urinary retention (%) | 6.7 | ||||||||
| Concentration problems (%) | 3.8 | 0 | |||||||
| Dilated pupils (%) | 3.8 | ||||||||
| Emotional indifference (%) | 3.8 | ||||||||
| Photosensitivity (%) | 3.8 | ||||||||
| Vivid dreams (%) | 3.8 | ||||||||
| Psychomotor agitation (%) | 73.3 | ||||||||
| Orthostatic dysregulation (%) | 60.0 | ||||||||
| Accomodative dysfunction (%) | 26.7 | ||||||||
AE: adverse event; RCT: randomised controlled trial; SGA: second‐generation antidepressant
Results for this comparison and the illustrative comparative risks are presented in summary of findings Table 1.
Fluoxetine versus light therapy
Primary outcome
2.1 Fifty per cent improvement on the Hamilton Depression Scale (HAM‐D) combined with the eight‐item supplementary scale for seasonal affective disorder (Structured Interview Guide for the Hamilton Depression Rating Scale ‐ Seasonal Affective Disorder Version (SIGH‐SAD))
Meta‐analysis of two RCTs (136 participants) showed little to no differences in response and remission between fluoxetine and light therapy. Response was assessed after five, Ruhrmann 1998, or eight weeks, Lam 2006, based on a greater than 50% improvement in the 24‐item SIGH‐SAD tool. The pooled risk ratio of response was 0.98 (95% CI 0.77 to 1.24, low‐certainty evidence) (Analysis 2.1; Figure 4). This corresponds to a response rate of between 66% and 68% for both comparators. Heterogeneity for this result was low (I2 = 0%). Using a random‐effects model (as sensitivity analysis) resulted in the same pooled effect.

Forest plot of comparison: Fluoxetine versus light therapy, outcome: 1.1 Response (> 50% improvement on 24‐item HAM‐D SIGH‐SAD).
2.2 Fifty per cent improvement on the HAM‐D
No data available.
Secondary outcomes
2.3 Clinical Global Impression – Improvement (CGI‐I) score of 1 or 2 (much improved or very much improved)
No data available.
1.4 Improvement of quality of life (QOL) as measured by a validated QOL tool
Data were available for health‐related quality of life from one trial with 96 participants (Lam 2006). The authors found little to no difference in improvement in quality of life between the fluoxetine and light therapy groups on two scales: the 20‐Item Short Form Health Survey (SF‐20) (fluoxetine group = mean change from baseline 9.38 (SD 14.39) versus light group = mean change from baseline 7.82 (standard deviation (SD) 15.49) ) the mean difference of mean changes from baseline was 1.56 (95% CI ‐4.42 to 7.54); and the Quality of Life Enjoyment and Satisfaction Questionnaire (Q‐LES‐Q) (fluoxetine = mean change from baseline 21.77 (SD 17.04) versus light therapy = mean change from baseline 20.56 (SD 13.11)), mean difference of mean changes from baseline was 1.21 (‐4.87 to 7.29). We rated the certainty of evidence as low.
1.5 Remission, as defined by the study authors
Between 46% and 50% of participants in both study arms achieved remission (Ruhrmann 1998, Lam 2006). Heterogeneity for this outcome was high (I2 = 61%), which may be attributed to greater difference in the rate of remission between the two groups in the smaller trial. Presumably this is a result of a very low number of participants in this trial (N = 40). The pooled risk ratio of remission is 0.91 (95% CI 0.64 to 1.30) (Analysis 2.2; Figure 5). We performed sensitivity analysis using a random‐effects model. The pooled result was similar: RR 0.81 (95% CI 0.39, 1.71). We rated the certainty of evidence as very low.

Forest plot of comparison: Fluoxetine versus light therapy, outcome: 1.2 Remission (response plus end score 8 or less).
1.6 Speed of onset of response
No data available.
1.7 Occurrence of adverse events
Overall, similar numbers of participants in the fluoxetine and light therapy groups experienced an adverse event (75% in for fluoxetine versus 77% for light treatment, risk ratio 0.97, 95% CI 0.78 to 1.22, low‐certainty evidence; Lam 2006) (Analysis 2.3). The authors reported the number of cases of specific adverse events in each group, with differences between groups for only three adverse events (agitation, sleep disturbance, and palpitations, all worse with fluoxetine compared to placebo) (Analysis 2.4; Analysis 2.5; Analysis 2.6); however, the effect rate for all adverse events was low, and confidence intervals were very wide. Details on the number of adverse events in each group are provided in Table 6.
Results for this comparison and the illustrative comparative risks are presented in summary of findings Table 2.
3. SGAs versus other SGA
We did not find any eligible study for this comparison.
4. SGAs versus psychotherapy
We did not find any eligible study for this comparison.
Narrative summary of adverse events: bupropion, fluoxetine, escitalopram, duloxetine, nefazodone, reboxetine
We obtained controlled data on adverse events from two RCTs (Lam 1995; Lam 2006), and crude rates of specific adverse events from five observational studies (Dilsaver 1992; Pjrek 2007; Pjrek 2008; Pjrek 2009; Shen 2005), on fluoxetine (Lam 1995; Lam 2006), bupropion (Dilsaver 1992), escitalopram (Pjrek 2007), duloxetine (Pjrek 2008), nefazodone (Shen 2005), and reboxetine (Pjrek 2009). One RCT included for efficacy provided no evidence on adverse events (Ruhrmann 1998). The SGA arms of these studies involved a total of 169 participants; we obtained data regarding adverse events from 249 participants. Quantitative analysis of the comparative rates of adverse events between SGAs was not possible due to a lack of data, therefore a narrative overview of adverse events with crude rates for all of the included SGAs is presented here. It is important to note that the data presented here on adverse events are not robust, and any interpretation of the data needs to be undertaken with caution.
Overall, between 0% and 100% of participants in the SGA groups suffered an adverse event. Between 0% and 25% of participants withdrew from the study because of adverse events. An overview of all adverse events is provided in Table 6. The most common adverse events were: nausea (range 10% to 54%); diarrhoea (range 5% to 23%); sleep disturbance (range 8% to 44%); decreased sex drive (range 15% to 20%); dry mouth (range 11% to 86%); and psychomotor agitation (73% (data for reboxetine only)). Shen 2005 reported numerical results on sleep disturbance (insomnia), and reported generally that the most frequent adverse events at week 4 were headache, difficulty concentrating, dry mouth, and increased thirst without providing specific numbers, and that all had disappeared at eight weeks of study duration.
Discussion
Summary of main results
We aimed to assess the efficacy and safety of SGAs for the treatment of SAD in adults. In particular, we wanted to find and pool randomised trials of SGAs versus placebo to determine if SGAs are efficacious for SAD and to define the adverse events profile compared with placebo. Furthermore, we hoped to locate head‐to‐head studies of SGAs compared with other SGAs or with light therapy or psychotherapy to determine the comparative efficacy of SGAs.
We found evidence on only one SGA, fluoxetine. Based on the results of the single available RCT, it is not clear that fluoxetine is more efficacious than placebo for SAD. The risk ratio (RR) of depression response favours fluoxetine, but the confidence interval includes both a beneficial and no beneficial effect of fluoxetine (RR 1.62, 95% CI 0.92 to 2.83). We assessed the risk of bias for this trial as unclear in most domains, that is random sequence generation, allocation concealment, blinding, and attrition. The certainty of evidence for this effect is very low because the trial has an unclear risk of bias in most domains, and the effect is imprecise. There was an approximately equal occurrence of adverse events in the two groups; however, the reporting of adverse events in this study was poor (only an overall adverse event rate is reported). Future trials should seek to clarify the incidence of specific treatment‐emergent adverse events in participants with SAD receiving fluoxetine versus those receiving placebo. The results of this comparison are presented in summary of findings Table 1.
Similarly, the pooled results from two RCTs of fluoxetine versus light therapy did not demonstrate superior response of either therapy (RR 0.98, 95% CI 0.77 to 1.24). We assessed the certainty of evidence as low, as risk of bias was high in one study, and imprecision was also high because the optimal information size was not achieved. Adverse events data were available from one of the trials, which showed generally similar proportions in both groups. The results of this comparison are presented in summary of findings Table 2.
Overall, adverse events data were sparse, and no comparative analysis of the rates of adverse events between SGAs was possible (data on adverse events are presented in Table 6). Overall, 0 to 25% of participants treated with SGAs for SAD withdrew from the study early due to adverse events (across all studies 24 of 201). Because of the lack of evidence for the safety of SGAs when used for SAD, it may be reasonable to assume that SGAs have a similar adverse events profile when used in people with SAD and those suffering from major depressive disorder. One large systematic review of all SGAs for major depressive disorder provides evidence on the incidence of adverse events (Gartlehner 2008). Overall, 61% of participants in 80 trials reported at least one adverse event. The most common adverse events were constipation, diarrhoea, dizziness, insomnia, nausea, sexual adverse events, and somnolence.
Overall completeness and applicability of evidence
All three RCTs and the five non‐randomised studies included adult participants with moderate depression who met the DSM‐III or DSM‐IV criteria for SAD (depression with a seasonal pattern). The trials were conducted in North America (Canada and the USA) and Europe (Germany and Austria). Standard doses and method of administration of fluoxetine were used throughout. The studies varied between five and eight weeks in duration, which is an adequate time frame in which to see effects on response according to the German Depression Guideline (DGPPN 2015). In order to fully elucidate adverse events, a longer time period would probably have been necessary. The primary outcome of this review, response to treatment, was measured in all included RCTs. Overall, the available evidence is too weak to make robust conclusions. Furthermore, no head‐to‐head evidence on the comparative effectiveness of SGAs or a comparison with psychotherapy was available. Lastly, the data were too sparse to conduct any comparative quantitative analyses of adverse events.
Certainty of the evidence
For the comparison of fluoxetine with placebo, we graded the certainty of evidence for the outcomes treatment response and adverse events as very low. The certainty of the evidence was limited by the quality of the study because all domains but one were rated as unclear risk of bias). It was also limited by serious imprecision due to the small sample size and broad confidence intervals. No data were reported in the identified trial for our secondary outcomes (for details see summary of findings Table 1).
For the second comparison, we included two RCTs of fluoxetine versus light therapy with a total of 136 participants. We rated the certainty of evidence as low for the outcome treatment response, due to a high risk of bias and imprecision (small sample size) in one study. For remission, we rated the certainty of evidence as very low. We rated down for inconsistency between the two pooled studies, imprecision, and because one study had a high risk of bias. For quality of life, we also assessed the certainty of evidence as very low. We rated down because of imprecision and indirectness and because no relative effect was calculated, so no direct comparison was possible. For adverse events, the certainty of the evidence was low because of very serious imprecision. No data were reported for our other secondary outcomes (for details see summary of findings Table 2).
The non‐randomised studies included for the purpose of evaluating adverse event outcomes suffered high attrition and did not blind participants or outcome assessors. Our confidence in the results presented from these studies was very low because of their observational design, high risk of bias, and small study size (resulting in very serious imprecision).
Potential biases in the review process
We conducted extensive searches. Despite this, publication bias remains a threat for systematic reviews, and we cannot rule out the possibility that we may have missed some trials of SGAs conducted in participants with SAD.
We focused on SAD patients in the context of MDD and excluded studies with SAD patients with bipolar disorder. Therefore we also excluded the study by Moscovitch et al. (Moscovitch 2004) although the proportion of SAD patients with bipolar disorder was only 10%. The results are in agreement with our results for the comparison of SGA vs. placebo. Moscovitch et al. compared sertraline with placebo and also showed no statistical significant difference in response with 55.9% of participants achieving response in the sertraline group and 50% achieving response under placebo. A future update of this review might consider broadening the inclusion criteria to also include studies with a small proportion of bipolar SAD patients.
Agreements and disagreements with other studies or reviews
The first version of this review (Thaler 2011) came to the same conclusion as this update. A recent Health Technology Assessment also concluded that SGAs and light therapy show similar treatment effects (Nussbaumer‐Streit 2020).
Study flow diagram.

Risk of bias graph: review authors' judgements about each risk of bias item presented as percentages across all included studies.

Risk of bias summary: review authors' judgements about each risk of bias item for each included study.

Forest plot of comparison: Fluoxetine versus light therapy, outcome: 1.1 Response (> 50% improvement on 24‐item HAM‐D SIGH‐SAD).

Forest plot of comparison: Fluoxetine versus light therapy, outcome: 1.2 Remission (response plus end score 8 or less).

Comparison 1: Fluoxetine versus placebo, Outcome 1: Response (> 50% improvement on 29‐item HAM‐D SIGH‐SAD)

Comparison 1: Fluoxetine versus placebo, Outcome 2: Harm: overall adverse events

Comparison 2: Fluoxetine versus light therapy, Outcome 1: Response (> 50% improvement on 24‐item HAM‐D SIGH‐SAD)

Comparison 2: Fluoxetine versus light therapy, Outcome 2: Remission (response plus end score 8 or less)

Comparison 2: Fluoxetine versus light therapy, Outcome 3: Harm: at least 1 treatment‐emergent adverse event

Comparison 2: Fluoxetine versus light therapy, Outcome 4: Harm: agitation

Comparison 2: Fluoxetine versus light therapy, Outcome 5: Harm: sleep disturbance

Comparison 2: Fluoxetine versus light therapy, Outcome 6: Harm: palpitations
| Fluoxetine compared with placebo for seasonal affective disorder | |||||
| Patient or population: adults with seasonal affective disorder Settings: outpatients Intervention: fluoxetine Comparison: placebo | |||||
| Outcomes | Illustrative comparative risks* (95% CI) | Relative effect | No. of participants | Certainty of the evidence | |
|---|---|---|---|---|---|
| Assumed risk | Corresponding risk | ||||
| Placebo | Fluoxetine | ||||
| Response (> 50% improvement on 29‐item HAM‐D SIGH‐SAD) 5 weeks | 34 per 100
| 56 per 100
| RR 1.62 (0.92 to 2.83) | 68 | ⊕⊝⊝⊝ |
| Clinical Global Impression – Improvement score | No evidence identified. | ||||
| Quality of life | No evidence identified. | ||||
| Remission | No evidence identified. | ||||
| Speed of onset of response | No evidence identified. | ||||
| Overall adverse events 5 weeks | 91 per 100
| 97 per 100
| RR 1.07 (0.95 to 1.21) | 68 | ⊕⊝⊝⊝ |
| *The basis for the assumed risk (e.g. the median control group risk across studies) is the rate in the placebo group. The corresponding risk (and its 95% CI) is based on the assumed risk in the fluoxetine group and the relative effect of the intervention (and its 95% CI). CI: confidence interval; HAM‐D SIGH‐SAD: Structured Interview Guide for the Hamilton Depression Rating Scale ‐ Seasonal Affective Disorder Version; RR: risk ratio | |||||
| GRADE Working Group grades of evidence High certainty: We are very confident that the true effect lies close to that of the estimate of the effect Moderate certainty: We are moderately confident in the effect estimate: The true effect is likely to be close to the estimate of the effect, but there is a possibility that it is substantially different Low certainty: Our confidence in the effect estimate is limited: The true effect may be substantially different from the estimate of the effect Very low certainty: We have very little confidence in the effect estimate: The true effect is likely to be substantially different from the estimate of effect | |||||
| 1Downgraded by one level because the trial has an unclear risk of bias in all but one 'Risk of bias' domains, and two levels for serious imprecision due to the small number of participants in the trial and because the confidence interval includes both benefit and no effect. | |||||
| Fluoxetine compared with light therapy for seasonal affective disorder | ||||||
| Patient or population: adults with seasonal affective disorder Settings: outpatients Intervention: fluoxetine Comparison: light therapy | ||||||
| Outcomes | Illustrative comparative risks* (95% CI) | Relative effect | No. of participants | Certainty of the evidence | Comments | |
|---|---|---|---|---|---|---|
| Assumed risk | Corresponding risk | |||||
| Light therapy | Fluoxetine | |||||
| Response (> 50% improvement on 24‐item HAM‐D SIGH‐SAD) 5 to 8 weeks | 68 per 100 | 67 per 100 | RR 0.98 (0.77 to 1.24) | 136 | ⊕⊕⊝⊝ | |
| Clinical Global Impression – Improvement score | No evidence identified. | |||||
| Quality of life (SF‐20 and Q‐LES‐Q) 8 weeks | SF‐20: The mean change from baseline was 7.82 Q‐LES‐Q:The mean change from baseline was 20.26 | SF‐20: The mean change from baseline was 1.56 higher (4.2 lower to 7.32 higher) Q‐LES‐Q:The mean change from baseline was 1.21 higher (4.87 lower to 7.29 higher) | ‐ | 96 (1 study, Lam 2006) | ⊕⊕⊝⊝ | mean difference of change from baseline self calculated by review authors |
| Remission (response plus end score 8 or less) 5 to 8 weeks | 68 per 100 | 55 per 100 | RR 0.81 (0.39 to 1.71) | 136 | ⊕⊝⊝⊝ | |
| Time to onset of response | No evidence identified | |||||
| Adverse events (at least 1 treatment‐emergent adverse event) 8 weeks | 77 per 100 | 75 per 100 | RR 0.97 (0.78 to 1.22) | 96 (1 study, Lam 2006) | ⊕⊕⊝⊝ | |
| *The basis for the assumed risk (e.g. the median control group risk across studies) is the response rate in the light therapy groups in the 2 included trials. The corresponding risk (and its 95% CI) is based on the assumed risk in the fluoxetine group and the relative effect of the intervention (and its 95% CI). CI: confidence interval; HAM‐D SIGH‐SAD: Structured Interview Guide for the Hamilton Depression Rating Scale ‐ Seasonal Affective Disorder Version; NR: not reported; Q‐LES‐Q: Quality of Life Enjoyment and Satisfaction Questionnaire; RR: risk ratio; SF‐20: 20‐Item Short Form Health Survey | ||||||
| GRADE Working Group grades of evidence High certainty: We are very confident that the true effect lies close to that of the estimate of the effect Moderate certainty: We are moderately confident in the effect estimate: The true effect is likely to be close to the estimate of the effect, but there is a possibility that it is substantially different Low certainty: Our confidence in the effect estimate is limited: The true effect may be substantially different from the estimate of the effect Very low certainty: We have very little confidence in the effect estimate: The true effect is likely to be substantially different from the estimate of effect | ||||||
| 1Downgraded by one level because the risk of bias was high in one study, and one level for imprecision because the optimal information size was not reached (too few participants). | ||||||
| Domain | Authors' judgement | Support for judgement |
|---|---|---|
| How did allocation occur? Was there concealment of allocation? | High risk | All participants received active therapy with bupropion. No concealment of allocation |
| Blinding? (participants) | High risk | Open‐label |
| Follow‐up equal and complete? | High risk | 33% attrition |
| Baseline comparability of groups? | Unclear | Only 1 group |
| Intention‐to‐treat analysis | High risk | Intention‐to‐treat analysis not employed. |
| Intervention clearly specified? | Low risk | Intervention clearly described. |
| Outcomes clearly specified? | High risk | Outcome of interest (adverse events) not clearly specified. |
| Interpretation based on results? | Low risk | Yes |
| Domain | Authors' judgement | Support for judgement |
|---|---|---|
| How did allocation occur? Was there concealment of allocation? | High risk | All participants received active therapy with escitalopram. No concealment of allocation |
| Blinding? (participants) | High risk | Open‐label |
| Follow‐up equal and complete? | Low risk | 10% attrition |
| Baseline comparability of groups? | Unclear | Only 1 group |
| Intention‐to‐treat analysis | Low risk | Intention‐to‐treat analysis employed. |
| Intervention clearly specified? | Low risk | Intervention clearly described. |
| Outcomes clearly specified? | Low risk | Outcomes clearly specified, including prospective adverse events recording with Udvalg for Kliniske Undersogelser |
| Interpretation based on results? | Low risk | Yes |
| Domain | Authors' judgement | Support for judgement |
|---|---|---|
| How did allocation occur? Was there concealment of allocation? | High risk | All participants received active therapy with duloxetine. No concealment of allocation |
| Blinding? (participants) | High risk | Open‐label |
| Follow‐up equal and complete? | High risk | 23% attrition |
| Baseline comparability of groups? | Unclear | Only 1 group |
| Intention‐to‐treat analysis | High risk | LOCF analysis employed. |
| Intervention clearly specified? | Low risk | Intervention clearly described. |
| Outcomes clearly specified? | Low risk | Outcomes clearly specified, including prospective adverse events recording with Udvalg for Kliniske Undersogelser |
| Interpretation based on results? | High risk | No, due to high attrition and use of LOCF approach for missing data |
| LOCF: last observation carried forward | ||
| Domain | Authors' judgement | Support for judgement |
|---|---|---|
| How did allocation occur? Was there concealment of allocation? | High risk | All participants received active therapy with reboxetine. No concealment of allocation |
| Blinding? (participants) | High risk | Open‐label |
| Follow‐up equal and complete? | High risk | 27% attrition |
| Baseline comparability of groups? | Unclear | Only 1 group |
| Intention‐to‐treat analysis | High risk | LOCF analysis employed. |
| Intervention clearly specified? | Low risk | Intervention clearly described. |
| Outcomes clearly specified? | Low risk | Outcomes clearly specified, including prospective adverse events recording with Udvalg for Kliniske Undersogelser |
| Interpretation based on results? | High risk | No, due to high attrition and use of LOCF approach for missing data |
| LOCF: last observation carried forward | ||
| Domain | Authors' judgement | Support for judgement |
|---|---|---|
| How did allocation occur? Was there concealment of allocation? | High risk | All participants received active therapy with nefazodone. No concealment of allocation |
| Blinding? (participants) | High risk | Open‐label |
| Follow‐up equal and complete? | High risk | 33% attrition |
| Baseline comparability of groups? | Unclear | Only 1 group |
| Intention‐to‐treat analysis | High risk | No intention‐to‐treat analysis employed. |
| Intervention clearly specified? | Low risk | Intervention clearly described. |
| Outcomes clearly specified? | High risk | For adverse events a questionnaire was used (no details about the questionnaire). |
| Interpretation based on results? | High risk | Adverse events are reported vaguely without presentation of absolute numbers. |
| Study ID | Lam 2006 | Lam 1995 | Dilsaver 1992 | Pjrek 2007 | Pjrek 2008 | Pjrek 2009 | Shen 2005 | ||
|---|---|---|---|---|---|---|---|---|---|
| Study design | RCT | RCT | Open‐label observational study | Open‐label observational study | Open‐label observational study | Open‐label observational study | Open‐label observational study | ||
| SGA | Fluoxetine | Light therapy | Fluoxetine | Placebo | Bupoprion | Escitalopram | Duloxetine | Reboxetine | Nefazodone |
| Number of participants (N) | N = 48 | N = 48 | N = 36 | N = 32 | N = 15 | N = 20 | N = 26 | N = 15 | N = 9 |
| Overall AEs (%) | 75 | 77 | 97 | 91 | 0 | 55 | 100 | ||
| Withdrawal due to AEs (%) | 25 | 23 | 6 | 3 | 0 | 15.4 | 13.3 | ||
| Gastrointestinal | |||||||||
| Abdominal pain (%) | 8.3 | 6.3 | |||||||
| Nausea (%) | 10.4 | 4.2 | 40 | 53.8 | 20 | ||||
| Diarrhoea (%) | 10.4 | 4.2 | 5 | 23.1 | 0.0 | ||||
| Constipation (%) | 6.3 | 8.3 | 5 | 11.5 | 26.7 | ||||
| Decreased appetite (%) | 14.6 | 14.6 | 5 | 6.7 | |||||
| Increased appetite (%) | 14.6 | 8.3 | 3.8 | ||||||
| Weight loss (%) | 6.3 | 2.1 | 3.8 | ||||||
| Central nervous system | |||||||||
| Anxiety (%) | 25.0 | 12.5 | |||||||
| Nervousness (%) | 10.4 | 12.5 | |||||||
| Agitation (%) | 12.5 | 0 | |||||||
| Dizziness (%) | 5 | 0.0 | |||||||
| Tremor (%) | 6.3 | 2.1 | 3.8 | 33.3 | |||||
| Irritability (%) | 8.3 | 4.2 | |||||||
| Sleepiness (%) | 12.5 | 8.3 | 3.8 | 26.7 | |||||
| Increased sleep (%) | 18.8 | 12.5 | 6.7 | ||||||
| Decreased sleep (%) | 20.8 | 22.9 | |||||||
| Sleep disturbance (%) | 29.2 | 2.1 | 7.7 | 44.4 | |||||
| Headache (%) | 10.4 | 16.7 | 5 | 7.7 | 13.3 | 0 | |||
| Paraesthesia (%) | 20.0 | ||||||||
| Sexual dysfunction | |||||||||
| Decreased sex drive (%) | 16.7 | 14.6 | 20 | 0 | |||||
| Male erection problems (%) | 6.3 | 4.7 | |||||||
| Female delayed orgasm (%) | 6.3 | 0 | |||||||
| Other | |||||||||
| Feeling faint (%) | 0 | 6.3 | |||||||
| Palpitations (%) | 10.4 | 0 | 3.8 | 60.0 | |||||
| Sweating (%) | 10.4 | 6.3 | 11.5 | 73.3 | |||||
| Flushing (%) | 4.2 | 6.3 | |||||||
| Muscle pain (%) | 12.5 | 12.5 | |||||||
| Weakness/fatigue (%) | 16.7 | 16.5 | |||||||
| Rash (%) | 6.3 | 0 | |||||||
| Dry mouth (%) | 14.6 | 18.8 | 11.5 | 86.7 | 0 | ||||
| Hypersalivation (%) | 6.7 | ||||||||
| Dry eyes (%) | 6.7 | ||||||||
| Urinary retention (%) | 6.7 | ||||||||
| Concentration problems (%) | 3.8 | 0 | |||||||
| Dilated pupils (%) | 3.8 | ||||||||
| Emotional indifference (%) | 3.8 | ||||||||
| Photosensitivity (%) | 3.8 | ||||||||
| Vivid dreams (%) | 3.8 | ||||||||
| Psychomotor agitation (%) | 73.3 | ||||||||
| Orthostatic dysregulation (%) | 60.0 | ||||||||
| Accomodative dysfunction (%) | 26.7 | ||||||||
| AE: adverse event; RCT: randomised controlled trial; SGA: second‐generation antidepressant | |||||||||
| Outcome or subgroup title | No. of studies | No. of participants | Statistical method | Effect size |
| 1.1 Response (> 50% improvement on 29‐item HAM‐D SIGH‐SAD) Show forest plot | 1 | Risk Ratio (M‐H, Fixed, 95% CI) | Totals not selected | |
| 1.2 Harm: overall adverse events Show forest plot | 1 | Risk Ratio (M‐H, Fixed, 95% CI) | Totals not selected | |
| Outcome or subgroup title | No. of studies | No. of participants | Statistical method | Effect size |
| 2.1 Response (> 50% improvement on 24‐item HAM‐D SIGH‐SAD) Show forest plot | 2 | 136 | Risk Ratio (M‐H, Fixed, 95% CI) | 0.98 [0.77, 1.24] |
| 2.2 Remission (response plus end score 8 or less) Show forest plot | 2 | 136 | Risk Ratio (M‐H, Fixed, 95% CI) | 0.91 [0.64, 1.30] |
| 2.3 Harm: at least 1 treatment‐emergent adverse event Show forest plot | 1 | Risk Ratio (M‐H, Fixed, 95% CI) | Totals not selected | |
| 2.4 Harm: agitation Show forest plot | 1 | Risk Ratio (M‐H, Fixed, 95% CI) | Totals not selected | |
| 2.5 Harm: sleep disturbance Show forest plot | 1 | Odds Ratio (M‐H, Fixed, 95% CI) | Totals not selected | |
| 2.6 Harm: palpitations Show forest plot | 1 | Risk Ratio (M‐H, Fixed, 95% CI) | Totals not selected | |