| 1 Vasomotor symptoms Show forest plot | 7 | 1657 | Std. Mean Difference (Fixed, 95% CI) | ‐0.99 [‐1.10, ‐0.89] |
|
| 1.1 Tibolone 0.625 mg/d | 1 | 158 | Std. Mean Difference (Fixed, 95% CI) | ‐0.05 [‐0.46, 0.36] |
| 1.2 Tibolone 1.25 mg/day | 3 | 414 | Std. Mean Difference (Fixed, 95% CI) | ‐0.83 [‐1.06, ‐0.60] |
| 1.3 Tibolone 2.5 mg/day | 7 | 920 | Std. Mean Difference (Fixed, 95% CI) | ‐1.16 [‐1.30, ‐1.03] |
| 1.4 Tibolone 5 mg/day | 1 | 165 | Std. Mean Difference (Fixed, 95% CI) | ‐0.84 [‐1.25, ‐0.43] |
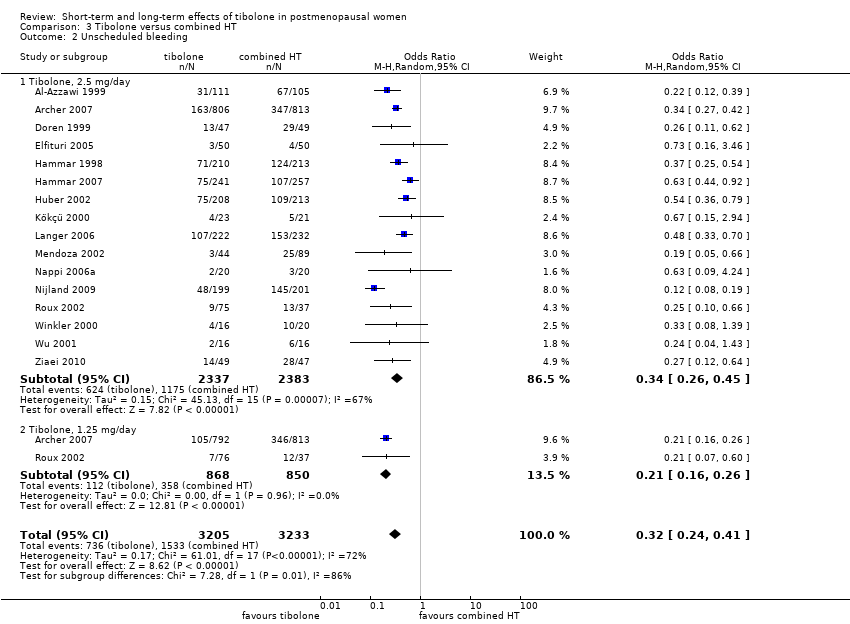
| 2 Unscheduled bleeding Show forest plot | 9 | 7814 | Odds Ratio (M‐H, Random, 95% CI) | 2.79 [2.10, 3.70] |
|
| 2.1 Tibolone, 2.5 mg/day | 8 | 4186 | Odds Ratio (M‐H, Random, 95% CI) | 2.58 [1.89, 3.52] |
| 2.2 Tibolone, 1.25 mg/day | 3 | 3628 | Odds Ratio (M‐H, Random, 95% CI) | 3.63 [2.37, 5.55] |
| 3 Endometrial cancer Show forest plot | 9 | | Odds Ratio (M‐H, Random, 95% CI) | Subtotals only |
|
| 3.1 Tibolone, all doses | 9 | 8504 | Odds Ratio (M‐H, Random, 95% CI) | 2.04 [0.79, 5.24] |
| 4 Breast cancer; women without previous breast cancer Show forest plot | 4 | | Odds Ratio (M‐H, Random, 95% CI) | Subtotals only |
|
| 4.1 Tibolone, all doses | 4 | 5500 | Odds Ratio (M‐H, Random, 95% CI) | 0.52 [0.21, 1.25] |
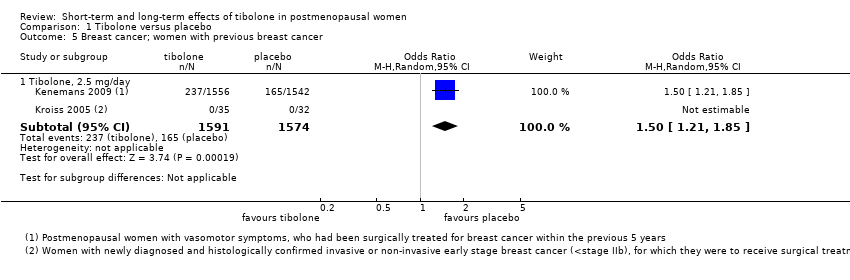
| 5 Breast cancer; women with previous breast cancer Show forest plot | 2 | | Odds Ratio (M‐H, Random, 95% CI) | Subtotals only |
|
| 5.1 Tibolone, 2.5 mg/day | 2 | 3165 | Odds Ratio (M‐H, Random, 95% CI) | 1.50 [1.21, 1.85] |
| 6 Venous thromboembolic events (clinical evaluation) Show forest plot | 5 | 9176 | Odds Ratio (M‐H, Random, 95% CI) | 0.85 [0.37, 1.97] |
|
| 6.1 Tibolone (all doses) | 5 | 9176 | Odds Ratio (M‐H, Random, 95% CI) | 0.85 [0.37, 1.97] |
| 7 Cardiovascular events Show forest plot | 4 | | Odds Ratio (M‐H, Random, 95% CI) | Subtotals only |
|
| 7.1 Tibolone, all doses | 4 | 8401 | Odds Ratio (M‐H, Random, 95% CI) | 1.38 [0.84, 2.27] |
| 8 Cerebrovascular events; women's mean age over 60 years Show forest plot | 4 | | Odds Ratio (M‐H, Random, 95% CI) | Subtotals only |
|
| 8.1 Tibolone (all doses) | 4 | 7930 | Odds Ratio (M‐H, Random, 95% CI) | 1.74 [0.99, 3.04] |
| 9 Mortality from any cause Show forest plot | 4 | 8242 | Odds Ratio (M‐H, Random, 95% CI) | 1.06 [0.79, 1.41] |
|
| 9.1 Tibolone, 2.5 mg/day | 3 | 3736 | Odds Ratio (M‐H, Random, 95% CI) | 0.94 [0.32, 2.73] |
| 9.2 Tibolone, 1.25 mg/day | 1 | 4506 | Odds Ratio (M‐H, Random, 95% CI) | 0.93 [0.54, 1.59] |
| 10 Insomnia Show forest plot | 3 | 3432 | Std. Mean Difference (Fixed, 95% CI) | ‐0.19 [‐0.38, ‐0.00] |
|
| 10.1 Tibolone, 2.5 mg/day | 3 | 3432 | Std. Mean Difference (Fixed, 95% CI) | ‐0.19 [‐0.38, ‐0.00] |
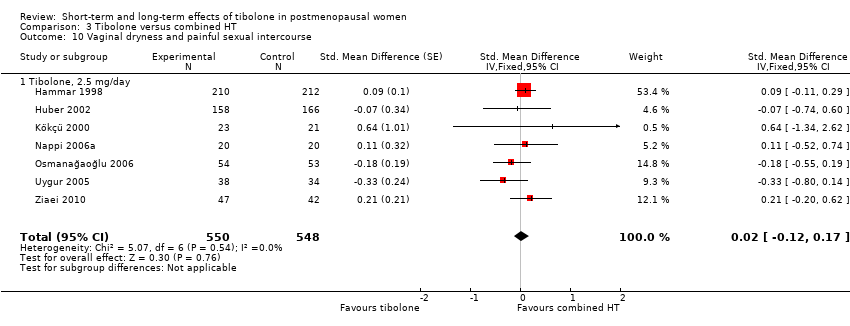
| 11 Vaginal dryness and painful sexual intercourse Show forest plot | 3 | 3348 | Std. Mean Difference (Fixed, 95% CI) | ‐0.66 [‐0.90, ‐0.43] |
|
| 11.1 Tibolone, 1.25mg/day | 1 | 62 | Std. Mean Difference (Fixed, 95% CI) | ‐1.78 [‐2.43, ‐1.13] |
| 11.2 Tibolone, 2.5 mg/day | 3 | 3286 | Std. Mean Difference (Fixed, 95% CI) | ‐0.49 [‐0.75, ‐0.24] |
| 12 Vaginal infections Show forest plot | 2 | 7639 | Odds Ratio (M‐H, Random, 95% CI) | 2.50 [1.24, 5.06] |
|
| 12.1 Tibolone, 2.5 mg/day | 1 | 3133 | Odds Ratio (M‐H, Random, 95% CI) | 1.73 [1.17, 2.55] |
| 12.2 Tibolone, 1.25 mg/day | 1 | 4506 | Odds Ratio (M‐H, Random, 95% CI) | 3.54 [2.61, 4.81] |
| 13 Urinary tract infections Show forest plot | 1 | | Odds Ratio (M‐H, Random, 95% CI) | Subtotals only |
|
| 13.1 Tibolone, 2.5 mg/day | 1 | 3133 | Odds Ratio (M‐H, Random, 95% CI) | 0.70 [0.46, 1.06] |
| 14 Endometrial hyperplasia Show forest plot | 4 | | Odds Ratio (M‐H, Random, 95% CI) | Subtotals only |
|
| 14.1 Tibolone, all doses | 4 | 4518 | Odds Ratio (M‐H, Random, 95% CI) | 1.20 [0.23, 6.25] |
| 15 Sensitivity Analysis ‐ Vasomotor symptoms without trials with high risk of attrition bias Show forest plot | 4 | | Std. Mean Difference (Fixed, 95% CI) | ‐0.61 [‐0.73, ‐0.49] |
|
| 15.1 Tibolone 0.625 mg/day | 1 | | Std. Mean Difference (Fixed, 95% CI) | ‐0.05 [‐0.46, 0.36] |
| 15.2 Tibolone 1.25 mg/day | 2 | | Std. Mean Difference (Fixed, 95% CI) | ‐0.62 [‐0.86, ‐0.38] |
| 15.3 Tibolone 2.5 mg/day | 4 | | Std. Mean Difference (Fixed, 95% CI) | ‐0.65 [‐0.80, ‐0.50] |
| 15.4 Tibolone 5 mg/day | 1 | | Std. Mean Difference (Fixed, 95% CI) | ‐0.84 [‐1.25, ‐0.43] |