Entrenamiento de las habilidades sociales para el Trastorno por déficit de atención e hiperactividad (TDAH) en niños de cinco a 18 años de edad
Resumen
Antecedentes
Trastorno por déficit de atención e hiperactividad (TDAH) en los niños se asocia con hiperactividad e impulsividad, problemas de atención y dificultades con las interacciones sociales. El tratamiento farmacológico puede aliviar los síntomas del TDAH, aunque rara vez resuelve las dificultades con las interacciones sociales. Los niños con TDAH pueden beneficiarse de intervenciones diseñadas para mejorar sus habilidades sociales. Se examinaron los beneficios y los perjuicios del entrenamiento en habilidades sociales con los siguientes resultados: habilidades sociales, competencias emocionales, conducta general, síntomas del TDAH y rendimiento escolar.
Objetivos
Evaluar los efectos del entrenamiento de habilidades sociales en niños y adolescentes con TDAH.
Métodos de búsqueda
En julio de 2018, se realizaron búsquedas en CENTRAL, MEDLINE, Embase, PsycINFO, otras cuatro bases de datos y dos registros de ensayos. También se realizaron búsquedas en los resúmenes de congresos en línea y se estableció contacto con los expertos en el campo para obtener información sobre ensayos clínicos aleatorios no publicados o en curso. No limitamos nuestras búsquedas por idioma, año de publicación, o tipo o estado de publicación, y buscamos la traducción de las secciones relevantes de los artículos en idiomas distintos del inglés.
Criterios de selección
Ensayos clínicos aleatorizados que investigan el entrenamiento en habilidades sociales versus ninguna intervención o control en lista de espera, con o sin tratamiento farmacológico, de ambos grupos de comparación de niños y adolescentes con TDAH.
Obtención y análisis de los datos
La revisión se realizó según el Manual Cochrane para Revisiones Sistemáticas de Intervenciones (Cochrane Handbook for Systematic Reviews of Interventions). Los análisis se realizaron mediante Review Manager 5 y el programa informático Trial Sequental Analysis. Se evaluó el sesgo según los dominios para los errores sistemáticos. La certeza de la evidencia se evaluó mediante los criterios GRADE.
Resultados principales
Se incluyeron 25 ensayos clínicos aleatorizados descritos en 45 informes. Los ensayos incluyeron un total de 2690 participantes de entre cinco y 17 años de edad. En 17 ensayos, a los participantes también se les diagnosticó varias comorbilidades.
Las intervenciones de habilidades sociales se describieron como: 1) entrenamiento en habilidades sociales, 2) terapia cognitivo conductual, 3) terapia conductual multimodal/psicosocial, 4) terapia de habilidades de atención y vida infantil, 5) entrenamiento en habilidades para la vida, 6) el "programa horizonte desafiante", 7) autoinstrucción verbal, 8) entrenamiento meta‐cognitivo, 9) terapia conductual, 10) terapia de habilidades sociales y conductuales, y 11) terapia psicosocial. Las intervenciones de control fueron ninguna intervención o lista de espera.
La duración de las intervenciones osciló entre cinco semanas y dos años. Se consideró que el contenido de las intervenciones en habilidades sociales era comparable y se basaba en un modelo cognitivo‐conductual. La mayoría de los ensayos compararon el entrenamiento de las habilidades sociales del niño y el entrenamiento de los padres más medicación versus medicación sola. Algunas de las intervenciones experimentales también incluyeron consultas con los profesores.
Más de la mitad de los ensayos estuvieron en riesgo de sesgo alto con respecto a la generación de la secuencia de asignación y a la ocultación de la asignación. Ningún ensayo informó sobre el cegamiento de los participantes y el personal. La mayoría de los ensayos no informaron sobre las diferencias entre los grupos en cuanto a la medicación para los trastornos comórbidos. Se utilizaron todos los ensayos elegibles en los metanálisis, pero se redujo la certeza de la evidencia a baja o muy baja.
No se encontró ningún efecto de tratamiento clínicamente relevante de las intervenciones de habilidades sociales en las medidas de resultado primarias: habilidades sociales calificadas por el profesor al final del tratamiento (diferencia de medias estandarizada (DME) 0,11; intervalo de confianza (IC) del 95%: 0,00 a 0,22; 11 ensayos, 1 271 participantes; I2 = 0%; P = 0.05); competencias emocionales calificadas por el profesor al final del tratamiento (DME ‐0,02; IC del 95%: ‐0,72 a 0,68; dos ensayos, 129 participantes; I2 = 74%; p = 0,96); o en la conducta general calificada por el profesor (DME ‐0,06 (valor negativo mejor), IC del 95%: ‐0,19 a 0,06; ocho ensayos, 1002 participantes; I2 = 0%; p = 0,33). El efecto sobre la medida de resultado primaria, habilidades sociales calificadas por el profesor al final del tratamiento, corresponde a una DM de 1,22 puntos en la escala del sistema de calificación de habilidades sociales (SSRS) (IC del 95%: 0,09 a 2,36). La diferencia mínima clínicamente relevante (10%) en el SSRS es de 10,0 puntos (rango de 0 a 102 puntos en el SSRS).
Se encontró evidencia a favor del entrenamiento en habilidades sociales sobre los síntomas centrales del TDAH clasificados por el profesor al final del tratamiento en todos los ensayos elegibles (DME ‐0,26; IC del 95%: ‐0,47 a ‐0,05; 14 ensayos, 1 379 participantes; I2 = 69%; P = 0,02), pero el hallazgo es cuestionable debido a la falta de apoyo de los análisis de sensibilidad, el alto riesgo de sesgo, la falta de significación clínica, la alta heterogeneidad y la baja certeza.
Los estudios no informaron eventos adversos graves o no graves.
Conclusiones de los autores
La revisión indica que hay poca evidencia para apoyar o refutar el entrenamiento de las habilidades sociales para los niños y adolescentes con THDA. Es posible que se necesiten más ensayos con bajo riesgo de sesgo y un número suficiente de participantes para determinar la eficacia del entrenamiento en habilidades sociales versus ningún entrenamiento para el TDAH. La base de evidencia con respecto a los adolescentes es especialmente débil.
PICO
Resumen en términos sencillos
Entrenamiento de las habilidades sociales para los niños entre cinco y 18 años de edad con Trastorno por déficit de atención e hiperactividad (TDAH)
Pregunta de la revisión
¿Cuáles son los beneficios y los perjuicios del entrenamiento en habilidades sociales para los niños y adolescentes con el trastorno por déficit de atención e hiperactividad (TDAH)?
Antecedentes
Los niños y adolescentes con TDAH experimentan hiperactividad, impulsividad, problemas de atención y dificultades en las interacciones sociales. El entrenamiento en habilidades sociales para el TDAH busca mejorar y mantener la interacción social y prevenir las dificultades interpersonales. Los programas tienden a centrarse en la resolución de problemas, el control de las emociones y la comunicación verbal y no verbal. Se examinaron los beneficios y los perjuicios del entrenamiento en habilidades sociales con los siguientes resultados: habilidades sociales, competencias emocionales, conducta general, síntomas del TDAH y rendimiento escolar.
Características de los estudios
Se encontraron 25 ensayos clínicos aleatorizados (estudios en los que los participantes con TDAH fueron asignados al azar a uno de dos o más grupos) que incluían un total de 2690 participantes. Los ensayos duraron entre cinco semanas y dos años. El entrenamiento en habilidades sociales en general se centró en enseñarles a los niños cómo “leer” las señales sutiles en las interacciones sociales, como por ejemplo, aprender a esperar su turno, saber cuándo cambiar de tema durante una conversación, y poder reconocer las expresiones emocionales de los otros. El entrenamiento de habilidades sociales a menudo consiste en representación de roles, ejercicios y juegos, así como en deberes para hacer fuera de la sesión de entrenamiento. Los niños de los grupos de control no recibieron ninguna intervención o fueron colocados en una lista de espera.
Resultados clave
No se encontraron diferencias significativas entre el entrenamiento en habilidades sociales versus los controles de las habilidades sociales, las competencias emocionales y el comportamiento general según la evaluación de los profesores. En comparación con los niños que no tenían entrenamiento en habilidades sociales, los profesores calificaron a los que habían asistido en los grupos de habilidades sociales como los que tenían menos síntomas de TDAH al final del tratamiento. Sin embargo, este hallazgo fue cuestionable porque los otros análisis no lo confirman. No se encontraron indicios de efectos perjudiciales.
Todos los ensayos tuvieron problemas metodológicos como la sobreestimación de los beneficios y la subestimación de los prejuicios. Muchos estudios también fueron difíciles de comparar porque incluían diferentes intervenciones. Los resultados de algunos ensayos no fueron muy precisos, lo que significa que es difícil confiar en los resultados. En siete ensayos, los autores del estudio eran miembros de la junta de compañías farmacéuticas, habían recibido financiación de dichas compañías o habían realizado investigaciones previas sobre el tema.
Interpretación
No podemos concluir si el entrenamiento en habilidades sociales es beneficioso o no para los niños con TDAH. Se necesitan más ensayos clínicos aleatorizados sobre el entrenamiento en habilidades sociales para niños y adolescentes con TDAH que tengan un número suficiente de participantes y una calidad metodológica más alta. La base de la evidencia con relación a los adolescentes es especialmente débil. No se encontraron efectos adversos del tratamiento.
Authors' conclusions
Summary of findings
| Social skills training compared to no intervention | ||||||
| Patient or population: children aged five to 18 years with ADHD | ||||||
| Outcomes | Illustrative comparative risks* (95% CI) | Relative effect | Number of participants (studies) | Certainity of the evidence | Comments | |
| Assumed risk | Corresponding risk | |||||
| No intervention | Social skills training | |||||
| Teacher‐rated social skills Measured by: Conners Behavior Rating Scale: Social Problems Index; Strength and Difficulties Questionnaire: Prosocial Behaviour Subscale (teacher‐rated); Social Skills Improvement System; Social Skills Rating Scale: Coorperation Subscale Follow‐up: at end of treatment | ‐ | The mean score for teacher‐rated social skills at end of treatment in the intervention groups was 0.11 standard deviations higher (0.00 lower to 0.22 higher)e | ‐ | 1271 (11 studies) | ⊕⊝⊝⊝ a,b,c | Social skills training may have no effect on teacher‐rated social skills |
| Parent‐rated social skills Measured by: Social Skills Rating Scale; Weiss Functional Impairment Scale: Social Acitivities Domain (parent‐rated); Strength and Difficulties Questionnaire: Prosocial Behavior Subscale; Social Skills Improvement System Follow‐up: at end of treatment | ‐ | The mean score for parent‐rated social skills at end of treatment in the intervention groups was 0.19 standard deviations higher (0.06 higher to 0.32 higher) | ‐ | 1609 (15 studies) | ⊕⊝⊝⊝ a,b,c | Social skills training may have no effect on parent‐rated social skills |
| Teacher‐rated emotional competencies Measured by: Strengths and Difficulties Questionnaire: Emotional Symptoms Subscale; Conners Behavior Rating Scale: Emotional Index Score Follow‐up: at end of treatment | ‐ | The mean score for teacher‐rated emotional competencies at end of treatment in the intervention groups was 0.02 standard deviations lower (0.72 lower to 0.68 higher) | ‐ | 129 (two studies) | ⊕⊝⊝⊝ a,b,c | Social skills training may have no effect on teacher‐rated emotional competencies |
| Teacher‐rated general behaviour Measured by: Self‐Control Rating Scale; Conners Behavior Rating Scale: Aggressiveness Index; Disruptive Behavior Disorders Rating Scale; Conners Teacher Rating Scale: Conduct Problems Index; Strengths and Difficulties Questionnaire: Conduct Problems Subscale (teacher‐rated); Child Symptom Inventory: ODD Scale (teacher‐rated); Child Behavior Checklist Follow‐up: at end of treatment | ‐ | The mean score for teacher‐rated general behaviour at end of treatment in the intervention groups was 0.06 standard deviations lower (0.19 lower to 0.06 higher) | ‐ | 1002 (eight studies) | ⊕⊕⊝⊝ a,d | Social skills training may have no effect on teacher‐rated general behaviour |
| Parent‐rated general behaviour Measured by: Strengths and Difficulties Questionnaire (parent‐rated; total scores); Conners Behavior Rating Scale: Aggressiveness Index; Disruptive Behavior Disorders Rating Scale; Behavior Rating Inventory of Executive Function; SDQ: Conduct Problems Subscale (parent‐rated); Child Symptom Inventory; Child Behavior Checklist Follow‐up: at end of treatment | ‐ | The mean score for parent‐rated general behaviour at end of treatment in the intervention groups was 0.38 standard deviations lower (0.61 lower to 0.14 lower) | 995 (eight studies) | ⊕⊝⊝⊝ a,b,c,d | Social skills training may slightly improve parent‐rated general behaviour | |
| Teacher‐rated ADHD symptoms Measured by: Disruptive Behavior Disorders Rating Scale; ADHD Rating Scales: Hyperactivity and Impulsivity Subscales (total scores); Conner Teacher Rating Scale: Hyperactivity Index; Strengths and Weaknesses of ADHD Symptoms and Normal Behaviors; ADHD Symptom Checklist; Child Symptom Inventory (ADHD (inattention) scale score); SNAP‐IV (teacher rating scale) Follow‐up: at end of treatment | ‐ | The mean score for teacher‐rated ADHD symptoms at end of treatment in the intervention groups was 0.26 standard deviations lower (0.47 lower to 0.05 lower) | ‐ | 1379 (14 studies) | ⊕⊝⊝⊝ | Social skills training may slightly improve teacher‐rated ADHD symptoms |
| Parent‐rated ADHD symptoms Measured by: Conners Parent Rating Scale: Hyperkinesis Index; Disruptive Behavior Disorders Rating Scale; Strengths and Weaknesses of ADHD Symptoms and Normal Behaviors; Sluggish Cognitive Tempo; ADHD Symptom Checklist; ADHD Rating Scales; Child Symptom Inventory: Inattention; SNAP‐IV (teacher rating scale); Child Attention Profile Follow‐up: at end of treatment | ‐ | The mean score for parent‐rated ADHD symptoms at end of treatment in the intervention groups was 0.54 standard deviations lower (0.81 lower to 0.26 lower) | ‐ | 1206 (11 studies) | ⊕⊝⊝⊝ | Social skills training may slightly improve parent‐rated ADHD symptoms |
| *The basis for the assumed risk (e.g. the median control group risk across studies) is provided in footnotes. The corresponding risk (and its 95% CI) is based on the assumed risk in the comparison group and the relative effect of the intervention (and its 95% Cl). | ||||||
| ADHD: Attention deficit hyperactivity disorder; CI: Confidence interval; ODD: Oppositional defiant disorder; SNAP‐IV: Swanson, Nolan and Pelham rating scale ‐ Fourth Version. | ||||||
| GRADE Working Group grades of evidence | ||||||
| aDowngraded one level due to high risk of bias (systematic errors leading to overestimation of benefits and underestimation of harms) in several 'Risk of bias' domains, including lack of sufficient blinding and selective outcome reporting (many of the included studies did not report on this outcome) eThe effect on the primary outcome, teacher‐rated social skills at end of treatment, corresponds to a MD of 1.22 points on the social skills rating system (SSRS) scale (95% CI 0.09 to 2.36). The minimal clinical relevant difference (10%) on the SSRS is 10.0 points (range 0 to 102 points on SSRS). | ||||||
Background
Description of the condition
Attention deficit hyperactivity disorder
Attention deficit hyperactivity disorder (ADHD) affects 3% to 5% of all children (Polanczyk 2007; Thomas 2015). The main symptoms of ADHD include problems with attention, impulsiveness, and hyperactivity (Sergeant 2003; Pasini 2007). Individuals with ADHD also present with difficulties in the domains of attentional and cognitive functions, such as problem‐solving, planning, orienting, flexibility, sustained attention, response inhibition, and working memory (Sergeant 2003; Pasini 2007). Other difficulties involve affective components such as motivation delay and mood regulation (Nigg 2005;Castellanos 2006;Schmidt 2009). These latter difficulties are closely related to the condition and are the fundamental basis for these children's problems with social skills (Whalen 1985; Landau 1991),
Prevalence estimates for ADHD vary across the international literature. A large survey in the UK found that 3.6% of boys aged five to 15 years had ADHD; for girls of the same age, this study reported a prevalence of 0.9% (Ford 2003). In one study from Columbia, the reported prevalence was considerably higher: 19.9% for boys and 12.3% for girls (Pineda 2003). A systematic review on the prevalence of ADHD reported a mean proportion of 5.3% children and adolescents having ADHD overall, and concluded that much of the variation is derived from differences in methods used to diagnose the condition (Polanczyk 2007). Among US children and adolescents, the estimated prevalence of diagnosed attention deficit hyperactivity disorder increased from 6.1% in 1997‐1998 to 10.2% in 2015‐2016 (Xu 2018).
The aetiology of ADHD involves genetic, environmental, and social factors that are not clearly understood. Family and twin studies have shown a high heritability and with no sex differences of heritability (Neale 2010; Franke 2012). Furthermore, genetic factors may be involved in determining the persistence of ADHD into adulthood (Faraone 2000; Franke 2012). Although family studies have shown high heritability, and there are many candidate genes that may be involved in the disorder (Neale 2010), genome‐wide studies have yet to find any clear associations. Environmental risk factors include prenatal substance exposures, heavy metal and chemical exposures, nutritional factors, and lifestyle/psychosocial factors (Froehlich 2011).
A diagnosis of ADHD is made through recognition of excessive inattention, hyperactivity, and impulsivity (according to the presence of 18 symptoms) in a child, before 12 years of age, that causes impairment to his/her functioning or development (DSM‐5; ICD‐10). The principal classification systems for diagnosing ADHD are: International Classification of Diseases ‐ 10th Version (ICD‐10); and the Diagnostic and Statistical Manual of Mental Disorders (DSM) Fourth Edition (DSM‐IV), Fourth Edition ‐ Text Revision (DSM‐IV‐TR), andFifth Edition (DSM‐5).
In the DSM‐IV and DSM‐5, there are three different subdiagnoses, where particular symptoms are identified and classified: the 'predominantly inattentive type'; the 'predominantly hyperactive‐impulsive type'; and the 'combined' type, which presents with both hyperactive‐impulsive and inattentive symptoms (Willcut 2012).
Comorbid disorders, such as behavioural disorders (e.g. oppositional defiant disorder, conduct disorder), depression, anxiety, bipolar disorder, tics, motor skill development disturbance, learning difficulties, and verbal and cognitive difficulties are common in ADHD (Newcorn 2008; Schmidt 2009; Yoshimasu 2012; Czamara 2013; Perroud 2014).
ADHD is associated with negative social outcomes such as severe social incompetence, and displays of off‐task, disruptive and rule‐violating behaviour (Kolko 1990; Landau 1991), health problems such as abuse of drugs or alcohol, and criminality later in life (Barkley 2002; Dalsgaard 2002; Storebø 2014; Koisaari 2015).
ADHD is also associated with negative psychological outcomes such as an increased risk of developing personality disturbances and possibly psychotic conditions (Keshavan 2003; Storebø 2014).
Excessive weight and obesity are found in children with ADHD compared to children without ADHD (Cortese 2016). ADHD is associated with both early‐onset tobacco and alcohol use (Chang 2012). Similarly, ADHD comorbidity with conduct disorder can lead to adverse outcomes in academic achievement, failure to complete high school, criminality, substance use disorder, and unemployment (Erskine 2016).
ADHD seems to increase premature mortality by 50%, compared to individuals without ADHD, in a 24.9 million person‐years Danish cohort study (Dalsgaard 2015). A weakness of this study is that it did not include medical treatment of ADHD in the analysis as a possible confounder for the relationship between ADHD and mortality (Dalsgaard 2015). There have been some reports of sudden death in children and adults treated with stimulant treatment but it is unclear if these are related directly to methylphenidate (US FDA 2011). More research is being conducted on this topic.
Pharmacological management of ADHD
The drug most commonly used for the treatment of ADHD in children and adolescents is methylphenidate (a stimulant); atomoxetine, and dexamphetamine (another stimulant) are used less often (NICE 2009; NICE 2018). Storebø and colleagues conducted a comprehensive Cochrane Review investigating the short‐term benefits and harms of methylphenidate for children and adolescents. This review concluded that there is a possible small beneficial effect on ADHD symptoms, general behaviour, and quality of life, and that methylphenidate does not seem to increase the risk of serious adverse events in the short‐term but is associated with a relatively high risk of non‐serious adverse events in general (Storebø 2015). However, there were a number of limitations in the included trials such as lack of blinding in spite of placebo use, outcome reporting bias, and heterogeneity, which resulted in the evidence being rated as low to very low. The authors concluded that there is high need for long‐term randomised placebo tablet ('active placebo')‐controlled clinical trials, without risks of systematic errors, that investigate the effect of methylphenidate treatment for children and adolescents with ADHD (Storebø 2015). Whilst medication can help in the management of core behavioural symptoms, it is not designed to address skills deficits.
The most common adverse effects associated with methylphenidate are: headache, sleep problems, tiredness, and decreased appetite (Storebø 2018). Methylphenidate also affects the children's height and weight curves (Schachar 1997; Swanson 2007). Dexamphetamine seems to affect children's sleep and can result in dry mouth, thirst, weight loss, decreased appetite and stomach ache, and increase the risk of regressive, dependent behaviour and psychosis (Punja 2016). Atomoxetine is associated with pain, nausea and vomiting, decreased appetite with associated weight loss, dizziness, and slight increases in heart rate and blood pressure (Wolraich 2007).
Research on the neurochemical basis of ADHD has primarily focused on the neurotransmitters noradrenaline and dopamine, and their receptors in the central nervous system. Although the neurophysiological mechanism of the medications are not clearly known, it is presumed that their effects on symptoms of ADHD are explained primarily by the stimulant effects of dopaminergic and, to some extent, noradrenergic neurotransmission(Kadesjö 2002). Selective noradrenaline‐acting tricyclic medications and alpha‐2‐adrenergic agonists have also been observed to reduce symptoms of ADHD in children (Zametkin 1987).
Description of the intervention
Social skills training is developed with the characteristics of ADHD in mind in order to improve and maintain the individual’s social skills and prevent or alleviate social difficulties. Social skills are complex and involve different aspects of cognitions, emotions, and behaviour. Programmes vary in their focus on different aspects of social skills but tend to focus on problem‐solving, control of emotions, and verbal and non‐verbal communication. The training generally focuses on teaching the children how to 'read' the subtle cues in social interaction such as learning to wait for their turn, knowing when to shift topics during a conversation, and being able to recognise the emotional expressions of others (Fohlmann 2009a;Fohlmann 2009b [pers comm]). The children may be taught to practice how to adjust their verbal and non‐verbal behaviour in their social interactions. It may also include efforts to change the children’s cognitive assessment of the 'social world'. Social skills training also includes teaching social norms, social 'rules', and expectations of others (Liberman 1988).
Training may also focus on emotion regulation, such as the child's ability to deal with, manage, express, and control his or her emotions. An inability to regulate both positive and negative emotion has been associated with disorders such as ADHD and conduct disorder (Walcott 2004). Emotional self‐regulation is an important aspect of resilience. Children who have effective strategies for dealing with disappointment, loss, and other upsetting events are more likely to bounce back from adversity than those who do not. Managing positive emotion is also important. Success socially and at school depends on the ability to control exuberance, when appropriate.
Social skills training often consists of role play, exercises and games, as well as homework. Social skills training is often taught in groups and is a relatively short intervention typically lasting between eight and 12 weeks. The duration of each group session is usually 50 to 90 minutes. Treatment frequency can range from a couple of times per month to several times a week. Often the programme also involves parents or teachers. Parental groups are typically included to give the parents the opportunity to support the children's training in the social skills groups by understanding the nature of ADHD and the content of the treatment programme. Teachers are often included to facilitate learning objectives and to coordinate social skills training domains, such as homework.
How the intervention might work
The effect of the intervention may be measured by looking at social skills per se, or by looking at a more global assessment of psychological functioning such as the quality of peer relationships, emotional competences, and general behaviour. Social skills training includes procedures to identify problems and set goals in collaboration with the participant. Through role play, exercises and games, participants demonstrate the required skills, and positive or corrective feedback is given to them accordingly. By social modelling and behavioural practice, participants observe and repeat the skills until they become more generalised. Homework assignments are then given to motivate participants to implement these communications in real‐life situations (Almerie 2015).
Why it is important to do this review
Several randomised clinical trials suggest that social skills training may help children with ADHD (Pfiffner 1997; Antshel 2003; Pfiffner 2007). Social skills training may be effective alone, as an adjunct to medication, or both. However, the evidence on social skills training is unclear, and systematic reviews are necessary to evaluate its effectiveness and potential harms. It is always important to investigate the benefits and harms of interventions in order to not waste valuable resources in clinical practice.
Like medical treatments, the effects of social skills training do not always appear to endure. Some trials indicate that not all children benefit from social skills training, potentially due to lack of parental engagement during treatment (Kadesjö 2002). Some have argued that social skills training groups can have a negative effect on children with behavioural problems because the children’s aggressive and restless behaviour can limit their ability to learn social skills. This, paradoxically, can increase negative behaviour (Mager 2005).
This review is an update of our systematic review published in 2011, which, at the time, was the only high‐quality review on the topic (Storebø 2011). Many new trials have been conducted since 2011 and this update includes more than the double number of trials compared to our original review.
We have identified two meta‐analyses and one review investigating the efficacy of social skills or psychosocial training for children with ADHD. Two of these studies found a significant effect of social skills and psychosocial treatment (De Boo 2007;Majewicz‐Hefley 2007) and one did not find any significant effect (Van der Oord 2008). We also found a meta‐analysis which assessed the effectiveness of social skills training for students with behaviour disorders (Kavale 1997). This meta‐analysis also did not find any significant benefit from social skills training. The review and these meta‐analyses have serious methodological deficits. None of them were systematic reviews like ours and they all lacked a published protocol before they were conducted. Furthermore, none of them systematically evaluated systematic errors (bias) or random errors (play of chance), and therefore their results are questionable. A systematic review published in 2019 on stand‐alone social skills training for youth with ADHD concluded that social skills training implemented without additional treatment components like parent support, showed improvements on some areas of social functioning (Willis 2019). However, this review suffered from a very limited search strategy and did not evaluate systematic errors (bias) in the included trials. In our Cochrane review in 2011 on the topic, we were unable to demonstrate clear benefits or harms of social skills training (Storebø 2011).
Objectives
To present the available evidence on the beneficial and harmful effects of social skills training in children and adolescents with ADHD.
Methods
Criteria for considering studies for this review
Types of studies
Randomised clinical trials (RCTs) investigating social skills training alone or as an adjunct to pharmacological treatment compared to pharmacological treatment. The comparison groups were no intervention or waiting‐list control.
Types of participants
Children and adolescents between five and 18 years of age and diagnosed with ADHD according to the DSM‐IV, DSM‐IV‐TR or DSM‐5, or with hyperkinetic disorder according to the ICD‐10. The main term used in the DSM‐IV is 'ADHD 314', which is divided into three subdiagnoses: 'predominantly inattentive type' (314.00), 'predominantly hyperactive/impulsive type' (314.01), and 'combined type' (314.02). We also included trials that used the DSM‐IV diagnosis of 'ADHD unspecified' (314.9), as well as other diagnostic categories from earlier DSM systems (DSM‐III; DSM‐IV‐R), and 'hyperkinetic disorder' from the ICD‐9.
In addition, we included participants with a diagnosis of ADHD based on a cut‐off score from a validated diagnostic assessment instrument: for example, Conners’ Parent Rating Scales (Conners 1998). We also included participants with different kinds of comorbidity such as conduct or oppositional disorders, depression, attachment disorder, or anxiety disorders.
Types of interventions
We considered all forms of social skills training where training focused on behavioural and cognitive‐behavioural efforts to improve social skills and emotional competence. This included behavioural and cognitive treatments focusing on teaching the children how to 'read' the subtle cues in social interaction, such as learning to wait for their turn, knowing when to shift topics during a conversation, and being able to recognise the emotional expressions of others, as well as social 'rules', and expectations of others.
We included trials comparing social skills training versus either no intervention or waiting‐list control. We considered these control groups to be equal. Therefore, we did not distinguish between the control groups, but analysed the trials with relevant outcomes together in the same comparison. We also included trials with concurrent medical treatment if the medication was administered equally in both groups. In further updates of the review, we will include trials with social skills training versus placebo or sham intervention, as described in our protocol (Storebø 2010).
Types of outcome measures
Primary outcomes
-
Social skills in school or at home, measured at post‐treatment and longest follow‐up, by well‐established and validated instruments such as the Social Skills Rating System (SSRS; Gresham 1990) or Conners' Behaviour Rating Scales (CBRS;Conners 2008a).
-
Emotional competencies in school or at home, measured at post‐treatment and longest follow‐up, by well‐established and validated instruments such as the Emotion Regulation Checklist (ERC; Hannesdottir 2017).
-
General behaviour in school or at home, measured at post‐treatment and longest follow‐up, by well‐established and validated instruments such as the Achenbach Child Behavior Checklist (Achenbach 1991).
Secondary outcomes
-
Core ADHD symptoms of inattention, impulsivity, and hyperactivity, measured at post‐treatment and longest follow‐up, by well‐established and validated instruments such as Conners' Parents’ Rating Scales (Conners 1998; Conners 2008b).
-
Performance and grades in school, measured at post‐treatment and longest follow‐up, by well‐established and validated instruments.
-
Participant or parent (or both) satisfaction with treatment, measured as continuous outcomes by psychometrically validated instruments such as the Client Satisfaction Questionnaire (Attkisson 1982).
-
Adverse events. We included both severe and non‐severe adverse events. We defined serious adverse events as any event that led to death, was life‐threatening, required inpatient hospitalisation or prolongation of existing hospitalisation, resulted in persistent or significant disability, or any important medical event that may have jeopardised the participant's health or required intervention to prevent it (ICH 1996). We considered all other adverse events as non‐serious.
Search methods for identification of studies
We ran searches for the previous review up to March 2011, using the search strategies reported in Storebø 2011. For this update, we made some changes to the databases we searched (see Differences between protocol and review).
Electronic searches
For this update, we searched the following electronic databases up to July 2018.
-
Cochrane Central Register of Controlled Trials (CENTRAL; 2018, Issue 6), in the Cochrane Library (searched 11 July 2018).
-
MEDLINE Ovid (1948 to 11 July 2018).
-
Embase Ovid (1980 to 11 July 2018).
-
ERIC EBSCOhost (Education Resources Information Center; 1966 to 11 July 2018).
-
CINAHL EBSCOhost (Cumulative Index to Nursing and Allied Health Literature; 1980 to 11 July 2018).
-
PsycINFO Ovid (1806 to 11 July 2018).
-
Sociological Abstracts ProQuest (1952 to 11 July 2018).
-
ProQuest Dissertations & Theses Global (searched 11 July 2018).
-
ClinicalTrials.gov (clinicaltrials.gov; searched 12 July 2018).
-
World Health Organization International Clinical Trials Registry Platform (WHO ICTRP; www.who.int/ictrp/en; searched 12 July 2018).
The search strategies for this update are shown in Appendix 1. We did not limit our searches by language, year of publication, or type or status of publication. We sought translation of the relevant sections of non‐English language articles.
Searching other resources
We searched the following online proceedings for potentially relevant conference abstracts.
-
2nd International Congress on ADHD: from childhood to adult disease; 2009 May 21 to 24; Vienna, Austria (International Congress on ADHD 2009).
-
3rd International Congress on ADHD: from childhood to adult disease; 2011 May 26 to 29; Berlin, Germany (World Congress on ADHD 2011).
-
4th World Congress on ADHD: from childhood to adult disease; 2013 June 6 to 9; Milan, Italy (World Congress on ADHD 2013).
-
5th World Congress on ADHD: from child to adult disorder; 2015 May 28 to 31; Glasgow, Scotland (World Congress on ADHD 2015).
-
6th World Congress on ADHD: from child to adult disorder; 2017 Apr 20 to 23; Vancouver, Canada (World Congress on ADHD 2017).
-
Eunethydis 1st International ADHD Conference: from data to best clinical practice; 2010 May 26 to 28; Amsterdam, The Netherlands (Eunethydis 2010).
-
Nordic ADHD Konference: livslange perspektiver og specielle behov [lifelong perspectives and special needs]; 2010 May 19 to 20; Aalborg, Denmark (Nordic ADHD konference 2010).
-
InternationaI Society for Research in Child and Adolescent Psychopathology (ISRCAP) conference; 2009 June 17‐20; Seattle, Washington, USA.
-
CADDRA: 14th Annual ADHD Conference; 2018 Nov 10 to 11; Calgary, Canada.
In addition, we contacted 176 experts in the field for information about possible unpublished or ongoing RCTs, and received responses from 15 (a list of those contacted is available from the review contact author).
Data collection and analysis
We conducted the review according to the Cochrane Handbook for Systematic Reviews of Interventions (Higgins 2011). In the following section, we report only the methods that we were able to use in this update. Methods that we had planned to use as per our published protocol (Storebø 2010), but could not (e.g. cluster‐randomised trials), are reported in Table 1.
| Section | Protocol | Review |
| Types of outcome measures | We did not define what we meant by adverse events. | We added a definition of adverse events according to the International Committee of Harmonization guidelines (ICH 1996), because many of the studies included pharmaceutical treatment and it is not known whether social skills training might have adverse events. |
| We stated that we would measure the three primary and the first two secondary outcomes at short‐term (up to six months), medium‐term (six to 12 months), and long‐term (more than 12 months) follow‐up. | We changed this to end of treatment and at the longest follow‐up because we did not have data for the planned three time points. | |
| We did not prespecify the most important comparisons for the 'Summary of findings' table. | We reported a total of seven outcomes in the 'Summary of findings' table as per Cochrane recommendations; three primary outcomes (social skills, emotional competencies and general behaviour) and the first secondary outcome (ADHD symptoms). | |
| Assessment of risk of bias in included studies | We had not planned to evaluate blinding of participants and personnel. | We assessed the blinding of participants and personnel, as this is also important to assess in trials investigating psychosocial interventions, even if it is very difficult to do in these types of trials. |
| We stated that we would only use studies at low risk (or lower risk) of bias in the meta‐analysis. | We changed the decision to restrict the meta‐analysis to studies at comparable risk of bias (for example, all low risk of bias, all unclear risk of bias, or all high risk of bias), and performed sensitivity analyses accordingly. We decided to change this as there were very few trials at low risk of bias in this field. | |
| We stated that we would assess 'baseline imbalance' and 'early stopping' as risk of bias domains. | We did not assess these baseline domains. The randomisation procedure should give an even distribution of confounding factors and baseline imbalance. | |
| Dealing with missing data | We intended to assess the impact of missing dichotomous data in the results by applying procedures for 'intention‐to‐treat' and 'best‐case/worst‐case scenarios'. | We were unable to perform this analysis as there were no dichotomous data. |
| Measures of treatment effect | Dichotomous data We planned to analyse dichotomous data as risk ratios and present these with 95% confidence intervals (CIs), and to calculate the risk difference and, where there was a significant effect with the intervention and reasonable homogeneity of studies (that is, clinical, methodological, or statistical heterogeneity was within reasonable limits), the number needed to treat for an additional beneficial outcome (Higgins 2011, Section 9.2). | We did not do this as there were no dichotomous data. |
| Unit of analysis issues | Cluster‐randomised studies We stated that we thought investigators would have presented their results after appropriately checking for clustering effects (robust standard errors or hierarchical linear models). We planed to contact the investigators for further information if this was unclear. Where appropriate checks were not used, we planned to request and re‐analyse individual participant data using multilevel models that check for clustering. Following this, we planned to analyse effect sizes and standard errors in RevMan 5 (Review Manager 2014), using the generic inverse method (Higgins 2011, Section 9.3.2). If there was insufficient information to check for clustering, we would have entered outcome data into RevMan 5 using individuals as the units of analysis, and then conducting a sensitivity analysis to assess the potential biasing effects of inadequately controlled clustered studies (Donner 2002). See 'Sensitivity analysis' below. | We did not find any cluster‐randomised trials. |
| Assessment of reporting biases | We did not state that we would use Egger's test to test for small‐study effects. | We performed Egger's statistical test for small‐study effects. |
| Subgroup analysis and investigation of heterogeneity | We planned to perform subgroup analyses according to the following categories.
| We were not able to perform these subgroup analyses due to lack of sufficient data. |
| Sensitivity analysis | We stated that we would repeat the analysis taking into consideration the different methods used to handle the missing data and the potential biasing effects of inadequately controlled clustered studies. | We did not perform this analysis due to a lack of necessary data and, consequently, have analysed the data as reported. |
ADHD: attention deficit hyperactivity disorder.
Selection of studies
Eight reviewers (OJS, NP, EGF, MEA, BT, MS, HC and SJ) independently evaluated and selected trials for inclusion. Having removed duplicates, they assessed the titles and abstracts of all records generated by the search and excluded those that clearly did not meet the inclusion criteria: for example, non‐randomised trials or trials with participants outside the specified age range (Criteria for considering studies for this review). Next, they retrieved the full‐text reports for those trials deemed relevant or for which more information was needed to determine relevance and assessed them for eligibility. The review authors discussed differing interpretations regarding eligibility and consulted a third review author (ES) for those cases where they could not reach an agreement.
We have listed relevant RCTs that did not fulfil the inclusion criteria with reasons for exclusion in the Characteristics of excluded studies table. We recorded our selection process in a study flow diagram (Moher 2009).
Dealing with duplicate publication
We collected multiple reports of the same study to maximise data collection.
Data extraction and management
Working in pairs, eight review authors (OJS, MEA, EGF, BT, HC, SJH, NP, and MS) independently extracted data onto a data collection form (Appendix 2). We extracted data on participants, study design and methods, interventions, outcomes, and relevant data for 'Risk of bias' assessments. We resolved differences by discussion.
OJS entered the data into Review Manager 5 (RevMan 5) (Review Manager 2014).
In cases of lack of data, for the use of e.g. tables with sociodemographic data, 'risk of bias' assessment, or the analysis, or where data in the published study reports were unclear, we contacted the trial authors requesting them to clarify the missing information (see Dealing with missing data).
Assessment of risk of bias in included studies
For each included RCT, eight review authors (OJS, MEA, EGF, BT, HC, SJH, NP, and MS), working in pairs, independently evaluated the following 'Risk of bias' components: random sequence generation; allocation concealment; blinding of participants and personnel; blinding of outcome assessment; incomplete outcome data; selective outcome reporting; vested interest bias; and other sources of bias. We assigned trials to one of three categories (low risk of bias, uncertain risk of bias, and high risk of bias), according to guidelines in the Cochrane Handbook for Systematic Reviews of Interventions (Higgins 2011, section 8.2.1) and from the Cochrane Hepato‐Biliary Group (Cochrane Hepato‐Biliary Group 2019) (see Appendix 3). We resolved disagreements by discussion. We used the results of the 'Risk of bias' assessment to inform the GRADE assessment.
Measures of treatment effect
Continuous data
We compared the mean score between the two intervention groups to give a mean difference (MD) and presented this with 95% confidence intervals (CIs). We wanted to use the overall MD, where possible, to compare the outcome measures from trials. However, because many of the included trials used different rating scales for measuring the same construct we used the standardised mean difference (SMD) in many analyses. For the primary outcome, teacher‐rated social skills at end of treatment, we transformed the MD and standard deviation (SD) from the different rating scales used in this analysis to the MD and SD of a commonly used scale, namely the Social Skills Rating Scale (SSRS). We reported this MD in the results section as well as in the abstract and we compared it to a plausible minimal relevant difference of 10% on this scale.
Unit of analysis issues
We did not encounter any unit of analysis issues. Our strategies for dealing with these can be found in Table 1 (see also Storebø 2010).
Dealing with missing data
We sought to retrieve any missing data from the trial authors. Overall, we wrote to 17 authors, eight of whom supplied us with missing sociodemographic data and missing information about methodology; some also supplied us with missing statistics. If data remained unavailable, we tried to estimate the missing data using the available information (e.g. if the standard deviation (SD) was missing, we estimated it from the standard error, if reported). When we were not able to obtain missing data, we conducted analyses using available (incomplete) data.
Assessment of heterogeneity
We assessed clinical heterogeneity by examining variability in the participants, interventions, and outcomes described in each included trial. We assessed methodological heterogeneity by inspecting variability in the designs of the trials, and statistical heterogeneity by assessing the difference in the trials' intervention effects. We assessed heterogeneity between trials by visual inspection of the forest plot for overlapping CIs, using the Chi2 test for homogeneity with a significance level of α (alpha) = 0.10, and the I2 statistic for quantifying inconsistency (estimating the percentage of variation in effect estimates due to heterogeneity rather than sampling error). We judged I2 values of 0% to 40% to indicate little heterogeneity; 30% to 60%, moderate heterogeneity; 50% to 90%, substantial heterogeneity; and 75% to 100%, considerable heterogeneity (Higgins 2011). Furthermore, we explored potential reasons for the heterogeneity by examining individual trial characteristics and conducting subgroup analyses (Subgroup analysis and investigation of heterogeneity).
Assessment of reporting biases
We handled different forms of reporting bias, especially publication bias and outcome reporting bias, according to the recommendations in the Cochrane Handbook for Systematic Reviews of Interventions (Higgins 2011, Section 10.1). We drew funnel plots (estimated differences in treatment effects against their standard error), and we performed Egger's statistical test for small‐study effects (Egger 1997). There are several reasons for the asymmetry of a funnel plot; for example, true heterogeneity, poor methodological quality, or publication bias (Higgins 2011, section 10.4.1).
Data synthesis
We included and analysed trials undertaken in any setting; for instance, in groups, in the home, or at a centre. We summarised data in a meta‐analysis when they were available and if clinical heterogeneity was not excessive (for example, there was not too much variability in participants' characteristics). We performed statistical analysis in RevMan 5 (Review Manager 2014), according to recommendations in the latest version of the Cochrane Handbook for Systematic Reviews of Interventions (Higgins 2011, Section 9.4.1). We synthesised data by using final values and the inverse variance method in the meta‐analyses. We generally used the random‐effects model because we expected differences in the treatments. The fixed‐effect model is used when there is an assumption that the observed differences between the study results are just due to ‘play of chance’. When there is heterogeneity that cannot be explained as ‘play of chance’, it is common to use the random‐effects model. A random‐effects model has the assumption that apparent differences between study effects are random, but the estimated difference follows a normal distribution. This method gives more weight to small trials, whereas the fixed‐effect model gives more weight to large trials. We therefore conducted both fixed‐effect and random‐effects models, and checked for differences between these methods of analyses (Higgins 2011, Section 9.5.4). If both models gave the same results, we reported the results from the random‐effects model only. For some outcomes we were unable to conduct a meta‐analysis because the outcomes were reported only in a single study. For these outcomes, we provided a narrative description of the results.
Diversity‐adjusted required information size and Trial Sequential Analysis
Trial Sequential Analysis (TSA) is a tool for controlling risks of type I and type II errors in cumulative meta‐analyses, and gives a valuable overview of the number of participants needed to make a firm evaluation of a possible intervention effect (Brok 2008; Wetterslev 2008; Brok 2009; Thorlund 2009; Wetterslev 2009; Wetterslev 2017).
Comparable to the a priori sample size estimation in a single RCT, a meta‐analysis should include an information size (IS) at least as large as the sample size of an adequately powered single study to reduce the risks of random errors. The TSA provides the required information size (RIS) for a meta‐analysis, adjusting the significance level for sparse data and repetitive testing on accumulating data, to avoid the increased risk of random error (Wetterslev 2008; Wetterslev 2009; Wetterslev 2017).
Multiple analyses of accumulating data from new emergent trials leads to ‘repeated significant testing’, and use of the conventional P value is prone to exacerbate the risk of a type I random error (Lau 1995; Berkley 1996). Meta‐analyses that do not reach the RIS are analysed with trial sequential monitoring boundaries, which are analogous to interim monitoring boundaries in a single study (Wetterslev 2008; Wetterslev 2017). This approach is crucial in coming updates of this review.
We used an a priori assumption that the minimal relevant clinical intervention effect was 4.0 points. This is approximately ½ SD on the used scale, which can be used as a minimal clinical relevant difference (Norman 2003).
We calculated the diversity‐adjusted required information size (DARIS; that is the number of participants required to detect or reject a specific intervention effect in a meta‐analysis), and performed a TSA for the primary outcome (teacher‐rated social skills competences) at the end of treatment, based on the following a priori assumptions:
-
the SD of the primary outcome of 9.5 points;
-
an anticipated minimal relevant difference (MIREDIF) of 4.0 points;
-
a maximum type I error of 2.5% (due to three primary outcomes; Jakobsen 2014);
-
a maximum type II error of 10% (minimum 90% power; Castellini 2018); and
-
the diversity observed in the meta‐analysis.
Subgroup analysis and investigation of heterogeneity
We conducted subgroup analysis both where we found statistically significant differences between intervention groups, and in other cases to make hypotheses about the subgroups mentioned below.
We performed the following subgroup analyses.
-
Children aged five to 11 years compared to children aged 12 to 18 years;
-
ADHD with comorbidity compared to ADHD without comorbidity;
-
Social skills training only compared to social skills training supported by parent training;
-
Social skills training, parent training and medication compared to social skills training and parent training without medication;
-
No‐intervention control group compared to waiting‐list control group with possible minor active intervention components.
Sensitivity analysis
We assessed the robustness of the results by conducting sensitivity analyses in which we repeated the analysis:
-
excluding the trial with longest treatment duration or the largest trial; and
-
using different statistical models (fixed‐effect or random‐effects models) (Higgins 2011).
'Summary of findings' table
We constructed 'Summary of findings' tables using GRADE software (GRADEpro GDT 2015) for the comparison 'social skills training compared to no intervention'. We included three primary outcomes (social skills, emotional competencies and general behaviour) and one secondary outcome (ADHD core symptoms) assessed at end of treatment in the table.
We used the GRADE approach to assess the quality of the evidence associated with each of these outcomes (Guyatt 2008). The GRADE approach appraises the quality of a body of evidence based on the extent to which one can be confident that an estimate of effect or association reflects the item being assessed. Considerations are due to: within‐study risk of bias; directness of evidence; heterogeneity of the data; precision of effect estimates; and risk of publication bias (Balshem 2011; Guyatt 2011a; Guyatt 2011b; Guyatt 2011c; Guyatt 2011d; Guyatt 2011e; Guyatt 2011f; Guyatt 2011g; Andrews 2013a; Andrews 2013b; Brunetti 2013; Guyatt 2013a; Guyatt 2013b; Guyatt 2013c; Mustafa 2013).
Results
Description of studies
Results of the search
This updated review fully incorporates the results of searches conducted up to July 2018. We carried out electronic searches over five time periods: up to February 2009; February 2009 to June 2010; June 2010 to March 2011; March 2011 to May 2017; and May 2017 to July 2018. The number of unique records (i.e. number of records after duplicates were removed) generated by these searches were as follows.
-
Up to February 2009 = 2500 (out of 3045);
-
February 2009 until June 2010 = 200 (out of 643)
-
June 2010 until March 2011 = 165 (out of 208)
-
March 2011 until May 2017 = 1616 (out of 3229)
-
May 2017 until July 2018 = 324 (out of 410)
To date, the electronic searches for this review have found 7535 records, plus an additional four records from searching other resources. Having removed duplicates, we screened 4805 records, and subsequently excluded 4492 as clearly irrelevant on the basis of title and abstract. We retrieved the full texts of the remaining 313 reports, which we assessed for eligibility against our selection criteria (Criteria for considering studies for this review). From these, we excluded 224 as irrelevant, formally excluded a further 39 with reasons (see Excluded studies), and included 25 trials (from 45 reports). We also identified four ongoing trials, and one which is awaiting classification (see Figure 1).

Study flow diagram.
Included studies
This review includes 25 RCTs described in 45 reports. Of these 25 trials, one, Cohen 1981, did not have usable data to be included in the quantitative analysis (meta‐analysis). Another one of the trials had extreme values in some of the outcomes and we did not use the data on these outcomes (Tabaeian 2010).
See Characteristics of included studies tables for further details on each included study.
Setting
Thirteen trials were carried out in North America: 12 in the US (Bloomquist 1991; Pfiffner 1997; MTA 1999; Antshel 2003; Tutty 2003; Abikoff 2004; Pfiffner 2007; Waxmonsky 2010; Pfiffner 2014; Evans 2016; Pfiffner 2016; Waxmonsky 2016). Of the remaining 12 trials, six were carried out in Asia; three in Iran (Tabaeian 2010; Azad 2014; Meftagh 2014a), two in China (Yuk‐chi 2005; Qian 2017), and one in South Korea (Choi 2015). Five trials were conducted in Europe; one apiece in Denmark (Storebø 2012), Iceland (Hannesdottir 2017), Germany (Schramm 2016), The Netherlands (Van der Oord 2007), and one which took place in both Belgium and The Netherlands (Bul 2016): One trial was conducted in Australia (Wilkes Gillan 2016), and one in Canada (Cohen 1981).
The majority of trials were conducted in an outpatient setting; six trials were carried out in a clinical setting (Pfiffner 1997; Tabaeian 2010; Storebø 2012; Azad 2014; Hannesdottir 2017; Qian 2017).
Participants
The 25 RCTs included a total of 2690 participants. The majority of trials included children between five and 13 years of age; a single trial included adolescents between 12 and 17 years of age (Schramm 2016). All participants were diagnosed with ADHD using tools that had been accepted for inclusion in this review. All of these diagnostic tools were based on the international DSM (DSM‐III; DSM‐IV; DSM‐IV‐R; DSM‐IV‐TR; DSM‐5) or ICD diagnostic systems ICD‐10), or a cut‐off score from the Conners' Rating Scale (Conners 1998; Conners 2008a; Conners 2008b).
Six trials did not specify intelligence (IQ) as inclusion or exclusion criteria (Pfiffner 1997; Tutty 2003; Tabaeian 2010; Meftagh 2014a; Azad 2014; Schramm 2016), and the remaining trials excluded children with low IQ (ranging from < 70 to < 90).
All but seven trials (Pfiffner 1997; Antshel 2003; Van der Oord 2007; Azad 2014; Meftagh 2014a; Choi 2015; Schramm 2016) excluded patients with one or more comorbid mental disorders – typically autism spectrum disorder, psychosis, or neurological disorder. Two trials used comorbidity as an exclusion criterion (Tutty 2003; Tabaeian 2010). Eighteen trials reported on different types of comorbidities, such as oppositional defiant disorder, conduct disorder, and anxiety disorder for the children in addition to the ADHD diagnosis.
The distribution of boys to girls was almost equal in two trials (Pfiffner 2014; Choi 2015). In the remaining trials, boys outnumbered girls. The number of boys to girls was: 2:1 in seven trials (Bloomquist 1991; Pfiffner 1997; Pfiffner 2007; Storebø 2012; Evans 2016; Waxmonsky 2016; Hannesdottir 2017); 3:1 in three trials (Antshel 2003; Tutty 2003; Pfiffner 2016); 4:1 in four trials (MTA 1999; Waxmonsky 2010; Bul 2016; Qian 2017); 6:1 in two trials (Schramm 2016; Wilkes Gillan 2016); 7:1 in one trial (Cohen 1981); 9:1 in one trial (Yuk‐chi 2005) and 14:1 in one trial (Abikoff 2004). The participants were all males in one trial (Tabaeian 2010), and three trials provided no information on the sex of the participants (Van der Oord 2007; Azad 2014; Meftagh 2014a).
Participants were between 80% and 100% Caucasian in six trials (Bloomquist 1991; Pfiffner 1997; Antshel 2003; Abikoff 2004; Van der Oord 2007; Waxmonsky 2010). Ethnicity was more mixed in seven other trials: 16% to 74% Caucasian; 3% to 75% Hispanic; 0% to 16% Asian; and 5% to 20% Afro‐American (MTA 1999; Tutty 2003; Pfiffner 2007; Pfiffner 2014; Evans 2016; Pfiffner 2016; Waxmonsky 2016). In four trials, ethnicity was stated with reference to the country of origin, with all or almost all being Canadian (Cohen 1981), Chinese (Yuk‐chi 2005), Iranian (Tabaeian 2010), or Australian (Wilkes Gillan 2016). Ethnicity was not explicitly described in eight trials (Storebø 2012; Azad 2014; Meftagh 2014a; Choi 2015; Bul 2016; Schramm 2016; Hannesdottir 2017; Qian 2017). Eleven trials included and controlled for a measure of socioeconomic status (Pfiffner 1997; Yuk‐chi 2005; Pfiffner 2014; Evans 2016; Pfiffner 2016; Schramm 2016; Waxmonsky 2016; Tutty 2003; Van der Oord 2007; Waxmonsky 2010; Wilkes Gillan 2016).
Sample size
There was considerable variation in sample sizes between trials. The number of participants randomised per study ranged from 24 to 576 participants in all trials. Only three trials reported a sample size calculation before the start of the study (MTA 1999; Storebø 2012; Bul 2016).
Interventions
Experimental
The 25 trials had different but comparable experimental interventions. The interventions named were: social skills training (Pfiffner 1997; Antshel 2003; Tabaeian 2010; Storebø 2012; Choi 2015; Hannesdottir 2017); cognitive behavioural intervention (Cohen 1981; Bloomquist 1991); meta‐cognitive training (Azad 2014); multimodal behavioural/psychosocial therapy (MTA 1999; Abikoff 2004; Van der Oord 2007); behavioural therapy/treatment (Pfiffner 2007; Waxmonsky 2010); behavioural and social skills treatment (Tutty 2003; Waxmonsky 2016); challenging horizon program (CHP; Evans 2016); children's verbal self‐instruction training (Meftagh 2014a); child life and attention skills treatment (CLAS; Pfiffner 2014; Pfiffner 2016), executive skills training (Qian 2017); learning skills training (Schramm 2016); different play or game‐based intervention (Bul 2016; Wilkes Gillan 2016); and psychosocial treatment (Yuk‐chi 2005). We considered that all these interventions were comparable and based on a cognitive behavioural model. Throughout the rest of the review, we referred to the experimental child interventions as 'child social skills training', in accordance with the Description of the intervention section.
The duration of the intervention varied between five and eight weeks in seven trials (Pfiffner 1997; Antshel 2003; Tutty 2003; Waxmonsky 2010; Storebø 2012; Azad 2014; Hannesdottir 2017), and between 10 and 16 weeks in 13 trials (Cohen 1981; Bloomquist 1991; Pfiffner 2007; Van der Oord 2007; Tabaeian 2010; Meftagh 2014a; Pfiffner 2014; Choi 2015; Bul 2016; Pfiffner 2016; Waxmonsky 2016; Wilkes Gillan 2016; Qian 2017). In two trials, the intervention lasted for 24 weeks (Yuk‐chi 2005; Schramm 2016), and, in one trial apiece, the intervention lasted for one year (Evans 2016), 14 months (MTA 1999), and two years (Abikoff 2004).
Five trials used social skills training for children plus parent training (Cohen 1981; Antshel 2003; Tutty 2003; Abikoff 2004; Waxmonsky 2010); one of these trials also administered academic organisational skills training and individual psychotherapy (Abikoff 2004). Seven trials used a combination of social skills training for children, parent training, and teacher consultations in the experimental group (Bloomquist 1991; Yuk‐chi 2005; Pfiffner 2007; Van der Oord 2007; Pfiffner 2014; Pfiffner 2016; Schramm 2016). One trial used social skills training for children, parent training, teacher consultations, and classroom behavioural intervention in the experimental group (MTA 1999), and another used social skills training for children and parent training plus standard treatment in the experimental group (Storebø 2012). One trial used either social skills training for children or social skills training for children plus parent training (Pfiffner 1997).
One trial used social skills training only in the experimental group (Choi 2015). Another trial included the Challenging Horizons Program, which is designed to target different skills such as organisational and social skills (Evans 2016), whereas other trials used life skills (Pfiffner 2014) and group‐based social skills training as the experimental intervention (Hannesdottir 2017). One trial used verbal self‐instruction as the experimental programme (Meftagh 2014a), and another used a play‐based intervention (Wilkes Gillan 2016). Finally, one trial used a specific intervention targeting skills related to mood and behaviour (Waxmonsky 2016).
Two trials used meta‐cognitive training (Azad 2014; Qian 2017); one had a social game intervention, which targeted cooperation and planning skills among others (Bul 2016), and the other used behavioural and cognitive training (Schramm 2016).
Seven trials included concurrent medical treatment with ADHD medication in both the experimental and control groups (Cohen 1981; Antshel 2003; Tutty 2003; Abikoff 2004; Waxmonsky 2010; Tabaeian 2010; Storebø 2012).
Control
Eight trials used medications in the experimental group and as the only treatment in the control group (Cohen 1981; MTA 1999; Antshel 2003; Tutty 2003; Abikoff 2004; Yuk‐chi 2005; Van der Oord 2007; Waxmonsky 2010); one of these trials also included a no‐treatment control group (Cohen 1981). Two trials used standard treatment in the experimental group and as the only treatment in the control group (Storebø 2012; Bul 2016). Nine trials used a waiting‐list or no‐intervention control group without medication in any of the groups (Bloomquist 1991; Pfiffner 1997; Pfiffner 2007; Tabaeian 2010; Azad 2014; Choi 2015; Schramm 2016; Wilkes Gillan 2016; Hannesdottir 2017). One trial used parent training in the experimental group and as the only treatment in the control group (Pfiffner 2014). Four trials used a control group with some active intervention elements, however, the researchers did not provide any direct intervention to the individuals in this condition (Pfiffner 2014; Evans 2016; Waxmonsky 2016; Qian 2017). One trial did not describe the control group (Meftagh 2014a).
Outcome measures
In the following section, we did not describe the measures used in one study, Tabaeian 2010, as we were not able to identify these reliably from the information provided in the translated report.
Social skills
See Table 2.
| Measures | Description | Number of studies | Ratings | |||
| Teacher | Parent | Child | Observer | |||
| Social Skills Rating Scale (SSRS) | Three‐point Likert scale, ranging from zero (never) to two (often); higher scores indicate better social skills | 9 | ‐ | ‐ | ||
| ‐ | ||||||
| ‐ | ‐ | ‐ | ||||
| ‐ | ‐ | |||||
| ‐ | ‐ | |||||
| ‐ | ‐ | ‐ | ||||
| ‐ | ‐ | ‐ | ||||
| ‐ | ‐ | ‐ | ||||
| ‐ | ‐ | ‐ | ||||
| SSRS: Cooperation Subscale | Three‐point Likert scale, ranging from zero (never) to two (often); higher scores indicate better cooperation | 1 | ‐ | ‐ | ||
| Social Skills Improvement System (SSIS) | Four‐point rating scale, ranging from zero (never) to three (almost always); higher scores indicate better social skills. | 3 | ‐ | ‐ | ||
| ‐ | ‐ | |||||
| ‐ | ‐ | |||||
| Teacher Report ‐ Walker‐McConnell Scale of Social Competence and School Adjustment | Five‐point rating scale, ranging from one (never occurs) to five (frequently occurs); higher scores indicate better social skills | 1 | ‐ | ‐ | ‐ | |
| Weiss Functional Impairment Scale ‐ Parent Form (WFIRS‐P): Social Activities Subscale | Four‐point rating scale, ranging from zero (never or not at all) to three (very often or very much); higher scores indicate better social skills | 1 | ‐ | ‐ | ‐ | |
| Strengths and Difficulties Questionnaire (SDQ): Prosocial Behavior Subscale | Three‐point rating scale, ranging from zero (not true) to two (certainly true); higher scores indicate better social skills. | 1 | ‐ | |||
| Conners Behavior Rating Scale (CBRS): Social Problems Subscale | Four‐point rating scale, ranging from zero (not true at all) to three (very much true); higher scores indicate better social skills | 1 | ‐ | ‐ | ‐ | |
| Social Interaction Observation Code | Recording frequencies of positive, negative or neutral behaviour, including observations of negative behaviour | 1 | ‐ | ‐ | ‐ | |
| Test of Social Skill Knowledge | Scored from one (low knowledge) to 15 (high knowledge); higher scores indicate better social skills | 1 | ‐ | ‐ | ‐ | |
| Observation in Classrooms | Observing children for three × eight‐minute periods during a one‐hour period for two categories of behaviour: play behaviour and social behaviour | 1 | ‐ | ‐ | ‐ | |
| Test of Playfulness: Skillfulness | Four‐point rating scale, ranging from zero (unskilled) to three (highly skilled); higher scores indicate better social skills | 1 | ‐ | ‐ | ‐ | |
Nineteen trials measured social skills using a variety of scales (Cohen 1981; Bloomquist 1991; Pfiffner 1997; MTA 1999; Antshel 2003; Abikoff 2004; Pfiffner 2007; Van der Oord 2007; Waxmonsky 2010; Storebø 2012; Pfiffner 2014; Bul 2016; Evans 2016; Pfiffner 2016; Schramm 2016; Waxmonsky 2016; Wilkes Gillan 2016; Hannesdottir 2017; Qian 2017). Ten trials used the Social Skills Rating Scale (Pfiffner 1997; MTA 1999; Antshel 2003; Abikoff 2004; Pfiffner 2007; Van der Oord 2007; Waxmonsky 2010; Bul 2016; Waxmonsky 2016; Hannesdottir 2017); one trial used the Cooperation Subscale (Bul 2016), whereas the nine remaining trials used the full Social Skills Rating Scale. Three trials used the Social Skills Improvement System (Pfiffner 2014; Evans 2016; Pfiffner 2016). The remaining studies each used different measures to assess social skills.
Seven of the 19 trials used more than one informant to measure social skills: two used teacher, parent and observer ratings (Pfiffner 1997; Abikoff 2004); one used teacher, parent and child ratings (Schramm 2016); and four used teacher and parent ratings (MTA 1999; Antshel 2003; Pfiffner 2014; Bul 2016). Of the 12 remaining trials, nine used only teacher ratings (Bloomquist 1991; Pfiffner 2007; Van der Oord 2007; Waxmonsky 2010; Storebø 2012; Evans 2016; Pfiffner 2016; Waxmonsky 2016; Hannesdottir 2017), two used only observer‐ratings (Cohen 1981; Wilkes Gillan 2016), and one used only parent ratings (Qian 2017).
Emotional competencies
See Table 3.
| Measures | Description | Number of studies | Ratings | |||
| Teacher | Parent | Child | Observer | |||
| Emotion Expression Scale for Children | Five‐point Likert scale, ranging from one (not at all) to five (extremely true); higher scores indicate poorer emotion awareness and greater reluctance to express emotion | 1 | ‐ | ‐ | ‐ | |
| Emotion Regulation Checklist (ERC): Emotion Regulation Subscale | Four‐point rating scale, ranging from one (never) to four (almost always); higher scores indicate better emotional regulation | 1 | ‐ | ‐ | ‐ | |
| Behavior Rating Inventory of Executive Function (BRIEF): Emotion Control Subscale | Three‐point rating scale, ranging from one (never) to three (often); lower scores indicate better emotional control. | 1 | ‐ | ‐ | ‐ | |
| Conners Behavior Rating Scale (CBRS): Emotional Index | Four‐point rating scale, ranging from zero (not true at all) to three (very much true); higher scores indicate better emotional competence | 1 | ‐ | ‐ | ‐ | |
| Strengths and Difficulties Questionnaire (SDQ): Emotional Symptoms Subscale | Three‐point rating scale, ranging from zero (not true) to two (certainly true); higher scores indicate lower emotional competence | 1 | ‐ | |||
| Richman‐Graham Scale | Three‐point rating scale, ranging from zero (no difficulties) to two (occurs frequently). Higher scores indicate lower emotional competence. | 1 | ‐ | ‐ | ‐ | |
Six trials measured emotional competencies, each using a different measure (Cohen 1981; Choi 2015; Storebø 2012; Schramm 2016; Hannesdottir 2017; Qian 2017). Of these, only one trial, Schramm 2016, used ratings from more than one type of informant: teacher, parent and child. The five remaining trials used only parent ratings (Cohen 1981; Hannesdottir 2017; Qian 2017), teacher ratings (Storebø 2012), or child ratings (Choi 2015). No trials used observer ratings.
General behaviour
See Table 4.
| Measures | Description | Number of studies | Ratings | |||
| Teacher | Parent | Child | Observer | |||
| Child Behavior Checklist (CBCL) | Three point rating scale, ranging from zero (not true) to two (often true); lower scores indicate better general behaviour | 1 | ‐ | ‐ | ||
| Clinical Global Impression (CGI) Scale | Seven‐point rating scale, ranging from one (much worse) to seven (much improved); higher scores indicate improved general behaviour | 2 | ‐ | |||
| Disruptive Behavior Disorders Rating Scale: Oppositional Defiant Disorder index (DBDRS‐ODD) | Four‐point Likert scale, ranging from zero (not at all) to three (very much); lower scores indicate better general behaviour | 2 | ‐ | ‐ | ||
| Child Symptom Inventory (CSI): Oppositional Defiant Disorder Subscale | Four‐point rating scale, ranging from zero (never) to three (very often); lower scores indicate better general behaviour | 1 | ‐ | ‐ | ||
| Behavior Rating Inventory of Executive Function (BRIEF) | Three‐point rating scale, ranging from one (never) to three (often); lower scores indicate better general behaviour | 1 | ‐ | ‐ | ‐ | |
| Conners Behavior Rating Scale (CBRS): Conduct Problem Subscale | Four‐point rating scale, ranging from zero (not true at all) to three (very much true); lower scores indicate better general behaviour | 1 | ‐ | ‐ | ||
| CBRS: Aggressiveness Subscale | Four‐point rating scale, ranging from zero (not true at all) to three (very much true); lower scores indicate better general behaviour | 1 | ‐ | ‐ | ‐ | |
| Conners Teacher Rating Scale (CTRS) | Four‐point Likert scale, ranging from zero (not at all true) to three (very true); lower scores indicate better general behaviour | 1 | ‐ | ‐ | ‐ | |
| Strengths and Difficulties Questionnaire (SDQ): Total | Three‐point rating scale, ranging from zero (not true) to two (certainly true); lower scores indicate better general behaviour | 1 | ‐ | ‐ | ‐ | |
| SDQ: Conduct Problems Subscale | Three‐point rating scale, ranging from zero (not true) to two (certainly true); lower scores indicate better general behaviour | 1 | ‐ | |||
| Social Skills Rating Scale (SSRS): Problem Behaviour Subscale | Three‐point Likert scale, ranging from zero (never) to two (often); lower scores indicate better general behaviour | 1 | ‐ | ‐ | ‐ | |
| Self‐Control Rating Scale | Seven‐point continuum, ranging from one (indicating maximum level of self‐control) to seven (indicating maximum level of impulsivity; lower scores indicate better general behaviour | 1 | ‐ | ‐ | ‐ | |
Thirteen trials measured general behaviour using a large variety of measures (Cohen 1981; Bloomquist 1991; MTA 1999; Abikoff 2004; Pfiffner 2007; Waxmonsky 2010; Storebø 2012; Evans 2016; Pfiffner 2016; Schramm 2016; Waxmonsky 2016; Hannesdottir 2017; Qian 2017). Of these 13 trials, six used more than one informant; one used teacher, parent and child ratings (Schramm 2016) and five trials used teacher and parent ratings (Cohen 1981; MTA 1999; Pfiffner 2007; Evans 2016; Pfiffner 2016). Of the seven remaining trials, three apiece used only teacher ratings (Bloomquist 1991; Abikoff 2004; Storebø 2012) or parent ratings (Waxmonsky 2016; Hannesdottir 2017; Qian 2017), and one trial used only observer ratings (Waxmonsky 2010).
Core ADHD symptoms
See Table 5.
| Measures | Description | Number of studies | Studies reporting ratings from: | |||
| Teacher | Parent | Child | Observer | |||
| Disruptive Behavior Disorders Rating Scale (DBDRS) | Four‐point Likert scale, ranging from zero (not at all) to three (very much); lower scores indicate fewer ADHD symptoms | 4 | ‐ | ‐ | ||
| ‐ | ‐ | |||||
| ‐ | ‐ | |||||
| ‐ | ‐ | |||||
| ADHD Rating Scales (ADHD‐RS) | Five‐point Likert scale, ranging from zero (never) to four (almost always); lower scores indicate fewer ADHD symptoms | 2 | ‐ | ‐ | ‐ | |
| ‐ | ‐ | ‐ | ||||
| ADHD‐RS: Hyperactivity and Impulsivity Subscale | Five‐point Likert scale, ranging from zero (never) to four (almost always); lower scores indicate fewer ADHD symptoms | 1 | ‐ | ‐ | ‐ | |
| Child Symptom Inventory (CSI): Inattention Scale | Four‐point rating scale, ranging from zero (never) to three (very often); lower scores indicate fewer ADHD symptoms | 2 | ‐ | ‐ | ||
| ‐ | ‐ | |||||
| Child Symptom Inventory (CSI): ADHD Scale | Four‐point scale (never, sometimes, often, very often); lower scores indicate fewer ADHD symptoms | 1 | ‐ | ‐ | ||
| Conners Teacher Rating Scale (CTRS) | Four‐point Likert scale, ranging from zero (not at all true) to three (very true); lower scores indicate fewer ADHD symptoms. | 2 | ‐ | ‐ | ‐ | |
| ‐ | ‐ | |||||
| Conners Parent Rating Scale (CPRS) | Four‐point Likert scale, ranging from zero (not at all true) to three (very true); lower scores indicate fewer ADHD symptoms | 2 | ‐ | ‐ | ‐ | |
| ‐ | ‐ | ‐ | ||||
| Conners 3: Hyperactivity/impulsivity Scale | Four‐point Likert scale, ranging from zero (not at all true) to three (very much true); lower scores indicate fewer ADHD symptoms | 1 | ‐ | ‐ | ‐ | |
| ADHD Symptom Checklist (Fremdbeurteilungsbogen für Hyperkinetische Störungen) | Four‐point scale ranging from one (not at all) to three (very much); lower scores indicate fewer ADHD symptoms | 1 | ‐ | |||
| Swanson, Nolan and Pelham Teacher Rating Scale (SNAP) | Four‐point rating scale, ranging from zero (not at al) to three (very often); lower scores indicate fewer ADHD symptoms | 1 | ‐ | ‐ | ||
| Child Attention Profile (CAP) | Three‐point rating scale (1 = not true, 2 = sometimes true, 3 = very often true); lower scores indicate fewer ADHD symptoms | 1 | ‐ | ‐ | ‐ | |
| Strengths and Weaknesses of ADHD Symptoms and Normal Behaviors (SWAN) | Seven‐point rating scale, including both positive and negative scores to reflect strengths and weaknesses, ranging from three (far below average) to minus three (far above average). Zero = normal/average | 1 | ‐ | ‐ | ||
| Structured Behavioural Observations | Child behaviour coded as 'on task', 'off task', or 'off task/disruptive'; lower scores indicate fewer ADHD symptoms | 1 | ‐ | ‐ | ‐ | |
| Continuous Performance Test (CPT): Omission Errors | CPT is a computerised test measuring impulse control and attention control based on the child's response to 150 stimuli, including 30 target stimuli. The omission errors reflect degree of inattention; higher score on omission errors indicate higher degree of inattention. | 1 | ‐ | ‐ | ‐ | |
Eighteen trials measured ADHD symptoms using a variety of measures (Bloomquist 1991; Abikoff 2004; MTA 1999; Tutty 2003; Yuk‐chi 2005; Pfiffner 2007; Van der Oord 2007; Waxmonsky 2010; Storebø 2012; Azad 2014; Meftagh 2014a; Pfiffner 2014; Evans 2016; Pfiffner 2016; Schramm 2016; Waxmonsky 2016; Hannesdottir 2017; Qian 2017). Of these 18, 10 trials used ratings from more than one type of informant; 10 trials used both teacher and parent ratings (MTA 1999; Tutty 2003; Yuk‐chi 2005; Pfiffner 2007; Van der Oord 2007; Waxmonsky 2010; Pfiffner 2014; Evans 2016; Pfiffner 2016; Waxmonsky 2016), and one trial apiece used teacher and observer ratings (Bloomquist 1991), parent and observer ratings (Abikoff 2004), or teachers, parents and child ratings (Schramm 2016). Of the five remaining trials, three used only parent ratings (Azad 2014; Hannesdottir 2017; Qian 2017) and one apiece used only teacher ratings (Storebø 2012) or observer ratings ( Meftagh 2014a).
Performance and grades in school
See Table 6.
| Measure | Description | Numbder of studies | Ratings | |||
| Teacher | Parent | Child | Observer | |||
| Classroom Performance Survey (CPS) | Five‐point Likert scale, ranging from one (always) to five (never); higher scores indicate lower performance in school | 1 | ‐ | ‐ | ‐ | |
| Conners Behavior Rating Scale (CBRS): Academic Performance Index; | Four‐point rating scale, ranging from zero (not true at all) to three (very much true); higher scores indicate better performance in school | 1 | ‐ | ‐ | ‐ | |
| Social Skills Improvement System (SSIS): Academic Competence Scale | Four‐point scale, ranging from zero (never) to three (almost always); higher scores indicate better performance in school | 1 | ‐ | ‐ | ‐ | |
| Academic Performance Rating Scale (APRS) | Five‐point Likert scale, ranging from one (never or poor) to five (very often or excellent); higher scores indicate better performance in school | 1 | ‐ | ‐ | ‐ | |
| Wechsler Individual Achievement Test (WIAT) | WIAT is a clinician‐administered performance test including 16 subtests divided between Oral Reading, Math Fluency and Early Reading Skills; higher scores indicate better performance | 1 | ‐ | ‐ | ‐ | |
| German teacher‐rated questionnaire for learning and working behaviour (Arbeitsverhalten Lehrer) | German teacher‐rated questionnaire for learning and working behaviour (Arbeitsverhalten Lehrer is a teacher‐rated scale) | 1 | ‐ | ‐ | ‐ | |
Six trials measured performance and grades in school, each using a different measure (MTA 1999; Waxmonsky 2010; Storebø 2012; Evans 2016; Schramm 2016; Pfiffner 2016). Five of these trials used teacher ratings (Evans 2016; Pfiffner 2016; Storebø 2012; Schramm 2016; Waxmonsky 2010) while one trial used observer ratings (MTA 1999).
Satisfaction with treatment
Ten trials reported on participants', parents', teachers' and/or mental health professionals' satisfaction with the treatment (Pfiffner 1997; MTA 1999; Yuk‐chi 2005; Pfiffner 2007; Waxmonsky 2010; Storebø 2012; Pfiffner 2014; Bul 2016; Pfiffner 2016; Waxmonsky 2016). Four trials used the Consumer Satisfaction Questionnaire, which is rated on a seven‐point Likert scale (Pfiffner 1997; MTA 1999; Yuk‐chi 2005; Pfiffner 2007). One trial, Pfiffner 2016, developed a seven‐item measure (rated on a five‐point Likert scale) specifically for the study. The five remaining trials measured treatment satisfaction using a single‐item question that was rated on a five‐point Likert scale in two trials (Pfiffner 2014; Waxmonsky 2016), a seven‐point Likert scale in one trial (Waxmonsky 2010), and a 10‐point Likert scale in two trials (Storebø 2012; Bul 2016).
Adverse events
Only two trials reported data on adverse events (Storebø 2012; Bul 2016). They assessed adverse events as spontaneous reporting and reported no adverse events.
Funding
Fourteen studies reported funding sources. Two of these were funded by pharmacological companies (Waxmonsky 2010; Bul 2016) and the remaining 12 trials were funded by university national foundations (Cohen 1981; MTA 1999; Tutty 2003; Pfiffner 2007; Storebø 2012; Meftagh 2014a; Pfiffner 2014; Pfiffner 2016; Evans 2016; Waxmonsky 2016; Wilkes Gillan 2016; Qian 2017). Two studies reported that they did not receive any funding for the trials (Choi 2015; Hannesdottir 2017) and we did not find any information on funding for the nine remaining trials (Bloomquist 1991; Pfiffner 1997; Antshel 2003; Abikoff 2004; Yuk‐chi 2005; Van der Oord 2007; Tabaeian 2010; Azad 2014; Schramm 2016).
Excluded studies
We excluded 263 full‐text reports in total. Of these, we excluded 224 clearly irrelevant reports. We formally excluded a further 39 full‐text reports, providing reasons for exclusion in the Characteristics of excluded studies tables. Of these 39 reports, we excluded 23 trials with ineligible interventions, 11 trials with ineligible patient populations, and five trials with ineligible comparators.
Ongoing studies
We included four ongoing trials (NCT01330849; Yang 2015; IRCT201609186834N11; NCT02937142). All trials used different methods to investigate the benefits of different types of social skills training or comparable cognitive behaviour training for children and adolescents with ADHD.
Studies awaiting classification
We included one study awaiting classification (NCT01019252).
Risk of bias in included studies
We assessed the risk of bias of each included trial using the Cochrane 'Risk of bias' tool (Higgins 2011). A summary of our assessment is provided below, and in Figure 2 and Figure 3. Further details can be found in the 'Risk of bias' tables (in the Characteristics of included studies tables). We also drew a funnel plot to visually assess whether the effect was associated with the size of the trial; it seemed to be symmetrical with no clinical significant effect. Eggers’ test, moreover, was not statistically significant (Egger’s regression intercept (bias) = 1.13 (two‐tailed P = 0.17)) in the conclusion of whether or not there was publication bias in the meta‐analysis on this outcome.

Risk of bias summary: review authors' judgements about each risk of bias item for each included study

Risk of bias graph: review authors' judgements about each risk of bias item presented as percentages across all included studies
Allocation
Generation of the allocation sequence
We considered the random sequence generation to be at low risk of bias in 14 trials that assigned allocation by computer‐generated random numbers derived from a table or by the coin‐toss method (MTA 1999; Antshel 2003; Tutty 2003; Abikoff 2004; Yuk‐chi 2005; Pfiffner 2007; Waxmonsky 2010; Storebø 2012; Bul 2016; Evans 2016; Qian 2017; Waxmonsky 2016; Wilkes Gillan 2016; Hannesdottir 2017). We rated 11 trials that did not state the method used to generate the random sequence to be at unclear risk of bias (Cohen 1981; Bloomquist 1991; Pfiffner 1997; Van der Oord 2007; Tabaeian 2010; Azad 2014; Meftagh 2014a; Pfiffner 2014; Choi 2015; Pfiffner 2016; Schramm 2016). We rated no trials at high risk of bias on this domain.
Allocation concealment
We judged 10 trials to be at low risk of bias due to adequate concealment of the allocation (MTA 1999; Antshel 2003; Abikoff 2004; Pfiffner 2007; Waxmonsky 2010; Storebø 2012; Evans 2016; Waxmonsky 2016; Wilkes Gillan 2016; Qian 2017). Fourteen trials did not describe allocation concealment, so we considered them to be at unclear risk of bias (Bloomquist 1991; Pfiffner 1997; Tutty 2003; Yuk‐chi 2005; Van der Oord 2007; Tabaeian 2010; Azad 2014; Meftagh 2014a; Pfiffner 2014; Choi 2015; Bul 2016; Pfiffner 2016; Schramm 2016; Hannesdottir 2017). We rated one trial, Cohen 1981, to be at high risk of bias because four participants were moved between groups after randomisation due to adverse reactions.
Blinding
We do not believe it is possible to blind participants or personnel involved in the delivery of social skills interventions, and consequently, rated all trials at high risk of performance bias.
It is possible, however, to blind those that perform the ratings and observations. Two trials had blinded ratings and observations and we rated them to be at low risk of detection bias (Storebø 2012; Wilkes Gillan 2016). We rated two other trials to be at uncertain risk of detection bias because it was unclear if raters were blinded (Azad 2014; Pfiffner 2014). We rated the remaining 21 trials as having high risk of detection bias since none of them used blinded ratings and observations for all outcomes (Cohen 1981; Bloomquist 1991; Pfiffner 1997; Abikoff 2004; MTA 1999; Antshel 2003; Tutty 2003; Yuk‐chi 2005; Pfiffner 2007; Van der Oord 2007; Waxmonsky 2010; Tabaeian 2010; Meftagh 2014a; Choi 2015; Bul 2016; Evans 2016; Pfiffner 2016; Schramm 2016; Waxmonsky 2016; Hannesdottir 2017; Qian 2017).
Five trials used blinding for at least one outcome, but we did not use these outcomes in our meta‐analyses as they were not outcomes prespecified for our review.
Incomplete outcome data
We rated 16 trials to be at low risk of attrition bias, as they adequately addressed incomplete outcome data (Pfiffner 1997; Antshel 2003; Tutty 2003; Pfiffner 2007; Van der Oord 2007; Tabaeian 2010; Storebø 2012; Azad 2014; Meftagh 2014a; Pfiffner 2014; Bul 2016; Evans 2016; Schramm 2016; Waxmonsky 2016; Wilkes Gillan 2016; Hannesdottir 2017). We assessed five trials to be at high risk of attrition bias (Cohen 1981; Bloomquist 1991; Abikoff 2004; Yuk‐chi 2005; Waxmonsky 2010). Of these five trials, one reported that 22 out of 103 children failed to complete the trial (Abikoff 2004); another permitted up to 50% missing items on indexes, and dropped participants when there were not enough data (Waxmonsky 2010); while the other three trials did not adequately address incomplete outcome data (Cohen 1981; Bloomquist 1991; Yuk‐chi 2005). We considered the remaining four trials to be at unclear of risk of attrition bias due to a lack of information (MTA 1999; Choi 2015; Pfiffner 2016; Qian 2017).
Selective reporting
We rated 13 trials (which had protocols published before the trial started, and reported on all protocol specified outcomes) to be at low risk of reporting bias (Cohen 1981; Bloomquist 1991; Antshel 2003; Tutty 2003; Yuk‐chi 2005; Pfiffner 2007; Van der Oord 2007; Storebø 2012; Meftagh 2014a; Bul 2016; Schramm 2016; Waxmonsky 2016; Hannesdottir 2017). We rated four trials to be at high risk of reporting bias (Pfiffner 1997; Pfiffner 2016; Qian 2017; Waxmonsky 2010). While most trials reported on all outcomes expected to be addressed as described in their published trial protocol, Pfiffner 1997 did not report on two important outcomes (the Swanson, Nolan and Pelham (SNAP) rating scale and the Conners, Loney, and Milich (CLAM) scale used in pre‐ and post‐treatment assessments) and there was an inconsistency between the published report and the description of the trial (protocol) on clinicaltrials.gov in Waxmonsky 2010, Pfiffner 2016 and Qian 2017. We rated the eight remaining trials to be at unclear risk of reporting bias due to a lack of information (MTA 1999; Abikoff 2004; Tabaeian 2010; Azad 2014; Pfiffner 2014; Choi 2015; Evans 2016; Wilkes Gillan 2016): we were unable to find reports on all prespecified outcomes in one trial (MTA 1999); another trial published reports on both the design of the trial and the results simultaneously (Abikoff 2004); another trial registered the protocol retrospectively (after participant enrolment), and did not report on all prespecified outcomes thus making it difficult to assess if there had been selective reporting (Wilkes Gillan 2016); and five trials had no published design report or trial registration and thus no information to assess this domain (Tabaeian 2010; Azad 2014; Pfiffner 2014; Choi 2015; Evans 2016).
Vested interest
We assessed seven trials to be at high risk of bias on this domain because the trial authors were board members in pharmaceutical companies, had received funding from pharmaceutical companies, or had performed previous research on the topic (Abikoff 2004; Pfiffner 2007; Waxmonsky 2010; Choi 2015; Bul 2016; Schramm 2016; Waxmonsky 2016). We rated nine trials to be at unclear risk of bias because of a lack of information on vested interests (Bloomquist 1991; Antshel 2003; Yuk‐chi 2005; Van der Oord 2007; Tabaeian 2010; Azad 2014; Pfiffner 2014; Pfiffner 2016; Qian 2017). We rated the remaining nine trials to be at low risk of bias (Cohen 1981; Evans 2016; Hannesdottir 2017; Meftagh 2014a; MTA 1999; Pfiffner 1997; Storebø 2012; Tutty 2003; Wilkes Gillan 2016).
Other potential sources of bias
We rated 14 trials to be at low risk of other bias due to no other potential risk of bias (MTA 1999; Abikoff 2004; Yuk‐chi 2005; Tabaeian 2010; Azad 2014; Meftagh 2014a; Bul 2016; Evans 2016; Schramm 2016; Wilkes Gillan 2016; Hannesdottir 2017; Qian 2017).
We considered seven trials to be at high risk of other bias (Cohen 1981; Pfiffner 1997; Pfiffner 2007; Pfiffner 2014; Pfiffner 2016; Choi 2015; Waxmonsky 2016). In five of these trials (Pfiffner 1997; Pfiffner 2007; Pfiffner 2014; Pfiffner 2016; Waxmonsky 2016), the families and teachers were paid for doing the assessment at follow‐up, leading to potential bias from those who were prone to this incentive. In Pfiffner 1997, 44% of participants were medicated with stimulant medication, but the number of medicated children in the comparison group was not stated. One trial provided no information about the between‐group balance of stimulant medication (Cohen 1981), and there was no description of the participant selection procedure in another trial (Choi 2015).
With the exception of one trial where all kinds of medication were balanced between groups (MTA 1999), the remaining trials provided no information about any co‐medication for comorbid disorders.
We judged six trials to be at unclear risk of other bias due to a lack of information (Bloomquist 1991; Antshel 2003; Tutty 2003; Van der Oord 2007; Waxmonsky 2010; Storebø 2012).
We assessed all trials to be at high risk of bias overall.
Effects of interventions
See: Summary of findings for the main comparison Social skills training compared to no intervention
We present the results for each of the three primary and four secondary outcomes below. We calculated and presented the effect sizes as SMD and, where possible, as MD. We considered a SMD effect size of: 0.15 or less to have no clinically meaningful effect; 0.15 to 0.40 to have a clinical meaningful but small effect ; 0.40 to 0.75 to have a moderate effect; and greater than 0.75 to have a large treatment effect (Thalheimer 2002). We only used the outcomes from included trials, which we had predefined in our protocol that we wanted to use in this review. For those trials for which we were unable to obtain the necessary data to calculate an effect size, or used outcomes that could not be included in the meta‐analyses, we reported the results in the same way as the original report as single study results. We contacted the authors of 17 trials with unclear or missing data and requested the necessary data (some of them several times) (Bloomquist 1991; Pfiffner 1997; MTA 1999; Antshel 2003; Tutty 2003; Abikoff 2004; Pfiffner 2007; Van der Oord 2007; Tabaeian 2010; Waxmonsky 2010; Azad 2014; Choi 2015; Evans 2016; Pfiffner 2016; Wilkes Gillan 2016; Hannesdottir 2017; Qian 2017). We received information back from eight trial groups (Pfiffner 1997; Antshel 2003; Abikoff 2004; Pfiffner 2007; Waxmonsky 2010; Evans 2016; Wilkes Gillan 2016; Hannesdottir 2017).
For 14 trials, we used all of their outcomes in meta‐analyses (Antshel 2003; Pfiffner 2007; Van der Oord 2007; Tabaeian 2010; Storebø 2012; Meftagh 2014a; Pfiffner 2014; Evans 2016; Pfiffner 2016; Schramm 2016; Waxmonsky 2016; Wilkes Gillan 2016; Qian 2017; Hannesdottir 2017). For seven trials, we reported some outcomes separately and used some in meta‐analyses (Bloomquist 1991; Pfiffner 1997; MTA 1999; Tutty 2003; Abikoff 2004; Yuk‐chi 2005; Waxmonsky 2010). Only Cohen 1981 had no outcomes included in a meta‐analysis; we reported all outcomes from this trial separately.
One of the trials did not report means and SD but P values connected to F values (Cohen 1981). We tried to transform these into SD, but this was not possible because we did not have the necessary between‐group values. For one trial, Pfiffner 2007, we received raw data on the SSRS parent‐ and teacher‐rated scores and used these for calculations.
Primary outcomes
Social skills
Twenty trials reported data on social skills (Bloomquist 1991; Pfiffner 1997; MTA 1999; Antshel 2003; Abikoff 2004; Pfiffner 2007; Van der Oord 2007; Tabaeian 2010; Waxmonsky 2010; Storebø 2012; Pfiffner 2014; Choi 2015; Bul 2016; Evans 2016; Pfiffner 2016; Schramm 2016; Waxmonsky 2016; Wilkes Gillan 2016; Hannesdottir 2017; Qian 2017).
Meta‐analysis results
We combined data from 11 eligible trials in a primary meta‐analysis of teacher‐rated social skills at end of treatment (Pfiffner 1997; MTA 1999; Pfiffner 2007; Van der Oord 2007; Waxmonsky 2010; Storebø 2012; Pfiffner 2014; Bul 2016; Evans 2016; Pfiffner 2016; Schramm 2016). We found no evidence of an effect of the intervention (SMD 0.11, 95% CI −0.00 to 0.22; 11 trials, 1271 participants; I2 = 0%; P = 0.05). We rated the certainty of the evidence as very low certainty due to high risk of bias, inconsistency, and imprecision. The primary outcome, teacher‐rated social skills at end of treatment, corresponds to a MD of 1.22 points on the SSRS scale (95% CI 0.09 to 2.36). The minimal clinical relevant difference (10%) on the SSRS is 10.2.
We tested the robustness of this result by conducting a sensitivity analysis in which we excluded the three trials with the longest treatment duration (MTA 1999; Pfiffner 2014; Evans 2016), and again found no evidence of an effect (SMD 0.11, 95% CI −0.05 to 0.27; eight trials, 620 participants; I2 = 0%; P = 0.17; Analysis 1.1).
We conducted four further secondary meta‐analyses (Analysis 1.2), and found that, compared with no intervention, social skills training:
-
did not improve teacher‐rated social skills at longest follow‐up (SMD 0.06, 95% CI −0.22 to 0.35; three trials, 192 participants, I2 = 0%; P = 0.66; Pfiffner 1997; Storebø 2012; Pfiffner 2014);
-
did improve parent‐rated social skills at end of treatment for all eligible trials (SMD 0.19, 95% CI 0.06 to 0.32; 15 trials, 1609 participants; I2 = 33% ; P = 0.003; very low‐certainty evidence; Pfiffner 1997; Abikoff 2004; MTA 1999; Antshel 2003; Pfiffner 2007; Van der Oord 2007; Waxmonsky 2010; Pfiffner 2014; Bul 2016; Evans 2016; Pfiffner 2016; Schramm 2016; Waxmonsky 2016; Hannesdottir 2017; Qian 2017);
-
did not improve parent‐rated social skills at longest follow‐up (SMD 0.13, 95% CI −0.35 to 0.62; two trials, 445 participants; I2 = 80% ; P = 0.59; Pfiffner 2014; Evans 2016); and
-
did not improve participant‐rated social skills at end of treatment for all eligible trials (SMD 0.28, 95% CI −0.68 to 1.23; five trials, 344 participants; I2 = 92%; P = 0.57; Abikoff 2004; Antshel 2003; Tabaeian 2010; Choi 2015; Schramm 2016).
We conducted the analyses using a random‐effects model, and obtained similar results when repeating the analyses using a fixed‐effect model.
Single study results
Below, we present the data from six studies, which assessed social skills using different measures and thus could not be included in the aforementioned meta‐analyses (Cohen 1981; Bloomquist 1991; Pfiffner 1997; Abikoff 2004; Tabaeian 2010; Wilkes Gillan 2016).
The Cohen 1981 trial reported no significant group differences from observing children for three eight‐minute periods during a one‐hour period for two categories of behaviour in classrooms: play behaviour and social behaviour.
The Wilkes Gillan 2016 trial reported improved observer‐rated social skills at end of treatment for all eligible trials (SMD 2.88, 95% CI 1.80 to 3.96; one trial, 29 participants; P < 0.001; Analysis 1.2.4).
The Tabaeian 2010 trial reported a significant difference between the groups in favour of participant‐rated social skills at longest follow‐up (SMD 1.60, 95% CI 0.77 to 2.44; one trial, 30 participants; P=0.0002; Analysis 1.2.6).
The Bloomquist 1991 trial found no significant difference between the groups for social skills assessed using the teacher‐reported version of the Walker‐McConnell Scale of Social Competence and School Adjustment (five‐point scale ranging from 'never occurs' to 'frequently occurs'; higher scores indicate better social skills): MD 1.06 points, 95% CI −0.47 to 2.59; one trial, 46 participants; P = 0.18; Analysis 1.3.(fixed‐effects analysis).
The Pfiffner 1997 trial found evidence of a large treatment effect in favour of social skills training using the parent‐rated Social Skills Scale (UCI) UC Irvine Health Child Development School (higher scores indicate better social skills): MD 9.70 points, 95% CI 6.07 to 13.33; one trial, 18 participants; P < 0.001; Analysis 1.4. Pfiffner 1997 also found a significant difference between the groups when using the child‐rated Test of Social Skill Knowledge (scored by blinded raters; ranging from one (low knowledge) to 15 (high knowledge); higher scores indicate better social skills): MD 4.20 points, 95% CI 1.99 to 6.41; one trial, 18 participants; P < 0.001; Analysis 1.5.
Abikoff 2004 reported no significant difference between the groups in negative behaviour assessed by the Social Interaction Observation Code, which records the frequency of positive, negative, or neutral behaviour, including observations of negative behaviour (higher scores equate to more negative behaviour) (MD 0.20 points, 95% CI ‐0.11 to 0.51; one trial, 68 participants; P = 0.21; Analysis 1.6).
Emotional competencies
Five trials reported data on emotional competencies (Storebø 2012; Choi 2015; Schramm 2016; Hannesdottir 2017; Qian 2017).
Meta‐analysis results
We combined data from two trials in a meta‐analysis (Storebø 2012; Schramm 2016). We found no evidence of an effect of the intervention for the primary meta‐analysis of teacher‐rated emotional competencies at end of treatment (SMD −0.02, 95% CI −0.72 to 0.68; two trials, 129 participants; I2 = 74%; P = 0.96; Analysis 2.1). We rated the certainty of the evidence as very low due to high risk of bias, inconsistency, and imprecision.
We also conducted two secondary meta‐analyses (Analysis 2.2), and found no evidence of an effect of the intervention on:
-
parent‐rated emotional competencies (SMD −0.27, 95% CI −0.59 to 0.05; three trials, 173 participants; I2 = 8%; P = 0.09; Schramm 2016; Hannesdottir 2017; Qian 2017);
-
participant‐rated emotional competencies (SMD −0.27, 95% CI −0.62 to 0.09; two trials, 125 participants; I2 = 0% ; P = 0.14; Choi 2015; Schramm 2016).
We conducted the analyses using a random‐effects model, and obtained similar results when repeating the analyses using a fixed‐effect model.
Single study results
The Storebø 2012 trial reported parent‐rated emotional competencies at longest follow‐up (SMD 0.19, 95% CI −0.34 to 0.72; one trial, 56 participants; P = 0.49).
General behaviour
Eleven trials reported data on general behaviour (Bloomquist 1991; MTA 1999; Abikoff 2004; Pfiffner 2007; Storebø 2012; Evans 2016; Pfiffner 2016; Schramm 2016; Waxmonsky 2016; Hannesdottir 2017; Qian 2017).
Meta‐analysis results
We combined data from eight trials in a meta‐analysis (Bloomquist 1991; MTA 1999; Abikoff 2004; Storebø 2012; Evans 2016; Pfiffner 2016; Schramm 2016; Waxmonsky 2016). We found no evidence of an effect for the primary meta‐analysis of teacher‐rated general behaviour at the end of treatment (SMD −0.06, 95% CI −0.19 to 0.06; eight trials, 1002 participants; I2 = 0%; P = 0.33; Analysis 3.1). We rated the quality of the evidence as low due to high risk of bias, inconsistency, and imprecision.
We tested the robustness of this result by conducting two sensitivity analyses, both of which found no evidence of an effect:
-
sensitivity analysis excluding the two trials with the longest treatment duration (MTA 1999; Evans 2016): SMD −0.09, 95% CI −0.28 to 0.10; six trials, 422 participants; I2 = 0%; P = 0.36; and
-
sensitivity analysis excluding the two largest trials (MTA 1999; Evans 2016): SMD −0.09, 95% CI −0.28 to 0.10; six trials, 422 participants; I2 = 0%; P = 0.36.
We also conducted two secondary meta‐analyses (Analysis 3.2), and found that, compared with no intervention, social skills training:
-
did not improve teacher‐rated general behaviour at longest follow‐up (SMD −0.10, 95% CI −0.27 to 0.07; four trials, 637 participants; I2 = 7% ; P = 0.24; Bloomquist 1991; MTA 1999; Storebø 2012; Evans 2016);
-
did improve parent‐rated general behaviour at end of treatment (SMD −0.38, 95% CI −0.61 to −0.14; eight trials, 995 participants; I2 = 64%; P = 0.002; very low‐quality evidence; MTA 1999; Storebø 2012; Evans 2016; Pfiffner 2016; Schramm 2016; Waxmonsky 2016; Hannesdottir 2017; Qian 2017).
We conducted the analyses using a random‐effects model, and obtained similar results when repeating the analyses using a fixed‐effect model.
Single study results
The Pfiffner 2007 trial measured general behaviour using parent and teacher ratings of the Clinical Global Impression Scale, and found that the intervention group showed significantly greater improvement than the control group (parents: F1, 51 = 28.46, P < 0.001; teachers: F1, 51 = 11.73, P = 0.001; one trial, 69 participants).
The Evans 2016 trial reported parent‐rated general behaviour at longest follow‐up (SMD −0.21, 95% CI 0.44 to 0.03; one trial; 326 participants; P = 0.08).
The Schramm 2016 trial reported participant‐rated general behaviour at end of treatment (SMD −0.07, 95% CI −0.52 to 0.38; one trial, 76 participants; P = 0.76).
Secondary outcomes
Core ADHD symptoms
Nineteen trials reported data on ADHD symptoms (Bloomquist 1991; Tutty 2003; Abikoff 2004; MTA 1999; Yuk‐chi 2005; Pfiffner 2007; Van der Oord 2007; Tabaeian 2010; Waxmonsky 2010; Storebø 2012; Azad 2014; Meftagh 2014a; Pfiffner 2014; Evans 2016; Pfiffner 2016; Schramm 2016; Waxmonsky 2016; Hannesdottir 2017; Qian 2017).
Meta‐analysis results
We combined data from 14 eligible trials in a meta‐analysis of the primary meta‐analysis of teacher‐rated ADHD symptoms at end of treatment (Bloomquist 1991; Abikoff 2004; MTA 1999; Yuk‐chi 2005; Van der Oord 2007; Waxmonsky 2010; Storebø 2012; Pfiffner 2014; Evans 2016; Pfiffner 2016; Schramm 2016; Waxmonsky 2016; Hannesdottir 2017; Qian 2017). We found evidence of an effect in favour of the intervention (SMD −0.26, 95% CI −0.47 to −0.05; 14 trials, 1379 participants; I2 = 69%; P = 0.02; Analysis 4.1). We rated the quality of the evidence as very low due to high risk of bias, inconsistency, and imprecision.
We tested the robustness of this result by conducting two sensitivity analyses, both of which showed no evidence of an effect:
-
sensitivity analysis excluding the three trials with the longest treatment duration (MTA 1999; Pfiffner 2014; Evans 2016): SMD −0.24, 95% CI −0.52 to 0.04; 11 trials, 677 participants, I2 = 69%; P = 0.10); and
-
sensitivity analysis excluding the three largest trials (MTA 1999; Pfiffner 2014; Evans 2016): SMD −0.24, 95% CI −0.52 to 0.04; 11 trials, 677 participants; I2 = 69%; P = 0.10).
We also drew a funnel plot to visually assess whether the effect was associated with the size of the trial; it seemed to be symmetrical with no clinically significant effect. Eggers’ test, moreover was not statistically significant (Egger’s regression intercept (bias) = 0.40 (two‐tailed P = 0.78)) for the conclusion whether or not there was publication bias in the meta‐analysis for this outcome.
We conducted five further secondary meta‐analyses (Analysis 4.2), and found that, compared with no intervention, social skills training:
-
did not reduce teacher‐rated ADHD symptoms at longest follow‐up (SMD −0.11, 95% CI −0.28 to 0.06; five trials, 582 participants; I2 = 0%; P = 0.20; Bloomquist 1991; Yuk‐chi 2005; Storebø 2012; Pfiffner 2014; Evans 2016);
-
did reduce parent‐rated ADHD symptoms at end of treatment for all eligible trials (SMD −0.54, 95% CI −0.81 to −0.26; 11 trials, 1206 participants; I2 = 79%; P < 0.001; very low‐quality evidence; Tutty 2003; Abikoff 2004; MTA 1999; Yuk‐chi 2005; Pfiffner 2007; Van der Oord 2007; Waxmonsky 2010; Azad 2014; Pfiffner 2014; Evans 2016; Schramm 2016);
-
did reduce parent‐rated ADHD symptoms at longest follow‐up (SMD −1.36, 95% CI −2.48 to −0.25; three trials, 476 participants; I2 = 95%; P = 0.02; Azad 2014; Pfiffner 2014; Evans 2016);
-
did not reduce participant‐rated ADHD symptoms at end of treatment (SMD −0.77, 95% CI −2.31 to 0.78; two trials, 106 participants; I2 = 91%; P = 0.33; Tabaeian 2010; Schramm 2016); and
-
did not reduce observer‐rated ADHD symptoms at end of treatment for all eligible trials (SMD −3.15, 95% CI ‐9.88 to 3.57; two trials, 107 participants; I2 = 98%; P = 0.36; Meftagh 2014a; Schramm 2016).
We conducted the analyses using a random‐effects model. We obtained similar results when repeating the analyses using a fixed‐effect model, except for sensitivity analyses 4.1.2 and 4.1.3, both of which showed a statistical significant effect when analysed with fixed‐effect model. However, the random‐effects model is more appropriate because of the heterogeneity in these analyses.
Single study results
The Meftagh 2014a trial found a significant difference between groups for observer‐rated ADHD symptoms at longest follow‐up (SMD 3.95, 95% CI 2.66 to 5.23; one trial, 30 participants; P < 0.001).
The MTA 1999 trial found no significant difference between the groups on teacher‐rated ADHD symptoms (inattention) at end of treatment (SMD 0.01, 95% CI −0.23 to 0.26; one trial, 254 participants; P = 0.92).
The Pfiffner 2007 trial also found no significant difference between the groups on teacher‐rated ADHD symptoms (sluggish cognitive tempo) at end of treatment (SMD −0.29, 95% CI −0.78 to 0.20; one trial, 66 participants; P = 0.24).
The Tabaeian 2010 trial found a significant difference between groups on participant‐rated ADHD symptoms at longest follow‐up (SMD 1.62, 95% CI 0.78 to 2.46; one trial, 30 participants; P < 0.001).
Performance and grades in school
Five trials measured performance in school (MTA 1999; Waxmonsky 2010; Storebø 2012; Evans 2016; Pfiffner 2016).
Meta‐analysis results
We pooled the data in a meta‐analysis and found that social skills training did not improve teacher‐rated performance in school at end of treatment (SMD 0.15, 95% CI ‐0.01 to 0.31; five trials, 642 participants; I2= 0% ; P = 0.07; Analysis 5.1; Waxmonsky 2010; Storebø 2012; Evans 2016; Schramm 2016, Pfiffner 2016) or at longest follow‐up (SMD −0.01, 95% CI −0.22 to 0.20; two trials, 379 participants; I2 = 0%; P = 0.92; Analysis 5.2; Storebø 2012; Evans 2016).
We conducted the analyses using a random‐effects model, and obtained similar results when repeating the analyses using a fixed‐effect model.
Single study results
The MTA 1999 trial found no significant difference between groups for observer‐rated performance in school (MD 1.50 points, 95% CI −2.06 to 5.06; measured using Wechsler Individual Achievement Test (WIAT); (higher score indicates better performance); one trial, 260 participants; P = 0.41; Analysis 6.1).
Participant or parent (or both) satisfaction with the treatment
Four trials (233 participants) measured satisfaction with treatment (Pfiffner 1997; Pfiffner 2007; Waxmonsky 2010; Yuk‐chi 2005). Although satisfaction with treatment was high in all four trials, two trials found no significant difference between the intervention and controI groups (Pfiffner 1997; Waxmonsky 2010), and two trials did not report on differences between the groups (Pfiffner 2007; Yuk‐chi 2005).
Adverse events
Only two trials (226 participants) reported data on adverse events (Storebø 2012; Bul 2016).They assessed adverse events as spontaneous reporting and reported no adverse events in the trial.
Trial Sequential Analysis (TSA)
We conducted a TSA of the primary outcome, social skills rated by teachers at end of treatment, with data from four trials (Pfiffner 1997; Pfiffner 2007; Van der Oord 2007; Waxmonsky 2010). Using an a priori assumption that the minimal relevant clinical intervention effect was 4.0 points, we found that the intervention effect almost reached the futility area (between the two widening dotted red lines), possibly signalling that the social skills intervention had no effect on teacher‐rated social skills at the end of treatment (MD 1.80, 95% CI ‐1.01 to 4.62; four trials, 185 participants; Analysis 7.1; Figure 4). We used a power of 90% in the analysis and this gives a maximum type II error of 10%, and therefore there is a 10% risk of overlooking a true effect.
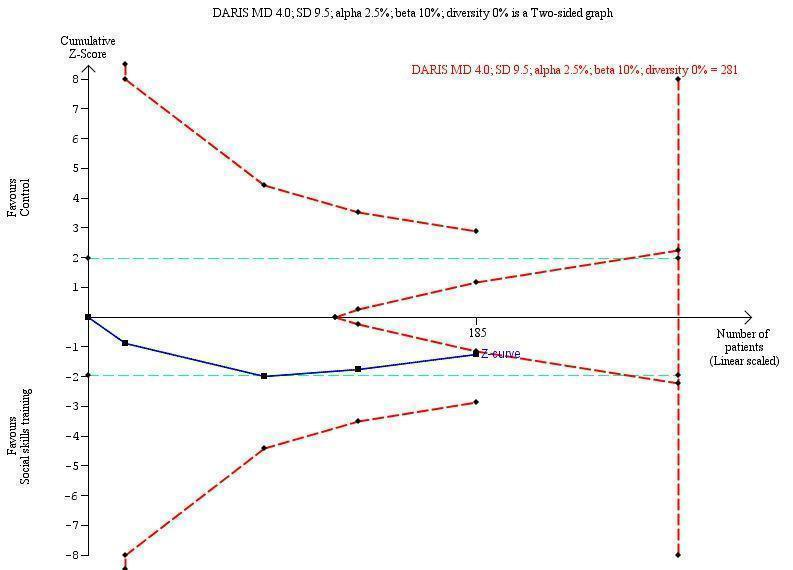
Trial Sequential Analysis of teacher‐rated social skills ‐ SSRS
Footnotes
DARIS: diversity‐adjusted required information size
MD: mean difference
SSRS: Social Skills Rating Scale
We also conducted a post hoc TSA of social skills rated by teachers for all eligible trials; 11 trials in total provided data (Pfiffner 1997; MTA 1999; Pfiffner 2007; Van der Oord 2007; Waxmonsky 2010; Storebø 2012; Pfiffner 2014; Bul 2016; Evans 2016; Pfiffner 2016; Schramm 2016). To do this, we transformed the MD and SD from the different rating scales used in this analysis to the MD and SD of a commonly used scale, namely the SSRS, using the following formula: MD = SMD*SD (Thorlund 2011). In the TSA we found that the cumulative z scores (blue line) crossed into the areas of futility (in between the two widening dotted red lines) (SMD 0.11, 95% CI −0.00 to 0.22; 11 trials, 1271 participants; Analysis 7.1; Figure 5).
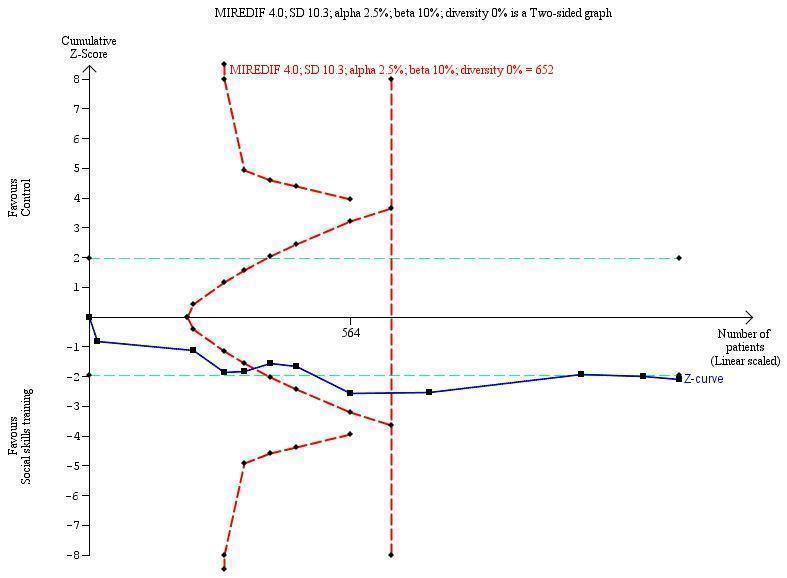
Trial Sequential Analysis of teacher‐rated social skills ‐ all studies transformed to SSRS
Footnotes
MIREDIF: minimum relevant difference
SD: standard deviation
SSRS: Social Skills Rating Scale
Subgroup analyses
We performed five subgroup analyses, none of which showed significant differences in intervention effects.
-
Children aged five to 11 years compared to children aged 12 to 18 year:
Teacher‐rated social skills at end of treatment: children aged five to 11 years (10 trials, 1194 participants: Pfiffner 1997; MTA 1999; Pfiffner 2007; Van der Oord 2007; Waxmonsky 2010; Storebø 2012; Pfiffner 2014; Bul 2016; Evans 2016; Pfiffner 2016) compared to children aged 12 to 18 years (one trial, 77 participants: Schramm 2016). Test for subgroup differences: Chi2 = 0.06, df = 1 (P = 0.81), I2 = 0%; Analysis 8.1.
-
ADHD with comorbidity compared to ADHD without comorbidity:
Parent‐rated ADHD symptoms at end of treatment: ADHD with comorbidity (eight trials, 1003 participants: Abikoff 2004; MTA 1999; Yuk‐chi 2005; Pfiffner 2007; Van der Oord 2007; Waxmonsky 2010; Pfiffner 2014; Evans 2016) compared to ADHD without comorbidity (two trials, 173 participants: Tutty 2003; Schramm 2016). Test for subgroup differences: Chi2 = 0.10, df = 1 (P = 0.75), I2 = 0%; Analysis 9.1.
-
Social skills training only compared to social skills training supported by parent training:
Teacher‐rated social skills at end of treatment: social skills training only (four trials, 336 participants: Pfiffner 1997; Pfiffner 2014; Bul 2016; Evans 2016) compared to social skills training supported by parent training (four trials, 632 participants: Pfiffner 1997; Storebø 2012; Pfiffner 2014; Schramm 2016). Test for subgroup differences: Chi2 = 0.16, df = 1 (P = 0.69), I2 = 0%; Analysis 10.1.
-
Social skills training, parent training and medication compared to social skills training and parent training without medication:
Parent‐rated social skills at end of treatment: social skills training, parent training and medication (four trials, 299 participants: Abikoff 2004; Antshel 2003; Waxmonsky 2010; Waxmonsky 2016) compared to social skills training and parent training without medication (four trials, 337 participants: Pfiffner 1997; Pfiffner 2007; Pfiffner 2014; Pfiffner 2016). Test for subgroup differences: Chi2 = 2.61, df = 1 (P = 0.11), I2 = 61.6%; Analysis 11.1.
-
No‐intervention control group compared to waiting‐list control group with possible minor active intervention components:
Teacher‐rated social skills at end of treatment: no‐intervention control group (eight trials, 693 participants: Pfiffner 1997; MTA 1999; Pfiffner 2007; Van der Oord 2007; Waxmonsky 2010; Storebø 2012; Bul 2016; Schramm 2016) compared to waiting‐list control group with possible minor active intervention components (three trials, 578 participants: Pfiffner 2014; Evans 2016; Pfiffner 2016). Test for subgroup differences: Chi2 = 0.02, df = 1 (P = 0.89), I2 = 0%; Analysis 12.1.
We conducted the analyses using a random‐effects model, and obtained similar results when repeating the analyses using a fixed‐effect model.
Single study result
One trial (576 participants) reported on subgroup analyses comparing children with ADHD only to children with ADHD and comorbid anxiety disorder (MTA 1999). This analysis found significant differences in teacher‐rated hyperactivity/impulsivity (F = 1.64, P = 0.04) and teacher‐rated social skills (F = 1.68, P = 0.03) between the two subgroups of children in connection with all four active treatments used in this trial. The subgroup with ADHD and comorbidity of anxiety disorder showed better results (MTA 1999).
Discussion
We conducted this systematic review to examine the effects of social skills training for children and adolescents with ADHD. We considered a total of 313 full‐text reports from which we included 25 trials published in 45 articles in this review. Of these 25 trials, we used the results from 24 in meta‐analyses.
Summary of main results
We included 25 trials published in 45 reports. Altogether these trials randomised 2690 participants. All trials included children aged between five and 13 years, except for a single study which included adolescents between 12 and 17 years of age. The duration of the trials ranged from five weeks to two years. Most were conducted in outpatient clinics in the USA, Asia, and Europe. We assessed all trials as having high risk of bias, which might lead to systematic errors: overestimation of benefits and underestimation of harms. We considered the parent‐rated findings to be more questionable than our primary analyses, which were based on teacher‐rated outcomes, due to high risk of systematic errors (lack of blinding) in the parent‐rated outcomes (Daley 2014b).
In accordance with the Cochrane Handbook for Systematic Reviews of Interventions (Higgins 2011), we combined all relevant trials in a meta‐analysis to investigate common features of treatment effects. We found no significant differences between the group given social skills training and the groups given no intervention or assigned to a waiting list. There was a beneficial effect on some of the parent‐rated primary outcomes and the secondary outcome of teacher‐rated ADHD symptoms at end of treatment, but the finding was questionable due to lack of support from sensitivity analyses with low clinical significance and low‐certainty evidence. We found no indications of harmful effects.
We presented all results using the random‐effects model, thus giving more weight to smaller trials; however, the conclusions on the effect of intervention did not change when we applied a fixed‐effect model. Thus, we conclude that the observed statistical heterogeneity does not seem to be of importance for the results of the present review.
Overall completeness and applicability of evidence
We were able to include most of the data from the trials in our meta‐analyses, which provides a good basis for the evidence in this review. However, the interventions might be considered too heterogeneous to combine in a meta‐analysis and the multiplicity of different outcome measures might limit the external validity of this review. We found a small treatment effect for some of the outcomes, but all of the trials were at high risk of bias.
Components and duration of the interventions
All but three trials (Cohen 1981; Pfiffner 1997; Antshel 2003) used manual‐based interventions. The social skills interventions in the trials were, in general, cognitive behaviour‐based treatments but varied in form, content, and in the use of specific behaviour techniques. Most manuals were structured around specific themes, with most trials focusing on problem‐solving and emotion regulation and a few trials focusing more specifically on academic organisational skills (Evans 2016) or play skills (Wilkes Gillan 2016).
The duration of the treatment also differed greatly, from five weeks to 24 months. However, there were no differences in the results when we excluded the study with the longest intervention from the analyses of social skills and ADHD symptoms.
Parent training
Most trials included specific parent training in the social skills intervention. One study involved parents before the onset of training (Hannesdottir 2017) or as part of the first or last session (Qian 2017), in order that parents might understand the concept of the training and be able to support the children in home assignments or in applying what they learned at home. Other trials did not describe parental involvement in the training (Azad 2014; Meftagh 2014a; Choi 2015; Bul 2016; Evans 2016).
Teacher training
More than half of the trials included teacher training or teacher consultations as part of the social skills training. The inherent differences in the interventions accorded with this review's inclusion criteria (criteria for considering studies for this review), but were likely to produce heterogeneity in the analysis.
Treatment effects
Although the measurable beneficial effects of social skills training were small and questionable due to the low certainty of the evidence, participant, parent, and teacher satisfaction with the intervention was overall in the positive direction, as the level of satisfaction was rated as high in all of the included studies. However, in half of the trials measuring this outcome, there was no significant difference in the level of satisfaction when comparing the experimental and control group. The other half of the trials did not report on between‐group differences. This is a problem as participant satisfaction with treatment is often used as an argument for this kind of treatment.
In the MTA 1999 trial, the multimodal treatment had a superior treatment effect on children with ADHD and comorbid anxiety disorder compared to those without that comorbidity. This was an interesting subgroup finding and suggested that future trials on this topic should investigate these findings further by planning for subgroup analyses on children with and without comorbid anxiety disorder. Moreover, we know very little about the effects of social skills training in adolescents.
Limitations of the evidence
In all meta‐analyses that achieved significant findings with 95% confidence intervals, the findings could be due to bias and overestimation of beneficial intervention effects. We conducted TSA to control the risk of type I and type 2 errors and to estimate how far we were from obtaining the diversity adjusted required information size (DARIS) to detect or reject a certain plausible intervention effect. Moreover, the TSAs showed that the observed intervention effects could be due to type I errors. This highlights the need for more clinical research on this topic without risks of bias. Both the a priori and post hoc TSA showed that there is a need for more participants in order to reach a firm conclusion in the meta‐analyses.
A serious limitation of these types of trials was the lack of blinding or inability to blind. This introduced a high risk of bias in the assessment of outcomes (Schultz 1995; Kjaergard 2002; Wood 2008; Savovíc 2012; Savovic 2018). Statistical heterogeneity was low (0%) in most meta‐analyses, most likely due to inherent features of the trials leading to wide CIs of the estimates, and therefore was not mirroring the clinical and methodological heterogeneity.
RCTs are generally considered to be the highest level of evidence, but most of the trials included in this systematic review were at high risk of bias and the vast majority were at high risk of random errors due to their low sample sizes. Generally, we rated the certainty of the evidence as low or very low using the GRADE approach (GRADE Working Group), downgrading the certainty of the evidence by two or three levels due to high risk of bias, imprecision and inconsistency. Further research may change the estimates of the treatment effect, but such trials ought to be conducted without risk of systematic errors (bias), random errors (play of chance), and design errors (Keus 2010).
Quality of the evidence
Our review has some limitations. Our results were based on only 25 trials with a limited number of participants (n = 2690). Many of the trials were prone to selection bias due to unclear or inadequate generation of the allocation sequence or allocation concealment. All 25 trials had an overall assessment as having 'high risk of bias', so our results might not be robust and reliable (Figure 2).
Funnel Plots
We drew funnel plots of the following two outcomes for all eligible trials to visually assess whether effects were associated with the size of the study: 1) teacher‐rated social skills and 2) teacher‐rated ADHD symptoms. Both outcomes seemed to be symmetrical with no clinically significant effect. An Eggers’ test for both the outcomes was not statistically significant so we were unable to conclude whether or not there was publication bias in the meta‐analysis of these outcomes.
There is, therefore, currently insufficient evidence to draw any conclusions about any form of social skills training as having an effect on ADHD patients.
The important methodological limitations, which have been elaborated above, reduced the reliability of the results of most of the trials included in this review.
Potential biases in the review process
We sought to minimise potential biases in the review process in the following ways. We published a protocol before we embarked on the review itself. We conducted extensive searches of relevant databases. Two review authors, working independently, selected trials for inclusion and extracted data. Disagreements were resolved by discussion with team members. We assessed risk of bias in all trials according to the recommendations provided in Chapter 8 of the Cochrane Handbook for Systematic Reviews of Interventions (Higgins 2011). We recognise, however, that there are some limitations in the review process. In particular, we did not assess quality of life as an outcome and we defined serious adverse events as a secondary outcome when it should have been a primary outcome (though these were reported in the review). Furthermore, we believe that the outcomes of emotional competencies and general behaviour should have been secondary outcomes; we will change this in the next update of this review. Conduct disorder was used in two out of the 10 trials that were included in the analysis of general behaviour, and we took the decision to include this in a meta‐analysis of the impact of social skills training on behaviour more generally. Some might take issue with this, but we believe this was a sensible approach.
Agreements and disagreements with other studies or reviews
Four earlier meta‐analyses examined the effects of social skills training for children with ADHD. Two of these concluded that there was no effect of social skills training for children with ADHD (Kavale 1997; Van der Oord 2008); the other two concluded that there was a beneficial effect (De Boo 2007; Majewicz‐Hefley 2007). The obvious limitation of all four reviews is that all are at least 10 years old, and suffer from several methodological weaknesses; for example, none of these reviews evaluated systematic errors (bias) in the included trials. The conclusion in this update reinforces the conclusion in our original review where we wrote that "there is little evidence to support or refute social skills training for adolescents with ADHD (Storebø 2011). There is need for more trials, with low risk of bias and with a sufficient number of participants, investigating the efficacy of social skills training versus no training for both children and adolescents." (Storebø 2011). A new systematic review published in 2019 investigating the effectiveness of stand‐alone social skills training for youth with ADHD concluded that social skills training implemented without additional treatment components like parent support, showed improvements on some areas of social functioning (Willis 2019). However, this review suffered from a very limited search strategy and did not evaluate systematic errors (bias) in the included trials.
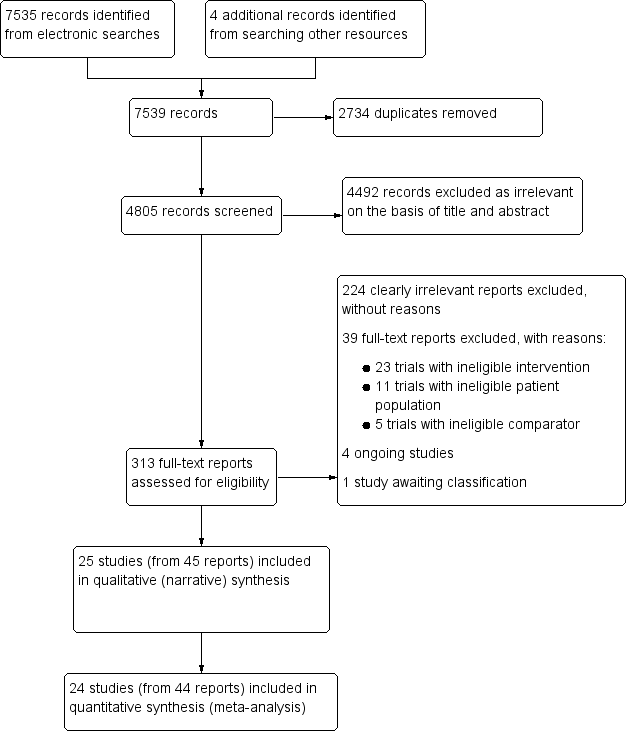
Study flow diagram.

Risk of bias summary: review authors' judgements about each risk of bias item for each included study

Risk of bias graph: review authors' judgements about each risk of bias item presented as percentages across all included studies

Trial Sequential Analysis of teacher‐rated social skills ‐ SSRS
Footnotes
DARIS: diversity‐adjusted required information size
MD: mean difference
SSRS: Social Skills Rating Scale

Trial Sequential Analysis of teacher‐rated social skills ‐ all studies transformed to SSRS
Footnotes
MIREDIF: minimum relevant difference
SD: standard deviation
SSRS: Social Skills Rating Scale
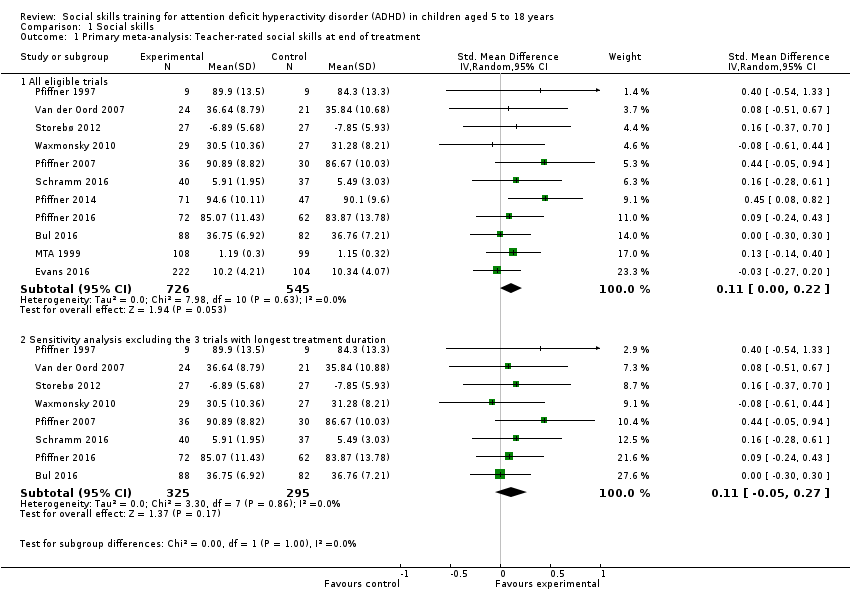
Comparison 1 Social skills, Outcome 1 Primary meta‐analysis: Teacher‐rated social skills at end of treatment.

Comparison 1 Social skills, Outcome 2 Secondary meta‐analyses: Social skills.
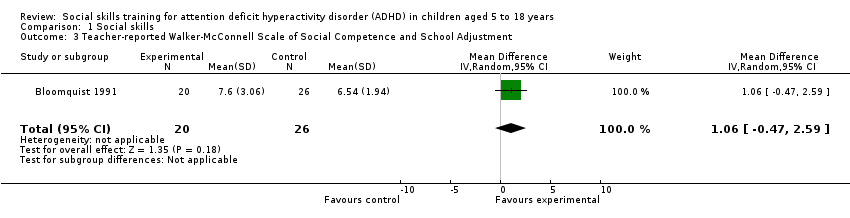
Comparison 1 Social skills, Outcome 3 Teacher‐reported Walker‐McConnell Scale of Social Competence and School Adjustment.

Comparison 1 Social skills, Outcome 4 Parent‐rated Social Skills Scale (UCI).

Comparison 1 Social skills, Outcome 5 Child‐rated Test of Social Skill Knowledge.
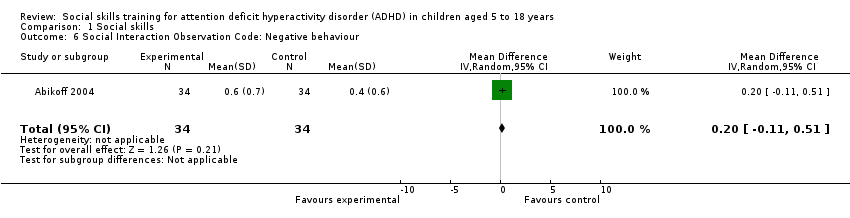
Comparison 1 Social skills, Outcome 6 Social Interaction Observation Code: Negative behaviour.
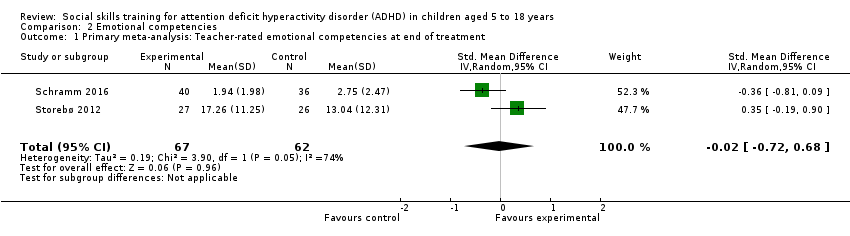
Comparison 2 Emotional competencies, Outcome 1 Primary meta‐analysis: Teacher‐rated emotional competencies at end of treatment.
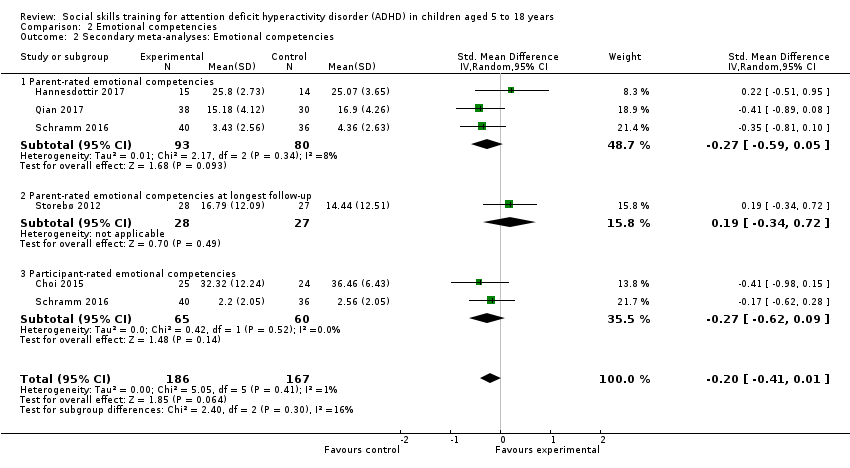
Comparison 2 Emotional competencies, Outcome 2 Secondary meta‐analyses: Emotional competencies.

Comparison 3 General behaviour, Outcome 1 Primary meta‐analysis: Teacher‐rated general behaviour at end of treatment.

Comparison 3 General behaviour, Outcome 2 Secondary analyses: general behaviour.
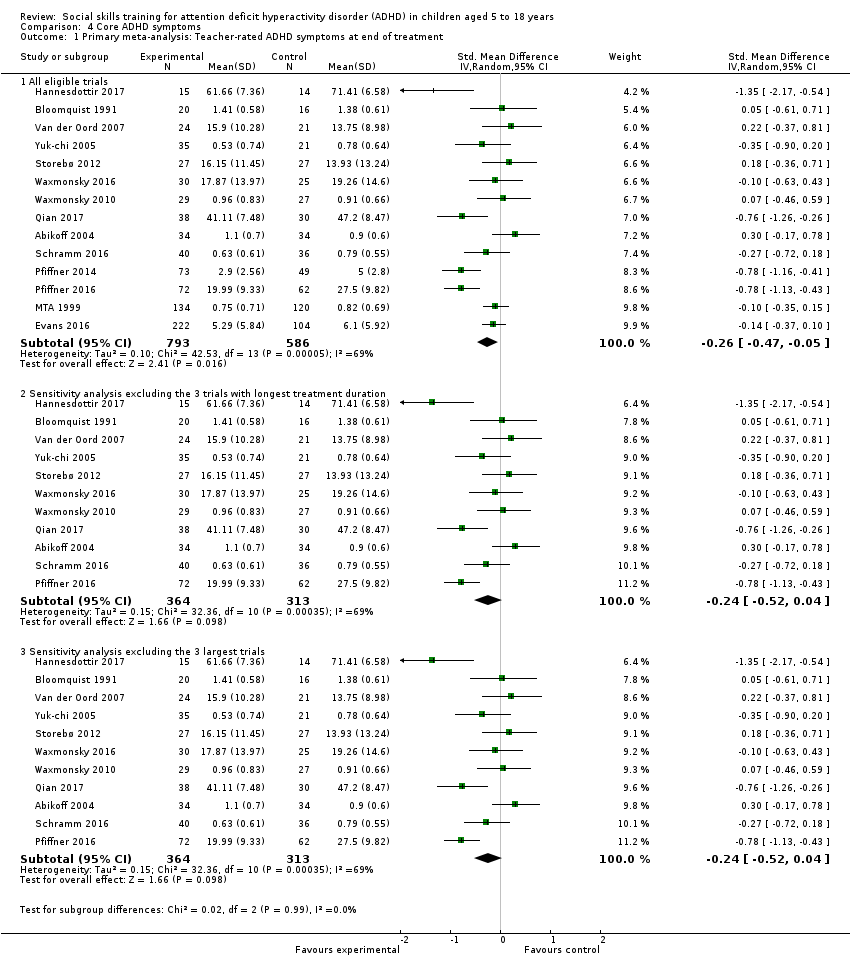
Comparison 4 Core ADHD symptoms, Outcome 1 Primary meta‐analysis: Teacher‐rated ADHD symptoms at end of treatment.

Comparison 4 Core ADHD symptoms, Outcome 2 Secondary meta‐analyses: ADHD symptoms.

Comparison 5 Teacher‐rated performance and grades in school, Outcome 1 At end of treatment.

Comparison 5 Teacher‐rated performance and grades in school, Outcome 2 At longest follow‐up.
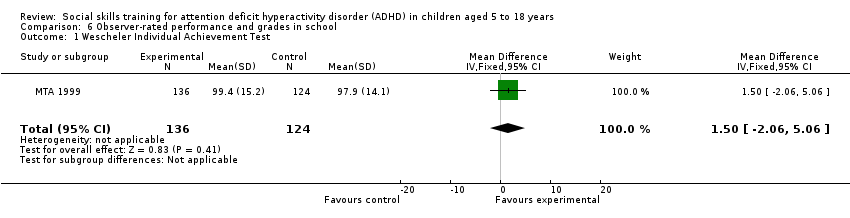
Comparison 6 Observer‐rated performance and grades in school, Outcome 1 Wescheler Individual Achievement Test.

Comparison 7 TSA, Outcome 1 Teacher‐rated social skills.

Comparison 8 Subgroup analysis 1: Children aged five to 11 years versus children aged 12 to 18 years, Outcome 1 Teacher‐rated social skills.
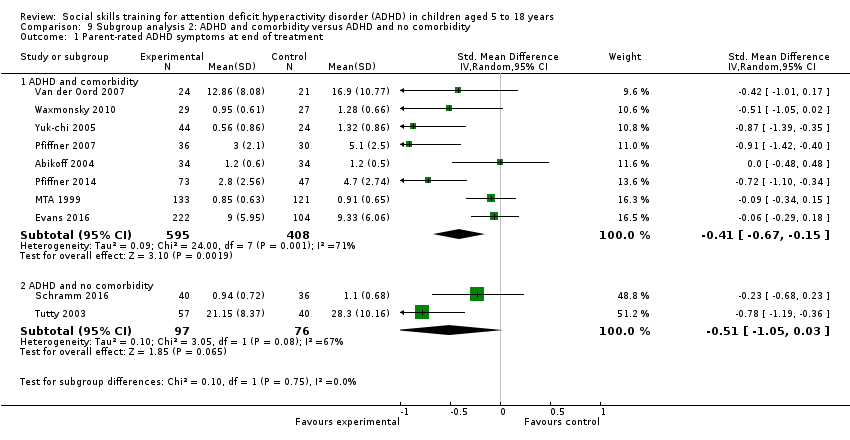
Comparison 9 Subgroup analysis 2: ADHD and comorbidity versus ADHD and no comorbidity, Outcome 1 Parent‐rated ADHD symptoms at end of treatment.

Comparison 10 Subgroup analysis 3: Social skills training only versus social skills training supported by parent training, Outcome 1 Teacher‐rated social skills at end of treatment.
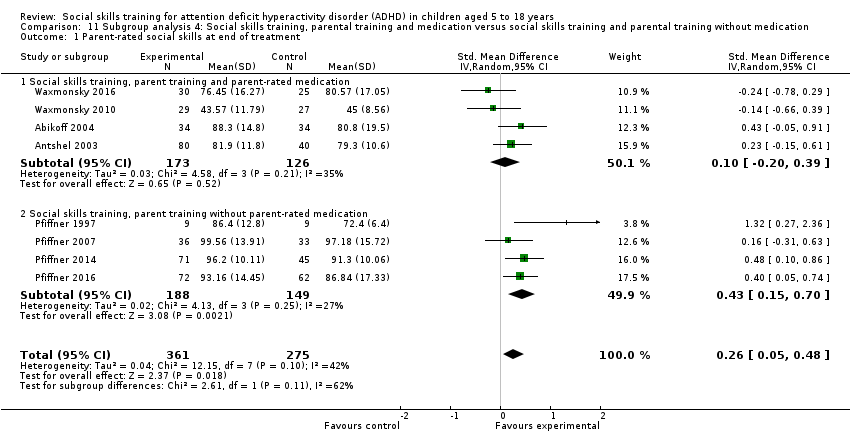
Comparison 11 Subgroup analysis 4: Social skills training, parental training and medication versus social skills training and parental training without medication, Outcome 1 Parent‐rated social skills at end of treatment.

Comparison 12 Subgroup analysis 5: No‐intervention control group versus waiting‐list control group with possible minor active intervention components, Outcome 1 Teacher‐rated social skills at end of treatment.
| Social skills training compared to no intervention | ||||||
| Patient or population: children aged five to 18 years with ADHD | ||||||
| Outcomes | Illustrative comparative risks* (95% CI) | Relative effect | Number of participants (studies) | Certainity of the evidence | Comments | |
| Assumed risk | Corresponding risk | |||||
| No intervention | Social skills training | |||||
| Teacher‐rated social skills Measured by: Conners Behavior Rating Scale: Social Problems Index; Strength and Difficulties Questionnaire: Prosocial Behaviour Subscale (teacher‐rated); Social Skills Improvement System; Social Skills Rating Scale: Coorperation Subscale Follow‐up: at end of treatment | ‐ | The mean score for teacher‐rated social skills at end of treatment in the intervention groups was 0.11 standard deviations higher (0.00 lower to 0.22 higher)e | ‐ | 1271 (11 studies) | ⊕⊝⊝⊝ a,b,c | Social skills training may have no effect on teacher‐rated social skills |
| Parent‐rated social skills Measured by: Social Skills Rating Scale; Weiss Functional Impairment Scale: Social Acitivities Domain (parent‐rated); Strength and Difficulties Questionnaire: Prosocial Behavior Subscale; Social Skills Improvement System Follow‐up: at end of treatment | ‐ | The mean score for parent‐rated social skills at end of treatment in the intervention groups was 0.19 standard deviations higher (0.06 higher to 0.32 higher) | ‐ | 1609 (15 studies) | ⊕⊝⊝⊝ a,b,c | Social skills training may have no effect on parent‐rated social skills |
| Teacher‐rated emotional competencies Measured by: Strengths and Difficulties Questionnaire: Emotional Symptoms Subscale; Conners Behavior Rating Scale: Emotional Index Score Follow‐up: at end of treatment | ‐ | The mean score for teacher‐rated emotional competencies at end of treatment in the intervention groups was 0.02 standard deviations lower (0.72 lower to 0.68 higher) | ‐ | 129 (two studies) | ⊕⊝⊝⊝ a,b,c | Social skills training may have no effect on teacher‐rated emotional competencies |
| Teacher‐rated general behaviour Measured by: Self‐Control Rating Scale; Conners Behavior Rating Scale: Aggressiveness Index; Disruptive Behavior Disorders Rating Scale; Conners Teacher Rating Scale: Conduct Problems Index; Strengths and Difficulties Questionnaire: Conduct Problems Subscale (teacher‐rated); Child Symptom Inventory: ODD Scale (teacher‐rated); Child Behavior Checklist Follow‐up: at end of treatment | ‐ | The mean score for teacher‐rated general behaviour at end of treatment in the intervention groups was 0.06 standard deviations lower (0.19 lower to 0.06 higher) | ‐ | 1002 (eight studies) | ⊕⊕⊝⊝ a,d | Social skills training may have no effect on teacher‐rated general behaviour |
| Parent‐rated general behaviour Measured by: Strengths and Difficulties Questionnaire (parent‐rated; total scores); Conners Behavior Rating Scale: Aggressiveness Index; Disruptive Behavior Disorders Rating Scale; Behavior Rating Inventory of Executive Function; SDQ: Conduct Problems Subscale (parent‐rated); Child Symptom Inventory; Child Behavior Checklist Follow‐up: at end of treatment | ‐ | The mean score for parent‐rated general behaviour at end of treatment in the intervention groups was 0.38 standard deviations lower (0.61 lower to 0.14 lower) | 995 (eight studies) | ⊕⊝⊝⊝ a,b,c,d | Social skills training may slightly improve parent‐rated general behaviour | |
| Teacher‐rated ADHD symptoms Measured by: Disruptive Behavior Disorders Rating Scale; ADHD Rating Scales: Hyperactivity and Impulsivity Subscales (total scores); Conner Teacher Rating Scale: Hyperactivity Index; Strengths and Weaknesses of ADHD Symptoms and Normal Behaviors; ADHD Symptom Checklist; Child Symptom Inventory (ADHD (inattention) scale score); SNAP‐IV (teacher rating scale) Follow‐up: at end of treatment | ‐ | The mean score for teacher‐rated ADHD symptoms at end of treatment in the intervention groups was 0.26 standard deviations lower (0.47 lower to 0.05 lower) | ‐ | 1379 (14 studies) | ⊕⊝⊝⊝ | Social skills training may slightly improve teacher‐rated ADHD symptoms |
| Parent‐rated ADHD symptoms Measured by: Conners Parent Rating Scale: Hyperkinesis Index; Disruptive Behavior Disorders Rating Scale; Strengths and Weaknesses of ADHD Symptoms and Normal Behaviors; Sluggish Cognitive Tempo; ADHD Symptom Checklist; ADHD Rating Scales; Child Symptom Inventory: Inattention; SNAP‐IV (teacher rating scale); Child Attention Profile Follow‐up: at end of treatment | ‐ | The mean score for parent‐rated ADHD symptoms at end of treatment in the intervention groups was 0.54 standard deviations lower (0.81 lower to 0.26 lower) | ‐ | 1206 (11 studies) | ⊕⊝⊝⊝ | Social skills training may slightly improve parent‐rated ADHD symptoms |
| *The basis for the assumed risk (e.g. the median control group risk across studies) is provided in footnotes. The corresponding risk (and its 95% CI) is based on the assumed risk in the comparison group and the relative effect of the intervention (and its 95% Cl). | ||||||
| ADHD: Attention deficit hyperactivity disorder; CI: Confidence interval; ODD: Oppositional defiant disorder; SNAP‐IV: Swanson, Nolan and Pelham rating scale ‐ Fourth Version. | ||||||
| GRADE Working Group grades of evidence | ||||||
| aDowngraded one level due to high risk of bias (systematic errors leading to overestimation of benefits and underestimation of harms) in several 'Risk of bias' domains, including lack of sufficient blinding and selective outcome reporting (many of the included studies did not report on this outcome) eThe effect on the primary outcome, teacher‐rated social skills at end of treatment, corresponds to a MD of 1.22 points on the social skills rating system (SSRS) scale (95% CI 0.09 to 2.36). The minimal clinical relevant difference (10%) on the SSRS is 10.0 points (range 0 to 102 points on SSRS). | ||||||
| Section | Protocol | Review |
| Types of outcome measures | We did not define what we meant by adverse events. | We added a definition of adverse events according to the International Committee of Harmonization guidelines (ICH 1996), because many of the studies included pharmaceutical treatment and it is not known whether social skills training might have adverse events. |
| We stated that we would measure the three primary and the first two secondary outcomes at short‐term (up to six months), medium‐term (six to 12 months), and long‐term (more than 12 months) follow‐up. | We changed this to end of treatment and at the longest follow‐up because we did not have data for the planned three time points. | |
| We did not prespecify the most important comparisons for the 'Summary of findings' table. | We reported a total of seven outcomes in the 'Summary of findings' table as per Cochrane recommendations; three primary outcomes (social skills, emotional competencies and general behaviour) and the first secondary outcome (ADHD symptoms). | |
| Assessment of risk of bias in included studies | We had not planned to evaluate blinding of participants and personnel. | We assessed the blinding of participants and personnel, as this is also important to assess in trials investigating psychosocial interventions, even if it is very difficult to do in these types of trials. |
| We stated that we would only use studies at low risk (or lower risk) of bias in the meta‐analysis. | We changed the decision to restrict the meta‐analysis to studies at comparable risk of bias (for example, all low risk of bias, all unclear risk of bias, or all high risk of bias), and performed sensitivity analyses accordingly. We decided to change this as there were very few trials at low risk of bias in this field. | |
| We stated that we would assess 'baseline imbalance' and 'early stopping' as risk of bias domains. | We did not assess these baseline domains. The randomisation procedure should give an even distribution of confounding factors and baseline imbalance. | |
| Dealing with missing data | We intended to assess the impact of missing dichotomous data in the results by applying procedures for 'intention‐to‐treat' and 'best‐case/worst‐case scenarios'. | We were unable to perform this analysis as there were no dichotomous data. |
| Measures of treatment effect | Dichotomous data We planned to analyse dichotomous data as risk ratios and present these with 95% confidence intervals (CIs), and to calculate the risk difference and, where there was a significant effect with the intervention and reasonable homogeneity of studies (that is, clinical, methodological, or statistical heterogeneity was within reasonable limits), the number needed to treat for an additional beneficial outcome (Higgins 2011, Section 9.2). | We did not do this as there were no dichotomous data. |
| Unit of analysis issues | Cluster‐randomised studies We stated that we thought investigators would have presented their results after appropriately checking for clustering effects (robust standard errors or hierarchical linear models). We planed to contact the investigators for further information if this was unclear. Where appropriate checks were not used, we planned to request and re‐analyse individual participant data using multilevel models that check for clustering. Following this, we planned to analyse effect sizes and standard errors in RevMan 5 (Review Manager 2014), using the generic inverse method (Higgins 2011, Section 9.3.2). If there was insufficient information to check for clustering, we would have entered outcome data into RevMan 5 using individuals as the units of analysis, and then conducting a sensitivity analysis to assess the potential biasing effects of inadequately controlled clustered studies (Donner 2002). See 'Sensitivity analysis' below. | We did not find any cluster‐randomised trials. |
| Assessment of reporting biases | We did not state that we would use Egger's test to test for small‐study effects. | We performed Egger's statistical test for small‐study effects. |
| Subgroup analysis and investigation of heterogeneity | We planned to perform subgroup analyses according to the following categories.
| We were not able to perform these subgroup analyses due to lack of sufficient data. |
| Sensitivity analysis | We stated that we would repeat the analysis taking into consideration the different methods used to handle the missing data and the potential biasing effects of inadequately controlled clustered studies. | We did not perform this analysis due to a lack of necessary data and, consequently, have analysed the data as reported. |
| ADHD: attention deficit hyperactivity disorder. | ||
| Measures | Description | Number of studies | Ratings | |||
| Teacher | Parent | Child | Observer | |||
| Social Skills Rating Scale (SSRS) | Three‐point Likert scale, ranging from zero (never) to two (often); higher scores indicate better social skills | 9 | ‐ | ‐ | ||
| ‐ | ||||||
| ‐ | ‐ | ‐ | ||||
| ‐ | ‐ | |||||
| ‐ | ‐ | |||||
| ‐ | ‐ | ‐ | ||||
| ‐ | ‐ | ‐ | ||||
| ‐ | ‐ | ‐ | ||||
| ‐ | ‐ | ‐ | ||||
| SSRS: Cooperation Subscale | Three‐point Likert scale, ranging from zero (never) to two (often); higher scores indicate better cooperation | 1 | ‐ | ‐ | ||
| Social Skills Improvement System (SSIS) | Four‐point rating scale, ranging from zero (never) to three (almost always); higher scores indicate better social skills. | 3 | ‐ | ‐ | ||
| ‐ | ‐ | |||||
| ‐ | ‐ | |||||
| Teacher Report ‐ Walker‐McConnell Scale of Social Competence and School Adjustment | Five‐point rating scale, ranging from one (never occurs) to five (frequently occurs); higher scores indicate better social skills | 1 | ‐ | ‐ | ‐ | |
| Weiss Functional Impairment Scale ‐ Parent Form (WFIRS‐P): Social Activities Subscale | Four‐point rating scale, ranging from zero (never or not at all) to three (very often or very much); higher scores indicate better social skills | 1 | ‐ | ‐ | ‐ | |
| Strengths and Difficulties Questionnaire (SDQ): Prosocial Behavior Subscale | Three‐point rating scale, ranging from zero (not true) to two (certainly true); higher scores indicate better social skills. | 1 | ‐ | |||
| Conners Behavior Rating Scale (CBRS): Social Problems Subscale | Four‐point rating scale, ranging from zero (not true at all) to three (very much true); higher scores indicate better social skills | 1 | ‐ | ‐ | ‐ | |
| Social Interaction Observation Code | Recording frequencies of positive, negative or neutral behaviour, including observations of negative behaviour | 1 | ‐ | ‐ | ‐ | |
| Test of Social Skill Knowledge | Scored from one (low knowledge) to 15 (high knowledge); higher scores indicate better social skills | 1 | ‐ | ‐ | ‐ | |
| Observation in Classrooms | Observing children for three × eight‐minute periods during a one‐hour period for two categories of behaviour: play behaviour and social behaviour | 1 | ‐ | ‐ | ‐ | |
| Test of Playfulness: Skillfulness | Four‐point rating scale, ranging from zero (unskilled) to three (highly skilled); higher scores indicate better social skills | 1 | ‐ | ‐ | ‐ | |
| Measures | Description | Number of studies | Ratings | |||
| Teacher | Parent | Child | Observer | |||
| Emotion Expression Scale for Children | Five‐point Likert scale, ranging from one (not at all) to five (extremely true); higher scores indicate poorer emotion awareness and greater reluctance to express emotion | 1 | ‐ | ‐ | ‐ | |
| Emotion Regulation Checklist (ERC): Emotion Regulation Subscale | Four‐point rating scale, ranging from one (never) to four (almost always); higher scores indicate better emotional regulation | 1 | ‐ | ‐ | ‐ | |
| Behavior Rating Inventory of Executive Function (BRIEF): Emotion Control Subscale | Three‐point rating scale, ranging from one (never) to three (often); lower scores indicate better emotional control. | 1 | ‐ | ‐ | ‐ | |
| Conners Behavior Rating Scale (CBRS): Emotional Index | Four‐point rating scale, ranging from zero (not true at all) to three (very much true); higher scores indicate better emotional competence | 1 | ‐ | ‐ | ‐ | |
| Strengths and Difficulties Questionnaire (SDQ): Emotional Symptoms Subscale | Three‐point rating scale, ranging from zero (not true) to two (certainly true); higher scores indicate lower emotional competence | 1 | ‐ | |||
| Richman‐Graham Scale | Three‐point rating scale, ranging from zero (no difficulties) to two (occurs frequently). Higher scores indicate lower emotional competence. | 1 | ‐ | ‐ | ‐ | |
| Measures | Description | Number of studies | Ratings | |||
| Teacher | Parent | Child | Observer | |||
| Child Behavior Checklist (CBCL) | Three point rating scale, ranging from zero (not true) to two (often true); lower scores indicate better general behaviour | 1 | ‐ | ‐ | ||
| Clinical Global Impression (CGI) Scale | Seven‐point rating scale, ranging from one (much worse) to seven (much improved); higher scores indicate improved general behaviour | 2 | ‐ | |||
| Disruptive Behavior Disorders Rating Scale: Oppositional Defiant Disorder index (DBDRS‐ODD) | Four‐point Likert scale, ranging from zero (not at all) to three (very much); lower scores indicate better general behaviour | 2 | ‐ | ‐ | ||
| Child Symptom Inventory (CSI): Oppositional Defiant Disorder Subscale | Four‐point rating scale, ranging from zero (never) to three (very often); lower scores indicate better general behaviour | 1 | ‐ | ‐ | ||
| Behavior Rating Inventory of Executive Function (BRIEF) | Three‐point rating scale, ranging from one (never) to three (often); lower scores indicate better general behaviour | 1 | ‐ | ‐ | ‐ | |
| Conners Behavior Rating Scale (CBRS): Conduct Problem Subscale | Four‐point rating scale, ranging from zero (not true at all) to three (very much true); lower scores indicate better general behaviour | 1 | ‐ | ‐ | ||
| CBRS: Aggressiveness Subscale | Four‐point rating scale, ranging from zero (not true at all) to three (very much true); lower scores indicate better general behaviour | 1 | ‐ | ‐ | ‐ | |
| Conners Teacher Rating Scale (CTRS) | Four‐point Likert scale, ranging from zero (not at all true) to three (very true); lower scores indicate better general behaviour | 1 | ‐ | ‐ | ‐ | |
| Strengths and Difficulties Questionnaire (SDQ): Total | Three‐point rating scale, ranging from zero (not true) to two (certainly true); lower scores indicate better general behaviour | 1 | ‐ | ‐ | ‐ | |
| SDQ: Conduct Problems Subscale | Three‐point rating scale, ranging from zero (not true) to two (certainly true); lower scores indicate better general behaviour | 1 | ‐ | |||
| Social Skills Rating Scale (SSRS): Problem Behaviour Subscale | Three‐point Likert scale, ranging from zero (never) to two (often); lower scores indicate better general behaviour | 1 | ‐ | ‐ | ‐ | |
| Self‐Control Rating Scale | Seven‐point continuum, ranging from one (indicating maximum level of self‐control) to seven (indicating maximum level of impulsivity; lower scores indicate better general behaviour | 1 | ‐ | ‐ | ‐ | |
| Measures | Description | Number of studies | Studies reporting ratings from: | |||
| Teacher | Parent | Child | Observer | |||
| Disruptive Behavior Disorders Rating Scale (DBDRS) | Four‐point Likert scale, ranging from zero (not at all) to three (very much); lower scores indicate fewer ADHD symptoms | 4 | ‐ | ‐ | ||
| ‐ | ‐ | |||||
| ‐ | ‐ | |||||
| ‐ | ‐ | |||||
| ADHD Rating Scales (ADHD‐RS) | Five‐point Likert scale, ranging from zero (never) to four (almost always); lower scores indicate fewer ADHD symptoms | 2 | ‐ | ‐ | ‐ | |
| ‐ | ‐ | ‐ | ||||
| ADHD‐RS: Hyperactivity and Impulsivity Subscale | Five‐point Likert scale, ranging from zero (never) to four (almost always); lower scores indicate fewer ADHD symptoms | 1 | ‐ | ‐ | ‐ | |
| Child Symptom Inventory (CSI): Inattention Scale | Four‐point rating scale, ranging from zero (never) to three (very often); lower scores indicate fewer ADHD symptoms | 2 | ‐ | ‐ | ||
| ‐ | ‐ | |||||
| Child Symptom Inventory (CSI): ADHD Scale | Four‐point scale (never, sometimes, often, very often); lower scores indicate fewer ADHD symptoms | 1 | ‐ | ‐ | ||
| Conners Teacher Rating Scale (CTRS) | Four‐point Likert scale, ranging from zero (not at all true) to three (very true); lower scores indicate fewer ADHD symptoms. | 2 | ‐ | ‐ | ‐ | |
| ‐ | ‐ | |||||
| Conners Parent Rating Scale (CPRS) | Four‐point Likert scale, ranging from zero (not at all true) to three (very true); lower scores indicate fewer ADHD symptoms | 2 | ‐ | ‐ | ‐ | |
| ‐ | ‐ | ‐ | ||||
| Conners 3: Hyperactivity/impulsivity Scale | Four‐point Likert scale, ranging from zero (not at all true) to three (very much true); lower scores indicate fewer ADHD symptoms | 1 | ‐ | ‐ | ‐ | |
| ADHD Symptom Checklist (Fremdbeurteilungsbogen für Hyperkinetische Störungen) | Four‐point scale ranging from one (not at all) to three (very much); lower scores indicate fewer ADHD symptoms | 1 | ‐ | |||
| Swanson, Nolan and Pelham Teacher Rating Scale (SNAP) | Four‐point rating scale, ranging from zero (not at al) to three (very often); lower scores indicate fewer ADHD symptoms | 1 | ‐ | ‐ | ||
| Child Attention Profile (CAP) | Three‐point rating scale (1 = not true, 2 = sometimes true, 3 = very often true); lower scores indicate fewer ADHD symptoms | 1 | ‐ | ‐ | ‐ | |
| Strengths and Weaknesses of ADHD Symptoms and Normal Behaviors (SWAN) | Seven‐point rating scale, including both positive and negative scores to reflect strengths and weaknesses, ranging from three (far below average) to minus three (far above average). Zero = normal/average | 1 | ‐ | ‐ | ||
| Structured Behavioural Observations | Child behaviour coded as 'on task', 'off task', or 'off task/disruptive'; lower scores indicate fewer ADHD symptoms | 1 | ‐ | ‐ | ‐ | |
| Continuous Performance Test (CPT): Omission Errors | CPT is a computerised test measuring impulse control and attention control based on the child's response to 150 stimuli, including 30 target stimuli. The omission errors reflect degree of inattention; higher score on omission errors indicate higher degree of inattention. | 1 | ‐ | ‐ | ‐ | |
| Measure | Description | Numbder of studies | Ratings | |||
| Teacher | Parent | Child | Observer | |||
| Classroom Performance Survey (CPS) | Five‐point Likert scale, ranging from one (always) to five (never); higher scores indicate lower performance in school | 1 | ‐ | ‐ | ‐ | |
| Conners Behavior Rating Scale (CBRS): Academic Performance Index; | Four‐point rating scale, ranging from zero (not true at all) to three (very much true); higher scores indicate better performance in school | 1 | ‐ | ‐ | ‐ | |
| Social Skills Improvement System (SSIS): Academic Competence Scale | Four‐point scale, ranging from zero (never) to three (almost always); higher scores indicate better performance in school | 1 | ‐ | ‐ | ‐ | |
| Academic Performance Rating Scale (APRS) | Five‐point Likert scale, ranging from one (never or poor) to five (very often or excellent); higher scores indicate better performance in school | 1 | ‐ | ‐ | ‐ | |
| Wechsler Individual Achievement Test (WIAT) | WIAT is a clinician‐administered performance test including 16 subtests divided between Oral Reading, Math Fluency and Early Reading Skills; higher scores indicate better performance | 1 | ‐ | ‐ | ‐ | |
| German teacher‐rated questionnaire for learning and working behaviour (Arbeitsverhalten Lehrer) | German teacher‐rated questionnaire for learning and working behaviour (Arbeitsverhalten Lehrer is a teacher‐rated scale) | 1 | ‐ | ‐ | ‐ | |
| Outcome or subgroup title | No. of studies | No. of participants | Statistical method | Effect size |
| 1 Primary meta‐analysis: Teacher‐rated social skills at end of treatment Show forest plot | 11 | Std. Mean Difference (IV, Random, 95% CI) | Subtotals only | |
| 1.1 All eligible trials | 11 | 1271 | Std. Mean Difference (IV, Random, 95% CI) | 0.11 [‐0.00, 0.22] |
| 1.2 Sensitivity analysis excluding the 3 trials with longest treatment duration | 8 | 620 | Std. Mean Difference (IV, Random, 95% CI) | 0.11 [‐0.05, 0.27] |
| 2 Secondary meta‐analyses: Social skills Show forest plot | 19 | 2649 | Std. Mean Difference (IV, Random, 95% CI) | 0.29 [0.11, 0.47] |
| 2.1 Teacher‐rated social skills at longest follow‐up | 3 | 192 | Std. Mean Difference (IV, Random, 95% CI) | 0.06 [‐0.22, 0.35] |
| 2.2 Parent‐rated social skills at end of treatment for all eligible trials | 15 | 1609 | Std. Mean Difference (IV, Random, 95% CI) | 0.19 [0.06, 0.32] |
| 2.3 Parent‐rated social skills at longest follow‐up | 2 | 445 | Std. Mean Difference (IV, Random, 95% CI) | 0.13 [‐0.35, 0.62] |
| 2.4 Observer‐rated social skills at end of treatment for all eligible trials | 1 | 29 | Std. Mean Difference (IV, Random, 95% CI) | 2.88 [1.80, 3.96] |
| 2.5 Participants‐rated social skills at end of treatment for all eligible trials | 5 | 344 | Std. Mean Difference (IV, Random, 95% CI) | 0.28 [‐0.68, 1.23] |
| 2.6 Participant‐rated social skills at longest follow‐up | 1 | 30 | Std. Mean Difference (IV, Random, 95% CI) | 1.60 [0.77, 2.44] |
| 3 Teacher‐reported Walker‐McConnell Scale of Social Competence and School Adjustment Show forest plot | 1 | 46 | Mean Difference (IV, Random, 95% CI) | 1.06 [‐0.47, 2.59] |
| 4 Parent‐rated Social Skills Scale (UCI) Show forest plot | 1 | 18 | Mean Difference (IV, Random, 95% CI) | 9.70 [6.07, 13.33] |
| 5 Child‐rated Test of Social Skill Knowledge Show forest plot | 1 | 18 | Mean Difference (IV, Random, 95% CI) | 4.20 [1.99, 6.41] |
| 6 Social Interaction Observation Code: Negative behaviour Show forest plot | 1 | 68 | Mean Difference (IV, Random, 95% CI) | 0.20 [‐0.11, 0.51] |
| Outcome or subgroup title | No. of studies | No. of participants | Statistical method | Effect size |
| 1 Primary meta‐analysis: Teacher‐rated emotional competencies at end of treatment Show forest plot | 2 | 129 | Std. Mean Difference (IV, Random, 95% CI) | ‐0.02 [‐0.72, 0.68] |
| 2 Secondary meta‐analyses: Emotional competencies Show forest plot | 5 | 353 | Std. Mean Difference (IV, Random, 95% CI) | ‐0.20 [‐0.41, 0.01] |
| 2.1 Parent‐rated emotional competencies | 3 | 173 | Std. Mean Difference (IV, Random, 95% CI) | ‐0.27 [‐0.59, 0.05] |
| 2.2 Parent‐rated emotional competencies at longest follow‐up | 1 | 55 | Std. Mean Difference (IV, Random, 95% CI) | 0.19 [‐0.34, 0.72] |
| 2.3 Participant‐rated emotional competencies | 2 | 125 | Std. Mean Difference (IV, Random, 95% CI) | ‐0.27 [‐0.62, 0.09] |
| Outcome or subgroup title | No. of studies | No. of participants | Statistical method | Effect size |
| 1 Primary meta‐analysis: Teacher‐rated general behaviour at end of treatment Show forest plot | 8 | Std. Mean Difference (IV, Random, 95% CI) | Subtotals only | |
| 1.1 All eligible trials | 8 | 1002 | Std. Mean Difference (IV, Random, 95% CI) | ‐0.06 [‐0.19, 0.06] |
| 1.2 Sensitivity analysis excluding the 2 trials with the longest treatment duration | 6 | 422 | Std. Mean Difference (IV, Random, 95% CI) | ‐0.09 [‐0.28, 0.10] |
| 1.3 Sensitivity analysis excluding the 2 largest trials | 6 | 422 | Std. Mean Difference (IV, Random, 95% CI) | ‐0.09 [‐0.28, 0.10] |
| 2 Secondary analyses: general behaviour Show forest plot | 9 | 2034 | Std. Mean Difference (IV, Random, 95% CI) | ‐0.26 [‐0.40, ‐0.12] |
| 2.1 Teacher‐rated general behaviour at longest follow‐up | 4 | 637 | Std. Mean Difference (IV, Random, 95% CI) | ‐0.10 [‐0.27, 0.07] |
| 2.2 Parent‐rated general behaviour at end of treatment | 8 | 995 | Std. Mean Difference (IV, Random, 95% CI) | ‐0.38 [‐0.61, ‐0.14] |
| 2.3 Parent‐rated general behaviour at longest follow‐up | 1 | 326 | Std. Mean Difference (IV, Random, 95% CI) | ‐0.21 [‐0.44, 0.03] |
| 2.4 Participant‐rated general behaviour at end of treatment | 1 | 76 | Std. Mean Difference (IV, Random, 95% CI) | ‐0.07 [‐0.52, 0.38] |
| Outcome or subgroup title | No. of studies | No. of participants | Statistical method | Effect size |
| 1 Primary meta‐analysis: Teacher‐rated ADHD symptoms at end of treatment Show forest plot | 14 | Std. Mean Difference (IV, Random, 95% CI) | Subtotals only | |
| 1.1 All eligible trials | 14 | 1379 | Std. Mean Difference (IV, Random, 95% CI) | ‐0.26 [‐0.47, ‐0.05] |
| 1.2 Sensitivity analysis excluding the 3 trials with longest treatment duration | 11 | 677 | Std. Mean Difference (IV, Random, 95% CI) | ‐0.24 [‐0.52, 0.04] |
| 1.3 Sensitivity analysis excluding the 3 largest trials | 11 | 677 | Std. Mean Difference (IV, Random, 95% CI) | ‐0.24 [‐0.52, 0.04] |
| 2 Secondary meta‐analyses: ADHD symptoms Show forest plot | 15 | 2857 | Std. Mean Difference (IV, Random, 95% CI) | ‐0.39 [‐0.63, ‐0.15] |
| 2.1 Teacher‐rated ADHD symptoms at longest follow‐up | 5 | 582 | Std. Mean Difference (IV, Random, 95% CI) | ‐0.11 [‐0.28, 0.06] |
| 2.2 Parent‐rated ADHD symptoms at end of treatment for all eligible trials | 11 | 1206 | Std. Mean Difference (IV, Random, 95% CI) | ‐0.54 [‐0.81, ‐0.26] |
| 2.3 Parent‐rated ADHD symptoms at longest follow‐up | 3 | 476 | Std. Mean Difference (IV, Random, 95% CI) | ‐1.36 [‐2.48, ‐0.25] |
| 2.4 Participant‐rated ADHD symptoms at end of treatment | 2 | 106 | Std. Mean Difference (IV, Random, 95% CI) | ‐0.77 [‐2.31, 0.78] |
| 2.5 Observer‐rated ADHD symptoms at end of treatment for all eligible trials | 2 | 107 | Std. Mean Difference (IV, Random, 95% CI) | ‐3.15 [‐9.88, 3.57] |
| 2.6 Observer‐rated ADHD symptoms at longest follow for all eligible trials | 1 | 30 | Std. Mean Difference (IV, Random, 95% CI) | 3.95 [2.66, 5.23] |
| 2.7 Single study result: Teacher‐rated ADHD symptoms (inattention) at end of treatment | 1 | 254 | Std. Mean Difference (IV, Random, 95% CI) | 0.01 [‐0.23, 0.26] |
| 2.8 Single study result: Teacher‐rated ADHD symptoms (sluggish cognitive tempo) at end of treatment | 1 | 66 | Std. Mean Difference (IV, Random, 95% CI) | ‐0.29 [‐0.78, 0.20] |
| 2.9 Single study result: Participant‐rated ADHD symptoms at longest follow‐up | 1 | 30 | Std. Mean Difference (IV, Random, 95% CI) | 1.62 [0.78, 2.46] |
| Outcome or subgroup title | No. of studies | No. of participants | Statistical method | Effect size |
| 1 At end of treatment Show forest plot | 5 | 642 | Std. Mean Difference (IV, Random, 95% CI) | 0.15 [‐0.01, 0.31] |
| 2 At longest follow‐up Show forest plot | 2 | 379 | Std. Mean Difference (IV, Random, 95% CI) | ‐0.01 [‐0.22, 0.20] |
| Outcome or subgroup title | No. of studies | No. of participants | Statistical method | Effect size |
| 1 Wescheler Individual Achievement Test Show forest plot | 1 | 260 | Mean Difference (IV, Fixed, 95% CI) | 1.5 [‐2.06, 5.06] |
| Outcome or subgroup title | No. of studies | No. of participants | Statistical method | Effect size |
| 1 Teacher‐rated social skills Show forest plot | 11 | Mean Difference (IV, Random, 95% CI) | Subtotals only | |
| 1.1 At end of treatment | 4 | 185 | Mean Difference (IV, Random, 95% CI) | 1.80 [‐1.01, 4.62] |
| 1.2 All eligible trials | 11 | 1271 | Mean Difference (IV, Random, 95% CI) | 1.22 [0.09, 2.36] |
| Outcome or subgroup title | No. of studies | No. of participants | Statistical method | Effect size |
| 1 Teacher‐rated social skills Show forest plot | 11 | 1271 | Std. Mean Difference (IV, Random, 95% CI) | 0.11 [‐0.00, 0.22] |
| 1.1 Children aged 5 to 11 years | 10 | 1194 | Std. Mean Difference (IV, Random, 95% CI) | 0.11 [‐0.01, 0.22] |
| 1.2 Children aged 12 to 18 years | 1 | 77 | Std. Mean Difference (IV, Random, 95% CI) | 0.16 [‐0.28, 0.61] |
| Outcome or subgroup title | No. of studies | No. of participants | Statistical method | Effect size |
| 1 Parent‐rated ADHD symptoms at end of treatment Show forest plot | 10 | Std. Mean Difference (IV, Random, 95% CI) | Subtotals only | |
| 1.1 ADHD and comorbidity | 8 | 1003 | Std. Mean Difference (IV, Random, 95% CI) | ‐0.41 [‐0.67, ‐0.15] |
| 1.2 ADHD and no comorbidity | 2 | 173 | Std. Mean Difference (IV, Random, 95% CI) | ‐0.51 [‐1.05, 0.03] |
| Outcome or subgroup title | No. of studies | No. of participants | Statistical method | Effect size |
| 1 Teacher‐rated social skills at end of treatment Show forest plot | 6 | 968 | Std. Mean Difference (IV, Random, 95% CI) | 0.14 [‐0.00, 0.28] |
| 1.1 Social skills training supported by parent training | 4 | 336 | Std. Mean Difference (IV, Random, 95% CI) | 0.22 [‐0.01, 0.45] |
| 1.2 Social skills training only (i.e. without parent training) | 4 | 632 | Std. Mean Difference (IV, Random, 95% CI) | 0.15 [‐0.12, 0.41] |
| Outcome or subgroup title | No. of studies | No. of participants | Statistical method | Effect size |
| 1 Parent‐rated social skills at end of treatment Show forest plot | 8 | 636 | Std. Mean Difference (IV, Random, 95% CI) | 0.26 [0.05, 0.48] |
| 1.1 Social skills training, parent training and parent‐rated medication | 4 | 299 | Std. Mean Difference (IV, Random, 95% CI) | 0.10 [‐0.20, 0.39] |
| 1.2 Social skills training, parent training without parent‐rated medication | 4 | 337 | Std. Mean Difference (IV, Random, 95% CI) | 0.43 [0.15, 0.70] |
| Outcome or subgroup title | No. of studies | No. of participants | Statistical method | Effect size |
| 1 Teacher‐rated social skills at end of treatment Show forest plot | 11 | 1271 | Std. Mean Difference (IV, Random, 95% CI) | 0.11 [‐0.00, 0.22] |
| 1.1 No‐intervention control group | 8 | 693 | Std. Mean Difference (IV, Random, 95% CI) | 0.12 [‐0.03, 0.27] |
| 1.2 Waiting‐list control group with possible minor active intervention components | 3 | 578 | Std. Mean Difference (IV, Random, 95% CI) | 0.14 [‐0.13, 0.42] |