Mejoría de la atención por médicos generalistas para los trastornos y síntomas somáticos funcionales en la atención primaria
Appendices
Appendix 1. CCDAN Registers search strategy
The Cochrane, Depression, Anxiety and Neurosis Review Group Specialised Register (CCDANCTR)
The Cochrane Depression, Anxiety and Neurosis Review Group (CCDAN) maintain two clinical trials registers at their editorial base in Bristol, UK, a references register and a studies based register. The CCDANCTR‐References Register contains over 31,500 reports of randomized controlled trials in depression, anxiety and neurosis. Approximately 65% of these references have been tagged to individual, coded trials. The coded trials are held in the CCDANCTR‐Studies Register and records are linked between the two registers through the use of unique Study ID tags. Coding of trials is based on the EU‐Psi coding manual. Please contact the CCDAN Trials Search Coordinator for further details. Reports of trials for inclusion in the Group's registers are collated from routine (weekly), generic searches of MEDLINE (1950‐), EMBASE (1974‐) and PsycINFO (1967‐); quarterly searches of the Cochrane Central Register of Controlled Trials (CENTRAL) and review specific searches of additional databases. Reports of trials are also sourced from international trials registers c/o the World Health Organisation’s trials portal (ICTRP), ClinicalTrials.gov, drug companies, the hand‐searching of key journals, conference proceedings and other (non‐Cochrane) systematic reviews and meta‐analyses.
Details of CCDAN's generic search strategies can be found on the Group‘s website.
The CCDANCTR‐Studies Register was searched using the following terms:
Treatment setting = “general practice” or “family practice” or “primary care”
and
Diagnosis= “medically unexplained” or “frequent attend*” or “high util*” or somat* or neurasthen* or hypochondria* or hysteri* or pain or "chronic fatigue"
The CCDANCTR‐References Register was searched to find additional untagged/uncoded references uisng the following terms:
Free‐text = “general practi*” or “family practi*” or “primary care” or "primary health*" or (physician* and family) or “primary medical care” or “health practitioner*” or “doctor patient relation*” or Title/Abstract = GP*
and
Free‐text = “medically unexplained” or “frequent attend*” or “high util*” or somat* or neurasthen* or hypochondria* or hysteri* or "chronic fatigue" or “unexplained physical symptoms”
The CCDANCTR was searched on 13 August 2012.
Appendix 2. Search strategies
A native database search was done in Ovid Medline, Embase and PsycINFO in 2009 and updated on 13 September 2012 as stated below.
Supplementary searches (using similar, but translated terms) were conducted in CINAHL,PSYNDEX, SIGLE AND LILACS (April 2010).
These searches yielded no supplementary studies to those identified by the Cochrane databases.
-
SOMATOFORM DISORDER/ or NEURASTHENIA/ or HYPOCHONDRIASIS/
-
NEUROCIRCULATORY ASTHENIA/
-
(somatoform or somati#ation or somati#ing or somati#ed or somatic symptom$ or somatic syndrome$ or symptom syndrome$ or multisomat$ or neurastheni$ or hypochondria$).ti,ab.
-
((medic$ adj3 (unexplain$ or inexplic$)) or unexplained symptom$).ti,ab.
-
(((frequent or high) adj1 attend$) or high utili#er$ or repeat$ present$).ti,ab.
-
functional symptoms.ti,ab.
-
reattribution.ti,ab.
-
exp ABDOMINAL PAIN/
-
stomach ache$.ti,ab
-
exp BACK PAIN/
-
COLONIC DISEASES, FUNCTIONAL/
-
CYSTITIS, INTERSTITIAL/
-
painful bladder syndrome.ti,ab.
-
urethral syndrome.ti,ab.
-
cardiac neuros$.ti,ab.
-
((non cardiac or noncardiac or non‐cardiac) adj chest pain).ti,ab.
-
((nonorganic or non organic or non‐organic) adj pain).ti,ab.
-
effort syndrome.ti,ab.
-
DIZZINESS/
-
FIBROMYALGIA/
-
FATIGUE SYNDROME, CHRONIC/
-
myalgic encephalomyel$.ti,ab.
-
(post viral or postviral or post‐viral) adj (fatigue or syndrome).ti,ab.
-
exp HEADACHE
-
exp HEADACHE DISORDERS
-
exp HYPERVENTILATION
-
exp HYSTERIA
-
Briquet's syndrome.ti,ab.
-
IRRITABLE BOWEL SYNDROME/
-
MULTIPLE CHEMICAL SENSITIVITY/
-
exp PELVIC PAIN
-
exp PREMENSTRUAL SYNDROME
-
PSYCHOPHYSIOLOGIC DISORDERS
-
(psychalgia or psychogenic or psychoseizure$ or psychosomatic).ti,ab.
-
TEMPOROMANDIBULAR JOINT DYSFUNCTION SYNDROM
-
or/1‐35
-
exp PRIMARY HEALTHCARE/
-
PHYSICIANS, FAMILY/
-
FAMILY PRACTICE/
-
FAMILY HEALTHCARE/
-
NURSE PRACTITIONERS/
-
((family or community) adj (medic$ or doctor$ or physician$ or nurs$ or health)).ti,ab.
-
((general or family or nurs$) adj1 (practice$ or practitioner$)).ti,ab.
-
(primary care or primary healthcare or primary health care or primary health service$ or homecare or care in the community).ti,ab.
-
GP$ or generalist$.ti,ab.
-
or/37‐45
-
randomized controlled trial.pt.
-
controlled clinical trial.pt.
-
randomi#ed.ab.
-
placebo$.ab.
-
exp Clinical Trials as Topic/
-
randomly.ab.
-
trial.ti.
-
or/47‐53
-
(animals not (humans and animals)).sh.
-
54 not 55
-
36 and 46 and 56
International Clinical Trials Registries were searched (Clinicaltrials.gov and the ICTRP (apps.who.int/trialsearch)) using the following terms:
Unexplained
Somatoform
Somatisation OR somatization

Study flow diagram.
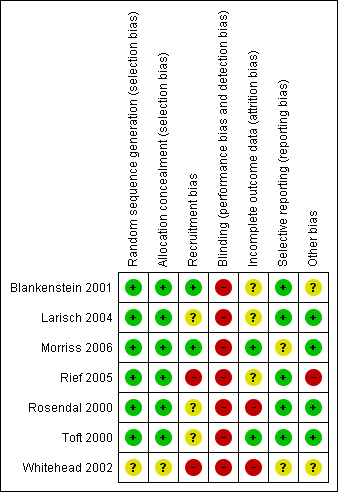
Risk of bias summary: review authors' judgements about each risk of bias item for each included study.
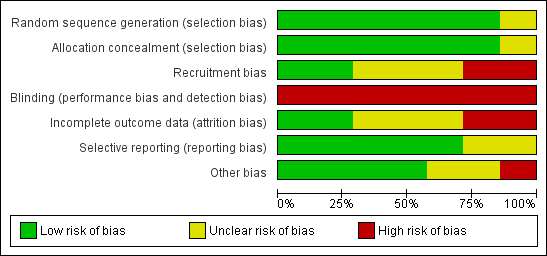
Risk of bias graph: review authors' judgements about each risk of bias item presented as percentages across all included studies.

Comparison 1 Health related quality of life, Outcome 1 Change in physical health 6‐24 months.

Comparison 1 Health related quality of life, Outcome 2 Change in physical health 1‐3 months.

Comparison 1 Health related quality of life, Outcome 3 Change in mental health 6‐24 months.

Comparison 1 Health related quality of life, Outcome 4 Change in mental health 1‐3 months.
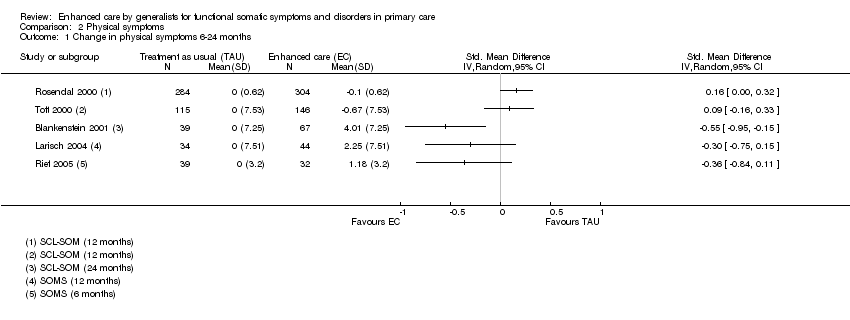
Comparison 2 Physical symptoms, Outcome 1 Change in physical symptoms 6‐24 months.
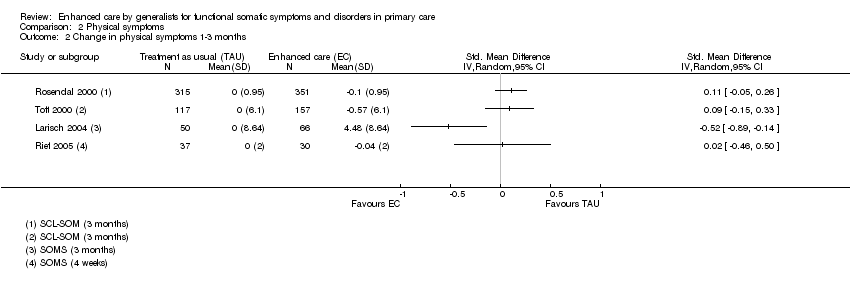
Comparison 2 Physical symptoms, Outcome 2 Change in physical symptoms 1‐3 months.
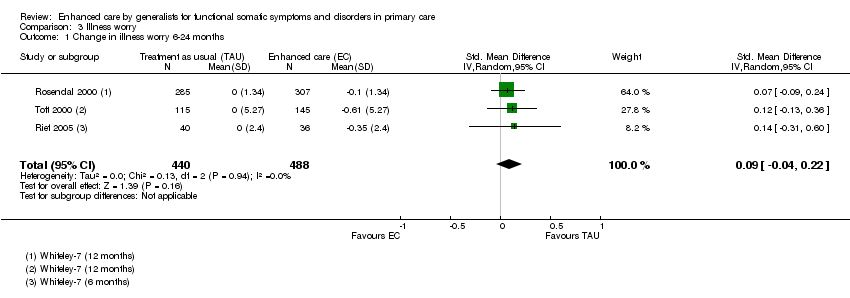
Comparison 3 Illness worry, Outcome 1 Change in illness worry 6‐24 months.

Comparison 3 Illness worry, Outcome 2 Change in illness worry 1‐3 months.
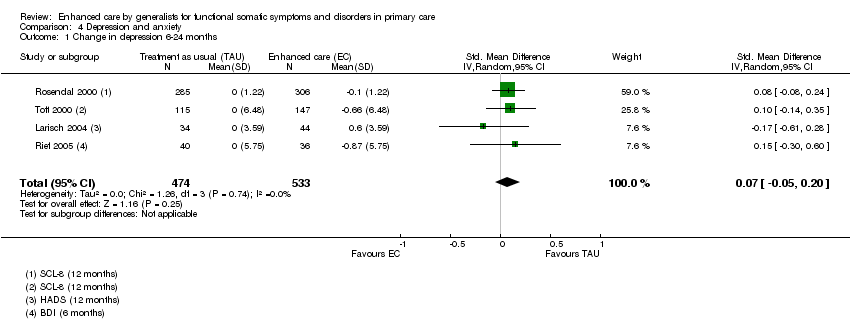
Comparison 4 Depression and anxiety, Outcome 1 Change in depression 6‐24 months.

Comparison 4 Depression and anxiety, Outcome 2 Change in depression 1‐3 months.
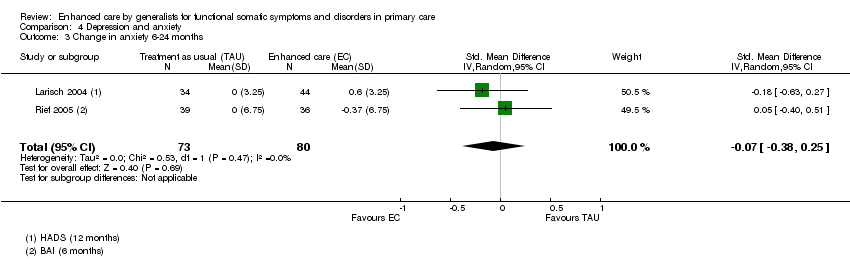
Comparison 4 Depression and anxiety, Outcome 3 Change in anxiety 6‐24 months.

Comparison 4 Depression and anxiety, Outcome 4 Change in anxiety 1‐3 months.
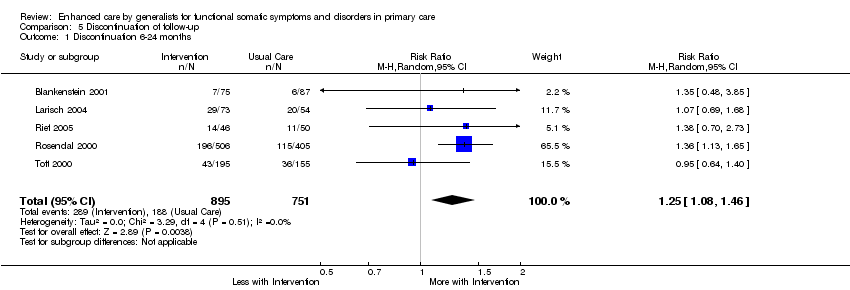
Comparison 5 Discontinuation of follow‐up, Outcome 1 Discontinuation 6‐24 months.
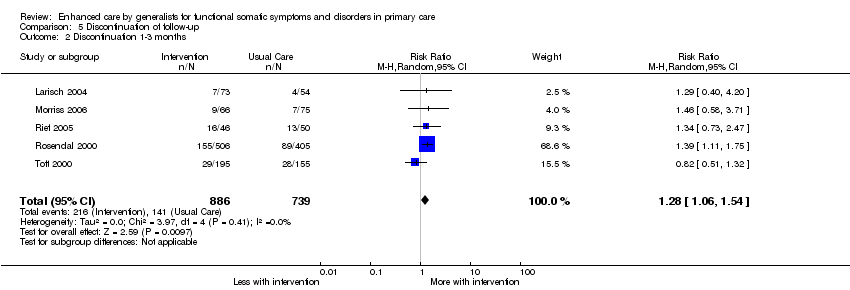
Comparison 5 Discontinuation of follow‐up, Outcome 2 Discontinuation 1‐3 months.
| Type of instrument | Name | references |
| Questionnaire | Abridged criteria/Escobar criteria/SOMS | |
|
| PHQ‐15 | |
|
| SCL‐12 (SCL‐90 somatization scale) | |
|
| Whiteley (7 or 14) | |
| GHQ | ||
| Interview | SCAN | |
|
| DIS | |
|
| CIDI | |
| Health care use | Frequent attendance | |
| The table may be supplemented by specific instruments for functional somatic syndromes. SOMS: Screening for somatoform Symptoms; PHQ: Patient Health Questionnaire; SCL: Symptom Check List; GHQ: General Health Questionnaire; SCAN: Schedules for Clinical Assessment in Neuropsychiatry; DIS: Diagnostic Interview Schedule; CIDI: Composite International Diagnostic Interview. | ||
| Rubric | Reviewer1 | Reviewer 2 | Conclusion | |
| Study ID, name of study | ||||
| Report ID | ||||
| Author name and year |
|
|
| |
| Title of paper |
|
|
| |
| Contact details |
|
|
| |
| Personal notes (e.g. name of disorder used) |
|
|
| |
| Assessment of eligibility | Intervention provided by generalist | |||
| Intervention deals with non‐biomedical aspects | ||||
| Patients have MUS or functional syndrome(s) | ||||
| RCT | ||||
| Personal notes | Reason for exclusion |
|
| |
| Study characteristics |
|
|
| |
| Methods | Study design including level of randomisation and measures of clustering |
|
|
|
| Study duration | ||||
| Sequence generation | ||||
| Allocation concealment | ||||
| Blinding (clinician, patient, researcher) | ||||
| Incomplete data (short term, longer term) | ||||
| Reporting (prespecified, incidental) | ||||
| Recruitment bias | ||||
|
| The risk of contamination (control patients receiving intervention unintentional or vice versa) |
|
|
|
| Other concerns about bias | ||||
| Participating GPs | Number of GPs/practices | |||
| Setting of the study (the primary care organisation and country) | ||||
| Doctor characteristics and sampling (previous training, years in practice, GP age) |
|
|
| |
| Participating patients | Number of patients in each group | |||
| Diagnostic criteria and instrument used | ||||
| Patient characteristics (inclusion, exclusion, ethnicity, diagnosis, symptom duration, psychiatric co‐morbidity) and sampling (population screening, waiting room screening, GP assessment, diagnostic instruments used) |
|
|
| |
| Date of study | ||||
| Intervention | Number of groups | |||
| Intervention* in active group and adherence |
|
|
| |
|
| Intervention in control group and adherence |
|
|
|
| Outcomes | Primary and secondary outcomes: time from randomisation, measure, tool used, definition, unit of measurement, definition of positive outcome |
|
|
|
|
| Length of maximum follow‐up |
|
|
|
| Analysis | Type (e.g. intention to treat) | |||
| Missing data (attempts to minimise, handling of) | ||||
| Covariate choice | ||||
| Power, anticipated effect and sample size adjustment | ||||
| Results | Number of participants in each group |
|
|
|
| Primary and secondary outcomes: sample size, missings, summary data for each group, estimate of effect, subgroup analyses | ||||
| Other | Funding, key conclusions by authors | |||
| Comments | ||||
| * Interventions
| ||||
| Study | Training intensity | Intervention | Delivery intensity | Manual and adherence | Proportion population eligible |
| Blankenstein | 20 hour programme, included discussion of audio taped consultations and booster sessions | Reattribution + (c) symptom diaries | “during usual care” at least two appointments. | Intervention registration forms filled in by GP during consultations with included patients. Adherence: intervention was applied to 51 of 75 patients (68%). Reattribution was achieved in 33 of 75 patients (31%) | Registered 33,000 (11,000 age 20‐45 ˜34% of population) Screened 900 (Frequent attenders: top 8%) Eligible 243 ( > = 5 on DSM3 symptoms checklist) (age 20‐45 only) 0.74% |
| Larisch | 12 hour programme, Teaching, pre‐recorded video, role playing | Training based on reattribution modified for German PHC setting: (a) emphasised examination (b) symptom diaries | 6x20 minute appointments every 2 weeks | Manual with therapy protocols for each of the 6 patient sessions. Adherence not reported. | Registered 34,000 (42 GPs x 800 patients / GP) Screened 847 (waiting room + GP opportunistic) Eligible 222 (4M/6F on SOMS + GHQ>2) 0.65% |
| Morriss | 3x2hours Teaching, pre‐recorded video, role playing | Reattribution: (a) feeling understood (c) making the link | Single clinic appointment | No manual but specific consultation model (reattribution) which was audio taped for evaluation. Adherence: Intervention GPs communicated reattribution in most of the consultation in 20 of 65 patients (31%) | Registered 102,000 (16 x 6400) Screened 4484 in 430 clinics Eligible 141 (current MUS >3 months) 0.14% |
| Rief | One day Teaching, pre‐recorded video, role playing (“if necessary”) | “Synthesis of” reattribution + additional information. (b) stopping medical investigations (c) handling organic health beliefs and need for reassurance (d) options for further treatment | Not specified. “encouraged to make regular appointments” | No manual or measurement of adherence. | Registered 20,800 (26 GPs x 800 patients / GP) Eligible 289 (96 in cohort 2) selected by GPs as 2 or more MUS (non‐randomised design, no record of individual consent / opt‐in or out??) 1.4% |
| Rosendal | 2 day residential + 3x2hour sessions Analysis of own video consultations + outreach visit after 6/12 | Extended reattribution and management (a) understanding – including brief focused exam (e) principles for management of chronic conditions | Not specified | No manual or measurement of adherence. | Population 66,500 (19% GPs serving 350,000 residents) 2880 screened Eligible 911 (either 4+ symptoms on SCL‐SOM or 2+ on Whitely‐7) 1.4% |
| Toft | 2 day residential + 3x2hour sessions Analysis of own video consultations + outreach visit after 6/12 | Extended reattribution and management (a) understanding – including brief focused exam (e) principles for management of chronic conditions | Not specified | No manual or measurement of adherence. | Population 54,000 (9%GPs serving 600,000 residents) 1785 screened (attenders 18‐65 consulting new health problem) Eligible 350 (Somatoform Disorder according to SCAN) 0.65% |
| Item | Description | Scoring: yes, unclear or no | |
| Selection bias | Random sequence generation | Was the allocation sequence adequately generated? | A method for random allocation at the level of the doctor or patient must have been applied and stated. |
| Allocation concealment | Was allocation adequately concealed? | Allocation should have been performed by an independent person without any influence on the allocation sequence or the decision about eligibility for inclusion. | |
| Recruitment bias | Were patients recruited before or after randomisation of doctors/practices? | If patients were recruited after randomisation at the level of the doctor/practice the recruitment could be affected by the practice awareness of allocation group to some degree (instruments for inclusion applied) or to a high degree (inclusion under direct influence of the doctor) | |
| Performance and detection bias | Blinding | Was knowledge of the allocated intervention prevented during the study at the level of the doctor, patient and assessor? | We defined: Low risk = attempt to conceal from doctor AND patients AND assessors blinded. Unclear risk = Unclear blinding of patient, doctor and/or assessor but none unblinded. High risk = either no attempt to conceal from doctor OR patients OR assessor not blinded |
| Attrition bias | Incomplete outcome data | Were loss to follow‐up acceptable and was attrition addressed? | Information about included patients lost to follow‐up. Attrition above 30% was rated as high risk. |
| Reporting bias | Selective reporting | Reporting of selective outcome? | Were primary outcomes stated and reported? Were other findings reported as such? |
| Other bias | Was the study free of other problems that could put it at a high risk of bias? | Specific attention paid to whether statistics were adjusted for the effect of clustering of patients with GPs or practices. |
| Outcome or subgroup title | No. of studies | No. of participants | Statistical method | Effect size |
| 1 Change in physical health 6‐24 months Show forest plot | 4 | Std. Mean Difference (IV, Random, 95% CI) | Totals not selected | |
| 2 Change in physical health 1‐3 months Show forest plot | 4 | Std. Mean Difference (IV, Random, 95% CI) | Totals not selected | |
| 3 Change in mental health 6‐24 months Show forest plot | 3 | 795 | Std. Mean Difference (IV, Random, 95% CI) | ‐0.04 [‐0.18, 0.10] |
| 4 Change in mental health 1‐3 months Show forest plot | 3 | 904 | Std. Mean Difference (IV, Random, 95% CI) | ‐0.00 [‐0.13, 0.13] |
| Outcome or subgroup title | No. of studies | No. of participants | Statistical method | Effect size |
| 1 Change in physical symptoms 6‐24 months Show forest plot | 5 | Std. Mean Difference (IV, Random, 95% CI) | Totals not selected | |
| 2 Change in physical symptoms 1‐3 months Show forest plot | 4 | Std. Mean Difference (IV, Random, 95% CI) | Totals not selected | |
| Outcome or subgroup title | No. of studies | No. of participants | Statistical method | Effect size |
| 1 Change in illness worry 6‐24 months Show forest plot | 3 | 928 | Std. Mean Difference (IV, Random, 95% CI) | 0.09 [‐0.04, 0.22] |
| 2 Change in illness worry 1‐3 months Show forest plot | 4 | 1141 | Std. Mean Difference (IV, Random, 95% CI) | 0.07 [‐0.06, 0.19] |
| Outcome or subgroup title | No. of studies | No. of participants | Statistical method | Effect size |
| 1 Change in depression 6‐24 months Show forest plot | 4 | 1007 | Std. Mean Difference (IV, Random, 95% CI) | 0.07 [‐0.05, 0.20] |
| 2 Change in depression 1‐3 months Show forest plot | 5 | 1259 | Std. Mean Difference (IV, Random, 95% CI) | ‐0.00 [‐0.16, 0.15] |
| 3 Change in anxiety 6‐24 months Show forest plot | 2 | 153 | Std. Mean Difference (IV, Random, 95% CI) | ‐0.07 [‐0.38, 0.25] |
| 4 Change in anxiety 1‐3 months Show forest plot | 3 | Std. Mean Difference (IV, Random, 95% CI) | Subtotals only | |
| Outcome or subgroup title | No. of studies | No. of participants | Statistical method | Effect size |
| 1 Discontinuation 6‐24 months Show forest plot | 5 | 1646 | Risk Ratio (M‐H, Random, 95% CI) | 1.25 [1.08, 1.46] |
| 2 Discontinuation 1‐3 months Show forest plot | 5 | 1625 | Risk Ratio (M‐H, Random, 95% CI) | 1.28 [1.06, 1.54] |