Kontrollierter Nabelschnurzug in der Nachgeburtsphase
Zusammenfassung
Hintergrund
Die aktive Leitung der Nachgeburtsphase besteht aus mehreren Interventionen, zu denen das Verabreichen eines prophylaktischen Uterotonikums (bei oder nach der Geburt des Kindes), das Abklemmen und Durchtrennen der Nabelschnur, der kontrollierte Zug an der Nabelschnur (CCT) um die Plazenta zu entbinden und die Massage des Uterus gehören. Nach neuesten Empfehlungen sollte mit dem Abklemmen der Nabelschnur gewartet werden, bis das geburtshilfliche Personal bereit ist CCT anzuwenden. Das Maßnahmenpaket der aktiven Leitung der Nachgeburtsphase vermindert das Risiko einer Nachgeburtsblutung (PPH), ebenso wie die Einzelkomponente, die routinemäßige Gabe von Uterotonika. Um den möglichen Nutzen von CCT abzuklären, sollte dieser quantifiziert werden, da die Anwendung unangenehm ist und Frauen ein interventionsarmes, zurückhaltendes Vorgehen bevorzugen. Zusätzlich hat die Einführung dieser Maßnahme eine Auswirkung auf die Ressourcen bezüglich des Trainings von Gesundheitsfachpersonal.
Ziele
Die Wirkung von CCT in der Nachgeburtsphase zu evaluieren, entweder mit oder ohne konventioneller aktiver Nachgeburtsleitung.
Literatursuche
Wir suchten im Cochrane Pregnancy and Childbirth Group's Trials Register (29. Januar 2014), PubMed (1966 bis 29. Januar 2014) und in Literaturlisten identifizierter Studien.
Auswahlkriterien
Randomisierte kontrollierte Studien, die planmäßige CCT mit keiner geplanten CCT bei Frauen mit Vaginalgeburt vergleichen.
Datenerhebung und ‐analyse
Zwei Autoren untersuchten die Studienqualität und extrahierten Daten mit Hilfe eines standardisierten Datenextraktionsblatts.
Wesentliche Ergebnisse
Wir schlossen drei methodisch gute Studien mit Daten von jeweils 199, 4058 und 23616 Frauen ein. Eine Verblindung war nicht möglich, aber der Bias konnte durch die objektive Messung des Blutverlustes, eingeschränkt werden.
Es gab keinen Unterschied in Bezug auf das Risiko eines Blutverlustes von mehr als 1000ml (drei Studien, 27.454 Frauen; Risikoverhältnis (RR) 0,91, 95% Konfidenzintervall (KI) 0,77 bis 1,08). Die Anzahl manueller Plazentalösungen war mit CCT vermindert (zwei Studien, 27.665 Frauen; RR 0,69, 95% KI 0,57 bis 0,83). In der Studie der Weltgesundheitsorganisation (WHO) reduzierte sich die Anzahl der manuellen Plazentalösungen vor allem an Orten, wo routinemäßig Ergometrin in der Nachgeburtsphase verabreicht wurde. Eine nicht vordefinierte Analyse, welche Orte, an denen routinemäßig Ergometrin in der Nachgeburtsphase verabreicht wird, ausschloß, fand keinen Unterschied zu dem Risiko der manuellen Plazentalösung in der WHO Studie (1 Studie, 23.010 Frauen; RR 1,03, 95% KI 0,73 bis 1,46). Die Regelung, die Dauer der Nachgeburtsphase auf 30 Minuten zu begrenzen (4057 Frauen; RR 0,69, 95% KI 0,53 bis 0,90) könnte einen Effekt in der französischen Studie gehabt haben.
Zu den sekundären Endpunkten zählte eine Verminderung des Blutverlustes von 500 ml oder mehr (drei Studien, 27.454 Frauen; RR 0,93, 95% KI 0,88 bis 0,99), durchschnittlicher Blutverlust (2 Studien, 27.255 Frauen; Mittelwertdifferenz (MD) ‐10,85 ml, 95% KI ‐16,73 bis ‐4,98), und Dauer der Nachgeburtsphase (2 Studien, 27.360 Frauen; standardisierte MD ‐0.57, ‐0,59 bis ‐0,54). Es gab keine klaren Unterschiede in Bezug auf den Gebrauch von zusätzlichen Uterotonika (drei Studien, 27.829 Frauen; durchschnittlicher RR 0,95, 95% KI 0,88 bis 1,02), Bluttransfusion, mütterlicher Tod/schwere Morbidität, operative Eingriffe oder mütterliche Zufriedenheit. Mütterlicher Schmerz (nicht vorab festgelegt) wurde in einer Studie vermindert (3760 Frauen; RR 0,78, KI 0,61 bis 0,99).
Folgende sekundäre Endpunkte wurden in keiner der Studien erwähnt: Verzögerte Plazentalösung von mehr als 60 Minuten oder wie durch den Studienautor definiert; mütterlicher Hämoglobinwert weniger als 9g/dl nach 24 bis 48 Stunden nach der Geburt oder Bluttransfusion; Organversagen, Verlegung auf Intensivstation, Zufriedenheit des betreuenden Gesundheitsfachpersonals, Wirtschaftlichkeit, Nachkürretage oder Infektion.
Schlussfolgerungen der Autoren
Unter Umständen hat CCT den Vorteil das Risiko einer manuellen Plazentalösung zu verringern. Evidenz weist darauf hin, dass CCT routinemäßig in der Nachgeburtsperiode angeboten werden kann, vorausgesetzt das geburtshilfliche Personal hat die notwendige Ausbildung. CCT sollte eine Kernkompetenz von ausgebildetem geburtshilflichem Personal bleiben. Jedoch würde der begrenzte Nutzen der CCT bezüglich einer schweren Nachblutung (PPH) nicht die erhebliche Investition rechtfertigen, welche für ein Training in CCT‐Fähigkeiten für nicht formelle ausgebildete Hebammen benötigt würde. Frauen, die eine interventionsärmere Nachgeburtsleitung bevorzugen, kann versichert werden, dass bei Verabreichung eines Uterotonikums, CCT aus dem Maßnahmenpaket des aktiven Managements der Nachgeburtsphase weggelassen werden kann, ohne das Risiko einer schweren Nachblutung zu erhöhen, sich das Risiko einer manuellen Plazentalösung jedoch erhöhen könnte.
Es gibt Forschungslücken bezüglich der Anwendung von CCT ohne die Verabreichung eines Uterotonikums und der Rolle der Uterusmassage in der Leitung der Nachgeburtsphase.
PICO
Laienverständliche Zusammenfassung
Zug an der Nabelschnur um die Plazenta zu entbinden
Als Nachgeburtsphase bezeichnet man die Zeit zwischen der Geburt des Kindes und dem kompletten Ausstoßen der Plazenta. Ein gewisser Blutverlust nach der Geburt des Kindes aufgrund der Plazentalösung ist normal. Schwere Nachgeburtsblutungen (PPH) sind eine der Hauptursachen für den Tod von Müttern sowohl in einkommensstarken als auch in einkommensschwachen Ländern. Als "aktive Leitung der Nachgeburtsphase" bezeichnet man folgende Interventionen: die Mutter bekommt ein Medikament (normalerweise per Injektion), um der Gebärmutter zu helfen sich zu kontrahieren, die Nabelschnur wird durchtrennt und an der Nabelschnur wird mit gleichzeitigem Gegendruck auf die Gebärmutter gezogen, um bei der Entbindung der Plazenta zu helfen (kontrollierter Nabelschnurzug, CCT). Dies kann für die Mutter unangenehm sein und im Widerspruch zu ihrem Wunsch nach einer natürlichen Geburt stehen. Das geburtshilfliche Personal braucht ein spezielles Training um eine CCT auszuführen.
Dieser Review randomisierter kontrollierter Studien beinhaltet drei Studien, die Frauen mit Vaginalgeburten einschließen. Die Studien waren methodologisch gut und die Ergebnisse konsistent. Eine der Studien war eine große Studie mit 23.000 beteiligten Frauen aus acht Ländern, eine andere wurde an verschiedenen Orten in Frankreich mit über 4.000 Frauen durchgeführt und eine Studie aus Uruguay mit fast 200 Frauen, wurde an einem einzelnen Zentrum durchgeführt. Schwere PPH (Blutverlust > 1000 ml) wurde durch kontrollierten Zug an der Nabelschnur (CCT) nicht eindeutig verringert, aber CCT führte zu einer kleinen Reduktion von PPH (Blutverlust > 500ml) und des durchschnittlichen Blutverlusts. Das Risiko die Plazentalösung manuell durchführen zu müssen wurde verringert. Wenn das geburtshilfliche Personal den kontrollierten Zug an der Nabelschnur sicher beherrscht, sollte die Maßnahme empfohlen werden.
Authors' conclusions
Background
Description of the condition
The third stage of labour refers to the period between the birth of the baby and complete expulsion of the placenta. Some degree of blood loss occurs after the birth of the baby due to separation of the placenta. This is a risky period, because the uterus may not contract well after birth and heavy blood loss can endanger the life of the mother. Different approaches, such as active management and expectant management, are proposed for the management of the third stage of labour.
Postpartum haemorrhage is defined as blood loss of 500 mL or more after birth; severe postpartum haemorrhage as 1000 mL or more. Postpartum haemorrhage is a major cause of maternal mortality in both high‐income and low‐income countries. Globally, it is estimated that postpartum haemorrhage occurs in about 11% of women who give birth. The incidence is thought to be much higher in low‐income countries, where many women do not have access to a skilled attendant at birth, and where active management of the third stage of labour may not be routine (Mousa 2007).
Description of the intervention
Once the uterus is felt to contract, traction is applied to the umbilical cord with counter‐pressure suprapubically on the uterus, until the placenta delivers.
Active management consists of a group of interventions, including administration of a prophylactic uterotonic (at or after delivery of the baby), early cord clamping and cutting, controlled cord traction to deliver the placenta, and uterine massage. Recently, due to emerging data on beneficial effects of delayed cord clamping on term (McDonald 2013) and preterm (Rabe 2012) newborn haematological indices, international recommendations on the timing of cord clamping have changed. It is recommended to delay cord clamping until the caregiver is ready to initiate controlled cord traction (thought to be around two to three minutes) (WHO 2007). Uterotonics, used as part of the active management of the third stage of labour include synthetic oxytocin, ergometrine, and various prostaglandins. Oxytocin has the advantage of minimal side effects when given intramuscularly or by slow intravenous infusion. The limitations are that it is not very heat stable, and requires parenteral administration. Uterine massage (transabdominal rubbing of the uterus to stimulate contractions by release of endogenous prostaglandins) is usually recommended after delivery of the placenta.
On the other hand, expectant management means waiting for the signs of separation of the placenta and its spontaneous delivery, and late cord clamping, which is clamping the umbilical cord when cord pulsation has ceased (hands‐off approach) (Begley 2011).
There is good evidence that the package of active management of the third stage of labour in women at mixed risk of bleeding reduces the occurrence of severe postpartum haemorrhage by approximately 60% to 70% (Begley 2011). A survey of policies in 14 European countries (part of the EUPHRATES Study) found that policies of using uterotonics for the management of the third stage of labour are widespread, but policies about agents, timing, clamping, and cutting the umbilical cord and the use of controlled cord traction differ widely (Winter 2007). Differences in policies and quality of care (Bouvier‐Colle 2001) have been cited as being responsible for large differences (up to 10‐fold) in rates of postpartum haemorrhage between countries in Europe (Zhang 2005).
Controlled cord traction is one of the components of active management of the third stage of labour that requires training in manual skill for it to be performed appropriately. Cord traction was introduced into obstetric practice by Brandt in 1933 and Andrews in 1940 (Brandt 1933). The procedure, which became known as the Brandt‐Andrews manoeuvre, consists of elevating the uterus suprapubically while maintaining steady traction on the cord, once there is clinical evidence of placental separation and the uterus is contracted. In 1962, the term 'controlled cord traction' was introduced by Spencer as a modification which aims to facilitate the separation of the placenta once the uterus contracts, and thus shorten the third stage of labour (Spencer 1962). This is achieved by applying traction on the cord, accompanied by counter‐traction to the body of the uterus towards the umbilicus (Stearn 1963). Current clinical recommendations and most recent studies describe this or a similar method (ICM 2003).
Controlled cord traction may result in complications such as uterine inversion, particularly if traction is applied before the uterus has contracted sufficiently, and without applying effective counter‐pressure to the uterine fundus. It is therefore a manual skill, which requires considerable practical training in order to be applied safely. Its use is limited to settings with access to birth attendants with reasonably high levels of skill and training. If it is possible to omit controlled cord traction from the active management package without losing efficacy, this would have major implications for effective management of the third stage of labour in settings with limited human resources.
Expectant management of the third stage of labour is preferred by some women and practitioners. It is seen as a more physiological and less interventionist approach, avoids uncomfortable procedures shortly after birth when the mother wishes to concentrate on the baby, and reduces the risk of uterine inversion. Sometimes nipple stimulation is used to enhance uterine contractions by stimulating the release of endogenous oxytocin.
Cord traction may be used during caesarean section. This is covered in another Cochrane review (Anorlu 2008).
How the intervention might work
Cord traction may hasten the process of separation and delivery of the placenta, thus reducing blood loss and the incidence of retained placenta. It is thought that administration of a uterotonic drug may cause uterine contraction and retention of the placenta if not combined with controlled cord traction.
Why it is important to do this review
Active management of the third stage of labour (AMTSL) has been shown to be beneficial. Controlled cord traction (CCT) is one of the components of AMTSL. This technique, however, requires training in manual skill for it to be performed appropriately. At community level, where there are limited trained personnel, controlled cord traction may be difficult and costly to implement. It is therefore, important to evaluate whether CCT is really necessary as part of the AMTSL package.
Objectives
To evaluate the effects of controlled cord traction during the third stage of labour, either with or without conventional active management.
Methods
Criteria for considering studies for this review
Types of studies
We considered randomised controlled trials evaluating the effects of controlled cord traction. Cluster‐randomised trials would also be included but we would exclude quasi‐random allocation trials. Trials using a cross‐over design would not be appropriate as each participant has only one opportunity for the intervention.
Types of participants
Women who have given birth vaginally at 24 weeks' gestation or more.
Types of interventions
Controlled cord traction versus no controlled cord traction (both with uterotonics).
Controlled cord traction versus no controlled cord traction (both with no uterotonics, with or without uterine massage as an additional intervention).
Types of outcome measures
We chose severe postpartum haemorrhage (blood loss 1000 mL or more) as one primary outcome, as blood loss between 500 mL and 1000 mL is not usually associated with serious clinical morbidity.
Primary outcomes
-
Blood loss of 1000 mL or more after birth
-
Manual removal of the placenta
Secondary outcomes
-
Blood loss of 500 mL or more after birth
-
Mean blood loss
-
Mean duration of the third stage of labour
-
Retained placenta for more than 60 minutes or as defined by trial author
-
Blood transfusion
-
Maternal haemoglobin less than 9 g/dL at 24 to 48 hours post‐delivery or blood transfusion
-
Use of additional uterotonics during or after the third stage of labour
-
Maternal death or severe morbidity (e.g. operative procedures, organ failure, intensive care unit admission)
-
Operative procedures (e.g. hysterectomy, uterine compression sutures)
-
Organ failure
-
Intensive care unit admission
-
Maternal death
-
Maternal satisfaction
-
Caregiver satisfaction
-
Measures of cost‐effectiveness as defined by trial authors
-
Evacuation of retained products
-
Infection
-
Maternal pain (non‐prespecified outcome)
-
Cord rupture (non‐prespecified outcome)
-
Uterine inversion (non‐prespecified outcome)
Search methods for identification of studies
The following methods section of this review is based on a standard template used by the Cochrane Pregnancy and Childbirth Group.
Electronic searches
We searched the Cochrane Pregnancy and Childbirth Group’s Trials Register by contacting the Trials Search Co‐ordinator (29 January 2014).
The Cochrane Pregnancy and Childbirth Group’s Trials Register is maintained by the Trials Search Co‐ordinator and contains trials identified from:
-
monthly searches of the Cochrane Central Register of Controlled Trials (CENTRAL);
-
weekly searches of MEDLINE (Ovid);
-
weekly searches of Embase (Ovid);
-
handsearches of 30 journals and the proceedings of major conferences;
-
weekly current awareness alerts for a further 44 journals plus monthly BioMed Central email alerts.
Details of the search strategies for CENTRAL, MEDLINE and Embase, the list of handsearched journals and conference proceedings, and the list of journals reviewed via the current awareness service can be found in the ‘Specialized Register’ section within the editorial information about the Cochrane Pregnancy and Childbirth Group.
Trials identified through the searching activities described above are each assigned to a review topic (or topics). The Trials Search Co‐ordinator searches the register for each review using the topic list rather than keywords.
In addition we searched PubMed (1966 to 29 January 2014) using the search strategy detailed in Appendix 1.
Searching other resources
We searched the reference lists of retrieved studies.
We did not apply any language or date restrictions.
Data collection and analysis
The authors participated in a multicentre clinical trial of controlled cord traction (Gülmezoglu 2012). Decisions regarding the inclusion and interpretation of this trial were checked independently by a Research Associate working for the Cochrane Pregnancy and Childbirth Group.
The following methods section of this review is based on a standard template used by the Cochrane Pregnancy and Childbirth Group.
Selection of studies
Two review authors (Justus Hofmeyr (GJH) and Nolundi Mshweshwe (NM)) independently assessed for inclusion all the potential studies identified as a result of the search strategy. We resolved any disagreement through discussion or, if required, consulted the third author or, if necessary, the editor assigned to the review.
Data extraction and management
We designed a form to extract data. For eligible studies, GJH and NM extracted the data using the agreed form. We resolved discrepancies through discussion. We entered data into Review Manager software (RevMan 2014) and checked it for accuracy.
When information regarding any of the above was unclear, we attempted to contact authors of the original reports to provide further details.
Assessment of risk of bias in included studies
Two review authors (GJH and NM) independently assessed risk of bias for each study using the criteria outlined in the Cochrane Handbook for Systematic Reviews of Interventions (Higgins 2011). We resolved any disagreement by discussion or, if necessary, by involving another assessor.
(1) Sequence generation (checking for possible selection bias)
We described for each included study the method used to generate the allocation sequence in sufficient detail to allow an assessment of whether it should produce comparable groups.
We assessed the method as:
-
low risk of bias (any truly random process, e.g. random number table; computer random number generator);
-
high risk of bias (any non‐random process, e.g. odd or even date of birth; hospital or clinic record number);
-
unclear risk of bias.
(2) Allocation concealment (checking for possible selection bias)
We described for each included study the method used to conceal allocation to interventions prior to assignment and assessed whether intervention allocation could have been foreseen in advance of, or during recruitment, or changed after assignment.
We assessed the methods as:
-
low risk of bias (e.g. telephone or central randomisation; consecutively numbered sealed opaque envelopes);
-
high risk of bias (open random allocation; unsealed or non‐opaque envelopes, alternation; date of birth);
-
unclear risk of bias.
(3.1) Blinding of participants and personnel (checking for possible performance bias)
We described for each included study the methods used, if any, to blind study participants and personnel from knowledge of which intervention a participant received. We considered that studies were at low risk of bias if they were blinded, or if we judged that the lack of blinding would be unlikely to affect results. We planned to assess blinding separately for different outcomes or classes of outcomes.
We assessed the methods as:
-
low, high or unclear risk of bias for participants;
-
low, high or unclear risk of bias for personnel.
(3.2) Blinding of outcome assessment (checking for possible detection bias)
We described for each included study the methods used, if any, to blind outcome assessors from knowledge of which intervention a participant received. We planned to assess blinding separately for different outcomes or classes of outcomes.
We assessed methods used to blind outcome assessment as:
-
low, high or unclear risk of bias.
(4) Incomplete outcome data (checking for possible attrition bias due to the amount, nature and handling of incomplete outcome data)
We described for each included study, and for each outcome or class of outcomes, the completeness of data including attrition and exclusions from the analysis. We stated whether attrition and exclusions were reported and the numbers included in the analysis at each stage (compared with the total randomised participants), reasons for attrition or exclusion where reported, and whether missing data were balanced across groups or were related to outcomes. Where sufficient information was reported, or could be supplied by the trial authors, we planned to re‐include missing data in the analyses which we undertook.
We assessed methods as:
-
low risk of bias (e.g. no missing outcome data; missing outcome data balanced across groups; or less than 20% losses to follow‐up);
-
high risk of bias (e.g. numbers or reasons for missing data imbalanced across groups; ‘as treated’ analysis done with substantial departure of intervention received from that assigned at randomisation);
-
unclear risk of bias.
(5) Selective reporting bias
We described for each included study how we investigated the possibility of selective outcome reporting bias and what we found. We assessed the methods as:
-
low risk of bias (where it is clear that all of the study’s prespecified outcomes and all expected outcomes of interest to the review have been reported);
-
high risk of bias (where not all the study’s prespecified outcomes have been reported; one or more reported primary outcomes were not prespecified; outcomes of interest are reported incompletely and so cannot be used; study fails to include results of a key outcome that would have been expected to have been reported);
-
unclear risk of bias.
(6) Other sources of bias (checking for bias due to problems not covered by (1) to (5) above)
We described for each included study any important concerns we had about other possible sources of bias.
We assessed whether studies that included multiple pregnancies accounted appropriately for non‐independence of babies from the same pregnancy in the analysis. There are several ways this can be done, and these studies should present something like an odds ratio adjusted for non‐independence. If adjustment was not done, we assessed the potential for bias i.e. if multiples only made up a small proportion of the total then there is probably not much potential for bias.
We assessed whether each study was free of other problems that could put it at risk of bias:
-
low risk of other bias;
-
high risk of other bias;
-
unclear whether there is risk of other bias.
(7) Overall risk of bias
We made explicit judgements about whether studies are at high risk of bias, according to the criteria given in the Cochrane Handbook for Systematic Reviews of Interventions (Higgins 2011). With reference to (1) to (6) above, we assessed the likely magnitude and direction of the bias and whether we consider it likely to impact on the findings. In future updates of this review, as more data become available we will explore the impact of the level of bias through undertaking sensitivity analyses (see Sensitivity analysis).
Measures of treatment effect
Dichotomous data
For dichotomous data, we presented results as summary risk ratios (RRs) with 95% confidence intervals (CIs).
Continuous data
For continuous data, we used the mean difference (MD) if outcomes are measured in the same way between trials. In future updates, if appropriate, we will use the standardised MD to combine trials that measure the same outcome, but use different methods.
Unit of analysis issues
Cluster‐randomised trials
In future updates, if cluster‐randomised trials are identified for inclusion, we will include cluster‐randomised trials in the analyses along with individually randomised trials. We will adjust their sample using the methods described in the Cochrane Handbook for Systematic Reviews of Interventions using an estimate of the intracluster correlation co‐efficient (ICC) derived from the trial (if possible), from a similar trial or from a study of a similar population (Higgins 2011). If we use ICCs from other sources, we will report this and conduct sensitivity analyses to investigate the effect of variation in the ICC. If we identify both cluster‐randomised trials and individually randomised trials, we plan to synthesise the relevant information. We will consider it reasonable to combine the results from both if there is little heterogeneity between the study designs and the interaction between the effect of intervention and the choice of randomisation unit is considered to be unlikely.
We will also acknowledge heterogeneity in the randomisation unit and perform a subgroup analysis to investigate the effects of the randomisation unit.
Dealing with missing data
For included studies, we note levels of attrition. In future updates, as more data become available we will explore the impact of including studies with high levels of missing data in the overall assessment of treatment effect by using sensitivity analysis.
For all outcomes, we will carry out analyses, as far as possible, on an intention‐to‐treat basis, i.e. we attempt to include all participants randomised to each group in the analyses, and all participants will be analysed in the group to which they were allocated, regardless of whether or not they received the allocated intervention. The denominator for each outcome in each trial will be the number randomised minus any participants whose outcomes are known to be missing.
Assessment of heterogeneity
We assessed statistical heterogeneity in each meta‐analysis using the Tau², I² and Chi² statistics. We regarded heterogeneity as substantial if I² is greater than 30% and either Tau² is greater than zero, or there is a low P value (less than 0.10) in the Chi² test for heterogeneity.
Assessment of reporting biases
When there are 10 or more studies in the meta‐analysis we will investigate reporting biases (such as publication bias) using funnel plots. We will assess funnel plot asymmetry visually. If asymmetry is suggested by a visual assessment, we will perform exploratory analyses to investigate it.
Data synthesis
We carried out statistical analysis using Review Manager software (RevMan 2014). We used fixed‐effect meta‐analysis for combining data where it was reasonable to assume that studies were estimating the same underlying treatment effect: i.e. where trials were examining the same intervention, and the trials’ populations and methods were judged sufficiently similar. If there was clinical heterogeneity sufficient to expect that the underlying treatment effects differed between trials, or if substantial statistical heterogeneity was detected, we used random‐effects meta‐analysis to produce an overall summary if an average treatment effect across trials was considered clinically meaningful. The random‐effects summary was treated as the average of the range of possible treatment effects and we discussed the clinical implications of treatment effects differing between trials. If the average treatment effect was not clinically meaningful we did not combine trials.
For the random‐effects analyses, the results were presented as the average treatment effect with its 95% CI, and the estimates of Tau² and I².
Subgroup analysis and investigation of heterogeneity
In future updates of this review, if we identify substantial heterogeneity, we will investigate it using subgroup analyses and sensitivity analyses. We will consider whether an overall summary is meaningful, and if it is, use random‐effects analysis to produce it.
We plan to carry out the following subgroup analyses.
-
Women with routine use of uterotonics, no routine use, or mixed/uncertain use.
-
Women with routine use of uterine massage before or after placental delivery, no routine use, or mixed/unclear use.
-
Women with and without placental drainage, or mixed or unclear use of placental drainage.
We will use all outcomes in the subgroup analysis.
We will assess subgroup differences by interaction tests available within Review Manager (RevMan 2014). We will report the results of subgroup analyses quoting the Chi² statistic and P value, and the interaction test I² value.
Sensitivity analysis
As more data become available we will conduct sensitivity analyses by comparing the outcomes before and after exclusion of trials with 'high' or 'unclear' risk of bias for sequence generation or allocation concealment.
We have conducted a non‐prespecified sensitivity analysis excluding sites where ergometrine was used for third stage management. The reason for this is that in the largest trial included in the review (Gülmezoglu 2012), a reduction in manual removal of the placenta was found to be limited to the Philippines sites, which were the only sites where ergometrine was routinely used for third stage management.
Results
Description of studies
Results of the search
The search of the Cochrane Pregnancy and Childbirth Group's Trials Register found 14 trial reports: we included three studies (Althabe 2009; Deneux‐Tharaux 2012; Gülmezoglu 2012), and excluded five studies (Artymuk 2014; Bonham 1963; Kemp 1971; Khan 1997; Sharma 2005). The PubMed search did not retrieve any additional papers (see Figure 1).

Study flow diagram.
Included studies
We included three studies (Althabe 2009; Deneux‐Tharaux 2012; Gülmezoglu 2012) (see Characteristics of included studies).
Excluded studies
We excluded five studies (see Characteristics of excluded studies). Three were excluded because they were quasi‐randomised trials (Artymuk 2014; Bonham 1963; Kemp 1971). Two trials were excluded because they compared controlled cord traction (CCT) with routine uterotonics with passive third stage without early uterotonics (oxytocin infusion only after delivery of the placenta) (Khan 1997), or draining versus non‐draining of the placenta (Sharma 2005).
Risk of bias in included studies
Please see Figure 2 and Figure 3 for a summary of risk of bias assessments.

Risk of bias graph: review authors' judgements about each risk of bias item presented as percentages across all included studies.

Risk of bias summary: review authors' judgements about each risk of bias item for each included study.
Allocation
We assessed all three trials (Althabe 2009; Deneux‐Tharaux 2012; Gülmezoglu 2012) as having low risk of bias for allocation concealment and sequence generation. All three used appropriate random sequence generation, and allocation concealment was by means of opaque sealed envelopes (Althabe 2009), on‐line allocation (Deneux‐Tharaux 2012) or local computer‐based allocation (Gülmezoglu 2012).
Blinding
Blinding was not possible (Althabe 2009; Deneux‐Tharaux 2012; Gülmezoglu 2012). Since the researchers were unblinded as to which group the participant belonged to, there is high risk of observer bias. Bias in the assessment of blood loss was minimised by using objective measurement.
Incomplete outcome data
Only 5/204 women were not included in the final analysis in the Althabe 2009 study. In the Gülmezoglu 2012 trial a modified intention‐to‐treat analysis (excluding women delivered by caesarean section ‐ 343 in the CCT group and 366 in the no CCT group) was used. The final numbers included in the analysis were 11,820/12,163 (97.2%) allocated, and 11,861/12,227 (97.0%), respectively. In the study of Deneux‐Tharaux 2012, 297 (6.8%) were excluded after enrolment, 294 for intrapartum caesarean section and three declined to participate.
Selective reporting
There are no obvious sources of selective reporting.
Other potential sources of bias
No obvious sources of bias, other than the lack of blinding.
Effects of interventions
There was heterogeneity between the trials for several outcomes, and for which we used a random‐effects analysis.
Primary analysis including sites routinely using ergometrine for management of the third stage of labour
Primary outcomes
There was no difference in the risk of blood loss ≥ 1000 mL (three trials, 27,454 women; risk ratio (RR) 0.91, 95% confidence interval (CI) 0.77 to 1.08) (Analysis 1.1). Manual removal of the placenta was reduced with CCT (two trials, 27,665 women; RR 0.69, 95% CI 0.57 to 0.83) (Analysis 1.2). In the WHO trial the reduction in manual removal occurred mainly in sites where ergometrine was used routinely in the third stage of labour (see sensitivity analysis below). In the French study the effect on manual removal of the placenta may have been due to the policy of restricting the third stage of labour to 30 minutes.
Secondary outcomes
Among the secondary outcomes, there were reductions in blood loss ≥ 500 mL (three trials, 27,454 women; RR 0.93, 95% CI 0.88 to 0.99) (Analysis 1.3), mean blood loss (two trials, 27,255 women; mean difference (MD) ‐10.85 mL, 95% CI ‐16.73 to ‐4.98) (Analysis 1.4), and duration of the third stage of labour (two trials, 27,360 women; standardised MD ‐0.57, ‐0.59 to ‐0.54) (Analysis 1.5). There was no clear reduction in use of additional uterotonics (three trials, 27,829 women; average RR 0.95, 95% CI 0.88 to 1.02; heterogeneity: Tau² = 0.00; Chi² = 3.44, df = 2 (P = 0.18); I² = 42%) (Analysis 1.7), blood transfusion (Analysis 1.6), maternal death/severe morbidity (Analysis 1.8; Analysis 1.10), operative procedures (Analysis 1.9), nor maternal satisfaction (Analysis 1.11). Non‐prespecified outcomes: one case of uterine inversion was reported with CCT (Analysis 1.14), maternal pain was reduced in one trial (3760 women; RR 0.78, 95% CI 0.61 to 0.99) (Analysis 1.12); in one trial cord rupture as expected was far more common with CCT (89/2034 versus 2/2024; 4058 women; RR 44.28, 95% CI 10.92 to 179.58) (Analysis 1.13).
The following secondary outcomes were not reported upon in any of the trials: retained placenta for more than 60 minutes or as defined by trial author; maternal haemoglobin less than 9 g/dL at 24 to 48 hours post‐delivery or blood transfusion; organ failure; intensive care unit admission; caregiver satisfaction; cost‐effectiveness; evacuation of retained products; or infection.
Non‐prespecified sensitivity analysis excluding sites routinely using ergometrine for management of the third stage of labour
Primary outcomes
The results excluding sites routinely using ergometrine for management of the third stage of labour were similar to the primary analysis (Analysis 2.1), except that the difference in the risk of manual removal of the placenta in the WHO trial was eliminated (one trial, 23,010 women; RR 1.03, 95% CI 0.73 to 1.46) (Analysis 2.2). This result was significantly different from the result of the French trial (4057 women; RR 0.69, 95% CI 0.53 to 0.90) (Analysis 2.2). The effect in the French trial may have been due to the fact that the duration of the third stage of labour was limited to 30 minutes. Because of substantial clinical and statistical heterogeneity, we did not combine the results of the two trials.
Secondary outcomes
There were marginal changes for only two results: the reduction in blood loss ≥ 500 mL was no longer statistically significant (three trials, 23,043 women; RR 0.94, 95% CI 0.87 to 1.01), probably because a reduction in sample size increased the 95% CI (Analysis 2.3); and the reduction in use of additional uterotonics was significant (three trials, 23,175 women; RR 0.92, 95% CI 0.87 to 0.98), probably because there was less heterogeneity and we used a fixed‐effect analysis (Analysis 2.7). For all other secondary outcomes, the results were similar to the primary analysis (Analysis 2.4; Analysis 2.5; Analysis 2.6; Analysis 2.8; Analysis 2.9; Analysis 2.10; Analysis 2.11).
Discussion
Summary of main results
The results of this review are dominated by the large WHO trial (Gülmezoglu 2012), but are consistent with the results of the smaller trials (Althabe 2009; Deneux‐Tharaux 2012). There was no significant reduction in severe postpartum haemorrhage (PPH) (blood loss > 1000 mL), but a small reduction in PPH (blood loss > 500 mL) and mean blood loss with controlled cord traction (CCT). There was a significant reduction in manual removal of the placenta. In the WHO trial (Gülmezoglu 2012), the reduction in manual removal occurred mainly in sites where ergometrine was used routinely in the third stage of labour. The non‐prespecified analysis, excluding sites routinely using ergometrine for management of the third stage of labour, found no difference in the risk of manual removal of the placenta in the WHO trial. There may be some evidence that this decrease could be driven by imposed limitations on third stage times or by the routine use of ergometrine at some trial sites.
Overall completeness and applicability of evidence
The evidence includes a large, multicentre trial conducted by the WHO in several continents (Gülmezoglu 2012), a large trial in several centres in France (Deneux‐Tharaux 2012), as well as a small single centre trial in Uruguay (Althabe 2009) and should be widely applicable.
Quality of the evidence
The quality of the evidence is high in that three methodologically sound trials with large sample sizes are included. Lack of blinding is a possible source of bias, but has been minimised by use of objective measurement of blood loss.
Potential biases in the review process
The authors participated in one of the included trials (Gülmezoglu 2012). Decisions regarding the inclusion and interpretation of this trial were checked independently by a Research Associate working for the Cochrane Pregnancy and Childbirth Group.
Agreements and disagreements with other studies or reviews
The findings of the review were consistent with those of the two excluded quasi‐randomised controlled trials (Bonham 1963; Kemp 1971).

Study flow diagram.

Risk of bias graph: review authors' judgements about each risk of bias item presented as percentages across all included studies.

Risk of bias summary: review authors' judgements about each risk of bias item for each included study.
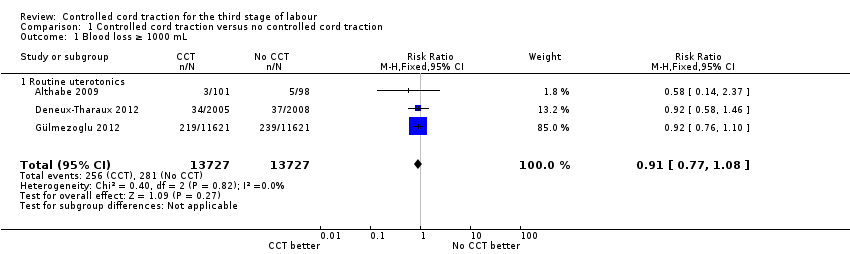
Comparison 1 Controlled cord traction versus no controlled cord traction, Outcome 1 Blood loss ≥ 1000 mL.

Comparison 1 Controlled cord traction versus no controlled cord traction, Outcome 2 Manual removal of the placenta.

Comparison 1 Controlled cord traction versus no controlled cord traction, Outcome 3 Blood loss ≥ 500 mL.

Comparison 1 Controlled cord traction versus no controlled cord traction, Outcome 4 Blood loss.

Comparison 1 Controlled cord traction versus no controlled cord traction, Outcome 5 Duration of 3rd stage of labour (minutes).

Comparison 1 Controlled cord traction versus no controlled cord traction, Outcome 6 Blood transfusion.

Comparison 1 Controlled cord traction versus no controlled cord traction, Outcome 7 Additional uterotonics used.

Comparison 1 Controlled cord traction versus no controlled cord traction, Outcome 8 Maternal death or severe morbidity.

Comparison 1 Controlled cord traction versus no controlled cord traction, Outcome 9 Operative procedures.

Comparison 1 Controlled cord traction versus no controlled cord traction, Outcome 10 Maternal death.

Comparison 1 Controlled cord traction versus no controlled cord traction, Outcome 11 Maternal satisfaction.

Comparison 1 Controlled cord traction versus no controlled cord traction, Outcome 12 Pain (not prespecified).

Comparison 1 Controlled cord traction versus no controlled cord traction, Outcome 13 Cord rupture (not prespecified).

Comparison 1 Controlled cord traction versus no controlled cord traction, Outcome 14 Uterine inversion (not prespecified).

Comparison 2 Controlled cord traction versus no controlled cord traction (excluding sites using ergometrine ‐ not prespecified), Outcome 1 Blood loss ≥ 1000 mL.

Comparison 2 Controlled cord traction versus no controlled cord traction (excluding sites using ergometrine ‐ not prespecified), Outcome 2 Manual removal of the placenta.

Comparison 2 Controlled cord traction versus no controlled cord traction (excluding sites using ergometrine ‐ not prespecified), Outcome 3 Blood loss ≥ 500 mL.
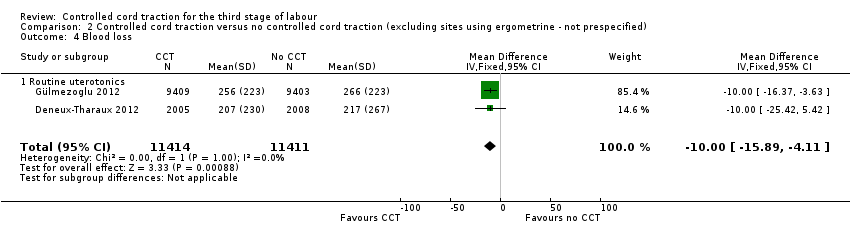
Comparison 2 Controlled cord traction versus no controlled cord traction (excluding sites using ergometrine ‐ not prespecified), Outcome 4 Blood loss.

Comparison 2 Controlled cord traction versus no controlled cord traction (excluding sites using ergometrine ‐ not prespecified), Outcome 5 Duration of 3rd stage of labour (minutes).

Comparison 2 Controlled cord traction versus no controlled cord traction (excluding sites using ergometrine ‐ not prespecified), Outcome 6 Blood transfusion.
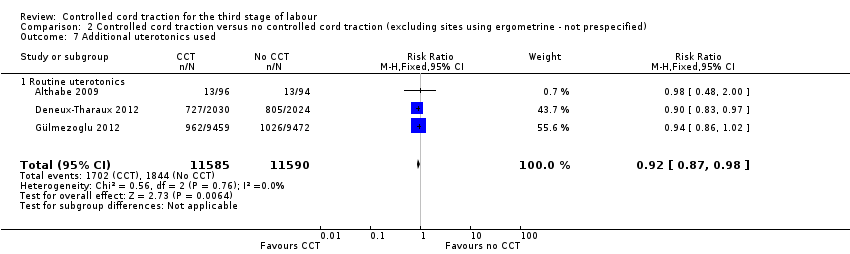
Comparison 2 Controlled cord traction versus no controlled cord traction (excluding sites using ergometrine ‐ not prespecified), Outcome 7 Additional uterotonics used.
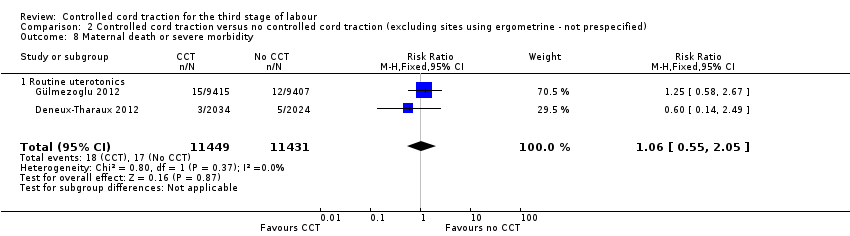
Comparison 2 Controlled cord traction versus no controlled cord traction (excluding sites using ergometrine ‐ not prespecified), Outcome 8 Maternal death or severe morbidity.

Comparison 2 Controlled cord traction versus no controlled cord traction (excluding sites using ergometrine ‐ not prespecified), Outcome 9 Operative procedures.

Comparison 2 Controlled cord traction versus no controlled cord traction (excluding sites using ergometrine ‐ not prespecified), Outcome 10 Maternal death.

Comparison 2 Controlled cord traction versus no controlled cord traction (excluding sites using ergometrine ‐ not prespecified), Outcome 11 Uterine inversion (not prespecified).
| Outcome or subgroup title | No. of studies | No. of participants | Statistical method | Effect size |
| 1 Blood loss ≥ 1000 mL Show forest plot | 3 | 27454 | Risk Ratio (M‐H, Fixed, 95% CI) | 0.91 [0.77, 1.08] |
| 1.1 Routine uterotonics | 3 | 27454 | Risk Ratio (M‐H, Fixed, 95% CI) | 0.91 [0.77, 1.08] |
| 2 Manual removal of the placenta Show forest plot | 2 | 27665 | Risk Ratio (M‐H, Fixed, 95% CI) | 0.69 [0.57, 0.83] |
| 2.1 Routine uterotonics | 2 | 27665 | Risk Ratio (M‐H, Fixed, 95% CI) | 0.69 [0.57, 0.83] |
| 3 Blood loss ≥ 500 mL Show forest plot | 3 | 27454 | Risk Ratio (M‐H, Fixed, 95% CI) | 0.93 [0.88, 0.99] |
| 3.1 Routine uterotonics | 3 | 27454 | Risk Ratio (M‐H, Fixed, 95% CI) | 0.93 [0.88, 0.99] |
| 4 Blood loss Show forest plot | 2 | 27255 | Mean Difference (IV, Fixed, 95% CI) | ‐10.85 [‐16.73, ‐4.98] |
| 4.1 Routine uterotonics | 2 | 27255 | Mean Difference (IV, Fixed, 95% CI) | ‐10.85 [‐16.73, ‐4.98] |
| 5 Duration of 3rd stage of labour (minutes) Show forest plot | 2 | 27360 | Std. Mean Difference (IV, Random, 95% CI) | ‐0.57 [‐0.59, ‐0.54] |
| 5.1 Routine uterotonics | 2 | 27360 | Std. Mean Difference (IV, Random, 95% CI) | ‐0.57 [‐0.59, ‐0.54] |
| 6 Blood transfusion Show forest plot | 2 | 27662 | Risk Ratio (M‐H, Fixed, 95% CI) | 0.94 [0.68, 1.32] |
| 6.1 Routine uterotonics | 2 | 27662 | Risk Ratio (M‐H, Fixed, 95% CI) | 0.94 [0.68, 1.32] |
| 7 Additional uterotonics used Show forest plot | 3 | 27829 | Risk Ratio (M‐H, Random, 95% CI) | 0.95 [0.88, 1.02] |
| 7.1 Routine uterotonics | 3 | 27829 | Risk Ratio (M‐H, Random, 95% CI) | 0.95 [0.88, 1.02] |
| 8 Maternal death or severe morbidity Show forest plot | 2 | 27300 | Risk Ratio (M‐H, Random, 95% CI) | 1.22 [0.55, 2.74] |
| 8.1 Routine uterotonics | 2 | 27300 | Risk Ratio (M‐H, Random, 95% CI) | 1.22 [0.55, 2.74] |
| 9 Operative procedures Show forest plot | 2 | 27662 | Risk Ratio (M‐H, Random, 95% CI) | 1.61 [0.22, 11.81] |
| 9.1 Routine uterotonics | 2 | 27662 | Risk Ratio (M‐H, Random, 95% CI) | 1.61 [0.22, 11.81] |
| 10 Maternal death Show forest plot | 1 | 23616 | Risk Ratio (M‐H, Fixed, 95% CI) | 0.50 [0.05, 5.52] |
| 10.1 Routine uterotonics | 1 | 23616 | Risk Ratio (M‐H, Fixed, 95% CI) | 0.50 [0.05, 5.52] |
| 11 Maternal satisfaction Show forest plot | 1 | 3672 | Risk Ratio (M‐H, Fixed, 95% CI) | 0.72 [0.32, 1.61] |
| 11.1 Routine uterotonics | 1 | 3672 | Risk Ratio (M‐H, Fixed, 95% CI) | 0.72 [0.32, 1.61] |
| 12 Pain (not prespecified) Show forest plot | 1 | 3760 | Risk Ratio (M‐H, Fixed, 95% CI) | 0.78 [0.61, 0.99] |
| 12.1 Routine uterotonics | 1 | 3760 | Risk Ratio (M‐H, Fixed, 95% CI) | 0.78 [0.61, 0.99] |
| 13 Cord rupture (not prespecified) Show forest plot | 1 | 4058 | Risk Ratio (M‐H, Fixed, 95% CI) | 44.28 [10.92, 179.58] |
| 13.1 Routine uterotonics | 1 | 4058 | Risk Ratio (M‐H, Fixed, 95% CI) | 44.28 [10.92, 179.58] |
| 14 Uterine inversion (not prespecified) Show forest plot | 3 | 27867 | Risk Ratio (M‐H, Fixed, 95% CI) | 3.01 [0.12, 73.76] |
| 14.1 Routine uterotonics | 3 | 27867 | Risk Ratio (M‐H, Fixed, 95% CI) | 3.01 [0.12, 73.76] |
| Outcome or subgroup title | No. of studies | No. of participants | Statistical method | Effect size |
| 1 Blood loss ≥ 1000 mL Show forest plot | 3 | 23043 | Risk Ratio (M‐H, Fixed, 95% CI) | 0.91 [0.74, 1.11] |
| 1.1 Routine uterotonics | 3 | 23043 | Risk Ratio (M‐H, Fixed, 95% CI) | 0.91 [0.74, 1.11] |
| 2 Manual removal of the placenta Show forest plot | 2 | Risk Ratio (M‐H, Random, 95% CI) | Totals not selected | |
| 2.1 Routine uterotonics | 2 | Risk Ratio (M‐H, Random, 95% CI) | 0.0 [0.0, 0.0] | |
| 3 Blood loss ≥ 500 mL Show forest plot | 3 | 23043 | Risk Ratio (M‐H, Fixed, 95% CI) | 0.94 [0.87, 1.01] |
| 3.1 Routine uterotonics | 3 | 23043 | Risk Ratio (M‐H, Fixed, 95% CI) | 0.94 [0.87, 1.01] |
| 4 Blood loss Show forest plot | 2 | 22825 | Mean Difference (IV, Fixed, 95% CI) | ‐8.00 [‐15.89, ‐4.11] |
| 4.1 Routine uterotonics | 2 | 22825 | Mean Difference (IV, Fixed, 95% CI) | ‐8.00 [‐15.89, ‐4.11] |
| 5 Duration of 3rd stage of labour (minutes) Show forest plot | 2 | 22819 | Std. Mean Difference (IV, Random, 95% CI) | ‐0.54 [‐0.56, ‐0.51] |
| 5.1 Routine uterotonics | 2 | 22819 | Std. Mean Difference (IV, Random, 95% CI) | ‐0.54 [‐0.56, ‐0.51] |
| 6 Blood transfusion Show forest plot | 2 | 23005 | Risk Ratio (M‐H, Random, 95% CI) | 0.85 [0.46, 1.58] |
| 6.1 Routine uterotonics | 2 | 23005 | Risk Ratio (M‐H, Random, 95% CI) | 0.85 [0.46, 1.58] |
| 7 Additional uterotonics used Show forest plot | 3 | 23175 | Risk Ratio (M‐H, Fixed, 95% CI) | 0.92 [0.87, 0.98] |
| 7.1 Routine uterotonics | 3 | 23175 | Risk Ratio (M‐H, Fixed, 95% CI) | 0.92 [0.87, 0.98] |
| 8 Maternal death or severe morbidity Show forest plot | 2 | 22880 | Risk Ratio (M‐H, Fixed, 95% CI) | 1.06 [0.55, 2.05] |
| 8.1 Routine uterotonics | 2 | 22880 | Risk Ratio (M‐H, Fixed, 95% CI) | 1.06 [0.55, 2.05] |
| 9 Operative procedures Show forest plot | 2 | 23005 | Risk Ratio (M‐H, Random, 95% CI) | 1.46 [0.14, 15.73] |
| 9.1 Routine uterotonics | 2 | 23005 | Risk Ratio (M‐H, Random, 95% CI) | 1.46 [0.14, 15.73] |
| 10 Maternal death Show forest plot | 2 | 23016 | Risk Ratio (M‐H, Fixed, 95% CI) | 1.00 [0.06, 16.01] |
| 10.1 Routine uterotonics | 2 | 23016 | Risk Ratio (M‐H, Fixed, 95% CI) | 1.00 [0.06, 16.01] |
| 11 Uterine inversion (not prespecified) Show forest plot | 2 | 4257 | Risk Ratio (M‐H, Fixed, 95% CI) | 0.0 [0.0, 0.0] |
| 11.1 Routine uterotonics | 2 | 4257 | Risk Ratio (M‐H, Fixed, 95% CI) | 0.0 [0.0, 0.0] |