Intervenciones psicológicas y farmacológicas para la depresión en pacientes con arteriopatía coronaria
Resumen
Antecedentes
Con frecuencia las personas con arteriopatía coronaria (AC) presentan depresión y está asociada con un mal pronóstico.
Objetivos
Determinar los efectos de las intervenciones psicológicas y farmacológicas para la depresión en los pacientes con AC y depresión concomitante.
Métodos de búsqueda
Se hicieron búsquedas en las bases de datos CENTRAL, MEDLINE, Embase, PsycINFO y CINAHL hasta agosto de 2020. También se buscó en tres registros de ensayos clínicos en septiembre de 2021. Se examinaron las listas de referencias de los ensayos controlados aleatorizados (ECA) incluidos y se estableció contacto con los autores principales. No se aplicaron restricciones de idioma.
Criterios de selección
Se incluyeron los ECA que investigaron intervenciones psicológicas y farmacológicas para la depresión en adultos con AC y depresión concomitante. Los desenlaces principales fueron la depresión, la mortalidad y los eventos cardíacos. Los desenlaces secundarios fueron los costes y el uso de la asistencia sanitaria, la calidad de vida relacionada con la salud, las constantes vitales cardiovasculares, los biomarcadores de activación plaquetaria, los parámetros de onda del electrocardiograma, los eventos adversos no cardíacos y los efectos secundarios farmacológicos.
Obtención y análisis de los datos
Dos autores de la revisión examinaron de forma independiente los artículos identificados para su inclusión y extrajeron los datos de los estudios incluidos. Se realizaron metanálisis según un modelo de efectos aleatorios para computar las estimaciones globales de los desenlaces del tratamiento.
Resultados principales
Treinta y siete ensayos cumplieron los criterios de inclusión. Las intervenciones psicológicas podrían dar lugar a una reducción de los síntomas de depresión al final del tratamiento en comparación con los controles (diferencia de medias estandarizada [DME] ‐0,55; intervalo de confianza [IC] del 95%: ‐0,92 a ‐0,19; I2 = 88%; evidencia de certeza baja; diez ensayos; n = 1226). No se evidenció ningún efecto sobre los síntomas de depresión a medio plazo entre uno y seis meses después del final del tratamiento (DME ‐0,20; IC del 95%: ‐0,42 a 0,01; I2 = 69%; siete ensayos; n = 2654). La evidencia sobre los síntomas de depresión a largo plazo y la respuesta a la depresión fue escasa para esta comparación. Existe evidencia de certeza baja de que las intervenciones psicológicas podrían dar lugar a poca o ninguna diferencia en la remisión de la depresión (odds ratio [OR] 2,02; IC del 95%: 0,78 a 5,19; I2 = 87%; evidencia de certeza baja; tres ensayos; n = 862). Según uno o dos ensayos por desenlace, no se encontraron de manera consistente efectos beneficiosos sobre la mortalidad ni los eventos cardíacos de las intervenciones psicológicas versus el control. La evidencia fue muy incierta en cuanto a los efectos al final del tratamiento sobre la mortalidad por todas las causas, y no se proporcionaron datos sobre la mortalidad cardiovascular al final del tratamiento ni sobre la incidencia de infarto de miocardio en esta comparación.
En los ensayos que examinaron una comparación directa de diversas intervenciones psicológicas o del tratamiento clínico, la evidencia acerca del efecto sobre los síntomas de depresión al final del tratamiento es muy incierta para: la terapia cognitivo‐conductual comparada con el apoyo para el control del estrés; la terapia conductual comparada con la terapia centrada en la persona; la terapia cognitivo‐conductual y la terapia de bienestar comparadas con el tratamiento clínico. Existe evidencia de certeza baja de un ensayo de que la terapia cognitivo‐conductual podría dar lugar a poca o ninguna diferencia en la remisión de la depresión al final del tratamiento en comparación con el apoyo para el control del estrés (OR 1,81; IC del 95%: 0,73 a 4,50; evidencia de certeza baja; n = 83). Según uno o dos ensayos por desenlace, no se encontraron de manera consistente efectos beneficiosos sobre la remisión de la depresión, la respuesta de la depresión, las tasas de mortalidad ni sobre los eventos cardíacos en las comparaciones directas entre las intervenciones psicológicas o el tratamiento clínico.
La revisión indica que la intervención farmacológica podría tener un gran efecto sobre los síntomas de depresión al final del tratamiento (DME ‐0,83; IC del 95%: ‐1,33 a ‐0,32; I2 = 90%; evidencia de certeza baja; ocho ensayos; n = 750). Es probable que las intervenciones farmacológicas den lugar a un gran aumento de la remisión de la depresión (OR 2,06; IC del 95%: 1,47 a 2,89; I2 = 0%; evidencia de certeza moderada; cuatro ensayos, n = 646). Se encontró un efecto que favorece la intervención farmacológica versus el placebo en la respuesta de la depresión al final del tratamiento, aunque no se calificó la solidez de la evidencia (OR 2,73; IC del 95%: 1,65 a 4,54; I2 = 62%; cinco ensayos; n = 891). Según de uno a cuatro ensayos por desenlace, no se encontraron de forma consistente efectos beneficiosos sobre la mortalidad ni los eventos adversos en los ensayos de intervención farmacológica versus placebo, y la evidencia con respecto a los efectos al final del tratamiento sobre la mortalidad por todas las causas y sobre el infarto de miocardio fue muy incierta.
En los ensayos que examinaron una comparación directa de diversos fármacos, la evidencia fue muy incierta en cuanto a los efectos al final del tratamiento sobre los síntomas de la depresión. La evidencia de los efectos de los diferentes fármacos sobre los síntomas de la depresión al final del tratamiento es muy incierta para la simvastatina versus la atorvastatina; la paroxetina versus la fluoxetina; y el escitalopram versus Bu Xin Qi.
Ningún ensayo se consideró elegible para la comparación de un intervención psicológica con una intervención farmacológica.
Conclusiones de los autores
En personas con AC y depresión, existe evidencia de certeza baja de que las intervenciones psicológicas podrían dar lugar a una reducción de los síntomas de la depresión al final del tratamiento. También hubo evidencia de certeza baja de que las intervenciones farmacológicas podrían dar lugar a una gran reducción de los síntomas de la depresión al final del tratamiento. La evidencia de certeza moderada indica que las intervenciones farmacológicas probablemente dan lugar a un aumento moderado a grande de la remisión de la depresión al final del tratamiento. Todavía falta evidencia sobre los efectos en el mantenimiento y la durabilidad de estos hallazgos a corto plazo. La evidencia de los desenlaces principales y secundarios, aparte de los síntomas de depresión al final del tratamiento, sigue siendo escasa debido a los pocos ensayos por desenlace y a la heterogeneidad de las poblaciones e intervenciones examinadas. Dado que las intervenciones psicológicas y farmacológicas pueden tener aparentemente un efecto grande, pequeño o nulo sobre la depresión, es necesario realizar más estudios de investigación que se centren en determinar aquellas técnicas capaces de mejorar sustancialmente la depresión en personas con AC y depresión.
PICO
Resumen en términos sencillos
Tratamientos para la depresión en personas con arteriopatía coronaria
Esta revisión examinó los ensayos clínicos sobre terapias psicológicas y medicamentos antidepresivos en personas con arteriopatía coronaria y depresión. El objetivo fue determinar los efectos de estos tratamientos sobre la depresión, la mortalidad, los eventos cardíacos como otro ataque al corazón o la cirugía cardíaca.
Se identificaron 37 ensayos como relevantes para la revisión. Quince ensayos investigaron terapias psicológicas y 21 investigaron intervenciones farmacológicas que incluyesen antidepresivos.
En general, las terapias psicológicas comparadas con controles, y los antidepresivos comparados con placebo (medicamento inactivo), podrían dar lugar a una reducción de los síntomas de depresión al final del tratamiento; sin embargo, la evidencia por lo general es de certeza baja. La evidencia es muy poco clara en cuanto a si las terapias psicológicas comparadas con el control y los antidepresivos comparados con el placebo reducen la mortalidad y los episodios cardiovasculares.
La evidencia está actualizada hasta agosto de 2020.
Authors' conclusions
Summary of findings
| Psychological treatment compared to control for depression in patients with coronary artery disease | ||||||
| Patient or population: health problem or population | ||||||
| Outcomes | Anticipated absolute effects* (95% CI) | Relative effect | № of participants | Certainty of the evidence | Comments | |
|---|---|---|---|---|---|---|
| Risk with Control | Risk with Psychological treatment | |||||
| Depression symptoms ‐ short‐term | ‐ | SMD 0.55 SD lower | ‐ | 1226 | ⊕⊕⊝⊝ | There is low certainty evidence that psychological treatment may result in a moderate reduction in depression symptoms at the end of treatment. |
| Depression remission ‐ short term | 319 per 1000 | 486 per 1000 | OR 2.02 | 862 | ⊕⊕⊝⊝ | There is low certainty evidence that psychological treatment may result in no difference in depression remission at the end of treatment. |
| All‐cause mortality ‐ short‐term | 25 per 1000 | 8 per 1000 | OR 0.31 | 324 | ⊕⊝⊝⊝ | The evidence is very uncertain about the effect of psychological treatment on all‐cause mortality at the end of treatment. |
| Cardiovascular mortality ‐ long‐term | 85 per 1000 | 72 per 1000 | OR 0.83 | 2720 | ‐ | No data for cardiovascular mortality at end of treatment in trials comparing psychological interventions versus usual care |
| Myocardial infarction ‐ short term (end of treatment) ‐ not reported | ‐ | ‐ | ‐ | ‐ | ‐ | No data for occurrence of myocardial infarction at end of treatment in trials comparing psychological interventions versus usual care |
| *The risk in the intervention group (and its 95% confidence interval) is based on the assumed risk in the comparison group and the relative effect of the intervention (and its 95% CI). | ||||||
| GRADE Working Group grades of evidence | ||||||
| See interactive version of this table: https://gdt.gradepro.org/presentations/#/isof/isof_question_revman_web_427596582080189491. | ||||||
| a Risk of bias rated down one level ‐ trials that contributed to this outcome were rated as unclear risk of bias | ||||||
| Psychological treatment 1 compared to psychological treatment 2 for depression in patients with coronary artery disease | ||||||
| Patient or population: health problem or population | ||||||
| Outcomes | Anticipated absolute effects* (95% CI) | Relative effect | № of participants | Certainty of the evidence | Comments | |
|---|---|---|---|---|---|---|
| Risk with Psychological Treatment 2 | Risk with Psychological Treatment 1 | |||||
| Depression symptoms ‐ short term (end of treatment) | Not pooled | Not pooled | Not pooled | 219 | ‐ | No meta‐analysis performed due to clinical heterogeneity. The evidence is very uncertain as to whether different psychological interventions may result in a reduction in depression symptoms at the end of treatment for: cognitive‐behavioural therapy compared to supportive stress management (Freedland 2009); behaviour therapy compared to person‐centred therapy (Brown 1993); cognitive‐behavioural therapy and well‐being therapy compared to clinical management (TREATED‐ACS 2020). |
| Depression remission ‐ short term (end of treatment) | 571 per 1000 | 707 per 1000 | OR 1.81 | 83 | ⊕⊕⊝⊝ | There is low certainty evidence from one trial that cognitive‐behavioural therapy may result in no difference in depression remission at the end of treatment compared to supportive stress management (Freedland 2009). |
| All‐cause mortality ‐ short term (end of treatment) ‐ not reported | ‐ | ‐ | ‐ | ‐ | ‐ | No data for all‐cause mortality at end of treatment in trials comparing psychological intervention versus another psychological intervention/clinical management |
| Cardiovascular mortality ‐ short term (end of treatment) ‐ not reported | ‐ | ‐ | ‐ | ‐ | ‐ | No data for cardiovascular mortality at end of treatment in trials comparing psychological intervention versus another psychological intervention/clinical management |
| Myocardial infarction ‐ short term (end of treatment) ‐ not reported | ‐ | ‐ | ‐ | ‐ | ‐ | No data for the occurrence of myocardial infarction at end of treatment in trials comparing psychological intervention versus another psychological intervention/clinical management |
| *The risk in the intervention group (and its 95% confidence interval) is based on the assumed risk in the comparison group and the relative effect of the intervention (and its 95% CI). | ||||||
| GRADE Working Group grades of evidence | ||||||
| See interactive version of this table: https://gdt.gradepro.org/presentations/#/isof/isof_question_revman_web_427665509108780589. | ||||||
| a Imprecision rated down two levels ‐ wide confidence intervals from one trial encompass an adverse effect to beneficial effect | ||||||
| Pharmacological treatment compared to placebo for depression in patients with coronary artery disease | ||||||
| Patient or population: health problem or population | ||||||
| Outcomes | Anticipated absolute effects* (95% CI) | Relative effect | № of participants | Certainty of the evidence | Comments | |
|---|---|---|---|---|---|---|
| Risk with Placebo | Risk with Pharmacological | |||||
| Depression symptoms ‐ short term | ‐ | SMD 0.83 lower | ‐ | 750 | ⊕⊕⊝⊝ | There is low certainty evidence that pharmacological intervention may result in a large reduction in depression symptoms at the end of treatment |
| Depression remission ‐ short term | 323 per 1000 | 496 per 1000 | OR 2.06 | 646 | ⊕⊕⊕⊝ | There is moderate certainty evidence that pharmacological intervention probably results in a moderate to large increase in depression remission at the end of treatment. |
| All‐cause mortality ‐ short term | 36 per 1000 | 14 per 1000 | OR 0.38 | 437 | ⊕⊝⊝⊝ | The evidence is very uncertain about the effect of pharmacological intervention on all‐cause mortality at the end of treatment. In addition to the pooled results, data could not be extracted from 2 studies where no deaths occurred and from 1 trial which remained unclear. |
| Cardiovascular mortality ‐ short term (end of treatment) ‐ not reported | ‐ | ‐ | ‐ | ‐ | ‐ | No data for cardiovascular mortality at end of treatment in trials comparing pharmacological intervention versus placebo |
| Myocardial infarction ‐ short term | 22 per 1000 | 17 per 1000 | OR 0.74 | 728 | ⊕⊝⊝⊝ | The evidence is very uncertain about the effect of pharmacological intervention on myocardial infarction at the end of treatment. |
| *The risk in the intervention group (and its 95% confidence interval) is based on the assumed risk in the comparison group and the relative effect of the intervention (and its 95% CI). | ||||||
| GRADE Working Group grades of evidence | ||||||
| See interactive version of this table: https://gdt.gradepro.org/presentations/#/isof/isof_question_revman_web_427666962988765745. | ||||||
| a Risk of bias rated down one level ‐ trials that contributed to this outcome were rated as unclear or high risk of bias | ||||||
| Pharmacological treatment 1 compared to pharmacological treatment 2 for depression in patients with coronary artery disease | ||||||
| Patient or population: health problem or population | ||||||
| Outcomes | Anticipated absolute effects* (95% CI) | Relative effect | № of participants | Certainty of the evidence | Comments | |
|---|---|---|---|---|---|---|
| Risk with Pharmacological intervention 2 | Risk with Pharmacological intervention 1 | |||||
| Depression symptoms ‐ short term (end of treatment) | Not pooled | Not pooled | Not pooled | 442 | ‐ | No meta‐analysis performed due to clinical heterogeneity. The evidence is very uncertain as to whether different pharmacological interventions may result in a reduction in depression symptoms at the end of treatment for: simvastatin compared to atorvastatin (Abbasi 2015); sertraline plus omega‐3 compared to sertraline plus placebo (Carney 2009); paroxetine compared to fluoxetine (Tian 2016); escitalopram compared to Bu Xin Qi (Wang 2020). |
| Depression remission ‐ short term (end of treatment) | Not pooled | Not pooled | Not pooled | 243 | ‐ | No meta‐analysis performed due to clinical heterogeneity. The evidence is very uncertain about the effect of pharmacological treatment compared to another pharmacological treatment on depression remission at the end of treatment . |
| All‐cause mortality ‐ short term (end of treatment) | 26 per 1000 | 68 per 1000 | OR 2.72 | 149 | ⊕⊝⊝⊝ | The evidence from 1 trial is very uncertain about the effect of sertraline vs Shugan Jieyu on all‐cause mortality at the end of treatment (Liu 2016). |
| Cardiovascular mortality ‐ short term (end of treatment) ‐ not reported | ‐ | ‐ | ‐ | ‐ | ‐ | No data for cardiovascular mortality at end of treatment in trials comparing a pharmacological intervention versus another pharmacological intervention |
| Myocardial infarction ‐ short term (end of treatment) | Not pooled | Not pooled | Not pooled | 396 | ‐ | No meta‐analysis performed due to clinical heterogeneity. The evidence is very uncertain about the effect of pharmacological treatment compared to another pharmacological treatment on the occurrence of myocardial infarction at end of treatment for: sertraline plus omega‐3 compared to sertraline plus placebo (Carney 2009); paroxetine compared to fluoxetine (Tian 2016); escitalopram compared to Bu Xin Qi (Wang 2020). |
| *The risk in the intervention group (and its 95% confidence interval) is based on the assumed risk in the comparison group and the relative effect of the intervention (and its 95% CI). | ||||||
| GRADE Working Group grades of evidence | ||||||
| See interactive version of this table: https://gdt.gradepro.org/presentations/#/isof/isof_question_revman_web_428037497253281678. | ||||||
| a Risk of bias rated down one level ‐ the trial(s) that contributed to this outcome were rated as unclear or high risk of bias | ||||||
Background
Coronary artery disease (CAD) is amongst the leading causes of death for both men and women in middle‐ and high‐ income countries (Roth 2017). A strong association between CAD and comorbid depression has been consistently reported (Baune 2012; Kendler 2009; Scherrer 2003; Schulman‐Marcus 2016; Stenman 2014), which is similar to the association observed in other chronic disease populations (Chen 2019; Härter 2007; Matte 2016; Mezuk 2015; Petrak 2015). Results from the World Mental Health Surveys, Ormel 2007, indicate a twofold increased risk of depression for individuals with heart disease compared to those without heart disease and conversely, an increased risk of developing incident heart disease in individuals with depression compared to those without depression (Scott 2013). Prevalence rates of major depression in CAD populations, including those undergoing coronary revascularisation procedures, range from 15% to 20% (Nieuwsma 2017; Thombs 2008; Tully 2012), and are thus disproportionate to that observed in the general community (Kessler 2010).
The increased prevalence rates raise the issue of the impact of comorbid depression on the lives of these individuals and the healthcare system. Several original studies and systematic reviews document a significant prognostic association between comorbid depression and increased mortality, morbidity, and healthcare costs, as well as diminished quality of life and adherence to treatment regimen (Abberger 2017; Barth 2004; Baumeister 2011c; Frasure‐Smith 2003a; Frasure‐Smith 2008; Lichtman 2014; Nicholson 2006).
Description of the condition
Coronary artery disease is one of the most common forms of heart disease. One of the main underlying problems in cardiovascular disease is atherosclerosis, a process that obstructs blood vessels with deposits of fat, cholesterol, and other substances (WHO 1992). It is most serious when it restricts the blood supply to the heart itself (myocardial ischaemia). Clinical manifestations of CAD are acute coronary syndrome comprising myocardial infarction (MI) and unstable angina (Antman 2004), as well as stable angina pectoris (Fox 2006). MI refers to what is commonly known as a 'heart attack'. It occurs when prolonged myocardial ischaemia leads to myocardial cell death (necrosis) (Alpert 2000).
Depression is an emotional state characterised by strong feelings of sadness, worthlessness and guilt, withdrawal from others, sleeplessness, and loss of appetite, sexual desire, and interest in usual activities (Davison 2003), occurring in several subtypes (Baune 2012). Two key diagnostic criteria for major depression are depressed mood and loss of pleasure or interest in activities (anhedonia; APA 2013). Depressive disorders can be reliably diagnosed through structured clinical interviews. The severity of depressive symptoms is usually assessed by patient‐ or clinician‐administered rating scales that have undergone psychometric validation. Cut‐off scores have been validated for these scales that correspond to the likelihood of an indication of depression (Sadock 2009). Recommendations for the assessment of depression in individuals with cardiovascular disease are available (Davidson 2006; Lichtman 2014; Nieuwsma 2017; Thombs 2008).
Description of the intervention
Psychological interventions comprise cognitive behavioural therapy (CBT), psychodynamic psychotherapy, interpersonal therapy (IPT), other approaches such as problem‐solving therapy, non‐directive or supportive therapy and counselling as well as single techniques of these interventions (Davison 2003). Other interventions comprise acceptance and commitment therapy, mindfulness‐based cognitive therapy and mindfulness‐based stress reduction, emotion‐focused therapy, and metacognitive therapy (Australian Psychological Society 2018). The mode of delivery comprises individual, group, or family (including couple) therapy carried out by a healthcare professional.
A network meta‐analysis comparing seven psychotherapeutic approaches concluded that most approaches were equally effective, with IPT being more effective than supportive therapy (Cohen's d = −0.30, 95% confidence interval (CI) −0.54 to −0.05) (Barth 2013). However, this conclusion needs to be considered preliminary, as single trials lack statistical power, and meta‐analyses are limited by the heterogeneous methodological standards of primary studies (Cuijpers 2016). This might be even more true regarding psychological depression interventions for individuals with CAD, given the diversity of psychological interventions offered, from nurse‐led and low‐intensive, two‐session interventions to regular psychotherapies with at least 12 to 16 therapy sessions, offered at varying time points post‐cardiac event (Baumeister 2011c; Baumeister 2012b; Doyle 2021).
Antidepressant drugs are commonly used treatments in people with depression. In general, the available medications do not differ in their overall efficacy and effectiveness, but differ substantially with regard to short‐ and long‐term side effects (NICE 2009; Sadock 2009). Antidepressant treatment selection depends on the type of depressive disorder and the presence of comorbid somatic or mental disorders. The main pharmacological classes of antidepressant medications are selective serotonin reuptake inhibitors (SSRIs), serotonin‐norepinephrine reuptake inhibitors (SNRIs), tricyclic antidepressants (TCAs), and monoamine oxidase inhibitors (MAOIs). For CAD patients with moderate, severe, or recurrent depression, SSRIs are viewed as safe and effective pharmacological agents (Lichtman 2008). In contrast, TCAs and MAOIs are contraindicated in CAD patients because of their cardiac side effects such as prolongation of the QT interval on electrocardiogram (Lichtman 2008). Other potential pharmacological interventions include repurposing vascular drugs intended to lower cholesterol or blood pressure for the treatment of depression (Cipriani 2016; Taragano 2005). In addition, interventions may explore diet and supplements such as n‐3 polyunsaturated fatty acids, also known as omega‐3 oils (Appleton 2015).
A systematic review experimentally comparing psychological or psychotherapy and pharmacological approaches indicated that overall, psychological and pharmacological interventions are equally effective for treating depression, with pharmacotherapy seemingly being superior in dysthymia (Hedges' g = 0.3) as well as compared to non‐directive counselling (Hedges' g = 0.33), and psychotherapy being superior to tricyclic antidepressants (Hedges' g = 0.21) (Cuijpers 2013). Combining both pharmacotherapy and psychotherapy is superior to pharmacotherapy alone at six months or longer postrandomisation (odds ratio (OR) 2.93). However, and conversely, psychotherapy alone compared to combined therapy resulted in equal depression effects at six months follow‐up and longer (Karyotaki 2016).
How the intervention might work
Many biological and behavioural mechanisms linking CAD and depression have been proposed (Carney 2017; Härter 2007a; Joynt 2003; Musselman 1998; Skala 2006), comprising pathophysiological pathways such as decreased heart rate variability, platelet activation, and endothelial dysfunction in depressed CAD patients (Antman 2004). Furthermore, an accumulation of behavioural (smoking, physical inactivity, and imbalanced diet) and medical risk factors (hypertension, diabetes, and obesity) in depressed patients might affect the development and course of CAD (Joynt 2003; Whooley 2008). Psychosocial stress constitutes a risk factor for both CAD and depression (Joynt 2003).
A review concluded that pharmacological interventions for depression might influence physiological pathways linking depression and CAD (Carney 2017). Psychological treatments may also affect physiological processes, but the interrelations between behavioural and physiological mechanisms remain less clear (Carney 2017). Psychological interventions might improve not only depression outcomes in CAD patients with comorbid depressive disorder, but also medical outcome parameters, by encouraging behaviour changes towards a healthier lifestyle in these patients (Firth 2019; Richards 2017).
Why it is important to do this review
Due to high prevalence rates and the impact of comorbid depression on both medical and psychosocial outcomes, there is a need for effective depression treatments in CAD. In various systematic reviews, psychological and psychopharmacological interventions have proven to be effective interventions for the treatment of major depression (Cuijpers 2008a; Cuijpers 2008b; Cuijpers 2013; Karyotaki 2016; NICE 2009; Sadock 2009). However, the evidence on the effectiveness of psychological and pharmacological depression interventions for people with CAD and depression is far less conclusive (Baumeister 2011c), and prone to bias in the literature (Doyle 2021), which argues for an update of our Cochrane Review. Several clinical guidelines recommend depression intervention in CAD populations whilst noting the limited efficacy in preventing major adverse cardiac events, based on few trials to date (Hillis 2011; Lichtman 2014).
Another Cochrane Review examined the effects of non‐specific psychological interventions in CAD patients and found small to moderate reductions in depression, anxiety, and stress symptoms as well as a 22% reduction in MI compared to usual care (Richards 2017). However, the review did not study the effects of depression‐specific treatment in the population of CAD patients with a comorbid depressive disorder or depression symptoms. Furthermore, the review included non‐specific psychological interventions and interventions delivered in combination with cardiac rehabilitation, whereas the focus of our review is on depression‐specific psychological or pharmacological interventions explicitly used for treating depression in populations with depression. Some randomised controlled trials may be included in both reviews, but the research questions remain different owing to the focus of our review on the effects of depression treatments in depressed CAD patients.
The current review will permit the drawing of conclusions on the effects of depression treatment in CAD patients with comorbid depressive disorders. Depending on the number of primary studies, conclusions may be drawn concerning differential effects of type of intervention on depression and mortality or cardiovascular events, as well as on participant quality of life (QoL), thus providing a basis for treatment recommendations. Furthermore, follow‐up data may be examined concerning the healthcare costs of the interventions. Sources of heterogeneity in the results of the primary studies can be explored and could help provide suggestions for the design of future studies.
Objectives
To determine the effects of psychological and pharmacological interventions for depression in CAD patients with comorbid depression.
Methods
Criteria for considering studies for this review
Types of studies
Randomised controlled clinical trials (RCTs) of any length of treatment and any length of follow‐up. Both individually and cluster‐randomised clinical trials were eligible. We included studies reported as full text, those published as abstract only, and unpublished data.
Types of participants
Adults (18 years or older) with CAD (International Statistical Classification of Diseases and Related Health Problems (ICD‐10): I20‐I25, WHO 1992, or later versions of the ICD) and comorbid depressive disorder (ICD‐10: F32/33/34.1 (WHO 1992); Diagnostic and Statistical Manual of Mental Disorders, Third Edition, Revised (DSM‐III‐R): 296.xx; 300.4, APA 1987, or later versions of diagnostic classification systems; including subthreshold conditions) assessed by standardised interviews, self‐reports, medical records, or physicians' diagnosis. Studies comprised of individuals with non‐CAD conditions were ineligible. Inclusion of primary studies was not further limited to specific clinical subgroups in order to increase the generalisability of the results of the review.
With regard to comorbid depression, studies comprising mixed study samples (e.g. both depressed CAD patients and CAD patients with low social support (ENRICHD 2003)) were included in the review.
Types of interventions
Psychological interventions comprise CBT, psychodynamic psychotherapy, IPT, non‐directive or supportive therapy and counselling (Davison 2003), acceptance and commitment therapy, mindfulness‐based cognitive therapy, mindfulness‐based stress reduction, emotion‐focused therapy, and metacognitive therapy (Australian Psychological Society 2018). In the first instance, we pooled all psychological interventions together, conducted analyses of heterogeneity, and took this into consideration when adjudicating the strength of evidence. The mode of delivery was defined as individual, group, or family (including couple) therapy carried out in whole or in part by a healthcare professional. The comparison group was defined consistent with a similar review of type 1 diabetes interventions (Winkley 2020): 'no intervention', 'usual care', 'wait‐list control', 'attention‐control' or 'clinical management' (CM).
With regard to differential or incremental effects of different treatment approaches, we also considered trials with a control group receiving pharmacological treatment or another psychological treatment (Comparison 2 and Comparison 4). In accordance with the previous review (Baumeister 2011c), we grouped separately studies using CM as a comparator intervention or other psychological intervention. The rationale for this was that CM, which consists of information about depression and depression treatment, provides a more concerted approach to depression management than does usual care (CREATE 2007), with CM delivered by health professionals and often for equal intensity as an intervention. By contrast, usual care commonly involves no depression treatment at all, even when incentives are provided (Jani 2013; Rollman 2009). In head‐to‐head comparison trials of psychological interventions or CM, we abstained from pooling across different treatments, consistent with the original review (Baumeister 2011c), owing to the heterogeneity in clinical interventions and their heterogenous comparators.
Pharmacological interventions included all antidepressant medications and other drug therapies used explicitly for treating depressive disorders (Sadock 2009). The control group was placebo. In the first instance, we pooled all pharmacological interventions and conducted analyses of heterogeneity. We included pharmacological treatments compared to other pharmacological medications, as well as add‐on therapies or augmentation strategies, or by comparison to psychological interventions, to determine differential or incremental effects. In accordance with the previous review (Baumeister 2011c), we grouped separately head‐to‐head comparison trials of pharmacological interventions. We abstained from pooling across different studies owing to the heterogeneity in clinical interventions and their heterogenous comparators.
Types of outcome measures
Reporting one or more of the outcomes listed here in the trial was not an inclusion criterion for the review. Where a published report did not appear to report one of these outcomes, we accessed the trial protocol and contacted the trial authors to ascertain whether the outcomes were measured but not reported. Relevant trials that measured these outcomes but did not report the data at all, or not in a useable format, were included in the review as part of the narrative.
We assessed outcomes at three follow‐up periods, consistent with the previous review by Baumeister 2011c:
-
short term (at the end of treatment), which was the primary time point of clinical interest for the review;
-
medium term (one to six months after the end of treatment);
-
long term (more than six months after the end of treatment).
Multiple observations in primary studies were allocated to separate analyses by different time frames, which reflect short‐, medium‐, and long‐term follow‐up. The rationale for subdividing outcomes by time was to assess the durability of interventions, given that evidence was sparse for longer‐term outcomes in the previous review (Baumeister 2011c).
Primary outcomes
-
Depression (measured either dimensionally or categorically) following the intervention, as assessed by validated self‐report questionnaires or standardised interviews. Depression may be quantified categorically as 'remitted' or 'response', the latter defined as a 50% or more reduction in severity from baseline.
-
All‐cause mortality.
-
Cardiovascular mortality.
-
Non‐fatal cardiac events according to standardised criteria (e.g. WHO 1992 or subsequent iterations):
-
myocardial infarction (MI);
-
angina;
-
heart failure;
-
arrhythmia;
-
stroke;
-
Coronary revascularisation for CAD: coronary artery bypass graft (CABG) and/or percutaneous coronary intervention (PCI) or angioplasty.
-
We analysed the primary outcomes separately and abstained from pooling a composite outcome, with two exceptions: 1) acute coronary syndromes (inclusive of ST and non‐ST elevated MI, and/or unstable angina) were collapsed into MI (for one study, U‐CARE 2018); and 2) coronary revascularisation for CAD was inclusive of CABG and/or PCI or angioplasty. Here we grouped coronary revascularisation for CAD under cardiac events, as opposed to healthcare utilisation, in line with common definitions of major adverse cardiac events (Bosco 2021).
Secondary outcomes
-
Healthcare costs or resource utilisation, including:
-
hospitalisations;
-
emergency department visits;
-
length of stay.
-
-
Health‐related quality of life.
-
Cardiovascular vital signs:
-
systolic blood pressure (BP) measured in mmHg;
-
diastolic BP measured in mmHg;
-
heart rate measured in beats per minute (bpm).
-
-
Biomarkers of platelet activation:
-
β‐thromboglobulin (βTG);
-
platelet factor 4 (PF4);
-
P‐selectin;
-
platelet/endothelial cell adhesion molecule‐1 (PECAM‐1);
-
thromboxane B2 (TxB2).
-
-
Electrocardiogram (ECG) wave recording in milliseconds:
-
PR interval;
-
QRS interval;
-
QT interval;
-
QTc interval.
-
-
Non‐cardiac adverse events (psychiatric admission, suicide, worsening depression). In pharmacological interventions side effects were also assessed.
Analysis of the secondary outcomes cardiovascular vital signs and biomarkers of platelet activation was considered in the previous review but not reported (Baumeister 2011c). We also added important adverse effects (ECG wave recording, non‐cardiac adverse events, and pharmacological side effects) to this updated review, which we define as post hoc outcomes. We analysed the secondary outcomes separately and abstained from pooling any composite outcomes apart from pharmacological side effects, which we considered as a composite of any quantified side effect by self‐report scale, checklist, or adverse outcome.
Search methods for identification of studies
Electronic searches
We searched the following databases for RCTs of treatment of depressive disorders in CAD patients on 3 August 2020:
-
Cochrane Central Register of Controlled Trials (CENTRAL) (Cochrane Library, Issue 8 of 12, 2020);
-
Epub Ahead of Print, In‐Process & Other Non‐Indexed Citations, MEDLINE Daily and MEDLINE (Ovid, 1946 to 31 July 2020);
-
Embase (Ovid, 1980 to 2020 Week 31);
-
PsycINFO (Ovid, 1806 to July Week 4 2020);
-
CINAHL (Cumulative Index to Nursing and Allied Health Literature) (EBSCO, 1937 to 3 August 2020);
-
Database of Abstracts of Reviews of Effects (DARE) and NHS Economic Evaluation Database (EED) (Cochrane Library, Issue 2 of 4, 2015);
-
Health Technology Assessment Database (HTA) (Cochrane Library Issue 4 of 4, 2016).
The Cochrane sensitivity‐maximising RCT filter was used for MEDLINE, and for Embase, terms as recommended in the Cochrane Handbook for Systematic Reviews of Interventions were applied (Lefebvre 2011). Adaptations of these RCT filters were applied to the other databases, except CENTRAL. See Appendix 1 for details of the 2009 search strategies and Appendix 2 for the updated 2020 search strategies. No language restrictions were applied.
Searching other resources
We searched the World Heath Organization International Clinical Trials Registry Platform (https://trialsearch.who.int/), ISRCTN registry (http://isrctn.org/), and ClinicalTrials.gov (clinicaltrials.gov) on 2 September 2021 (Appendix 2). We also examined the reference lists of all included trials to identify other potentially relevant studies. We contacted corresponding authors of the included trials to ask about other RCTs, published or unpublished, which might be relevant to the review. We handsearched the list of included and excluded studies in the Cochrane Review by Richards 2017 and the network meta‐analysis by Doyle 2021.
Data collection and analysis
Selection of studies
Two review authors independently in pairs selected studies for inclusion (original review: NH, HB; update: SYA, EJLL, EB, NB). We examined a list of titles and abstracts; if title and abstract contained sufficient information to determine exclusion, the article was rejected. We retrieved the full papers of all remaining articles, which two review authors independently reviewed. In addition, any other potentially relevant articles identified by checking the reference lists or personal communications were also reviewed. We kept a record of all rejected papers and the reasons for rejection. We used this information to construct a PRISMA flow diagram (Figure 1), and reported the reasons for exclusion of excluded studies in the Characteristics of excluded studies table. Important parts of foreign language papers of included studies (i.e. not English, German, or Chinese) were translated into English. If the two review authors disagreed about the inclusion of an article, a third review author (original review: JB; update: PJT) was asked to review the article. Any disagreements were resolved by consensus discussion.
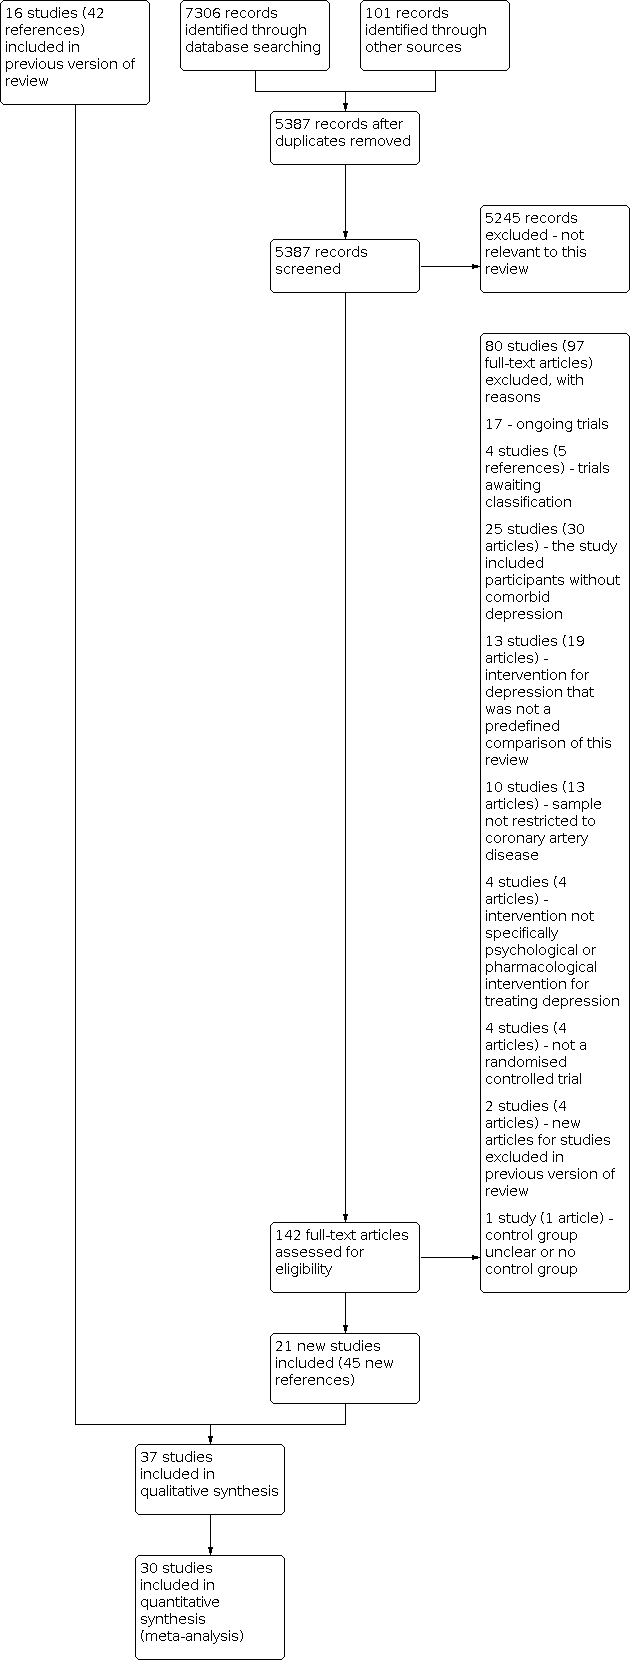
Summary of the 2020 literature search update and study selection.
Data extraction and management
Two review authors (original review: HB, NH; update: PJT, SYA, EJLL, NB, EB) independently in pairs extracted data from the full copies of primary studies using a data extraction form. We extracted study characteristics including participants (sample size at baseline and follow‐up, type of CAD, gender, age), type of depression (major depression, minor depression or dysthymic disorder), assessment method (standardised diagnostic interview, self‐report questionnaire, medical record or physician’s diagnosis), cut‐off used to indicate depression on self‐report questionnaire, type of intervention (type of psychological treatment versus type of pharmacological treatment), comparison group (usual care, other control, another psychological treatment or pharmacological treatment), length of follow‐up, descriptive statistics of primary and secondary outcomes, effect sizes and confidence intervals.
Assessment of risk of bias in included studies
Two review authors (original review HB, NH; update: PJT, SYA, EJLL, EB, NB) independently in pairs assessed risk of bias in the included studies using Cochrane's tool for assessing risk of bias (Higgins 2011). We described sequence generation, allocation concealment, blinding, incomplete outcome data, selective outcome reporting, and other sources of bias. With regard to psychological interventions, blinding of healthcare providers or participants to the treatment is not feasible. In pharmacological trials blinding is possible for participants, personnel, and outcome assessors, and was evaluated accordingly. We considered a trial as having an overall high risk of bias when four domains out of six were assessed as high or unclear for: allocation (sequence generation and concealment), blinding (participants, personnel, and outcome assessors), incomplete outcome data, and selective reporting. In the event that we identified an other source of bias at high risk, this also contributed to the overall adjudication of a trial at high risk of bias.
Measures of treatment effect
Continuous outcomes measured using different scales necessitated the standardisation of the results of the studies to a uniform scale. We computed standardised mean differences (SMD) with 95% confidence intervals (CIs) for continuous outcomes measured using different scales. As a first preference we analysed the mean scores of final assessment, followed by mean change scores from baseline to final assessment if only these scores were available. If no measures of variability were provided in the study reports, we used exact P values as well as t‐statistic or Chi2 statistic to compute an SMD.
For dichotomous variables, we computed odds ratios (OR) with 95% CI. For continuous primary and secondary outcomes assessed by the same method (i.e. Hamilton Depression Rating Scale (HAM‐D), BP, heart rate, ECG parameters), we used a mean difference (non‐standardised).
Several strategies have been proposed to help readers interpret results presented as SMDs (e.g. re‐expressing SMDs using Cohen's rules of thumb for effect sizes (Cohen 1988), re‐expressing SMDs by transformation to OR, re‐expressing SMDs using a familiar instrument, reporting the ratio of the means, or expressing as minimal important difference units; see also Section 15.5.3 of the Cochrane Handbook for Systematic Reviews of Interventions) (Higgins 2011). However, all of these strategies have substantial disadvantages and introduce imprecision. For example, re‐expressing SMDs by means of familiar instruments does not account for between‐study heterogeneity. An SMD of a specific magnitude translates into different scores (e.g. on the Beck Depression Inventory (BDI)) depending on, for example, the baseline severity of depression. Conclusions based on this strategy might thus be substantially misleading. We decided to use the rule of thumb proposed by Cohen 1988 and suggested by the Cochrane Handbook to re‐express SMDs (Higgins 2011). Based on the assumptions of Cohen 1988, SMDs around 0.2 must be regarded as small, 0.5 as moderate, and 0.8 as large. As previously mentioned, this strategy also comprises substantial disadvantages, as a small, moderate, or large effect size depends on the specific outcome and the assessment instrument being used. Moreover, patient importance of a finding is context‐dependent and not amenable to generic statements (Higgins 2011). When interpreting the results (Baumeister 2012b), readers should keep this limitation of the rules of thumb in mind (Cohen 1988).
Unit of analysis issues
The unit of analysis in the primary studies was the participant, which is randomised to either the treatment or control group. The number of observations thus matches the number of units that are randomised. In instances where observational units were correlated (e.g. by cluster), we planned to reduce the sample to an 'effective sample size', dividing the original sample size by the ‘design effect’ (Higgins 2021).
Dealing with missing data
We requested missing information from published RCTs from the corresponding authors or obtained it from trial data repositories. Of 18 authors contacted for missing data, five replied, and three were able to provide at least some of the requested data. No imputation methods were used due to the small amount of trials per outcome.
Assessment of heterogeneity
We tested for statistically significant heterogeneity using the Q‐statistics with a 95% CI. We computed the I2 to examine the extent of heterogeneity. Meta‐analytically pooled effect estimates should be interpreted in accordance with any substantial clinical or methodological or statistical heterogeneity. We planned to specifically examine heterogeneity with the I2 statistic quantifying inconsistency across studies to assess the impact of heterogeneity on the meta‐analysis. Interpretation of heterogeneity would include the magnitude and direction of effects, the strength of evidence for heterogeneity (e.g. P value from the Chi2 test), and the I2 statistic where:
-
0% to 40%: might not be important;
-
30% to 60%: may represent moderate heterogeneity;
-
50% to 90%: may represent substantial heterogeneity;
-
75% to 100%: considerable heterogeneity (Higgins 2021).
A meta‐regression was considered to explore potential sources of heterogeneity but was not performed owing to the small amount of trials per outcome.
Assessment of reporting biases
We did not create funnel plots to investigate reporting bias due to the limited number of trials per outcome (Higgins 2021). To examine outcome reporting bias, we analysed discrepancies in reported outcomes between published protocols and original papers. Where no protocol was available, we contacted the corresponding trial authors for published or unpublished protocols.
Data synthesis
We performed random‐effects meta‐analyses to compute overall estimates of treatment outcomes based on the assumption of high clinical and methodological heterogeneity between RCTs. Both SMD and OR effect sizes were pooled using the inverse‐variance method, which is best suited to random‐effects meta‐analysis (Higgins 2011). The effect sizes of the primary studies are presented in forest plots. In the case of considerable methodological heterogeneity owing to different intervention types and their heterogenous comparators, we abstained from meta‐analytical pooling of trial results (Comparison 2: psychological versus psychological/CM; Comparison 4: pharmacological versus pharmacological). Where no dichotomous events occurred in both arms of a trial, we described the finding narratively in the text and in the summary of findings tables.
In the case of multiple assessment tools used for the same outcome, we followed a hierarchical approach to decide which assessment to use in the meta‐analyses. Clinician‐rated assessments were given priority over patient self‐report questionnaires. In the case of assessment tools on the same hierarchical level, we chose the most frequently used assessment tool across the included studies, followed by the measure with the least missing data (per‐protocol), followed by random selection of one of the assessment tools.
Subgroup analysis and investigation of heterogeneity
We planned subgroup analyses to examine the impact of sex (men versus women), CAD subtype, time of onset of depression (pre‐existing versus new‐onset depression), CAD severity, and risk of bias of included studies on the results, but did not conduct them due to the sparseness of trial data. We will reconsider these subgroup analyses in future updates of the review.
Sensitivity analysis
Because pooling results across different types of psychological interventions may level out specific treatment effects and be potentially misleading (Baumeister 2011c), we conducted sensitivity analysis on depression symptoms at end of treatment to update the results of Baumeister 2011c for Comparison 1: psychological versus control and Comparison 3: pharmacological versus placebo. For Comparison 1, we performed sensitivity analysis in CBT‐only trials, and similarly in Comparison 3 conducted sensitivity analysis restricted to serotonergic antidepressant interventions. Specifically, the sensitivity analysis included SSRIs and mirtazepine, which can be classed as a noradrenergic and specific serotonergic antidepressant and tetracyclic analogue (see Types of interventions) (de Boer 1995). We also performed sensitivity analyses according to depressive disorders and secondly by depression‐only trials (e.g. excluding mixed depression/anxiety studies).
Summary of findings and assessment of the certainty of the evidence
We assessed the certainty of the evidence for the primary outcomes (short‐term) using the GRADE approach (GRADEpro GDT), which takes into consideration risk of bias (see Assessment of risk of bias in included studies), consistency of effect, imprecision, indirectness, and publication bias (Schünemann 2019). We constructed a summary of findings table for the primary outcomes (short‐term, end of treatment) for five outcomes: depression symptoms, depression remission, all‐cause mortality, cardiovascular mortality, and occurrence of MI. We made comments narratively to qualitatively describe the certainty of the evidence for the five end‐of‐treatment outcomes per comparison.
Results
Description of studies
See: PRISMA flow chart (Figure 1), Characteristics of included studies; Table 1; Characteristics of excluded studies; Characteristics of studies awaiting classification; Characteristics of ongoing studies.
| Study ID | Intervention | [n]screened | [n] randomised | [n] ITT | [n] finishing study | [%] of randomised participants | Comments |
|---|---|---|---|---|---|---|---|
| Intervention 1 (I1): simvastatin Intervention 2 (I2): atorvastatin | Total: 206 | I1: 29 I2: 29 Total: 58 | I1: NR I2: NR Total: NR (per‐protocol) | I1: 23 I2: 23 Total: 46 | I1: 79.3% I2: 79.3% Total: 79.3% | ||
| Intervention (I): sertraline Control (C): placebo | Total: ? | I: ? C: ? Total: 2 | I: ? C: ? Total: ? | I: ? C: ? Total: ? | I: ? C: ? Total: ? | Comment: trial terminated early, no results posted | |
| Intervention (I): resource‐orientated psychotherapy Control (C): usual care | Total: 1709 | I: 27 C: 32 Total: 59 | I: 27 C: 32 Total: 59 (per‐protocol) | I: 27 C: 28 Total: 55 | I: 100% C: 87.5% Total: 93.2% | ||
| Intervention 1 (I1): behaviour therapy Intervention 2 (I2): person‐centred therapy | Total: 107 | I1: NR I2: NR Total: 54 | I1: NR I2: NR Total: NR (per‐protocol) | I1: 20 I2: 20 Total: 40 | I1: ? I2: ? Total: 74.1% | Comment: dropout reported in text, no flow chart | |
| Intervention 1 (I1): interpersonal psychotherapy, citalopram, clinical management Intervention 2 (I2): citalopram, clinical management Control 1 (C1): interpersonal psychotherapy, placebo, clinical management Control 2 (C2): placebo, clinical management | Total: 1897 | I1: 67 I2: 75 C1: 75 C2: 67 Total: 284 | I1: 67 I2: 75 C1: 75 C2: 67 Total: 284 | I1: 59 I2: 72 C1: 59 C2: 47 Total: 237 | I1: 88.1% I2: 96.0% C1: 78.7% C2: 70.1% Total: 83.5% | Comment: 2 x 2 factorial trial; only I2 and C2 data are eligible for this review | |
| Intervention 1 (I1): sertraline plus omega‐3 Intervention 2 (I2): sertraline plus placebo | Total: 941 | I1: 62 I2: 60 Total: 122 | I1: 62 I2: 60 Total: 122 | I1: 59 I2: 56 Total: 115 | I1: 95.2% I2: 93.3% Total: 94.3% | ||
| Intervention (I): cognitive‐ behavioural therapy C: usual care | Total: 513 | I: 50 C: 50 Total: 100 | I: NR C: NR Total: NR (per‐protocol) | I: 48 C: 48: Total: 96 | I: 96% C: 96% Total: 96% | ||
| Intervention 1 (I1): sertraline plus red yeast rice Intervention 2 (I2): sertraline plus placebo | Total: 101 | I1: 28 I2: 28 Total: 56 | I1: NR I2: NR Total: NR | I1: 25 I2: 25 Total: 50 | I1: 89.3% I2: 89.3% Total: 89.3% | ||
| Intervention (I): cognitive‐ behavioural therapy Control (C): usual care | Total: 117 | I: NR C: NR Total: NR | I: NR C: NR Total: NR (per‐protocol) | I: 7 C: 8 Total: 15 | I: ? C: ? Total: ? | Comment: reasons for dropout not stated, no flow chart Comment: nested trial within observational study (non‐depressed cohort) | |
| Intervention (I): escitalopram Control (C): placebo | Total: 4809 | I:149 C: 151 Total: 300 | I: 108 C: 109 Total: 217 (per‐protocol) | I: 78 C: 79 Total: 157 | I: 52.3% C: 52.3% Total: 52.3% | Comment: nested trial within observational study (depressed cohort receiving usual care) | |
| Intervention (I): cognitive‐ behavioural therapy Control (C): usual care | Total: 33780 | I: 1238 C: 1243 Total: 2481 | I: 1238 C: 1243 Total: 2481 | I: 983 C: 985 Total: 1968 | I: 79.4% C: 79.2% Total: 79.3% | ||
| Intervention (I): health education and psychological intervention Control (C): usual care | Total: ? | I: 27 C: 30 Total: 57 | I: ? C: ? Total: ? | I: ? C: ? Total: ? | I: ? C: ? Total: ? | Comment: translated paper | |
| Intervention 1 (I1): cognitive‐ behavioural therapy Intervention 2 (I2): supportive stress management Control (C): usual care | Total: 2955 | I1: 41 I2: 42 C1: 40 Total: 123 | I1: 41 I2: 42 C1: 40 Total: 123 | I1: 40 I2: 33 C1: ? Total: ? | I1: 98% I2: 79% C1: ? Total: ? | ||
| Intervention (I): alprazolam Control (C): placebo | Total: 459 | I: 54 C: 53 Total: 107 | I: NR C: NR Total: NR (per‐protocol) | I: 32 C: 28 Total: 60 | I: 59.3% C: 52.8% Total: 56.1% | Comment: no flow chart | |
| Intervention (I): escitalopram Control (C): placebo | Total: NR | I: 9 C: 10 Total: 19 | I: NR C: NR Total: NR (per‐protocol) | I: 2 C: 2 Total: 4 | I: 22.2% C: 20.0% Total: 21.1% | Comment: trial terminated early, redacted results posted | |
| Intervention (I): St John's wort extract Control (C): placebo | Total: ? | I: ? C: ? Total: 87 | I: ? C: ? Total: ? | I: 43 C: 39 Total: 82 | I: ? C: ? Total: 94.3% | Comment: translated paper | |
| Intervention (I): fluoxetine Control (C): placebo | Total: ? | I: ? C: ? Total: ? | I: ? C: ? Total: ? | I: 31 C: 37 Total: ? | I: ? C: ? Total: ? | Comment: translated paper | |
| Intervention 1 (I1): sertraline and Shugan Jieyu Intervention 2 (I2): sertraline and placebo | Total: 3907 | I1: 76 I2: 73 Total: 149 | I1: 76 I2: 73 Total: 149 | I1: 48 I2: 46 Total: 94 | I1: 63.2% I2: 63.0% Total: 63.1% | Comment: no flow chart, reasons for dropout reported in text | |
| Intervention (I): mirtazapine Control (C): placebo | Total: 2177 | I: 47 C: 44 Total: 91 | I: 47 C: 44 Total: 91 | I: 22 C: 18 Total: 40 | I: 46.8% C: 40.9% Total: 44.0% | Comment: nested trial within observational study (depressed cohort receiving usual care) | |
| Intervention (I): Xinkeshu Control (C): placebo | Total: 312 | I: 30 C: 30 Total: 60 | I: NR C: NR Total: NR | I: 28 C: 27 Total: 55 | I: 93.3% C: 90% Total: 91.7% | ||
| Intervention (I): sertraline Control (C): placebo | Total: 238 | I: 18 C: 20 Total: 38 | I: NR C: NR Total: NR (per‐protocol) | I: 12 C: 15 Total: 27 | I: 66.7% C: 75.0% Total: 71.1% | Comment: no flow chart, reasons for dropout reported in text | |
| Intervention (I1): telephone counselling Control (C): usual care | Total: 700 | I: 53 C: 47 Total: 100 | I: NR C: NR Total: NR (per‐protocol) | I: 45 C: 34 Total: 79 | I: 84.9% C: 72.3% Total: 79% | ||
| Intervention (I): cognitive‐ behavioural therapy | Total: 3071 | I: 61 C: 60 Total: 121 | I: NR C: NR Total: NR | I: 53 C: 53 Total: 106 | I: 86.9% C: 88.3% Total: 87.6% | ||
| Intervention (I): sertraline Control (C): placebo | Total: 630 | I: 50 C: 50 Total: 100 | I: NR C: NR Total: NR (per‐protocol) | I: 47 C: 48 Total: 95 | I: 94% C: 96% Total: 95% | ||
| Intervention 1 (I1): paroxetine Intervention 2 (I2): nortriptyline | Total: NR | I1: 41 I2: 40 Total: 81 | I1: 41 I2: 40 Total: 81 | I1: 37 I2: 30 Total: 67 | I1: 90.2% I2: 75.0% Total: 82.7% | Comment: no flow chart, reasons for dropout reported in text | |
| Intervention (I): sertraline Control (C): placebo | Total: 11546 | I: 186 C: 183 Total: 369 | I: 186 C: 183 Total: 169 | I: 133 C: 137 Total: 270 | I: 71.5% C: 74.9% Total: 73.1% | ||
| Intervention (I): stepwise psychotherapy intervention Control (C): usual care | Total: 21780 | I: 285 C: 285 Total: 570 | I: 284 C: 284 Total: 568 | I: 110 C: 194 Total: 304 | I: 38.6% C: 68.1% Total: 53.3% | ||
| Intervention 1 (I1): fluoxetine Intervention 2 (I2): Crocus sativus L. (saffron) | Total: 75 | I1: 22 I2: 22 Total: 44 | I1: NR I2: NR Total: NR (per‐protocol) | I1: 20 I2: 20 Total: 40 | I1: 90.9% I2: 90.9% Total: 90.9% | ||
| Intervention (I): fluoxetine Control (C): placebo | Total: 556 | I: 27 C: 27 Total: 54 | I: 27 C: 27 Total: 54 | I: 22 C: 18 Total: 40 | I: 81.5% C: 66.7% Total: 74.1% | ||
| Intervention 1 (I1): paroxetine Intervention 2 (I2): fluoxetine | Total: ? | I1: 23 I2: 23 Total: 46 | I1: 23 I2: 23 Total: 46 (per‐protocol) | I1: 23 I2: 23 Total: 46 | I1: 100% I2: 100% Total: 100% | Comment: no flow chart was reported. It is unclear whether 16 participants who did not finish the study were from I1 or I2 groups, or non‐treatment or non‐depressed groups. | |
| Intervention 1 (I1): cognitive‐behavioural therapy and well‐being therapy Intervention 2 (I2): clinical management | Total: 740 | I1: 50 I2: 50 Total: 100 | I1: 50 I2: 50 Total: 100 | I1: 42 I2: 40 Total: 82 | I1: 84% I2: 80% Total: 82% | ||
| Intervention (I): internet cognitive‐behavioural therapy Control (C): usual care | Total: 3928 | I: 117 C: 122 Total: 239 | I: 117 C: 122 Total: 239 | I: 96 C: 115 Total: 211 | I: 82.1% C: 94.3% Total: 88.3% | ||
| Intervention 1 (I1): sertraline Intervention 2 (I2): exercise Control (C): placebo | Total: 1680 | I1: 40 I2: 37 C: 24 Total: 101 | I1: NR I2: NR C: NR Total: NR | I1: 36 I2: 36 C: 23 Total: 95 | I1: 90% I2: 97.3% C: 95.8% Total: 94.1% | Comment: only I1 sertraline and C placebo are eligible for this review | |
| Intervention 1 (I1): escitalopram Intervention 2 (I2): Bu Xin Qi decoction | Total: 300 | I1: 140 I2: 140 Total: 280 | I1: NR I2: NR Total: NR (per‐protocol) | I1: 113 I2: 115 Total: 228 | I1: 80.7% I2: 82.1% Total: 81.4% | Comment: reasons for dropout not stated in flow chart | |
| Intervention (I): internet cognitive‐behavioural therapy Control (C): wait‐list control | Total: 72 | I: 18 C: 16 Total: 34 | I: 18 C: 16 Total: 34 | I: 13 C: 13 Total: 26 | I: 72.2% C: 81.3% Total: 76.5% | ||
| Intervention (I): intensive telephone‐based care Control (C): usual care | Total: 354 | I: 112 C: 112 Total: 224 | I: NR C: NR Total: NR | I: 107 C: 105 Total: 212 | I: 95.5% C: 93.8% Total: 94.6% | ||
| Intervention (I): Peplau's therapeutic communication model Control (C): usual care | Total: ? | I: ? C: ? Total: ? | I: ? C: ? Total: ? (per‐protocol) | I: 37 C: 37 Total: 74 | I: ? C: ? Total: ? | Comment: total sample estimated from degrees of freedom in Table 3 |
ITT = intention‐to‐treat; NR = not reported; ? = unclear
Results of the search
The database and trial registry search resulted in 7407 references (101 from trial registries), 5387 of which were unique references. We excluded 5245 articles at the title/abstract level, and 80 studies (97 articles) after full‐text review, most commonly because the study did not investigate participants without comorbid depression (25 studies, 30 articles), the intervention for depression was not a predefined comparison of this review (13 studies, 19 articles), the sample was not restricted to CAD (10 studies, 13 articles), the intervention not specifically psychological or pharmacological intervention for treating depression (4 studies, 4 articles), the study was not an RCT (4 studies, 4 articles), the control group was unclear or there was no control group (1 study, 1 reference), or new citations to studies already excluded in the previous review (2 studies, 4 references). We also identified 17 ongoing studies (17 references) and 4 trials awaiting classification (5 references). Twenty‐one new studies were found to be eligible in this updated review (45 new references) and included in the narrative review or synthesis. See the study flow chart for details of the study selection process (Figure 1).
Included studies
Thirty‐seven trials fulfilled the inclusion criteria of the review (Abbasi 2015; ANDROS 2015; Barth 2005; Brown 1993; Carney 2009; CREATE 2007; Dao 2011; Divsalar 2018; Doering 2007; ENRICHD 2003; EsDEPACS 2014; Fang 2003; Freedland 2009; Freeman 1986; Kennedy 2005; Li 2005; Liu 1999; Liu 2016; Ma 2019; McFarlane 2001; McLaughlin 2005; MIND‐IT 2007; MoodCare 2011; Pizzi 2009; Roose 1998; SADHART 2002; Shahmansouri 2014; SPIRR‐CAD 2011; Strik 2000; Tian 2016; TREATED‐ACS 2020; U‐CARE 2018; UPBEAT 2012; Wang 2020; WIDeCAD 2017; Yang 2019; Zarea 2014).
Fifteen trials investigated psychological interventions, which comprised CBT (Dao 2011; Doering 2007; ENRICHD 2003; MoodCare 2011; U‐CARE 2018; WIDeCAD 2017), resource‐orientated psychotherapy (Barth 2005), telephone counselling (McLaughlin 2005; Yang 2019), individual and group psychotherapy (SPIRR‐CAD 2011), therapeutic communication sessions (Zarea 2014), and an intervention comprising health education and various psychological treatments (Fang 2003). One three‐arm trial examined CBT, supportive stress management, and usual care (Freedland 2009). One trial examined eight sessions of CBT in combination with four sessions of well‐being therapy versus CM (TREATED‐ACS 2020). One trial examined behaviour therapy versus person‐centred therapy (Brown 1993). Two psychological therapy trials delivered the CBT intervention entirely online with therapist or eCoach support (U‐CARE 2018; WIDeCAD 2017); all others delivered the intervention face‐to‐face.
Twenty‐one trials investigated the effects of pharmacological depression treatments with sertraline (ANDROS 2015; McFarlane 2001; Pizzi 2009; SADHART 2002; UPBEAT 2012), mirtazapine (MIND‐IT 2007), fluoxetine (Liu 1999; Strik 2000), escitalopram (EsDEPACS 2014; Kennedy 2005), paroxetine and nortriptyline (Roose 1998), paroxetine and fluoxetine (Tian 2016), alprazolam (Freeman 1986), sertraline plus omega‐3 (Carney 2009), sertraline plus red yeast rice (Divsalar 2018), St John's wort (Li 2005), simvastatin compared to atorvastatin (Abbasi 2015), Xinkeshu (Ma 2019), saffron compared to fluoxetine (Shahmansouri 2014), Shugan Jieyu compared to sertraline (Liu 2016), Bu Xin Qi compared to escitalopram (Wang 2020).
One trial had a 2 x 2 factorial design (CREATE 2007). In accordance with our inclusion criteria, we restricted analyses to the citalopram and CM versus placebo and CM arms of the trial. The IPT plus citalopram plus CM, and IPT plus placebo plus CM arms of the trial were ineligible and are not described further.
The trial size in psychological intervention studies ranged from 15 participants in Doering 2007 to 2481 participants in ENRICHD 2003. In the pharmacological intervention studies, the trial size ranged from 2 participants in ANDROS 2015 to 369 participants in SADHART 2002.
The mean age of participants ranged from 52.6 in Shahmansouri 2014 to 64.0 years in UPBEAT 2012. The percentage of female participants ranged from 10% in Brown 1993 to 56.8% in Shahmansouri 2014. One study was restricted to female participants only (Doering 2007).
Ten studies originated from the USA (Brown 1993; Carney 2009; Dao 2011; Doering 2007; ENRICHD 2003; Freedland 2009; Freeman 1986; McLaughlin 2005; Roose 1998; UPBEAT 2012), eight from China (Fang 2003; Li 2005; Liu 1999; Liu 2016; Ma 2019; Tian 2016; Wang 2020; Yang 2019), four from Iran (Abbasi 2015; Divsalar 2018; Shahmansouri 2014; Zarea 2014), three from Germany (Barth 2005; SPIRR‐CAD 2011; WIDeCAD 2017), two from Canada (CREATE 2007; McFarlane 2001), two from the Netherlands (MIND‐IT 2007; Strik 2000), two from Italy (Pizzi 2009; TREATED‐ACS 2020), one from Australia (MoodCare 2011), one from Korea (EsDEPACS 2014), one from France (ANDROS 2015), and one from Sweden (U‐CARE 2018). Two studies were performed across multiple sites in different countries, taking place in the USA, Europe, Canada, and Australia in SADHART 2002 and Denmark, Estonia, and Norway in Kennedy 2005.
Sixteen studies investigated individuals with MI or acute coronary syndromes (ANDROS 2015; ENRICHD 2003; EsDEPACS 2014; Fang 2003; Kennedy 2005; Liu 1999; Liu 2016; McFarlane 2001; McLaughlin 2005; MIND‐IT 2007; MoodCare 2011; SADHART 2002; Strik 2000; Tian 2016; TREATED‐ACS 2020; U‐CARE 2018). Twelve trials studied diverse CAD populations comprising MI, angina pectoris, and patients undergoing cardiac procedures (Barth 2005; Brown 1993; Carney 2009; CREATE 2007; Ma 2019; Pizzi 2009; Roose 1998; SPIRR‐CAD 2011; UPBEAT 2012; Wang 2020; WIDeCAD 2017; Yang 2019). Seven trials investigated patients awaiting or after CABG (Abbasi 2015; Dao 2011; Doering 2007; Freedland 2009; Freeman 1986; Li 2005; Zarea 2014), and two trials investigated patients after PCI (Divsalar 2018; Shahmansouri 2014).
We also identified 17 ongoing trials (Ahmadi 2018; Ardakani 2020; COMBAT‐DS 2021; eMindYourHeart 2021; Firouzjaei 2017; Geng 2018; Hamzehpour 2020; Irfan 2020; Jazayeri 2017; Luberto 2021; Ma 2014; Mohammadian 2018; Moudi 2016; Qiaoning 2019; Sourizahi 2017; Wang 2015; Yang 2020). Three studies are awaiting classification, two of which were identified as conference abstracts in our search of the databases, without any contact information available (Ahangarezaiezadeh 2017; Cai 2012; Gu 2017).
Excluded studies
A total of 96 studies (118 articles) that appeared to be relevant to the review were excluded after careful examination of eligibility criteria (see Characteristics of excluded studies for reasons for exclusion). Sixteen studies (21 references) were excluded in the previous review reported by Baumeister 2011c, and 80 studies (97 references) were excluded from the 2020 updated literature search.
Risk of bias in included studies
Risk of bias in the included studies varied across studies (see Figure 2; Figure 3). The information available after translating parts of three trials published in Chinese was insufficient to determine risk of bias in these studies (Fang 2003; Li 2005; Liu 1999). We assessed risk of bias for the two trials that were terminated early by the investigators based on information reported in the clinical trial registries (ANDROS 2015; Kennedy 2005).

Risk of bias graph: review authors' judgements about each risk of bias item presented as percentages across all included studies.

Risk of bias summary: review authors' judgements about each risk of bias item for each included study.
Allocation
Twelve trials used an appropriately generated and adequately concealed randomisation procedure (Abbasi 2015; Barth 2005; Carney 2009; CREATE 2007; Divsalar 2018; ENRICHD 2003; EsDEPACS 2014; Freedland 2009; MoodCare 2011; Shahmansouri 2014; SPIRR‐CAD 2011; UPBEAT 2012). The generation of the randomisation sequence appeared to be appropriate in eight trials; however, they did not sufficiently describe the concealment of the allocation, Dao 2011; Liu 2016; MIND‐IT 2007; Roose 1998; U‐CARE 2018; WIDeCAD 2017; Yang 2019, or failed to conceal the allocation adequately (McLaughlin 2005). Two trials used an inappropriate randomisation procedure and provided insufficient information on concealment (Ma 2019; Zarea 2014). One trial described a sufficient sequence generation but was an open‐label trial (Wang 2020). Details regarding sequence generation and allocation concealment were unclear for the remaining 14 trials (ANDROS 2015; Brown 1993; Doering 2007; Fang 2003; Freeman 1986; Kennedy 2005; Li 2005; Liu 1999; McFarlane 2001; Pizzi 2009; SADHART 2002; Strik 2000; Tian 2016; TREATED‐ACS 2020).
Blinding
No trial of psychological interventions utilised an attention‐control design, thus we judged participants in all psychological intervention trials as unblinded to treatment allocation. The outcome assessor was blinded in seven psychological intervention trials (Barth 2005; Doering 2007; Freedland 2009; MoodCare 2011; SPIRR‐CAD 2011; TREATED‐ACS 2020; Yang 2019). Seven trials did not report sufficient details regarding blinding to make a judgement of low or high risk (Brown 1993; Dao 2011; ENRICHD 2003; Fang 2003; U‐CARE 2018; WIDeCAD 2017; Zarea 2014). We assessed one psychological trial as high risk and unblinded, as the outcome was assessed using patient self‐report without sufficient information regarding blinding (McLaughlin 2005).
In six pharmacological trials blinding was adequately realised and described (Abbasi 2015; CREATE 2007; Divsalar 2018; EsDEPACS 2014; Shahmansouri 2014; UPBEAT 2012). Four pharmacological trials reported using a double‐blind method but did not describe who was blinded (MIND‐IT 2007; Roose 1998; SADHART 2002; Strik 2000). One trial was described as open‐label trial and hence unblinded (Wang 2020). The remaining 11 trials did not report sufficient information regarding blinding of staff, participants, and outcome assessors (ANDROS 2015; Carney 2009; Freeman 1986; Kennedy 2005; Li 2005; Liu 1999; Liu 2016; Ma 2019; McFarlane 2001; Pizzi 2009; Tian 2016).
Incomplete outcome data
Fourteen trials provided intention‐to‐treat (ITT) analyses for primary outcomes (Carney 2009; CREATE 2007; Divsalar 2018; Freedland 2009; MIND‐IT 2007; MoodCare 2011; Roose 1998; SADHART 2002; SPIRR‐CAD 2011; Strik 2000; TREATED‐ACS 2020; UPBEAT 2012; WIDeCAD 2017; Yang 2019). One trial reported both ITT and per‐protocol analyses simultaneously (SPIRR‐CAD 2011). Depression outcomes were analysed per‐protocol in two trials that reported cardiovascular mortality and cardiac events as ITT (ENRICHD 2003; U‐CARE 2018). Conversely, Strik 2000 reported ITT analyses for depression outcomes and per‐protocol analyses for cardiac events, cardiovascular vital signs, and ECG waves. Fourteen trials reported per‐protocol analyses (Abbasi 2015; Barth 2005; Brown 1993; Doering 2007; EsDEPACS 2014; Freeman 1986; Kennedy 2005; Ma 2019; McFarlane 2001; McLaughlin 2005; Pizzi 2009; Shahmansouri 2014; Tian 2016; Wang 2020). The remaining seven studies provided insufficient information to make a determination (ANDROS 2015; Dao 2011; Fang 2003; Li 2005; Liu 1999; Liu 2016; Zarea 2014).
Selective reporting
We judged eight studies as free of selective reporting based on the comparison of outcomes reported in published study protocols, methods sections, and original papers (CREATE 2007; EsDEPACS 2014; Freedland 2009; MoodCare 2011; Shahmansouri 2014; TREATED‐ACS 2020; U‐CARE 2018; WIDeCAD 2017). Three trials have as yet not reported the results of all the outcomes mentioned in published protocols (Carney 2009; MIND‐IT 2007; SPIRR‐CAD 2011). We assessed four trials as high risk of bias due to incomplete or inadequate outcome reporting (ENRICHD 2003; Kennedy 2005; Ma 2019; Strik 2000). Furthermore, in UPBEAT 2012, we rated selective reporting as unclear risk bias, as measures of variance (standard deviation (SD) or standard error (SE)) were not reported, and P values were reported for active treatment (sertraline group, exercise group), thereby combining two separate interventions. No published or unpublished trial protocols were available other than trial registries for the remaining 21 trials (Abbasi 2015; ANDROS 2015; Barth 2005; Brown 1993; Dao 2011; Divsalar 2018; Doering 2007; Fang 2003; Freeman 1986; Li 2005; Liu 1999; Liu 2016; McFarlane 2001; McLaughlin 2005; Pizzi 2009; Roose 1998; SADHART 2002; Tian 2016; Wang 2020; Yang 2019; Zarea 2014), thus it remains unclear whether or not there is a risk of selective reporting in these trials.
Other potential sources of bias
We judged eight studies as free of other sources of bias (Abbasi 2015; CREATE 2007; EsDEPACS 2014; Freedland 2009; Pizzi 2009; Shahmansouri 2014; Strik 2000; UPBEAT 2012). The risk of other sources of bias remains unclear for the three trials translated from Chinese (Fang 2003; Li 2005; Liu 1999). Ten psychotherapy studies may exhibit performance bias because the adherence of therapists in the treatment group was unclear (Barth 2005; Brown 1993; Doering 2007; McLaughlin 2005; TREATED‐ACS 2020; U‐CARE 2018; WIDeCAD 2017; Yang 2019; Zarea 2014), or was undertaken differently from the protocol (MoodCare 2011). In two trials there was evidence of statistically significant differences between groups at baseline on depression (Brown 1993; MIND‐IT 2007), or differences at baseline were not established (ENRICHD 2003; Wang 2020). In McFarlane 2001 (p 619 and p 620) and McLaughlin 2005 (discrepancy between text and figure of depression score on Hospital Anxiety and Depression Scale (HADS)), results were inconsistently reported. In three trials (Carney 2009; SPIRR‐CAD 2011; U‐CARE 2018), there was a change in the inclusion criteria.
In two trials there was evidence of high risk of bias (selection bias), with eligible participants not recruited (Divsalar 2018; WIDeCAD 2017). There was evidence of high risk of other bias in two internet CBT interventions that were terminated early by investigators with ITT results reported (U‐CARE 2018; WIDeCAD 2017). Similarly, a high risk of other bias was evident in two drug trials terminated early with results not reported (ANDROS 2015), or partially reported per protocol in redacted form (Kennedy 2005). A high risk of other bias was evident in two trials that either did not register the trial (Tian 2016), or did so retrospectively after recruitment had commenced (Ma 2019). A high risk of other bias was evident in two drug trials that included pharmaceutical company employees in the trial design, conduct, analysis, and reporting of results (Roose 1998; SADHART 2002). A high risk of other bias was evident in Liu 2016, where the primary results were reported mid‐treatment.
Effects of interventions
See: Summary of findings 1 Summary of findings table ‐ Psychological treatment compared to control for depression in patients with coronary artery disease; Summary of findings 2 Summary of findings table ‐ Psychological treatment 1 compared to psychological treatment 2 for depression in patients with coronary artery disease; Summary of findings 3 Summary of findings table ‐ Pharmacological treatment compared to placebo for depression in patients with coronary artery disease; Summary of findings 4 Summary of findings table ‐ Pharmacological treatment 1 compared to pharmacological treatment 2 for depression in patients with coronary artery disease
Comparison 1: Psychological intervention versus control
Thirteen trials studied the effects of a psychological intervention versus control (Barth 2005; Dao 2011; Doering 2007; ENRICHD 2003; Fang 2003; Freedland 2009; McLaughlin 2005; MoodCare 2011; SPIRR‐CAD 2011; U‐CARE 2018; WIDeCAD 2017; Yang 2019; Zarea 2014).
1.1 Primary outcome: depression symptoms
Twelve studies investigated the effects of psychological interventions on short‐term depression symptoms (i.e. the end of treatment) (Barth 2005; Dao 2011; Doering 2007; Fang 2003; Freedland 2009; McLaughlin 2005; MoodCare 2011; SPIRR‐CAD 2011; U‐CARE 2018; WIDeCAD 2017; Yang 2019; Zarea 2014). One study did not report sufficient information to compute effect sizes (Doering 2007). Three studies reported data as change scores (Fang 2003; SPIRR‐CAD 2011; Yang 2019), of which two studies reported end‐of‐treatment scores that could be pooled in analysis of standardised mean difference (SMD) (Fang 2003; SPIRR‐CAD 2011). Meta‐analysis of 10 trials showed that psychological interventions may result in a reduction in depression symptoms at the end of treatment compared to control groups (pooled SMD −0.55, 95% confidence interval (CI) −0.92 to −0.19) (n = 1226) (Analysis 1.1) (Barth 2005; Dao 2011; Fang 2003; Freedland 2009; McLaughlin 2005; MoodCare 2011; SPIRR‐CAD 2011; U‐CARE 2018; WIDeCAD 2017; Zarea 2014). Heterogeneity was considerable (I2 = 88%). One trial reported a significant change in the depression subscale of the HADS for patients' intensive telephone‐based care (Δ −2.20, SD 2.61) compared to usual care (Δ −1.04, SD 2.89) (n = 212) (Yang 2019), which could not be pooled. Sensitivity analyses for Analysis 1.1 (Table 2) indicate minimal change to the pooled SMD and heterogeneity in analyses restricted to non‐major depressive disorder trials and CBT trials. By contrast, analyses restricted to depression‐only trials resulted in an attenuation of the SMD that was no longer significant.
| Comparison | Sensitivity analysis | Study references [n] | SMD | I2 |
|---|---|---|---|---|
| Psychological vs control | None (Analysis 1.1) | Barth 2005; Dao 2011; Fang 2003; Freedland 2009; McLaughlin 2005; MoodCare 2011; SPIRR‐CAD 2011; U‐CARE 2018; WIDeCAD 2017; Zarea 2014 (n = 1226) | −0.55 (95% CI −0.92 to −0.19) | 88 |
| Psychological vs control | Constrained to trials without depression disorders as part of the inclusion criteria | Barth 2005; Dao 2011; Fang 2003; McLaughlin 2005; MoodCare 2011; SPIRR‐CAD 2011; U‐CARE 2018; WIDeCAD 2017; Zarea 2014 (n = 1145) | −0.53 (95% CI −0.92 to −0.13) | 89 |
| Psychological vs control | Constrained to depression (e.g. excluding trials with mixed depression and/or anxiety as part of the inclusion criteria) | Barth 2005; Freedland 2009; MoodCare 2011; SPIRR‐CAD 2011; WIDeCAD 2017 (n = 681) | −0.27 (95% CI −0.58 to 0.03) | 65 |
| Psychological vs control | Constrained to cognitive‐behavioural therapy trials | Dao 2011; Freedland 2009; MoodCare 2011; U‐CARE 2018; WIDeCAD 2017 (n = 571) | −0.48 (95% CI −0.77 to −0.19) | 61 |
CI = confidence interval; SMD = standardised mean difference
Eight studies investigated the effects of psychological interventions on medium‐term depression symptoms (i.e. one to six months after treatment) (Dao 2011; Doering 2007; ENRICHD 2003; Freedland 2009; McLaughlin 2005; MoodCare 2011; SPIRR‐CAD 2011; Zarea 2014). One study did not report sufficient information to compute effect sizes (Doering 2007). Meta‐analysis of seven psychotherapy trials showed no benefit compared to control on medium‐term depression symptoms (pooled SMD −0.20, 95% CI −0.42 to 0.01) (n = 2620) (Analysis 1.2) (Dao 2011; ENRICHD 2003; Freedland 2009; McLaughlin 2005; MoodCare 2011; SPIRR‐CAD 2011; Zarea 2014). Heterogeneity was substantial (I2 = 69%).
Two trials investigated the effects of psychological interventions on long‐term depression symptoms (i.e. more than six months after treatment) (Freedland 2009; U‐CARE 2018). CBT was not superior to control on long‐term depression symptoms (SMD −0.46, 95% CI −0.96 to 0.04) (n = 282) (Analysis 1.3). There was evidence of considerable heterogeneity (I2 = 72%).
1.2 Primary outcome: depression remission and response
Three studies reported on depression remission in the short term (i.e. end of treatment) (n = 862) (Freedland 2009; SPIRR‐CAD 2011; Yang 2019). CBT was beneficial compared to usual care (odds ratio (OR) 5.02, 95% CI 1.95 to 12.90) in the study by Freedland 2009. An intensive telephone‐based care programme was beneficial compared to usual care (OR 2.25, 95% CI 1.22 to 4.15) in the study by Yang 2019. Stepwise, fully manualised individual and group psychotherapy was not superior compared to usual care (n = 569) (SPIRR‐CAD 2011). A pooled analysis suggests that psychological intervention results in little to no difference in depression remission at the end of treatment (OR 2.02, 95% CI 0.78 to 5.19) (n = 862) (Analysis 1.4). Statistical heterogeneity remained considerable between studies (I2 = 87%).
One trial included only participants with depressive disorders and re‐evaluated participants in the medium term (four months) for depression disorders, but did not report these data (Doering 2007). Only Freedland 2009 (n = 81) reported on medium‐ and long‐term depression remission. No effect was observed in the medium term (i.e. one to six months after end of treatment) (Analysis 1.5). In the same trial, the effect was significant in the long term (i.e. more than six months after end of treatment; OR 5.06, 95% CI 1.96 to 13.08) (Analysis 1.6).
No trials reported depression response at any time point.
1.3 Primary outcome: all‐cause and cardiovascular mortality
Two trials reported loss to follow‐up attributable to all‐cause mortality in the short term (McLaughlin 2005; Yang 2019). Few events were recorded (five deaths), and neither trial showed a significant increase or decrease in probability of mortality in the short term. Pooled analysis of the two trials was very uncertain regarding the effect of psychological interventions on all‐cause mortality at end of treatment (OR 0.31, 95% CI 0.05 to 2.02; I2 = 0%) (n = 324) (Analysis 1.7).
The SPIRR‐CAD 2011 trial reported all‐cause mortality in the medium term and did not find a significant increase or decrease in probability of mortality (OR 0.66, 95% CI 0.23 to 1.88) (n = 570) (Analysis 1.8).
The ENRICHD 2003 (n = 2481) and Yang 2019 (n = 189) trials reported all‐cause mortality in the long term as an endpoint. No effect between psychotherapy versus usual care was observed in the two trials, and the pooled effect was not significant (OR 0.83, 95% CI 0.48 to 1.42) (n = 2670) (Analysis 1.9). There was evidence of moderate heterogeneity (I2 = 46%).
No psychological intervention trial reported the short‐term cardiovascular mortality outcome. The SPIRR‐CAD 2011 trial (n = 570) reported cardiovascular mortality in the medium term and did not find a significant increase or decrease in probability of cardiovascular mortality (Analysis 1.10). Two trials reported on cardiovascular mortality in the long term (ENRICHD 2003; U‐CARE 2018). No effect between CBT versus usual control was observed (OR 0.83, 95% CI 0.62 to 1.10) (n = 2720) (Analysis 1.11). There was no evidence of heterogeneity (I2 = 0%).
1.4 Primary outcome: cardiac events
No psychological intervention trial reported MI as an outcome in the short or medium term. Two trials (n = 2720) reported on MI (ENRICHD 2003; U‐CARE 2018). In U‐CARE 2018, the endpoint was inclusive of acute coronary syndromes (ST and non‐ST elevated MI, and unstable angina). No effect between CBT and control was observed on MI outcome in the long term (OR 1.09, 95% CI 0.73 to 1.65) (n = 2720) (Analysis 1.12). There was no evidence of heterogeneity (I2 = 27%). Only U‐CARE 2018 reported the primary outcomes of heart failure and stroke in the long term (n = 239). U‐CARE 2018 did not report a significant increase or decrease in probability of heart failure (OR 3.82, 95% CI 0.78 to 18.77) (Analysis 1.13) or stroke (OR 2.10, 95% CI 0.19 to 23.52) (Analysis 1.14) in the long term (n = 239), though the number of events were sparse. Two trials reported coronary revascularisation procedure as an outcome in the long term (OR 0.91, 95% CI 0.75 to 1.11) (n = 2780) (Analysis 1.15) without heterogeneity (I2 = 0%) (ENRICHD 2003; U‐CARE 2018). No psychological intervention trial reported angina or arrhythmia as an outcome in the short, medium, or longer term.
1.5 Secondary outcome: healthcare and resource utilisation
One trial reported data on the effect of a brief CBT intervention compared to usual care on hospital length of stay after a CABG procedure (mean difference (MD) −1.30, 95% CI −2.53 to −0.07) (n = 97) (Analysis 1.17) (Dao 2011). One trial reported data on the effect of a CBT intervention compared to usual care on hospitalisation for cardiovascular causes (OR 0.92, 95% CI 0.78 to 1.09) (n = 2481) (Analysis 1.16) (ENRICHD 2003).
1.6 Secondary outcome: quality of life
Three studies investigated the effects of psychological interventions on short‐term quality of life (QoL) (Freedland 2009; MoodCare 2011; WIDeCAD 2017). The Physical Component Summary (PCS) and Mental Component Summary (MCS) scores of the Medical Outcomes Study Short‐Form 12/36‐item Health Survey (SF‐12 and SF‐36) were used in MoodCare 2011 and Freedland 2009, respectively. The WIDeCAD 2017 trial utilised the Assessment of Quality of Life scale (AQoL‐8D) at end of treatment, where higher scores indicate lower QoL, therefore these data were not pooled with data from the trials utilising the SF‐12 and SF‐36 (Freedland 2009; MoodCare 2011).
There was no beneficial effect of CBT versus usual care on PCS score (SMD 0.22, 95% CI −0.06 to 0.50) (n = 202) (I2 = 0%). (Analysis 1.18). There was an effect favouring CBT versus usual care on MCS in Freedland 2009. No effect on MCS was reported in MoodCare 2011. The pooled effect of the two trials indicated a moderate effect on MCS favouring CBT versus usual care (SMD 0.51, 95% CI 0.07 to 0.94) (n = 202), with substantial heterogeneity (I2 = 57%) (Analysis 1.19). There was no difference between internet CBT (M = 63.87 ± 16.43) and wait‐list control (M = 63.78 ± 14.42; Cohen's d = 0.00) on total AQoL‐8D scores at end of treatment in the WIDeCAD 2017 trial (n = 34).
Three studies investigated the effects of psychological interventions on medium‐term QoL, using the PCS and MCS scores of the SF‐12/36 (Freedland 2009; MoodCare 2011), and the overall score of the SF‐12 (Dao 2011). The pooled effect of two trials indicated no effect on PCS for psychotherapy (both CBT) versus usual care (SMD 0.18, 95% CI −1.29 to 1.65) (n = 202), without evidence of heterogeneity (I2 = 25%) (Analysis 1.20) (Freedland 2009; MoodCare 2011). The pooled effect of two trials indicated no effect on MCS for psychotherapy (both CBT) versus usual care (SMD 1.21, 95% CI −1.09 to 3.52) (n = 202), with evidence of moderate heterogeneity (I2 = 41%) (Analysis 1.21) (Freedland 2009; MoodCare 2011). In the trial by Dao 2011, no effect for brief CBT versus usual care was found for the SF‐12 overall score (MD −4.00, 95% CI −8.48 to 0.48) (n = 96) (Analysis 1.22). One trial investigated the effects of psychological interventions on long‐term QoL using the PCS and MCS scores of the SF‐36 quantified at nine months (n = 81) (Freedland 2009). No effect was observed on the PCS score in the long term (MD 0.70, 95% CI −3.60 to 5.00) (Analysis 1.23). An effect was reported for the MCS score of the SF‐36 QoL measure (MD 6.70, 95% CI 1.29 to 12.11) (n = 81) (Analysis 1.24). One further study did not report sufficient information to compute effects sizes regarding QoL (ENRICHD 2003).
1.7 Secondary outcome: cardiovascular vital signs, biomarkers of platelet activation, ECG wave recording
No trial comparing psychological interventions with control reported cardiovascular vital signs, biomarkers of platelet activation, or ECG wave recording at any follow‐up time point.
1.8 Post hoc outcome: non‐cardiac adverse events
One trial comparing CBT with wait‐list control reported a non‐cardiac adverse event (suicide intent) during the eight‐week intervention and did not attribute this to the intervention (WIDeCAD 2017). One trial reported insufficient information on newly diagnosed severe mental illness (e.g. severe depression, suicide attempt, and psychosis) (SPIRR‐CAD 2011). Otherwise, data were sparse for non‐cardiac adverse effects of psychological interventions for depression in individuals with CAD.
Comparison 2: Psychological intervention versus psychological intervention
In three trials with a total of 219 participants the effects of a specific psychological intervention were compared with the effects of another psychological intervention or clinical management (Brown 1993; Freedland 2009; TREATED‐ACS 2020). Brown 1993 compared 12 weekly sessions of behaviour therapy for patients and their partners by Lewinsohn versus 12 weekly sessions of person‐centred therapy by Rogers. Freedland 2009 compared 12 weekly sessions of CBT versus 12 weekly sessions of supportive stress management. TREATED‐ACS 2020 compared an intervention comprising eight sessions of CBT and four sessions of well‐being therapy versus CM. We could not report pooled estimates for this comparison due to the heterogeneous interventions and different comparators examined in the trials (see Types of interventions). Data are therefore reported as mean differences and described qualitatively in text.
2.1 Primary outcome: depression score
Three studies investigated the effects of psychological intervention compared to another psychological intervention on short‐term depression symptoms (i.e. end of treatment) (Brown 1993; Freedland 2009; TREATED‐ACS 2020). The evidence is very uncertain regarding the effect on end‐of‐treatment depression symptoms for behaviour therapy compared to person‐centred therapy on the BDI (n = 40) (Brown 1993); CBT compared to supportive stress management on the HAM‐D (n = 83) (Freedland 2009); and the combination of CBT and well‐being therapy compared to CM on symptoms measured by the Clinical Interview for Depression (CID) (n = 100) (Analysis 2.1) (TREATED‐ACS 2020).
Three studies investigated the effects of psychological intervention compared to another psychological intervention or CM on medium‐term depression symptoms (i.e. one to six months after treatment) (Brown 1993; Freedland 2009; TREATED‐ACS 2020). No effect was observed for CBT compared to supportive stress management on symptoms measured by the HAM‐D depression score (n = 83) (Freedland 2009). Behaviour therapy showed a beneficial effect compared to person‐centred therapy on symptoms measured by the BDI (SMD −0.65, 95% CI −1.28 to −0.01) (n = 40) (Brown 1993). No effect was observed for the combination of CBT and well‐being therapy compared to CM on symptoms measured by the CID (n = 100) (Analysis 2.2) (TREATED‐ACS 2020).
Three studies investigated the effects of psychological intervention compared to another psychological intervention or CM on long‐term depression symptoms (i.e. more than six months after treatment) (Brown 1993; Freedland 2009; TREATED‐ACS 2020). No effect was observed for CBT compared to supportive stress management on symptoms measured by the HAM‐D (n = 83) (Freedland 2009). Behaviour therapy resulted in a large effect compared to person‐centred therapy on symptoms measured by the BDI (SMD −0.69, 95% CI −1.33 to −0.05) (n = 40) (Brown 1993). No effect was observed for the combination of CBT and well‐being therapy compared to CM on symptoms measured by the CID (n = 100) (Analysis 2.3) (TREATED‐ACS 2020).
2.2 Primary outcome: depression remission and response
One trial investigated the effects of psychological intervention compared to another psychological intervention on short‐term depression remission (i.e. end of treatment) (Freedland 2009). No effect was observed for CBT compared to supportive stress management on the HAM‐D (n = 83) (Analysis 2.4) (Freedland 2009). No effect was observed for CBT compared to supportive stress management on HAM‐D depression remission in one study (n = 83) in the medium term (i.e. one to six months after end of treatment) (Analysis 2.5) and the long term (i.e. more than six months after end of treatment) (Analysis 2.6) (Freedland 2009). One trial reported depression relapse, but as remission and response rate was unclear data were not extracted (TREATED‐ACS 2020).
2.3 Primary outcome: all‐cause and cardiovascular mortality
No trials reported all‐cause mortality at any length of follow‐up for this comparison. One trial comparing the combination of CBT and well‐being therapy versus CM reported cardiac death as a cause of attrition or dropout from the study from 18 to 30 months (TREATED‐ACS 2020), though events were sparse (Analysis 2.7) (n = 100).
2.4 Primary outcome: cardiac events
One trial reported composite cardiac events to 30 months of follow‐up but did not differentiate cardiac events, therefore data could not be analysed (n = 100) (TREATED‐ACS 2020).
2.5 Secondary outcome: healthcare and resource utilisation
No trials reported healthcare and resource utilisation at any length of follow‐up for this comparison.
2.6 Secondary outcome: quality of life
Only Freedland 2009 (n = 83) reported QoL using mean final scores of the SF‐36 subscales PCS and MCS. No effects were observed for CBT compared to supportive stress management in the short term (i.e. end of treatment) for the PCS (Analysis 2.8) (n = 83) and MCS (Analysis 2.9) (n = 83). No effects were observed for CBT compared to supportive stress management in the medium term (i.e. one to six months after end of treatment) for the PCS (Analysis 2.10) (n = 83) and MCS (Analysis 2.11) (n = 83). Likewise, no effects were reported for the PCS (Analysis 2.12) and MCS (Analysis 2.13) in the long term (i.e. more than six months after end of treatment) (n = 83).
2.7 Secondary outcome: cardiovascular vital signs, biomarkers of platelet activation, ECG wave recording
One trial quantified biomarkers of platelet activation (i.e. platelet count, D‐dimer level) at three months but did not report sufficient information to compute effect sizes (TREATED‐ACS 2020).
2.8 Post hoc outcome: non‐cardiac adverse events
Non‐cardiac adverse events were inconsistently and sparsely reported for this comparison. In Freedland 2009, one participant in the supportive stress management group dropped out due to psychiatric complications.
Comparison 3: Pharmacological intervention versus placebo
Thirteen trials studied the effects of a pharmacological intervention versus placebo (ANDROS 2015; CREATE 2007; EsDEPACS 2014; Freeman 1986; Li 2005; Liu 1999; Ma 2019; McFarlane 2001; MIND‐IT 2007; Pizzi 2009; SADHART 2002; Strik 2000; UPBEAT 2012). Minimal information could be extracted from the trial registry of the two trials that were terminated early (ANDROS 2015; Kennedy 2005). Data from CREATE 2007 were restricted to the citalopram and CM versus placebo and CM arms of this trial, thereby excluding data from the arms randomised to psychotherapy (IPT).
3.1 Primary outcome: depression score
Twelve studies investigated the effects of pharmacological interventions on short‐term depression symptoms (i.e. end of treatment) (CREATE 2007; EsDEPACS 2014; Freeman 1986; Li 2005; Liu 1999; Ma 2019; McFarlane 2001; MIND‐IT 2007; Pizzi 2009; SADHART 2002; Strik 2000; UPBEAT 2012). Two trials did not report sufficient information to compute effects sizes (Freeman 1986; MIND‐IT 2007). A pooled analysis of eight trials indicated that pharmacological intervention may result in a large reduction in depression symptoms at the end of treatment versus placebo (SMD −0.83, 95% CI −1.33 to −0.32) (n = 750) (Analysis 3.1) (CREATE 2007; EsDEPACS 2014; Li 2005; Liu 1999; Ma 2019; McFarlane 2001; Pizzi 2009; UPBEAT 2012). There was evidence of considerable heterogeneity between studies (I2 = 90%). Sensitivity analyses for Analysis 3.1 (Table 3) indicated that heterogeneity remained. The pooled SMD was attenuated and no longer significant in three trials undertaken in participants with depressive disorders. There was no attenuation of the pooled SMD in analyses restricted to seven trials undertaken in depression‐only samples (i.e. excluding mixed depression/anxiety). The pooled SMD was modestly attenuated in analyses restricted to six serotonergic antidepressant trials.
| Comparison | Sensitivity analysis | Study references [n] | SMD | I2 |
|---|---|---|---|---|
| Pharmacological vs placebo | None (Analysis 3.1) | CREATE 2007; EsDEPACS 2014; Li 2005; Liu 1999; Ma 2019; McFarlane 2001; Pizzi 2009; UPBEAT 2012 (n = 750) | SMD −0.83 (95% CI −1.33 to −0.32) | 90 |
| Pharmacological vs placebo | Constrained to trials with major depressive disorders as part of the inclusion criteria | CREATE 2007; EsDEPACS 2014; Liu 1999 (n = 427) | SMD −0.48 (95% CI −1.38 to 0.42) | 95 |
| Pharmacological vs placebo | Constrained to depression (e.g. excluding trials with mixed depression and/or anxiety as part of the inclusion criteria) | CREATE 2007; EsDEPACS 2014; Li 2005; Liu 1999; McFarlane 2001; Pizzi 2009; UPBEAT 2012 (n = 695) | SMD −0.76 (95% CI −1.29 to −0.23) | 90 |
| Pharmacological vs placebo | Constrained to serotonergic antidepressant trials | CREATE 2007; EsDEPACS 2014; Liu 1999; McFarlane 2001; Pizzi 2009; UPBEAT 2012 (n = 613) | SMD −0.69 (95% CI −1.27 to −0.11) | 91 |
CI = confidence interval; SMD = standardised mean difference
Two studies reported depression change scores that could not be pooled in the main meta‐analysis of end‐of‐treatment SMDs (SADHART 2002; Strik 2000), and one trial reported both end‐of‐treatment scores and change scores (UPBEAT 2012). A pooled analysis of change scores suggested a small change in depression symptoms (SMD −0.18, 95% CI −0.36 to −0.00) compared to placebo (Analysis 3.2) (n = 482). Heterogeneity was low (I2 = 0%). No trials reported depression symptoms in the medium or long term.
3.2 Primary outcome: depression remission and response
Four studies investigated the effects of pharmacological interventions on short‐term depression remission (i.e. end of treatment) (CREATE 2007; EsDEPACS 2014; MIND‐IT 2007; Strik 2000). One study reported insufficient information on "depressive reductive rate" which was unclear and not extracted (Li 2005). Citalopram showed a beneficial effect compared to placebo in two studies (CREATE 2007; EsDEPACS 2014). Mirtazapine, MIND‐IT 2007 (n = 91), and fluoxetine, Strik 2000 (n = 54), did not show a beneficial effect compared to placebo. Pooled meta‐analysis of four studies indicated that pharmacological intervention probably results in a moderate to large increase in depression remission at the end of treatment versus placebo (OR 2.06, 95% CI 1.47 to 2.89; I2 = 0%) (Analysis 3.3) (n = 646) (CREATE 2007; EsDEPACS 2014; MIND‐IT 2007; Strik 2000).
Five trials investigated the effects of pharmacological intervention on depression response, defined as a 50% reduction in depression scores, in the short term (i.e. end of treatment) (CREATE 2007; EsDEPACS 2014; Liu 1999; Pizzi 2009; SADHART 2002). No significant effect was found in one trial (CREATE 2007). An effect favouring pharmacological intervention for depression response versus placebo was found in the other four trials (EsDEPACS 2014; Liu 1999; Pizzi 2009; SADHART 2002). The pooled effect from five trials indicated an effect favouring pharmacological intervention treatment versus placebo (OR 2.73, 95% CI 1.65 to 4.54) (n = 891) with considerable heterogeneity (I2 = 62%) (Analysis 3.4). No trials reported depression remission or depression response in the medium or long term for this comparison.
3.3 Primary outcome: all‐cause and cardiovascular mortality
Five studies reported all‐cause mortality (EsDEPACS 2014; Liu 1999; McFarlane 2001; MIND‐IT 2007; SADHART 2002). No deaths occurred in two studies in the short term (MIND‐IT 2007 (n = 91); (McFarlane 2001) (n = 27)), and in two trials no effect was observed (Liu 1999; SADHART 2002). Data from one trial after translation remained unclear and could not be extracted (Li 2005). The evidence is very uncertain regarding the effect of pharmacological intervention on all‐cause mortality at end of treatment in two trials (OR 0.38, 95% CI 0.10 to 1.47; I2 = 0%) (n = 437) (Analysis 3.5). Medium‐term all‐cause mortality data was not reported. Two studies reported long‐term all‐cause mortality (EsDEPACS 2014 (n = 300); SADHART 2002 (n = 361)), neither of which showed a survival benefit from pharmacological intervention versus placebo. The pooled effect was not significant (OR 0.89, 95% CI 0.64 to 1.25) (n = 661) (Analysis 3.6) and without heterogeneity (I2 = 0%). One trial reported long‐term cardiovascular mortality and did not find a survival benefit from escitalopram versus placebo (Analysis 3.7) (n = 300) (EsDEPACS 2014).
3.4 Primary outcome: cardiac events
Four studies analysed cardiac events (CREATE 2007; EsDEPACS 2014; Liu 1999; SADHART 2002). One trial reported specific cardiac events occurring by the end of treatment in groups randomised to mirtazapine or placebo (MIND‐IT 2007). Serious adverse events were described in the terminated trial (Kennedy 2005). Insufficient information was provided in one trial to adjudicate whether cardiac events were assessed or had occurred (Ma 2019). Three studies reported the occurrence of MI in the short term (CREATE 2007; EsDEPACS 2014; SADHART 2002). The evidence is very uncertain regarding the effects of pharmacological intervention on MI at end of treatment from tree trials (OR 0.74, 95% CI 0.26 to 2.09; I2 = 0%) (n = 728) (Analysis 3.8). Longer‐term MI was not significantly decreased in one trial comparing escitalopram versus placebo (Analysis 3.9) (n = 300) (EsDEPACS 2014).
There was little to no difference in angina at the end of treatment in trials of sertraline (SADHART 2002) (n = 369), mirtazapine (MIND‐IT 2007) (n = 91), citalopram (CREATE 2007) (n = 142), and escitalopram (EsDEPACS 2014) (n = 217). Meta‐analysis of four studies indicated little to no difference with pharmacological intervention versus placebo in angina pectoris (OR 0.75, 95% CI 0.44 to 1.28; I2 = 0%) (Analysis 3.10) (n = 819) (CREATE 2007; EsDEPACS 2014; MIND‐IT 2007; SADHART 2002). Angina was not reported in the medium to long term for this comparison.
There was little to no difference in heart failure in trials of sertraline (SADHART 2002) (n = 369), mirtazapine (MIND‐IT 2007) (n = 91), and citalopram (CREATE 2007) (n = 142), though the number of events was sparse. Meta‐analysis of three studies indicated little to no difference with pharmacological intervention versus placebo in heart failure in the short term (OR 0.93, 95% CI 0.33 to 2.62; I2 = 0%) (Analysis 3.11) (n = 602) (CREATE 2007; MIND‐IT 2007; SADHART 2002).
Arrhythmias were decreased in one trial of fluoxetine compared to placebo at the end of treatment (Liu 1999). Atrial fibrillation was reported as a serious adverse event in the terminated trial (Kennedy 2005). The pooled estimate from two trials showed little to no difference in arrhythmia at end of treatment (OR 0.46, 95% CI 0.01 to 17.06) (Analysis 3.12) (n = 87). The number of events was sparse, and there was considerable heterogeneity between studies (I2 = 71%). Changes to ECG waves, Kennedy 2005; Strik 2000, and heart rate variability, McFarlane 2001, were reported but could not be extracted due to uncertainty in the assessment of arrhythmia endpoints. Ventricular function assessment and endpoints were unclear after translation of one trial, and data could not be extracted (Li 2005).
There was little to no difference in stroke in one trial comparing sertraline to placebo, SADHART 2002 (n = 369), and one trial comparing escitalopram to placebo, EsDEPACS 2014 (n = 217). One trial of citalopram compared to placebo reported no stroke events in either group (n = 142) (CREATE 2007). The pooled probability estimate of stroke at the end of treatment from the two trials with events indicated little to no difference in stroke (OR 0.99, 95% CI 0.20 to 4.96) (Analysis 3.13) (n = 586). The number of events was sparse, and there was no heterogeneity between studies (I2 = 0%). There was little to no difference in percutaneous coronary intervention procedures in the long term in one trial of escitalopram versus placebo (Analysis 3.14) (n = 300) (EsDEPACS 2014). Evidence of coronary revascularisation interventions for CAD was sparse and not reported in the short and medium term.
3.5 Secondary outcome: healthcare and resource utilisation
There was little to no difference in healthcare costs at the end of treatment, excluding antidepressant medication with sertraline, in SADHART 2002 (Analysis 3.15) (n = 369). Meta‐analysis of three studies (n = 514) indicated that pharmacological interventions may reduce hospitalisations compared to placebo (OR 0.58, 95% CI 0.39 to 0.85) (Analysis 3.16) without evidence of heterogeneity (I2 = 0%) (MIND‐IT 2007; SADHART 2002; Strik 2000). Any possible effect on hospitalisation was largely attributed to a trial of sertraline (OR 0.59, 95% CI 0.38 to 0.91) (n = 369) (SADHART 2002), whereas no effect was observed in the trials of mirtazapine, MIND‐IT 2007 (n = 91), and fluoxetine, Strik 2000 (n = 54). Emergency room visits at the end of treatment were not reduced in a trial of sertraline (OR 0.58, 95% CI 0.34 to 1.00) (Analysis 3.17) (n = 369) (SADHART 2002).
3.6 Secondary outcome: quality of life
Two trials examined quality of life (EsDEPACS 2014; SADHART 2002). The SADHART 2002 trial (n = 369) investigated quality of life using the Quality of Life Enjoyment and Satisfaction Questionnaire (Q‐LES‐Q) and the SF‐36 comparing sertraline with placebo. Data for the SF‐36 were not reported sufficiently to compute effects sizes. No effect was observed for the Q‐LES‐Q (Analysis 3.18). EsDEPACS 2014 (n = 213) examined short‐ and medium‐term QoL using the WHOQOL‐BREF questionnaire. Escitalopram compared to placebo (n = 213) showed possible short‐term end‐of‐treatment effects on the following WHOQOL‐BREF subscales: physical (MD 6.80, 95% CI 2.77 to 10.83) (Analysis 3.19), psychological (MD 5.60, 95% CI 1.54 to 9.66) (Analysis 3.20), social relationship (MD 4.00, 95% CI 0.03 to 7.97) (Analysis 3.21), and environmental (MD 6.50, 95% CI 2.90 to 10.10) (Analysis 3.22) (EsDEPACS 2014). End‐of‐treatment effects on social and occupational functioning, as well as disability, were reported for a subset of participants in EsDEPACS 2014 (n = 217), but were not extracted here.
Escitalopram compared to placebo showed possible medium‐term treatment effects on the WHOQOL‐BREF subscales physical (MD 6.10, 95% CI 1.25 to 10.95) (Analysis 3.23), social relationship (MD 4.80, 95% CI 0.17 to 9.43) (Analysis 3.25), and environmental (MD 5.80, 95% CI 1.54 to 10.06) (Analysis 3.26), but not on the psychological subscale (MD 4.70, 95% CI −0.33 to 9.73) (n = 213) (Analysis 3.24) (EsDEPACS 2014).
3.7 Secondary outcome: cardiovascular vital signs, biomarkers of platelet activation, ECG wave recording
Three trials reported all BP and heart rate cardiovascular vital signs post‐treatment (CREATE 2007; EsDEPACS 2014; SADHART 2002), and a fourth trial reported heart rate and not BP (McFarlane 2001). Pooled analysis from three trials indicated that pharmacological intervention may result in little to no difference in end‐of‐treatment systolic BP versus placebo (MD −0.24, 95% CI −3.52 to 3.05) (Analysis 3.27) in three trials (n = 675) without substantial heterogeneity (I2 = 32%). Likewise, pharmacological intervention may result in little to no difference in end‐of‐treatment diastolic BP (MD 0.60, 95% CI −1.55 to 2.74) (Analysis 3.28) in three trials (n = 675). There was evidence of moderate heterogeneity between studies (I2 = 43%). Pharmacological intervention may result in little to no difference in end‐of‐treatment heart rate (MD −0.80, 95% CI −2.40 to 0.79) (Analysis 3.29) in four trials (n = 662). There was no evidence of heterogeneity between studies (I2 = 0%).
Seven studies reported platelet biomarkers post‐treatment (CREATE 2007; EsDEPACS 2014; Ma 2019; MIND‐IT 2007; Pizzi 2009; SADHART 2002; UPBEAT 2012), generally from a smaller subset of participants from each trial arm. Two studies reported insufficient data to calculate effect sizes (EsDEPACS 2014; UPBEAT 2012), and additional data for PF4 could be extracted from an online trial data repository (UPBEAT 2012). Two studies reported platelet biomarkers outside of the outcomes of this review (Ma 2019; Pizzi 2009), which may be considered in a future update. Meta‐analysis of three trials showed that pharmacological treatment may reduce βTG at end of treatment (SMD −0.54, 95% CI −0.99 to −0.09) versus placebo (n = 141) (Analysis 3.30). There was evidence of possible heterogeneity (I2 = 36%).
Meta‐analysis of three trials showed that pharmacological treatment may result in little to no difference in reduction in PF4 (SMD −0.14, 95% CI −0.48 to 0.19) versus placebo (n = 144) (Analysis 3.31). There was no evidence of heterogeneity between studies (I2 = 0%). Meta‐analysis of two trials showed that pharmacological treatment may result in little to no difference in P‐selectin (SMD −0.31, 95% CI −1.12 to 0.50) versus placebo (n = 121) (Analysis 3.32). There was evidence of considerable between‐study effect sizes (I2 = 79%). Only SADHART 2002 reported PECAM‐1 and TxB2 in a subset of trial participants. SADHART 2002 did not find an effect of pharmacological treatment versus placebo on PECAM‐1 (MD −8.30, 95% CI −18.12 to 1.52) (n = 64) (Analysis 3.33). No effect was observed in SADHART 2002 of pharmacological treatment versus placebo in TxB2 (MD −6.20, 95% CI −15.78 to 3.38) (n = 64) (Analysis 3.34).
Six studies performed end‐of‐treatment ECGs and reported wave parameters comparing pharmacological intervention versus placebo at end of treatment (CREATE 2007; EsDEPACS 2014; MIND‐IT 2007; SADHART 2002; Strik 2000; UPBEAT 2012). Three studies reported insufficient data to calculate effect sizes (MIND‐IT 2007; Strik 2000; UPBEAT 2012). A reduction in PR interval was found in the SADHART 2002 trial of sertraline when compared to placebo (MD −6.00, 95% CI −11.84 to −0.16). The pooled effect for PR interval from three studies indicated that pharmacological intervention may result in a small reduction in PR interval (MD −4.35, 95% CI −8.40 to −0.31) (Analysis 3.35) (n = 635) without evidence of heterogeneity (I2 = 0%) (CREATE 2007; EsDEPACS 2014; SADHART 2002). The pooled effect of ECG findings also suggested that pharmacological intervention may result in little to no difference in the QRS interval at the end of treatment (MD 2.37, 95% CI −0.41 to 5.15) (Analysis 3.36) (n = 635) without evidence of heterogeneity (I2 = 0%). Only CREATE 2007 (n = 142) reported the QT interval, finding no evidence of a difference between citalopram and placebo (MD 2.40, 95% CI −9.11 to 13.91). Pooled meta‐analysis from three trials indicated that pharmacological intervention probably results in little to no difference in QTc interval at the end of treatment (MD 2.76, 95% CI −1.96 to 7.47) (Analysis 3.38) (n = 635) without evidence of heterogeneity between studies (I2 = 20%).
3.8 Post hoc outcome: non‐cardiac adverse events and pharmacological side effects
One trial reported worsening depression in one participant receiving placebo and CM (CREATE 2007). Otherwise, non‐cardiac adverse events were sparsely reported. Ten studies reported pharmacological side effects (CREATE 2007; EsDEPACS 2014; Kennedy 2005; Li 2005; Ma 2019; MIND‐IT 2007; Pizzi 2009; SADHART 2002; Strik 2000; UPBEAT 2012). Two studies reported insufficient data to calculate effect sizes (Li 2005; Ma 2019). Pharmacological intervention may be associated with an increase in side effects (OR 1.44, 95% CI 1.07 to 1.92) versus placebo (Analysis 3.39) in eight trials (n = 1193) (CREATE 2007; EsDEPACS 2014; Kennedy 2005; MIND‐IT 2007; Pizzi 2009; SADHART 2002; Strik 2000; UPBEAT 2012), without evidence of heterogeneity (I2 = 0%).
Comparison 4: Pharmacological intervention versus pharmacological intervention
4.1 Primary outcome: depression symptoms
Eight trials compared two active pharmacological interventions against each other (Abbasi 2015; Carney 2009; Divsalar 2018; Liu 2016; Roose 1998; Shahmansouri 2014; Tian 2016; Wang 2020). We did not report pooled estimates for this comparison due to the heterogeneous interventions and comparators examined in the trials. The trials made the following comparisons:
-
Abbasi 2015 (n = 46) simvastatin versus atorvastatin (each 20 mg/d);
-
Carney 2009 (n = 122) the add‐on effect of sertraline (50 mg/d) plus omega‐3 (2 g/d) versus sertraline (50 mg/d) and placebo;
-
Divsalar 2018 (n = 56) sertraline (200 mg/d) plus red yeast rice (2400 mg/d) versus sertraline (200 mg/d) plus placebo;
-
Liu 2016 (n = 146) Shugan Jieyu plus sertraline placebo versus sertraline plus Shugan Jieyu placebo;
-
Roose 1998 (n = 81) paroxetine versus nortriptyline;
-
Shahmansouri 2014 (n = 40) saffron (15 to 30 mg/d) versus fluoxetine (20 to 40 mg/d);
-
Tian 2016 (n = 46) paroxetine versus fluoxetine (each 20 mg/d); and
-
Wang 2020 (n = 228) escitalopram (5 to 10 mg/d) versus Bu Xin Qi concoction (400 mL twice a day).
Eight studies examined the differential effects of two pharmacological interventions on short‐term depression symptoms, all using the HAM‐D clinician rating scale (Abbasi 2015; Carney 2009; Divsalar 2018; Liu 2016; Roose 1998; Shahmansouri 2014; Tian 2016; Wang 2020). The evidence is very uncertain as to whether different pharmacological interventions may result in a reduction in depression symptoms at end of treatment (Analysis 4.1) for: simvastatin versus atorvastatin (SMD −0.66, 95% CI −1.25 to −0.06) (n = 46) (Abbasi 2015); paroxetine versus fluoxetine (SMD −1.05, 95% CI −1.67 to −0.43) (n = 46) (Tian 2016); and escitalopram versus Bu Xin Qi (SMD −1.02, 95% CI −1.30 to −0.74) (n = 228) (Wang 2020). The evidence is very uncertain as to whether the add‐on effect of sertraline (50 mg/d) plus omega‐3 (2 g/d) versus sertraline (50 mg/d) and placebo may result in a reduction in depression symptoms at end of treatment (n = 122) (Carney 2009).
Four trials reported end‐of‐treatment depression change scores (Divsalar 2018; Liu 2016; Roose 1998; Shahmansouri 2014). In the study by Liu 2016, we assumed the data were reported as standard errors and not standard deviation as stated in the article to remain consistent with the P values reported. The evidence is very uncertain regarding the effects of different pharmacological strategies on end‐of‐treatment depression change scores in the four trials (Analysis 4.2) (Divsalar 2018 (n = 50), Liu 2016 (n = 149), Roose 1998 (n = 81), and Shahmansouri 2014 (n = 40)). No trials for this comparison reported medium‐ or longer‐term durability of interventions on depression symptoms.
4.2 Primary outcome: depression remission and response
Three studies examined the differential effects of two pharmacological interventions on depression remission (Carney 2009; Roose 1998; Shahmansouri 2014). In all three trials no differences were observed between groups using the clinician‐rated HAM‐D, Carney 2009; Shahmansouri 2014, or the BDI‐II, Roose 1998 (Analysis 4.3), and the evidence is very uncertain regarding the effects of different pharmacological strategies on end‐of‐treatment depression remission. Four studies examined the differential effects of two pharmacological interventions on depression response (Abbasi 2015; Carney 2009; Roose 1998; Shahmansouri 2014). No differences were observed using the clinician‐rated HAM‐D, Abbasi 2015; Carney 2009; Shahmansouri 2014, or the BDI‐II, Roose 1998 (Analysis 4.4). The study by Liu 2016 (n = 149) reported the number needed for treatment for non‐inferiority, but not depression response nor remission, therefore no data were extracted.
4.3 Primary outcome: all‐cause and cardiovascular mortality
The evidence from one trial is very uncertain regarding the effect of Shugan Jieyu plus sertraline placebo compared to sertraline plus Shugan Jieyu placebo on all‐cause mortality at the end of treatment (n = 149) (Analysis 4.5) (Liu 2016). No trials for this comparison reported medium‐ or longer‐term all‐cause mortality. Likewise, no trials for this comparison reported cardiovascular mortality at any time point.
4.4 Primary outcome: cardiac events
Four studies reported the differential effects of two pharmacological interventions on cardiac events at the end of treatment (i.e. short term) (Carney 2009; Roose 1998; Tian 2016; Wang 2020). The number of events were sparse for MI, heart failure, and arrhythmia, whilst no study reported stroke. The evidence is very uncertain regarding the occurrence of MI at end of treatment in trials of: sertraline plus omega‐3 versus sertraline plus placebo (n = 122) (Carney 2009); paroxetine versus fluoxetine (n = 46) (Tian 2016); and escitalopram versus Bu Xin Qi concoction (n = 228) (Wang 2020) (Analysis 4.6). No differences were reported between different pharmacological strategies on end‐of‐treatment angina in the trials by Roose 1998 (n = 81), Tian 2016 (n = 46), or Wang 2020 (n = 228) (Analysis 4.7). No differences were observed between pharmacological interventions in end‐of‐treatment heart failure in the trials reported by Carney 2009 (n = 122) and Wang 2020 (n = 228) (Analysis 4.8). Likewise, no differences were observed between pharmacological interventions in end‐of‐treatment arrhythmia in the trials reported by Carney 2009 (n = 122), Roose 1998 (n = 81), and Wang 2020 (n = 228) (Analysis 4.9). No studies reported the occurrence of MI, angina, heart failure, arrhythmia, or stroke in the medium to longer term. Coronary revascularisation procedure for CAD (angioplasty) at end of treatment did not differ between groups in the trial reported by Carney 2009 (Analysis 4.10) (n = 122).
4.5 Secondary outcome: healthcare and resource utilisation
One trial reported emergency room visits, finding no effect for sertraline plus omega‐3 versus sertraline plus placebo (n = 122) (Analysis 4.11) (Carney 2009).
4.6 Secondary outcome: quality of life
No trials evaluating this comparison reported QoL at any time point.
4.7 Secondary outcome: cardiovascular vital signs, biomarkers of platelet activation, ECG wave recording
Three studies reported the differential effects of pharmacological interventions on cardiovascular vital signs in the short term (Liu 2016; Roose 1998; Tian 2016). Paroxetine may result in a lower systolic BP (MD −10.00, 95% CI −17.10 to −2.90) compared to nortriptyline (n = 63) (Analysis 4.12) (Roose 1998). Systolic BP may not differ for pharmacological strategies employing paroxetine versus fluoxetine (n = 46) (Tian 2016), or Shugan Jieyu versus sertraline (n = 149) (Liu 2016). No differential effects were evident between pharmacological interventions for diastolic BP in the trials by Roose 1998 (n = 63), Tian 2016 (n = 46), and Liu 2016 (n = 149) (Analysis 4.13). Two studies reported heart rate. Paroxetine may result in a lower heart rate (MD −11.00, 95% CI −14.31 to −7.69) compared to nortriptyline (n = 63) (Analysis 4.14) (Roose 1998). No difference in heart rate was observed between Shugan Jieyu plus sertraline placebo and sertraline plus Shugan Jieyu placebo (n = 149) (Liu 2016). No trials reported medium‐ to longer‐term assessment of cardiovascular vital signs for this comparison.
No head‐to‐head comparison of two pharmacological interventions reported on biomarkers of platelet activation.
Two studies reported the differential effects of two pharmacological interventions on ECG waves in the short term (Liu 2016; Roose 1998). Paroxetine may result in a lower PR interval (MD −9.00, 95% CI −16.77 to −1.23) compared to nortriptyline (n = 63) (Analysis 4.15) (Roose 1998). Shugan Jieyu plus sertraline placebo versus sertraline plus Shugan Jieyu placebo was not associated with differences in PR interval (n = 146) (Liu 2016). There may be little to no differences between pharmacological interventions for the QRS (Analysis 4.16) and QTc intervals (Analysis 4.17). No trial reported end‐of‐treatment QT intervals. One trial reported ventricular premature depolarisations (Roose 1998), which was not considered in this review.
4.8 Post hoc outcome: non‐cardiac adverse events and pharmacological side effects
In Shahmansouri 2014, one participant allocated to fluoxetine withdrew from treatment due to suicidal ideation. In two trials (Liu 2016 ; Wang 2020), the definition of non‐cardiac adverse events was unclear. Otherwise, non‐cardiac adverse events were sparsely reported. Seven studies reported pharmacological side effects (Abbasi 2015; Carney 2009; Divsalar 2018; Liu 2016; Roose 1998; Shahmansouri 2014; Wang 2020). There may be little to no difference between different pharmacological intervention strategies on side effects at end of treatment in seven trials (Analysis 4.18) (n = 716).
Comparison 5: Psychological intervention versus pharmacological intervention
We found no trials evaluating psychological intervention versus pharmacological intervention. No analyses were performed.
Subgroup analyses
We planned subgroup analyses to take into account variables such as the population, sex, CAD subtype, time of onset of depression, CAD severity, and risk of bias. Lack of primary data per outcome precluded these analyses. However, as Cochrane Reviews are meant to be updated on a regular basis, these analyses may be feasible in future updates of this review.
Discussion
The current systematic review investigated the effects of psychological and pharmacological interventions on depression outcomes, mortality, cardiac events, healthcare costs and utilisation, health‐related QoL, cardiovascular vital signs, biomarkers of platelet activation, ECG wave parameters, non‐cardiac adverse events, and side effects in CAD patients with comorbid depressive disorder. Our comprehensive search strategy identified 37 RCTs fulfilling the inclusion criteria of the review. Fifteen trials examined psychological interventions, and 21 trials examined pharmacological interventions.
Summary of main results
The results of the current review provide evidence that psychological interventions may result in lower depression symptoms compared to control at end of treatment. However, psychological intervention may result in little to no difference in depression remission in the short term based on three trials. The findings of one trial favoured psychological intervention for depression remission in the long term but not in the medium term. Based on one to two trials per outcome, the evidence is uncertain or sparse for the effects of psychological interventions versus usual care on mortality and cardiac events in the short to longer term. Regarding our secondary outcomes, one trial reported that psychological intervention may result in a reduction in resource utilisation (i.e. length of hospital stay). Though an improved mental QoL favouring psychological intervention versus usual care was found in the short term, no effect on end‐of‐treatment physical QoL was observed.
The evidence base for the comparison of psychological intervention versus other psychological intervention or CM was sparse, and the evidence is very uncertain. Based on four trials, the evidence is very uncertain as to whether there may be differences between the varying approaches (behavioural therapy versus person‐centred therapy; CBT versus supportive stress management; IPT versus CM; CBT and well‐being therapy versus CM) on our primary outcomes. Statistical and methodological heterogeneity precluded the pooling of results to determine effect sizes.
Regarding the comparison pharmacological intervention versus placebo, we found low‐certainty evidence that pharmacological intervention may result in a large reduction in depression symptoms at the end of treatment. There was moderate‐certainty evidence that pharmacological intervention probably results in a moderate to large increase in depression remission at the end of treatment. The evidence is very uncertain regarding the effects of pharmacological intervention on mortality and cardiac events, and no consistent findings were reported. The evidence for our secondary outcomes of hospitalisation rates, emergency room visits, and QoL was sparse but points in the direction of a possible beneficial effect of pharmacological intervention compared to placebo. Evidence on cardiovascular vital signs, platelet biomarkers, and ECG waves was mixed and based on small substudies from the main trials. Pooled meta‐analysis of one to three trials indicated a possible small beneficial effect of pharmacological interventions for βTG and lower PR interval on ECG at the end of treatment. A possible increase in non‐cardiovascular side effects was observed with the pharmacological intervention compared with placebo.
The comparison of pharmacological intervention versus other pharmacological intervention comprised eight trials. The evidence was very uncertain for the effect of different pharmacological agents on depression symptoms at the end of treatment for: simvastatin compared to atorvastatin (Abbasi 2015); sertraline plus omega‐3 compared to sertraline plus placebo (Carney 2009); paroxetine compared to fluoxetine (Tian 2016); and escitalopram compared to Bu Xin Qi (Wang 2020). Statistical and methodological heterogeneity precluded the pooling of results to determine effect sizes.
Overall, there is evidence for a possible beneficial effect of both psychological and pharmacological interventions on depression outcomes at end of treatment. However, the evidence base is still small and did not permit conclusions about the effects of these interventions on most other outcomes, as well as on specific types of psychological approaches and pharmacological agents. Moreover, the settings, samples, interventions, and outcome measures were heterogeneous across the included studies, which hampered the interpretation of meta‐analytical synthesis. Sensitivity analyses for end‐of‐treatment depression symptoms provided mixed results that could not explain heterogeneity between psychological trials (versus control) and pharmacological trials (versus placebo). Moreover, our pre‐planned subgroup analyses were not feasible due to the low number of studies per outcome and methodological and clinical heterogeneity between studies.
Overall completeness and applicability of evidence
This review summarises the evidence regarding depression treatments in a variety of settings. The included trials comprised different CAD samples (MI, CABG, PCI); investigated various types of psychological and pharmacologic interventions; and were located in different countries with different healthcare systems, thus increasing the generalisability of the results. However, the overall completeness is limited, and the applicability of evidence restricted due to four aspects.
Firstly, most of the primary and secondary outcomes were investigated or reported insufficiently. Hence, evidence of treatment effects on these outcomes needs to be interpreted carefully. Moreover, most trials were underpowered to detect effects of depression treatments on mortality and specific cardiac events and were below the optimal information size.
Secondly, we found no studies comparing psychological and pharmacological interventions. Consequently, no conclusions could be drawn on the differential effects of these treatment approaches. A systematic review experimentally comparing the two approaches indicated that overall psychological and pharmacological interventions were equally effective for treating depression, with pharmacotherapy seemingly superior in dysthymia (g = 0.3), as well as compared to non‐directive counselling (g = 0.33), and psychotherapy superior to tricyclic antidepressants (g = 0.21) (Cuijpers 2013). Combining both pharmacotherapy and psychotherapy was superior to pharmacotherapy alone at six months or longer postrandomisation (OR = 2.93), whilst psychotherapy alone resulted in equal depression effects when compared to combined therapy at six months and longer follow‐up (Karyotaki 2016). However, the National Institute for Health and Care Excellence (NICE) guideline on depression in adults with a chronic physical health problem favours the use of psychological interventions as first‐line interventions in patients with minor and mild to moderate depression due to adverse effects of antidepressants and the resulting poor risk‐benefit ratio (NICE 2009). An increase in side effects was observed in trials of antidepressants versus placebo for patients with CAD and depression symptoms.
Thirdly, the samples of the included trials most likely differed regarding subtypes and severity of depression. The included trials comprised participants with a wide range of depressive symptomatology and different aetiology (e.g. dysthymia, minor and major depression, adjustment disorder with depressed mood; Baumeister 2012a). Depressive disorders were present immediately following the cardiac event or up to 12 months after the event. Furthermore, diverse methods and cut‐off points were used to determine trial eligibility and determine depression remission and depression response. The inclusion of mixed samples and those with different depression disorders may have levelled potential effects of depression treatments in participants with specific subtypes of depression (Baumeister 2012a; Baune 2012). For example, when these factors were considered, sensitivity analyses showed changes to the strength and significance of end‐of‐treatment depression symptoms effect sizes. Other research suggests that the onset of depression was previously shown to be a moderator of treatment outcomes in CAD patients (Dickens 2008). Another trial on depression treatment in general highlighted differential responses to psychotherapy versus pharmacotherapy in chronic depressed patients with childhood trauma compared to those without a history of childhood trauma (Nemeroff 2003). Moreover, a patient‐level meta‐analysis concluded that the effects of antidepressant medication are associated with the severity of depressive symptoms, showing minimal effects in mild to moderate depression and substantial benefit in severe depression (Fournier 2010).
Fourthly, the length of psychotherapies examined in the included trials ranged from short‐term four‐session therapies, Barth 2005; Dao 2011, to 12 sessions, Freedland 2009; TREATED‐ACS 2020; single‐ and group‐therapies, Brown 1993; SPIRR‐CAD 2011; and 12‐month telephone support counselling, Yang 2019. The number and intensity of sessions needed to show substantial benefit in psychotherapy should be higher or more specifically tailored to the needs, problems and treatment response of individual patients in order to exploit the full potential of psychological interventions (Carr 2017; Harnett 2010). Hence, the effects found in the included psychological intervention trials may be limited in part due to an insufficient number or intensity of sessions.
Quality of the evidence
The included trials differed with regard to methodological shortcomings (see Risk of bias in included studies) and quality of reporting. Many trials did not adequately describe design aspects such as randomisation procedure, allocation concealment, and blinding. Furthermore, some trials did not report ITT analyses, missing data was common, and selective reporting may have occurred. However, published protocols were not always available, and we were unable to quantify publication bias for our primary outcomes. Low‐quality studies have been associated with exaggerated effects (Cuijpers 2010; Moher 1999). The treatment effects summarised in this review may therefore be overestimated due to poor methodological quality of some of the included trials as well as uncertainty in study quality.
Most pharmacological studies were supported by pharmaceutical industry, and two trials included pharmaceutical company employees in the design, conduct, analysis, and reporting of trial outcomes. It has been shown that studies sponsored by pharmaceutical companies are more likely to have outcomes favouring the sponsor than studies with other sponsors (Lexchin 2003). Furthermore, selective reporting of null findings in industry‐funded RCTs of antidepressant trials has been documented (Turner 2008). Despite our comprehensive search strategy, there may be unpublished trials with non‐significant results or additional trials terminated prematurely.
Another source of bias results from selective reporting of negative findings for prespecified primary outcomes, whilst emphasising positive results from secondary or new outcomes of antidepressant medication trials (Pigott 2010). We were not able to obtain published protocols for all trials included in this review and thus were not able to judge the risk of selective reporting for these studies.
Meta‐analyses regarding depressive outcomes were hampered because depressive symptoms were assessed by a heterogeneous set of clinician‐rated tools and self‐report questionnaires. Furthermore, the included trials reported either final mean scores or mean change scores from baseline to final assessment or did not report sufficient information to compute effect estimates.
The GRADE assessment of primary outcomes in the short term resulted in a range of ratings of certainty of evidence. We assessed the evidence for only one outcome as moderate certainty (depression remission at end of treatment in pharmacological versus placebo trials). Otherwise, the certainty of evidence was very low, low, or could not be determined. The certainty of evidence must be taken into consideration when interpreting the findings of the review (summary of findings Table 1; summary of findings Table 2; summary of findings Table 3; summary of findings Table 4).
Potential biases in the review process
In the review process we decided to consider the ENRICHD 2003 and Barth 2005 studies as psychological intervention trials, disregarding the fact that participants in these trials were allowed to receive adjunct pharmacologic treatments in addition to the assigned psychological intervention. Hence, it remains unclear to what degree the effects of these studies were impacted by additional pharmacological treatments. Conversely, we excluded the psychological arms (IPT) in the CREATE 2007 trial who received citalopram, placebo, or CM. The results might also be biased by the inclusion of mixed study samples of CAD patients with depression and/or low social support, ENRICHD 2003, and patients with depression and/or anxiety (Brown 1993; Dao 2011; Fang 2003; Freeman 1986; Ma 2019; McLaughlin 2005; U‐CARE 2018; Zarea 2014). As a result of including these trials with mixed study samples and methodological uncertainties, the presented findings might be biased. Moreover, the inclusion of such heterogeneous samples without depression may spuriously increase or decrease the pooled effect sizes. Another source of potential bias may result from the translation process of the included Chinese trials (Fang 2003; Li 2005; Liu 1999). Despite our efforts to translate the Chinese trials accurately, the translations did not result in unambiguous results. Moreover, the limited information provided resulted in unclear risk of bias for these trials (Fang 2003; Li 2005; Liu 1999). Another potential source of bias in the review process concerns the pooling of outcomes by time frame (short, medium, and long term) in accordance with the original review (Baumeister 2011c). This likely results in data below the optimal information size when pooling uncommon cardiovascular events (e.g. stroke). Future updates to this review may consider pooling all time frames together in dichotomous but infrequent primary outcomes of mortality and cardiovascular events. Likewise, combining end‐of‐treatment depression symptom effect sizes with the medium‐term data may result in increased certainty of evidence.
Agreements and disagreements with other studies or reviews
Differences in the trials included in this review compared to previous reviews are attributable to our focus on trials investigating depression treatments in CAD patients with depression. Two psychological intervention trials included in the current review, CREATE 2007; ENRICHD 2003, were also included in the review of Van Straten 2010, which investigated the effects of psychological treatments on depressive symptoms in medical diseases. The authors conducted a meta‐analysis of 23 studies with 10 different medical diseases and concluded that depressive symptoms could be effectively treated with psychological interventions. The results of our review were in a similar direction for CAD patients with depression. However, the evidence is still sparse given the high within‐review variance of findings regarding psychological interventions.
Rayner 2010, a Cochrane Review, systematically reviewed trials investigating the effects of antidepressant medication in treating depression in physically ill people. They concluded that antidepressants were superior to placebo in a meta‐analysis of 51 studies. The evidence of the current review agrees with this finding for the specific group of CAD patients with comorbid depression. Four trials were included in both reviews (CREATE 2007; MIND‐IT 2007; SADHART 2002; Strik 2000).
One systematic review examined collaborative care interventions for patients with CAD and depression (Tully 2015). Based on six included trials, the authors reported a reduction in major cardiac events in the short but not long term, and a small‐to‐moderate effect on depression severity and an increased depression remission rate. A direct comparison of the findings on collaborative care (Tully 2015) with the stand‐alone psychological or pharmacological interventions here is difficult since the methodological heterogeneity between the respective included trials is substantial. There is as yet insufficient evidence to recommend one treatment option over another, suggesting that psychological interventions and pharmacological interventions and more complex collaborative care are recommendable for the treatment of depression in patients with CAD and depression. A network meta‐analysis compared different depression interventions for CAD patients at eight weeks from baseline (Doyle 2021). Both psychological therapy (versus usual care) and antidepressant therapy (versus placebo and usual care) displayed significantly better effects. The strongest effects were evident for combination therapy and exercise; however, only single trials were available. Moreover, the network meta‐analysis included antidepressant versus usual care interventions, which was a prespecified exclusion criterion for the current review, where we only included pharmacological versus placebo trials (Doyle 2021).
Several trials included in our review, Brown 1993; ENRICHD 2003; Freedland 2009; McLaughlin 2005; MoodCare 2011, were included in a Cochrane Review on the effects of psychological interventions in CAD patients in general (i.e. not restricted to depressed CAD patients) (Richards 2017). Overall, psychological interventions had no effect on mortality, but a beneficial effect on depression symptoms (Richards 2017), which is comparable to the current review. Also, Richards 2017 found a 22% reduction in MI for psychological interventions, which cannot be confirmed for the depression‐specific interventions for depressed CAD patients examined in the current review.
The systematic review by Swenson 2006 reported the side effects from antidepressant drug versus placebo trials performed in individuals with chronic illness. No difference was observed between SSRI and placebo for serious and non‐serious cardiovascular events. Swenson 2006 also reported higher dropout due to side effects in participants receiving SSRIs versus placebo. A direct comparison with the current review indicates some consistent results on pharmacological side effects. We found evidence that pharmacological intervention may result in an increase in side effects compared to placebo at end of treatment. However, the evidence is very uncertain as to whether there are differences between different pharmacological agents in end‐of‐treatment side effects.

Summary of the 2020 literature search update and study selection.

Risk of bias graph: review authors' judgements about each risk of bias item presented as percentages across all included studies.

Risk of bias summary: review authors' judgements about each risk of bias item for each included study.

Comparison 1: Psychological intervention versus control, Outcome 1: Depression symptoms ‐ short term

Comparison 1: Psychological intervention versus control, Outcome 2: Depression symptoms ‐ medium term

Comparison 1: Psychological intervention versus control, Outcome 3: Depression symptoms ‐ long term

Comparison 1: Psychological intervention versus control, Outcome 4: Depression remission ‐ short term

Comparison 1: Psychological intervention versus control, Outcome 5: Depression remission ‐ medium term

Comparison 1: Psychological intervention versus control, Outcome 6: Depression remission ‐ long term

Comparison 1: Psychological intervention versus control, Outcome 7: All‐cause mortality ‐ short term

Comparison 1: Psychological intervention versus control, Outcome 8: All‐cause mortality ‐ medium term

Comparison 1: Psychological intervention versus control, Outcome 9: All‐cause mortality ‐ long term

Comparison 1: Psychological intervention versus control, Outcome 10: Cardiovascular mortality ‐ medium term

Comparison 1: Psychological intervention versus control, Outcome 11: Cardiovascular mortality ‐ long term

Comparison 1: Psychological intervention versus control, Outcome 12: Myocardial infarction ‐ long term

Comparison 1: Psychological intervention versus control, Outcome 13: Heart failure ‐ long term

Comparison 1: Psychological intervention versus control, Outcome 14: Stroke ‐ long term

Comparison 1: Psychological intervention versus control, Outcome 15: Coronary revascularisation procedure ‐ long term

Comparison 1: Psychological intervention versus control, Outcome 16: Hospitalisations ‐ long term

Comparison 1: Psychological intervention versus control, Outcome 17: Length of stay ‐ short term

Comparison 1: Psychological intervention versus control, Outcome 18: Quality of life SF‐12/36 physical ‐ short term

Comparison 1: Psychological intervention versus control, Outcome 19: Quality of life SF‐12/36 mental ‐ short term

Comparison 1: Psychological intervention versus control, Outcome 20: Quality of life SF‐12/36 physical ‐ medium term

Comparison 1: Psychological intervention versus control, Outcome 21: Quality of life SF‐12/36 mental ‐ medium term

Comparison 1: Psychological intervention versus control, Outcome 22: Quality of life SF‐12 total ‐ medium term

Comparison 1: Psychological intervention versus control, Outcome 23: Quality of life SF‐36 physical ‐ long term

Comparison 1: Psychological intervention versus control, Outcome 24: Quality of life SF‐36 mental ‐ long term

Comparison 2: Psychological intervention versus psychological intervention/clinical management, Outcome 1: Depression symptoms ‐ short term

Comparison 2: Psychological intervention versus psychological intervention/clinical management, Outcome 2: Depression symptoms ‐ medium term

Comparison 2: Psychological intervention versus psychological intervention/clinical management, Outcome 3: Depression symptoms ‐ long term

Comparison 2: Psychological intervention versus psychological intervention/clinical management, Outcome 4: Depression remission ‐ short term

Comparison 2: Psychological intervention versus psychological intervention/clinical management, Outcome 5: Depression remission ‐ medium term

Comparison 2: Psychological intervention versus psychological intervention/clinical management, Outcome 6: Depression remission ‐ long term

Comparison 2: Psychological intervention versus psychological intervention/clinical management, Outcome 7: Cardiovascular mortality ‐ long term

Comparison 2: Psychological intervention versus psychological intervention/clinical management, Outcome 8: Quality of life SF‐36 physical ‐ short term

Comparison 2: Psychological intervention versus psychological intervention/clinical management, Outcome 9: Quality of life SF‐36 mental ‐ short term

Comparison 2: Psychological intervention versus psychological intervention/clinical management, Outcome 10: Quality of life SF‐36 physical ‐ medium term

Comparison 2: Psychological intervention versus psychological intervention/clinical management, Outcome 11: Quality of life SF‐36 mental ‐ medium term

Comparison 2: Psychological intervention versus psychological intervention/clinical management, Outcome 12: Quality of life SF‐36 physical ‐ long term

Comparison 2: Psychological intervention versus psychological intervention/clinical management, Outcome 13: Quality of life SF‐36 mental ‐ long term

Comparison 3: Pharmacological intervention versus placebo, Outcome 1: Depression symptoms ‐ short term

Comparison 3: Pharmacological intervention versus placebo, Outcome 2: Depression symptoms change score ‐ short term

Comparison 3: Pharmacological intervention versus placebo, Outcome 3: Depression remission ‐ short term

Comparison 3: Pharmacological intervention versus placebo, Outcome 4: Depression response ‐ short term

Comparison 3: Pharmacological intervention versus placebo, Outcome 5: All‐cause mortality ‐ short term

Comparison 3: Pharmacological intervention versus placebo, Outcome 6: All‐cause mortality ‐ long term

Comparison 3: Pharmacological intervention versus placebo, Outcome 7: Cardiovascular mortality ‐ long term

Comparison 3: Pharmacological intervention versus placebo, Outcome 8: Myocardial infarction ‐ short term

Comparison 3: Pharmacological intervention versus placebo, Outcome 9: Myocardial infarction ‐ long term

Comparison 3: Pharmacological intervention versus placebo, Outcome 10: Angina ‐ short term

Comparison 3: Pharmacological intervention versus placebo, Outcome 11: Heart failure ‐ short term

Comparison 3: Pharmacological intervention versus placebo, Outcome 12: Arrhythmia ‐ short term

Comparison 3: Pharmacological intervention versus placebo, Outcome 13: Stroke ‐ short term

Comparison 3: Pharmacological intervention versus placebo, Outcome 14: Coronary revascularisation procedure ‐ long term

Comparison 3: Pharmacological intervention versus placebo, Outcome 15: Healthcare costs ‐ short term

Comparison 3: Pharmacological intervention versus placebo, Outcome 16: Hospitalisations ‐ short term

Comparison 3: Pharmacological intervention versus placebo, Outcome 17: Emergency department visits ‐ short term

Comparison 3: Pharmacological intervention versus placebo, Outcome 18: Quality of life Q‐LES‐Q ‐ short term

Comparison 3: Pharmacological intervention versus placebo, Outcome 19: Quality of life WHOQOL‐BREF Physical ‐ short term

Comparison 3: Pharmacological intervention versus placebo, Outcome 20: Quality of life WHOQOL‐BREF Psychological ‐ short term

Comparison 3: Pharmacological intervention versus placebo, Outcome 21: Quality of life WHOQOL‐BREF Social relationships ‐ short term

Comparison 3: Pharmacological intervention versus placebo, Outcome 22: Quality of life WHOQOL‐BREF Environmental ‐ short term

Comparison 3: Pharmacological intervention versus placebo, Outcome 23: Quality of life WHOQOL‐BREF Physical ‐ medium term

Comparison 3: Pharmacological intervention versus placebo, Outcome 24: Quality of life WHOQOL‐BREF Psychological ‐ medium term

Comparison 3: Pharmacological intervention versus placebo, Outcome 25: Quality of life WHOQOL‐BREF Social Relationships ‐ medium term

Comparison 3: Pharmacological intervention versus placebo, Outcome 26: Quality of life WHOQOL‐BREF Environmental ‐ medium term

Comparison 3: Pharmacological intervention versus placebo, Outcome 27: Systolic BP ‐ short term

Comparison 3: Pharmacological intervention versus placebo, Outcome 28: Diastolic BP ‐ short term

Comparison 3: Pharmacological intervention versus placebo, Outcome 29: Heart rate ‐ short term

Comparison 3: Pharmacological intervention versus placebo, Outcome 30: Platelet biomarker βTG ‐ short term

Comparison 3: Pharmacological intervention versus placebo, Outcome 31: Platelet biomarker PF4 ‐ short term

Comparison 3: Pharmacological intervention versus placebo, Outcome 32: Platelet biomarker P‐selectin ‐ short term

Comparison 3: Pharmacological intervention versus placebo, Outcome 33: Platelet biomarker PECAM‐1 ‐ short term

Comparison 3: Pharmacological intervention versus placebo, Outcome 34: Platelet biomarker TxB 2 ‐ short term

Comparison 3: Pharmacological intervention versus placebo, Outcome 35: ECG PR interval ‐ short term

Comparison 3: Pharmacological intervention versus placebo, Outcome 36: ECG QRS interval ‐ short term

Comparison 3: Pharmacological intervention versus placebo, Outcome 37: ECG QT interval ‐ short term

Comparison 3: Pharmacological intervention versus placebo, Outcome 38: ECG QTc interval ‐ short term

Comparison 3: Pharmacological intervention versus placebo, Outcome 39: Non‐cardiac adverse events and side effects ‐ short term

Comparison 4: Pharmacological intervention versus pharmacological intervention, Outcome 1: Depression symptoms ‐ short term

Comparison 4: Pharmacological intervention versus pharmacological intervention, Outcome 2: Depression symptoms change score ‐ short term

Comparison 4: Pharmacological intervention versus pharmacological intervention, Outcome 3: Depression remission ‐ short term

Comparison 4: Pharmacological intervention versus pharmacological intervention, Outcome 4: Depression response ‐ short term

Comparison 4: Pharmacological intervention versus pharmacological intervention, Outcome 5: All‐cause mortality ‐ short term

Comparison 4: Pharmacological intervention versus pharmacological intervention, Outcome 6: Myocardial infarction ‐ short term

Comparison 4: Pharmacological intervention versus pharmacological intervention, Outcome 7: Angina ‐ short term

Comparison 4: Pharmacological intervention versus pharmacological intervention, Outcome 8: Heart failure ‐ short term

Comparison 4: Pharmacological intervention versus pharmacological intervention, Outcome 9: Arrhythmia ‐ short term

Comparison 4: Pharmacological intervention versus pharmacological intervention, Outcome 10: Coronary revascularisation procedure ‐ short term

Comparison 4: Pharmacological intervention versus pharmacological intervention, Outcome 11: Emergency department visits ‐ short term

Comparison 4: Pharmacological intervention versus pharmacological intervention, Outcome 12: Systolic BP ‐ short term

Comparison 4: Pharmacological intervention versus pharmacological intervention, Outcome 13: Diastolic BP ‐ short term

Comparison 4: Pharmacological intervention versus pharmacological intervention, Outcome 14: Heart rate ‐ short term

Comparison 4: Pharmacological intervention versus pharmacological intervention, Outcome 15: ECG PR interval ‐ short term

Comparison 4: Pharmacological intervention versus pharmacological intervention, Outcome 16: ECG QRS interval ‐ short term

Comparison 4: Pharmacological intervention versus pharmacological intervention, Outcome 17: ECG QTc interval ‐ short term

Comparison 4: Pharmacological intervention versus pharmacological intervention, Outcome 18: Non‐cardiac adverse events and side effects ‐ short term
| Psychological treatment compared to control for depression in patients with coronary artery disease | ||||||
| Patient or population: health problem or population | ||||||
| Outcomes | Anticipated absolute effects* (95% CI) | Relative effect | № of participants | Certainty of the evidence | Comments | |
|---|---|---|---|---|---|---|
| Risk with Control | Risk with Psychological treatment | |||||
| Depression symptoms ‐ short‐term | ‐ | SMD 0.55 SD lower | ‐ | 1226 | ⊕⊕⊝⊝ | There is low certainty evidence that psychological treatment may result in a moderate reduction in depression symptoms at the end of treatment. |
| Depression remission ‐ short term | 319 per 1000 | 486 per 1000 | OR 2.02 | 862 | ⊕⊕⊝⊝ | There is low certainty evidence that psychological treatment may result in no difference in depression remission at the end of treatment. |
| All‐cause mortality ‐ short‐term | 25 per 1000 | 8 per 1000 | OR 0.31 | 324 | ⊕⊝⊝⊝ | The evidence is very uncertain about the effect of psychological treatment on all‐cause mortality at the end of treatment. |
| Cardiovascular mortality ‐ long‐term | 85 per 1000 | 72 per 1000 | OR 0.83 | 2720 | ‐ | No data for cardiovascular mortality at end of treatment in trials comparing psychological interventions versus usual care |
| Myocardial infarction ‐ short term (end of treatment) ‐ not reported | ‐ | ‐ | ‐ | ‐ | ‐ | No data for occurrence of myocardial infarction at end of treatment in trials comparing psychological interventions versus usual care |
| *The risk in the intervention group (and its 95% confidence interval) is based on the assumed risk in the comparison group and the relative effect of the intervention (and its 95% CI). | ||||||
| GRADE Working Group grades of evidence | ||||||
| See interactive version of this table: https://gdt.gradepro.org/presentations/#/isof/isof_question_revman_web_427596582080189491. | ||||||
| a Risk of bias rated down one level ‐ trials that contributed to this outcome were rated as unclear risk of bias | ||||||
| Psychological treatment 1 compared to psychological treatment 2 for depression in patients with coronary artery disease | ||||||
| Patient or population: health problem or population | ||||||
| Outcomes | Anticipated absolute effects* (95% CI) | Relative effect | № of participants | Certainty of the evidence | Comments | |
|---|---|---|---|---|---|---|
| Risk with Psychological Treatment 2 | Risk with Psychological Treatment 1 | |||||
| Depression symptoms ‐ short term (end of treatment) | Not pooled | Not pooled | Not pooled | 219 | ‐ | No meta‐analysis performed due to clinical heterogeneity. The evidence is very uncertain as to whether different psychological interventions may result in a reduction in depression symptoms at the end of treatment for: cognitive‐behavioural therapy compared to supportive stress management (Freedland 2009); behaviour therapy compared to person‐centred therapy (Brown 1993); cognitive‐behavioural therapy and well‐being therapy compared to clinical management (TREATED‐ACS 2020). |
| Depression remission ‐ short term (end of treatment) | 571 per 1000 | 707 per 1000 | OR 1.81 | 83 | ⊕⊕⊝⊝ | There is low certainty evidence from one trial that cognitive‐behavioural therapy may result in no difference in depression remission at the end of treatment compared to supportive stress management (Freedland 2009). |
| All‐cause mortality ‐ short term (end of treatment) ‐ not reported | ‐ | ‐ | ‐ | ‐ | ‐ | No data for all‐cause mortality at end of treatment in trials comparing psychological intervention versus another psychological intervention/clinical management |
| Cardiovascular mortality ‐ short term (end of treatment) ‐ not reported | ‐ | ‐ | ‐ | ‐ | ‐ | No data for cardiovascular mortality at end of treatment in trials comparing psychological intervention versus another psychological intervention/clinical management |
| Myocardial infarction ‐ short term (end of treatment) ‐ not reported | ‐ | ‐ | ‐ | ‐ | ‐ | No data for the occurrence of myocardial infarction at end of treatment in trials comparing psychological intervention versus another psychological intervention/clinical management |
| *The risk in the intervention group (and its 95% confidence interval) is based on the assumed risk in the comparison group and the relative effect of the intervention (and its 95% CI). | ||||||
| GRADE Working Group grades of evidence | ||||||
| See interactive version of this table: https://gdt.gradepro.org/presentations/#/isof/isof_question_revman_web_427665509108780589. | ||||||
| a Imprecision rated down two levels ‐ wide confidence intervals from one trial encompass an adverse effect to beneficial effect | ||||||
| Pharmacological treatment compared to placebo for depression in patients with coronary artery disease | ||||||
| Patient or population: health problem or population | ||||||
| Outcomes | Anticipated absolute effects* (95% CI) | Relative effect | № of participants | Certainty of the evidence | Comments | |
|---|---|---|---|---|---|---|
| Risk with Placebo | Risk with Pharmacological | |||||
| Depression symptoms ‐ short term | ‐ | SMD 0.83 lower | ‐ | 750 | ⊕⊕⊝⊝ | There is low certainty evidence that pharmacological intervention may result in a large reduction in depression symptoms at the end of treatment |
| Depression remission ‐ short term | 323 per 1000 | 496 per 1000 | OR 2.06 | 646 | ⊕⊕⊕⊝ | There is moderate certainty evidence that pharmacological intervention probably results in a moderate to large increase in depression remission at the end of treatment. |
| All‐cause mortality ‐ short term | 36 per 1000 | 14 per 1000 | OR 0.38 | 437 | ⊕⊝⊝⊝ | The evidence is very uncertain about the effect of pharmacological intervention on all‐cause mortality at the end of treatment. In addition to the pooled results, data could not be extracted from 2 studies where no deaths occurred and from 1 trial which remained unclear. |
| Cardiovascular mortality ‐ short term (end of treatment) ‐ not reported | ‐ | ‐ | ‐ | ‐ | ‐ | No data for cardiovascular mortality at end of treatment in trials comparing pharmacological intervention versus placebo |
| Myocardial infarction ‐ short term | 22 per 1000 | 17 per 1000 | OR 0.74 | 728 | ⊕⊝⊝⊝ | The evidence is very uncertain about the effect of pharmacological intervention on myocardial infarction at the end of treatment. |
| *The risk in the intervention group (and its 95% confidence interval) is based on the assumed risk in the comparison group and the relative effect of the intervention (and its 95% CI). | ||||||
| GRADE Working Group grades of evidence | ||||||
| See interactive version of this table: https://gdt.gradepro.org/presentations/#/isof/isof_question_revman_web_427666962988765745. | ||||||
| a Risk of bias rated down one level ‐ trials that contributed to this outcome were rated as unclear or high risk of bias | ||||||
| Pharmacological treatment 1 compared to pharmacological treatment 2 for depression in patients with coronary artery disease | ||||||
| Patient or population: health problem or population | ||||||
| Outcomes | Anticipated absolute effects* (95% CI) | Relative effect | № of participants | Certainty of the evidence | Comments | |
|---|---|---|---|---|---|---|
| Risk with Pharmacological intervention 2 | Risk with Pharmacological intervention 1 | |||||
| Depression symptoms ‐ short term (end of treatment) | Not pooled | Not pooled | Not pooled | 442 | ‐ | No meta‐analysis performed due to clinical heterogeneity. The evidence is very uncertain as to whether different pharmacological interventions may result in a reduction in depression symptoms at the end of treatment for: simvastatin compared to atorvastatin (Abbasi 2015); sertraline plus omega‐3 compared to sertraline plus placebo (Carney 2009); paroxetine compared to fluoxetine (Tian 2016); escitalopram compared to Bu Xin Qi (Wang 2020). |
| Depression remission ‐ short term (end of treatment) | Not pooled | Not pooled | Not pooled | 243 | ‐ | No meta‐analysis performed due to clinical heterogeneity. The evidence is very uncertain about the effect of pharmacological treatment compared to another pharmacological treatment on depression remission at the end of treatment . |
| All‐cause mortality ‐ short term (end of treatment) | 26 per 1000 | 68 per 1000 | OR 2.72 | 149 | ⊕⊝⊝⊝ | The evidence from 1 trial is very uncertain about the effect of sertraline vs Shugan Jieyu on all‐cause mortality at the end of treatment (Liu 2016). |
| Cardiovascular mortality ‐ short term (end of treatment) ‐ not reported | ‐ | ‐ | ‐ | ‐ | ‐ | No data for cardiovascular mortality at end of treatment in trials comparing a pharmacological intervention versus another pharmacological intervention |
| Myocardial infarction ‐ short term (end of treatment) | Not pooled | Not pooled | Not pooled | 396 | ‐ | No meta‐analysis performed due to clinical heterogeneity. The evidence is very uncertain about the effect of pharmacological treatment compared to another pharmacological treatment on the occurrence of myocardial infarction at end of treatment for: sertraline plus omega‐3 compared to sertraline plus placebo (Carney 2009); paroxetine compared to fluoxetine (Tian 2016); escitalopram compared to Bu Xin Qi (Wang 2020). |
| *The risk in the intervention group (and its 95% confidence interval) is based on the assumed risk in the comparison group and the relative effect of the intervention (and its 95% CI). | ||||||
| GRADE Working Group grades of evidence | ||||||
| See interactive version of this table: https://gdt.gradepro.org/presentations/#/isof/isof_question_revman_web_428037497253281678. | ||||||
| a Risk of bias rated down one level ‐ the trial(s) that contributed to this outcome were rated as unclear or high risk of bias | ||||||
| Study ID | Intervention | [n]screened | [n] randomised | [n] ITT | [n] finishing study | [%] of randomised participants | Comments |
|---|---|---|---|---|---|---|---|
| Intervention 1 (I1): simvastatin Intervention 2 (I2): atorvastatin | Total: 206 | I1: 29 I2: 29 Total: 58 | I1: NR I2: NR Total: NR (per‐protocol) | I1: 23 I2: 23 Total: 46 | I1: 79.3% I2: 79.3% Total: 79.3% | ||
| Intervention (I): sertraline Control (C): placebo | Total: ? | I: ? C: ? Total: 2 | I: ? C: ? Total: ? | I: ? C: ? Total: ? | I: ? C: ? Total: ? | Comment: trial terminated early, no results posted | |
| Intervention (I): resource‐orientated psychotherapy Control (C): usual care | Total: 1709 | I: 27 C: 32 Total: 59 | I: 27 C: 32 Total: 59 (per‐protocol) | I: 27 C: 28 Total: 55 | I: 100% C: 87.5% Total: 93.2% | ||
| Intervention 1 (I1): behaviour therapy Intervention 2 (I2): person‐centred therapy | Total: 107 | I1: NR I2: NR Total: 54 | I1: NR I2: NR Total: NR (per‐protocol) | I1: 20 I2: 20 Total: 40 | I1: ? I2: ? Total: 74.1% | Comment: dropout reported in text, no flow chart | |
| Intervention 1 (I1): interpersonal psychotherapy, citalopram, clinical management Intervention 2 (I2): citalopram, clinical management Control 1 (C1): interpersonal psychotherapy, placebo, clinical management Control 2 (C2): placebo, clinical management | Total: 1897 | I1: 67 I2: 75 C1: 75 C2: 67 Total: 284 | I1: 67 I2: 75 C1: 75 C2: 67 Total: 284 | I1: 59 I2: 72 C1: 59 C2: 47 Total: 237 | I1: 88.1% I2: 96.0% C1: 78.7% C2: 70.1% Total: 83.5% | Comment: 2 x 2 factorial trial; only I2 and C2 data are eligible for this review | |
| Intervention 1 (I1): sertraline plus omega‐3 Intervention 2 (I2): sertraline plus placebo | Total: 941 | I1: 62 I2: 60 Total: 122 | I1: 62 I2: 60 Total: 122 | I1: 59 I2: 56 Total: 115 | I1: 95.2% I2: 93.3% Total: 94.3% | ||
| Intervention (I): cognitive‐ behavioural therapy C: usual care | Total: 513 | I: 50 C: 50 Total: 100 | I: NR C: NR Total: NR (per‐protocol) | I: 48 C: 48: Total: 96 | I: 96% C: 96% Total: 96% | ||
| Intervention 1 (I1): sertraline plus red yeast rice Intervention 2 (I2): sertraline plus placebo | Total: 101 | I1: 28 I2: 28 Total: 56 | I1: NR I2: NR Total: NR | I1: 25 I2: 25 Total: 50 | I1: 89.3% I2: 89.3% Total: 89.3% | ||
| Intervention (I): cognitive‐ behavioural therapy Control (C): usual care | Total: 117 | I: NR C: NR Total: NR | I: NR C: NR Total: NR (per‐protocol) | I: 7 C: 8 Total: 15 | I: ? C: ? Total: ? | Comment: reasons for dropout not stated, no flow chart Comment: nested trial within observational study (non‐depressed cohort) | |
| Intervention (I): escitalopram Control (C): placebo | Total: 4809 | I:149 C: 151 Total: 300 | I: 108 C: 109 Total: 217 (per‐protocol) | I: 78 C: 79 Total: 157 | I: 52.3% C: 52.3% Total: 52.3% | Comment: nested trial within observational study (depressed cohort receiving usual care) | |
| Intervention (I): cognitive‐ behavioural therapy Control (C): usual care | Total: 33780 | I: 1238 C: 1243 Total: 2481 | I: 1238 C: 1243 Total: 2481 | I: 983 C: 985 Total: 1968 | I: 79.4% C: 79.2% Total: 79.3% | ||
| Intervention (I): health education and psychological intervention Control (C): usual care | Total: ? | I: 27 C: 30 Total: 57 | I: ? C: ? Total: ? | I: ? C: ? Total: ? | I: ? C: ? Total: ? | Comment: translated paper | |
| Intervention 1 (I1): cognitive‐ behavioural therapy Intervention 2 (I2): supportive stress management Control (C): usual care | Total: 2955 | I1: 41 I2: 42 C1: 40 Total: 123 | I1: 41 I2: 42 C1: 40 Total: 123 | I1: 40 I2: 33 C1: ? Total: ? | I1: 98% I2: 79% C1: ? Total: ? | ||
| Intervention (I): alprazolam Control (C): placebo | Total: 459 | I: 54 C: 53 Total: 107 | I: NR C: NR Total: NR (per‐protocol) | I: 32 C: 28 Total: 60 | I: 59.3% C: 52.8% Total: 56.1% | Comment: no flow chart | |
| Intervention (I): escitalopram Control (C): placebo | Total: NR | I: 9 C: 10 Total: 19 | I: NR C: NR Total: NR (per‐protocol) | I: 2 C: 2 Total: 4 | I: 22.2% C: 20.0% Total: 21.1% | Comment: trial terminated early, redacted results posted | |
| Intervention (I): St John's wort extract Control (C): placebo | Total: ? | I: ? C: ? Total: 87 | I: ? C: ? Total: ? | I: 43 C: 39 Total: 82 | I: ? C: ? Total: 94.3% | Comment: translated paper | |
| Intervention (I): fluoxetine Control (C): placebo | Total: ? | I: ? C: ? Total: ? | I: ? C: ? Total: ? | I: 31 C: 37 Total: ? | I: ? C: ? Total: ? | Comment: translated paper | |
| Intervention 1 (I1): sertraline and Shugan Jieyu Intervention 2 (I2): sertraline and placebo | Total: 3907 | I1: 76 I2: 73 Total: 149 | I1: 76 I2: 73 Total: 149 | I1: 48 I2: 46 Total: 94 | I1: 63.2% I2: 63.0% Total: 63.1% | Comment: no flow chart, reasons for dropout reported in text | |
| Intervention (I): mirtazapine Control (C): placebo | Total: 2177 | I: 47 C: 44 Total: 91 | I: 47 C: 44 Total: 91 | I: 22 C: 18 Total: 40 | I: 46.8% C: 40.9% Total: 44.0% | Comment: nested trial within observational study (depressed cohort receiving usual care) | |
| Intervention (I): Xinkeshu Control (C): placebo | Total: 312 | I: 30 C: 30 Total: 60 | I: NR C: NR Total: NR | I: 28 C: 27 Total: 55 | I: 93.3% C: 90% Total: 91.7% | ||
| Intervention (I): sertraline Control (C): placebo | Total: 238 | I: 18 C: 20 Total: 38 | I: NR C: NR Total: NR (per‐protocol) | I: 12 C: 15 Total: 27 | I: 66.7% C: 75.0% Total: 71.1% | Comment: no flow chart, reasons for dropout reported in text | |
| Intervention (I1): telephone counselling Control (C): usual care | Total: 700 | I: 53 C: 47 Total: 100 | I: NR C: NR Total: NR (per‐protocol) | I: 45 C: 34 Total: 79 | I: 84.9% C: 72.3% Total: 79% | ||
| Intervention (I): cognitive‐ behavioural therapy | Total: 3071 | I: 61 C: 60 Total: 121 | I: NR C: NR Total: NR | I: 53 C: 53 Total: 106 | I: 86.9% C: 88.3% Total: 87.6% | ||
| Intervention (I): sertraline Control (C): placebo | Total: 630 | I: 50 C: 50 Total: 100 | I: NR C: NR Total: NR (per‐protocol) | I: 47 C: 48 Total: 95 | I: 94% C: 96% Total: 95% | ||
| Intervention 1 (I1): paroxetine Intervention 2 (I2): nortriptyline | Total: NR | I1: 41 I2: 40 Total: 81 | I1: 41 I2: 40 Total: 81 | I1: 37 I2: 30 Total: 67 | I1: 90.2% I2: 75.0% Total: 82.7% | Comment: no flow chart, reasons for dropout reported in text | |
| Intervention (I): sertraline Control (C): placebo | Total: 11546 | I: 186 C: 183 Total: 369 | I: 186 C: 183 Total: 169 | I: 133 C: 137 Total: 270 | I: 71.5% C: 74.9% Total: 73.1% | ||
| Intervention (I): stepwise psychotherapy intervention Control (C): usual care | Total: 21780 | I: 285 C: 285 Total: 570 | I: 284 C: 284 Total: 568 | I: 110 C: 194 Total: 304 | I: 38.6% C: 68.1% Total: 53.3% | ||
| Intervention 1 (I1): fluoxetine Intervention 2 (I2): Crocus sativus L. (saffron) | Total: 75 | I1: 22 I2: 22 Total: 44 | I1: NR I2: NR Total: NR (per‐protocol) | I1: 20 I2: 20 Total: 40 | I1: 90.9% I2: 90.9% Total: 90.9% | ||
| Intervention (I): fluoxetine Control (C): placebo | Total: 556 | I: 27 C: 27 Total: 54 | I: 27 C: 27 Total: 54 | I: 22 C: 18 Total: 40 | I: 81.5% C: 66.7% Total: 74.1% | ||
| Intervention 1 (I1): paroxetine Intervention 2 (I2): fluoxetine | Total: ? | I1: 23 I2: 23 Total: 46 | I1: 23 I2: 23 Total: 46 (per‐protocol) | I1: 23 I2: 23 Total: 46 | I1: 100% I2: 100% Total: 100% | Comment: no flow chart was reported. It is unclear whether 16 participants who did not finish the study were from I1 or I2 groups, or non‐treatment or non‐depressed groups. | |
| Intervention 1 (I1): cognitive‐behavioural therapy and well‐being therapy Intervention 2 (I2): clinical management | Total: 740 | I1: 50 I2: 50 Total: 100 | I1: 50 I2: 50 Total: 100 | I1: 42 I2: 40 Total: 82 | I1: 84% I2: 80% Total: 82% | ||
| Intervention (I): internet cognitive‐behavioural therapy Control (C): usual care | Total: 3928 | I: 117 C: 122 Total: 239 | I: 117 C: 122 Total: 239 | I: 96 C: 115 Total: 211 | I: 82.1% C: 94.3% Total: 88.3% | ||
| Intervention 1 (I1): sertraline Intervention 2 (I2): exercise Control (C): placebo | Total: 1680 | I1: 40 I2: 37 C: 24 Total: 101 | I1: NR I2: NR C: NR Total: NR | I1: 36 I2: 36 C: 23 Total: 95 | I1: 90% I2: 97.3% C: 95.8% Total: 94.1% | Comment: only I1 sertraline and C placebo are eligible for this review | |
| Intervention 1 (I1): escitalopram Intervention 2 (I2): Bu Xin Qi decoction | Total: 300 | I1: 140 I2: 140 Total: 280 | I1: NR I2: NR Total: NR (per‐protocol) | I1: 113 I2: 115 Total: 228 | I1: 80.7% I2: 82.1% Total: 81.4% | Comment: reasons for dropout not stated in flow chart | |
| Intervention (I): internet cognitive‐behavioural therapy Control (C): wait‐list control | Total: 72 | I: 18 C: 16 Total: 34 | I: 18 C: 16 Total: 34 | I: 13 C: 13 Total: 26 | I: 72.2% C: 81.3% Total: 76.5% | ||
| Intervention (I): intensive telephone‐based care Control (C): usual care | Total: 354 | I: 112 C: 112 Total: 224 | I: NR C: NR Total: NR | I: 107 C: 105 Total: 212 | I: 95.5% C: 93.8% Total: 94.6% | ||
| Intervention (I): Peplau's therapeutic communication model Control (C): usual care | Total: ? | I: ? C: ? Total: ? | I: ? C: ? Total: ? (per‐protocol) | I: 37 C: 37 Total: 74 | I: ? C: ? Total: ? | Comment: total sample estimated from degrees of freedom in Table 3 | |
| ITT = intention‐to‐treat; NR = not reported; ? = unclear | |||||||
| Comparison | Sensitivity analysis | Study references [n] | SMD | I2 |
|---|---|---|---|---|
| Psychological vs control | None (Analysis 1.1) | Barth 2005; Dao 2011; Fang 2003; Freedland 2009; McLaughlin 2005; MoodCare 2011; SPIRR‐CAD 2011; U‐CARE 2018; WIDeCAD 2017; Zarea 2014 (n = 1226) | −0.55 (95% CI −0.92 to −0.19) | 88 |
| Psychological vs control | Constrained to trials without depression disorders as part of the inclusion criteria | Barth 2005; Dao 2011; Fang 2003; McLaughlin 2005; MoodCare 2011; SPIRR‐CAD 2011; U‐CARE 2018; WIDeCAD 2017; Zarea 2014 (n = 1145) | −0.53 (95% CI −0.92 to −0.13) | 89 |
| Psychological vs control | Constrained to depression (e.g. excluding trials with mixed depression and/or anxiety as part of the inclusion criteria) | Barth 2005; Freedland 2009; MoodCare 2011; SPIRR‐CAD 2011; WIDeCAD 2017 (n = 681) | −0.27 (95% CI −0.58 to 0.03) | 65 |
| Psychological vs control | Constrained to cognitive‐behavioural therapy trials | Dao 2011; Freedland 2009; MoodCare 2011; U‐CARE 2018; WIDeCAD 2017 (n = 571) | −0.48 (95% CI −0.77 to −0.19) | 61 |
| CI = confidence interval; SMD = standardised mean difference | ||||
| Comparison | Sensitivity analysis | Study references [n] | SMD | I2 |
|---|---|---|---|---|
| Pharmacological vs placebo | None (Analysis 3.1) | CREATE 2007; EsDEPACS 2014; Li 2005; Liu 1999; Ma 2019; McFarlane 2001; Pizzi 2009; UPBEAT 2012 (n = 750) | SMD −0.83 (95% CI −1.33 to −0.32) | 90 |
| Pharmacological vs placebo | Constrained to trials with major depressive disorders as part of the inclusion criteria | CREATE 2007; EsDEPACS 2014; Liu 1999 (n = 427) | SMD −0.48 (95% CI −1.38 to 0.42) | 95 |
| Pharmacological vs placebo | Constrained to depression (e.g. excluding trials with mixed depression and/or anxiety as part of the inclusion criteria) | CREATE 2007; EsDEPACS 2014; Li 2005; Liu 1999; McFarlane 2001; Pizzi 2009; UPBEAT 2012 (n = 695) | SMD −0.76 (95% CI −1.29 to −0.23) | 90 |
| Pharmacological vs placebo | Constrained to serotonergic antidepressant trials | CREATE 2007; EsDEPACS 2014; Liu 1999; McFarlane 2001; Pizzi 2009; UPBEAT 2012 (n = 613) | SMD −0.69 (95% CI −1.27 to −0.11) | 91 |
| CI = confidence interval; SMD = standardised mean difference | ||||
| Outcome or subgroup title | No. of studies | No. of participants | Statistical method | Effect size |
| 1.1 Depression symptoms ‐ short term Show forest plot | 10 | 1226 | Std. Mean Difference (IV, Random, 95% CI) | ‐0.55 [‐0.92, ‐0.19] |
| 1.2 Depression symptoms ‐ medium term Show forest plot | 7 | 2620 | Std. Mean Difference (IV, Random, 95% CI) | ‐0.20 [‐0.42, 0.01] |
| 1.3 Depression symptoms ‐ long term Show forest plot | 2 | 282 | Std. Mean Difference (IV, Random, 95% CI) | ‐0.46 [‐0.96, 0.04] |
| 1.4 Depression remission ‐ short term Show forest plot | 3 | 862 | Odds Ratio (IV, Random, 95% CI) | 2.02 [0.78, 5.19] |
| 1.5 Depression remission ‐ medium term Show forest plot | 1 | Odds Ratio (IV, Random, 95% CI) | Totals not selected | |
| 1.6 Depression remission ‐ long term Show forest plot | 1 | Odds Ratio (IV, Random, 95% CI) | Totals not selected | |
| 1.7 All‐cause mortality ‐ short term Show forest plot | 2 | 324 | Odds Ratio (IV, Random, 95% CI) | 0.31 [0.05, 2.02] |
| 1.8 All‐cause mortality ‐ medium term Show forest plot | 1 | Odds Ratio (IV, Random, 95% CI) | Totals not selected | |
| 1.9 All‐cause mortality ‐ long term Show forest plot | 2 | 2670 | Odds Ratio (IV, Random, 95% CI) | 0.83 [0.48, 1.42] |
| 1.10 Cardiovascular mortality ‐ medium term Show forest plot | 1 | Odds Ratio (IV, Random, 95% CI) | Totals not selected | |
| 1.11 Cardiovascular mortality ‐ long term Show forest plot | 2 | 2720 | Odds Ratio (IV, Random, 95% CI) | 0.83 [0.62, 1.10] |
| 1.12 Myocardial infarction ‐ long term Show forest plot | 2 | 2720 | Odds Ratio (IV, Random, 95% CI) | 1.09 [0.73, 1.65] |
| 1.13 Heart failure ‐ long term Show forest plot | 1 | Odds Ratio (IV, Random, 95% CI) | Totals not selected | |
| 1.14 Stroke ‐ long term Show forest plot | 1 | Odds Ratio (IV, Random, 95% CI) | Totals not selected | |
| 1.15 Coronary revascularisation procedure ‐ long term Show forest plot | 2 | 2780 | Odds Ratio (IV, Random, 95% CI) | 0.91 [0.75, 1.11] |
| 1.16 Hospitalisations ‐ long term Show forest plot | 1 | Odds Ratio (IV, Random, 95% CI) | Totals not selected | |
| 1.17 Length of stay ‐ short term Show forest plot | 1 | Mean Difference (IV, Random, 95% CI) | Totals not selected | |
| 1.18 Quality of life SF‐12/36 physical ‐ short term Show forest plot | 2 | 202 | Std. Mean Difference (IV, Random, 95% CI) | 0.22 [‐0.06, 0.50] |
| 1.19 Quality of life SF‐12/36 mental ‐ short term Show forest plot | 2 | 202 | Std. Mean Difference (IV, Random, 95% CI) | 0.51 [0.07, 0.94] |
| 1.20 Quality of life SF‐12/36 physical ‐ medium term Show forest plot | 2 | 187 | Std. Mean Difference (IV, Random, 95% CI) | 0.18 [‐1.29, 1.65] |
| 1.21 Quality of life SF‐12/36 mental ‐ medium term Show forest plot | 2 | 187 | Std. Mean Difference (IV, Random, 95% CI) | 1.21 [‐1.09, 3.52] |
| 1.22 Quality of life SF‐12 total ‐ medium term Show forest plot | 1 | Mean Difference (IV, Random, 95% CI) | Totals not selected | |
| 1.23 Quality of life SF‐36 physical ‐ long term Show forest plot | 1 | Mean Difference (IV, Random, 95% CI) | Totals not selected | |
| 1.24 Quality of life SF‐36 mental ‐ long term Show forest plot | 1 | Mean Difference (IV, Random, 95% CI) | Totals not selected | |
| Outcome or subgroup title | No. of studies | No. of participants | Statistical method | Effect size |
| 2.1 Depression symptoms ‐ short term Show forest plot | 3 | Mean Difference (IV, Random, 95% CI) | Totals not selected | |
| 2.2 Depression symptoms ‐ medium term Show forest plot | 3 | Std. Mean Difference (IV, Random, 95% CI) | Totals not selected | |
| 2.3 Depression symptoms ‐ long term Show forest plot | 3 | Std. Mean Difference (IV, Random, 95% CI) | Totals not selected | |
| 2.4 Depression remission ‐ short term Show forest plot | 1 | Odds Ratio (IV, Random, 95% CI) | Totals not selected | |
| 2.5 Depression remission ‐ medium term Show forest plot | 1 | Odds Ratio (IV, Random, 95% CI) | Totals not selected | |
| 2.6 Depression remission ‐ long term Show forest plot | 1 | Odds Ratio (IV, Random, 95% CI) | Totals not selected | |
| 2.7 Cardiovascular mortality ‐ long term Show forest plot | 1 | Odds Ratio (IV, Random, 95% CI) | Totals not selected | |
| 2.8 Quality of life SF‐36 physical ‐ short term Show forest plot | 1 | Mean Difference (IV, Random, 95% CI) | Totals not selected | |
| 2.9 Quality of life SF‐36 mental ‐ short term Show forest plot | 1 | Mean Difference (IV, Random, 95% CI) | Totals not selected | |
| 2.10 Quality of life SF‐36 physical ‐ medium term Show forest plot | 1 | Mean Difference (IV, Random, 95% CI) | Totals not selected | |
| 2.11 Quality of life SF‐36 mental ‐ medium term Show forest plot | 1 | Mean Difference (IV, Random, 95% CI) | Totals not selected | |
| 2.12 Quality of life SF‐36 physical ‐ long term Show forest plot | 1 | Mean Difference (IV, Random, 95% CI) | Totals not selected | |
| 2.13 Quality of life SF‐36 mental ‐ long term Show forest plot | 1 | Mean Difference (IV, Random, 95% CI) | Totals not selected | |
| Outcome or subgroup title | No. of studies | No. of participants | Statistical method | Effect size |
| 3.1 Depression symptoms ‐ short term Show forest plot | 8 | 750 | Std. Mean Difference (IV, Random, 95% CI) | ‐0.83 [‐1.33, ‐0.32] |
| 3.2 Depression symptoms change score ‐ short term Show forest plot | 3 | 482 | Std. Mean Difference (IV, Random, 95% CI) | ‐0.18 [‐0.36, ‐0.00] |
| 3.3 Depression remission ‐ short term Show forest plot | 4 | 646 | Odds Ratio (IV, Random, 95% CI) | 2.06 [1.47, 2.89] |
| 3.4 Depression response ‐ short term Show forest plot | 5 | 891 | Odds Ratio (IV, Random, 95% CI) | 2.73 [1.65, 4.54] |
| 3.5 All‐cause mortality ‐ short term Show forest plot | 2 | 437 | Odds Ratio (IV, Random, 95% CI) | 0.38 [0.10, 1.47] |
| 3.6 All‐cause mortality ‐ long term Show forest plot | 2 | 661 | Odds Ratio (IV, Random, 95% CI) | 0.89 [0.64, 1.25] |
| 3.7 Cardiovascular mortality ‐ long term Show forest plot | 1 | Odds Ratio (IV, Random, 95% CI) | Totals not selected | |
| 3.8 Myocardial infarction ‐ short term Show forest plot | 3 | 728 | Odds Ratio (IV, Random, 95% CI) | 0.74 [0.26, 2.09] |
| 3.9 Myocardial infarction ‐ long term Show forest plot | 1 | Odds Ratio (IV, Random, 95% CI) | Subtotals only | |
| 3.10 Angina ‐ short term Show forest plot | 4 | 819 | Odds Ratio (IV, Random, 95% CI) | 0.75 [0.44, 1.28] |
| 3.11 Heart failure ‐ short term Show forest plot | 3 | 602 | Odds Ratio (IV, Random, 95% CI) | 0.93 [0.33, 2.62] |
| 3.12 Arrhythmia ‐ short term Show forest plot | 2 | 87 | Odds Ratio (IV, Random, 95% CI) | 0.46 [0.01, 17.06] |
| 3.13 Stroke ‐ short term Show forest plot | 2 | 586 | Odds Ratio (IV, Random, 95% CI) | 0.99 [0.20, 4.96] |
| 3.14 Coronary revascularisation procedure ‐ long term Show forest plot | 1 | 300 | Odds Ratio (IV, Random, 95% CI) | 0.59 [0.32, 1.10] |
| 3.15 Healthcare costs ‐ short term Show forest plot | 1 | Mean Difference (IV, Random, 95% CI) | Totals not selected | |
| 3.16 Hospitalisations ‐ short term Show forest plot | 3 | 514 | Odds Ratio (M‐H, Random, 95% CI) | 0.58 [0.39, 0.85] |
| 3.17 Emergency department visits ‐ short term Show forest plot | 1 | Odds Ratio (M‐H, Random, 95% CI) | Subtotals only | |
| 3.18 Quality of life Q‐LES‐Q ‐ short term Show forest plot | 1 | Mean Difference (IV, Random, 95% CI) | Totals not selected | |
| 3.19 Quality of life WHOQOL‐BREF Physical ‐ short term Show forest plot | 1 | Mean Difference (IV, Random, 95% CI) | Totals not selected | |
| 3.20 Quality of life WHOQOL‐BREF Psychological ‐ short term Show forest plot | 1 | Mean Difference (IV, Random, 95% CI) | Totals not selected | |
| 3.21 Quality of life WHOQOL‐BREF Social relationships ‐ short term Show forest plot | 1 | Mean Difference (IV, Random, 95% CI) | Totals not selected | |
| 3.22 Quality of life WHOQOL‐BREF Environmental ‐ short term Show forest plot | 1 | Mean Difference (IV, Random, 95% CI) | Totals not selected | |
| 3.23 Quality of life WHOQOL‐BREF Physical ‐ medium term Show forest plot | 1 | Mean Difference (IV, Random, 95% CI) | Totals not selected | |
| 3.24 Quality of life WHOQOL‐BREF Psychological ‐ medium term Show forest plot | 1 | Mean Difference (IV, Random, 95% CI) | Totals not selected | |
| 3.25 Quality of life WHOQOL‐BREF Social Relationships ‐ medium term Show forest plot | 1 | Mean Difference (IV, Random, 95% CI) | Totals not selected | |
| 3.26 Quality of life WHOQOL‐BREF Environmental ‐ medium term Show forest plot | 1 | Mean Difference (IV, Random, 95% CI) | Totals not selected | |
| 3.27 Systolic BP ‐ short term Show forest plot | 3 | 675 | Mean Difference (IV, Random, 95% CI) | ‐0.24 [‐3.52, 3.05] |
| 3.28 Diastolic BP ‐ short term Show forest plot | 3 | 675 | Mean Difference (IV, Random, 95% CI) | 0.60 [‐1.55, 2.74] |
| 3.29 Heart rate ‐ short term Show forest plot | 4 | 662 | Mean Difference (IV, Random, 95% CI) | ‐0.80 [‐2.40, 0.79] |
| 3.30 Platelet biomarker βTG ‐ short term Show forest plot | 3 | 141 | Std. Mean Difference (IV, Random, 95% CI) | ‐0.54 [‐0.99, ‐0.09] |
| 3.31 Platelet biomarker PF4 ‐ short term Show forest plot | 3 | 144 | Std. Mean Difference (IV, Random, 95% CI) | ‐0.14 [‐0.48, 0.19] |
| 3.32 Platelet biomarker P‐selectin ‐ short term Show forest plot | 2 | 121 | Std. Mean Difference (IV, Random, 95% CI) | ‐0.31 [‐1.12, 0.50] |
| 3.33 Platelet biomarker PECAM‐1 ‐ short term Show forest plot | 1 | Mean Difference (IV, Random, 95% CI) | Subtotals only | |
| 3.34 Platelet biomarker TxB 2 ‐ short term Show forest plot | 1 | Mean Difference (IV, Random, 95% CI) | Subtotals only | |
| 3.35 ECG PR interval ‐ short term Show forest plot | 3 | 635 | Mean Difference (IV, Random, 95% CI) | ‐4.35 [‐8.40, ‐0.31] |
| 3.36 ECG QRS interval ‐ short term Show forest plot | 3 | 635 | Mean Difference (IV, Random, 95% CI) | 2.37 [‐0.41, 5.15] |
| 3.37 ECG QT interval ‐ short term Show forest plot | 1 | Mean Difference (IV, Random, 95% CI) | Subtotals only | |
| 3.38 ECG QTc interval ‐ short term Show forest plot | 3 | 635 | Mean Difference (IV, Random, 95% CI) | 2.76 [‐1.96, 7.47] |
| 3.39 Non‐cardiac adverse events and side effects ‐ short term Show forest plot | 8 | 1193 | Odds Ratio (M‐H, Random, 95% CI) | 1.44 [1.07, 1.92] |
| Outcome or subgroup title | No. of studies | No. of participants | Statistical method | Effect size |
| 4.1 Depression symptoms ‐ short term Show forest plot | 4 | Std. Mean Difference (IV, Random, 95% CI) | Totals not selected | |
| 4.2 Depression symptoms change score ‐ short term Show forest plot | 4 | Std. Mean Difference (IV, Random, 95% CI) | Totals not selected | |
| 4.3 Depression remission ‐ short term Show forest plot | 3 | Odds Ratio (IV, Random, 95% CI) | Totals not selected | |
| 4.4 Depression response ‐ short term Show forest plot | 4 | Odds Ratio (IV, Random, 95% CI) | Totals not selected | |
| 4.5 All‐cause mortality ‐ short term Show forest plot | 1 | Odds Ratio (M‐H, Random, 95% CI) | Totals not selected | |
| 4.6 Myocardial infarction ‐ short term Show forest plot | 3 | Odds Ratio (M‐H, Random, 95% CI) | Totals not selected | |
| 4.7 Angina ‐ short term Show forest plot | 3 | Odds Ratio (M‐H, Random, 95% CI) | Totals not selected | |
| 4.8 Heart failure ‐ short term Show forest plot | 2 | Odds Ratio (M‐H, Random, 95% CI) | Totals not selected | |
| 4.9 Arrhythmia ‐ short term Show forest plot | 3 | Odds Ratio (M‐H, Random, 95% CI) | Totals not selected | |
| 4.10 Coronary revascularisation procedure ‐ short term Show forest plot | 1 | Odds Ratio (M‐H, Random, 95% CI) | Totals not selected | |
| 4.11 Emergency department visits ‐ short term Show forest plot | 1 | Odds Ratio (M‐H, Random, 95% CI) | Totals not selected | |
| 4.12 Systolic BP ‐ short term Show forest plot | 3 | Mean Difference (IV, Random, 95% CI) | Totals not selected | |
| 4.13 Diastolic BP ‐ short term Show forest plot | 3 | Mean Difference (IV, Random, 95% CI) | Totals not selected | |
| 4.14 Heart rate ‐ short term Show forest plot | 2 | Mean Difference (IV, Random, 95% CI) | Totals not selected | |
| 4.15 ECG PR interval ‐ short term Show forest plot | 2 | Mean Difference (IV, Random, 95% CI) | Totals not selected | |
| 4.16 ECG QRS interval ‐ short term Show forest plot | 2 | Mean Difference (IV, Random, 95% CI) | Totals not selected | |
| 4.17 ECG QTc interval ‐ short term Show forest plot | 2 | Mean Difference (IV, Random, 95% CI) | Totals not selected | |
| 4.18 Non‐cardiac adverse events and side effects ‐ short term Show forest plot | 7 | Odds Ratio (M‐H, Random, 95% CI) | Totals not selected | |