Diclorhidrato de sapropterina para la fenilcetonuria
Appendices
Appendix 1. Glossary
| Technical term | Explanation |
| confidence interval | A measure of the uncertainty around the main finding of a statistical analysis. Estimates of unknown quantities, such as the odds ratio comparing an experimental intervention with a control, are usually presented as a point estimate and a 95% confidence interval. This means that if someone were to keep repeating a study in other samples from the same population, 95% of the confidence intervals from those studies would contain the true value of the unknown quantity. Alternatives to 95%, such as 90% and 99% confidence intervals, are sometimes used. Wider intervals indicate lower precision; narrow intervals, greater precision. |
| correlation coefficient | A correlation coefficient can range from ‐1 for perfect negative correlation, to +1 for perfect positive correlation (with perfect meaning that all the points lie on a straight line). A correlation coefficient of 0 means that there is no linear relationship between the variables. |
| cross‐over trial | A type of clinical trial comparing two or more interventions, in which the participants , upon completion of the course of one treatment, are switched to another. |
| encephalopathy | A disease of the brain; especially one involving alterations of brain structure |
| heterogeneity | Used in a general sense to describe the variation in, or diversity of participants, interventions and measurement of outcomes across a set of studies, or the variation in internal validity of those studies. |
| intention‐to‐treat analysis | A strategy for analysing data from a randomised controlled trial. All participants are included in the arm to which they were allocated, whether or not they received (or completed) the intervention given to that arm. Intention‐to‐treat analysis prevents bias caused by the loss of participants, which may disrupt the baseline equivalence established by randomisation and which may reflect non‐adherence to the protocol. The term is often misused in trial publications when some participants were excluded. |
| meta‐analysis | The use of statistical techniques in a systematic review to integrate the results of included studies. Sometimes misused as a synonym for systematic reviews, where the review includes a meta‐analysis. |
| microcephaly | An abnormally small head of a newborn, a congenitally small brain. |
| neuro‐psychometric testing | Detailed testing of memory and other aspects of intellectual functioning such as planning, speed of thinking, abstract thinking, calculation, language (including speech and reading), visio‐spatial function and attention and concentration. It is often used to assess if there is evidence of intellectual or memory decline. When performed serially (eg at annual intervals) it can be used to detect evidence of change in intellectual functioning with time. |
| neurotoxicity | Toxicity to nervous tissue (both brain and peripheral nerves). |
| random‐effects model | A statistical model in which both within‐study sampling error (variance) and between‐studies variation are included in the assessment of the uncertainty (confidence interval) of the results of a meta‐analysis. When there is heterogeneity among the results of the included studies beyond chance, random‐effects models will give wider confidence intervals than fixed‐effect models. |
| standard deviation | A measure of the spread or dispersion of a set of observations, calculated as the average difference from the mean value in the sample. |
Appendix 2. Search strategy: ClinicalTrials.gov (Date searched: 01 September 2009 for all years)
| Search term |
| (kuvan OR phenoptin OR Sapropterin) AND (phenylketonuria OR PKU) |
Appendix 3. Search strategy: Current Controlled Trials (Date searched: 01 September 2009 for all years)
| Register | Search term |
| metaRegister (active register) | (kuvan OR phenoptin OR Sapropterin) AND (phenylketonuria OR PKU) |
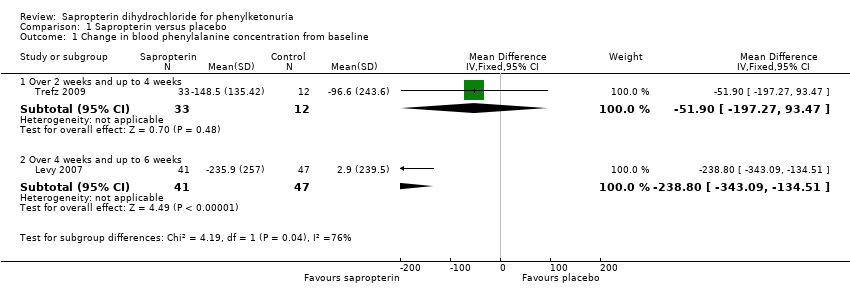
Comparison 1 Sapropterin versus placebo, Outcome 1 Change in blood phenylalanine concentration from baseline.
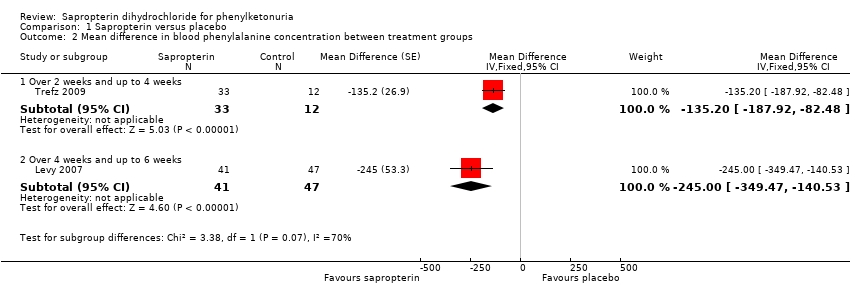
Comparison 1 Sapropterin versus placebo, Outcome 2 Mean difference in blood phenylalanine concentration between treatment groups.
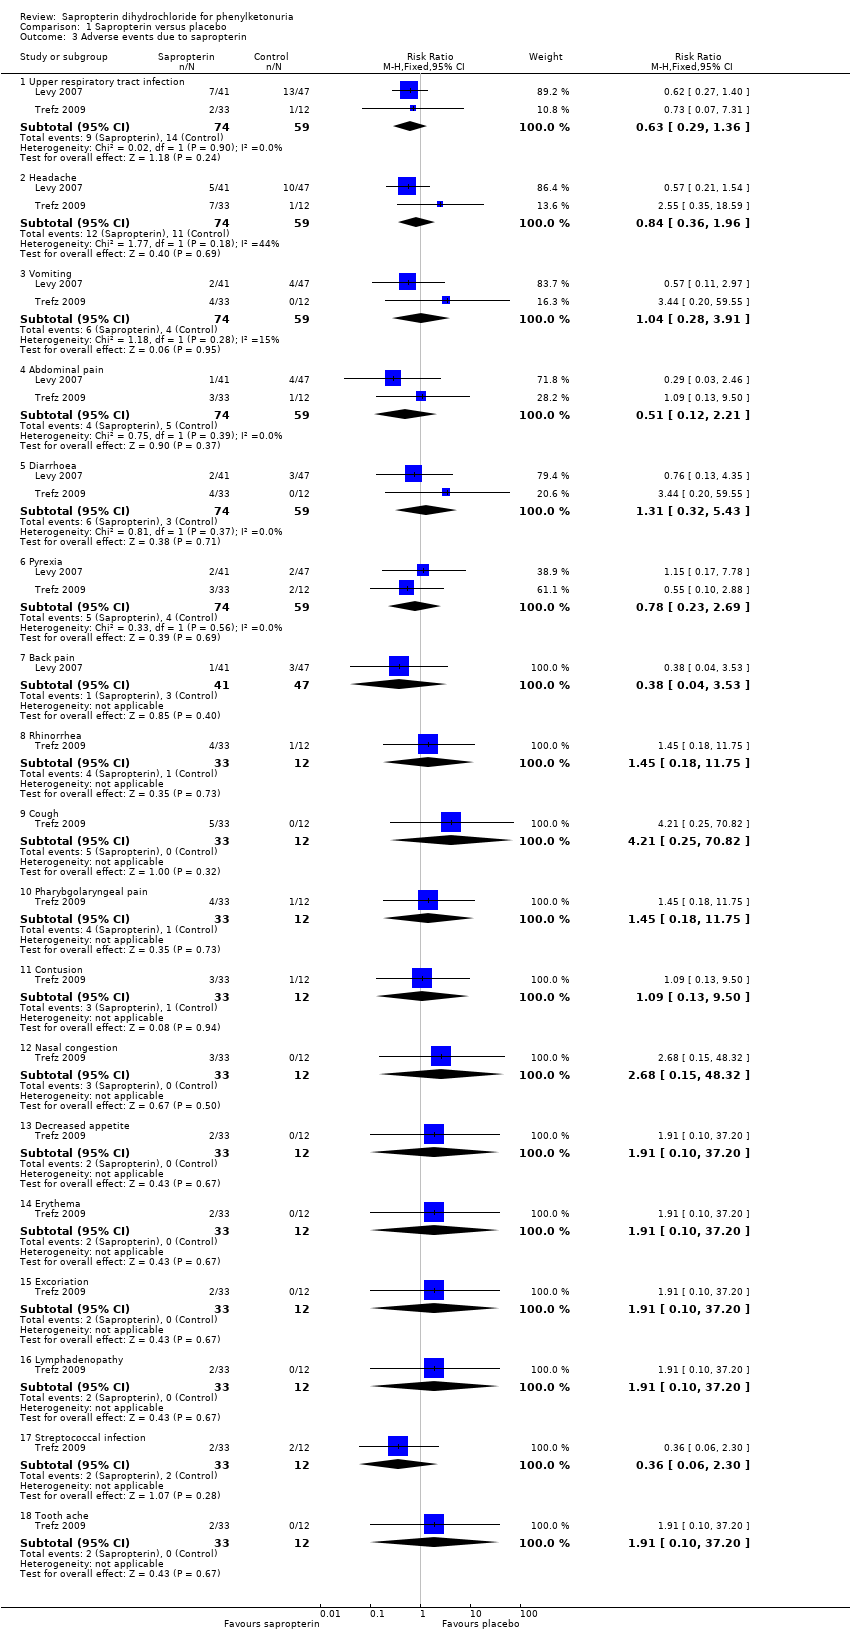
Comparison 1 Sapropterin versus placebo, Outcome 3 Adverse events due to sapropterin.

Comparison 1 Sapropterin versus placebo, Outcome 4 Mean phenylalanine supplement tolerated.
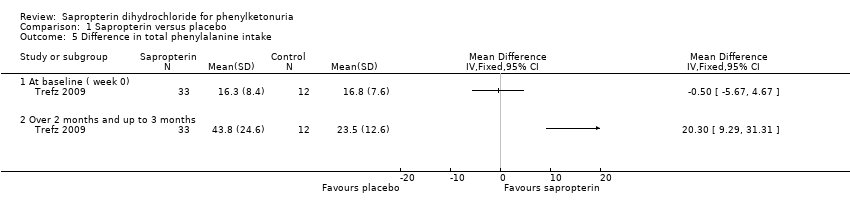
Comparison 1 Sapropterin versus placebo, Outcome 5 Difference in total phenylalanine intake.
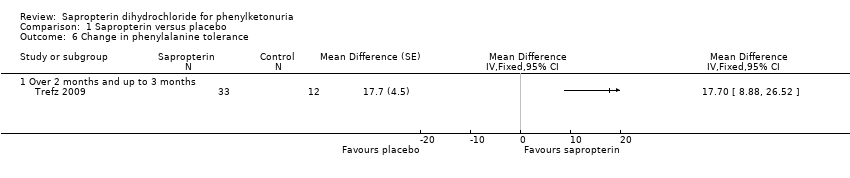
Comparison 1 Sapropterin versus placebo, Outcome 6 Change in phenylalanine tolerance.
| Outcome or subgroup title | No. of studies | No. of participants | Statistical method | Effect size |
| 1 Change in blood phenylalanine concentration from baseline Show forest plot | 2 | Mean Difference (IV, Fixed, 95% CI) | Subtotals only | |
| 1.1 Over 2 weeks and up to 4 weeks | 1 | 45 | Mean Difference (IV, Fixed, 95% CI) | ‐51.90 [‐197.27, 93.47] |
| 1.2 Over 4 weeks and up to 6 weeks | 1 | 88 | Mean Difference (IV, Fixed, 95% CI) | ‐238.8 [‐343.09, ‐134.51] |
| 2 Mean difference in blood phenylalanine concentration between treatment groups Show forest plot | 2 | Mean Difference (Fixed, 95% CI) | Subtotals only | |
| 2.1 Over 2 weeks and up to 4 weeks | 1 | 45 | Mean Difference (Fixed, 95% CI) | ‐135.2 [‐187.92, ‐82.48] |
| 2.2 Over 4 weeks and up to 6 weeks | 1 | 88 | Mean Difference (Fixed, 95% CI) | ‐245.0 [‐349.47, ‐140.53] |
| 3 Adverse events due to sapropterin Show forest plot | 2 | Risk Ratio (M‐H, Fixed, 95% CI) | Subtotals only | |
| 3.1 Upper respiratory tract infection | 2 | 133 | Risk Ratio (M‐H, Fixed, 95% CI) | 0.63 [0.29, 1.36] |
| 3.2 Headache | 2 | 133 | Risk Ratio (M‐H, Fixed, 95% CI) | 0.84 [0.36, 1.96] |
| 3.3 Vomiting | 2 | 133 | Risk Ratio (M‐H, Fixed, 95% CI) | 1.04 [0.28, 3.91] |
| 3.4 Abdominal pain | 2 | 133 | Risk Ratio (M‐H, Fixed, 95% CI) | 0.51 [0.12, 2.21] |
| 3.5 Diarrhoea | 2 | 133 | Risk Ratio (M‐H, Fixed, 95% CI) | 1.31 [0.32, 5.43] |
| 3.6 Pyrexia | 2 | 133 | Risk Ratio (M‐H, Fixed, 95% CI) | 0.78 [0.23, 2.69] |
| 3.7 Back pain | 1 | 88 | Risk Ratio (M‐H, Fixed, 95% CI) | 0.38 [0.04, 3.53] |
| 3.8 Rhinorrhea | 1 | 45 | Risk Ratio (M‐H, Fixed, 95% CI) | 1.45 [0.18, 11.75] |
| 3.9 Cough | 1 | 45 | Risk Ratio (M‐H, Fixed, 95% CI) | 4.21 [0.25, 70.82] |
| 3.10 Pharybgolaryngeal pain | 1 | 45 | Risk Ratio (M‐H, Fixed, 95% CI) | 1.45 [0.18, 11.75] |
| 3.11 Contusion | 1 | 45 | Risk Ratio (M‐H, Fixed, 95% CI) | 1.09 [0.13, 9.50] |
| 3.12 Nasal congestion | 1 | 45 | Risk Ratio (M‐H, Fixed, 95% CI) | 2.68 [0.15, 48.32] |
| 3.13 Decreased appetite | 1 | 45 | Risk Ratio (M‐H, Fixed, 95% CI) | 1.91 [0.10, 37.20] |
| 3.14 Erythema | 1 | 45 | Risk Ratio (M‐H, Fixed, 95% CI) | 1.91 [0.10, 37.20] |
| 3.15 Excoriation | 1 | 45 | Risk Ratio (M‐H, Fixed, 95% CI) | 1.91 [0.10, 37.20] |
| 3.16 Lymphadenopathy | 1 | 45 | Risk Ratio (M‐H, Fixed, 95% CI) | 1.91 [0.10, 37.20] |
| 3.17 Streptococcal infection | 1 | 45 | Risk Ratio (M‐H, Fixed, 95% CI) | 0.36 [0.06, 2.30] |
| 3.18 Tooth ache | 1 | 45 | Risk Ratio (M‐H, Fixed, 95% CI) | 1.91 [0.10, 37.20] |
| 4 Mean phenylalanine supplement tolerated Show forest plot | 1 | Mean Difference (IV, Fixed, 95% CI) | Totals not selected | |
| 4.1 Over 2 months and up to 3 months | 1 | Mean Difference (IV, Fixed, 95% CI) | 0.0 [0.0, 0.0] | |
| 5 Difference in total phenylalanine intake Show forest plot | 1 | Mean Difference (IV, Fixed, 95% CI) | Totals not selected | |
| 5.1 At baseline ( week 0) | 1 | Mean Difference (IV, Fixed, 95% CI) | 0.0 [0.0, 0.0] | |
| 5.2 Over 2 months and up to 3 months | 1 | Mean Difference (IV, Fixed, 95% CI) | 0.0 [0.0, 0.0] | |
| 6 Change in phenylalanine tolerance Show forest plot | 1 | Mean Difference (Fixed, 95% CI) | Totals not selected | |
| 6.1 Over 2 months and up to 3 months | 1 | Mean Difference (Fixed, 95% CI) | 0.0 [0.0, 0.0] | |