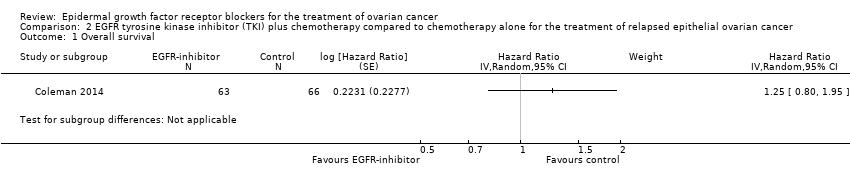
| 1 Overall survival Show forest plot | 4 | 658 | Hazard Ratio (Random, 95% CI) | 0.93 [0.74, 1.18] |
|
| 1.1 Platinum‐sensitive | 1 | 149 | Hazard Ratio (Random, 95% CI) | 1.02 [0.63, 1.67] |
| 1.2 Platinum‐resistant or refractory | 3 | 509 | Hazard Ratio (Random, 95% CI) | 0.91 [0.70, 1.18] |
| 2 Progression‐free survival Show forest plot | 4 | 658 | Hazard Ratio (Random, 95% CI) | 0.90 [0.70, 1.16] |
|
| 2.1 Platinum‐sensitive | 1 | 149 | Hazard Ratio (Random, 95% CI) | 1.17 [0.81, 1.70] |
| 2.2 Platinum‐resistant or refractory | 3 | 509 | Hazard Ratio (Random, 95% CI) | 0.83 [0.63, 1.09] |
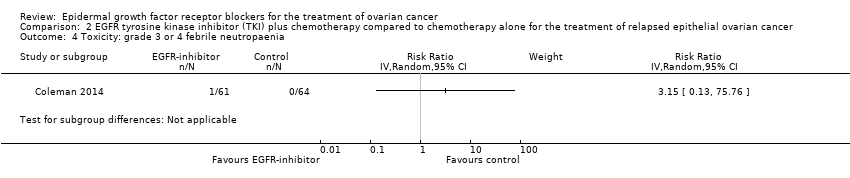
| 3 Toxicity: grade 3 or 4 neutropaenia Show forest plot | 4 | 652 | Risk Ratio (IV, Random, 95% CI) | 1.05 [0.64, 1.71] |
|
| 3.1 Pertuzumab | 3 | 432 | Risk Ratio (IV, Random, 95% CI) | 1.16 [0.66, 2.05] |
| 3.2 Seribantumab | 1 | 220 | Risk Ratio (IV, Random, 95% CI) | 0.64 [0.26, 1.60] |
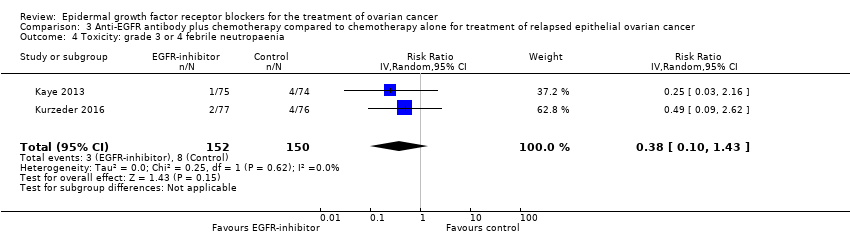
| 4 Toxicity: grade 3 or 4 febrile neutropaenia Show forest plot | 2 | 302 | Risk Ratio (IV, Random, 95% CI) | 0.38 [0.10, 1.43] |
|
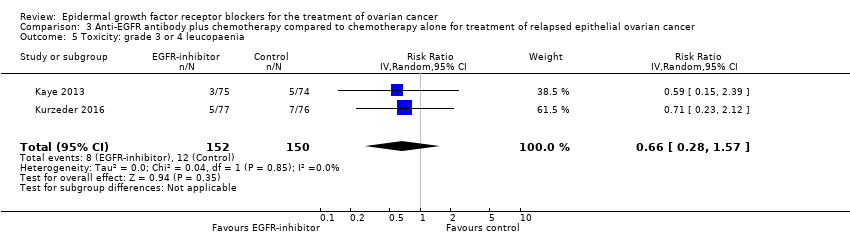
| 5 Toxicity: grade 3 or 4 leucopaenia Show forest plot | 2 | 302 | Risk Ratio (IV, Random, 95% CI) | 0.66 [0.28, 1.57] |
|
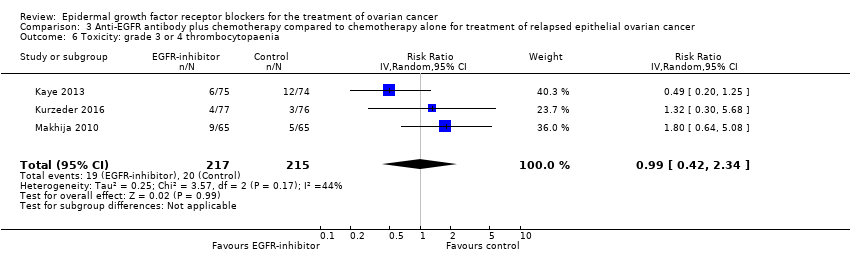
| 6 Toxicity: grade 3 or 4 thrombocytopaenia Show forest plot | 3 | 432 | Risk Ratio (IV, Random, 95% CI) | 0.99 [0.42, 2.34] |
|
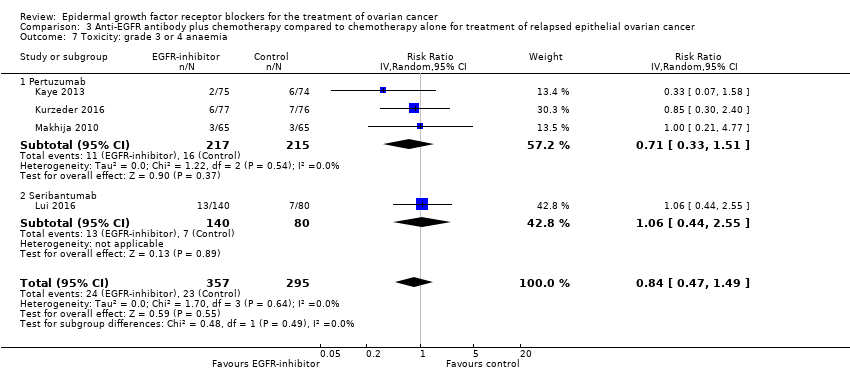
| 7 Toxicity: grade 3 or 4 anaemia Show forest plot | 4 | 652 | Risk Ratio (IV, Random, 95% CI) | 0.84 [0.47, 1.49] |
|
| 7.1 Pertuzumab | 3 | 432 | Risk Ratio (IV, Random, 95% CI) | 0.71 [0.33, 1.51] |
| 7.2 Seribantumab | 1 | 220 | Risk Ratio (IV, Random, 95% CI) | 1.06 [0.44, 2.55] |
| 8 Toxicity: grade 3 or 4 diarrhoea Show forest plot | 4 | 652 | Risk Ratio (IV, Random, 95% CI) | 2.87 [0.59, 13.89] |
|
| 8.1 Pertuzumab | 3 | 432 | Risk Ratio (IV, Random, 95% CI) | 6.37 [1.89, 21.45] |
| 8.2 Seribantumab | 1 | 220 | Risk Ratio (IV, Random, 95% CI) | 0.38 [0.07, 2.23] |
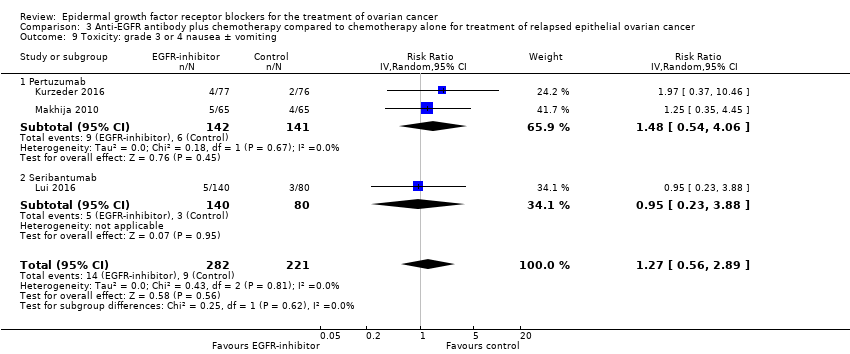
| 9 Toxicity: grade 3 or 4 nausea ± vomiting Show forest plot | 3 | 503 | Risk Ratio (IV, Random, 95% CI) | 1.27 [0.56, 2.89] |
|
| 9.1 Pertuzumab | 2 | 283 | Risk Ratio (IV, Random, 95% CI) | 1.48 [0.54, 4.06] |
| 9.2 Seribantumab | 1 | 220 | Risk Ratio (IV, Random, 95% CI) | 0.95 [0.23, 3.88] |
| 10 Toxicity: grade 3 or 4 dyspepsia Show forest plot | 1 | | Risk Ratio (IV, Random, 95% CI) | Subtotals only |
|
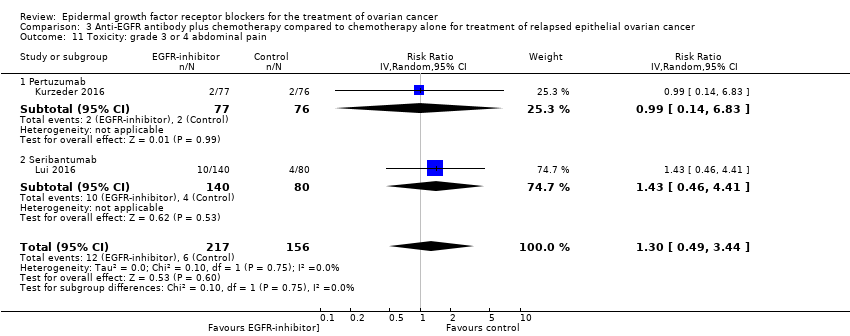
| 11 Toxicity: grade 3 or 4 abdominal pain Show forest plot | 2 | 373 | Risk Ratio (IV, Random, 95% CI) | 1.30 [0.49, 3.44] |
|
| 11.1 Pertuzumab | 1 | 153 | Risk Ratio (IV, Random, 95% CI) | 0.99 [0.14, 6.83] |
| 11.2 Seribantumab | 1 | 220 | Risk Ratio (IV, Random, 95% CI) | 1.43 [0.46, 4.41] |
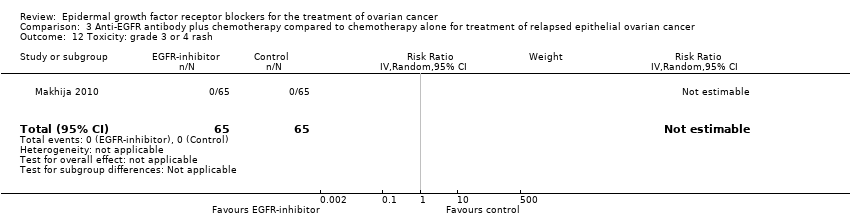
| 12 Toxicity: grade 3 or 4 rash Show forest plot | 1 | 130 | Risk Ratio (IV, Random, 95% CI) | 0.0 [0.0, 0.0] |
|
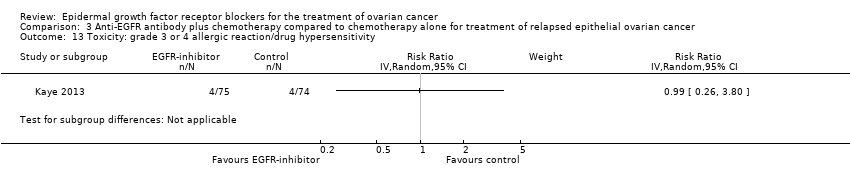
| 13 Toxicity: grade 3 or 4 allergic reaction/drug hypersensitivity Show forest plot | 1 | | Risk Ratio (IV, Random, 95% CI) | Subtotals only |
|
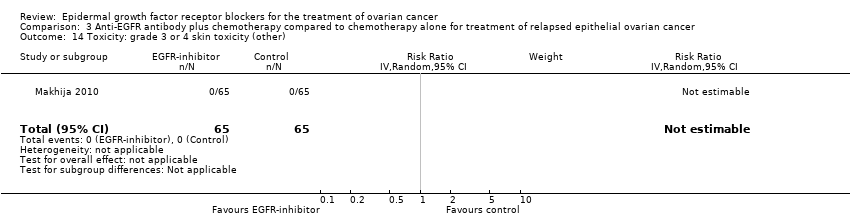
| 14 Toxicity: grade 3 or 4 skin toxicity (other) Show forest plot | 1 | 130 | Risk Ratio (IV, Random, 95% CI) | 0.0 [0.0, 0.0] |
|
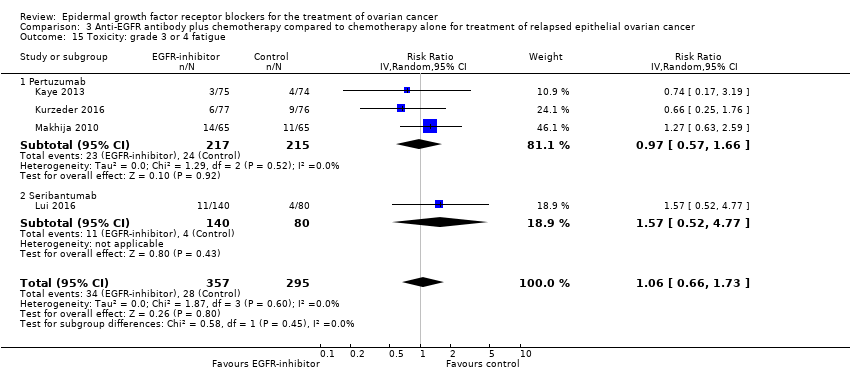
| 15 Toxicity: grade 3 or 4 fatigue Show forest plot | 4 | 652 | Risk Ratio (IV, Random, 95% CI) | 1.06 [0.66, 1.73] |
|
| 15.1 Pertuzumab | 3 | 432 | Risk Ratio (IV, Random, 95% CI) | 0.97 [0.57, 1.66] |
| 15.2 Seribantumab | 1 | 220 | Risk Ratio (IV, Random, 95% CI) | 1.57 [0.52, 4.77] |
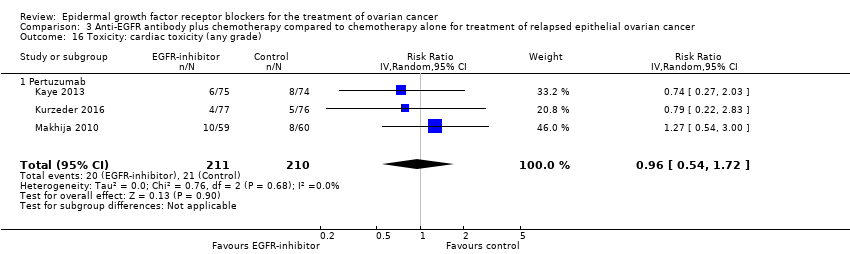
| 16 Toxicity: cardiac toxicity (any grade) Show forest plot | 3 | 421 | Risk Ratio (IV, Random, 95% CI) | 0.96 [0.54, 1.72] |
|
| 16.1 Pertuzumab | 3 | 421 | Risk Ratio (IV, Random, 95% CI) | 0.96 [0.54, 1.72] |
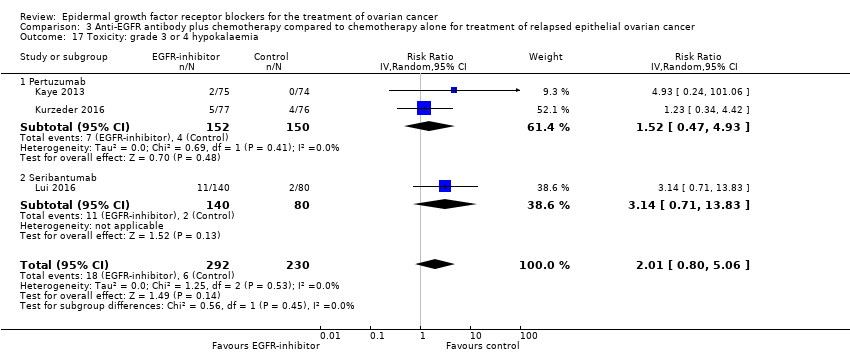
| 17 Toxicity: grade 3 or 4 hypokalaemia Show forest plot | 3 | 522 | Risk Ratio (IV, Random, 95% CI) | 2.01 [0.80, 5.06] |
|
| 17.1 Pertuzumab | 2 | 302 | Risk Ratio (IV, Random, 95% CI) | 1.52 [0.47, 4.93] |
| 17.2 Seribantumab | 1 | 220 | Risk Ratio (IV, Random, 95% CI) | 3.14 [0.71, 13.83] |
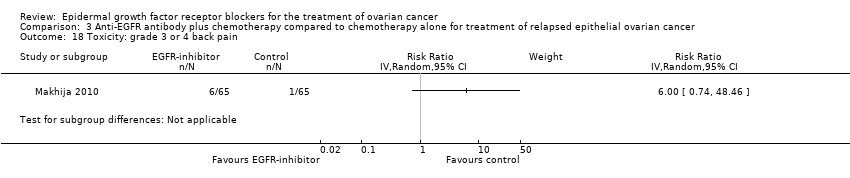
| 18 Toxicity: grade 3 or 4 back pain Show forest plot | 1 | | Risk Ratio (IV, Random, 95% CI) | Subtotals only |
|