Heated insufflation with or without humidification for laparoscopic abdominal surgery
Abstract
Background
Intraoperative hypothermia during both open and laparoscopic abdominal surgery may be associated with adverse events. For laparoscopic abdominal surgery, the use of heated insufflation systems for establishing pneumoperitoneum has been described to prevent hypothermia. Humidification of the insufflated gas is also possible. Past studies on heated insufflation have shown inconclusive results with regards to maintenance of core temperature and reduction of postoperative pain and recovery times.
Objectives
To determine the effect of heated gas insufflation compared to cold gas insufflation on maintaining intraoperative normothermia as well as patient outcomes following laparoscopic abdominal surgery.
Search methods
We searched Cochrane Colorectal Cancer Specialised Register (September 2016), the Cochrane Central Register of Controlled Trials (CENTRAL; The Cochrane Library 2016, Issue 8), Ovid MEDLINE (1950 to September 2016), Ovid Embase (1974 to September 2016), International Pharmaceutical Abstracts (IPA) (September 2016), Web of Science (1985 to September 2016), Scopus, www.clinicaltrials.gov and the National Research Register (1956 to September 2016). We also searched grey literature and cross references. Searches were limited to human studies without language restriction.
Selection criteria
Only randomised controlled trials comparing heated (with or without humidification) with cold gas insufflation in adult and paediatric populations undergoing laparoscopic abdominal procedures were included. We assessed study quality in regards to relevance, design, sequence generation, allocation concealment, blinding, possibility of incomplete data and selective reporting. Two review authors independently selected studies for the review, with any disagreement resolved in consensus with a third co‐author.
Data collection and analysis
Two review authors independently performed screening of eligible studies, data extraction and methodological quality assessment of the trials. We classified a study as low‐risk of bias if all of the first six main criteria indicated in the 'Risk of Bias Assessment' table were assessed as low risk. We used data sheets to collect data from eligible studies. We presented results using mean differences for continuous outcomes and relative risks for dichotomous outcomes, with 95% confidence intervals. We used Review Manager (RevMan) 5.3 software to calculate the estimated effects. We took publication bias into consideration and compiled funnel plots.
Main results
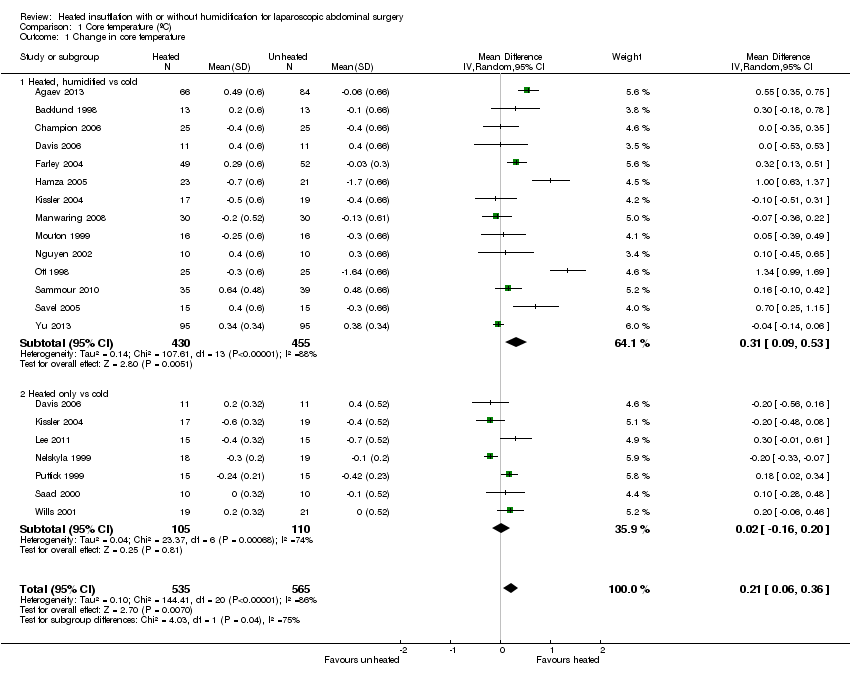
We included 22 studies in this updated analysis, including six new trials with 584 additional participants, resulting in a total of 1428 participants. The risk of bias was low in 11 studies, high in one study and unclear in the remaining studies, due primarily to failure to report methodology for randomisation, and allocation concealment or blinding, or both. Fourteen studies examined intraoperative core temperatures among heated and humidified insufflation cohorts and core temperatures were higher compared to cold gas insufflation (MD 0.31 °C, 95% CI, 0.09 to 0.53, I2 = 88%, P = 0.005) (low‐quality evidence). If the analysis was limited to the eight studies at low risk of bias, this result became non‐significant but remained heterogeneous (MD 0.18 °C, 95% CI, ‐0.04 to 0.39, I2= 81%, P = 0.10) (moderate‐quality evidence).
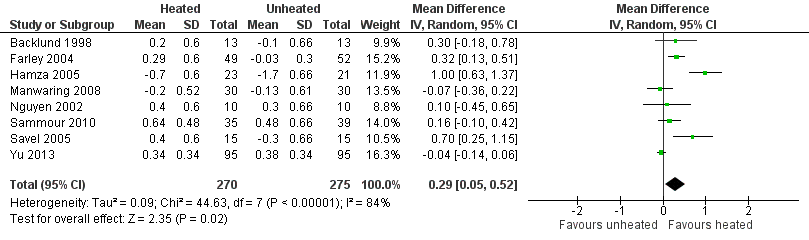
In comparison to the cold CO2 group, the meta‐analysis of the heated, non‐humidified group also showed no statistically significant difference between groups. Core temperature was statistically, significantly higher in the heated, humidified CO2 with external warming groups (MD 0.29 °C, 95% CI, 0.05 to 0.52, I2 = 84%, P = 0.02) (moderate‐quality evidence). Despite the small difference in temperature of 0.31 °C with heated CO2, this is unlikely to be of clinical significance.
For postoperative pain scores, there were no statistically significant differences between heated and cold CO2, either overall, or for any of the subgroups assessed. Interestingly, morphine‐equivalent use was homogeneous and higher in heated, non‐humidified insufflation compared to cold insufflation for postoperative day one (MD 11.93 mg, 95% CI 0.92 to 22.94, I2 = 0%, P = 0.03) (low‐quality evidence) and day two (MD 9.79 mg, 95% CI 1.58 to 18.00, I2 = 0%, P = 0.02) (low‐quality evidence). However, morphine use was not significantly different six hours postoperatively or in any humidified insufflation groups.
There was no apparent effect on length of hospitalisation, lens fogging or length of operation with heated compared to cold gas insufflation, with or without humidification. Recovery room time was shorter in the heated cohort (MD ‐26.79 minutes, 95% CI ‐51.34 to ‐2.25, I2 = 95%, P = 0.03) (low‐quality evidence). When the one and only unclear‐risk study was removed from the analysis, the difference in recovery‐room time became non‐significant and the studies were statistically homogeneous (MD ‐1.22 minutes, 95% CI, ‐6.62 to 4.17, I2 = 12%, P = 0.66) (moderate‐quality evidence).
There were also no differences in the frequency of major adverse events that occurred in the cold or heated cohorts.
These results should be interpreted with caution due to some limitations. Heterogeneity of core temperature remained significant despite subgroup analysis, likely due to variations in the study design of the individual trials, as the trials had variations in insufflation gas temperatures (35 ºC to 37 ºC), humidity ranges (88% to 100%), gas volumes and location of the temperature probes. Additionally, some of the trials lacked specific study design information making evaluation difficult.
Authors' conclusions
While heated, humidified gas leads to mildly smaller decreases in core body temperatures, clinically this does not account for improved patient outcomes, therefore, there is no clear evidence for the use of heated gas insufflation, with or without humidification, compared to cold gas insufflation in laparoscopic abdominal surgery.
PICO
Plain language summary
Heated CO2 for laparoscopic abdominal surgery
Background
In laparoscopic surgery, surgery is performed through small incisions using long instruments and video cameras. To create a working and viewing space in the abdomen, carbon dioxide (CO2) is insufflated to separate the abdominal wall from internal organs. Traditionally, unheated CO2 is used but there has been suggestions that heated CO2 may prevent hypothermia. Hypothermia has been associated with heart attacks, abnormal heart rhythms, increased infections, decreased clotting ability and increased blood loss. We aimed to investigate the role of heated compared with cold CO2 in laparoscopic abdominal surgery.
Study Characteristics
We searched the medical literature for randomised controlled trials (where people are allocated at random to one of two or more treatment groups) that compared heated and cold CO2. We analysed data from the trials for changes in core temperature. We also compared post‐operative pain scores and pain medication requirements, length of hospital stay, length of surgery and fogging of the surgical video camera lens. Evidence is current to September 2016.
Key results and quality of evidence
We identified and included 22 trials. There was an increase of 0.31 °C in the heated, humidified CO2 group compared to the cold CO2 group but the data were heterogeneous (highly variable). However, if the analysis was limited to the eight low‐risk‐of‐bias studies that reported core temperatures, no significant difference was found. Also, there was no temperature difference for heated and non‐humidified gas compared to cold gas.
There was no difference in postoperative pain with heated or cold insufflation. However, pain medication use was higher in only the heated, non‐humidified group on postoperative days one and two.
Heated gas apparently did not change length of hospitalisation, lens fogging or length of operation. Recovery room stay was shorter with heated gas but the data was heterogeneous (highly variable). When we only included studies at low risk of bias, the data became homogeneous (less variable) and the recovery room time was not significantly different between the heated and cold gas groups.
Authors' Conclusions
While heated, humidified gas leads to slightly smaller decreases in core body temperatures, this does not account for improvement in any patient outcomes. Therefore, there is no clear evidence for the use of heated gas insufflation, with or without humidification, in laparoscopic abdominal surgery.
Authors' conclusions
Summary of findings
| Heated CO2 with or without humidification for laparoscopic abdominal surgery | |||||
| Patient or population: Laparoscopic abdominal surgery (core temperature) | |||||
| Outcomes | Anticipated absolute effects* (95% CI) | № of participants | Quality of the evidence | Comments | |
| Risk with cold gas | Risk with heated gas | ||||
| Change in core temperature (ºC) | The mean change in core temperature was ‐0.22 °C | The mean change in core temperature in the intervention group was 0.21 °C higher (0.06 to 0.36) | 1100 | ⨁⨁◯◯ | Negative temperature indicates core temperature dropped during surgery |
| Change in core temperature: heated, humidified vs cold | The mean change in core temperature: heated, humidified vs cold was ‐0.25 °C | The mean change in core temperature: heated, humidified vs cold in the intervention group was 0.31 °C higher (0.09 to 0.53) | 885 | ⨁⨁◯◯ | |
| Change in core temperature: heated only vs cold | The mean change in core temperature: heated vs cold was ‐0.19 °C | The mean change in core temperature: heated vs cold in the intervention group was 0.02 °C higher (‐0.16 to 0.20) | 215 | ⨁⨁◯◯ | |
| Change in core temperature for known low risk of bias studies | The mean change in core temperature for low risk of bias studies was ‐0.10 °C | The mean change in core temperature for low risk of bias studies in the intervention group was 0.16 °C higher (‐0.01 to 0.33) | 653 | ⨁⨁⨁◯ | |
| Change in core temperature for known low risk of bias studies: heated, humidified vs cold | The mean change in core temperature for low risk of bias studies: heated, humidified vs cold was ‐0.09 °C | The mean change in core temperature for low risk of bias studies: heated, humidified vs cold in the intervention group was 0.18 °C higher (‐0.04 to 0.39) | 561 | ⨁⨁⨁◯ | |
| Change in core temperature for low risk of bias studies: heated only vs cold | The mean change in core temperature for low risk of bias studies: heated vs cold was ‐0.10 °C | The mean change in core temperature for low risk of bias studies: heated vs cold in the intervention group was 0.12 °C higher (‐0.15 to 0.39) | 92 | ⨁⨁⨁◯ | |
| Change in core temperature with external warming | The mean change in core temperature with external warming was ‐0.14 °C | The mean change in core temperature with external warming in the intervention group was 0.29 °C higher (0.05 to 0.52) | 545 | ⨁⨁⨁◯ | |
| Change in core temperature without external warming | The mean change in core temperature without external warming was ‐0.40 °C | The mean change in core temperature without external warming in the intervention group was 0.32 °C higher (‐0.11 to 0.75) | 340 | ⨁⨁⨁◯ | |
| Change in core temperature for operations > 120 min | The mean change in core temperature for operations > 120 min was ‐0.74 °C | The mean change in core temperature for operations > 120 min in the intervention group was 0.70 °C higher (0.10 to 1.30) | 194 | ⨁⨁⨁◯ | |
| *The risk in the intervention group (and its 95% confidence interval) is based on the assumed risk in the comparison group and the relative effect of the intervention (and its 95% CI). | |||||
| GRADE Working Group grades of evidence | |||||
|
| |||||
| Heated CO2 with or without humidification for laparoscopic abdominal surgery | |||||
| Patient or population: Laparoscopic abdominal surgery (pain score) | |||||
| Outcomes | Anticipated absolute effects* (95% CI) | № of participants | Quality of the evidence | Comments | |
| Risk with cold gas | Risk with heated gas | ||||
| Day 1 pain score (0 to 10‐point VAS) | The mean day 1 pain score was 2.8 | The mean day 1 pain score in the intervention group was 0.04 fewer (‐0.42 to 0.34) | 991 | ⨁⨁◯◯ | Higher score indicates more pain for participants |
| Day 1 pain score: heated, humidified vs cold (abdominal) | The mean day 1 pain score: heated, humidified vs cold (abdominal) was 4 | The mean day 1 pain score: heated, humidified vs cold (abdominal) in the intervention group was 0.14 fewer (‐0.6 to 0.33) | 670 | ⨁⨁◯◯ | |
| Day 1 pain score: heated, humidified vs cold (shoulder) | The mean day 1 pain score: heated, humidified vs cold (shoulder) was 2 | The mean day 1 pain score: heated, humidified vs cold (shoulder) in the intervention group was 0.35 fewer (‐1.75 to 1.05) | 171 | ⨁◯◯◯ | |
| Day 1 pain score: heated only vs cold | The mean day 1 pain score: heated vs cold was 2.8 | The mean day 1 pain score: heated vs cold in the intervention group was 0.5 more (‐0.11 to 1.12) | 150 | ⨁⨁⨁◯ | |
| Day 2 pain score | The mean day 2 pain score was 2.2 | The mean day 2 pain score in the intervention group was 0.28 fewer (‐0.78 to 0.21) | 695 | ⨁⨁◯◯ | |
| Day 2 pain score: heated, humidified vs cold (abdominal) | The mean day 2 pain score: heated, humidified vs cold (abdominal) was 3.2 | The mean day 2 pain score: heated, humidified vs cold (abdominal) in the intervention group was 0.4 fewer (‐1.07 to 0.28) | 442 | ⨁⨁◯◯ | |
| Day 2 pain score: heated, humidified vs cold (shoulder) | The mean day 2 pain score: heated, humidified vs cold (shoulder) was 1.5 | The mean day 2 pain score: heated, humidified vs cold (shoulder) in the intervention group was 0.88 fewer (‐2.93 to 1.17) | 111 | ⨁◯◯◯ | |
| Day 2 pain score: heated only vs cold | The mean day 2 pain score: heated vs cold was 1.9 | The mean day 2 pain score: heated vs cold in the intervention group was 0.41 more (‐0.44 to 1.27) | 142 | ⨁⨁◯◯ | |
| Day 1 pain score for low risk of bias studies | The mean day 1 pain score for low risk of bias studies was 2.7 | The mean day 1 pain score for low risk of bias studies in the intervention group was 0.17 more (‐0.21 to 0.55) | 570 | ⨁⨁⨁⨁ | |
| Day 1 pain score for low risk of bias studies: heated, humidified vs cold (abdominal) | The mean day 1 pain score for low risk of bias studies: heated, humidified vs cold (abdominal) was 4.3 | The mean day 1 pain score for low risk of bias studies: heated, humidified vs cold (abdominal) in the intervention group was 0.17 more (‐0.29 to 0.63) | 460 | ⨁⨁⨁⨁ | |
| Day 1 pain score for low risk of bias studies: heated, humidified vs cold (shoulder) | The mean day 1 pain score for low risk of bias studies: heated, humidified vs cold (shoulder) was 1.2 | The mean day 1 pain score for low risk of bias studies: heated, humidified vs cold (shoulder) in the intervention group was 0.25 more (‐0.81 to 1.31) | 110 | ⨁⨁⨁◯ | |
| Day 2 pain score for low risk of bias studies | The mean day 2 pain score for low risk of bias studies was 3.5 | The mean day 2 pain score for low risk of bias studies in the intervention group was 0.29 fewer (‐0.65 to 0.07) | 380 | ⨁⨁⨁⨁ | |
| *The risk in the intervention group (and its 95% confidence interval) is based on the assumed risk in the comparison group and the relative effect of the intervention (and its 95% CI). | |||||
| GRADE Working Group grades of evidence | |||||
|
| |||||
| Heated CO2 with or without humidification for laparoscopic abdominal surgery | |||||
| Patient or population: Laparoscopic abdominal surgery (morphine consumption) | |||||
| Outcomes | Anticipated absolute effects* (95% CI) | № of participants | Quality of the evidence | Comments | |
| Risk with cold gas | Risk with heated gas | ||||
| Up to 6 h | The mean up to 6 h morphine consumption was 12.6 mg | The mean up to 6 h in the intervention group was 0.45 mg more (‐1.19 to 2.08) | 231 | ⨁⨁⨁◯ | Morphine consumption was presented as equivalent daily dose |
| Day 1 morphine | The mean day 1 morphine consumption was 32.4 mg | The mean day 1 morphine consumption in the intervention group was 0.64 mg less (‐4.48 to 3.20) | 573 | ⨁⨁⨁◯ | |
| Day 1 morphine: heated, humidified vs cold | The mean day 1 morphine consumption: heated, humidified vs cold was 31.2 mg | The mean day 1 morphine consumption: heated, humidified vs cold in the intervention group was 1.66 mg less (‐4.79 to 1.46) | 481 | ⨁⨁◯◯ | |
| Day 1 morphine: heated only vs cold | The mean day 1 morphine consumption: heated vs cold was 33.6 mg | The mean day 1 morphine consumption: heated vs cold in the intervention group was 11.93 mg more (0.92 to 22.94) | 92 | ⨁⨁◯◯ | |
| Day 2 morphine | The mean day 2 morphine consumption was 22.1 mg | The mean day 2 morphine consumption in the intervention group was 0.61 mg less (‐2.79 to 1.57) | 532 | ⨁⨁⨁◯ | |
| Day 2 morphine: heated, humidified vs cold | The mean day 2 morphine consumption ‐ Heated, humidified vs cold was 21.3 mg | The mean day 2 morphine consumption: heated, humidified vs cold in the intervention group was 0.94 mg less (‐1.9 to 0.01) | 410 | ⨁⨁⨁◯ | |
| Day 2 morphine: heated only vs cold | The mean day 2 morphine consumption: heated vs cold was 23 mg | The mean day 2 morphine consumption: heated vs cold in the intervention group was 9.79 mg more (1.58 to 18.00) | 122 | ⨁⨁◯◯ | |
| *The risk in the intervention group (and its 95% confidence interval) is based on the assumed risk in the comparison group and the relative effect of the intervention (and its 95% CI). | |||||
| GRADE Working Group grades of evidence | |||||
| 1. Risk of bias not clear | |||||
| Heated CO2 with or without humidification for laparoscopic abdominal surgery | |||||
| Patient or population: Laparoscopic abdominal surgery (hospital stay) | |||||
| Outcomes | Anticipated absolute effects* (95% CI) | № of participants | Quality of the evidence | Comments | |
| Risk with cold gas | Risk with heated gas | ||||
| Hospital stay (days) | The mean hospital stay was 2.7 days | The mean hospital stay in the intervention group was 0.06 days less (‐0.31 to 0.19) | 685 | ⨁⨁⨁◯ | |
| Hospital stay: heated, humidified vs cold | The mean hospital stay: heated, humidified vs cold was 2.9 days | The mean hospital stay: heated, humidified vs cold in the intervention group was 0.13 days less (‐0.44 to 0.18) | 563 | ⨁⨁⨁◯ | |
| Hospital stay: heated only vs cold | The mean hospital stay: heated vs cold was 2.6 days | The mean hospital stay: heated vs cold in the intervention group was 0.20 days more (‐0.23 to 0.62) | 122 | ⨁⨁⨁◯ | |
| *The risk in the intervention group (and its 95% confidence interval) is based on the assumed risk in the comparison group and the relative effect of the intervention (and its 95% CI). | |||||
| GRADE Working Group grades of evidence | |||||
| 1. Risk of bias not clear | |||||
| Heated CO2 with or without humidification for laparoscopic abdominal surgery | |||||
| Patient or population: Laparoscopic abdominal surgery (recovery time) | |||||
| Outcomes | Anticipated absolute effects* (95% CI) | № of participants | Quality of the evidence | Comments | |
| Risk with cold gas | Risk with heated gas | ||||
| Recovery time (minutes) | The mean recovery time was 106.8 min | The mean recovery time in the intervention group was 26.79 min less (‐51.34 to ‐2.25) | 327 | ⨁⨁◯◯ | |
| Recovery time for low risk of bias studies | The mean recovery time for low risk of bias studies was 90.1 min | The mean recovery time for low risk of bias studies in the intervention group was 1.22 min less (‐6.62 to 4.17) | 277 | ⨁⨁⨁◯ | |
| *The risk in the intervention group (and its 95% confidence interval) is based on the assumed risk in the comparison group and the relative effect of the intervention (and its 95% CI). | |||||
| GRADE Working Group grades of evidence | |||||
| 1. Risk of bias not clear | |||||
| Heated CO2 with or without humidification for laparoscopic abdominal surgery | |||||
| Patient or population: Laparscopic abdominal surgery (lens fogging) | |||||
| Outcomes | Anticipated absolute effects* (95% CI) | № of participants | Quality of the evidence | Comments | |
| Risk with cold gas | Risk with heated gas | ||||
| Times cleaned | The mean frequency of cleaning was 1.8 times | The mean times cleaned in the intervention group was 0.73 times more (‐0.32 to 1.77) | 341 | ⨁⨁◯◯ | The frequency of lens cleaning during surgery |
| *The risk in the intervention group (and its 95% confidence interval) is based on the assumed risk in the comparison group and the relative effect of the intervention (and its 95% CI). | |||||
| GRADE Working Group grades of evidence | |||||
| 1. Risk of bias not clear | |||||
| Heated CO2 with or without humidification for laparoscopic abdominal surgery | |||||
| Patient or population: Laparoscopic abdominal surgery (operative time) | |||||
| Outcomes | Anticipated absolute effects* (95% CI) | № of participants | Quality of the evidence | Comments | |
| Risk with cold gas | Risk with heated gas | ||||
| Operative time (minutes) | The mean operative time was 76.6 min | The mean operative time in the intervention group was 0.44 min less (‐3.91 to 3.04) | 1318 | ⨁◯◯◯ | |
| Operative time: heated, humidified vs cold | The mean operative time: heated, humidified vs cold was 94.3 min | The mean operative time: heated, humidified vs cold in the intervention group was 2.01 min less (‐7.15 to 3.13) | 1033 | ⨁◯◯◯ | |
| Operative time: heated only vs cold | The mean operative time: heated vs cold was 58.8 min | The mean operative time: heated vs cold in the intervention group was 0.91 min more (‐4.02 to 5.83) | 285 | ⨁⨁◯◯ | |
| *The risk in the intervention group (and its 95% confidence interval) is based on the assumed risk in the comparison group and the relative effect of the intervention (and its 95% CI). | |||||
| GRADE Working Group grades of evidence | |||||
| 1. Risk of bias not clear | |||||
Background
Description of the condition
Intraoperative hypothermia can occur with open or laparoscopic surgery. General anaesthesia is associated with impaired thermoregulation (Putzu 2007; Qadan 2009) and insufflation of gas at ambient temperature during laparoscopic abdominal surgery may contribute to worsened hypothermia due to prolonged procedure times. Perioperative hypothermia has been associated with myocardial ischaemia and stimulation of cardiac dysrhythmias, such as ventricular tachycardia (Frank 1993; Frank 1997; Putzu 2007). Generalised immunosuppression and increased surgical site infections have also been described in conjunction with hypothermia. Infections are thought to arise because of a reduction in oxygen delivery to healing tissue due to peripheral vasoconstriction, (Beilin 1998; Qadan 2009). Increased blood loss has been associated with intraoperative hypothermia, resulting in greater transfusion requirements (Putzu 2007; Rajagopalan 2008), which may in turn further worsen hypothermia. Certain patient populations, including the elderly, may be at a higher risk of hypothermia (Macario 2002).
Description of the intervention
A European survey of 8083 surgical cases determined that only 19.4% of patients received intraoperative temperature monitoring (TEMMP). Interventions to prevent hypothermia include passive techniques (such as blankets and covers), and active techniques (such as heated forced air systems, heated mattresses and blankets, warmed humidified ventilator circuits and warmed intravenous and irrigation fluids). These techniques have been suggested to limit perioperative complications due to hypothermia (Putzu 2007; Winkler 2000; Wong 2007). Warm and humidified gas insufflation during laparoscopic surgery has been suggested as another active method to prevent hypothermia. The gas is heated by using a tube with an inline heating coil and water reservoir. The gas may be heated and humidified using such systems. The insufflation gas of choice in laparoscopic surgery is CO2 but other possibilities include nitrous oxide, helium or argon.
How the intervention might work
Several studies have analysed the impact of using warmed CO2, with or without humidification, for abdominal insufflation in laparoscopic surgery on patient‐centred clinical outcomes. It has been suggested that warming up CO2 prior to insufflation may prevent hypothermia and peritoneal inflammation (Demco 2001). Other studies concluded that warmed insufflation decreases postoperative pain (Champion 2006; Farley 2004; Hamza 2005; Mouton 1999; Ott 1998) and improves recovery times. These studies typically involved small and specific patient populations. In contradiction, there are a number of studies that show no important clinical benefits of using heated insufflation (Davis 2006; Nguyen 2002) and one in particular showed increased postoperative pain in the heated group (Kissler 2004).
Why it is important to do this review
This systematic review is an update to our previous review (Birch 2011), to further clarify the role of heated CO2 on core temperature during laparoscopic abdominal surgery and its impact on relevant clinical outcomes.
We repeated our search for eligible trials with updated search strategies, identified additional studies and included them in the meta‐analyses.
Objectives
To determine the effect of heated gas insufflation compared to cold gas insufflation on maintaining intraoperative normothermia as well as patient outcomes following laparoscopic abdominal surgery.
Methods
Criteria for considering studies for this review
Types of studies
All types of randomised controlled trials (RCT) including parallel‐group, crossover, cluster and factorial trials.
Types of participants
Adults and children undergoing laparoscopic abdominal surgery.
Types of interventions
Heated, with or without humidification, gas insufflation versus cold gas insufflation.
Types of outcome measures
Primary outcomes
Change in intra‐operative core temperature preferably measured via the tympanic membrane, nasopharynx, oesophagus, bladder or rectum (Cork 1983).
Secondary outcomes
The following clinical outcomes:
-
postoperative pain score (10‐point visual analogue scale (VAS));
-
morphine consumption; preferably reported as morphine equivalent daily doses
-
hospital stay;
-
recovery room stay;
-
lens fogging;
-
operative time;
-
major adverse events defined as Clavien‐Dindo grade III or higher (Dindo 2004).
Search methods for identification of studies
Electronic searches
We conducted a comprehensive literature search to identify all published and unpublished RCTs with no language restrictions in collaboration with the Cochrane Information Specialist (CIS) from Cochrane Colorectal Cancer. We searched the following electronic databases:
-
Cochrane Colorectal Cancer Group Specialised Register (September 2016);
-
Cochrane Central Register of Controlled Trials (CENTRAL; The Cochrane Library 2016, Issue 8)) (September 2016) (Appendix 1);
-
Ovid MEDLINE (1950 to Septermber 2016) (Appendix 2);
-
Ovid Embase (1974 to September 2016) (Appendix 3);
-
SCOPUS (date to July 2016) (Appendix 4);
-
Web of Science (1985 to July 2016) (Appendix 5);
-
www.clinicaltrials.gov, International Pharmaceutical Abstracts, the National Research Register and Google Scholar for completed and ongoing trials (Appendix 6).
Searching other resources
We also searched Google Scholar, conference proceedings and reference lists of included studies for relevant studies.
Data collection and analysis
Selection of studies
Two review authors (JD, XS) performed study selection independently, with any subsequent disagreement resolved through discussion with a third co‐author (NS). Studies were included in the review irrespective of whether they reported measured outcome data.
Data extraction and management
Two review authors (XS, NS) independently collected data from the included studies into data sheets. We resolved disagreements through discussion with a third co‐author (JD). Two studies (Saad 2000; Wills 2001) that did not use standard visual analogue scales (VAS) had their 0 to 100 scores converted to a score from 0 to 10.
Assessment of risk of bias in included studies
We used the Cochrane ‘Risk of bias’ tool for assessing risk of bias of included trials (Higgins 2011). We assessed risk of bias of the following domains:
-
random sequence generation;
-
allocation concealment;
-
blinding of participants and personnel;
-
blinding of outcome assessment;
-
incomplete outcome data;
-
selective reporting bias;
-
other bias (conflicts of interest, reporting of data, reporting and balance of characteristics at baseline).
We judged each domain as low risk, high risk or unclear risk of bias according to criteria used in the Cochrane ‘Risk of bias’ tool (see Appendix 7) (Higgins 2011). We judged a study as low risk of bias if we assessed all of the first six domains as low risk. Two review authors (JD, XS) independently assessed the risk of bias and disagreements were resolved with a third author (NS).
Measures of treatment effect
We calculated the effect of the intervention for each trial, expressing categorical data as relative risks (RR) with 95% confidence intervals (CI) and continuous data as mean differences (MD) ± 95% CIs.
Unit of analysis issues
For individual trials, the unit of analysis we used was individual participants. There were no cluster‐randomised trials or cross‐over trials that would be at risk of unit of analysis issues eligible for inclusion in our review. If there are such studies in future updates, we will perform sensitivity analyses to determine the effect of these trials on outcome measures.
Dealing with missing data
If possible, we obtained missing data either from the original study authors or from similar reviews written by others (Lee 2011; Sajid 2008; Sammour 2008). We contacted nine authors, four responded with additional data, two had no further data, and three did not respond. When the original data only provided the mean, we used the largest standard deviation (SD) in the group of trials in the analysis.
Assessment of heterogeneity
We assessed clinical heterogeneity for differences in participant characteristics (paediatric vs adult), intervention characteristics (humidified vs non‐humidified, duration of surgery, external warming) and outcome measures (abdominal vs shoulder pain) with subgroup analysis where possible. Heterogeneity was tested using the Chi² test with significance set at P < 0.10 and the amount of heterogeneity quantified by the I² statistic. Heterogeneity was considered as low, moderate, and high based on I2 values of 25%, 50%, and 75%, respectively (Higgins 2003).
Assessment of reporting biases
We considered publication bias and compiled funnel plots for the studies to reveal this. We then applied Egger's linear regression analysis (Egger 1997) to each funnel plot to detect asymmetry.
Data synthesis
We used meta‐analysis to combine the outcomes and determine the estimated effect of intervention, which we calculated using Review Manager (RevMan) software version 5.3 (RevMan 2014). We applied the random‐effects method in our analysis, assuming that the true effect estimates varied among studies.
Subgroup analysis and investigation of heterogeneity
When significant heterogeneity was found among studies, we performed subgroup analysis to explore the source. We performed subgroup analysis for humidified vs non‐humidified subgroups for the following outcomes: core temperature, pain score, morphine consumption, hospital stay, and operative time. For the core temperature outcome, we also analysed subgroups with longer operative times (more than 120 minutes) and those with external warming. The 120‐minute threshold was decided after consulting with surgeons on the research team as there was no clear definition in the literature. Further, for pain scores, we performed subgroup analysis for shoulder and abdominal pain. Shoulder pain occurs in some patients after insufflation due to referred pain from irritation of the diaphragm. Additionally, we performed separate analysis with only low‐risk‐of‐bias studies for core temperature, pain score and recovery time.
Summary of Findings Table
We assessed the quality of evidence of core temperature, pain score, morphine consumption, hospital stay, recovery room stay, lens fogging and operative time for the heated gas group versus cold gas group using the Grading of Recommendations Assessment, Development and Evaluation (GRADE) approach (Schünemann 2009) in the 'Summary of Findings' table(s).
The GRADE system classifies the quality of evidence in one of four grades:
| Grade | Definition |
| High | Further research is very unlikely to change our confidence in the estimate of effect |
| Moderate | Further research is likely to have an impact on our confidence in the estimate of effect and may change the estimate |
| Low | Further research is very likely to have an important impact on our confidence on the estimate of effect and is likely to change the estimate |
| Very low | Any estimate of effect is very uncertain |
Factors that influence the quality of evidence:
| Downgrades the evidence | Upgrades the evidence |
| Study limitation | Large magnitude of effect |
| Inconsistency of results | All plausible confounding would reduce the demonstrated effect |
| Indirectness of evidence | Dose‐response gradient |
| Imprecision | |
| Publication bias |
Sensitivity analysis
Not all studies had adequately reported on sequence generation, allocation concealment, blinding, or number of and reasons for withdrawals, and were therefore at an unclear risk of bias. We therefore performed sensitivity analyses including only those trials with a known low risk of bias.
Results
Description of studies
Results of the search
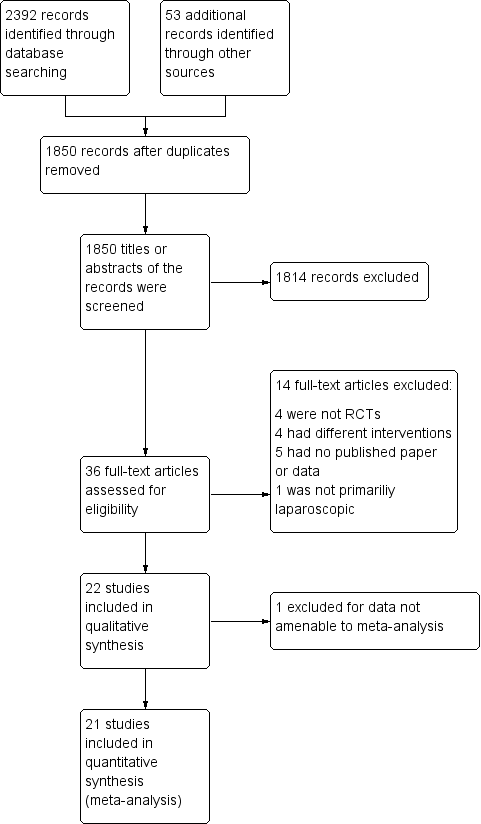
The electronic searches identified a total of 2392 citations. After removing duplicate studies, we reviewed 1850 titles or abstracts, and excluded trials that involved non‐abdominal procedures, uncommon laparoscopic procedures, non‐human subjects and those not using cold gas as a control. We also excluded duplicated studies and non‐randomised controlled trials. Finally, the review authors DB, NS and XS agreed that 22 trials met the inclusion criteria and included them in this review. See PRISMA diagram (Moher 2009) (Figure 1).

Study flow diagram
Included studies
All 22 included studies were RCTs comparing heated CO2 insufflation (with or without humidification) with standard cold CO2 insufflation. All the included studies used CO2 insufflation. We excluded from the review studies examining outcomes that were dissimilar to those relevant to this review and studies where we did not receive a response from the authors. Surgical procedures included in the studies were: gastric bypass (n = 168), gynaecologic surgery (n = 259), cholecystectomy (n = 500), Nissen fundoplication (n = 157), appendicectomy (n = 190), low anterior resection (n = 16), gastrectomy (n = 7), colonic surgery (n = 84), diagnostic laparoscopy (n = 40), hernioplasty (n = 4), myotomy (n = 2) and rectopexy (n = 1).
Primary outcome data were available for 1081 participants as three studies (Demco 2001; Klugsberger 2014; Slim 1999) did not report intraoperative changes in core temperature. Of these, 430 were in the heated, humidified gas group; 105 were in the heated‐only gas group; and 546 were in the cold gas group.
Five studies had relatively long operative times (more than 120 minutes) (Backlund 1998; Hamza 2005; Lee 2011; Ott 1991; Sammour 2010). Ten out of 22 studies used a warming blanket for simultaneous warming (Backlund 1998; Farley 2004; Hamza 2005; Lee 2011; Manwaring 2008; Nguyen 2002; Sammour 2010; Savel 2005; Wills 2001; Yu 2013). A heated insufflation company supported 11 of the 22 trials (Backlund 1998; Davis 2006; Farley 2004; Hamza 2005; Kissler 2004; Manwaring 2008; Mouton 1999; Nelskyla 1999; Ott 1998; Savel 2005; Wills 2001). Ten of the 22 studies demonstrated a benefit with the use of heated gas insufflation (Agaev 2013; Backlund 1998; Farley 2004; Hamza 2005; Klugsberger 2014; Lee 2011; Mouton 1999; Nelskyla 1999; Ott 1998; Puttick 1999). See Characteristics of included studies and Table 1; Table 2; Table 3 for full study details.
| Study | Number of participants | Mean age (years) | % Female | Mean BMI (kg/m2) or weight (kg) |
| 150 | 52 | 72.7 | ||
| 26 | 49W/53C | 42.3 | 25W/25C (BMI) | |
| 50 | 41.5WH/44C | 86 | 50W/52.9C (BMI) | |
| 44 | 42.3WH/40.6W/44.8H/42.5C | 47.2WH/49.1W/48.5H/52.4C (BMI) | ||
| 40 | 100 | |||
| 117 (16 excluded) | 52 | 68.3 | 29.5W/29.7C (BMI) | |
| 50 (6 excluded) | 44WH/45C | 89.1 | 125W/128C (weight) | |
| 90 (53 with data) | 37WH/33W/36C | 100 | 63WH/63W/65C (weight) | |
| 148 | 55.7 | 69.6 | 28.56 (BMI) | |
| 30 | 60.1W/55.1C | 36.7 | ||
| 60 | 30WH/30C | 100 | 25W/24C (BMI) | |
| 32 | 23‐89 (range) | |||
| 37 | 46W/47C | 100 | 63W/66C (weight) | |
| 20 | 43WH/45C | 45 | ||
| 72 (50 with data) | 100 | |||
| 30 | 46.2W/53.7C | |||
| 20 | 62W/51C | 60 | 75W/83C (weight) | |
| 82 (8 excluded) | 71WH/69C | 57.1W/59C | 26.5W/25.5C (BMI) | |
| 30 | 41WH/39C | 80 | 50.6W/52.3C (BMI) | |
| 108 (8 excluded) | 52W/53C | 58 | 26.9W/25.7C (BMI) | |
| 41 (1 excluded) | 47.5W/52.2C | 45 | 27W/29.2C (BMI) | |
| 195 (5 excluded) | 12 | 36.8 | 49.6W/50.3C (weight) |
W = warmed cohort, C = cold cohort, H = humidified cohort, WH = warmed and humidified cohort
| Study | Procedures | Method of temperature measurement | Insufflation gas | Gas temperature (°C) | Heating device | Humidification (%) | Duration of surgery (minutes) | External warming |
| 110 laparoscopic cholecystectomy, 40 laparoscopic fundoplication | Carbon dioxide | WISAP Flow Thermo | Not specified | 42WH/56C | None | |||
| Laparoscopic fundoplication, hernioplasty, sigmoid colon resection, rectopexy | Pulmonary artery catheter | Carbon dioxide | 37 | WISAP Flow Thermo | None | 161W/163C | Warm blanket/ warm waterbath mattress | |
| Laparoscopic Roux‐en‐Y gastric bypass | Rectal thermometer | Carbon dioxide | 35 | Lexion Insuflow | 95 | 61.7WH/61.7C | None | |
| Laparoscopic Roux‐en‐Y gastric bypass | Foley catheter for bladder temperature | Carbon dioxide | 37 | Lexion Insuflow | 95 | 78‐84 (range) | None | |
| Awake laparoscopy | Carbon dioxide | 35 | Lexion Insuflow | 95 | None | |||
| Laparoscopic cholecystectomy | Oesophageal probe | Carbon dioxide | 35 | Lexion Insuflow | 95 | 91.2 | Bair Hugger forced air warmer (32 °CW/34 °C C) | |
| Laparoscopic Roux‐en‐Y gastric bypass | Oesophageal/ tympanic membrane | Carbon dioxide | 37 | Lexion Insuflow | 95 | 120WH/132C | Warm cotton blankets | |
| Laparoscopic gynaecologic surgery | Intravesical temperature | Carbon dioxide | 38 | Laparo‐CO2‐Pneu2232 | 95‐100 | 62WH/51W/45C | None | |
| Laparoscopic cholecystectomy | Rectal probe | Carbon dioxide | 35 | Storz Optitherm | 95 | 63.88 | None | |
| Laparoscopic low anterior resection, colectomy, gastrectomy | Oesophageal temperature probe | Carbon dioxide | 37 | WISAP Flow Thermo | None | 212W/230C | Bair Hugger forced air warmer/ warming mattress with circulating water at 38 °C | |
| 49 laparoscopy for endometriosis, 16 laparoscopy for adhesions | Carbon dioxide | 37 | Fisher & Paykel | 100 | 49.6WH/46.8C | Upper body warming blanket | ||
| Laparoscopic cholecystectomy | Oesophageal thermoresistor | Carbon dioxide | 34‐37 | LINS‐1000 | 88‐90 | 40WH/48.3WH | None | |
| Laparoscopic hysterectomy | Tympanic and nasopharyngeal infrared technique | Carbon dioxide | 37 | None | 56W/51C | None | ||
| Laparoscopic Nissen fundoplication | Oesophageal probe | Carbon dioxide | 37 | Georgia BioMedical Insuflow | 95 | 35.6WH/35.6C | Bair Hugger forced air warmer | |
| Laparoscopic gynaecologic surgery | Endotracheal temperature probe | Carbon dioxide | 36.2 | Insuflow | 95 | 38‐262 (range) | None | |
| Laparoscopic cholecystectomy | Oesophageal probe | Carbon dioxide | 37 | WISAP Flow Thermo | None | 31.5W/32.1C | None | |
| Laparoscopic cholecystectomy | Oesophageal probe | Carbon dioxide | 37 | WISAP Flow Thermo | None | 56W/61C | None | |
| Laparoscopic colon resection | Oesophageal probe | Carbon dioxide | 37 | Fisher & Paykel | 98 | 176.3WH/184.7C | Bair Hugger forced air warmer | |
| Laparoscopic Roux‐en‐Y gastric bypass | Oesophageal probe | Carbon dioxide | 35 | Lexion Insuflow | 95 | 76WH/101C | Bair Hugger forced air warmer at discretion of blinded anaesthesiologist | |
| Laparoscopic cholecystectomy, fundoplication, myotomy | Subdiaphragmatic thermometric probe | Carbon dioxide | 37 | ThermoFlator | None | 73W/67C | None | |
| Laparoscopic fundoplication | Nasopharyngeal thermistor | Carbon dioxide | 37 | Cook LINS‐2000 | None | 69W/72C | Bair Hugger forced air warmer | |
| Laparoscopic appendectomy | Naso‐oesophageal probe | Carbon dioxide | 37 | Fisher & Paykel | 98 | 69.8WH/71.6C | Forced‐air warming blanket |
W = warmed cohort, C = cold cohort, H = humidified cohort, WH = warmed and humidified cohort
| Study | Mean change in core temperature (°C) | Adverse events (Clavien‐Dindo ≥ III) | ||||
| Heated and humidified | Heated only | Cold | Heated and humidified | Heated only | Cold | |
| 0.49 | ‐0.06 | Not reported | Not reported | |||
| 0.2 | ‐0.1 | Not reported | Not reported | |||
| ‐0.4 | ‐0.4 | Not reported | Not reported | |||
| 0.4 | 0.2 | 0.4 | Not reported | Not reported | Not reported | |
| Not reported | Not reported | Not reported | Not reported | |||
| 0.29 | ‐0.03 | Not reported | Not reported | |||
| ‐0.7 | ‐1.7 | Not reported | Not reported | |||
| ‐0.5 | ‐0.6 | ‐0.4 | Not reported | Not reported | Not reported | |
| Not reported | Not reported | 0 | 0 | |||
| ‐0.4 | ‐0.7 | Not reported | Not reported | |||
| ‐0.2 | ‐0.13 | Not reported | Not reported | |||
| ‐0.25 | ‐0.3 | 0 | 0 | |||
| ‐0.2 | 0 | Not reported | Not reported | |||
| 0.4 | 0.3 | 0 | 0 | |||
| ‐0.3 | ‐1.64 | 0 | 0 | |||
| ‐0.24 | ‐0.42 | Not reported | Not reported | |||
| 0 | ‐0.1 | Not reported | Not reported | |||
| 0.64 | 0.48 | 3 (8.6%) | 5 (12.8%) | |||
| 0.4 | ‐0.3 | Not reported | Not reported | |||
| Not reported | Not reported | 0 | 0 | |||
| 0.2 | 0 | 0 | 1 (4.8%) | |||
| 0.1 | 0.1 | 3 (10.3%) | 0 | |||
Agaev 2013: originally published in Russian, this study examined 150 laparoscopic operations (110 cholecystectomies and 40 fundoplications), participants with standard CO2 vs. warmed, humidified CO2 during the operations. Their conclusion was warmed, humidified CO2 had advantages for maintaining a warmer intraoperative core temperature, having less postoperative pain and requiring fewer analgesic prescriptions.
Backlund 1998: examined the effect of 37 °C and room temperature‐insufflated CO2 during and after prolonged laparoscopic surgery (more than 120 minutes). Twenty six participants undergoing fundoplication, hernioplasty, resection of the sigmoid colon and rectopexy were randomly assigned to warm or cold gas groups. Core temperature, cardiac index, urine output and recovery room opioid usage and pain scores were recorded.
Champion 2006: was a trial of heated, humidified versus cold dry CO2 insufflation for laparoscopic gastric bypass, which examined 50 consecutive obese patients with homogeneous baseline characteristics (gender, age, preoperative weight, body mass index (BMI) and c‐reactive protein (CRP)) between groups. The ambient insufflation gas was at a temperature of 35 °C and 95% relative humidity. The sole difference identified in the heated group was a lower postoperative subjective shoulder pain score at 18 hours. There were no differences between groups in intraoperative core temperature, operating room temperature, litres of insufflation, operating time, number of lens cleanings, recovery room temperature, narcotic usage, length of hospitalisation, high‐sensitivity CRP at 24 hours or abdominal pain scores.
Davis 2006: with adequate allocation concealment, this study examined 44 laparoscopic Roux‐en‐Y gastric bypass patients in Ohio State University. There were four study groups with 11 participants in each and similar baseline characteristics across the groups. The groups included the following insufflation techniques: 1) cold dry, 2) cold humidified (97% relative humidity), 3) heated dry (37 °C) and 4) heated humidified (37 °C and 97% relative humidity) CO2. There were no differences in patient core temperature, intra‐abdominal humidity, postoperative narcotic usage, pain scale scores, recovery room time, length of hospitalisation, lens fogging or macrophage activity between groups, though participants in the heated, humidified insufflation group demonstrated increased macrophage activity in biopsies.
Demco 2001: 40 women undergoing diagnostic laparoscopy were randomised to heated, humidified insufflation or cold CO2. Outcomes were shoulder pain, fentanyl use, percent requiring general anaesthetic, percent requiring intravenous sedation, amount of gas instilled before experiencing pain, operating time, recovery room time and time to recovery of shoulder pain. Outcomes were presented as percentages of participants in various groups (e.g. operative time more than 10 minutes, 10 to 20 minutes, etc.), which could not be included in meta‐analysis.
Farley 2004: with adequate allocation concealment, randomised 101 people undergoing laparoscopic cholecystectomy to either cold or heated and humidified CO2 insufflation. The experimental group showed higher intraoperative core temperatures and decreased postoperative pain scores at day 14; the study authors questioned the clinical relevance of the latter outcome. They identified no differences in the rate of lens fogging, narcotic requirements, length of hospitalisation or time of return to baseline activity levels.
Hamza 2005: randomised 50 people undergoing laparoscopic Roux‐en‐Y gastric bypass surgery, with no information on allocation concealment, to cold or heated and humidified CO2 insufflation. Six were excluded. Mean operative times for each group were greater than 120 min. The heated group showed a higher intraoperative core temperature, a reduction in time in the recovery room and narcotic requirements, and a higher quality of recovery at 48 hours postoperatively. There were no differences in postoperative tympanic membrane temperatures, pain scores, shivering, overall morphine usage, nausea scores, Aldrete recovery assessment scores, length of hospital stay or lens fogging.
Kissler 2004: recruited 90 consecutive women scheduled for gynaecologic laparoscopic surgery into this study with randomisation to heated humidified, heated non‐humidified and cold gas insufflation groups, each with 30 participants. The trial was stopped following enrolment of 53 participants due to a tendency for less pain and higher postoperative satisfaction in the cold insufflation control group.
Klugsberger 2014: randomised 148 people undergoing laparoscopic cholecystectomy to standard gas or warmed, humidified gas groups. Intraoperative core temperature was significantly higher with less six‐hour postoperative pain in the warmed, humidified gas group. Pain was not significantly different on the first day after operation.
Lee 2011: randomised 30 people undergoing laparoscopic low anterior resection, colectomy or gastrectomy to heated CO2 or standard CO2 groups. Mean operative times were greater than 200 minutes for each cohort. They recorded acid‐base parameters and core temperature. Heated CO2 did not significantly change acid‐base parameters in participants but reduced the decrease in core body temperature 30 minutes after pneumoperitoneum.
Manwaring 2008: randomised 60 gynaecology patients to heated humidified or cold insufflation groups. Heated and humidified gas insufflation was not associated with any significant benefits as no difference was found in oesophageal temperature, pain scores or narcotic usage.
Mouton 1999): randomised 40 people undergoing cholecystectomy to heated, humidified insufflation or cold gas insufflation. Eight were excluded. Though they found no difference in core temperature during the relatively brief operations, there was significantly less pain compared to the experimental heated and humidified insufflation participants at six hours and on the first to third days postoperatively. Pain was also less on the 14th postoperative day.
Nelskyla 1999: randomised 40 women undergoing laparoscopic hysterectomy to heated or unheated gas insufflation groups. Three were excluded. Tympanic and nasopharyngeal intraoperative temperatures were not different between the groups.
Nguyen 2002: randomised 20 people undergoing laparoscopic Nissen fundoplication, without information on the allocation method, to heated and humidified or cold and dry gas insufflation groups. There were no differences in core temperature, pain scores, narcotic consumption, urine output or lens fogging.
Ott 1998: without stating the number of participants in each group, this study randomised 72 women undergoing laparoscopic gynaecologic surgery to heated and humidified or cold and dry gas insufflation. Most data was extracted from a systematic review (Sammour 2008) and was only available for 50 patients with no reason was given. The experimental heated group showed improved intraoperative normothermia and postoperative pain, and reduced recovery room stay.
Puttick 1999: randomised 30 people undergoing laparoscopic cholecystectomy to heated or cold gas insufflation. The study authors concluded that intraoperative cooling could be prevented by heating the insufflated gas.
Saad 2000: randomised 20 people undergoing laparoscopic cholecystectomy to heated or cold gas insufflation with no effects when comparing core temperature or postoperative pain. VAS pain scores were converted from a 0 to 100 scale to a standard 0 to 10 scale.
Sammour 2010: randomised 82 people undergoing laparoscopic colon surgery to heated, humidified or cold gas insufflation groups, each with 41 participants. Eight patients were excluded. They found no significant effects, including no effect on the early postoperative inflammatory cytokine response. Mean operative times were greater than 170 minutes for both cohorts.
Savel 2005: randomised 30 people undergoing laparoscopic Roux‐en‐Y gastric bypass to cold or heated and humidified gas insufflation groups. Length of hospitalisation and operative time were reduced in the experimental group but the study found no differences in pain sensation.
Slim 1999: enrolled 100 people undergoing laparoscopic cholecystectomy, fundoplication, or Heller's myotomy and randomised them to cold or heated insufflation. Shoulder and subcostal pain sensation was increased in the heated insufflation group and the study found no difference on core temperature or narcotic consumption.
Wills 2001: randomised 41 people to heated or cold gas insufflation during laparoscopic fundoplication. One was excluded. An increased core temperature was associated with the heated insufflation group, though the control group participants suffered less postoperative pain and required fewer narcotics. VAS pain scores were converted from a 0 to 100 scale to a standard 0 to 10 scale.
Yu 2013: randomised 195 children undergoing laparoscopic appendectomy to warm, humidified CO2 or standard CO2 groups. Five were excluded. The study assessed postoperative opioid usage, pain intensity, postoperative recovery and return to normal activities. Warm, humidified CO2 insufflation had no short‐term clinical benefits on postoperative outcomes in children.
Excluded studies
We excluded Beste 2006 and Benavides 2009 from this review because they compared heated, humidified CO2 with heated, non‐humidified CO2, a comparison not intended for this review. However, they were included in two previously published systematic reviews (Sajid 2008; Sammour 2008). Herrmann 2015 we excluded because it assessed laparoscopic‐assisted vaginal hysterectomies which is not primarily an abdominal, laparoscopic surgery. We excluded the remaining studies because they were not RCTs. Excluded studies were excluded from both quantitative and qualitative analyses. See section on Characteristics of excluded studies for details.
Risk of bias in included studies
We assessed risk of bias for all included studies (Figure 2; Figure 3). Eleven studies had an overall low risk of bias (low risk of bias for the six main criteria assessed) in the presentation of their results (Champion 2006; Davis 2006; Farley 2004; Hamza 2005; Lee 2011; Manwaring 2008; Nguyen 2002; Sammour 2010; Slim 1999; Wills 2001; Yu 2013).
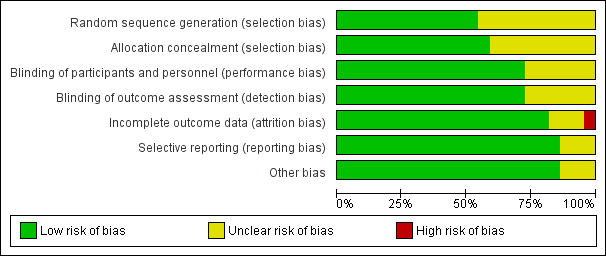
Risk of bias graph: review authors' judgements about each risk of bias item presented as percentages across all included studies
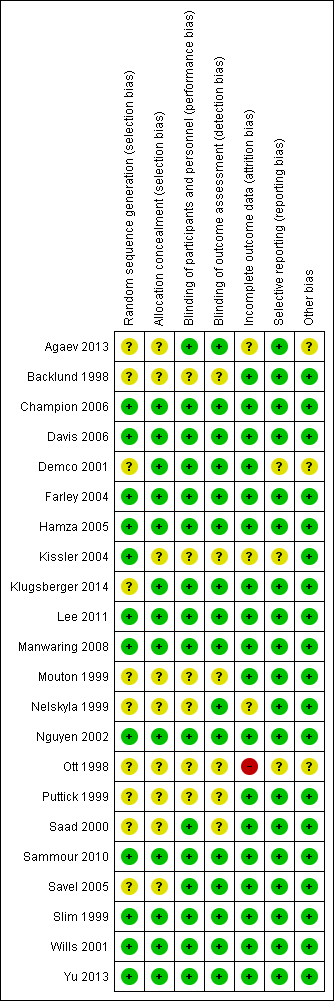
Risk of bias summary: review authors' judgements about each risk of bias item for each included study
Allocation
We rated 11 studies at unclear risk of bias, with nine of these studies (Backlund 1998; Demco 2001; Kissler 2004; Mouton 1999; Nelskyla 1999; Ott 1998; Puttick 1999; Saad 2000; Savel 2005) failing to report on the methodology for randomisation or allocation concealment. Agaev 2013 stated that randomisation was done with a computer model post‐anaesthetic, but comparative groups were very uneven with 84 in the heated group and 66 in non‐heated. Klugsberger 2014 was unclear about randomisation and also had uneven groups (67 in heated and 81 in non‐heated).
Blinding
We judged five studies (Backlund 1998; Mouton 1999; Ott 1998; Puttick 1999; Saad 2000) at unclear risk of bias because they had no description of blinding. The remaining studies were adequately blinded with only one or two operating‐room personnel unblinded to initiate the intervention.
Incomplete outcome data
We deemed three studies an unclear risk of attrition bias. Agaev 2013 did not state the number of participants included in their analysis. Kissler 2004 was stopped early because the control group had less pain and improved satisfaction. Nelskyla 1999 excluded three participants without clear reasoning. Ott 1998 reported data on only 55 of 72 participants and did not state a reason for this missing data. This was assessed a high risk of bias.
Selective reporting
Demco 2001 did not report any core temperatures which would be expected from a study on heated insufflation. Klugsberger 2014 and Slim 1999 reported mean core temperatures but did not report on intraoperative changes in core temperature. However, Slim 1999 only measured subdiaphragmatic core temperatures once during the operation so this is not due to selective reporting.
Other potential sources of bias
Agaev 2013, originally published in Russian, was translated voluntarily by a research scientist employed by a surgical humidification device company. We deemed this an unclear risk of bias due to a possible conflict of interest. Many studies (Agaev 2013; Backlund 1998; Champion 2006; Davis 2006; Hamza 2005; Kissler 2004; Lee 2011; Mouton 1999; Nguyen 2002; Ott 1998; Saad 2000; Savel 2005; Wills 2001) were also missing standard deviations and this potentially distorted the true effects and potentially increased the error.
Demco 2001 did not report any baseline demographics, while Ott 1998 did not separate demographics between groups and potential imbalances in participant characteristics could have contributed to bias.
Industry supported eight trials by providing heated insufflation devices (Backlund 1998; Farley 2004; Kissler 2004; Manwaring 2008; Nelskyla 1999; Savel 2005; Wills 2001). Two trials received educational grants from industry (Davis 2006; Hamza 2005) and one trial reported industry assistance (Mouton 1999). We judged this a low risk of bias as there appeared to be no industry influence in the trials with industry support.
Effects of interventions
See: Summary of findings for the main comparison Core temperature; Summary of findings 2 Pain score; Summary of findings 3 Morphine consumption; Summary of findings 4 Hospital stay; Summary of findings 5 Recovery time; Summary of findings 6 Lens fogging; Summary of findings 7 Operative time
Primary outcome
Change in core temperature
(Analysis 1.1; Analysis 1.2; Analysis 1.3)
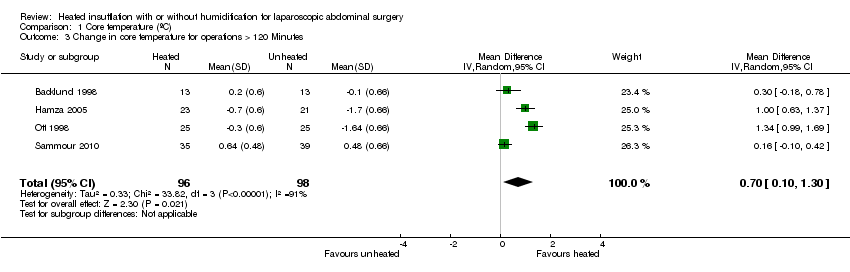
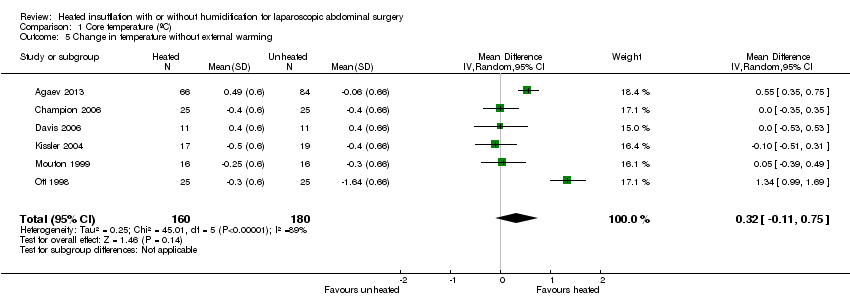
Nineteen studies reported change in intraoperative core temperatures. Overall, core temperature was slightly higher with heated CO2 (MD 0.21 °C, 95% CI 0.06 to 0.36, P = 0.007) (Figure 4). Heterogeneity was substantial (I2 = 86%), therefore subgroup analyses were performed for humidified and non‐humidified CO2. Heated gas with humidification had a small, but positive effect on core temperature intraoperatively compared to cold CO2 (MD 0.31 °C, 95% CI 0.09 to 0.53, P = 0.005) (Figure 4). When only studies with low risk of bias were assessed, this effect became statistically non‐significant (Figure 5). No apparent effect was found in the non‐humidified, heated‐gas group compared to cold gas, regardless of analysis based on all studies or only low‐risk studies. A subgroup analyses for operations lasting less and more than 120 minutes were also performed. There was no difference detected in temperature between heated and cold CO2 for operations lasting less than 120 minutes. However, for operations lasting over 120 minutes (Backlund 1998; Hamza 2005; Ott 1998; Sammour 2010), temperature was significantly higher with warming and humidification, but the studies exhibited significant statistical heterogeneity (I2 = 91%) (Figure 6). When subgroup analyses of studies using external warming were conducted, core temperatures were significantly higher in the heated, humidified group (MD 0.29 °C, 95% CI 0.05 to 0.52) (Figure 7); but the studies were once again statistically heterogenous (I2 = 84%). The only trial with a known low risk of bias (Savel 2005) showed no statistically significant difference between groups, however, with only 30 participants, such a small trial would unlikely be adequately powered to detect a difference between groups even if one was present (Figure 7). When only trials not using external warming were analysed, heated, humidified gas had no apparent effect on core temperature compared to cold gas. (Figure 8).

Forest plot of comparison: 2 Core temperature, outcome: 2.1 Change in core temperature

Forest plot of comparison: 2 Core temperature, outcome: 2.2 Change in core temperature for low risk of bias studies

Forest plot of comparison: 1 Core temperature, outcome: 1.5 Change in core temperature in heated, humidified vs cold groups with OR > 120 Minutes
Forest plot of comparison: 2 Core temperature, outcome: 2.3 Change in core temperature in heated, humidified vs cold groups with external warming

Forest plot of comparison: 1 Core temperature, outcome: 1.4 Change in temperature in heated, humidified vs cold groups without external warming
Secondary outcomes
Pain scores
(Analysis 2.1; Analysis 2.2; Analysis 2.3; Analysis 2.4)
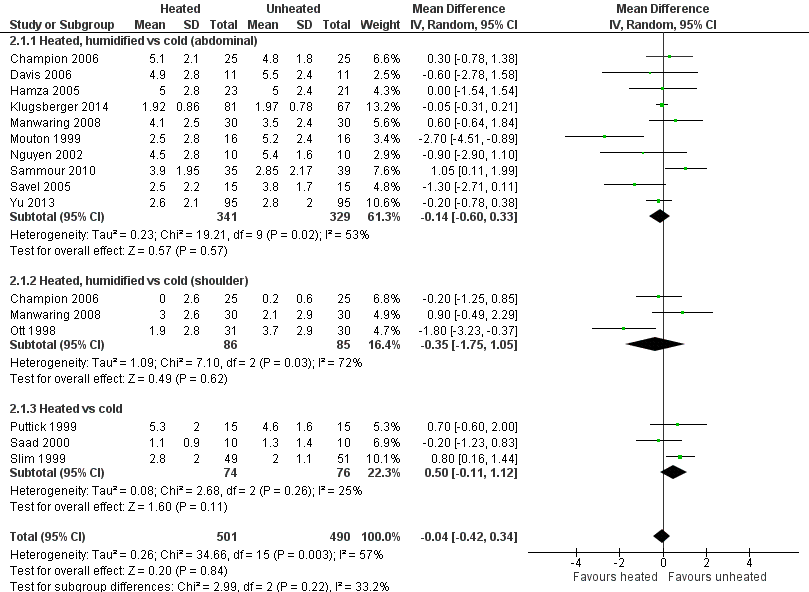
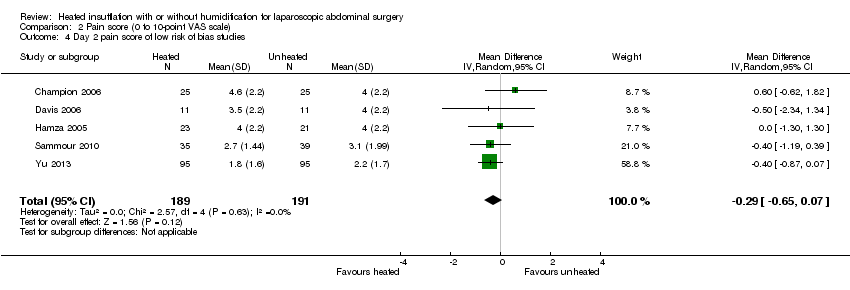
For pain scores (measured using a 0 to 10 visual analogue scale), there was no statistically significant difference detected between groups overall on day 1 (MD ‐0.04, 95% CI ‐0.42 to 0.34) or day 2 (MD ‐0.28, 95% CI ‐0.78 to 0.21). Subgroup analyses were performed for the effect of humidified CO2 and non‐humidified CO2, on shoulder and abdominal pain separately, and for heated only versus cold CO2 (not by location of pain).
Day 1
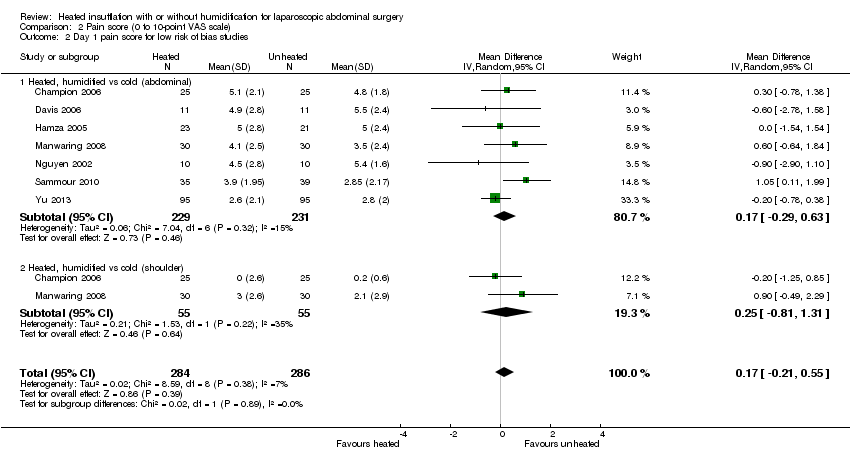
The effect of heated and humidified gas on postoperative day one showed no statistically significant difference compared to cold gas (abdominal pain MD ‐0.14, 95% CI ‐0.60 to 0.33, P = 0.57; shoulder pain MD ‐0.35, 95% CI ‐1.75 to 1.05, P = 0.62) (Figure 9). Given the significant heterogeneity across studies (abdominal P = 0.02, I2 = 53%; shoulder P = 0.03, I2 = 72%), sensitivity analyses were performed and only studies with a known low risk of bias were included. The pain scores were still apparently not different with respect to either abdominal or shoulder pain and the test of heterogeneity was no longer statistically significant (abdominal P = 0.32, I2 = 15%; shoulder P = 0.22, I2 = 35%) (Figure 10). When heated only gas was compared to cold gas, the day‐one pain scores were not statistically significantly different (Figure 9).
Forest plot of comparison: 1 Pain score, outcome: 1.1 Day 1 pain score

Forest plot of comparison: 1 Pain score, outcome: 1.3 Day 1 pain score for low risk of bias study
Day 2
For pain on the second postoperative day, heated and humidified gas did not apparently improve abdominal or shoulder pain (abdominal MD ‐0.40, 95% CI ‐1.07 to 0.28, P = 0.25; shoulder MD ‐0.88, 95% CI ‐2.93 to 1.17, P = 0.40), but again, the studies were heterogenous (I2 62% and 92%, respectively) (Figure 11). When only low risk of bias studies were included, the conclusion remained unchanged (Figure 12) and I2 decreased to 0%. With heated only gas, the postoperative day‐two pain score was similar to the cold gas control (MD 0.41, 95% CI ‐0.44 to 1.27, P = 0.34) with no statistically significant heterogeneity across trials (P = 0.23, I2 = 33%).

Forest plot of comparison: 1 Pain score, outcome: 1.2 Day 2 pain score

Forest plot of comparison: 1 Pain score, outcome: 1.4 Day 2 pain score of low risk of bias studies
Morphine consumption
(Analysis 3.1; Analysis 3.2; Analysis 3.3)
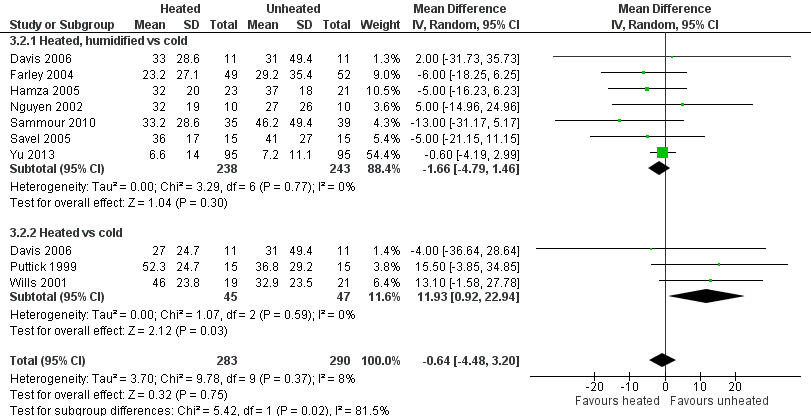
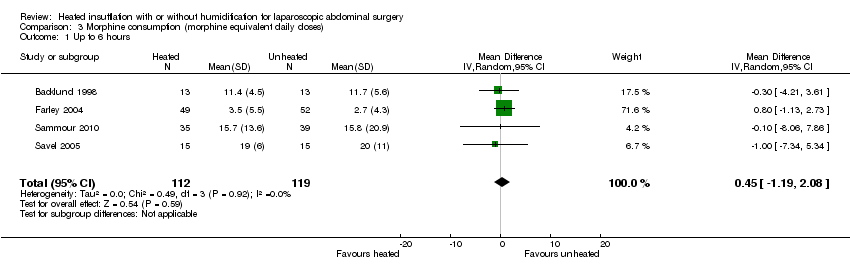
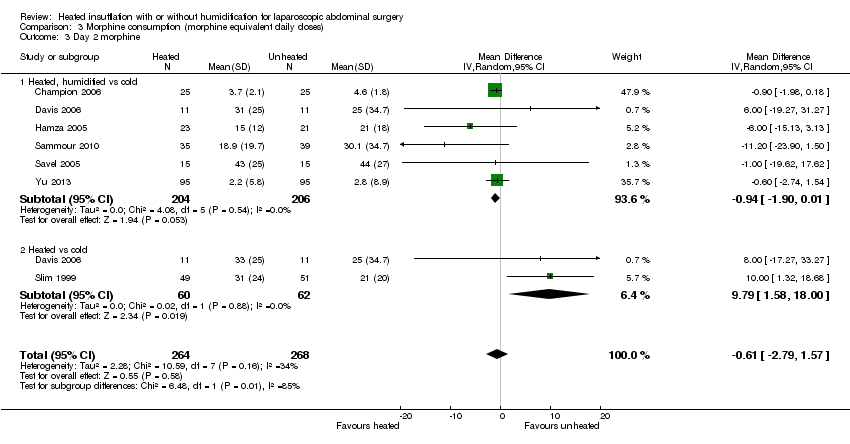
Four studies comparing heated and humidified CO2 with cold CO2 insufflation reported no statistically significant difference in morphine consumption up to six hours post‐operatively between groups (MD 0.45 mg, 95% CI ‐1.19 to 2.08, P = 0.59) (Figure 13). Heterogeneity was not statistically significant across studies (I2 = 0%). Morphine use on the first postoperative day was not significantly different either overall (MD ‐0.64 mg, 95% CI ‐4.48 to 3.20), or when CO2 was heated and humidified (MD ‐1.66 mg, 95% CI ‐4.79 to 1.46, P = 0.30), but was higher when CO2 was heated without humidification (MD 11.93 mg, 95% CI 0.92 to 22.94, P = 0.03) (Figure 14). A similar pattern was observed for the second postoperative day, where there was no difference overall or with humidification, but was higher with heated, non‐humidified CO2 (MD 9.79 mg, 95% CI 1.58 to 18.00, P = 0.02) (Figure 15).
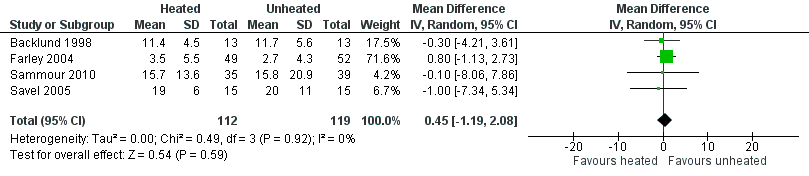
Forest plot of comparison: 3 Morphine consumption, outcome: 3.1 Up to 6 hours

Forest plot of comparison: 3 Morphine consumption, outcome: 3.2 Day 1 morphine

Forest plot of comparison: 3 Morphine consumption, outcome: 3.3 Day 2 morphine
Hospital stay
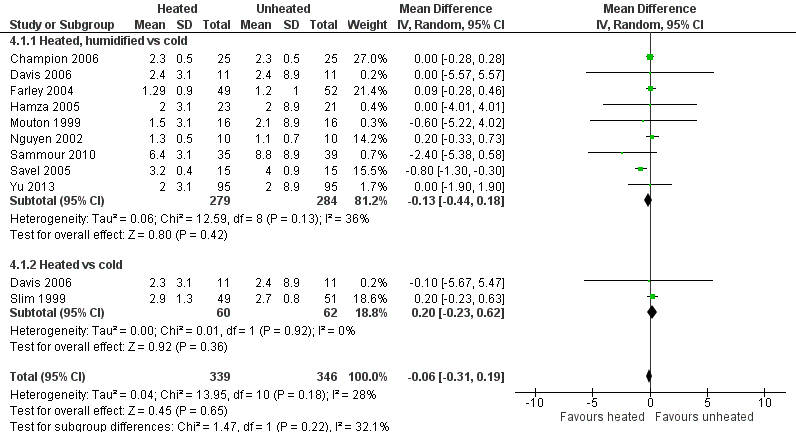
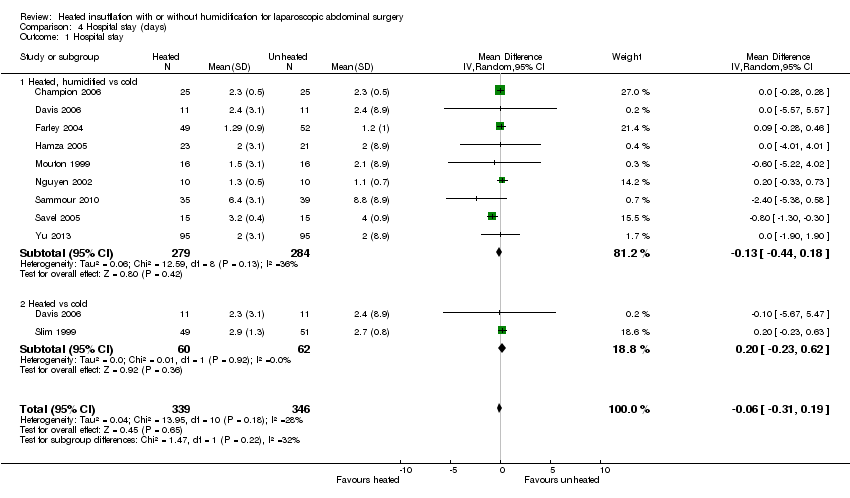
Length of stay in hospital was not different between the heated (with or without humidification) and cold gas insufflation groups (MD ‐0.06 days, 95% CI ‐0.31 to 0.19, P = 0.65) (Figure 16). There was no statistically significant heterogeneity across studies (I2 = 28%).

Forest plot of comparison: 4 Hospital stay, outcome: 4.1 Hospital stay
Recovery room stay
Recovery room time was documented in six studies and there was substantial heterogeneity among them (I2 = 95%). Shorter recovery time (MD ‐26.79 minutes, 95% CI ‐51.34 to ‐2.25, P = 0.03) was found with heated insufflation (Figure 17). With exclusion of the only high risk study (Ott 1998), the studies were statistically homogenous (I2 =12%) but the difference in recovery room stay was statistically not significant (MD ‐1.22 minutes, 95% CI ‐6.62 to 4.17, P = 0.44) (Figure 18).

Forest plot of comparison: 7 Recovery room stay, outcome: 7.1 Recovery time

Forest plot of comparison: 7 Recovery room stay, outcome: 7.2 Recovery time for low risk of bias studies
Lens fogging
Evidence of substantial heterogeneity was present (I2 = 78%) and no significant difference in the lens fogging scores was shown (MD 0.73, 95% CI ‐0.32 to 1.77, P = 0.17) (Figure 19).
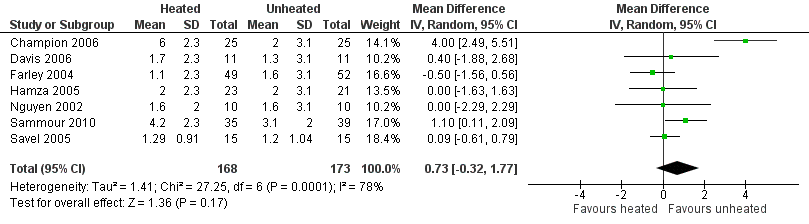
Forest plot of comparison: 5 Lens fogging, outcome: 5.1 Lens fogging
Operative time
Twenty studies reported their mean operative time; no evidence of statistically significant heterogeneity was found (I2 = 28%). The mean operative time was similar across groups (MD ‐0.44 minutes, 95% CI ‐3.91 to 3.04, P = 0.81) (Figure 20). Subgroup analyses on humidified and non‐humidified subgroups did not change the results.

Forest plot of comparison: 6 Operative time, outcome: 6.1 Operative time
Adverse events
The majority of included studies did not report on adverse events (Table 3). There were a total of twelve major adverse events with six in the heated group and six in the cold group.
Discussion
Controversy exists on the use of heated CO2 insufflation during laparoscopic surgery. Laparoscopic procedures already demand higher operating expenses than conventional open techniques (Janson 2004) and the addition of further complex equipment only increases this limitation. In 2002, the European Association for Endoscopic Surgery published consensus guidelines for laparoscopic pneumoperitoneum and stated that, "the clinical benefits of warmed humidified insufflation gas are minor and contradictory" (Neudecker 2002).
Summary of main results
Evidence based on the 22 RCTs in this systematic review failed to demonstrate definitive evidence for the use of heated CO2 insufflation during laparoscopic abdominal surgery. While heated and humidified gas insufflation leads to slightly higher core body temperatures, these studies are quite heterogeneous and patient outcomes were not improved with respect to pain scores, morphine consumption and hospital length of stay. For longer operative cases (more than 120 minutes), heated gas is associated with improved core temperatures during surgery. However, these benefits disappeared when the analysis only included trials with a known low risk of bias.
Among the 11 trials at a known low risk of bias included in the review, only one study demonstrated both improved maintenance of normothermia, as well as a reduction in analgesic use in the early postoperative period (Hamza 2005). In this study, external warming blankets were used solely as a 'rescue' treatment, potentially confounding the effect of the experimental intervention. Another study reported higher intraoperative core temperatures (Farley 2004) and improved postoperative pain but no differences in other outcomes. One heated, non‐humidified gas insufflation study reported increased core temperatures but with higher operative pain scores and narcotics usage (Wills 2001). The remaining eight known low risk of bias studies did not find any beneficial effect for the intervention in terms of maintaining normothermia. The heterogeneity in core temperature outcomes across studies may be secondary to minor protocol differences between studies such as different insufflation gas temperatures (35 ºC to 37 ºC), humidity ranges (88% to 100%), gas volumes and location of the temperature probe.
Overall completeness and applicability of evidence
All 22 RCTs included in this review compared heated CO2 with cold CO2 insufflation. The majority (19 RCTs, n = 1100) reported the primary outcome, change in core temperature. Fifteen studies (n = 925) included humidified insufflation and ten studies (n = 617) used external warming. This allowed for various subgroup analyses on different modalities of heated insufflation and helps to determine whether changes such as humidification and external warming have any effect. The review also included a broad range of laparoscopic surgeries including cholecystectomy, gastric bypass, gynaecological, gastrectomy, colectomy, low anterior resection and fundoplication, proving its applicability to many different laparoscopic abdominal surgeries. However, this variability may have contributed to the heterogeneity of the results.
The majority of participants were 30 to 60 years old and were female, as some studies only included women. Few of the studies included participants more than 60 years old and results may not be generalisable to an older population, who may be at higher risk of hypothermia (Macario 2002). Additionally, only one study (Yu 2013) enrolled primarily adolescents, who are at higher risk of intraoperative hypothermia given their higher surface area to body mass. This risk is particularly high in neonatal populations (Macario 2002), who were not studied in any trial included in this review.
Quality of the evidence
The results of this review should be interpreted cautiously due to some limitations. Although the studies were all randomised controlled trials and applicable to the research question, some lacked design information making evaluation of study quality difficult. Many of the studies included small sample sizes, which made individual inferences difficult regarding the attribution of effects to random error or the heated insufflation intervention. This also affects precision of the results. The standard deviations used for meta‐analysis were missing from some studies and the largest standard deviation from that group was used instead. This potentially distorts the true effects and potentially increases error. Finally, some heterogeneity across studies could not be explained through subgroup analysis, and the results from studies were often inconsistent. Specifically, conclusions on the effectiveness of heated CO2 on core temperature is downgraded as heterogeneity remained significant despite subgroup analysis. See summary of findings Table for the main comparison.
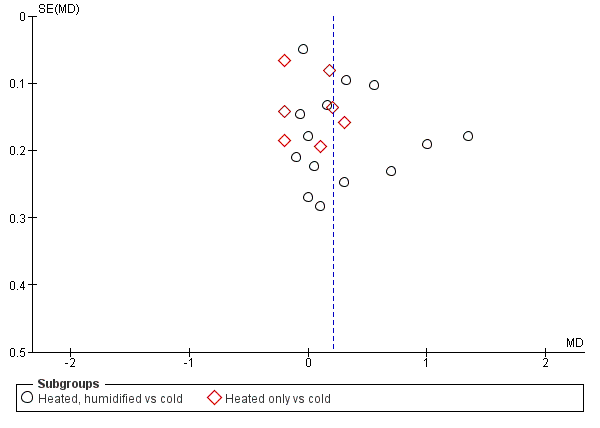
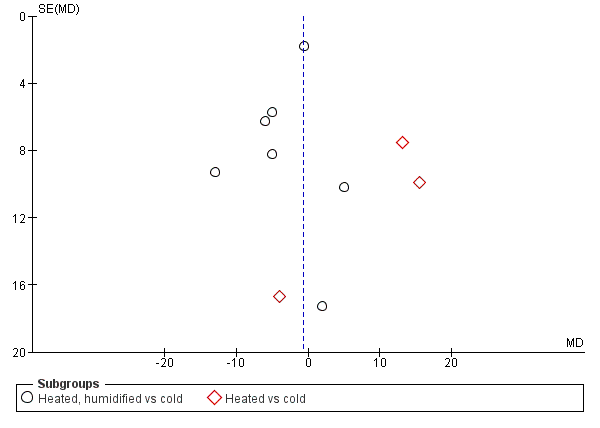
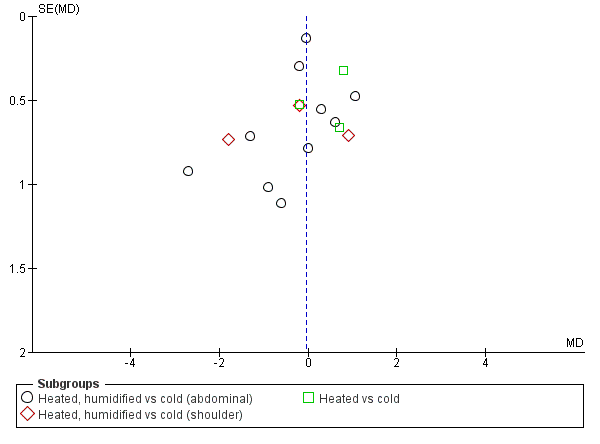
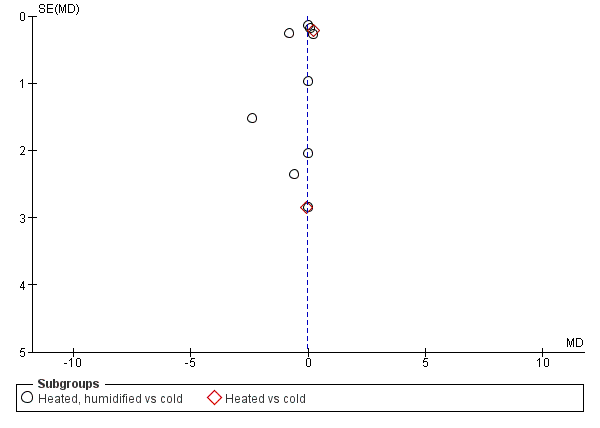
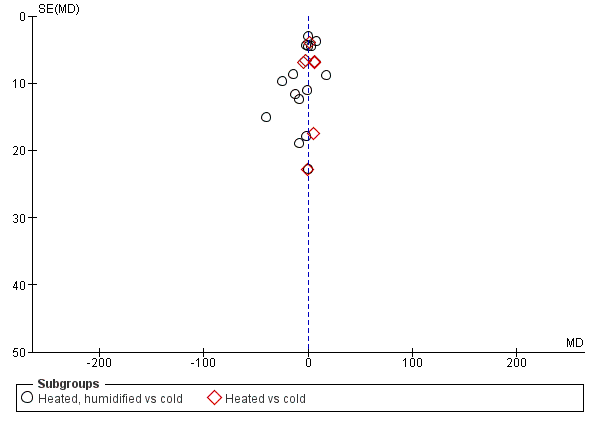
We also assessed publication bias for each outcome with funnel plots and Egger's linear regression test (Egger 1997) and we found no publication bias (Figure 21; Figure 22; Figure 23; Figure 24; Figure 25). We performed Egger's test on outcomes that included data from at least 10 trials: core temperature change (P = 0.697, 95% CI ‐4.26 to 2.94), day one pain score (P = 0.347, 95% CI ‐3.98 to 1.57), operating time (P = 0.662, 95% CI ‐0.41 to 0.63), day one morphine (P = 0.917, 95% CI ‐1.58 to 1.72) and length of stay (P = 0.477, 95% CI ‐3.38 to 1.75).
Funnel plot of comparison: 2 Core temperature, outcome: 2.1 Change in core temperature

Funnel plot of comparison: 1 Pain Score, outcome: 1.1 Day 1 pain score
Funnel plot of comparison: 3 Morphine consumption, outcome: 3.2 Day 1 morphine

Funnel plot of comparison: 4 Hospital stay, outcome: 4.1 Hospital stay

Funnel plot of comparison: 6 Operative time, outcome: 6.1 Operative time
Potential biases in the review process
We could not identify any potential biases in the review process.
Agreements and disagreements with other studies or reviews
Two previously published meta‐analyses revealed different conclusions from the current review (Sajid 2008; Sammour 2008). Both provided evidence for a reduction in postoperative pain and Sajid 2008 also demonstrated improved maintenance of core temperature and decreased narcotic requirements. The current review incorporates a greater number of studies in the analysis, including six recent trials showing equivocal results with heated insufflation compared to cold gas insufflation (Agaev 2013; Klugsberger 2014; Lee 2011; Manwaring 2008; Sammour 2010; Yu 2013). Finally, one study (Beste 2006) included in the previous reviews compared heated insufflation with humidification to heated insufflation without humidification, a comparison not in keeping with the aims of the current review and therefore excluded.
Study flow diagram

Risk of bias graph: review authors' judgements about each risk of bias item presented as percentages across all included studies

Risk of bias summary: review authors' judgements about each risk of bias item for each included study

Forest plot of comparison: 2 Core temperature, outcome: 2.1 Change in core temperature

Forest plot of comparison: 2 Core temperature, outcome: 2.2 Change in core temperature for low risk of bias studies
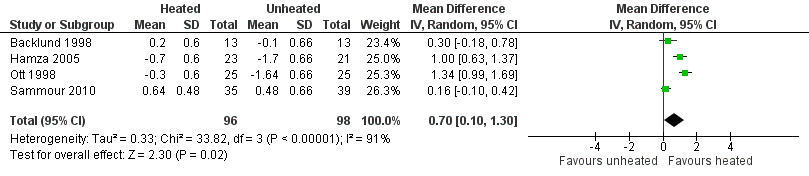
Forest plot of comparison: 1 Core temperature, outcome: 1.5 Change in core temperature in heated, humidified vs cold groups with OR > 120 Minutes

Forest plot of comparison: 2 Core temperature, outcome: 2.3 Change in core temperature in heated, humidified vs cold groups with external warming

Forest plot of comparison: 1 Core temperature, outcome: 1.4 Change in temperature in heated, humidified vs cold groups without external warming

Forest plot of comparison: 1 Pain score, outcome: 1.1 Day 1 pain score

Forest plot of comparison: 1 Pain score, outcome: 1.3 Day 1 pain score for low risk of bias study
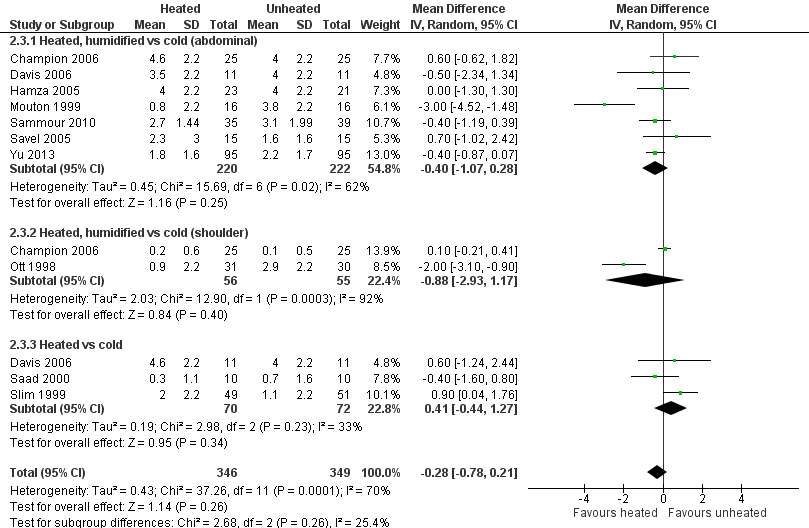
Forest plot of comparison: 1 Pain score, outcome: 1.2 Day 2 pain score

Forest plot of comparison: 1 Pain score, outcome: 1.4 Day 2 pain score of low risk of bias studies

Forest plot of comparison: 3 Morphine consumption, outcome: 3.1 Up to 6 hours
Forest plot of comparison: 3 Morphine consumption, outcome: 3.2 Day 1 morphine

Forest plot of comparison: 3 Morphine consumption, outcome: 3.3 Day 2 morphine
Forest plot of comparison: 4 Hospital stay, outcome: 4.1 Hospital stay

Forest plot of comparison: 7 Recovery room stay, outcome: 7.1 Recovery time

Forest plot of comparison: 7 Recovery room stay, outcome: 7.2 Recovery time for low risk of bias studies

Forest plot of comparison: 5 Lens fogging, outcome: 5.1 Lens fogging

Forest plot of comparison: 6 Operative time, outcome: 6.1 Operative time

Funnel plot of comparison: 2 Core temperature, outcome: 2.1 Change in core temperature
Funnel plot of comparison: 1 Pain Score, outcome: 1.1 Day 1 pain score

Funnel plot of comparison: 3 Morphine consumption, outcome: 3.2 Day 1 morphine
Funnel plot of comparison: 4 Hospital stay, outcome: 4.1 Hospital stay
Funnel plot of comparison: 6 Operative time, outcome: 6.1 Operative time
Comparison 1 Core temperature (ºC), Outcome 1 Change in core temperature.

Comparison 1 Core temperature (ºC), Outcome 2 Change in core temperature for low risk of bias studies.
Comparison 1 Core temperature (ºC), Outcome 3 Change in core temperature for operations > 120 Minutes.

Comparison 1 Core temperature (ºC), Outcome 4 Change in core temperature with external warming.
Comparison 1 Core temperature (ºC), Outcome 5 Change in temperature without external warming.

Comparison 2 Pain score (0 to 10‐point VAS scale), Outcome 1 Day 1 pain score.
Comparison 2 Pain score (0 to 10‐point VAS scale), Outcome 2 Day 1 pain score for low risk of bias studies.

Comparison 2 Pain score (0 to 10‐point VAS scale), Outcome 3 Day 2 pain score.
Comparison 2 Pain score (0 to 10‐point VAS scale), Outcome 4 Day 2 pain score of low risk of bias studies.
Comparison 3 Morphine consumption (morphine equivalent daily doses), Outcome 1 Up to 6 hours.

Comparison 3 Morphine consumption (morphine equivalent daily doses), Outcome 2 Day 1 morphine.
Comparison 3 Morphine consumption (morphine equivalent daily doses), Outcome 3 Day 2 morphine.
Comparison 4 Hospital stay (days), Outcome 1 Hospital stay.

Comparison 5 Recovery room stay (minutes), Outcome 1 Recovery time.

Comparison 5 Recovery room stay (minutes), Outcome 2 Recovery time for low risk of bias studies.

Comparison 6 Lens fogging, Outcome 1 Times cleaned.

Comparison 7 Operative time (minutes), Outcome 1 Operative time.
| Heated CO2 with or without humidification for laparoscopic abdominal surgery | |||||
| Patient or population: Laparoscopic abdominal surgery (core temperature) | |||||
| Outcomes | Anticipated absolute effects* (95% CI) | № of participants | Quality of the evidence | Comments | |
| Risk with cold gas | Risk with heated gas | ||||
| Change in core temperature (ºC) | The mean change in core temperature was ‐0.22 °C | The mean change in core temperature in the intervention group was 0.21 °C higher (0.06 to 0.36) | 1100 | ⨁⨁◯◯ | Negative temperature indicates core temperature dropped during surgery |
| Change in core temperature: heated, humidified vs cold | The mean change in core temperature: heated, humidified vs cold was ‐0.25 °C | The mean change in core temperature: heated, humidified vs cold in the intervention group was 0.31 °C higher (0.09 to 0.53) | 885 | ⨁⨁◯◯ | |
| Change in core temperature: heated only vs cold | The mean change in core temperature: heated vs cold was ‐0.19 °C | The mean change in core temperature: heated vs cold in the intervention group was 0.02 °C higher (‐0.16 to 0.20) | 215 | ⨁⨁◯◯ | |
| Change in core temperature for known low risk of bias studies | The mean change in core temperature for low risk of bias studies was ‐0.10 °C | The mean change in core temperature for low risk of bias studies in the intervention group was 0.16 °C higher (‐0.01 to 0.33) | 653 | ⨁⨁⨁◯ | |
| Change in core temperature for known low risk of bias studies: heated, humidified vs cold | The mean change in core temperature for low risk of bias studies: heated, humidified vs cold was ‐0.09 °C | The mean change in core temperature for low risk of bias studies: heated, humidified vs cold in the intervention group was 0.18 °C higher (‐0.04 to 0.39) | 561 | ⨁⨁⨁◯ | |
| Change in core temperature for low risk of bias studies: heated only vs cold | The mean change in core temperature for low risk of bias studies: heated vs cold was ‐0.10 °C | The mean change in core temperature for low risk of bias studies: heated vs cold in the intervention group was 0.12 °C higher (‐0.15 to 0.39) | 92 | ⨁⨁⨁◯ | |
| Change in core temperature with external warming | The mean change in core temperature with external warming was ‐0.14 °C | The mean change in core temperature with external warming in the intervention group was 0.29 °C higher (0.05 to 0.52) | 545 | ⨁⨁⨁◯ | |
| Change in core temperature without external warming | The mean change in core temperature without external warming was ‐0.40 °C | The mean change in core temperature without external warming in the intervention group was 0.32 °C higher (‐0.11 to 0.75) | 340 | ⨁⨁⨁◯ | |
| Change in core temperature for operations > 120 min | The mean change in core temperature for operations > 120 min was ‐0.74 °C | The mean change in core temperature for operations > 120 min in the intervention group was 0.70 °C higher (0.10 to 1.30) | 194 | ⨁⨁⨁◯ | |
| *The risk in the intervention group (and its 95% confidence interval) is based on the assumed risk in the comparison group and the relative effect of the intervention (and its 95% CI). | |||||
| GRADE Working Group grades of evidence | |||||
|
| |||||
| Heated CO2 with or without humidification for laparoscopic abdominal surgery | |||||
| Patient or population: Laparoscopic abdominal surgery (pain score) | |||||
| Outcomes | Anticipated absolute effects* (95% CI) | № of participants | Quality of the evidence | Comments | |
| Risk with cold gas | Risk with heated gas | ||||
| Day 1 pain score (0 to 10‐point VAS) | The mean day 1 pain score was 2.8 | The mean day 1 pain score in the intervention group was 0.04 fewer (‐0.42 to 0.34) | 991 | ⨁⨁◯◯ | Higher score indicates more pain for participants |
| Day 1 pain score: heated, humidified vs cold (abdominal) | The mean day 1 pain score: heated, humidified vs cold (abdominal) was 4 | The mean day 1 pain score: heated, humidified vs cold (abdominal) in the intervention group was 0.14 fewer (‐0.6 to 0.33) | 670 | ⨁⨁◯◯ | |
| Day 1 pain score: heated, humidified vs cold (shoulder) | The mean day 1 pain score: heated, humidified vs cold (shoulder) was 2 | The mean day 1 pain score: heated, humidified vs cold (shoulder) in the intervention group was 0.35 fewer (‐1.75 to 1.05) | 171 | ⨁◯◯◯ | |
| Day 1 pain score: heated only vs cold | The mean day 1 pain score: heated vs cold was 2.8 | The mean day 1 pain score: heated vs cold in the intervention group was 0.5 more (‐0.11 to 1.12) | 150 | ⨁⨁⨁◯ | |
| Day 2 pain score | The mean day 2 pain score was 2.2 | The mean day 2 pain score in the intervention group was 0.28 fewer (‐0.78 to 0.21) | 695 | ⨁⨁◯◯ | |
| Day 2 pain score: heated, humidified vs cold (abdominal) | The mean day 2 pain score: heated, humidified vs cold (abdominal) was 3.2 | The mean day 2 pain score: heated, humidified vs cold (abdominal) in the intervention group was 0.4 fewer (‐1.07 to 0.28) | 442 | ⨁⨁◯◯ | |
| Day 2 pain score: heated, humidified vs cold (shoulder) | The mean day 2 pain score: heated, humidified vs cold (shoulder) was 1.5 | The mean day 2 pain score: heated, humidified vs cold (shoulder) in the intervention group was 0.88 fewer (‐2.93 to 1.17) | 111 | ⨁◯◯◯ | |
| Day 2 pain score: heated only vs cold | The mean day 2 pain score: heated vs cold was 1.9 | The mean day 2 pain score: heated vs cold in the intervention group was 0.41 more (‐0.44 to 1.27) | 142 | ⨁⨁◯◯ | |
| Day 1 pain score for low risk of bias studies | The mean day 1 pain score for low risk of bias studies was 2.7 | The mean day 1 pain score for low risk of bias studies in the intervention group was 0.17 more (‐0.21 to 0.55) | 570 | ⨁⨁⨁⨁ | |
| Day 1 pain score for low risk of bias studies: heated, humidified vs cold (abdominal) | The mean day 1 pain score for low risk of bias studies: heated, humidified vs cold (abdominal) was 4.3 | The mean day 1 pain score for low risk of bias studies: heated, humidified vs cold (abdominal) in the intervention group was 0.17 more (‐0.29 to 0.63) | 460 | ⨁⨁⨁⨁ | |
| Day 1 pain score for low risk of bias studies: heated, humidified vs cold (shoulder) | The mean day 1 pain score for low risk of bias studies: heated, humidified vs cold (shoulder) was 1.2 | The mean day 1 pain score for low risk of bias studies: heated, humidified vs cold (shoulder) in the intervention group was 0.25 more (‐0.81 to 1.31) | 110 | ⨁⨁⨁◯ | |
| Day 2 pain score for low risk of bias studies | The mean day 2 pain score for low risk of bias studies was 3.5 | The mean day 2 pain score for low risk of bias studies in the intervention group was 0.29 fewer (‐0.65 to 0.07) | 380 | ⨁⨁⨁⨁ | |
| *The risk in the intervention group (and its 95% confidence interval) is based on the assumed risk in the comparison group and the relative effect of the intervention (and its 95% CI). | |||||
| GRADE Working Group grades of evidence | |||||
|
| |||||
| Heated CO2 with or without humidification for laparoscopic abdominal surgery | |||||
| Patient or population: Laparoscopic abdominal surgery (morphine consumption) | |||||
| Outcomes | Anticipated absolute effects* (95% CI) | № of participants | Quality of the evidence | Comments | |
| Risk with cold gas | Risk with heated gas | ||||
| Up to 6 h | The mean up to 6 h morphine consumption was 12.6 mg | The mean up to 6 h in the intervention group was 0.45 mg more (‐1.19 to 2.08) | 231 | ⨁⨁⨁◯ | Morphine consumption was presented as equivalent daily dose |
| Day 1 morphine | The mean day 1 morphine consumption was 32.4 mg | The mean day 1 morphine consumption in the intervention group was 0.64 mg less (‐4.48 to 3.20) | 573 | ⨁⨁⨁◯ | |
| Day 1 morphine: heated, humidified vs cold | The mean day 1 morphine consumption: heated, humidified vs cold was 31.2 mg | The mean day 1 morphine consumption: heated, humidified vs cold in the intervention group was 1.66 mg less (‐4.79 to 1.46) | 481 | ⨁⨁◯◯ | |
| Day 1 morphine: heated only vs cold | The mean day 1 morphine consumption: heated vs cold was 33.6 mg | The mean day 1 morphine consumption: heated vs cold in the intervention group was 11.93 mg more (0.92 to 22.94) | 92 | ⨁⨁◯◯ | |
| Day 2 morphine | The mean day 2 morphine consumption was 22.1 mg | The mean day 2 morphine consumption in the intervention group was 0.61 mg less (‐2.79 to 1.57) | 532 | ⨁⨁⨁◯ | |
| Day 2 morphine: heated, humidified vs cold | The mean day 2 morphine consumption ‐ Heated, humidified vs cold was 21.3 mg | The mean day 2 morphine consumption: heated, humidified vs cold in the intervention group was 0.94 mg less (‐1.9 to 0.01) | 410 | ⨁⨁⨁◯ | |
| Day 2 morphine: heated only vs cold | The mean day 2 morphine consumption: heated vs cold was 23 mg | The mean day 2 morphine consumption: heated vs cold in the intervention group was 9.79 mg more (1.58 to 18.00) | 122 | ⨁⨁◯◯ | |
| *The risk in the intervention group (and its 95% confidence interval) is based on the assumed risk in the comparison group and the relative effect of the intervention (and its 95% CI). | |||||
| GRADE Working Group grades of evidence | |||||
| 1. Risk of bias not clear | |||||
| Heated CO2 with or without humidification for laparoscopic abdominal surgery | |||||
| Patient or population: Laparoscopic abdominal surgery (hospital stay) | |||||
| Outcomes | Anticipated absolute effects* (95% CI) | № of participants | Quality of the evidence | Comments | |
| Risk with cold gas | Risk with heated gas | ||||
| Hospital stay (days) | The mean hospital stay was 2.7 days | The mean hospital stay in the intervention group was 0.06 days less (‐0.31 to 0.19) | 685 | ⨁⨁⨁◯ | |
| Hospital stay: heated, humidified vs cold | The mean hospital stay: heated, humidified vs cold was 2.9 days | The mean hospital stay: heated, humidified vs cold in the intervention group was 0.13 days less (‐0.44 to 0.18) | 563 | ⨁⨁⨁◯ | |
| Hospital stay: heated only vs cold | The mean hospital stay: heated vs cold was 2.6 days | The mean hospital stay: heated vs cold in the intervention group was 0.20 days more (‐0.23 to 0.62) | 122 | ⨁⨁⨁◯ | |
| *The risk in the intervention group (and its 95% confidence interval) is based on the assumed risk in the comparison group and the relative effect of the intervention (and its 95% CI). | |||||
| GRADE Working Group grades of evidence | |||||
| 1. Risk of bias not clear | |||||
| Heated CO2 with or without humidification for laparoscopic abdominal surgery | |||||
| Patient or population: Laparoscopic abdominal surgery (recovery time) | |||||
| Outcomes | Anticipated absolute effects* (95% CI) | № of participants | Quality of the evidence | Comments | |
| Risk with cold gas | Risk with heated gas | ||||
| Recovery time (minutes) | The mean recovery time was 106.8 min | The mean recovery time in the intervention group was 26.79 min less (‐51.34 to ‐2.25) | 327 | ⨁⨁◯◯ | |
| Recovery time for low risk of bias studies | The mean recovery time for low risk of bias studies was 90.1 min | The mean recovery time for low risk of bias studies in the intervention group was 1.22 min less (‐6.62 to 4.17) | 277 | ⨁⨁⨁◯ | |
| *The risk in the intervention group (and its 95% confidence interval) is based on the assumed risk in the comparison group and the relative effect of the intervention (and its 95% CI). | |||||
| GRADE Working Group grades of evidence | |||||
| 1. Risk of bias not clear | |||||
| Heated CO2 with or without humidification for laparoscopic abdominal surgery | |||||
| Patient or population: Laparscopic abdominal surgery (lens fogging) | |||||
| Outcomes | Anticipated absolute effects* (95% CI) | № of participants | Quality of the evidence | Comments | |
| Risk with cold gas | Risk with heated gas | ||||
| Times cleaned | The mean frequency of cleaning was 1.8 times | The mean times cleaned in the intervention group was 0.73 times more (‐0.32 to 1.77) | 341 | ⨁⨁◯◯ | The frequency of lens cleaning during surgery |
| *The risk in the intervention group (and its 95% confidence interval) is based on the assumed risk in the comparison group and the relative effect of the intervention (and its 95% CI). | |||||
| GRADE Working Group grades of evidence | |||||
| 1. Risk of bias not clear | |||||
| Heated CO2 with or without humidification for laparoscopic abdominal surgery | |||||
| Patient or population: Laparoscopic abdominal surgery (operative time) | |||||
| Outcomes | Anticipated absolute effects* (95% CI) | № of participants | Quality of the evidence | Comments | |
| Risk with cold gas | Risk with heated gas | ||||
| Operative time (minutes) | The mean operative time was 76.6 min | The mean operative time in the intervention group was 0.44 min less (‐3.91 to 3.04) | 1318 | ⨁◯◯◯ | |
| Operative time: heated, humidified vs cold | The mean operative time: heated, humidified vs cold was 94.3 min | The mean operative time: heated, humidified vs cold in the intervention group was 2.01 min less (‐7.15 to 3.13) | 1033 | ⨁◯◯◯ | |
| Operative time: heated only vs cold | The mean operative time: heated vs cold was 58.8 min | The mean operative time: heated vs cold in the intervention group was 0.91 min more (‐4.02 to 5.83) | 285 | ⨁⨁◯◯ | |
| *The risk in the intervention group (and its 95% confidence interval) is based on the assumed risk in the comparison group and the relative effect of the intervention (and its 95% CI). | |||||
| GRADE Working Group grades of evidence | |||||
| 1. Risk of bias not clear | |||||
| Study | Number of participants | Mean age (years) | % Female | Mean BMI (kg/m2) or weight (kg) |
| 150 | 52 | 72.7 | ||
| 26 | 49W/53C | 42.3 | 25W/25C (BMI) | |
| 50 | 41.5WH/44C | 86 | 50W/52.9C (BMI) | |
| 44 | 42.3WH/40.6W/44.8H/42.5C | 47.2WH/49.1W/48.5H/52.4C (BMI) | ||
| 40 | 100 | |||
| 117 (16 excluded) | 52 | 68.3 | 29.5W/29.7C (BMI) | |
| 50 (6 excluded) | 44WH/45C | 89.1 | 125W/128C (weight) | |
| 90 (53 with data) | 37WH/33W/36C | 100 | 63WH/63W/65C (weight) | |
| 148 | 55.7 | 69.6 | 28.56 (BMI) | |
| 30 | 60.1W/55.1C | 36.7 | ||
| 60 | 30WH/30C | 100 | 25W/24C (BMI) | |
| 32 | 23‐89 (range) | |||
| 37 | 46W/47C | 100 | 63W/66C (weight) | |
| 20 | 43WH/45C | 45 | ||
| 72 (50 with data) | 100 | |||
| 30 | 46.2W/53.7C | |||
| 20 | 62W/51C | 60 | 75W/83C (weight) | |
| 82 (8 excluded) | 71WH/69C | 57.1W/59C | 26.5W/25.5C (BMI) | |
| 30 | 41WH/39C | 80 | 50.6W/52.3C (BMI) | |
| 108 (8 excluded) | 52W/53C | 58 | 26.9W/25.7C (BMI) | |
| 41 (1 excluded) | 47.5W/52.2C | 45 | 27W/29.2C (BMI) | |
| 195 (5 excluded) | 12 | 36.8 | 49.6W/50.3C (weight) | |
| W = warmed cohort, C = cold cohort, H = humidified cohort, WH = warmed and humidified cohort | ||||
| Study | Procedures | Method of temperature measurement | Insufflation gas | Gas temperature (°C) | Heating device | Humidification (%) | Duration of surgery (minutes) | External warming |
| 110 laparoscopic cholecystectomy, 40 laparoscopic fundoplication | Carbon dioxide | WISAP Flow Thermo | Not specified | 42WH/56C | None | |||
| Laparoscopic fundoplication, hernioplasty, sigmoid colon resection, rectopexy | Pulmonary artery catheter | Carbon dioxide | 37 | WISAP Flow Thermo | None | 161W/163C | Warm blanket/ warm waterbath mattress | |
| Laparoscopic Roux‐en‐Y gastric bypass | Rectal thermometer | Carbon dioxide | 35 | Lexion Insuflow | 95 | 61.7WH/61.7C | None | |
| Laparoscopic Roux‐en‐Y gastric bypass | Foley catheter for bladder temperature | Carbon dioxide | 37 | Lexion Insuflow | 95 | 78‐84 (range) | None | |
| Awake laparoscopy | Carbon dioxide | 35 | Lexion Insuflow | 95 | None | |||
| Laparoscopic cholecystectomy | Oesophageal probe | Carbon dioxide | 35 | Lexion Insuflow | 95 | 91.2 | Bair Hugger forced air warmer (32 °CW/34 °C C) | |
| Laparoscopic Roux‐en‐Y gastric bypass | Oesophageal/ tympanic membrane | Carbon dioxide | 37 | Lexion Insuflow | 95 | 120WH/132C | Warm cotton blankets | |
| Laparoscopic gynaecologic surgery | Intravesical temperature | Carbon dioxide | 38 | Laparo‐CO2‐Pneu2232 | 95‐100 | 62WH/51W/45C | None | |
| Laparoscopic cholecystectomy | Rectal probe | Carbon dioxide | 35 | Storz Optitherm | 95 | 63.88 | None | |
| Laparoscopic low anterior resection, colectomy, gastrectomy | Oesophageal temperature probe | Carbon dioxide | 37 | WISAP Flow Thermo | None | 212W/230C | Bair Hugger forced air warmer/ warming mattress with circulating water at 38 °C | |
| 49 laparoscopy for endometriosis, 16 laparoscopy for adhesions | Carbon dioxide | 37 | Fisher & Paykel | 100 | 49.6WH/46.8C | Upper body warming blanket | ||
| Laparoscopic cholecystectomy | Oesophageal thermoresistor | Carbon dioxide | 34‐37 | LINS‐1000 | 88‐90 | 40WH/48.3WH | None | |
| Laparoscopic hysterectomy | Tympanic and nasopharyngeal infrared technique | Carbon dioxide | 37 | None | 56W/51C | None | ||
| Laparoscopic Nissen fundoplication | Oesophageal probe | Carbon dioxide | 37 | Georgia BioMedical Insuflow | 95 | 35.6WH/35.6C | Bair Hugger forced air warmer | |
| Laparoscopic gynaecologic surgery | Endotracheal temperature probe | Carbon dioxide | 36.2 | Insuflow | 95 | 38‐262 (range) | None | |
| Laparoscopic cholecystectomy | Oesophageal probe | Carbon dioxide | 37 | WISAP Flow Thermo | None | 31.5W/32.1C | None | |
| Laparoscopic cholecystectomy | Oesophageal probe | Carbon dioxide | 37 | WISAP Flow Thermo | None | 56W/61C | None | |
| Laparoscopic colon resection | Oesophageal probe | Carbon dioxide | 37 | Fisher & Paykel | 98 | 176.3WH/184.7C | Bair Hugger forced air warmer | |
| Laparoscopic Roux‐en‐Y gastric bypass | Oesophageal probe | Carbon dioxide | 35 | Lexion Insuflow | 95 | 76WH/101C | Bair Hugger forced air warmer at discretion of blinded anaesthesiologist | |
| Laparoscopic cholecystectomy, fundoplication, myotomy | Subdiaphragmatic thermometric probe | Carbon dioxide | 37 | ThermoFlator | None | 73W/67C | None | |
| Laparoscopic fundoplication | Nasopharyngeal thermistor | Carbon dioxide | 37 | Cook LINS‐2000 | None | 69W/72C | Bair Hugger forced air warmer | |
| Laparoscopic appendectomy | Naso‐oesophageal probe | Carbon dioxide | 37 | Fisher & Paykel | 98 | 69.8WH/71.6C | Forced‐air warming blanket | |
| W = warmed cohort, C = cold cohort, H = humidified cohort, WH = warmed and humidified cohort | ||||||||
| Study | Mean change in core temperature (°C) | Adverse events (Clavien‐Dindo ≥ III) | ||||
| Heated and humidified | Heated only | Cold | Heated and humidified | Heated only | Cold | |
| 0.49 | ‐0.06 | Not reported | Not reported | |||
| 0.2 | ‐0.1 | Not reported | Not reported | |||
| ‐0.4 | ‐0.4 | Not reported | Not reported | |||
| 0.4 | 0.2 | 0.4 | Not reported | Not reported | Not reported | |
| Not reported | Not reported | Not reported | Not reported | |||
| 0.29 | ‐0.03 | Not reported | Not reported | |||
| ‐0.7 | ‐1.7 | Not reported | Not reported | |||
| ‐0.5 | ‐0.6 | ‐0.4 | Not reported | Not reported | Not reported | |
| Not reported | Not reported | 0 | 0 | |||
| ‐0.4 | ‐0.7 | Not reported | Not reported | |||
| ‐0.2 | ‐0.13 | Not reported | Not reported | |||
| ‐0.25 | ‐0.3 | 0 | 0 | |||
| ‐0.2 | 0 | Not reported | Not reported | |||
| 0.4 | 0.3 | 0 | 0 | |||
| ‐0.3 | ‐1.64 | 0 | 0 | |||
| ‐0.24 | ‐0.42 | Not reported | Not reported | |||
| 0 | ‐0.1 | Not reported | Not reported | |||
| 0.64 | 0.48 | 3 (8.6%) | 5 (12.8%) | |||
| 0.4 | ‐0.3 | Not reported | Not reported | |||
| Not reported | Not reported | 0 | 0 | |||
| 0.2 | 0 | 0 | 1 (4.8%) | |||
| 0.1 | 0.1 | 3 (10.3%) | 0 | |||
| Outcome or subgroup title | No. of studies | No. of participants | Statistical method | Effect size |
| 1 Change in core temperature Show forest plot | 19 | 1100 | Mean Difference (IV, Random, 95% CI) | 0.21 [0.06, 0.36] |
| 1.1 Heated, humidified vs cold | 14 | 885 | Mean Difference (IV, Random, 95% CI) | 0.31 [0.09, 0.53] |
| 1.2 Heated only vs cold | 7 | 215 | Mean Difference (IV, Random, 95% CI) | 0.02 [‐0.16, 0.20] |
| 2 Change in core temperature for low risk of bias studies Show forest plot | 10 | 653 | Mean Difference (IV, Random, 95% CI) | 0.16 [‐0.01, 0.33] |
| 2.1 Heated, humidified vs cold | 8 | 561 | Mean Difference (IV, Random, 95% CI) | 0.18 [‐0.04, 0.39] |
| 2.2 Heated vs cold | 3 | 92 | Mean Difference (IV, Random, 95% CI) | 0.12 [‐0.15, 0.39] |
| 3 Change in core temperature for operations > 120 Minutes Show forest plot | 4 | 194 | Mean Difference (IV, Random, 95% CI) | 0.70 [0.10, 1.30] |
| 4 Change in core temperature with external warming Show forest plot | 8 | 545 | Mean Difference (IV, Random, 95% CI) | 0.29 [0.05, 0.52] |
| 5 Change in temperature without external warming Show forest plot | 6 | 340 | Mean Difference (IV, Random, 95% CI) | 0.32 [‐0.11, 0.75] |
| Outcome or subgroup title | No. of studies | No. of participants | Statistical method | Effect size |
| 1 Day 1 pain score Show forest plot | 14 | 991 | Mean Difference (IV, Random, 95% CI) | ‐0.04 [‐0.42, 0.34] |
| 1.1 Heated, humidified vs cold (abdominal) | 10 | 670 | Mean Difference (IV, Random, 95% CI) | ‐0.14 [‐0.60, 0.33] |
| 1.2 Heated, humidified vs cold (shoulder) | 3 | 171 | Mean Difference (IV, Random, 95% CI) | ‐0.35 [‐1.75, 1.05] |
| 1.3 Heated vs cold | 3 | 150 | Mean Difference (IV, Random, 95% CI) | 0.50 [‐0.11, 1.12] |
| 2 Day 1 pain score for low risk of bias studies Show forest plot | 7 | 570 | Mean Difference (IV, Random, 95% CI) | 0.17 [‐0.21, 0.55] |
| 2.1 Heated, humidified vs cold (abdominal) | 7 | 460 | Mean Difference (IV, Random, 95% CI) | 0.17 [‐0.29, 0.63] |
| 2.2 Heated, humidified vs cold (shoulder) | 2 | 110 | Mean Difference (IV, Random, 95% CI) | 0.25 [‐0.81, 1.31] |
| 3 Day 2 pain score Show forest plot | 10 | 695 | Mean Difference (IV, Random, 95% CI) | ‐0.28 [‐0.78, 0.21] |
| 3.1 Heated, humidified vs cold (abdominal) | 7 | 442 | Mean Difference (IV, Random, 95% CI) | ‐0.40 [‐1.07, 0.28] |
| 3.2 Heated, humidified vs cold (shoulder) | 2 | 111 | Mean Difference (IV, Random, 95% CI) | ‐0.88 [‐2.93, 1.17] |
| 3.3 Heated vs cold | 3 | 142 | Mean Difference (IV, Random, 95% CI) | 0.41 [‐0.44, 1.27] |
| 4 Day 2 pain score of low risk of bias studies Show forest plot | 5 | 380 | Mean Difference (IV, Random, 95% CI) | ‐0.29 [‐0.65, 0.07] |
| Outcome or subgroup title | No. of studies | No. of participants | Statistical method | Effect size |
| 1 Up to 6 hours Show forest plot | 4 | 231 | Mean Difference (IV, Random, 95% CI) | 0.45 [‐1.19, 2.08] |
| 2 Day 1 morphine Show forest plot | 9 | 573 | Mean Difference (IV, Random, 95% CI) | ‐0.64 [‐4.48, 3.20] |
| 2.1 Heated, humidified vs cold | 7 | 481 | Mean Difference (IV, Random, 95% CI) | ‐1.66 [‐4.79, 1.46] |
| 2.2 Heated vs cold | 3 | 92 | Mean Difference (IV, Random, 95% CI) | 11.93 [0.92, 22.94] |
| 3 Day 2 morphine Show forest plot | 7 | 532 | Mean Difference (IV, Random, 95% CI) | ‐0.61 [‐2.79, 1.57] |
| 3.1 Heated, humidified vs cold | 6 | 410 | Mean Difference (IV, Random, 95% CI) | ‐0.94 [‐1.90, 0.01] |
| 3.2 Heated vs cold | 2 | 122 | Mean Difference (IV, Random, 95% CI) | 9.79 [1.58, 18.00] |
| Outcome or subgroup title | No. of studies | No. of participants | Statistical method | Effect size |
| 1 Hospital stay Show forest plot | 10 | 685 | Mean Difference (IV, Random, 95% CI) | ‐0.06 [‐0.31, 0.19] |
| 1.1 Heated, humidified vs cold | 9 | 563 | Mean Difference (IV, Random, 95% CI) | ‐0.13 [‐0.44, 0.18] |
| 1.2 Heated vs cold | 2 | 122 | Mean Difference (IV, Random, 95% CI) | 0.20 [‐0.23, 0.62] |
| Outcome or subgroup title | No. of studies | No. of participants | Statistical method | Effect size |
| 1 Recovery time Show forest plot | 6 | 327 | Mean Difference (IV, Random, 95% CI) | ‐26.79 [‐51.34, ‐2.25] |
| 2 Recovery time for low risk of bias studies Show forest plot | 5 | 277 | Mean Difference (IV, Random, 95% CI) | ‐1.22 [‐6.62, 4.17] |
| Outcome or subgroup title | No. of studies | No. of participants | Statistical method | Effect size |
| 1 Times cleaned Show forest plot | 7 | 341 | Mean Difference (IV, Random, 95% CI) | 0.73 [‐0.32, 1.77] |
| Outcome or subgroup title | No. of studies | No. of participants | Statistical method | Effect size |
| 1 Operative time Show forest plot | 20 | 1318 | Mean Difference (IV, Random, 95% CI) | ‐0.44 [‐3.91, 3.04] |
| 1.1 Heated, humidified vs cold | 15 | 1033 | Mean Difference (IV, Random, 95% CI) | ‐2.01 [‐7.15, 3.13] |
| 1.2 Heated vs cold | 7 | 285 | Mean Difference (IV, Random, 95% CI) | 0.91 [‐4.02, 5.83] |