Cambios en el estilo de vida para pacientes con síndrome de ovario poliquístico
Resumen
Antecedentes
El síndrome de ovario poliquístico (SOPQ) afecta a entre el 8% y el 13% de las mujeres en edad fértil y se asocia con disfunción reproductiva y metabólica. La obesidad empeora la presentación del SOPQ y el control de peso (pérdida de peso, mantenimiento o prevención del aumento de peso excesivo) se propone como una estrategia de tratamiento inicial, que se logra mejor mediante cambios en el estilo de vida que incorporan intervenciones de dieta, ejercicio y conductuales.
Objetivos
Evaluar la efectividad de las intervenciones sobre el estilo de vida con respecto a la mejoría de los factores reproductivos, antropométricos (peso y composición corporal), metabólicos y de la calidad de vida para el SOPQ.
Métodos de búsqueda
Se buscó en el Registro Especializado del Grupo Cochrane de Ginecología y Fertilidad (Cochrane Gynaecology and Fertility Group), el Registro Cochrane Central de Ensayos Controlados (CENTRAL), MEDLINE, EMBASE, PsycINFO, CINAHL, LILACS y AMED (fecha de la última búsqueda marzo de 2018). También se realizaron búsquedas en registros de ensayos controlados, resúmenes de congresos, revistas relevantes, listas de referencias de artículos y revisiones relevantes y bases de datos de literatura gris, sin restricciones de idioma.
Criterios de selección
Ensayos controlados aleatorizados (ECA) que compararon intervenciones para cambiar el estilo de vida (dieta, ejercicio, tratamiento conductual, o una combinación) versus un tratamiento mínimo o ningún tratamiento en pacientes con SOPQ.
Obtención y análisis de los datos
Dos autores de la revisión de manera independiente seleccionaron los ensayos, evaluaron la calidad y el riesgo de sesgo y extrajeron los datos. Los resultados primarios fueron los nacidos vivos, el aborto espontáneo y el embarazo. Se utilizaron los modelos de la varianza inversa y de efectos fijos en los metanálisis. Se informaron los resultados dicotómicos como odds ratio y los resultados continuos como diferencias de medias (DM) o diferencias de medias estandarizadas (DME).
Resultados principales
Se incluyeron 15 estudios con 498 participantes. Diez estudios compararon la actividad física con la intervención mínima dietética y conductual o ninguna intervención. Cinco estudios compararon la intervención combinada de dieta, ejercicio y conductual con la intervención mínima. Un estudio comparó la intervención conductual con la intervención mínima. El riesgo de sesgo varió: ocho estudios tuvieron una generación de la secuencia adecuada, siete tuvieron un cegamiento adecuado del médico o del evaluador de resultados, siete tuvieron una ocultación de la asignación adecuada, seis tuvieron datos de resultado completos y seis estuvieron libres de informe selectivo. Ningún estudio evaluó los resultados primarios de fertilidad nacidos vivos o aborto espontáneo. Ningún estudio informó el resultado reproductivo secundario regularidad menstrual, como se definió en esta revisión.
Las intervenciones sobre el estilo de vida podrían mejorar un resultado reproductivo secundario (endocrino), el índice de andrógenos libres (FAI, por sus siglas en inglés) (DM ‐1,11; intervalo de confianza [IC] del 95%: ‐1,96 a ‐0,26; seis ECA, n = 204, I2 = 71%, evidencia de calidad baja). Las intervenciones sobre el estilo de vida podrían reducir el peso (kg) (DM ‐1,68 kg, IC del 95%: ‐2,66 a ‐0,70; nueve ECA, n = 353, I2 = 47%, evidencia de calidad baja). Las intervenciones sobre el estilo de vida podrían reducir el índice de masa corporal (IMC) (kg/m2) (‐0,34 kg/m2; IC del 95%: ‐0,68 a ‐0,01, 12 ECA, n = 434, I2= 0%,evidencia de calidad baja). No se conoce el efecto de las intervenciones sobre el estilo de vida en la tolerancia a la glucosa (resultados de la glucosa en prueba oral de tolerancia a la glucosa) (mmol/l/minuto) (DME ‐0,02; IC del 95%: ‐0,38 a 0,33; tres ECA, n = 121, I2 = 0%, evidencia de calidad baja).
Conclusiones de los autores
Las intervenciones sobre el estilo de vida pueden mejorar el índice de andrógenos libres (FAI), el peso y el IMC en las pacientes con SOPQ. No se conoce el efecto de las intervenciones sobre el estilo de vida en la tolerancia a la glucosa. Ningún estudio consideró el efecto de las intervenciones sobre el estilo de vida en los nacidos vivos, el aborto espontáneo o la regularidad menstrual. La mayoría de los estudios de esta revisión fueron de calidad baja, debido principalmente al riesgo alto o incierto de sesgo a través de la mayoría de los dominios, así como a la heterogeneidad alta para el resultado del FAI.
PICO
Resumen en términos sencillos
Efecto del cambio en el estilo de vida para pacientes con síndrome de ovario poliquístico
Pregunta de la revisión
Se examinó la evidencia en cuanto a los efectos de las intervenciones sobre el estilo de vida en los resultados reproductivos, antropométricos (medición corporal), metabólicos y de la calidad de vida en pacientes con síndrome de ovario poliquístico.
Antecedentes
El síndrome de ovario poliquístico (SOPQ) es un trastorno muy frecuente que afecta del 8% al 13% de las mujeres. El sobrepeso empeora todas las características clínicas del SOPQ. Estas características clínicas incluyen problemas reproductivos como una reducción en la frecuencia de la ovulación y ciclos menstruales irregulares, reducción de la fertilidad, ovarios poliquísticos en la ecografía y niveles altos de hormonas masculinas como la testosterona, que pueden causar el crecimiento de pelos faciales o corporales no deseados y acné. El SOPQ también se asocia con características metabólicas, con factores de riesgo de diabetes y enfermedades cardiovasculares, incluidos niveles altos de insulina o la resistencia a la insulina y niveles de colesterol anormales. El SOPQ afecta la calidad de vida y puede empeorar la ansiedad y la depresión, ya sea debido a los síntomas o debido al diagnóstico de una enfermedad crónica. Un estilo de vida sano consiste en una dieta saludable, ejercicio regular y lograr y mantener un peso saludable.
Características de los estudios
Se encontraron 15 estudios que incluyeron 498 participantes. Diez estudios compararon la actividad física con la intervención mínima dietética y conductual o ninguna intervención. Cinco estudios compararon la intervención combinada de dieta, ejercicio y conductual con la intervención mínima. Un estudio comparó la intervención conductual con la intervención mínima. El riesgo de sesgo de los estudios varió y en general fue incierto. La evidencia está actualizada hasta marzo de 2018.
Resultados clave
Ningún estudio investigó el efecto de un estilo de vida saludable sobre los nacidos vivos, el aborto espontáneo o la regularidad de los ciclos menstruales. La adopción de un estilo de vida saludable puede dar lugar a la pérdida de peso o a la reducción de los niveles de hormonas masculinas en algunos individuos. La dieta y el ejercicio podrían no tener un efecto sobre la capacidad del cuerpo de mantener los niveles normales de glucosa en sangre.
Calidad de la evidencia
La evidencia fue de baja calidad. Las limitaciones principales en la evidencia fueron los resultados inconsistentes e imprecisos, y el informe deficiente de los métodos usados en los estudios.
Authors' conclusions
Summary of findings
| Lifestyle intervention compared to minimal treatment in women with polycystic ovary syndrome | ||||
| Patient or population: women with polycystic ovary syndrome | ||||
| Outcomes | Anticipated effects | Effect estimate* (95% CI) | № of participants | Certainty of the evidence |
| Fertility: live birth ‐ not reported | No study reported on this outcome | ‐ | ‐ | ‐ |
| Fertility: miscarriage ‐ not reported | No study reported on this outcome | ‐ | ‐ | ‐ |
| Secondary reproductive: menstrual regularity ‐ not reported | No study reported on this outcome in way defined by this review | ‐ | ‐ | ‐ |
| Secondary reproductive: free androgen index (FAI) | Lifestyle intervention may reduce free androgen index (FAI) | MD ‐1.11 (‐1.96 to ‐0.26) | 204 | ⊕⊕⊝⊝ |
| Anthropometric: weight (kg) | Lifestyle intervention may reduce body weight by 1.68 kg (reduction of 2.66 kg to 0.7 kg) compared to no intervention. | MD ‐1.68 | 353 | ⊕⊕⊝⊝ |
| Anthropometric: body mass index (BMI) (kg/m2) | Lifestyle intervention may reduce body mass index (BMI) by 0.34 kg/m2 (reduction of 0.68 to 0.01 kg/m2). | MD ‐0.34 | 434 | ⊕⊕⊝⊝ |
| Metabolic: oral glucose tolerance test (OGTT) glucose (mmol/L/minute) | We are uncertain of the effect of lifestyle intervention on oral glucose tolerance test (OGTT) glucose (mmol/L/minute). | SMD ‐0.02 | 121 | ⊕⊕⊝⊝ |
| *The risk in the intervention group (and its 95% confidence interval) is based on the assumed risk in the comparison group and the relative effect of the intervention (and its 95% CI). | ||||
| GRADE Working Group grades of evidence | ||||
| aDowngraded one level for imprecision: the confidence intervals for most studies cross 0 or small number of events (< 400). bDowngraded one level for inconsistency: high heterogeneity with differing directions of effect. cDowngraded one level for serious risk of bias: lack of blinding of participants, clinicians or outcome assessors and/or attrition bias in a number of studies. | ||||
Background
Description of the condition
Polycystic ovary syndrome (PCOS) is a common condition with a range of clinical features that affects women of reproductive age. These reproductive features include oligo‐anovulation (reduced ovulation), irregular menstrual cycles, biochemical hyperandrogenism (elevated circulating male hormones or androgens such as testosterone), clinical hyperandrogenism (effects of androgens on body tissues including hirsutism or excess hair growth) and infertility (Teede 2011). Metabolic features include increased risk factors for type 2 diabetes mellitus and cardiovascular disease (worsened lipid profile, high blood pressure, worsened blood vessel function) (Heida 2016; Meyer 2005; Paradisi 2001; Rubin 2017), and an increase in the prevalence of the metabolic syndrome (a clustering of risk factors for cardiovascular disease), impaired glucose tolerance or prediabetes, type 2 diabetes and potentially cardiovascular disease (Kakoly 2018; Moran 2010b). The European Society for Human Reproduction and Embryology/American Society for Reproductive Medicine (ESHRE/ASRM) international consensus workshop group have expanded the diagnostic guidelines for PCOS to the Rotterdam criteria, based on presentation with any two of the three criteria of hyperandrogenism, irregular anovulatory cycles or polycystic ovaries on ultrasound, with exclusion of related reproductive disorders (ESHRE/ASRM 2004). Studies reporting PCOS prevalence using ESHRE/ASRM criteria (March 2010), including a systematic review and meta‐analysis of 15 trials, have shown that 8% to 13% of women have PCOS (Bozdag 2016). The recent international evidence‐based guidelines for PCOS revise these criteria in adolescents, now needing both hyperandrogenism and irregular cycles with ultrasound not recommended (International PCOS Guideline 2018).
The aetiology of PCOS is unknown although abnormalities in steroidogenesis (the production of steroid hormones such as reproductive hormones) and gonadotrophin action (the action of hormones that control reproductive hormone production) are implicated. Insulin resistance and compensatory hyperinsulinaemia are proposed as significant aetiological factors and are present in 75% and 95% of lean and overweight women with PCOS respectively (Alebic 2014; Behbourdi‐Gandevani 2016; DeUgarte 2005; Stepto 2013). These play a key role in PCOS through insulin stimulating ovarian androgen production (Barbieri 1986), and decreasing sex hormone‐binding globulin (SHBG) production in the liver (Plymate 1988), resulting in hyperandrogenism. Excess body weight worsens the underlying hormonal disturbances (increasing androgen and insulin levels) and the clinical features evident in women with PCOS.
Description of the intervention
Treatment aims in PCOS include optimising healthy weight, improving underlying hormonal disturbances, prevention of future reproductive and metabolic complications, and improving quality of life. Lifestyle interventions (dietary, exercise, behavioural or combined) are recommended as first‐line management in an international evidence‐based guideline on PCOS (International PCOS Guideline 2018). In addition, medical treatments involve the targeting of biochemical and clinical hyperandrogenism and reproductive and metabolic features. Targeted symptomatic treatment of PCOS includes combination oral contraceptives to improve hyperandrogenism, anti‐androgens for treatment of hirsutism and oral contraceptives or intermittent progestins to regulate menstrual cycles. The first‐line treatment of anovulatory infertility includes ovulation induction agents, second‐line treatment includes gonadotrophins and third‐line treatment includes in vitro fertilisation techniques and laparoscopic ovarian surgery (International PCOS Guideline 2018). Where metabolic features are a concern, preventative and therapeutic use of insulin‐sensitising agents has increasingly been adopted, both in isolation or in combination with other pharmacological options (International PCOS Guideline 2018; Naderpoor 2015; Teede 2007). Overall, the use of lifestyle interventions can present a cost‐effective initial treatment strategy compared to surgical and pharmacological options (Clark 1998). Lifestyle interventions are recommended to prevent excess weight gain, manage weight and prevent future reproductive and metabolic complications (International PCOS Guideline 2018). Prevention opportunities are particularly relevant as women with PCOS have a greater prevalence of overweight and obesity compared to the general population (Kakoly 2018; Lim 2012). Lifestyle intervention may also improve insulin resistance or other features of PCOS independent of weight loss, as demonstrated in the general population (Poehlman 2000; Roberts 2013). As such, there is a strong rationale for lifestyle interventions for both improving underlying hormonal imbalances and management of weight for a large proportion of women with PCOS.
How the intervention might work
Both hyperandrogenism and insulin resistance and hyperinsulinaemia underpin PCOS; women with PCOS are generally more insulin‐resistant and hyperandrogenic, presenting with worsened clinical reproductive and metabolic features than body mass index (BMI)‐matched controls (DeUgarte 2005; Yang 2016). These hormonal imbalances are further worsened by the presence of overweight (defined as a BMI > 25 kg/m2) and obesity (defined as a BMI > 30 kg/m2) (Acien 1999; Lim 2013). Obese and overweight women with PCOS display worsened clinical reproductive (Balen 1995; Kiddy 1990; Lønnebotn 2018) and metabolic features (Ehrmann 2006; Kakoly 2018; Legro 1999). Lifestyle intervention is therefore anticipated to work because a reduction in BMI will be associated with a reduction in insulin resistance, which will, in turn, lead to an improvement in the reproductive and metabolic features of PCOS.
Why it is important to do this review
Despite the high prevalence of PCOS, a strong rationale for lifestyle intervention and the fact that lifestyle intervention is recommended as first‐line treatment in women with PCOS who are overweight, the literature in this area is limited and challenging to interpret. There are a large number of small, uncontrolled trials demonstrating that weight loss achieved through lifestyle management decreases abdominal fat, hyperandrogenism and insulin resistance, and improves lipid profiles, menstrual cyclicity, fertility and risk factors for type 2 diabetes and cardiovascular disease in overweight women with PCOS (Clark 1998; Huber‐Buchholz 1999; Lass 2011; Moran 2003). There is additionally some evidence in both PCOS patients (Hutchison 2011) and the general population (Poehlman 2000; Roberts 2013; Ross 2000) that exercise improves metabolic risk factors in PCOS, even when no weight loss occurs. A Cochrane Review was previously published to summarise these findings (Moran 2011); however, many randomised controlled trials have been published since. This updated review provides the latest summary and assesses the evidence for the effectiveness of lifestyle management in improving reproductive and metabolic features in women with PCOS. Provision of this evidence has significant implications for the treatment of both short‐term reproductive abnormalities and long‐term metabolic morbidity and mortality in PCOS. The aim of this review is, therefore, to provide an update on the effect of lifestyle treatment (defined as a dietary, exercise or behavioural intervention, or a combination) on reproductive, anthropometric (weight and body composition), metabolic and quality of life factors in women with PCOS.
Objectives
To assess the effectiveness of lifestyle treatment in improving reproductive, anthropometric (weight and body composition), metabolic and quality of life factors in PCOS.
Methods
Criteria for considering studies for this review
Types of studies
We considered randomised controlled trials (RCTs) that compare lifestyle intervention to minimal treatment for inclusion in the review. We included cross‐over trials in the review for completeness but we only included data from the first phase in the meta‐analyses as the interventions under study are anticipated to have lasting effects and the cross‐over design is not valid in this context. Quasi‐randomised trials were not included.
Types of participants
Females of reproductive age (postmenarchal and premenopausal) with PCOS. We included studies using any definition of PCOS or overweight in this review, with the trialist's definition of PCOS and overweight described.
We excluded conditions with reproductive symptoms similar to PCOS, including congenital adrenal hyperplasia, Cushing's syndrome, hyperprolactinaemia, thyroid disease and androgen‐secreting tumours. Participants were not excluded based on type 2 diabetes, co‐morbidities or medication use for clinical or metabolic features of PCOS, as long as this medication use was not a primary component of the intervention or control arms. In this scenario, we noted type 2 diabetes, co‐morbidities or medication use and assessed the effects on outcome measures. Participants were not excluded based on ethnicity.
Types of interventions
We included RCTs comparing a lifestyle intervention to minimal treatment. Lifestyle intervention was defined as a structured dietary, exercise or behavioural intervention (both those designed to induce weight loss through an energy deficit or not designed to induce weight loss through an energy deficit) while minimal treatment was defined as either no treatment or standard unstructured minimal dietary, exercise or behavioural advice. A structured programme referred to more than one study visit allocated to the implementation of the dietary, exercise or behavioural treatment.
This aimed to include trials examining:
-
dietary intervention versus minimal treatment;
-
exercise intervention (resistance or aerobic exercise) versus minimal treatment;
-
behavioural management techniques for modifying diet or exercise versus minimal treatment;
-
a combination of dietary, exercise or behavioural intervention versus minimal treatment.
We included all study durations over two weeks.
Types of outcome measures
Primary outcomes
To be measured at the end of intervention (endpoint or change).
Fertility
-
Live birth and pregnancy, as defined by study authors
-
Miscarriage, as defined by study authors
Secondary outcomes
To be measured at the end of intervention (endpoint or change).
Secondary reproductive
-
Menstrual regularity (an initiation of menses or significant shortening of cycle length where possible), ovulation (number of ovulatory menstrual cycles where possible)
-
Endocrine (total testosterone, sex hormone‐binding globulin (SHBG), free androgen index (FAI) and clinical hyperandrogenism (hirsutism assessed clinically by Ferriman‐Gallwey score)
Anthropometric
-
Weight, BMI, adiposity distribution (by measures including waist circumference, waist‐to‐hip ratio (WHR))
Metabolic
-
Oral glucose tolerance test (OGTT), glucose
-
Fasting glucose
-
Fasting lipids (total cholesterol, high‐density lipoprotein cholesterol (HDL‐C), low‐density lipoprotein cholesterol (LDL‐C), triglycerides)
-
Fasting insulin
-
Oral glucose tolerance test (OGTT), insulin
Quality of life and participant satisfaction
Search methods for identification of studies
We sought all published and unpublished RCTs of a lifestyle intervention compared to minimal treatment using the following search strategy, without language restriction and in consultation with Cochrane Gynaecology and Fertility Information Specialist. (See the methods of the review: Appendix 1; Appendix 2; Appendix 3; Appendix 4; Appendix 5; Appendix 6; Appendix 7).
Electronic searches
We searched:
-
the Cochrane Gynaecology and Fertility Specialised Register, PROCITE platform (5 March 2018) (Appendix 1);
-
the Cochrane Central Register of Controlled Trials; via the Cochrane Register of Studies Online (CRSO Web platform) (searched 5 March 2018) (Appendix 2);
-
MEDLINE Ovid (1946 to 5 March 2018) (Appendix 3);
-
Embase Ovid (1980 to 5 March 2018) (Appendix 4);
-
PsycINFO Ovid(1806 to 5 March 2018) (Appendix 5);
-
CINAHL EBSCO (1961 to 5 March 2018) (Appendix 6);
-
AMED Ovid (1985 to 5 March 2018) (Appendix 7).
We also searched the trials registers ClinicalTrials.gov (http://clinicaltrials.gov) and the World Health Organization (WHO) International Clinical Trials Registry Platform (ICTRP) (http://www.who.int/trialsearch/Default.aspx), grey literature in OpenSIGLE (http://opensigle.inist.fr/) and Latin American and Caribbean trials in the LILACS database (http://lilacs.bvsalud.org/en/), using the keywords: polycystic ovary syndrome (PCOS) (April 2018).
Searching other resources
We handsearched the references of relevant reviews, systematic reviews and included studies to locate other potentially eligible studies.
Data collection and analysis
We conducted data collection and analysis in accordance with the Cochrane Handbook for Systematic Reviews of Interventions (Higgins 2011).
Selection of studies
Two of four review authors (SKH with SSL, EVR or LJM) undertook the study selection. SSL, EVR, LJM and SKH screened the titles and abstracts of articles found in the search and discarded studies that were clearly ineligible. They aimed to be overly inclusive rather than risk losing relevant studies. We retrieved the full text of all potentially eligible studies. Two review authors independently assessed whether the studies met the inclusion criteria, with disagreements resolved by consensus and discussion with a third author, if necessary. We sought further information from the authors where papers contained insufficient information to make a decision about eligibility.
Data extraction and management
We extracted the following information from the studies included in the review and presented this in the Characteristics of included studies table. Where studies had multiple publications, we used the main trial report as the reference and supplied additional details from secondary papers. Two individuals (SKH with SSL, EVR, LJM or JB) extracted all data independently using data extraction forms designed to Cochrane guidelines. Data from papers written in languages other than English were extracted by translators. We corresponded with study investigators in order to resolve any data queries, as required. We contacted study investigators on a minimum of two occasions (at least once for initial query and at least once for reminder query). We sought additional information on data or trial methodology and actual trial data from the authors of trials that appeared to meet the eligibility criteria but had aspects of methodology that were unclear or data in an unsuitable form for meta‐analysis. We recorded discrepancies in the extracted data and resolved these by consensus.
For each included trial, we collected information regarding the location of the study, methods of the study (design, setting, source of funding), the participants (definition of PCOS, age and BMI range, eligibility criteria, concurrent treatments), the nature of the interventions and data relating to the outcomes specified above. Unit conversion factors are shown in Table 1.
| Convert from | Convert to | Conversion factor | |
| Total testosterone | ng/dL | nmol/L | 0.03467 |
| SHBG | µg/dL | mmol/L | 34.7 |
| Glucose | mg/dL | mmol/L | 0.056 |
| Cholesterol | mg/dL | mmol/L | 0.026 |
| HDL‐C | mg/dL | mmol/L | 0.0259 |
| LDL‐C | mg/dL | mmol/L | 0.0259 |
| Triglycerides | mg/dL | mmol/L | 0.0113 |
| Standard deviation | Standard error | Standard deviation | Sqrt n |
HDL‐C: high‐density lipoprotein cholesterol, LDL‐C: low‐density lipoprotein cholesterol, SHBG: sex hormone‐binding globulin
Assessment of risk of bias in included studies
We assessed the included studies for risk of bias using the Cochrane 'Risk of bias' tool (Appendix 8). This tool assesses: sequence generation; allocation concealment; blinding of participants, providers and outcome assessors; completeness of outcome data; selective outcome reporting; and other potential sources of bias. Two authors assessed these six domains (SKH with SSL, EVR, LJM or JB), with any disagreements resolved by consensus or by discussing with a third author. We presented the conclusions in the 'Risk of bias' table and figures ('Risk of bias' in Characteristics of included studies table; Figure 1; Figure 2) and incorporated them into the interpretation of the review findings by means of sensitivity analysis (see below).

'Risk of bias' graph: review authors' judgements about each methodological quality item presented as percentages across all included studies.
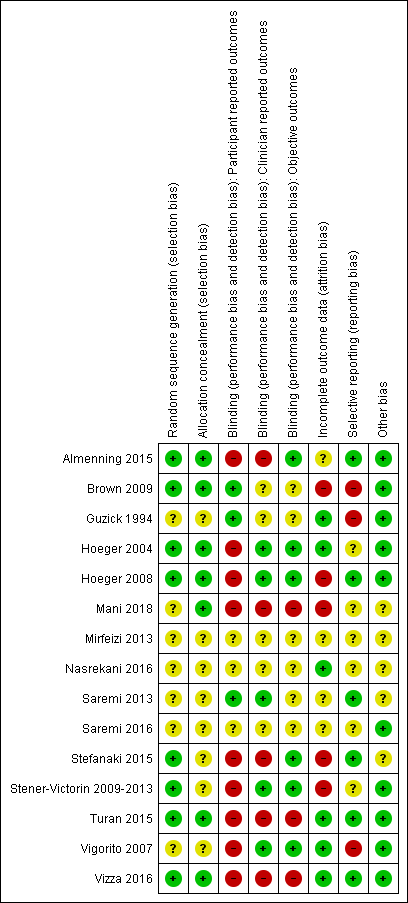
'Risk of bias' summary: review authors' judgements about each methodological quality item for each included study.
Measures of treatment effect
For dichotomous data, we used the number of events in the control and intervention groups of each study to calculate a Peto odds ratio (OR). For continuous data, we calculated a mean difference (MD) between treatment groups if all studies reported exactly the same outcomes. If similar outcomes were reported on different scales, we calculated the standardised mean difference (SMD). We presented 95% confidence intervals (CI) for all outcomes.
Unit of analysis issues
The primary analysis was per women randomised. We briefly summarised reported data that did not allow valid analysis (for example 'per cycle' rather than 'per woman' where women contributed to more than one cycle) in an additional table and did not meta‐analyse these data.
Dealing with missing data
We analysed the data on an intention‐to‐treat (ITT) basis, as far as possible, and made attempts to obtain missing data from the original investigators. Where these were unobtainable, we undertook imputation of individual values for the primary outcomes only. If studies reported sufficient detail to calculate mean differences but no information on associated standard deviations (SD), we assumed the outcome to have a standard deviation equal to the highest SD from other studies within the same analysis. For other outcomes, we only analysed the available data. We subjected any imputation undertaken to sensitivity analysis (see below).
Assessment of heterogeneity
We considered whether the clinical and methodological characteristics of the included studies were sufficiently similar for meta‐analysis to provide a meaningful summary. We assessed statistical heterogeneity by the measure of the I2 statistic. We took an I2 value greater than 50% to indicate substantial heterogeneity (Higgins 2011). If substantial heterogeneity was detected, we explored possible explanations in sensitivity analyses (see below).
Assessment of reporting biases
In view of the difficulty in detecting and correcting for publication bias and other reporting biases, we aimed to minimise their potential impact by ensuring a comprehensive search for eligible studies and by being alert for duplication of data. If there were 10 or more studies in an analysis, we used a funnel plot to explore the possibility of small study effects (a tendency for estimates of the intervention effect to be more beneficial in smaller studies).
Data synthesis
Where possible, we combined the data from primary studies using a fixed‐effect model. Meta‐analytic methods for continuous data assume that the underlying distribution of the measurements is normal. Where data were clearly skewed and results were reported in the publication as median and range with non‐parametric tests of significance, we excluded the results from the meta‐analysis. We conducted data management and analysis using Review Manager (RevMan) 5.3 (RevMan 2014). We displayed an increase in the odds of a particular outcome graphically in the meta‐analysis to the right of the centre line and a decrease in the odds of an outcome to the left of the centre line.
Subgroup analysis and investigation of heterogeneity
Where data were available, we conducted subgroup analyses to determine the separate evidence within the following subgroups.
-
Duration of intervention (short: two to four weeks, medium: four weeks to six months, long: greater than six months).
-
Component of intervention (dietary alone versus exercise alone versus behavioural intervention alone versus combined intervention).
-
Weight loss versus weight maintenance studies.
-
Studies where the inclusion criterion was overweight participants versus studies with no specific inclusion criterion for overweight participants.
-
Primary fertility outcomes (pregnancy, live birth and miscarriage) were only measured in a subgroup of eligible participants actively seeking pregnancy as part of the inclusion criteria. Where individual‐level data were required for this subgroup analysis, we contacted the authors.
Sensitivity analysis
We performed sensitivity analysis whereby:
-
eligibility was restricted to studies without a high risk of bias; we assessed only studies with a low risk of bias (assessed by random sequence generation and allocation concealment) in a separate analysis (blinding was not used in the sensitivity analysis as it was not possible to blind participants and the intervention provider due to the interactive nature of the interventions);
-
studies with outlying results were excluded;
-
alternative imputation strategies were adopted;
-
a random‐effects model was adopted.
Overall quality of the body of evidence: 'Summary of findings' table
We prepared a 'Summary of findings' table using GRADEpro and Cochrane methods (GRADEpro GDT 2015; Higgins 2011). This table evaluated the overall quality of the body of evidence for the main review outcomes (live birth, miscarriage, menstrual regularity, FAI, body weight, BMI and glucose tolerance) for the main review comparison (lifestyle intervention versus minimal treatment). We assessed the quality of the evidence using the GRADE criteria: risk of bias, consistency of effect, imprecision, indirectness and publication bias). We made judgements about evidence quality (high, moderate, low or very low) according to these criteria. We justified, documented and incorporated the judgements into our reporting of the results for each outcome.
We extracted study data, formatted our comparisons in data tables and prepared a 'Summary of findings' table before writing the results and conclusions of our review.
Results
Description of studies
(See Characteristics of included studies, and Characteristics of excluded studies tables).
Results of the search
For the current review, we identified a total of 4236 articles from: electronic databases (n = 2587), the Cochrane Gynaecology and Fertility Specialised Register (n = 478), handsearches (n = 261) and web sources of controlled trials (n = 910). After the initial exclusion of articles based on title or abstract, we retrieved 93 full‐text articles for more detailed evaluation. From these, we excluded 80 articles following full‐text screening as they did not meet the inclusion criteria (see Characteristics of excluded studies table). We categorised one article as awaiting classification due to our inability to obtain translated results for data analysis (Gaeini 2012). Six included studies from the original review (Moran 2011) were added to the 14 included studies from the current review. See Figure 3 for a PRISMA study flow diagram of the search and selection process.
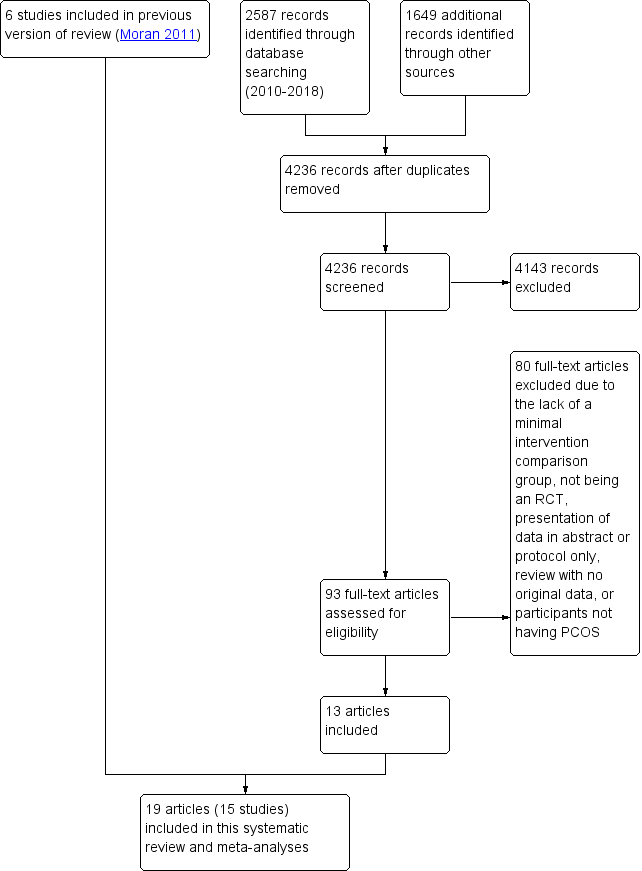
Study flow diagram.
Included studies
Design
We included 15 RCTs (from 19 articles) in this review (Almenning 2015; Brown 2009; Guzick 1994; Hoeger 2004; Hoeger 2008; Mani 2018; Nasrekani 2016; Saremi 2013; Saremi 2016; Stefanaki 2015; Jedel 2011; Leonhardt 2015; Stener‐Victorin 2009; Stener‐Victorin 2012; Stener‐Victorin 2013; Turan 2015; Vizza 2016; Vigorito 2007; Mirfeizi 2013). Trial characteristics are presented in the Characteristics of included studies table. One of the studies (Stener‐Victorin 2009‐2013) was reported in five articles (Jedel 2011; Leonhardt 2015; Stener‐Victorin 2009; Stener‐Victorin 2012; Stener‐Victorin 2013).
We contacted all corresponding authors of included trials for additional information, with seven authors providing some or all of the additional requested information (Almenning 2015; Brown 2009; Hoeger 2004; Hoeger 2008; Mani 2018, Stener‐Victorin 2009‐2013; Vigorito 2007) and the authors of one study unable to provide additional information due to the timing and location of the study (Guzick 1994).
All studies were reported as RCTs with a total number of 498 participants completed and analysed. Sample sizes ranges from 12 to 100 in each trial (N = 12 (Guzick 1994); N = 13 (Hoeger 2004; Vizza 2016); N = 18 (Hoeger 2008); N = 20 (Brown 2009; Nasrekani 2016); N = 22 (Saremi 2013); n=24 (Mirfeizi 2013); N = 25 (Almenning 2015); N = 28 (Saremi 2016); N = 30 ( Turan 2015); N = 38 (Stefanaki 2015); N = 45 (Jedel 2011; Leonhardt 2015; Stener‐Victorin 2009; Stener‐Victorin 2012; Stener‐Victorin 2013); N = 90 (Vigorito 2007); N = 100 (Mani 2018)).
The reported dropout rates for the arms studied were: 0% at 8 to 16 weeks (Guzick 1994; Nasrekani 2016; Saremi 2013; Vigorito 2007); 6% at 8 weeks (Turan 2015); 7% at 8 weeks (Saremi 2016); 12% at 16 weeks (Jedel 2011; Leonhardt 2015; Stener‐Victorin 2009; Stener‐Victorin 2012; Stener‐Victorin 2013); 13% at 12 weeks (Vizza 2016); 17% at 8 weeks (Stefanaki 2015); 18% at 24 weeks (Hoeger 2008); 19% at 10 weeks (Almenning 2015); 23% at 12 weeks (Mirfeizi 2013); 35% at 48 weeks (Hoeger 2004); 42% at 12 months (Mani 2018); and 46% at 16 weeks (Brown 2009).
Most studies (13/15) were of medium duration (four weeks to six months), while the remaining two studies were of long duration (beyond six months) (Hoeger 2004; Mani 2018).
The studies were conducted at university, hospital or clinical research centres in the USA (Brown 2009; Guzick 1994; Hoeger 2004; Hoeger 2008), Australia (Vizza 2016), Greece (Stefanaki 2015), Iran (Nasrekani 2016; Saremi 2013; Saremi 2016), Norway (Almenning 2015), Turkey (Turan 2015), the UK (Mani 2018), Sweden (Jedel 2011; Leonhardt 2015; Stener‐Victorin 2009; Stener‐Victorin 2012; Stener‐Victorin 2013) or Italy (Vigorito 2007).
Study durations were: 8 weeks (Saremi 2013; Saremi 2016; Stefanaki 2015; Turan 2015); 10 weeks (Almenning 2015); 12 weeks (Brown 2009;Mirfeizi 2013; Guzick 1994; Nasrekani 2016; Vigorito 2007; Vizza 2016); 16 weeks ( Stener‐Victorin 2009‐2013); 24 weeks (Hoeger 2008); 48 weeks (Hoeger 2004); and 12 months (Mani 2018). There were no short‐term studies; 15 were medium‐term and two were long‐term studies.
The lifestyle intervention was either a structured physical activity intervention (Almenning 2015; Brown 2009; Nasrekani 2016; Saremi 2013; Saremi 2016; Stener‐Victorin 2009‐2013; Turan 2015; Vigorito 2007; Vizza 2016), a combined dietary and exercise intervention (Guzick 1994; Hoeger 2004; Hoeger 2008; Mani 2018; Mirfeizi 2013), or a behavioural intervention (Stefanaki 2015). Interventions were designed to specifically induce weight loss (Guzick 1994; Hoeger 2004; Hoeger 2008), not specifically induce weight loss (Almenning 2015; Mani 2018; Mirfeizi 2013; Nasrekani 2016; Saremi 2013; Saremi 2016; Stefanaki 2015; Turan 2015; Vigorito 2007; Vizza 2016), or to be about weight maintenance (Brown 2009; Jedel 2011; Leonhardt 2015; Stener‐Victorin 2009; Stener‐Victorin 2012; Stener‐Victorin 2013).
As detailed below, under the inclusion criteria, studies specifically assessed overweight participants (Guzick 1994; Hoeger 2004; Hoeger 2008; Mani 2018; Vigorito 2007), or did not specifically assess overweight participants. Control groups either received no lifestyle advice (Brown 2009; Guzick 1994; Hoeger 2004; Nasrekani 2016; Stefanaki 2015; Vizza 2016), or minimal lifestyle advice (Almenning 2015; Mani 2018; Hoeger 2008; Jedel 2011; Leonhardt 2015; Stener‐Victorin 2009; Stener‐Victorin 2012; Stener‐Victorin 2013; Turan 2015; Vigorito 2007).
Participants
The PCOS diagnosis was either consistent with the ESHRE/ASRM criteria (ESHRE/ASRM 2004): two of three of hyperandrogenism, oligo‐ or anovulation or ultrasound polycystic ovary (PCO) morphology (Almenning 2015; Jedel 2011; Leonhardt 2015; Mani 2018; Nasrekani 2016; Saremi 2013; Saremi 2016; Stefanaki 2015; Stener‐Victorin 2009; Stener‐Victorin 2012; Stener‐Victorin 2013; Turan 2015; Vigorito 2007); or consistent with the National Institutes of Health (NIH) (Zawadski 1992) two criteria of anovulation and hyperandrogenism (clinical or biochemical) (Brown 2009; Guzick 1994; Hoeger 2004; Hoeger 2008), with the exclusion of other disorders; or as confirmed by a general practitioner or specialist (Vizza 2016).
The main inclusion criteria were as follows.
-
Overweight or obese (Guzick 1994; Hoeger 2004; Hoeger 2008; Mani 2018; Mirfeizi 2013; Vigorito 2007).
-
Aged one year postmenarchal 12 to 18 years (Hoeger 2008), 15 to 40 years (Stefanaki 2015), 18 to 37 years (Jedel 2011; Leonhardt 2015; Stener‐Victorin 2009; Stener‐Victorin 2012; Stener‐Victorin 2013), 18 to 42 years (Vizza 2016), 18 to 50 years (Brown 2009), 18 to 49 years (Mani 2018), 20 to 40 years (Guzick 1994) or not specified (Almenning 2015; Hoeger 2004; Nasrekani 2016; Saremi 2013; Saremi 2016; Turan 2015; Vigorito 2007).
The main exclusion criteria were as follows.
-
Pregnancy (Almenning 2015; Brown 2009; Hoeger 2004; Mani 2018; Vigorito 2007) or recent breastfeeding (Brown 2009; Jedel 2011; Leonhardt 2015; Stener‐Victorin 2009; Stener‐Victorin 2012; Stener‐Victorin 2013; Stefanaki 2015).
-
Impaired glucose tolerance (Vigorito 2007), type 2 diabetes (known or elevated fasting glucose) (Hoeger 2004; Mani 2018; Turan 2015) or fasting hyperglycaemia (Brown 2009).
-
Pre‐study use of medication: oral contraceptives, glucocorticoids, anti‐androgens, ovulation induction agents, anti‐diabetic, anti‐obesity, other hormonal drugs within the previous six months or during study (Vigorito 2007), hormonal medication (Hoeger 2004), oral contraceptives, oestrogen or progestin or other drugs known to affect lipoprotein metabolism within two months of the study (Hoeger 2008) or hormonal contraceptive use, antiandrogen therapy, use of medications known to affect carbohydrate metabolism (metformin and thiazolidinediones) within past 90 days (Brown 2009) or medication use for less than three months (Stener‐Victorin 2009‐2013).
-
Concurrent treatments: no use of insulin sensitisers, anti‐androgen therapy, anti‐hypertensives, corticosteroid or statin therapy (Almenning 2015; Hoeger 2008; Mani 2018) or drugs that are known to affect gonadotrophin secretion or ovulation (Almenning 2015; Hoeger 2008; Saremi 2013) during the study. For Hoeger 2004, one control took progestin for 10 days for unscheduled heavy bleeding at week 16.
-
Neoplastic disease (Brown 2009; Guzick 1994; Vigorito 2007), cardiovascular disorder (Guzick 1994; Saremi 2013; Turan 2015; Vigorito 2007), cerebrovascular disease (Guzick 1994), concurrent medical illness (e.g. heart failure, lung) (Vigorito 2007; Turan 2015), significant ovarian surgery (Hoeger 2008), psychiatric disorders (Guzick 1994; Stefanaki 2015).
-
Abnormal kidney or liver function (Guzick 1994; Hoeger 2004; Hoeger 2008; Saremi 2013; Turan 2015; Vigorito 2007).
-
Regular exercise (Almenning 2015; Brown 2009; Hoeger 2008; Saremi 2013).
-
Smoking (Hoeger 2008; Saremi 2016), current alcohol use or history of substance abuse (Hoeger 2008).
At baseline, participants in the intervention and control groups were comparable with the exception of Brown 2009, where intervention participants were significantly older.
With regards to comparisons between studies, overweight was an inclusion criterion in six studies (Guzick 1994; Hoeger 2004; Hoeger 2008; Mani 2018; Mirfeizi 2013; Vigorito 2007). As impaired glucose tolerance was excluded in participants in five studies (Brown 2009; Hoeger 2004; Mani 2018; Turan 2015; Vigorito 2007), this potentially introduced participants with worsened glucose tolerance for the remaining studies, which could impact on the baseline or end score glucose. In Hoeger 2008, one participant had type 2 diabetes, six impaired glucose tolerance and four impaired fasting glucose, although it was not stated whether these were from the intervention, control or additional arms of the study.
Interventions
The studies assessing structured physical activity interventions consisted of the following.
-
Three supervised 40‐minute training sessions/week at 60% to 70% VO2 max (Vigorito 2007).
-
Individualised prescriptions (average of 228 minutes/week at 40% to 60% peak VO2) (Brown 2009).
-
Thirty to 45 minutes of moderate exercise beyond daily physical activity with pulse frequency above 120 beats/minute (Jedel 2011; Leonhardt 2015; Stener‐Victorin 2009; Stener‐Victorin 2012; Stener‐Victorin 2013).
-
Three weekly sessions of high‐intensity interval training (90% to 95% individual heart rate maximum or strength training of eight drills with a resistance of 75% of one repetition maximum with 10 reps and three sets) (Almenning 2015).
-
Three supervised sessions per week of aerobic training at 40% to 65% maximum heart rate reserve (Nasrekani 2016).
-
Three sessions of 40 to 60 minutes per week of an aerobic training programme (Saremi 2013).
-
Three supervised sessions per week of resistance exercise with placebo or calcium supplementation (Saremi 2016).
-
Three supervised sessions per week (50 to 60 minutes per session) of a structured exercise programme (Turan 2015).
-
Two supervised progressive resistance training sessions per week (60 minutes per session) (Vizza 2016).
For studies assessing a combined lifestyle intervention, the interventions were as follows:
-
Meal replacement formula diet (Optifast) with meals and multivitamin supplements (energy intake 4200 to 5040 kJ/day), behavioural modification training and individualised energy expenditure goals in a non‐supervised environment (Guzick 1994).
-
Dietary, exercise and behavioural intervention aiming for a 7% to 10% weight loss through individual and group dietitian and exercise physiologist meetings weekly from weeks 0 to 24 and bi‐weekly from weeks 25 to 48 and individualised meal (2100 to 4200 kJ/day energy deficit) and exercise plans (150 minutes/week) (Hoeger 2004). Hoeger 2008 was based on the methodology of Hoeger 2004, with weekly group or individual training classes for diet, exercise and behavioural modification skills with overall therapy goals of a weight loss of 5% to 7% and a weekly level of exercise of at least 150 minutes/week.
-
A single session consisting of seven hours of interactive group discussion that included diet and physical activity and self‐management in PCOS (Mani 2018).
-
An eight‐week mindfulness stress management programme through a 30‐minute audio CD. Participants were required to participate daily in the programme (Stefanaki 2015).
No studies reported any financial compensation received by the study participants or costs incurred by participants.
The number of visits often differ between intervention and control groups, with more visits in the intervention groups:
-
24 versus six visits (Hoeger 2008).
-
36 versus 12 visits (Hoeger 2004).
-
39 versus three visits (Vigorito 2007).
-
24 versus one visit (Turan 2015).
There were also other potential confounders in the intervention duration, type or delivery. In Brown 2009 the study duration was longer for the intervention group compared to the controls. In addition, in Hoeger 2004 both the intervention and control groups received a placebo. The participant population in the study Hoeger 2008 was adolescents as opposed to adults and participants also attended the dietary, exercise and behavioural visits with a parent or guardian. In Stefanaki 2015, participants included both adolescents and adults.
Intervention compliance was reported for Almenning 2015 (87% compliance in the strength‐training group and 90% compliance in the high‐intensity interval training group), Mani 2018 (77% attended sessions, none recorded time duration for physical activities), Vizza 2016 (76% adherence to progressive resistance training and 43% adherence to home‐based callisthenics training, Hoeger 2008 (for the intervention group four participants attended < 50% of the lifestyle sessions and the remaining attended at least 75% of sessions), Vigorito 2007 (exercising women attended an average or 28 ± 2 sessions with an accuracy of 0.78 indicating number of expected sessions/effective sessions performed) and Brown 2009 (mean adherence rate, defined as minutes of exercise at a prescribed heart rate completed divided by minutes prescribed, of 89.8%).
Outcomes
For the primary fertility outcomes, two studies reported on pregnancy data (two pregnancies in the lifestyle arm (Hoeger 2004) and three pregnancies in the entire study (Jedel 2011; Leonhardt 2015; Stener‐Victorin 2009; Stener‐Victorin 2012; Stener‐Victorin 2013). In Hoeger 2004 only 2 of 20 participants were actively seeking pregnancy prior to the intervention and in Stener‐Victorin et al (Stener‐Victorin 2009‐2013) no participants were actively seeking pregnancy prior to the intervention. For these studies, pregnancy was not a defined outcome or aim of the study. We therefore excluded this variable from the analysis.
No studies reported live birth or miscarriage.
For the secondary reproductive outcomes, four studies reported on menstrual regularity (Hoeger 2004; Hoeger 2008; Jedel 2011; Leonhardt 2015; Stener‐Victorin 2009; Stener‐Victorin 2012; Stener‐Victorin 2013; Vigorito 2007). Three studies reported on ovulation (Guzick 1994; Hoeger 2004; Hoeger 2008).
For the secondary endocrine outcomes, 10 studies reported on total testosterone (Almenning 2015; Guzick 1994; Hoeger 2004; Hoeger 2008; Jedel 2011; Leonhardt 2015; Mani 2018; Mirfeizi 2013; Stener‐Victorin 2009; Stener‐Victorin 2012; Stener‐Victorin 2013; Turan 2015; Vigorito 2007; Vizza 2016), nine studies reported on sex hormone‐binding globulin (SHBG) (Almenning 2015; Guzick 1994; Hoeger 2004; Hoeger 2008; Jedel 2011; Leonhardt 2015; Mani 2018; Mirfeizi 2013; Stener‐Victorin 2009; Stener‐Victorin 2012; Stener‐Victorin 2013; Vigorito 2007; Vizza 2016), and six studies reported on free androgen index (FAI) or Ferriman‐Gallwey score (Almenning 2015; Vizza 2016; Hoeger 2004; Hoeger 2008; Jedel 2011; Leonhardt 2015; Stener‐Victorin 2009; Stener‐Victorin 2012; Stener‐Victorin 2013; Vigorito 2007).
For secondary anthropometric factors, nine studies reported on weight (Almenning 2015; Hoeger 2008; Mani 2018; Nasrekani 2016; Saremi 2013; Saremi 2016; Stener‐Victorin 2009‐2013; Vigorito 2007; Vizza 2016), with separate analyses performed due to the use of different scales (% change in weight (Hoeger 2004) and kg in weight (Almenning 2015; Hoeger 2008; Mani 2018; Nasrekani 2016; Saremi 2013; Vigorito 2007; Vizza 2016). Twelve studies reported on BMI (Almenning 2015; Hoeger 2004; Hoeger 2008; Jedel 2011; Leonhardt 2015; Mani 2018; Nasrekani 2016; Saremi 2013; Saremi 2016; Stefanaki 2015; Stener‐Victorin 2009; Stener‐Victorin 2012; Stener‐Victorin 2013; Turan 2015; Vigorito 2007; Vizza 2016). Eight studies reported on adiposity distribution (Almenning 2015; Guzick 1994; Hoeger 2008; Jedel 2011; Leonhardt 2015; Saremi 2013Stener‐Victorin 2009; Stener‐Victorin 2012; Stener‐Victorin 2013; Turan 2015; Vigorito 2007; Vizza 2016), with separate analyses performed due to the use of different scales (waist circumference (Almenning 2015; Hoeger 2008; Saremi 2013; Turan 2015; Vigorito 2007; Vizza 2016) and waist to hip ratio (WHR) (Guzick 1994; Jedel 2011; Leonhardt 2015; Saremi 2013; Stener‐Victorin 2009; Stener‐Victorin 2012; Stener‐Victorin 2013; Vigorito 2007).
For secondary metabolic outcomes, three studies reported on area under the curve (AUC) insulin (Hoeger 2004; Hoeger 2008; Vigorito 2007) or glucose tolerance (OGTT glucose) (Hoeger 2004; Hoeger 2008; Vigorito 2007), with the meta‐analysis calculated using the SMD for the endpoint 120‐minute or 180‐minute AUC glucose or insulin. Nine studies reported on endpoint lipids (Almenning 2015; Hoeger 2004; Hoeger 2008; Jedel 2011; Leonhardt 2015; Mani 2018; Saremi 2013; Saremi 2016; Stener‐Victorin 2009; Stener‐Victorin 2012; Stener‐Victorin 2013; Turan 2015; Vigorito 2007). Eleven studies reported on fasting glucose or fasting insulin (Almenning 2015; Guzick 1994; Hoeger 2004; Hoeger 2008; Jedel 2011; Leonhardt 2015; Mani 2018; Saremi 2013; Saremi 2016; Stener‐Victorin 2009; Stener‐Victorin 2012; Stener‐Victorin 2013; Turan 2015; Vigorito 2007; Vizza 2016).
Three studies reported quality of life (Jedel 2011; Leonhardt 2015; Stefanaki 2015; Stener‐Victorin 2009; Stener‐Victorin 2012; Stener‐Victorin 2013; Vizza 2016). No studies reported participant satisfaction data.
Excluded studies
We excluded a total of 80 studies after full‐text consideration. The reasons for excluding 49 studies are presented in the Characteristics of excluded studies table (Asemi 2015; Atiomo 2009; Azadi‐Yazdi 2017; Beena 2016; Bruner 2006; Curi 2012; Ebrahimi 2014; Foroozanfard 2017; Fux Otta 2010; Giallauria 2008; Glueck 2006; Gower 2015; Hamayeli 2010; Hutchison 2012; Jakubowicz 2013; Jiskoot 2017; Johnson 2015; Kim 2013; Konopka 2015; Legro 2015; Marzouk 2015; Mehrabani 2012; Moran 2006; Moran 2010a; Nidhi 2012; Nybacka 2013; Orio 2008; Orio 2016; Ornstein 2011; Palomba 2008; Palomba 2010; Panico 2014; Papakonstantinou 2016; Pasquali 1986; Pasquali 2000; Pekhlivanov 2006; Roessler 2013; Sa 2016; Sordia‐Hernandez 2016; Sorensen 2012; Sprung 2013; Talluto 2002; Tang 2006; Thomson 2008; Thomson 2016; Toscani 2011; Turner‐McGrievy 2014; Wong 2016; Zarrinkoub 2005).
In total, we excluded 62 due to the absence of a comparator group with minimal intervention; six due to the study not being an RCT, five due to presentation of data in an abstract or protocol only, two due to participants not having PCOS, one because we were unable to obtain full texts, one that was a review with no original data, one because there were no results from PCOS patients, one that was a duplicate report and one due to an irrelevant outcome.
Risk of bias in included studies
Our assessment of risk of bias in the included studies is presented in Figure 1 and Figure 2.
Allocation
Sequence generation
Eight studies described adequate methods of generating randomised sequences (computer generation) (Almenning 2015; Brown 2009; Hoeger 2004; Hoeger 2008; Jedel 2011; Leonhardt 2015; Stefanaki 2015Stener‐Victorin 2009; Stener‐Victorin 2012; Stener‐Victorin 2013; Turan 2015; Vizza 2016), whereas insufficient information was provided for the other studies, which may introduce selection bias (Guzick 1994; Mani 2018; Mirfeizi 2013; Nasrekani 2016; Saremi 2013; Saremi 2016; Vigorito 2007).
Allocation concealment
Seven studies described adequate allocation concealment from both the participants and investigators (Almenning 2015; Brown 2009; Hoeger 2004; Hoeger 2008; Mani 2018; Turan 2015; Vizza 2016), whereas there was a lack of information provided for the other studies to determine whether adequate allocation concealment occurred, which may introduce selection bias (Guzick 1994; Jedel 2011; Leonhardt 2015; Mirfeizi 2013; Nasrekani 2016; Saremi 2013; Saremi 2016; Stefanaki 2015Stener‐Victorin 2009; Stener‐Victorin 2012; Stener‐Victorin 2013; Vigorito 2007).
Blinding
Blinding of participants and personnel
In all studies, participant or treatment provider blinding was not possible as it is difficult to blind participants and treatment providers to behavioural interventions. This could be a potential source of performance and detection bias in favour of the treatment group. This is more relevant for participant‐reported outcomes such as menstrual diaries (Hoeger 2004; Hoeger 2008; Jedel 2011; Leonhardt 2015; Stener‐Victorin 2009; Stener‐Victorin 2012; Stener‐Victorin 2013; Vigorito 2007) and quality of life measures (Jedel 2011; Leonhardt 2015; Stefanaki 2015; Stener‐Victorin 2009; Stener‐Victorin 2012; Stener‐Victorin 2013; Vizza 2016). As no participant‐reported outcomes occurred for Guzick 1994 and Brown 2009 the lack of participant blinding is unlikely to introduce bias in these studies. Clinician blinding occurred in five studies (Hoeger 2004; Hoeger 2008; Jedel 2011; Leonhardt 2015; Saremi 2013; Stener‐Victorin 2009; Stener‐Victorin 2012; Stener‐Victorin 2013; Vigorito 2007). No blinding occurred in five studies (Almenning 2015; Mani 2018; Stefanaki 2015; Turan 2015; Vizza 2016). Insufficient information was provided to determine whether blinding occurred in six studies (Brown 2009; Guzick 1994; Saremi 2013; Saremi 2016; Mirfeizi 2013; Nasrekani 2016).
Blinding of outcome assessors
Outcome assessor or data analyst blinding occurred in six studies (Almenning 2015; Hoeger 2004; Hoeger 2008; Jedel 2011; Leonhardt 2015; Stefanaki 2015; Stener‐Victorin 2009; Stener‐Victorin 2012; Stener‐Victorin 2013; Vigorito 2007). There was a lack of blinding of outcome assessors in three studies (Mani 2018; Turan 2015; Vizza 2016), which may introduce detection bias. Lack of blinding in outcome assessors may introduce bias for the clinician‐ or assessor‐reported outcomes of hirsutism, weight, BMI and adiposity distribution and the objective outcomes of ovulation or biochemical data.
Incomplete outcome data
Three studies reported an intention‐to‐treat (ITT) analysis ( Jedel 2011; Leonhardt 2015; Mani 2018; Stener‐Victorin 2009; Stener‐Victorin 2012; Stener‐Victorin 2013; Vizza 2016) and no dropouts were reported in five studies (Guzick 1994; Jedel 2011; Leonhardt 2015; Nasrekani 2016; Saremi 2013; Stener‐Victorin 2009; Stener‐Victorin 2012; Stener‐Victorin 2013; Vigorito 2007). One study had outcome data reported for only a subset of study completers (5/17 physical activity and 7/11 controls) (Jedel 2011; Leonhardt 2015; Stener‐Victorin 2009; Stener‐Victorin 2012; Stener‐Victorin 2013). However, these missing data (n = 12 physical exercise, n = 6 control) are unbalanced between the intervention and control groups. Four studies reported a higher dropout rate for the intervention group than the control group (50% versus 39%) (Jedel 2011; Leonhardt 2015; Stener‐Victorin 2009; Stener‐Victorin 2012; Stener‐Victorin 2013); 27% versus 9% (Hoeger 2008); 62% versus 25% (Brown 2009) and 42% versus 33% (Mani 2018), indicating that the reason for missing outcome data was likely to be related to true outcome and a higher dropout rate for the intervention versus control group potentially giving an over‐exaggeration of treatment effect. The lack of blinding may have contributed to higher levels of dropout from the intervention group. One study reported a higher dropout rate in the control group (35% versus 0%; Stefanaki 2015), possibly related to the control group not receiving any intervention. In Guzick 1994 incomplete outcome data were reported for reproductive parameters for two studies (ovulation data were reported for 10/12 participants), however, the missing outcome data were balanced in numbers across intervention groups with similar reasons for the missing data and we considered this a low risk of bias. For Hoeger 2004, although the dropout rate was higher in the intervention group than in the control group at week 48 (45% versus 22%), two pregnancies occurred in the intervention group indicating a potential positive intervention effect (Hoeger 2004).
Selective reporting
For six studies there was insufficient information to permit a judgement on selective reporting (Hoeger 2004; Mani 2018; Mirfeizi 2013; Nasrekani 2016; Saremi 2016; Stener‐Victorin 2009‐2013). Six studies had a low risk of reporting bias, three of which are registered clinical trials (Almenning 2015; Hoeger 2008; Stefanaki 2015) and the remaining three had reported all pre‐specified outcomes that are of interest to this review (Saremi 2013; Turan 2015; Vizza 2016). Three studies had a high risk of reporting bias due to selective reporting (Brown 2009; Guzick 1994; Vigorito 2007). However, from the results section of these papers, all outcomes that are of interest in the review were reported in the prespecified way with the exception of menstrual data for the controls (Vigorito 2007), weight for the controls (Guzick 1994), and total cholesterol for all participants (Brown 2009).
Other potential sources of bias
We identified no other serious potential sources of bias from the included studies.
Effects of interventions
We conducted analyses for each defined primary or secondary outcome. We excluded Brown 2009 from all meta‐analyses because the data were skewed and reported as median and range with non‐parametric tests of significance. Brown 2009 compared lipid outcomes between intervention and control groups and found that the lifestyle intervention significantly improved triglycerides. We therefore included a total of 14 studies (N = 478) in the meta‐analyses. For studies with ITT, the final number of participants may reflect imputed data instead of the number of completers (Jedel 2011; Leonhardt 2015; Mani 2018; Stener‐Victorin 2009; Stener‐Victorin 2012; Stener‐Victorin 2013; Vizza 2016). We combined both endpoint and change data in the meta‐analysis as suggested by the Cochrane Handbook for Systematic Reviews of Interventions (Higgins 2011).
Primary outcome measures
We found no studies that had looked at live birth, miscarriage or pregnancy.
Secondary outcome measures
1.1. Secondary reproductive: menstrual regularity and ovulation
No studies reported menstrual regularity as defined in the review methods (initiation of menses or significant shortening of cycle length). The studies reported data for this outcome in different ways. Hoeger 2004 reported the data as mean ± SD menstrual cycles for lifestyle versus minimal treatment (24 weeks: 2.88 ± 1.7 versus 2.85 ± 1.6, mean difference (MD) 0.03, 95% confidence interval (CI) ‐1.64 to 1.70, P = 0.97; and 48 weeks: 5.4 ± 3.6 versus 4.3 ± 2.1, MD 1.10, 95% CI ‐2.17 to 4.37, P = 0.51). Vigorito 2007 reported 27 of 45 participants (60%) in the treatment group having normal menstrual cycles with no reported data for the control group. Hoeger 2008 reported an average of 2.3 versus 2.5 cycles per 24 weeks for the lifestyle group compared to controls. In one study, changes in menstrual bleeding pattern were not provided for the intervention group compared with the control group (Jedel 2011; Leonhardt 2015; Stener‐Victorin 2009; Stener‐Victorin 2012; Stener‐Victorin 2013) (Analysis 1.1).
No studies reported ovulation as defined in the review methods (number of ovulatory menstrual cycles). The studies again reported data in different ways. Hoeger 2004 reported the data as mean ± SD ovulations for lifestyle versus minimal treatment (24 weeks: 2.25 ± 1.7 versus 2.23 ± 2.1, MD 0.02, 95% CI ‐1.93 to 1.97, P = 0.98; and 48 weeks: 6.0 ± 3.6 versus 2.8 ± 2.9, MD 3.20, 95% CI ‐1.02 to 7.42, P = 0.14). Guzick 1994 reported 4/6 versus 1/6 participants as ovulatory in the lifestyle group versus the control group (odds ratio (OR) 6.59, 95% CI 0.73 to 59.34, P = 0.09). Hoeger 2008 reported 60% versus 50% ovulatory cycles for the lifestyle group versus the control group (Analysis 1.1).
1.2 Secondary reproductive: endocrine
Lifestyle treatment may result in a slightly greater decrease in total testosterone (MD ‐0.12 nmol/L, 95% CI ‐0.23 to ‐0.02, 10 studies, N = 392, I2 = 5%) and a greater increase in sex hormone‐binding globulin (SHBG) (MD 2.52 nmol/L, 95% CI 0.22 to 4.82, 9 studies, N = 364 participants, I2 = 63%) for lifestyle treatment compared to minimal treatment, with high heterogeneity. Lifestyle intervention may improve the free androgen index (FAI) (MD ‐1.11, 95% CI ‐1.96 to ‐0.26, 6 studies, N = 204, I2 = 71%, low‐quality evidence) (Analysis 1.2; Figure 4).

Forest plot of comparison: 1 Lifestyle intervention versus minimal treatment: Combined data, outcome: 1.2 Secondary reproductive outcomes.
For SHBG, total testosterone and clinical hyperandrogenism (Ferriman‐Gallwey score), mean change instead of post‐intervention data were used for Mani 2018 and Stener‐Victorin 2009‐2013.
For FAI, mean and SD values for Stener‐Victorin 2009‐2013 were calculated from group means and SD for T and SHBG.
There may be a slightly greater reduction in hirsutism (Ferriman‐Gallwey score) (MD ‐1.12, 95% CI ‐2.16 to ‐0.08, 4 studies, N = 166, I2 = 0% ) for lifestyle treatment compared to minimal treatment (Analysis 1.2; Figure 4).
1.3 Anthropometric
There may be greater weight loss (kg) with lifestyle treatment compared to minimal treatment (MD ‐1.68 kg, 95% CI ‐2.66 to ‐0.70, 9 studies, N = 353, I2 = 47%, low‐quality evidence) (Analysis 1.3; Figure 5). There may be a greater reduction in body mass index (BMI) with lifestyle treatment compared to minimal treatment (MD ‐0.34 kg/m2, 95% CI ‐0.68 to ‐0.01, 12 studies, N = 434, I2 = 0%, low‐quality evidence). There may be a greater reduction in waist circumference (MD ‐0.97 cm, 95% CI ‐1.80 to ‐0.14; 7 studies, N = 243, I2 = 22%) (Analysis 1.3; Figure 5) and waist‐hip ratio (MD ‐0.04, 95% CI ‐0.07 to ‐0.01, 4 studies, N = 135, I2 = 0%) (Analysis 1.3; Figure 5) with lifestyle treatment compared to minimal treatment.

Forest plot of comparison: 1 Lifestyle intervention versus minimal treatment: Combined data, outcome: 1.3 Anthropometric outcomes.
For weight, BMI and waist circumference, mean change instead of post‐intervention data were used for Mani 2018 and Stener‐Victorin 2009‐2013.
1.4 to 1.8. Metabolic outcomes
We are uncertain what the effect of lifestyle treatment is on oral glucose tolerance test (OGTT) glucose (SMD ‐0.02, 95% CI ‐0.38 to 0.33, 3 studies, N = 121, I2 = 0%, low‐quality evidence) (Analysis 1.4; Figure 6) or fasting glucose (MD ‐0.07 mmol/L, 95% CI ‐0.15 to 0.01, 11 studies, N = 354, I2=27%) (Analysis 1.5) compared to minimal treatment.
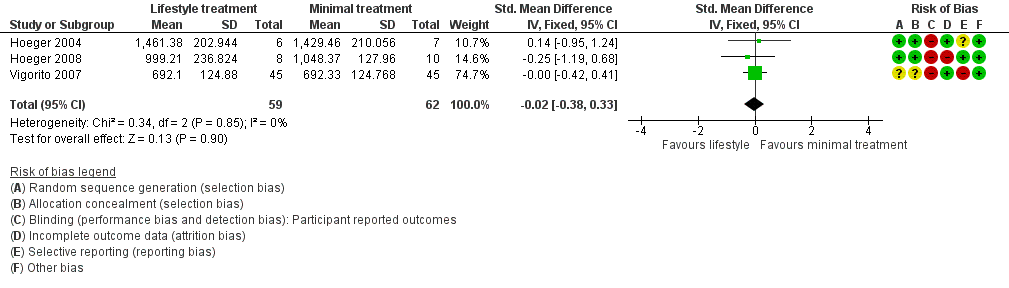
Forest plot of comparison: 1 Lifestyle intervention versus minimal treatment: secondary outcomes and subgroup analyses, outcome: 1.4 Metabolic: oral glucose tolerance test (OGTT) glucose (mmol/L/minute).
There may be a greater reduction in total cholesterol (MD ‐0.14 mmol/L, 95% CI ‐0.25 to ‐0.02; 9 studies, N = 331, I2 = 0%) and low‐density lipoprotein cholesterol (MD ‐0.16 mmol/L, 95% CI ‐0.29 to ‐0.03; 9 studies, N = 326, I2 = 29%) with lifestyle treatment compared to minimal treatment. Lifestyle treatment may make little or no difference to high‐density lipoprotein cholesterol (MD 0.01 mmol/L, 95% CI ‐0.03 to 0.05, 9 studies, N = 327, I2 = 59%) and triglycerides (MD ‐0.02 mmol/L, 95% CI ‐0.06 to 0.02, 9 studies, N = 328, I2 = 21%) (Analysis 1.6) compared to minimal treatment.
Fasting insulin (MD ‐1.42 µU/mL, 95% CI ‐2.44 to ‐0.39, 10 studies, N = 321, I2 = 0%) (Analysis 1.7) and OGTT insulin (standardised mean difference (SMD) ‐1.32, 95% CI ‐1.73 to ‐0.92, 3 studies, N = 121, I2 = 74% ) (Analysis 1.8) may be further reduced with lifestyle treatment compared to minimal treatment, although there was high heterogeneity for the OGTT insulin result.
1.9. Quality of life outcomes
There may be a small beneficial effect on Polycystic Ovary Syndrome Questionnaire (PCOSQ) scores in the domains of emotions (MD 0.77, 95% CI 0.30 to 1.23, 3 studies, N = 95, I2 = 92%) and infertility (MD 0.68, 95% CI 0.21 to 1.14, 3 studies, N = 95, I2 = 87%) with lifestyle treatment compared to minimal treatment, although the heterogeneity was high (Analysis 1.9). Due to the wide confidence intervals, we are uncertain of the effect of lifestyle treatment on PCOSQ scores in the domains of weight (MD ‐0.11, 95% CI ‐0.71 to 0.49; 3 studies, N = 95, I2 = 88%), hirsutism (MD ‐0.01, 95% CI ‐0.57 to 0.56; 3 studies, N = 95, I2 = 56%) and menstrual regularity (MD 0.25, 95% CI ‐0.24 to 0.75; 3 studies, N = 95, I2 = 85%) compared to minimal treatment.
Subgroup analysis
We conducted subgroup analyses for SHBG, FAI, OGTT insulin, high‐density lipoprotein (HDL) cholesterol and quality of life to explore possible sources of statistically significant heterogeneity (I2 value greater than 50%) in these outcomes according to the subgroups determined a priori in the Methods section, such as duration of intervention, types of intervention, weight loss versus weight maintenance studies and participants characteristics (i.e. whether a study included only overweight or obese participants).
There were insufficient studies for meaningful subgroup comparisons for the quality of life outcomes.
For SHBG, studies with a combined diet and physical activity intervention (MD 8.73, 95% CI 3.27 to 14.19; 5 studies, N = 191, I2 = 38%) may result in greater improvement compared with physical activity‐only interventions (MD 1.11, 95% CI ‐1.39 to 3.61; 4 studies, N = 173, I2 = 66%) (Analysis 1.10).
There were no subgroup differences found for FAI (Analysis 1.11) and HDL cholesterol (Analysis 1.12).
For OGTT insulin, a physical activity‐only intervention (SMD ‐1.71, 95% CI ‐2.20 to ‐1.22, 1 study, N = 90) may result in a small but significantly greater decrease compared to combined interventions (SMD ‐0.48, 95% CI ‐1.20 to 0.24, 2 studies, N = 31, I2 = 0%) (Analysis 1.13).
For the quality of life measures, behavioural intervention (Stefanaki 2015) may result in greater improvement than physical activity interventions (Stener‐Victorin 2009‐2013; Vizza 2016) in all PCOSQ domains (Analysis 1.14).
Sensitivity analysis
We conducted sensitivity analyses for BMI and FAI due to their clinical significance. We only included studies with low risk of bias for sequence generation and allocation concealment in the sensitivity analyses. Due to the wide confidence intervals, we are uncertain of the effect of lifestyle intervention on BMI (MD 0.29, 95% CI ‐1.91 to 2.49, 5 studies, N = 99, I2 = 0%) (Analysis 1.15) and FAI (MD ‐0.64, 95% CI ‐2.16 to 0.87, 4 studies, N = 69, I2 = 62%) (Analysis 1.16).
Discussion
Summary of main results
This Cochrane Review supports the benefits of lifestyle treatment in women with polycystic ovary syndrome (PCOS). We were not able to perform a meta‐analysis for primary fertility outcomes such as live birth, miscarriage and pregnancy or secondary reproductive outcomes such as menstrual regularity and ovulation due to a lack of data or reporting of data in a form inappropriate for meta‐analysis. In terms of secondary outcomes, lifestyle intervention may improve free androgen index, weight and body mass index (BMI). We are uncertain of the effect of lifestyle intervention on glucose tolerance. The recent guideline recommends free testosterone, bioavailable testosterone or free androgen index (FAI) to be used to assess biochemical hyperandrogenism (International PCOS Guideline 2018); however, FAI includes markers of insulin resistance such as sex hormone‐binding globulin (SHBG). The current review suggests that lifestyle treatment may improve biochemical and clinical hyperandrogenism. This is consistent with the widespread international recommendations that lifestyle treatment improves fertility and reproductive outcomes in PCOS (International PCOS Guideline 2018; Moran 2009).
This review reports that lifestyle treatment may improve a number of anthropometric markers (weight and BMI) in women with PCOS, with a mean difference in weight for lifestyle compared to minimal treatment of 1.68 kg. A 5% to 10% weight loss is considered clinically significant and is associated with metabolic, reproductive and psychological health benefits (International PCOS Guideline 2018). A 2 kg to 3 kg weight loss is associated with reductions in impaired glucose tolerance prevalence with improvements in risk factors for cardiovascular disease and type 2 diabetes in the general population (Aziz 2015). Overall this review indicates a modest reduction in weight and improvement in abdominal obesity with lifestyle treatment.
We are uncertain of the effect of lifestyle intervention on glucose tolerance and fasting glucose. Fasting glucose is an inferior predictor of abnormal glucose metabolism in PCOS compared to a glucose tolerance test (Vrbikova 2014); however, we also observed the null effect for oral glucose tolerance test (OGTT) glucose. The exclusion criterion of glucose intolerance in a number of studies suggests that where normal glucose tolerance is present, glucose tolerance improvements are less likely to be induced by lifestyle treatment.
This review reports that lifestyle treatment may improve lipid profile, specifically total cholesterol and low‐density lipoprotein (LDL) cholesterol despite the modest weight loss achieved (< 5 kg). As most of the studies reporting lipid outcomes were not weight loss studies and involved only physical activity, these findings are consistent with a recent systematic review and meta‐analysis, which reported that exercise training improves lipid profiles in women with PCOS (Benham 2018). However, significant heterogeneity that was not explained in the subgroup analyses highlights the complex relationship between PCOS and cardiovascular risk (Gunning 2017). The different cardio‐metabolic risks associated with different PCOS phenotypes (Daan 2014) may have also contributed to the heterogenous response to lifestyle intervention.
Insulin resistance is a key aetiological factor in PCOS, associated with increasing severity of PCOS (Androulakis 2014; Landay 2009; Stepto 2013), and it is an independent predictor of impaired glucose tolerance, type 2 diabetes and cardiovascular disease in the general population (Salazar 2016). Improvements in insulin resistance are associated with improvements in the clinical features of PCOS (Moran 2003; Morley 2017) and are therefore potential surrogate markers for lifestyle intervention success in PCOS. We report that lifestyle intervention may reduce surrogate markers of insulin resistance compared to minimal treatment, as evident from improvements in waist circumference and OGTT insulin. Given the role of insulin resistance in the pathophysiology and co‐morbidities of PCOS, the improvement in these markers is an important finding of this review.
The deleterious effect of PCOS on quality of life, anxiety and depression is increasingly recognised and these are important issues to treat in conjunction with anthropometric, reproductive and metabolic outcomes. Lifestyle intervention may improve quality of life scores in the domains of emotions and infertility in PCOS, as reported in this review. The studies that reported quality of life outcomes studied physical activity (Jedel 2011; Leonhardt 2015; Stener‐Victorin 2009; Stener‐Victorin 2012; Stener‐Victorin 2013; Vizza 2016) or stress management (Stefanaki 2015) interventions. A significant association between physical activity and positive emotions has been observed in the general population (Richards 2015), which may explain the improvement in the emotions domain of the PCOSQ score resulting from these interventions. Lifestyle interventions in this review also resulted in significant improvements in the infertility domain of the PCOSQ score. It is unclear if this reflected actual improvements in menstrual cyclicity, which were poorly reported in these studies. No studies reported on patient satisfaction, which indicates a considerable gap in the research literature.
Overall completeness and applicability of evidence
The identified studies are not sufficient to address the effect of lifestyle intervention on the primary outcomes of this review. The lack of fertility outcomes (live birth, miscarriage and pregnancy) as a specified endpoint in any of the studies means that no statement can be made as to the effects of lifestyle treatment on these primary outcomes. There is also insufficient evidence to address a number of secondary outcomes of the review; for example, there was a lack of reporting or incomplete reporting of menstrual regularity and ovulation. Participant satisfaction was not a measured outcome in any of the included literature.
We aimed to assess a range of intervention durations (short, medium and long‐term), types (exercise, behaviour, diet or combined; and weight loss or weight maintenance) and participants (overweight or not overweight) to consider the clinical utility of lifestyle treatment according to participant preference and available resources. Subgroup differences were observed for SHBG and triglycerides, with greater intervention effects in weight loss studies, studies with combined diet and physical activity interventions and studies of longer duration (over six months). Given the limited number of studies identified and the small sample sizes for other outcomes, subgroup analysis according to these predefined criteria was not feasible and the inclusion of these ranges of methodologies resulted in clinical heterogeneity. The limited duration of most trials in this review (13 of 15 with a duration of six months or less) may have impacted on effect size especially for weight loss. We also noted clinical heterogeneity in the intensity of the control group intervention, with this differing as to whether this was no intervention or standard minimal advice. However, the studies are similar enough to make meaningful comparisons and we still observed the effect of lifestyle intervention on a number of outcomes, indicating its likely utility in a range of settings. It is also recommended in the International Evidence‐based Guidelines for Assessment and Management of PCOS (International PCOS Guideline 2018). With regards to current international clinical practice, the effects of lifestyle treatment for PCOS on biochemical and clinical hyperandrogenism, adiposity and adiposity distribution, metabolic outcomes, surrogate markers of insulin resistance and quality of life are supported by this review. In areas where direct evidence is lacking, the recent guidelines for PCOS strongly recommend healthy eating and physical activity in women with PCOS to improve hormonal outcomes, general health and quality of life based on clinical consensus (International PCOS Guideline 2018). With regards to the application of types of lifestyle treatment or specific subpopulations within PCOS, further targeted research is required. This is of particular interest when generalising the results of the review to specific populations, interventions and settings, given that not all women with PCOS are overweight or obese. In these settings, the effect of lifestyle treatment independent of weight loss is of great clinical interest.
There are a range of other issues potentially affecting clinical heterogeneity that were not assessed in this review. All studies assessed adults except two, which included adolescents (Hoeger 2008; Stefanaki 2015). In one of these studies, participants also attended the lifestyle visits with a parent or guardian, which could indicate improved compliance and motivation (Hoeger 2008). Reproductive and metabolic features may differ between women with PCOS diagnosed by different criteria, with the National Institutes of Health (NIH) diagnosed women considered to have more severe disease than those diagnosed with the European Society for Human Reproduction and Embryology/American Society for Reproductive Medicine (ESHRE/ASRM criteria). Hence, the variability in diagnostic criteria may have introduced further clinical heterogeneity (Moran 2009b). The different country settings and populations studied may also introduce cultural or ethnic heterogeneity (Essah 2008).
Factors relating to the implementation of a lifestyle intervention in research or clinical settings, including intervention intensities, visit numbers, training of intervention providers and group versus individual treatment formats, may impact on the effectiveness of the intervention. This indicates the need for caution in extrapolating research results to clinical practice.
Quality of the evidence
In this review, we assessed 15 studies with a total of 498 participants. The majority of the studies had small sample sizes (11 to 45 participants) with the exception of two studies with sample sizes of 90 to 100 women (Mani 2018; Vigorito 2007). This has implications for the power of all analyses. For the meta‐analyses, we were only able to include 14 studies with a total of 478 participants due to the skewed data in Brown 2009. Three studies carried out intention‐to‐treat (ITT) analyses ( Jedel 2011; Leonhardt 2015; Mani 2018; Stener‐Victorin 2009; Stener‐Victorin 2012; Stener‐Victorin 2013; Vizza 2016), only seven studies had predefined power calculations (Almenning 2015; Brown 2009; Jedel 2011; Leonhardt 2015; Mani 2018; Nasrekani 2016; Saremi 2013; Saremi 2016; Stener‐Victorin 2009; Stener‐Victorin 2012; Stener‐Victorin 2013), and high dropout rates were reported for the majority of studies, with the exception of Guzick 1994 and Vigorito 2007, indicating methodological weaknesses and the need for caution in results interpretation.
Inconsistent outcomes were reported with few studies covering all predefined endpoints. We observed imprecision for several outcomes with large confidence intervals and different directions of effect reported (summary of findings Table for the main comparison). There was significant heterogeneity in the findings for SHBG, FAI, high‐density lipoprotein (HDL) cholesterol, OGTT insulin and quality of life, suggesting the need for caution in interpreting the pooled results. We did not meet the predefined objective of examining outcomes according to subgroup by intervention duration and type due to the lack of data in the primary outcome analysis. Regarding the risk of bias, we noted lack of evidence of adequate allocation concealment or random sequence generation for nine studies and lack of evidence of adequate clinician, outcome or data analyst blinding for 12 studies. We also noted incomplete outcome data for five studies mostly due to higher dropout rates from the intervention group compared to the minimal treatment group, potentially exaggerating treatment effects. We also noted selective outcome reporting for four studies. All of these introduce selection bias, performance bias, detection bias and attrition bias, which compromises the quality of the evidence. It is acknowledged that there are inherent challenges in reducing performance bias in trials designed to assess lifestyle interventions compared to no treatment and in reducing detection bias for clinical outcomes that rely on participants' self‐report, such as menstrual diaries. As a result of these challenges in addition to the shortcomings of the trial design as described above, the overall the quality of the evidence was low.
We conducted sensitivity analyses of studies with low risk of bias for sequence generation and allocation concealment. Due to the wide confidence intervals we could not conclude with certainty what the effect of lifestyle intervention was on BMI and FAI.
Potential biases in the review process
This review was conducted according to Cochrane methodology, with a predefined protocol. We aimed to minimise reporting bias by ensuring a comprehensive search for eligible studies and by being alert for duplication of data. Funnel plots were largely symmetrical for total testosterone, BMI, weight, fasting glucose and fasting insulin, suggesting a low risk of publication bias. We were unable to examine whether publication bias was present for other outcomes as we were not able to construct a funnel plot due to the small number of identified studies. We also attempted to address within‐trial bias through carefully assessing studies for within‐study reporting bias, such as trials failing to report obvious outcomes or reporting them in insufficient detail to allow inclusion, and we have included this level of detail in the 'Risk of bias' tables (Characteristics of included studies). As the systematic review included a narrow range of studies according to the eligibility criteria, a large number of studies that provide useful information on the topic of lifestyle management in PCOS were excluded. In particular, there were many studies that compared different dietary approaches or interventions that include medications, but these were not included in the present review as it did not allow for the assessment of the effect of lifestyle modification by itself. We were also unable to include the results of one study due to the results being reported as median and interquartile range. This study reported significant improvements in triglycerides after the exercise intervention compared to the control treatment (Brown 2009).
Agreements and disagreements with other studies or reviews
We identified two other systematic reviews on the effect of lifestyle treatment in PCOS (Domecq 2013; Haqq 2014; Haqq 2015). We identified an international position statement by the Androgen Excess PCOS Society (AEPCOS), which consisted of a systematic search strategy but included studies of all levels of evidence with no systematic review of methodological quality (Moran 2009). This paper reviewed a number of intervention studies on lifestyle treatment in PCOS that were of a lower quality of evidence. Study designs consisted of non‐comparison intervention studies in PCOS with no minimal treatment arm, comparisons with different non‐PCOS populations or comparisons to different types of lifestyle interventions. We also identified an international evidence‐based guideline on the assessment and management of PCOS for which the lifestyle section was based on the previous version of this review (International PCOS Guideline 2018; Moran 2011).
Past reviews have generally indicated the positive effects of lifestyle treatment on anthropometric, reproductive (biochemical and clinical hyperandrogenism, menstrual function, ovulation, pregnancy and conception), metabolic (fasting insulin, fasting glucose, glucose tolerance, lipid profiles, surrogate markers of insulin resistance) and quality of life endpoints. In this current review, we found that lifestyle treatment may improve reproductive (biochemical and clinical hyperandrogenism), anthropometric (adiposity, adiposity distribution) and metabolic features (markers of insulin resistance and cholesterol levels) and quality of life (emotions and infertility). We are unable to confirm the effects of lifestyle intervention on reproductive fertility outcomes, menstrual regularity and ovulation as these were not reported in a format that could be assessed in this review. In contrast with previous reviews, we could not conclude with certainty what the effect of lifestyle treatment was on fasting glucose (Domecq 2013). The inclusion of more recent studies in the current review with differing effects may have contributed to the discrepant conclusions. Similar to the previous review, we found little or no effect of lifestyle intervention on HDL cholesterol and triglycerides (Haqq 2015).
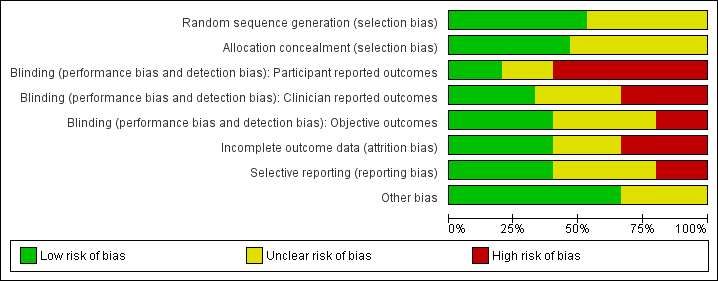
'Risk of bias' graph: review authors' judgements about each methodological quality item presented as percentages across all included studies.

'Risk of bias' summary: review authors' judgements about each methodological quality item for each included study.

Study flow diagram.
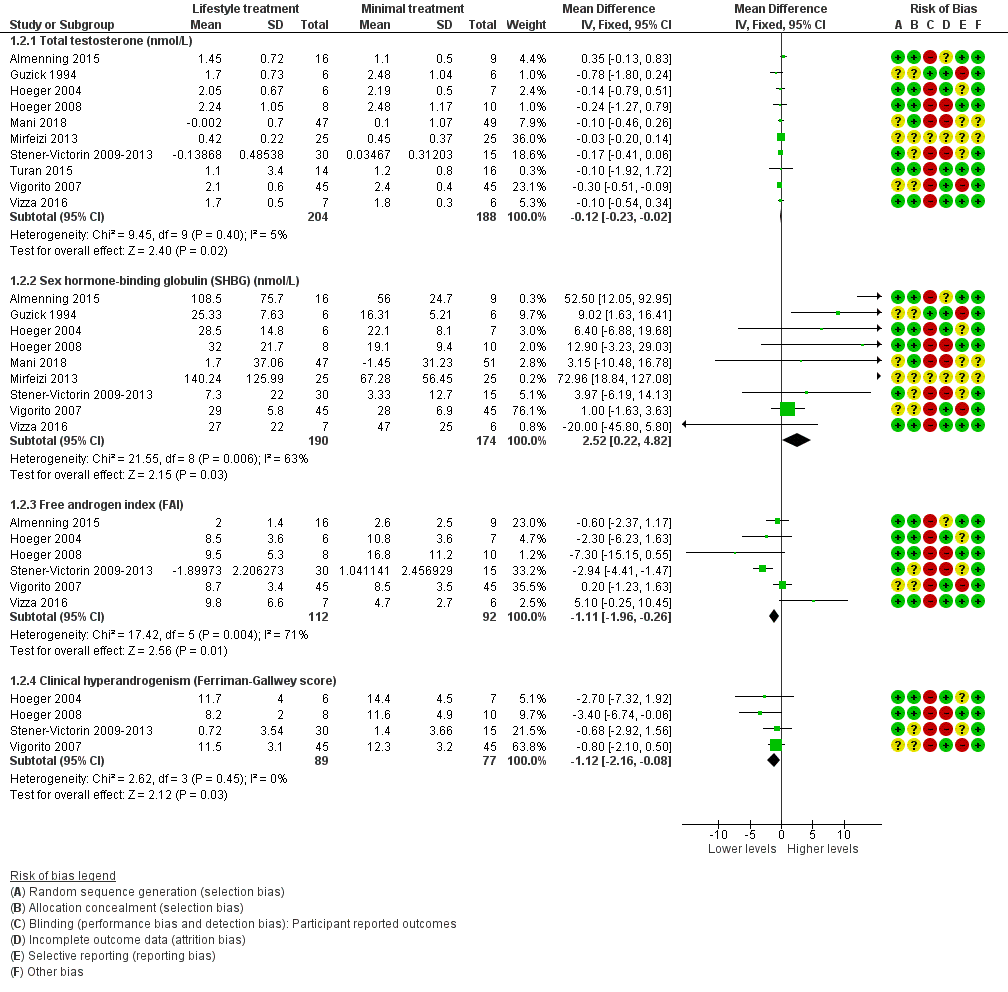
Forest plot of comparison: 1 Lifestyle intervention versus minimal treatment: Combined data, outcome: 1.2 Secondary reproductive outcomes.
For SHBG, total testosterone and clinical hyperandrogenism (Ferriman‐Gallwey score), mean change instead of post‐intervention data were used for Mani 2018 and Stener‐Victorin 2009‐2013.
For FAI, mean and SD values for Stener‐Victorin 2009‐2013 were calculated from group means and SD for T and SHBG.

Forest plot of comparison: 1 Lifestyle intervention versus minimal treatment: Combined data, outcome: 1.3 Anthropometric outcomes.
For weight, BMI and waist circumference, mean change instead of post‐intervention data were used for Mani 2018 and Stener‐Victorin 2009‐2013.

Forest plot of comparison: 1 Lifestyle intervention versus minimal treatment: secondary outcomes and subgroup analyses, outcome: 1.4 Metabolic: oral glucose tolerance test (OGTT) glucose (mmol/L/minute).
| Study | Menstrual regularity | Ovulation |
| Brown 2009 | No data | No data |
| Guzick 1994 | No data | 4/6 people ovulatory versus 1/6 people ovulatory OR 6.59, 95% CI 0.73 to 59.34, P = 0.09 |
| Hoeger 2004 | Menstrual cycles per participant (mean ± SD) 24 weeks: 2.88 ± 1.7 versus 2.85 ± 1.6 MD 0.03, 95% CI ‐1.64 to 1.70, P = 0.97 48 weeks: 5.4 ± 3.6 versus 4.3 ± 2.1 MD 1.10, 95% CI ‐2.17 to 4.37, P = 0.51 Number of menstrual events (mean): 48 weeks: 6.2 versus 4.7 | Ovulations per participant (mean±SD) 24 weeks: 2.25 ± 1.7 versus 2.23 ± 2.1 MD 0.02, 95% CI ‐1.93 to 1.97, P = 0.98 48 weeks: 6.0 ± 3.6 versus 2.8 ± 2.9 based on n = 4 intervention and n = 6 control patients MD 3.20, 95% CI ‐1.02 to 7.42, P = 0.14 Ovulations (mean): 48 weeks: 3.5 versus 2.7 Ovulations/menstrual cycle 24 weeks: ovulations/menstrual cycle: 18/23 (78.2%) versus 16/20 (80%) 48 weeks: ovulations/menstrual cycle: 25/29 (86.2%) versus 17/28 (60.7%) |
| Hoeger 2008 | Mean 2.3 versus 2.5 cycles/24 weeks No reported significant difference in menstrual cycles for lifestyle versus minimal treatment | 60% ovulatory cycles versus 50% ovulatory cycles No comment on significance of comparison for lifestyle versus minimal treatment |
| Stener‐Victorin 2009‐2013 | Change in menstruation frequency (month) after 16 weeks of intervention (mean ± SD) Intervention: 0.14 ± 0.33 Control: ‐0.04 ± 0.007 Change in menstruation frequency (month) at 16 weeks follow‐up (16 weeks after last intervention treatment) Intervention: 0.11 ± 0.36 Control: ‐0.04 ± 0.07 No comment on significance of comparison for lifestyle versus minimal treatment | |
| Vigorito 2007 | 27/45 (60%) of treatment normal menstrual cycles No data reported for minimal treatment group No comment on significance of comparison for lifestyle versus minimal treatment | No data |
Comparison 1 Lifestyle intervention versus minimal treatment: secondary outcomes and subgroup analyses, Outcome 1 Secondary reproductive: menstrual regularity and ovulation.
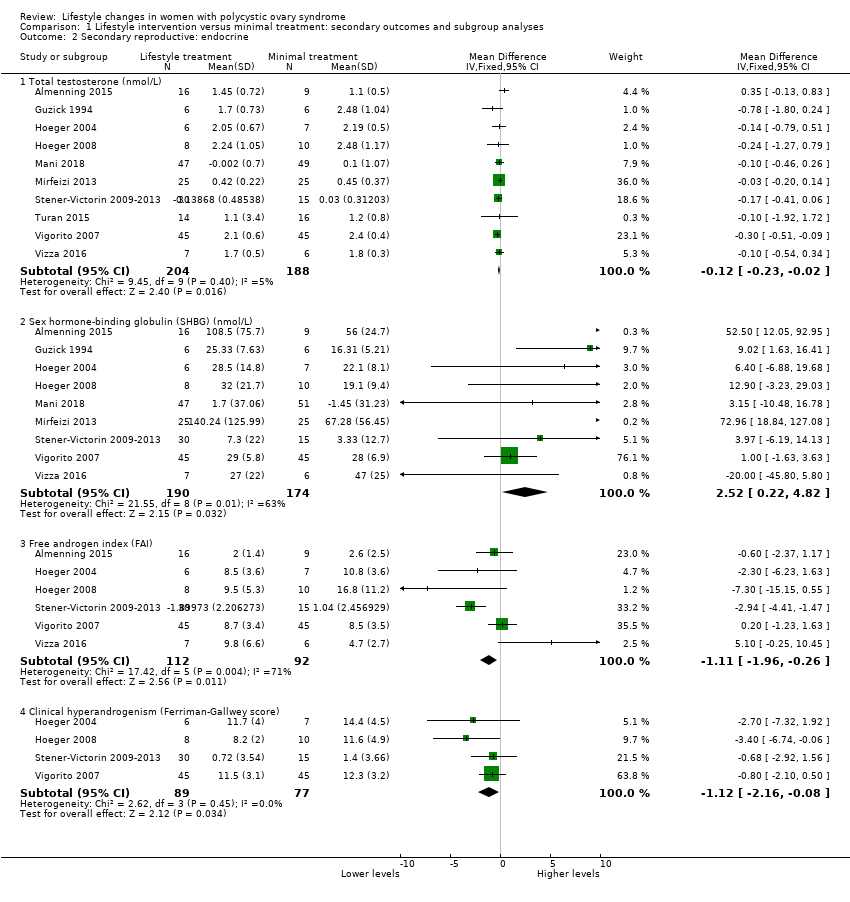
Comparison 1 Lifestyle intervention versus minimal treatment: secondary outcomes and subgroup analyses, Outcome 2 Secondary reproductive: endocrine.
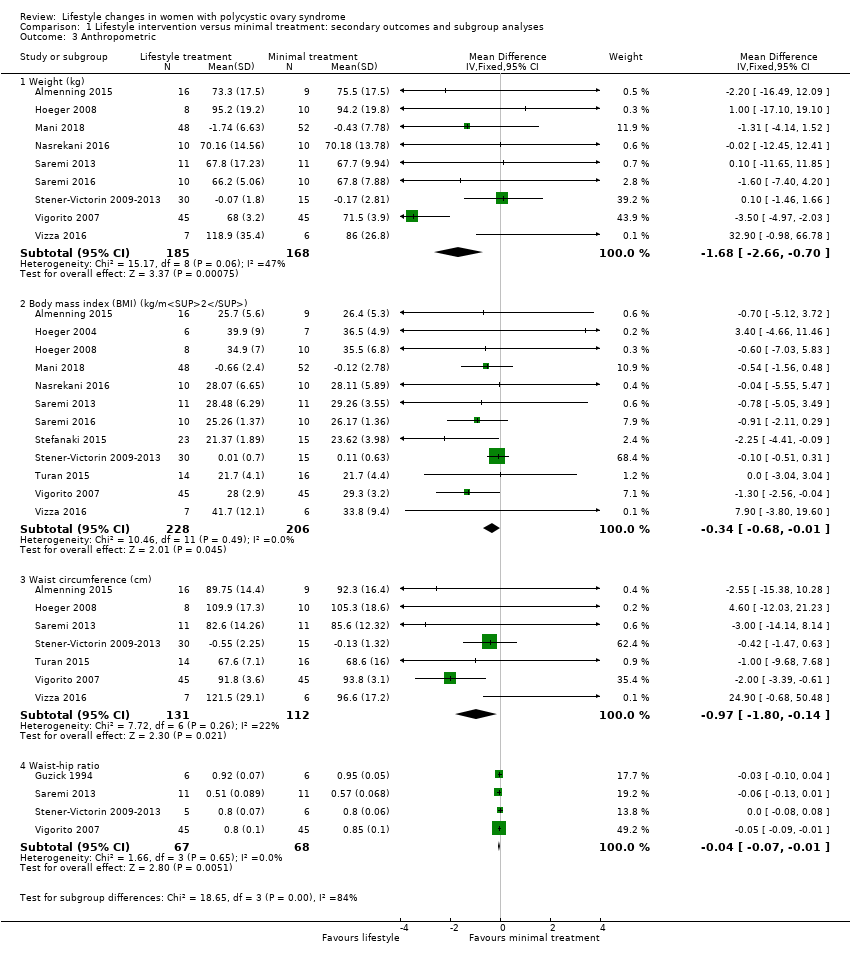
Comparison 1 Lifestyle intervention versus minimal treatment: secondary outcomes and subgroup analyses, Outcome 3 Anthropometric.

Comparison 1 Lifestyle intervention versus minimal treatment: secondary outcomes and subgroup analyses, Outcome 4 Metabolic: oral glucose tolerance test (OGTT) glucose (mmol/L/minute).
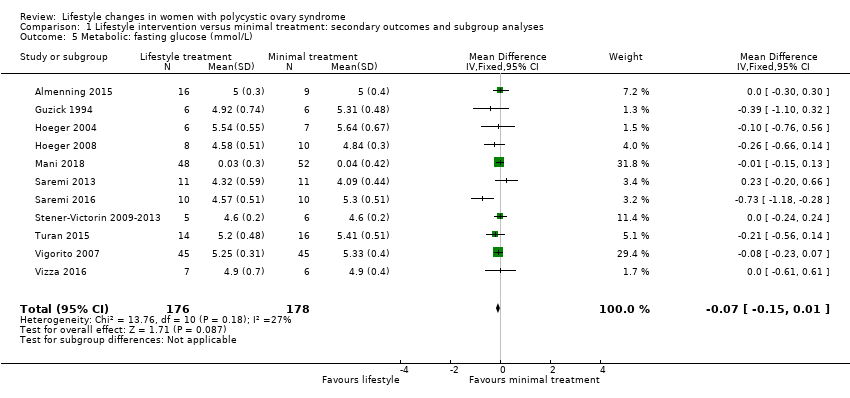
Comparison 1 Lifestyle intervention versus minimal treatment: secondary outcomes and subgroup analyses, Outcome 5 Metabolic: fasting glucose (mmol/L).

Comparison 1 Lifestyle intervention versus minimal treatment: secondary outcomes and subgroup analyses, Outcome 6 Metabolic: fasting lipids (mmol/L).

Comparison 1 Lifestyle intervention versus minimal treatment: secondary outcomes and subgroup analyses, Outcome 7 Metabolic: fasting insulin (µU/mL).

Comparison 1 Lifestyle intervention versus minimal treatment: secondary outcomes and subgroup analyses, Outcome 8 Metabolic: oral glucose tolerance test (OGTT) insulin (µU/mL/minute).

Comparison 1 Lifestyle intervention versus minimal treatment: secondary outcomes and subgroup analyses, Outcome 9 Quality of life.
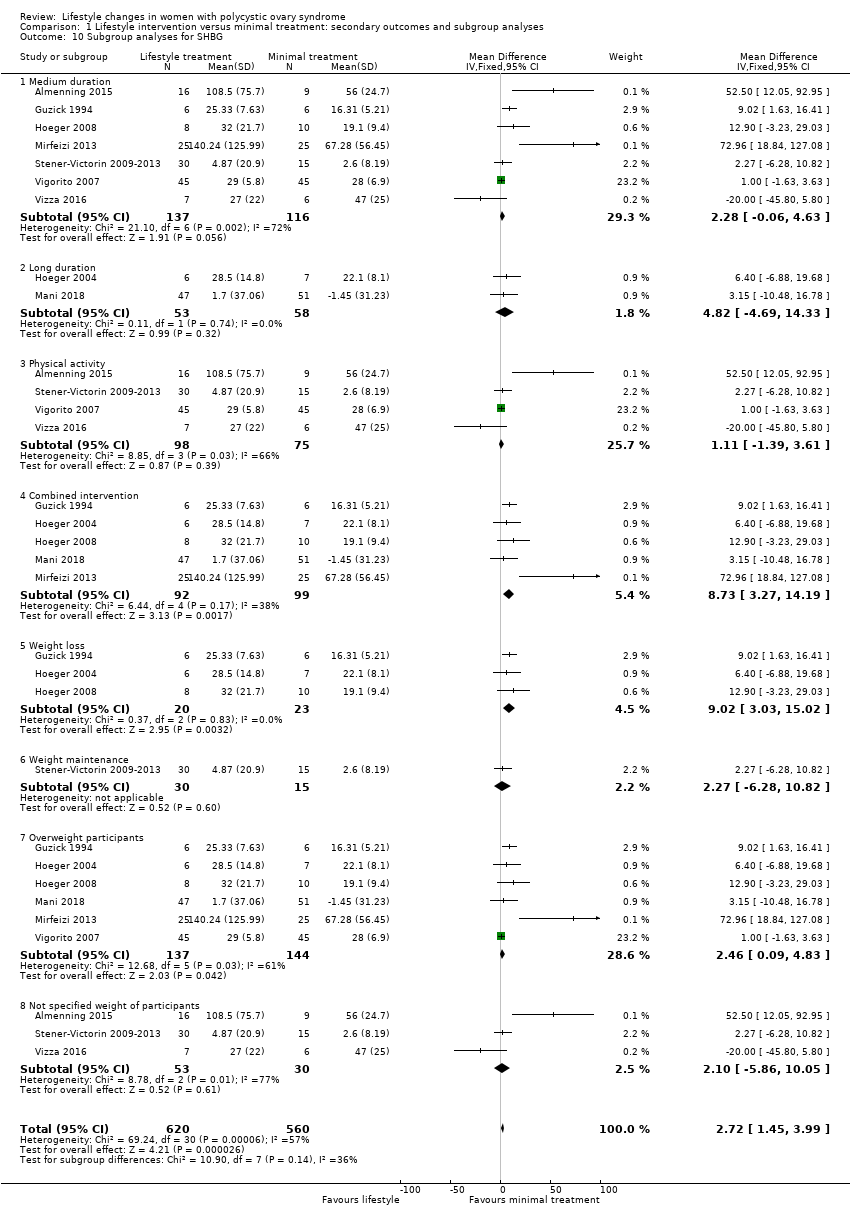
Comparison 1 Lifestyle intervention versus minimal treatment: secondary outcomes and subgroup analyses, Outcome 10 Subgroup analyses for SHBG.

Comparison 1 Lifestyle intervention versus minimal treatment: secondary outcomes and subgroup analyses, Outcome 11 Subgroup analyses for FAI.

Comparison 1 Lifestyle intervention versus minimal treatment: secondary outcomes and subgroup analyses, Outcome 12 Subgroup analyses for HDL‐C.

Comparison 1 Lifestyle intervention versus minimal treatment: secondary outcomes and subgroup analyses, Outcome 13 Subgroup analyses for OGTT insulin.
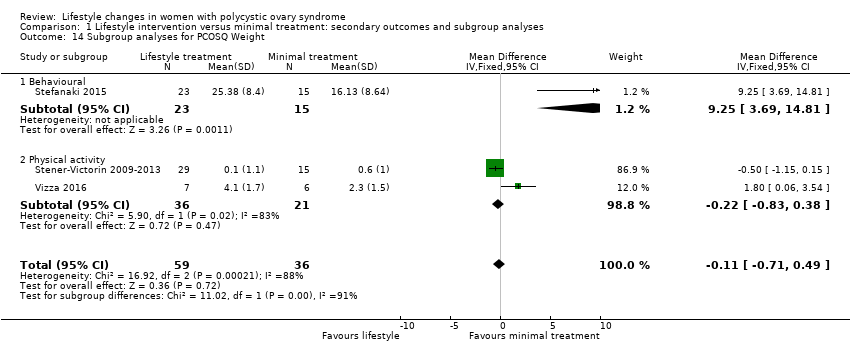
Comparison 1 Lifestyle intervention versus minimal treatment: secondary outcomes and subgroup analyses, Outcome 14 Subgroup analyses for PCOSQ Weight.

Comparison 1 Lifestyle intervention versus minimal treatment: secondary outcomes and subgroup analyses, Outcome 15 Sensitivity analyses for BMI.
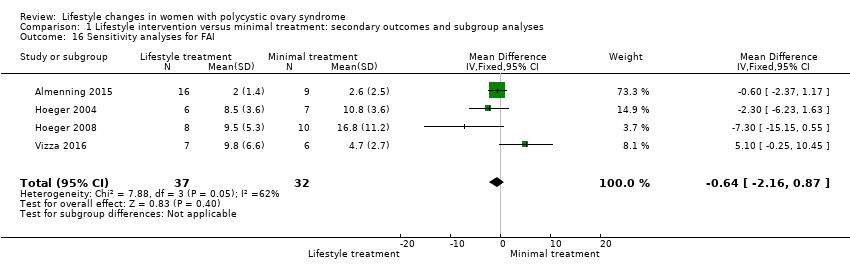
Comparison 1 Lifestyle intervention versus minimal treatment: secondary outcomes and subgroup analyses, Outcome 16 Sensitivity analyses for FAI.
| Lifestyle intervention compared to minimal treatment in women with polycystic ovary syndrome | ||||
| Patient or population: women with polycystic ovary syndrome | ||||
| Outcomes | Anticipated effects | Effect estimate* (95% CI) | № of participants | Certainty of the evidence |
| Fertility: live birth ‐ not reported | No study reported on this outcome | ‐ | ‐ | ‐ |
| Fertility: miscarriage ‐ not reported | No study reported on this outcome | ‐ | ‐ | ‐ |
| Secondary reproductive: menstrual regularity ‐ not reported | No study reported on this outcome in way defined by this review | ‐ | ‐ | ‐ |
| Secondary reproductive: free androgen index (FAI) | Lifestyle intervention may reduce free androgen index (FAI) | MD ‐1.11 (‐1.96 to ‐0.26) | 204 | ⊕⊕⊝⊝ |
| Anthropometric: weight (kg) | Lifestyle intervention may reduce body weight by 1.68 kg (reduction of 2.66 kg to 0.7 kg) compared to no intervention. | MD ‐1.68 | 353 | ⊕⊕⊝⊝ |
| Anthropometric: body mass index (BMI) (kg/m2) | Lifestyle intervention may reduce body mass index (BMI) by 0.34 kg/m2 (reduction of 0.68 to 0.01 kg/m2). | MD ‐0.34 | 434 | ⊕⊕⊝⊝ |
| Metabolic: oral glucose tolerance test (OGTT) glucose (mmol/L/minute) | We are uncertain of the effect of lifestyle intervention on oral glucose tolerance test (OGTT) glucose (mmol/L/minute). | SMD ‐0.02 | 121 | ⊕⊕⊝⊝ |
| *The risk in the intervention group (and its 95% confidence interval) is based on the assumed risk in the comparison group and the relative effect of the intervention (and its 95% CI). | ||||
| GRADE Working Group grades of evidence | ||||
| aDowngraded one level for imprecision: the confidence intervals for most studies cross 0 or small number of events (< 400). bDowngraded one level for inconsistency: high heterogeneity with differing directions of effect. cDowngraded one level for serious risk of bias: lack of blinding of participants, clinicians or outcome assessors and/or attrition bias in a number of studies. | ||||
| Convert from | Convert to | Conversion factor | |
| Total testosterone | ng/dL | nmol/L | 0.03467 |
| SHBG | µg/dL | mmol/L | 34.7 |
| Glucose | mg/dL | mmol/L | 0.056 |
| Cholesterol | mg/dL | mmol/L | 0.026 |
| HDL‐C | mg/dL | mmol/L | 0.0259 |
| LDL‐C | mg/dL | mmol/L | 0.0259 |
| Triglycerides | mg/dL | mmol/L | 0.0113 |
| Standard deviation | Standard error | Standard deviation | Sqrt n |
| HDL‐C: high‐density lipoprotein cholesterol, LDL‐C: low‐density lipoprotein cholesterol, SHBG: sex hormone‐binding globulin | |||
| Outcome or subgroup title | No. of studies | No. of participants | Statistical method | Effect size |
| 1 Secondary reproductive: menstrual regularity and ovulation Show forest plot | Other data | No numeric data | ||
| 2 Secondary reproductive: endocrine Show forest plot | 10 | Mean Difference (IV, Fixed, 95% CI) | Subtotals only | |
| 2.1 Total testosterone (nmol/L) | 10 | 392 | Mean Difference (IV, Fixed, 95% CI) | ‐0.12 [‐0.23, ‐0.02] |
| 2.2 Sex hormone‐binding globulin (SHBG) (nmol/L) | 9 | 364 | Mean Difference (IV, Fixed, 95% CI) | 2.52 [0.22, 4.82] |
| 2.3 Free androgen index (FAI) | 6 | 204 | Mean Difference (IV, Fixed, 95% CI) | ‐1.11 [‐1.96, ‐0.26] |
| 2.4 Clinical hyperandrogenism (Ferriman‐Gallwey score) | 4 | 166 | Mean Difference (IV, Fixed, 95% CI) | ‐1.12 [‐2.16, ‐0.08] |
| 3 Anthropometric Show forest plot | 13 | Mean Difference (IV, Fixed, 95% CI) | Subtotals only | |
| 3.1 Weight (kg) | 9 | 353 | Mean Difference (IV, Fixed, 95% CI) | ‐1.68 [‐2.66, ‐0.70] |
| 3.2 Body mass index (BMI) (kg/m2) | 12 | 434 | Mean Difference (IV, Fixed, 95% CI) | ‐0.34 [‐0.68, ‐0.01] |
| 3.3 Waist circumference (cm) | 7 | 243 | Mean Difference (IV, Fixed, 95% CI) | ‐0.97 [‐1.80, ‐0.14] |
| 3.4 Waist‐hip ratio | 4 | 135 | Mean Difference (IV, Fixed, 95% CI) | ‐0.04 [‐0.07, ‐0.01] |
| 4 Metabolic: oral glucose tolerance test (OGTT) glucose (mmol/L/minute) Show forest plot | 3 | 121 | Std. Mean Difference (IV, Fixed, 95% CI) | ‐0.02 [‐0.38, 0.33] |
| 5 Metabolic: fasting glucose (mmol/L) Show forest plot | 11 | 354 | Mean Difference (IV, Fixed, 95% CI) | ‐0.07 [‐0.15, 0.01] |
| 6 Metabolic: fasting lipids (mmol/L) Show forest plot | 9 | Mean Difference (IV, Fixed, 95% CI) | Subtotals only | |
| 6.1 Total cholesterol (mmol/L) | 9 | 331 | Mean Difference (IV, Fixed, 95% CI) | ‐0.14 [‐0.25, ‐0.02] |
| 6.2 High‐density lipoprotein cholesterol (HDL‐C) (mmol/L) | 9 | 327 | Mean Difference (IV, Fixed, 95% CI) | 0.01 [‐0.03, 0.05] |
| 6.3 Low‐density lipoprotein cholesterol (LDL‐C) (mmol/L) | 9 | 326 | Mean Difference (IV, Fixed, 95% CI) | ‐0.16 [‐0.29, ‐0.03] |
| 6.4 Triglycerides (mmol/L) | 9 | 328 | Mean Difference (IV, Fixed, 95% CI) | ‐0.02 [‐0.06, 0.02] |
| 7 Metabolic: fasting insulin (µU/mL) Show forest plot | 10 | 321 | Mean Difference (IV, Fixed, 95% CI) | ‐1.42 [‐2.44, ‐0.39] |
| 8 Metabolic: oral glucose tolerance test (OGTT) insulin (µU/mL/minute) Show forest plot | 3 | 121 | Std. Mean Difference (IV, Fixed, 95% CI) | ‐1.32 [‐1.73, ‐0.92] |
| 9 Quality of life Show forest plot | 3 | 475 | Mean Difference (IV, Fixed, 95% CI) | 0.39 [0.16, 0.61] |
| 9.1 PCOSQ (Weight) | 3 | 95 | Mean Difference (IV, Fixed, 95% CI) | ‐0.11 [‐0.71, 0.49] |
| 9.2 PCOSQ (Hirsutism) | 3 | 95 | Mean Difference (IV, Fixed, 95% CI) | ‐0.01 [‐0.57, 0.56] |
| 9.3 PCOSQ (Emotions) | 3 | 95 | Mean Difference (IV, Fixed, 95% CI) | 0.77 [0.30, 1.23] |
| 9.4 PCOSQ (Infertility) | 3 | 95 | Mean Difference (IV, Fixed, 95% CI) | 0.68 [0.21, 1.14] |
| 9.5 PCOSQ (Menstrual irregularity) | 3 | 95 | Mean Difference (IV, Fixed, 95% CI) | 0.25 [‐0.24, 0.75] |
| 10 Subgroup analyses for SHBG Show forest plot | 9 | 1180 | Mean Difference (IV, Fixed, 95% CI) | 2.72 [1.45, 3.99] |
| 10.1 Medium duration | 7 | 253 | Mean Difference (IV, Fixed, 95% CI) | 2.28 [‐0.06, 4.63] |
| 10.2 Long duration | 2 | 111 | Mean Difference (IV, Fixed, 95% CI) | 4.82 [‐4.69, 14.33] |
| 10.3 Physical activity | 4 | 173 | Mean Difference (IV, Fixed, 95% CI) | 1.11 [‐1.39, 3.61] |
| 10.4 Combined intervention | 5 | 191 | Mean Difference (IV, Fixed, 95% CI) | 8.73 [3.27, 14.19] |
| 10.5 Weight loss | 3 | 43 | Mean Difference (IV, Fixed, 95% CI) | 9.02 [3.03, 15.02] |
| 10.6 Weight maintenance | 1 | 45 | Mean Difference (IV, Fixed, 95% CI) | 2.27 [‐6.28, 10.82] |
| 10.7 Overweight participants | 6 | 281 | Mean Difference (IV, Fixed, 95% CI) | 2.46 [0.09, 4.83] |
| 10.8 Not specified weight of participants | 3 | 83 | Mean Difference (IV, Fixed, 95% CI) | 2.10 [‐5.86, 10.05] |
| 11 Subgroup analyses for FAI Show forest plot | 6 | 688 | Mean Difference (IV, Fixed, 95% CI) | ‐0.53 [‐1.09, 0.04] |
| 11.1 Medium duration | 5 | 191 | Mean Difference (IV, Fixed, 95% CI) | 0.01 [‐1.06, 1.08] |
| 11.2 Long duration | 1 | 13 | Mean Difference (IV, Fixed, 95% CI) | ‐2.30 [‐6.23, 1.63] |
| 11.3 Physical activity | 4 | 173 | Mean Difference (IV, Fixed, 95% CI) | 0.15 [‐0.94, 1.23] |
| 11.4 Combined intervention | 2 | 31 | Mean Difference (IV, Fixed, 95% CI) | ‐3.30 [‐6.81, 0.21] |
| 11.5 Weight loss | 2 | 31 | Mean Difference (IV, Fixed, 95% CI) | ‐3.30 [‐6.81, 0.21] |
| 11.6 Weight maintenance | 1 | 45 | Mean Difference (IV, Fixed, 95% CI) | 3.97 [‐6.19, 14.13] |
| 11.7 Overweight participants | 3 | 121 | Mean Difference (IV, Fixed, 95% CI) | ‐0.30 [‐1.62, 1.03] |
| 11.8 Not specified weight of participants | 3 | 83 | Mean Difference (IV, Fixed, 95% CI) | ‐1.66 [‐2.97, ‐0.34] |
| 12 Subgroup analyses for HDL‐C Show forest plot | 9 | 1023 | Mean Difference (IV, Fixed, 95% CI) | 0.01 [‐0.02, 0.03] |
| 12.1 Medium duration | 7 | 216 | Mean Difference (IV, Fixed, 95% CI) | 0.01 [‐0.03, 0.06] |
| 12.2 Long duration | 2 | 111 | Mean Difference (IV, Fixed, 95% CI) | ‐0.01 [‐0.11, 0.09] |
| 12.3 Physical activity | 6 | 198 | Mean Difference (IV, Fixed, 95% CI) | 0.02 [‐0.03, 0.07] |
| 12.4 Combined intervention | 3 | 129 | Mean Difference (IV, Fixed, 95% CI) | ‐0.02 [‐0.11, 0.07] |
| 12.5 Weight loss | 2 | 31 | Mean Difference (IV, Fixed, 95% CI) | 0.01 [‐0.15, 0.17] |
| 12.6 Weight maintenance | 1 | 11 | Mean Difference (IV, Fixed, 95% CI) | ‐0.10 [‐0.46, 0.26] |
| 12.7 Overweight participants | 4 | 219 | Mean Difference (IV, Fixed, 95% CI) | ‐0.04 [‐0.11, 0.04] |
| 12.8 Not specified weight of participants | 5 | 108 | Mean Difference (IV, Fixed, 95% CI) | 0.03 [‐0.02, 0.08] |
| 13 Subgroup analyses for OGTT insulin Show forest plot | 3 | 121 | Std. Mean Difference (IV, Fixed, 95% CI) | ‐1.32 [‐1.73, ‐0.92] |
| 13.1 Physical activity | 1 | 90 | Std. Mean Difference (IV, Fixed, 95% CI) | ‐1.71 [‐2.20, ‐1.22] |
| 13.2 Combined intervention | 2 | 31 | Std. Mean Difference (IV, Fixed, 95% CI) | ‐0.48 [‐1.20, 0.24] |
| 14 Subgroup analyses for PCOSQ Weight Show forest plot | 3 | 95 | Mean Difference (IV, Fixed, 95% CI) | ‐0.11 [‐0.71, 0.49] |
| 14.1 Behavioural | 1 | 38 | Mean Difference (IV, Fixed, 95% CI) | 9.25 [3.69, 14.81] |
| 14.2 Physical activity | 2 | 57 | Mean Difference (IV, Fixed, 95% CI) | ‐0.22 [‐0.83, 0.38] |
| 15 Sensitivity analyses for BMI Show forest plot | 5 | 99 | Mean Difference (IV, Fixed, 95% CI) | 0.29 [‐1.91, 2.49] |
| 16 Sensitivity analyses for FAI Show forest plot | 4 | 69 | Mean Difference (IV, Fixed, 95% CI) | ‐0.64 [‐2.16, 0.87] |