| Salicylate‐containing topical rubefacients compared with topical placebo for acute and chronic painful conditions |
| Patient or population: adults with strains or sprains (acute) or osteoarthritis or low back pain (chronic) Settings: community Intervention: salicylate‐containing topical rubefacient Comparison: topical placebo |
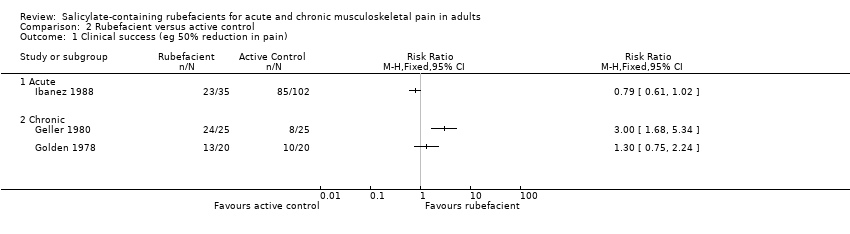
| Clinical success (eg 50% reduction in pain) Acute conditions | 640 in 1000 | 335 in 1000 | RR 1.9 (1.5 to 2.5) NNT 3.2 (2.4 to 4.9) | 4 studies 324 participants | ⊕⊝⊝⊝
very low | Most recent, largest study showed no effect Note NNT cannot be trusted because of low numbers and poor quality studies |
| Clinical success (eg 50% reduction in pain) Chronic conditions | 447 in 1000 | 284 in 1000 | RR 1.6 (1.2 to 2.0) NNT 6.2 (4.0 to 13) | 6 studies 455 participants | ⊕⊝⊝⊝
very low | Most recent, largest studies showed no effect Note NNT cannot be trusted because of low numbers and poor quality studies |
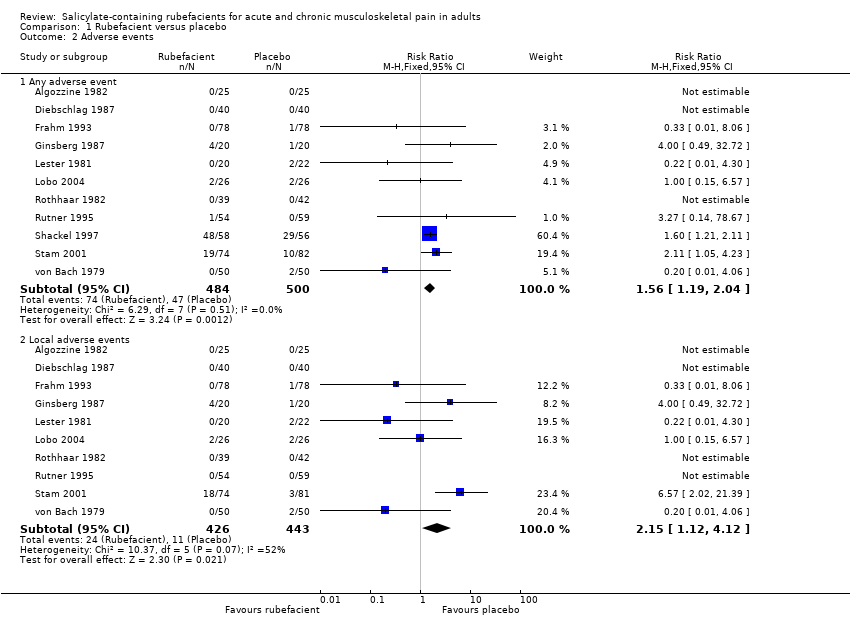
| Adverse events ‐ any adverse events Acute and chronic conditions combined | 152 in 1000 | 94 in 1000 | RR 1.6 (1.2 to 2.0) NNH 17 (9.9 to 58) | 11 studies 984 participants | ⊕⊕⊝⊝
low | Inadequate reporting of adverse events is common Acute and chronic conditions combined |
| Adverse events ‐ local adverse events Acute and chronic conditions combined | 56 in 1000 | 24 in 1000 | RR 2.2 (1.1 to 4.1) NNH 31 (16 to 300) | 10 studies 869 participants | ⊕⊝⊝⊝
very low | Small numbers of events Acute and chronic conditions combined |
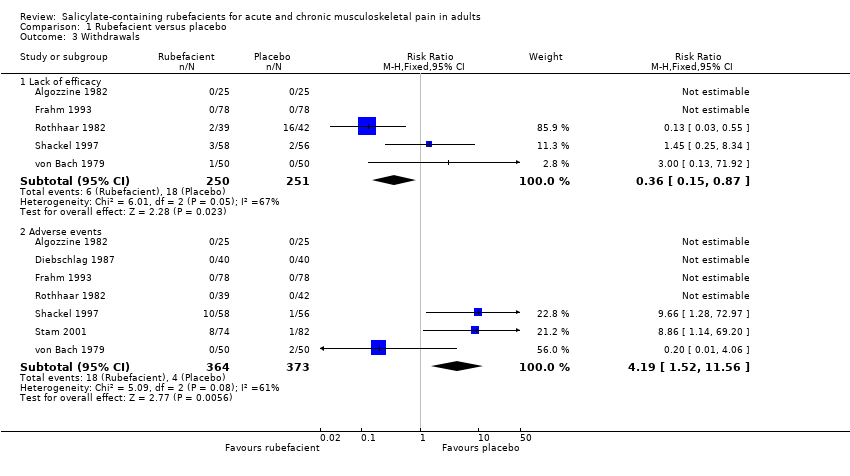
| Withdrawals ‐ lack of efficacy Acute and chronic conditions combined | 24 in 1000 | 72 in 1000 | RR 0.4 (0.2 to 0.9) NNTp 21 (12 to 120) | 5 studies 501 participants | ⊕⊝⊝⊝
very low | Small numbers of events Acute and chronic conditions combined |
| Withdrawals ‐ adverse events Acute and chronic conditions combined | 49 in 1000 | 11 in 1000 | RR 4.2 (1.5 to 12) NNH 26 (15 to 85) | 7 studies 737 participants | ⊕⊝⊝⊝
very low | Small numbers of events Acute and chronic conditions combined |
| GRADE Working Group grades of evidence
High quality: Further research is very unlikely to change our confidence in the estimate of effect.
Moderate quality: Further research is likely to have an important impact on our confidence in the estimate of effect and may change the estimate.
Low quality: Further research is very likely to have an important impact on our confidence in the estimate of effect and is likely to change the estimate.
Very low quality: We are very uncertain about the estimate. |