Different strategies for diagnosing gestational diabetes to improve maternal and infant health
Abstract
Background
Gestational diabetes mellitus (GDM) is carbohydrate intolerance resulting in hyperglycaemia with onset or first recognition during pregnancy. If untreated, perinatal morbidity and mortality may be increased. Accurate diagnosis allows appropriate treatment. Use of different tests and different criteria will influence which women are diagnosed with GDM. This is an update of a review published in 2011 and 2015.
Objectives
To evaluate and compare different testing strategies for diagnosis of gestational diabetes mellitus to improve maternal and infant health while assessing their impact on healthcare service costs.
Search methods
We searched Cochrane Pregnancy and Childbirth’s Trials Register, ClinicalTrials.gov, WHO International Clinical Trials Registry Platform (ICTRP) (9 January 2017) and reference lists of retrieved studies.
Selection criteria
We included randomised trials if they evaluated tests carried out to diagnose GDM. We excluded studies that used a quasi‐random model, cluster‐randomised or cross‐over trials.
Data collection and analysis
Two review authors independently assessed trials for inclusion and risk of bias, extracted data and checked them for accuracy. The quality of the evidence was assessed using the GRADE approach.
Main results
We included a total of seven small trials, with 1420 women. One trial including 726 women was identified by this update and examined the two step versus one step approach. These trials were assessed as having varying risk of bias, with few outcomes reported. We prespecified six outcomes to be assessed for quality using the GRADE approach for one comparison: 75 g oral glucose tolerance test (OGTT) versus 100 g OGTT; data for only one outcome (diagnosis of gestational diabetes) were available for assessment. One trial compared three different methods of delivering glucose: a candy bar (39 women), a 50 g glucose polymer drink (40 women) and a 50 g glucose monomer drink (43 women). We have included the results reported by this trial as separate comparisons. No trial reported on measures of costs of health services.
We examined six main comparisons.
75 g OGTT versus 100 g OGTT (1 trial, 248 women): women who received 75 g OGTT had a higher relative risk of being diagnosed with GDM (risk ratio (RR) 2.55, 95% confidence interval (CI) 0.96 to 6.75; very‐low quality evidence). No data were reported for the following additional outcomes prespecified for GRADE assessment: caesarean section, macrosomia > 4.5 kg or however defined in the trial, long‐term type 2 diabetes maternal, long‐term type 2 diabetes infant and economic costs.
Candy bar versus 50 g glucose monomer drink (1 trial, 60 women): more women receiving the candy bar, rather than glucose monomer, preferred the taste of the candy bar (RR 0.60, 95% CI 0.42 to 0.86) and 1‐hour glucose was less with the candy bar. There were no differences in the other outcomes reported (maternal side effects). No infant outcomes were reported or any review primary outcomes.
50 g glucose polymer drink versus 50 g glucose monomer drink (3 trials, 239 women): mean difference (MD) in gestation at birth was ‐0.80 weeks (1 trial, 100 women; 95% CI ‐1.69 to 0.09). Total side effects were less common with the glucose polymer drink (1 trial, 63 women; RR 0.21, 95% CI 0.07 to 0.59), and no clear difference in taste acceptability was reported (1 trial, 63 women; RR 0.99, 95% CI 0.76 to 1.29). Fewer women reported nausea following the 50 g glucose polymer drink compared with the 50 g glucose monomer drink (1 trial, 66 women; RR 0.29, 95% CI 0.11 to 0.78). No other measures of maternal morbidity or outcomes for the infant were reported.
50 g glucose food versus 50 g glucose drink (1 trial, 30 women): women receiving glucose in their food, rather than as a drink, reported fewer side effects (RR 0.08, 95% CI 0.01 to 0.56). No clear difference was noted in the number of women requiring further testing (RR 0.14, 95% CI 0.01 to 2.55). No other measures of maternal morbidity or outcome were reported for the infant or review primary outcomes.
75 g OGTT World Health Organization (WHO) criteria versus 75 g OGTT American Diabetes Association (ADA) criteria (1 trial, 116 women): no clear differences in included outcomes were observed between women who received the 75 g OGTT and were diagnosed using criteria based on WHO (1999) recommendations and women who received the 75 g OGTT and were diagnosed using criteria recommended by the ADA (1979). Outcomes measured included diagnosis of gestational diabetes (RR 1.47, 95% CI 0.66 to 3.25), caesarean section (RR 1.07, 95% CI 0.85 to 1.35), macrosomia defined as > 90th percentile by ultrasound or birthweight equal to or exceeding 4000 g (RR 0.73, 95% CI 0.19 to 2.79), stillbirth (RR 0.49, 95% CI 0.02 to 11.68) and instrumental birth (RR 0.21, 95% CI 0.01 to 3.94). No other secondary outcomes were reported.
Two‐step approach (50 g oral glucose challenge test followed by selective 100 g OGTT Carpenter and Coustan criteria) versus one‐step approach (universal 75 g OGTT ADA criteria) (1 trial, 726 women): women allocated the two‐step approach had a lower risk of being diagnosed with GDM at 11 to 14 weeks' gestation compared to women allocated the one‐step approach (RR 0.51, 95% CI 0.28 to 0.95). No other primary or secondary outcomes were reported.
Authors' conclusions
There is insufficient evidence to suggest which strategy is best for diagnosing GDM. Large randomised trials are required to establish the best strategy for correctly identifying women with GDM.
PICO
Plain language summary
Different strategies for diagnosing gestational diabetes mellitus (GDM) to improve maternal and infant health
What is the issue?
We aimed to evaluate and compare different ways of diagnosing gestational diabetes mellitus (GDM). We searched for all relevant studies in January 2017.
Why is this important?
Between seven and 24 pregnant women in every 100 develop GDM. GDM is when there is an inability to process carbohydrates properly, which leads to high blood sugar (hyperglycaemia). GDM can result in increased risks of problems around the time of birth for the mother and her baby. Treatment can reduce these risks, and therefore diagnosing the condition accurately means that treatment can be given to improve the health of mothers and their babies.
Different testing strategies aim to diagnose GDM. We wanted to compare the different strategies, to see how they affected the health of women and their infants, and to assess the cost of the strategies to the healthcare service.
What evidence did we find?
We found seven trials. A total of 1420 women were included, in settings in Turkey, Mexico, Nigeria, New Zealand, Canada and the USA. Across the trials, different testing approaches and criteria were evaluated as were different diagnostic tests including different oral glucose tolerance test loads; a glucose drink; a candy bar and food high in glucose. Women were given these items to eat/drink, and this was then followed by a blood test to measure blood sugar levels and questionnaires. In some tests, women were required to fast from the night before.
The main outcomes we looked for were frequency of diagnosis, incidence of caesarean section, assisted birth and vaginal birth, and incidence of macrosomia in babies (larger than normal weight at birth). Other outcomes spanned a range, including any side effects of the tests, the mothers' preferences, and the health of the babies.
There were a number of weaknesses among the studies: the methodology was not clear and there were important gaps in the data. The studies in this review do not provide enough evidence to guide clinical practice and health policy regarding identifying women with GDM.
What does this mean?
We are uncertain about which strategies to diagnose GDM are better, as we have assessed the quality of evidence as very low. Large randomised trials are needed to establish the best way for identifying women with GDM.
Authors' conclusions
Summary of findings
| 75 g oral glucose tolerance test (OGTT) versus 100 g OGTT for diagnosing gestational diabetes mellitus (GDM) to improve maternal and infant health | ||||||
| Patient or population: pregnant women at low or high risk of gestational diabetes Comparison: 100 g OGTT | ||||||
| Outcomes | Illustrative comparative risks* (95% CI) | Relative effect | Number of participants | Quality of the evidence | Comments | |
| Assumed risk | Corresponding risk | |||||
| 100 g OGTT | 75 g OGTT | |||||
| Diagnosis of gestational diabetes | Study population | RR 2.55 | 248 | ⊕⊝⊝⊝ | Women who received the 75 g OGTT test were 2.55 times more likely to test positive for gestational diabetes. | |
| 45 per 1000 | 116 per 1000 | |||||
| Caesarean section | See comment | See comment | Not estimable | 0 | See comment | None of the included studies reported this outcome. |
| Macrosomia > 4.5 kg or as defined in trial | See comment | See comment | Not estimable | 0 | See comment | None of the included studies reported this outcome. |
| Long‐term type 2 diabetes maternal | See comment | See comment | Not estimable | 0 | See comment | None of the included studies reported this outcome. |
| Long‐term type 2 diabetes infant | See comment | See comment | Not estimable | 0 | See comment | None of the included studies reported this outcome. |
| Economic costs | See comment | See comment | Not estimable | 0 | See comment | None of the included studies reported this outcome. |
| *The basis for the assumed risk (e.g. median control group risk across studies) is the risk. The corresponding risk (and its 95% confidence interval) is based on the assumed risk in the comparison group and the relative effect of the intervention (and its 95% CI). | ||||||
| GRADE Working Group grades of evidence. | ||||||
| aOne study with design limitations (‐1). | ||||||
Background
Description of the condition
Diabetes mellitus is a metabolic disorder that results from a defect in insulin secretion by pancreatic β‐cells, insulin action or both. Insulin is a hormone that is secreted by specialised cells in the pancreas (pancreatic β‐cells) in response to increases in blood glucose (blood sugar) levels. The effect of insulin is to lower blood glucose. Insulin enables most body cells to absorb glucose from the blood for use as fuel, for conversion to other needed molecules or for storage. Insulin is the principal instigator for conversion of glucose (the basic sugar used for fuel) to glycogen for internal storage in liver and muscle cells. A consequence of a defect that results in reduced insulin secretion or reduced ability of insulin to promote uptake of glucose from the blood (i.e. resistance to insulin action) is hyperglycaemia (high levels of glucose in the blood). If this becomes chronic (long term), disturbances in the metabolism of carbohydrate, fat and protein may occur: once levels of blood glucose are chronically above a specific level, diabetes is diagnosed. If diabetes is not treated, prolonged hyperglycaemia leads to damage and to poor function of various organs, especially eyes, kidneys, nerves, heart and blood vessels.
Classification of diabetes mellitus
The two most common types of diabetes are known as type 1 and type 2 diabetes mellitus (Expert 2000).
Type 1 diabetes mellitus
People with type 1 diabetes mellitus have absolute, or nearly absolute, insulin deficiency. This type of diabetes develops quickly with hyperglycaemia, rapid acidification of the blood (ketoacidosis) and death, unless treated with insulin. Type 1 diabetes usually presents with acute onset of symptoms, including increased urination and thirst, but it can also present first with collapse or coma. The disease may occur at any age, but onset in childhood or adolescence is most common. Type 1 diabetes usually results when the immune system attacks cells in the pancreas that produce insulin (autoimmune destruction of pancreatic β‐cells). Type 1 diabetes requires life‐long treatment with insulin.
Type 2 diabetes mellitus
People with type 2 diabetes mellitus may have resistance to insulin action or relative insulin deficiency or, more commonly, both. In many individuals with type 2 diabetes, problems begin with resistance to insulin action, meaning that higher levels of insulin are required to complete usual actions, including removal of glucose from the blood. The greater requirement for pancreatic β‐cells to secrete insulin results in impairment of their action and ultimately in insulin deficiency and diabetes. The pancreas generally retains some ability to produce insulin, but it is insufficient to meet the body's needs. Autoimmune destruction of pancreatic β‐cells does not occur, and ketoacidosis is rare. Insulin therapy may not be required. Type 2 diabetes mellitus usually develops slowly and is commonly asymptomatic, with up to 50% of adults with type 2 diabetes remaining undiagnosed (Thomas 2005; Williams 2003). The risk of type 2 diabetes increases with age, obesity and lack of physical activity. It can occur at any age but is relatively rare before the age of 30 years, however in concert with increasing obesity and reducing levels of physical activity, type 2 diabetes is becoming more common in young adults and is now seen in children.
Other types of diabetes
Less common types of diabetes mellitus include diabetes due to rare genetic disorders, congenital problems in the pancreas and trauma to the pancreas, as well as diabetes that occurs as a side effect of some drugs (e.g. steroids). Gestational diabetes is described in the section below.
Normal pregnancy and insulin resistance
Normal pregnancy is associated with insulin resistance similar to that found in type 2 diabetes. Physiological resistance to insulin action during pregnancy becomes apparent in the second trimester, and insulin sensitivity declines progressively to term. These changes facilitate transport of glucose across the placenta to ensure normal fetal growth and development. Transfer of glucose across the placenta stimulates fetal insulin secretion, and insulin acts as an essential growth hormone. However, if resistance to maternal insulin action becomes too pronounced, fetal hyperinsulinaemia, accelerated growth and possible organ damage may occur. In normal pregnancy after delivery, maternal pregnancy‐associated insulin resistance returns rapidly to normal, and glucose tolerance usually returns to normal within six weeks of delivery.
Gestational diabetes mellitus
Gestational diabetes mellitus (GDM) is defined as "carbohydrate intolerance resulting in hyperglycaemia of variable severity with onset or first recognition during pregnancy" (Expert 2000; WHO 1999). GDM is defined in this way for women with undiagnosed pre‐existing diabetes and for those in whom the first onset of hyperglycaemia is identified during pregnancy. To identify early in pregnancy women with previously undiagnosed diabetes, the International Association of Diabetes and Pregnancy Study Groups (IADPSG) (Metzger 2010) recommends assessment of high‐risk populations using glycated haemoglobin, fasting or random plasma glucose at first pregnancy booking. Other groups including the American Diabetes Association (ADA) (ADA 2017) and the UK National Institute for Health and Care Excellence (NICE 2015) also recommend early testing of high‐risk groups to identify women with pre‐existing diabetes.
In the past GDM has been categorised by severity of glucose impairment, with less severe cases referred to as impaired glucose tolerance, and more severe cases as GDM. Hyperglycaemia is now viewed as a continuum, with levels along the complete distribution of glycaemia in pregnant women associated with adverse effects (HAPO Study Cooperative Research Group 2008). Because of this, the term 'impaired glucose tolerance' is no longer used, and all abnormalities of glucose intolerance in pregnancy are now referred to as 'GDM'. GDM necessarily includes women who first develop diabetes during pregnancy, as well as those with previously undiagnosed type 1 or 2 diabetes mellitus (frank or pre‐existing diabetes) recognised for the first time in pregnancy, because it is impossible at the time of first recognition to distinguish clearly between these different diagnoses. GDM complicates between 1% and 24% of pregnancies (Farrar 2015a; Farrar 2016; NIH 2013) and varies with the population characteristics and the diagnostic glucose thresholds used. It is the most common metabolic disorder of pregnancy and is associated with increased maternal and perinatal morbidity (Bitó 2005; Crowther 2005; Kim 2002; Landon 2009; Schytte 2004). Reducing modifiable risk factors for developing GDM by eating a healthy balanced diet, achieving and maintaining a healthy normal weight and exercising before and throughout pregnancy may reduce the risk of development of GDM or its severity, but the evidence is limited (Ceysens 2006; Tieu 2017). Maternal hyperglycaemia leads to transfer of excessive glucose to the fetus, resulting in fetal hyperinsulinaemia. Fetal hyperinsulinaemia causes increased risk of fetal adiposity, macrosomia (increased birthweight) and perinatal complications (Jovanovic 2001; Kjos 1999). Specifically, GDM is associated with overgrowth of insulin‐sensitive tissue such as adipose tissue, especially around the chest, shoulders and abdomen, which increases the risk of shoulder dystocia, perinatal death and birth trauma and makes the need for caesarean section more likely (Jovanovic 2001; Kjos 1999). Risk of hypoxaemia is increased in utero, and this can lead to increased risk of intra‐uterine death, fetal polycythaemia (too many red blood cells), hyperbilirubinaemia (jaundice) and renal vein thrombosis (blood clot in the kidney vein). Evidence also suggests increased risk of neonatal metabolic complications, including hypoglycaemia, in babies of mothers experiencing GDM (Jovanovic 2001; Kjos 1999; Kostalova 2001; Pribylová 1996; Silverman 1995). Observational data suggest that babies of women with GDM are at increased risk of obesity (Dabelea 2000; Gillman 2003; Pettitt 1983) and hypertension (Akisü 1999) later in life. However, data from trials of treatment of women with mild to moderate GDM suggest similar adiposity in infants, regardless of their mother's group allocation (Gillman 2010; Landon 2015), data are few and length of follow up limited.
Description of the intervention
A range of recommendations and guidelines for identification of women with GDM have been published by the World Health Organization (WHO) (WHO 1999; WHO 2013), the International Association of Diabetes and Pregnancy Study Groups (IADPSG) (Metzger 2010), the American Diabetes Association (ADA 2017), the National Institute for Health and Clinical Excellence (NICE 2015), the Australasian Diabetes in Pregnancy Society (ADIPS 1998), the Royal Australian and New Zealand College of Obstetricians and Gynaecologists (RANZCOG 2014) and the Scottish Intercollegiate Guideline Network (Jovanovic 2004).
The criteria for diagnosis of GDM have been debated for some time. A linear association has been noted between maternal glucose levels and adverse perinatal outcomes across the whole distribution of glucose levels in pregnancy (HAPO Study Cooperative Research Group 2008). Thus, there is no clear threshold above which women are at high risk and below which they are at low risk. Criteria for diagnosis of GDM have been developed in attempts to identify thresholds that best predict adverse maternal and neonatal outcomes; however, lack of sufficient evidence of increased effectiveness in improving outcomes of one criterion over another has led to the use of different criteria, which are arbitrary and often are based on expert opinion. The IADPSG (Metzger 2010) has recommended revised thresholds (Table 1) in the light of Hyperglycaemia and Adverse Pregnancy Outcome (HAPO) study results, which suggest adverse effects on fetal outcomes with glucose levels previously considered within the normal range (HAPO Study Cooperative Research Group 2008). The WHO (WHO 2013) and the ADA (ADA 2017) have recently endorsed the IADPSG criteria; however, the ADA has also endorsed the 'two‐step' approach favoured by the American National Institutes of Health (NIH 2013).
| Time | Plasma |
| Fasting glucose (≥) | 5.1 mmol/L |
| 1‐hour glucose (≥) | 10.0 mmol/L |
| 2‐hour glucose (≥) | 8.5 mmol/L |
IADPSG cutoff levels for diagnosis of gestational diabetes for plasma glucose; gestational diabetes is diagnosed if any one value equals or exceeds any other value (Metzger 2010). World Health Organization (WHO) published revised guidance in 2013 recommended IADPSG cutoff levels for the diagnosis of gestational diabetes (WHO 2013).
Tests most commonly used for diagnosis of GDM are the two‐hour 75 g oral glucose tolerance test (OGTT) recommended by IADPSG and WHO (Metzger 2010; WHO 1999; WHO 2013) and the three‐hour 100 g OGTT recommended by the National Institutes of Health (NIH 2013). Limitations of these tests are that they require women to fast from the night before (although in some studies non‐fasting OGTT has been performed), to drink a glucose solution and to wait for two or three hours before undergoing the final blood test. Whether the drink itself has side effects is unclear, as is whether this might be a factor contributing to non‐attendance for the test. Alternative tests that have been proposed for the diagnosis of GDM include glycated haemoglobin, fasting blood glucose and random blood glucose, or glycosuria (sugar in the urine); however, it has been suggested that these tests are not as reliable as the OGTT for correctly identifying women with hyperglycaemia (Scott 2002). Globally the number of women diagnosed with GDM is rising; factors associated with this rise include increasing rates of obesity and reduced levels of exercise (Catalano 2011; NICE 2015; Simmons 2011); however lowering thresholds for diagnosis will increase prevalence. Now more than ever, efficient and effective strategies for identifying those with GDM are needed.
How the intervention might work
Oral glucose tolerance test and diagnostic criteria
Until 2013 the World Health Organization recommended that diagnosis of GDM should be based on the same criteria used for non‐pregnant adults (WHO 1999). The WHO recommended that with the 75 g OGTT, GDM (including impaired glucose tolerance) was diagnosed if the fasting plasma glucose level was greater than 7.0 mmol/L, or if the two‐hour level was greater than 7.8 mmol/L. The UK National Institute for Health and Care Excellence (NICE) recommendations (NICE 2015) are based on these criteria; however, although still recommending the 75 g OGTT, NICE recommend that GDM should be diagnosed when either fasting plasma glucose level is equal to or greater than 5.6 mmol/L, or when the two‐hour postload level is equal to or greater than 7.8 mmol/L.
The National Diabetes Data Group (NDDG) recommendations for GDM diagnosis were first published by the American Diabetes Association in 1997 (NDDG 1997); these criteria are based on initial screening with an oral glucose challenge test (OGCT). This test did not require women to fast; they were given a 50 g glucose drink and had blood glucose checked after one hour. If the one‐hour value was equal to or greater than 7.8 mmol/L, a three‐hour 100 g OGTT followed. Subsequently, the NDDG revised its recommendations, suggesting a one‐step approach for high‐risk women, using a 100 g three‐hour OGTT (Expert 2000). For low‐risk women, the NDDG continued to recommend a two‐step approach with an initial 50 g glucose challenge test, followed by a 100 g three‐hour OGTT for women who screen positive with the one‐hour OGCT threshold of 7.8 mmol/L. Blood glucose levels for diagnosis of GDM on the three‐hour test are equal to or greater than 5.3 mmol/L for fasting blood sugar, equal to or greater than 10.0 mmol/L at one hour, equal to or greater than 8.6 mmol/L at two hours and equal to or greater than 7.8 mmol/L at three hours (Expert 2000).
As discussed, the IADPSG has published guidance recommending the 75 g OGTT with lowered thresholds (compared with WHO 1999 criteria) in the light of HAPO study findings (Metzger 2010). Lowering the diagnostic threshold will result in the diagnosis of GDM in more women who have less severe hyperglycaemia. Evidence indicates that treatment of women with mild to moderate GDM reduces the risk of adverse perinatal outcomes; however the beneficial effects of treatment based on diagnosis determined using one criterion may not be the same as those of treatment based on diagnosis of GDM using different criteria.
Current recommendations on the criteria for diagnosis are presented in Table 1, Table 2, Table 3 and NICE 2015. It is clear that the choice of test and diagnostic criteria varies both within and between countries (Kanguru 2014).
| Time | Whole blood venous | Whole blood capillary | Plasma venous | Plasma capillary |
| Fasting glucose (≥) | 6.1 mmol/L | 6.1 mmol/L | 7.0 mmol/L | 7.0 mmol/L |
| 2‐hour glucose | 6.7 mmol/L | 7.8 mmol/L | 7.8 mmol/L | 8.9 mmol/L |
Cutoff levels for diagnosis of gestational diabetes for whole blood and plasma glucose. Diabetes is diagnosed if fasting plasma glucose level is > 7.0 mmol/L, or if 2‐hour level is > 11.1 mmol/L (WHO 1999).
| Time | |||
| Fasting glucose (≥) | 5.0 mmol/L | 5.8 mmol/L | 5.3 mmol/L |
| 1‐hour glucose (≥) | 9.1 mmol/L | 10.0 mmol/L | 10.0 mmol/L |
| 2‐hour glucose (≥) | 8.0 mmol/L | 9.1 mmol/L | 8.6 mmol/L |
| 3‐hour glucose (≥) | 6.9 mmol/L | 8.0 mmol/L | 7.8 mmol/L |
Gestational diabetes is diagnosed when two or more measurements in a single column exceed stated cutoff levels.
aO'Sullivan 1964: cutoff levels for diagnosis of gestational diabetes for whole blood.
bNDDG 1997: cutoff for diagnosis of gestational diabetes for plasma glucose.
cCarpenter 1982: cutoff for diagnosis of gestational diabetes for plasma glucose.
Other tests for gestational diabetes
The main disadvantages of the OGTT are that it is costly and unpleasant for women. Simpler, cheaper and more acceptable tests for initial screening and even diagnosis would be advantageous, provided they were accurate in identifying women with GDM or its complications or both. Random plasma glucose testing has been popular in the past, as it is convenient to perform. However, it fails to identify a large proportion of women who have GDM (low sensitivity) (McElduff 1994). Fasting plasma glucose has greater sensitivity and specificity than random glucose tests, but it relies on women fasting overnight, and it does not perform as well as the OGTT in identifying those with GDM (Perucchini 1999) because worsening insulin resistance in women with GDM may be compensated for by increased insulin production, which means that fasting glucose can be normal, with the early abnormality becoming apparent only after meals.
Glycated haemoglobin, which reflects glucose levels over the past four weeks, does not require an overnight fast and needs only a single blood sample; it is increasingly recommended as a potentially valuable tool for diagnosing diabetes in non‐pregnant people (Fonseca 2009). Use of glycated haemoglobin to diagnose GDM has not been well studied. In countries where fasting or random glucose or glucose challenge tests are not used to universally screen for GDM, the presence of glycosuria has been used as a screening method. Assessment of glycosuria is relatively cheap, non‐invasive and acceptable to pregnant women (Hanna 2008). However, guidance from NICE 2008 and ADA 2017 no longer recommend its use as a screening method, instead suggesting that risk assessment (e.g. based on ethnicity, family history, obesity) should be used as the primary screening method in the absence of a universal blood test for glycaemia. Evidence indicates that glycosuria has low sensitivity for identifying hyperglycaemia/GDM determined by glucose tolerance testing (Scott 2002). However, its sensitivity has not been directly compared with that of risk factors used as the preliminary screening tool in the UK, and limited evidence suggests an association between glycosuria and macrosomia and risk of obesity for future children (Scott 2002).
When to test for gestational diabetes
Views on the most appropriate time to test women for GDM are varied. Timing is important because consideration of the burden on pregnant women and on healthcare service resources means that ideally the test should be performed only once during pregnancy. At the same time, earlier diagnosis and treatment in any woman with GDM may prevent adverse perinatal outcomes. Administering the test during the first trimester results in identification of women with previously undiagnosed type 1 or type 2 diabetes, as well as those with early‐onset newly occurring diabetes. Women at particularly high risk, such as those who had GDM in a previous pregnancy, are often offered an OGTT in the first trimester. However, as most physiological pregnancy‐related changes in insulin sensitivity (sometimes referred to as a glucose challenge test of pregnancy) begin during the second trimester, testing in the first trimester may miss a large proportion of women who will develop GDM. For this reason it has been suggested that high‐risk women who have a normal test in the first trimester will usually require a second test later in pregnancy.
To avoid the need for repeated testing, most women are offered a single test in the late second trimester. This timing serves as a balance between testing too early (thus missing some women who do not develop gestational diabetes until after the test) and testing too late (leaving little time to intervene to reduce plasma glucose and improve outcomes).
Universal versus selective testing
The question of whether to offer universal or selective screening remains controversial and is the topic of another Cochrane Review (Screening for gestational diabetes mellitus to improve maternal and infant health) (Tieu 2014). In the past, screening has been targeted at those with increased risk of developing the condition, for example, women who have had GDM in a previous pregnancy, those with a family history, women of Asian or Carribean ethnicity and those who are obese; however some women without risk factors may develop GDM and may remain untreated. If all women are offered an OGTT, more women with hyperglycaemia will be identified and more women may benefit from treatment (Farrar 2014). There are however no robust trial data to suggest which approach (universal or selective) is best for improving maternal and infant outcomes, even though treatment trials (Crowther 2005; Landon 2009) and reviews (Brown 2017; Farrar 2016) have demonstrated an improvement in several important perinatal outcomes when hyperglycaemia is reduced (a Cochrane Protocol also details a review that will provide an overview of Cochrane Reviews of interventions (Martis 2016)).
Why it is important to do this review
Accurate identification of women with GDM is important, so that treatment can be provided to reduce the risk of adverse outcomes associated with hyperglycaemia. The aim of this Cochrane Review was to compare alternative diagnostic tests for identification of GDM and to assess their association with maternal and infant outcomes and use of healthcare service resources.
Objectives
To evaluate and compare different testing strategies for diagnosis of gestational diabetes mellitus to improve maternal and infant health while assessing their impact on healthcare service costs.
Methods
Criteria for considering studies for this review
Types of studies
We included randomised trials that evaluated diagnostic tests carried out to diagnose gestational diabetes mellitus (GDM). We excluded studies that clearly were not randomised trials, as well as studies that used a quasi‐random design, such as alternate days or date of birth, for allocation to the intervention group. Cluster or cross‐over designed trials were not eligible for inclusion. Abstracts were eligible for inclusion if sufficient information was available for assessment and data extraction.
Types of participants
We included studies if they recruited pregnant women at risk of GDM. We included women if they were at low risk or high risk (such as women who were obese, those with a first‐degree relative with diabetes, high‐risk ethnic groups, high‐fasting or random plasma glucose and previous gestational diabetes) of developing GDM. We included women with single or multiple gestations.
We excluded women with diabetes diagnosed before the incident pregnancy.
Types of interventions
We intended to include all diagnostic tests for GDM, such as glycated haemoglobin, random and fasting blood sugar and oral glucose tolerance tests. We included comparisons of any testing with no testing, as well as comparisons of one form of testing versus another.
We would have included comparisons of testing at different gestational ages if they had been available.
Types of outcome measures
We included the following outcomes in the review. We would have used primary outcomes for subgroup and sensitivity analyses if appropriate.
*A number of the primary and secondary maternal and infant outcome measures were based on the core outcomes for Cochrane gestational diabetes reviews reached by consensus among authors of reviews for treatment of GDM. A number of these had been included in previous versions of this review, but some were added for this update (see Differences between protocol and review).
Primary outcomes
Maternal
-
Mode of birth: normal, caesarean section, instrumental delivery.*
-
Diagnosis of gestational diabetes: as assessed by need for treatment such as diet or insulin.*
Neonatal
-
Macrosomia: birthweight greater than 4.5 kg, or however defined in the trial.*
Secondary outcomes
Maternal
-
Induction of labour.*
-
Side effects of testing, such as vomiting and bruising.
-
Compliance with testing, including attendance.
-
Need for repeat testing by the same or an alternative method.
-
Plasma glucose (non‐prespecified outcome).
-
Perineal trauma.*
-
Placental abruption.*
-
Weight gain during pregnancy.*
-
Breastfeeding (e.g. at discharge, six weeks postpartum).*
-
Measures of costs for healthcare services, such as number of antenatal visits, admissions to hospital.*
-
Measures of costs for women, such as time off work, need for additional child care.*
-
Longer‐term outcomes: postnatal depression, weight retention, GDM in a subsequent pregnancy, cardiovascular health (defined by trials, including blood pressure and hypertension), development of type 2 diabetes.*
-
Women's views, including their preferences and measures of satisfaction.*
-
Quality of life measures.*
Neonatal
-
Death: including perinatal death (stillbirth, death in the first week of life), neonatal death (death in the first 28 days of life) and infant death (death in the first year of life).*
-
Birth trauma, including shoulder dystocia, nerve palsy and fracture.
-
Preterm birth: birth before 37 completed weeks' gestation, birth before 34 weeks.
-
Large‐for‐gestational age: greater than 90th centile, or however defined in the trial.
-
Measures of neonatal morbidity, such as hypoglycaemia, hypocalcaemia, polycythaemia, respiratory distress syndrome, jaundice, admission to special care.
-
Apgar score (less than seven at five minutes).*
-
Gestational age at birth: mean.
-
Birthweight and z‐score.*
-
Ponderal index.*
-
Measures of adiposity.*
-
Shoulder dystocia.*
-
Bone fracture.*
-
Nerve palsy.*
-
Relavent biomarkers, e.g. cord C‐peptide, cord insulin.*
-
Longer‐term outcomes: measures of growth and adiposity and neurodevelopment during childhood and educational achievement, diabetes, blood pressure.*
-
Measures of costs for healthcare services, such as number of days on the neonatal unit, length of stay.*
Search methods for identification of studies
The following Methods section of this review is based on a standard template used by Cochrane Pregnancy and Childbirth.
Electronic searches
We searched Cochrane Pregnancy and Childbirth’s Trials Register by contacting their Information Specialist (6 January 2017).
The Register is a database containing over 22,000 reports of controlled trials in the field of pregnancy and childbirth. For full search methods used to populate Pregnancy and Childbirth’s Trials Register including the detailed search strategies for CENTRAL, MEDLINE, Embase and CINAHL; the list of handsearched journals and conference proceedings, and the list of journals reviewed via the current awareness service, please follow this link to the editorial information about the Cochrane Pregnancy and Childbirth in the Cochrane Library and select the ‘Specialized Register ’ section from the options on the left side of the screen.
Briefly, Cochrane Pregnancy and Childbirth’s Trials Register is maintained by their Information Specialist and contains trials identified from:
-
monthly searches of the Cochrane Central Register of Controlled Trials (CENTRAL);
-
weekly searches of MEDLINE (Ovid);
-
weekly searches of Embase (Ovid);
-
monthly searches of CINAHL (EBSCO);
-
handsearches of 30 journals and the proceedings of major conferences; and
-
weekly current awareness alerts for a further 44 journals plus monthly BioMed Central email alerts.
Search results are screened by two people and the full text of all relevant trial reports identified through the searching activities described above is reviewed. Based on the intervention described, each trial report is assigned a number that corresponds to a specific Pregnancy and Childbirth review topic (or topics), and is then added to the Register. The Information Specialist searches the Register for each review using this topic number rather than keywords. This results in a more specific search set which has been fully accounted for in the relevant review sections (Included studies; Excluded studies; Studies awaiting classification; Ongoing studies).
In addition, we searched ClinicalTrials.gov and the WHO International Clinical Trials Registry Platform (ICTRP) for unpublished, planned and ongoing trial reports (6 January 2017) using the terms given in Appendix 1.
Searching other resources
We searched the reference lists of retrieved studies.
We did not apply any language or date restrictions.
Data collection and analysis
For methods used in the previous version of this review, see Farrar 2015.
For this update, the following methods were used for assessing the 12 reports that were identified as a result of the updated search.
Selection of studies
Two review authors independently assessed for inclusion all potential studies identified as a result of the search. We resolved disagreements through discussion, or, if required, we consulted a third review author.
Data extraction and management
We designed a form for use in extracting data. For eligible studies, two review authors extracted data using the agreed upon form. We resolved discrepancies through discussion, or, if required, we consulted a third review author. We entered data into Review Manager software (RevMan 2014) and checked them for accuracy.
When information regarding any of the above was unclear, we planned to contact authors of the original reports to request further details.
Assessment of risk of bias in included studies
Two review authors independently assessed risk of bias for each study using the criteria outlined in the Cochrane Handbook for Systematic Reviews of Interventions (Higgins 2011). Disagreements were resolved by discussion or by consultation with a third assessor.
(1) Random sequence generation (checking for possible selection bias)
We described for each included study the method used to generate the allocation sequence in sufficient detail to allow an assessment of whether it should produce comparable groups.
We assessed the method as:
-
low risk of bias (any truly random process, e.g. random number table; computer random number generator);
-
high risk of bias (any non‐random process, e.g. odd or even date of birth; hospital or clinic record number); or
-
unclear risk of bias.
(2) Allocation concealment (checking for possible selection bias)
We described for each included study the method used to conceal allocation to interventions before the time of assignment and assessed whether intervention allocation could have been foreseen in advance of or during recruitment, or changed after assignment.
We assessed these methods as:
-
low risk of bias (e.g. telephone or central randomisation; consecutively numbered sealed opaque envelopes);
-
high risk of bias (open random allocation; unsealed or non‐opaque envelopes; alternation; date of birth); or
-
unclear risk of bias.
(3.1) Blinding of participants and personnel (checking for possible performance bias)
We described for each included study the methods used, if any, to blind study participants and personnel from knowledge of which intervention a participant received. We considered that studies were at low risk of bias if they were blinded, or if we judged that lack of blinding was unlikely to affect results. We assessed blinding separately for different outcomes or different classes of outcomes.
We assessed the methods as:
-
low, high or unclear risk of bias for participants; or
-
low, high or unclear risk of bias for personnel.
(3.2) Blinding of outcome assessment (checking for possible detection bias)
We described for each included study the methods used, if any, to blind outcome assessors from knowledge of which intervention a participant received. We assessed blinding separately for different outcomes or different classes of outcomes.
We assessed methods used to blind outcome assessment as:
-
low, high or unclear risk of bias.
(4) Incomplete outcome data (checking for possible attrition bias due to the quantity, nature and handling of incomplete outcome data)
We described for each included study, and for each outcome or class of outcomes, the completeness of data, including attrition and exclusions from the analysis. We stated whether attrition and exclusions were reported and the numbers included in the analysis at each stage (compared with the total number of randomly assigned participants), reasons for attrition or exclusion when reported and whether missing data were balanced across groups or were related to outcomes. When sufficient information was reported, or could be supplied by the trial authors, we planned to re‐include missing data in the analyses that we undertook.
We assessed methods as:
-
low risk of bias (e.g. no missing outcome data; missing outcome data balanced across groups);
-
high risk of bias (e.g. numbers or reasons for missing data imbalanced across groups; ‘as treated’ analysis done with substantial departure of intervention received from that assigned at randomisation); or
-
unclear risk of bias.
(5) Selective reporting (checking for reporting bias)
We described for each included study how we investigated the possibility of selective outcome reporting bias and what we found.
We assessed the methods as:
-
low risk of bias (when it was clear that all of the study’s prespecified outcomes and all expected outcomes of interest to the review had been reported);
-
high risk of bias (when not all of the study’s prespecified outcomes had been reported; one or more reported primary outcomes were not prespecified; outcomes of interest were reported incompletely and so could not be used; study failed to include results of a key outcome that would have been expected to have been reported); or
-
unclear risk of bias.
(6) Other bias (checking for bias due to problems not covered by (1) to (5) above)
We described for each included study important concerns that we had about other possible sources of bias.
(7) Overall risk of bias
We made explicit judgements about whether studies were at high risk of bias, according to the criteria given in the Cochrane Handbook for Systematic Reviews of Interventions (Higgins 2011). With reference to (1) to (6) above, we planned to assess the likely magnitude and direction of bias, and whether we considered it likely to impact study findings. In future updates, we will explore the impact of the level of bias by undertaking sensitivity analyses (see Sensitivity analysis).
Assessment of the quality of the evidence using the GRADE approach
For this update the quality of the evidence was assessed using the GRADE approach as outlined in the GRADE handbook in order to assess the quality of the body of evidence relating to the following outcomes for the main comparisons.
We assessed the quality of the body of evidence as related to the following outcomes for the comparison of 75 g oral glucose tolerance testing (OGTT) versus 100 g GTT.
-
Diagnosis of gestational diabetes.*
-
Caesarean section.*
-
Macrosomia > 4.5 kg, or however defined in the trial.
-
Long‐term type 2 diabetes maternal.*
-
Long‐term type 2 diabetes infant.*
-
Economic costs.
Some of the outcomes above* relate to outcomes from GRADE core outcomes for Cochrane gestational diabetes reviews reached by consensus among authors of reviews for treatment of GDM.
We used GRADEpro Guideline Development Tool to import data from Review Manager 5.3 (RevMan 2014) to create a 'Summary of findings' table. A summary of the intervention effect and a measure of quality for each of the above outcomes was produced using the GRADE approach. The GRADE approach uses five considerations (study limitations, consistency of effect, imprecision, indirectness and publication bias) to assess the quality of the body of evidence for each outcome. The evidence can be downgraded from 'high quality' by one level for serious (or by two levels for very serious) limitations, depending on assessments for risk of bias, indirectness of evidence, serious inconsistency, imprecision of effect estimates or potential publication bias.
Measures of treatment effect
Dichotomous data
For dichotomous data, we presented results as summary risk ratios (RRs) with 95% confidence intervals (CIs).
Continuous data
We used mean differences (MDs) when outcomes were measured in the same way between trials. We planned to use the standardised mean differences (SMDs) to combine trials that measured the same outcome but used different methods. SMDs were not used in this update.
Unit of analysis issues
Cluster‐randomised trials
Cluster‐randomised trials were not eligible for inclusion.
Cross‐over trials
Cross‐over trials were not eligible for inclusion.
Multi‐armed trials
When a multi‐armed trial was included, we recorded and included in the review all outcome data as two‐arm comparisons. We included the data for different arms in independent two‐arm comparisons in separate meta‐analyses. When the control group was shared by the two study arms, we divided the control group between relevant subgroup categories to avoid double counting of participants (for dichotomous data we divided the events and the total population, and for continuous data we assumed the same mean and standard deviation (SD) but divided the total population). In future updates, when we cannot include the data in separate comparisons, we will combine them to create a single pair‐wise comparison (Higgins 2011). We will describe details in the Characteristics of included studies tables.
Other unit of analysis issues
One trial included 35 women with twin pregnancies (Mexico 2011). Effects on outcomes of different strategies for diagnosing GDM may differ between singleton and multiple pregnancies; therefore caution should be taken when the results of analyses that include data from this trial are considered.
Dealing with missing data
For included studies, levels of attrition were noted. In future updates, if more eligible studies are included, the impact of including studies with high levels of missing data in the overall assessment of treatment effect will be explored by performing sensitivity analysis.
For all outcomes, analyses were carried out, as far as possible, on an intention‐to‐treat basis (i.e. we attempted to include in the analyses all participants randomly assigned to each group). The denominator for each outcome in each trial was the number randomly assigned minus any participants whose outcomes were known to be missing.
Assessment of heterogeneity
We assessed statistical heterogeneity in each meta‐analysis using Tau², I² and Chi² statistics and regarded heterogeneity as substantial if I² was greater than 30% and either Tau² was greater than zero or the P value was low (< 0.10) in the Chi² test for heterogeneity. If we identified substantial heterogeneity (> 30%), we planned to explore this by performing prespecified subgroup analysis.
Assessment of reporting biases
In future updates, if 10 or more studies are included in the meta‐analysis, we will investigate reporting biases (such as publication bias) by using funnel plots. We will assess funnel plot asymmetry visually. If asymmetry is suggested by visual assessment, we will perform exploratory analyses to investigate this.
Data synthesis
We carried out statistical analysis using Review Manager software (RevMan 2014). We used fixed‐effect meta‐analysis for combining data when it was reasonable to assume that studies were estimating the same underlying treatment effect (i.e. when trials were examining the same intervention and the trials’ populations and methods were judged sufficiently similar).
If clinical heterogeneity had been sufficient to suggest that underlying treatment effects differed between trials, or if substantial statistical heterogeneity was detected, we planned to use random‐effects meta‐analysis to produce an overall summary if an average treatment effect across trials was considered clinically meaningful. In this update, random‐effects meta‐analysis was not performed. In future updates, if we conduct random‐effects analysis, this will be treated as the average range of possible treatment effects, and we will discuss the clinical implications of differing treatment effects between trials. If the average treatment effect is not clinically meaningful, we will not combine trials. If we use random‐effects analyses, results will be presented as the average treatment effect with 95% CIs, along with estimates of Tau² and I².
Subgroup analysis and investigation of heterogeneity
It was not possible to carry out any subgroup analyses because data were insufficient. In future updates, if we identify substantial heterogeneity, we will investigate this by using subgroup analyses and sensitivity analyses. We will consider whether an overall summary is meaningful, and if it is, we will use random‐effects analysis to produce it.
We will carry out the following subgroup analyses in future updates.
-
Ethnicity.
-
Body mass index (underweight, normal weight, overweight and obese).
The following outcomes will be used in subgroup analyses in future updates.
-
Mode of birth: normal, caesarean section, instrumental delivery.
-
Diagnosis of gestational diabetes ‐ as assessed by need for treatment, such as diet or insulin.
-
Macrosomia: birthweight greater than 4.5 kg, or however defined in the trial.
We will assess subgroup differences by performing interaction tests available within RevMan (RevMan 2014). We will report the results of subgroup analyses by quoting the Chi² statistic and the P value, and those of the interaction test by providing the I² value.
Sensitivity analysis
If relevant to future updates, we will carry out sensitivity analyses to explore the effects of trial quality assessed by concealment of allocation, high attrition rates or both, with poor quality studies excluded from the analyses to permit assessment of whether this makes any difference in the overall result. This was not possible in this update because included data were insufficient.
Results
Description of studies
Results of the search
See Figure 1.
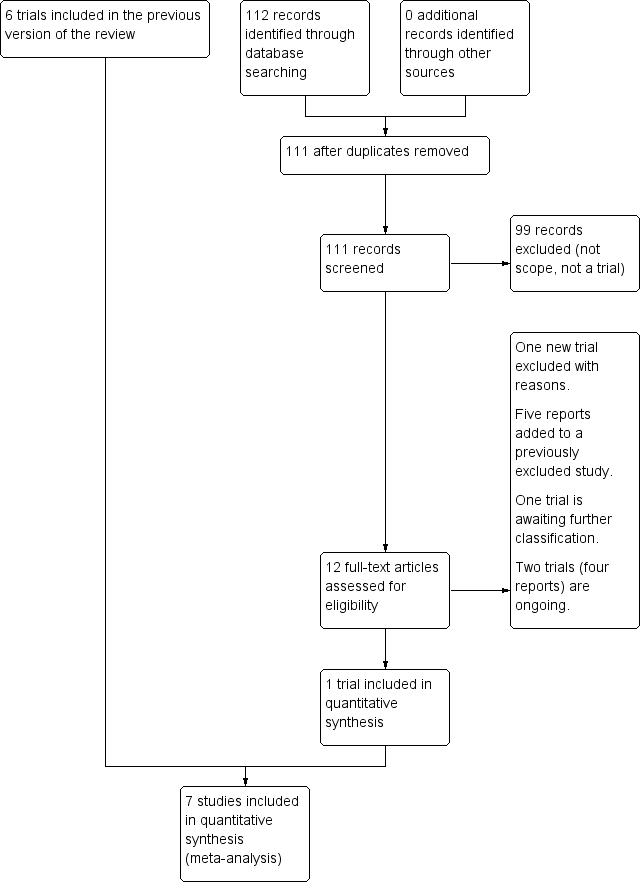
Study flow diagram.
The updated search in January 2017 search retrieved 12 potentially eligible trial reports. One trial was included (Turkey 2014). One trial is awaiting classification (China 2013). One trial was excluded (USA 2015) and a further five trial reports were added to a previously excluded trial (Ireland 2014a). Two trials (four reports) are ongoing (Ireland 2014b; USA 2014).
Included studies
We included seven trials with 1420 women. One new trial including 736 women was included in this update (Turkey 2014). One trial (Nigeria 2004) compared 75 g with 100 g oral glucose tolerance test (OGTT) using World Health Organization (WHO) and National Diabetes Data Group (NDDG) criteria for diagnosis of gestational diabetes mellitus (GDM) (NDDG 1997). One trial (USA 1994) compared a candy bar and glucose polymer and glucose monomer drinks. Glucose monomer, referred to as d‐glucose, was defined as the 'standard' intervention; therefore, data related to this group were divided for comparison with the two remaining intervention groups. One trial compared 50 g glucose food with a 50 g glucose drink (Mexico 2003). Another trial (Mexico 2011) included three comparison groups: 75 g OGTT using WHO criteria; 75 g OGTT using American Diabetes Association (ADA) criteria; and 100 g OGTT using ADA criteria. Non‐randomised participants were included in the 100 g OGTT group (ADA criteria); therefore data for this group were not included in this review. Two trials compared a glucose polymer drink with a glucose monomer drink (New Zealand 1985; USA 1992). One trial compared the two‐step (50 g OGCT and 100 g OGTT, diagnosis based on the Carpenter and Coustan criteria) with the one‐step (75 g OGTT, diagnosis based on the WHO (1999) criteria) approach (Turkey 2014).
Three trials (Mexico 2011; Nigeria 2004; Turkey 2014) reported maternal primary outcomes while only one trial (Mexico 2011) reported neonatal primary outcomes. Another trial (New Zealand 1985) reported macrosomia, but only for women who were subsequently diagnosed with GDM rather than for all women who were randomly assigned. The remaining three trials (Mexico 2003; USA 1992; USA 1994) only reported secondary outcomes. Infant outcomes were reported in three trials (Mexico 2011; New Zealand 1985; Nigeria 2004). Mexico 2011 reported macrosomia and stillbirth. Nigeria 2004 reported difference in mean birthweight, which was not one of our prespecified outcomes. The duration of follow‐up for all trials was short; lasting only one hour in three trials (Mexico 2003; USA 1992; USA 1994) and three hours in two trials (New Zealand 1985; Nigeria 2004). In Turkey 2014 there was no follow up because of the limited data that could be included, in Mexico 2011 follow up lasted up until birth.
Excluded studies
We excluded 30 trials, of which 15 used cross‐over designs (Austria 1994; Austria 1998; Germany 2004; Hong Kong 1993; Iran 2007; Iran 2008; New Zealand 1984a; New Zealand 1984b; Singapore 1992; Thailand 2003; Tunisia 2001; USA 1993a; USA 1993b; USA 1995; USA 1999); five did not randomise allocation (China 1995; China 1995a; Greece 2004; Thailand 1995; USA 1993c); two used quasi‐randomisation techniques (USA 1989; USA 1991); two did not meet our participant inclusion criteria (known non‐GDM and known GDM respectively at recruitment) (Thailand 2008; USA 2001); two did not provide the correct intervention (Canada 1999; Ireland 2000); two did not report outcomes in a form that allowed inclusion in the analyses (Canada 2005; USA 1995a); and one did not report sufficient data (USA 2015).
Risk of bias in included studies
All trials were relatively small and had several aspects of unclear quality with few outcomes reported. See Figure 2 and Figure 3 for a summary of risk of bias assessments.
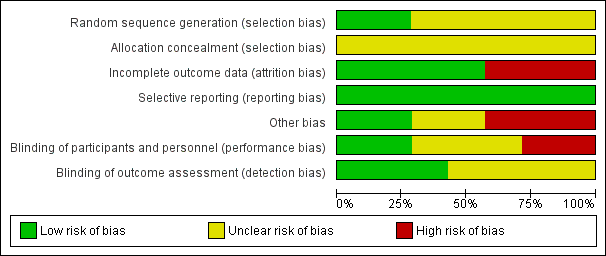
Risk of bias graph: review authors' judgements about each risk of bias item presented as percentages across all included studies.

Risk of bias summary: review authors' judgements about each risk of bias item for each included study.
Allocation
Two trials ( Turkey 2014; USA 1992) were judged as low risk of bias for sequence generation as they used computer generated random numbers and a random number table. It was unclear in the remaining five trials (Mexico 2003; Mexico 2011; New Zealand 1985; Nigeria 2004; USA 1994). All of the trials were judged as unclear risk of bias for allocation concealment.
Blinding
Two trials (New Zealand 1985; Nigeria 2004) were judged low risk for performance bias and detection bias: blinding of personnel and participants was not reported but this was possible because the tests consisted of glucose drinks that appeared to be identical and the outcomes were objective, for example, plasma glucose value and of birthweight, and would not have been affected by knowledge of treatment groups. Two trials were assessed as being at high risk for performance bias (Mexico 2003; USA 1994) and unclear for detection bias: blinding of participants and personnel was not reported but the reporting of side effects may have been influenced by knowledge of the treatment and it is unclear whether knowledge of side effects would have influenced outcome assessment. Two trials (Mexico 2011; USA 1992) were judged as unclear risk for performance bias: in one (Mexico 2011), blinding of personnel and participants was not reported but would have been possible because the tests consisted of glucose drinks that could have appeared to be identical. Blood glucose levels, birthweight and ruptured membranes would not have been affected by knowledge of treatment groups, but outcomes such as caesarean birth may have been affected. Outcome assessment was not reported and so was also assessed as being unclear (Mexico 2011). In the other trial, (USA 1992), it was described as double blind, which is possible as test drinks may have appeared identical, however, the outcome of side effects could have been affected by knowledge of treatment groups, although the plasma glucose value would not have been affected. For outcome assessment, USA 1992, was assessed as being at low risk, because side effects were self‐reported on a questionnaire and thus were not subject to assessor bias and plasma glucose values would not have been affected by lack of blinding on the part of assessors. The final trial, Turkey 2014, was assessed as being at unclear risk for both performance and detection bias: the tests were clearly different, but the outcome of GDM diagnosis is a biochemical assessment and so this would not have been influenced by lack of blinding; outcome assessment was not reported.
Incomplete outcome data
Four trials (Mexico 2003; New Zealand 1985; Turkey 2014; USA 1992) were judged as low risk of attrition bias with no loss to follow‐up described. The three remaining trials (Mexico 2011; Nigeria 2004; USA 1994) were judged as having high risk of attrition bias: loss to follow‐up was reported in up to 11% of participants in (USA 1994); loss of follow‐up was reported up to 15% in another (Nigeria 2004); and seven women were excluded because they could not tolerate the 75 g diagnostic test given in Mexico 2011, suggesting that this trial did not analyse data using intention‐to‐treat methodology.
Selective reporting
All seven included trials (Mexico 2003; Mexico 2011; New Zealand 1985; Nigeria 2004; Turkey 2014; USA 1992; USA 1994) were judged as low risk for reporting bias, however it is possible that not all outcomes were reported as no protocols were available.
Other potential sources of bias
Two trials (New Zealand 1985; Nigeria 2004) were judged as having low risk of bias, with no other potential sources of bias identified. Another three trials (Mexico 2011; Turkey 2014; USA 1994) were assessed as being at high risk of bias for this domain. Turkey 2014 only reported characteristics of women included in their final analysis 486/726; therefore the effectiveness of the randomisation process could not be assessed. Significant group differences were reported with respect to age and parity in USA 1994, which may be due to inadequate randomisation or small sample size. Inclusion of non‐randomised participants and unclear reporting of methods and outcomes suggest potential for 'other' bias in Mexico 2011. It was unclear in the remaining two trials (Mexico 2003; USA 1994).
Effects of interventions
Comparison 1. 75 g OGTT versus 100 g OGTT
We included one trial with 248 women in this comparison.
Primary outcomes
Diagnosis of gestational diabetes
Use of a 75 g OGTT rather than a 100 g OGTT was associated with increased risk of being diagnosed with GDM (RR 2.55, 95% CI 0.96 to 6.75; 1 trial, 248 women; Analysis 1.1; very low‐quality evidence). No other primary outcomes for mother or baby were reported in this trial.
Secondary outcomes
No clear differences in blood glucose levels at one hour (MD ‐0.11, 90% CI ‐0.44 to 0.22; 1 trial, 248 women; Analysis 1.2) and at two hours (MD ‐0.31, 90% CI ‐0.64 to 0.02; 1 trial, 248 women; Analysis 1.2) were observed between groups. At three hours women allocated 75 g OGTT had lower blood glucose than those allocated a 100 g test (MD ‐1.08 mmol/L, 95% CI ‐1.55 to ‐0.61; 1 trial, 248 women; Analysis 1.2). No other maternal nor neonatal outcomes were reported.
Comparison 2. 50 g glucose polymer drink versus 50 g glucose monomer drink
We included three trials with 239 women in this comparison.
Primary outcomes
No primary outcomes were reported.
Secondary outcomes
Two trials with 131 women reported side effects. Total reported side effects were less common with the glucose polymer (RR 0.21, 95% CI 0.07 to 0.59; 1 trial, 63 women; Analysis 2.1). Side effects reported were bloating, pain, nausea, headache, dizziness, tiredness and vomiting. Each reported side effect tended to be less common for women given the glucose polymer drink, with the exception of vomiting, which was not reported by either group. Nausea (RR 0.29, 95% CI 0.11 to 0.78; 1 trial, 66 women) was reported more often by women given the glucose monomer drink. There was no clear difference between groups for headache (RR 0.20, 95% CI 0.02 to 1.62; 1 trial, 66 women); bloating (RR 0.41, 95% CI 0.15 to 1.12; 2 trials, 131 women; I² = 49%); dizziness (RR 0.40, 95% CI 0.08 to 1.92; 1 trial, 66 women); tiredness (RR 1.33, 95% CI 0.32 to 5.50; 1 trial, 66 women); pain (RR 0.14, 95% CI 0.02 to 1.12; 2 trials,129 women; I² = 0%); and taste acceptability (RR 1.05, 95% CI 0.37 to 3.00; 1 trial, 63 women). No other maternal outcomes were reported (see Analysis 2.1).
Three trials (239 women) reported one‐hour glucose levels (MD ‐0.27 mmol/L, 95% CI ‐0.56 to 0.03), and one trial reported two‐hour (MD ‐0.40 mmol/L, 95% CI ‐0.85 to 0.05; 100 women) and three‐hour (MD 0.00 mmol/L, 95% CI ‐0.45 to 0.45; 100 women) glucose levels. No clear difference in glucose levels was noted between the groups (see Analysis 2.2).
Infants in the glucose polymer group had lower gestational age at birth compared with those in the glucose monomer group (MD ‐0.80 weeks, 95% CI ‐1.69 to 0.09; 1 trial, 100 women; Analysis 2.3), but it should be noted that the CIs ranged from a 1.69‐week reduction to a 0.09‐week increase.
No outcomes were reported for the baby.
Comparison 3. Candy bar versus 50 g glucose monomer drink
We included one trial with 60 women in this comparison.
Primary outcomes
No primary outcomes were reported.
Secondary outcomes
Reported side effects were pain, bloating and total side effects. No difference in total side effects was noted between women receiving the candy bar and women receiving the glucose monomer drink (RR 1.03, 95% CI 0.58 to 1.82). There was also no clear difference between the groups for pain (RR 0.17, 95% CI 0.01 to 3.91; 1 trial, 58 women), and bloating (RR 1.08, 95% CI 0.21 to 5.40; 1 trial, 60 participants). Nevertheless, there was evidence to suggest that women preferred the taste of the candy bar (RR 0.60, 95% CI 0.42 to 0.86; 1 trial, 59 women; Analysis 3.1).
The one‐hour serum glucose level was lower for women taking the candy bar than for those taking a glucose monomer drink (MD ‐1.0 mmol/L, 95% CI ‐1.13 to ‐0.87; 1 trial, 59 women; Analysis 3.2). It should be noted that the authors report 'serum' glucose as opposed to 'plasma' glucose (our prespecified outcome) although glucose levels are likely to be similar using either plasma or serum glucose it would be incorrect to report them as one and the same. No other maternal outcomes were reported.
No outcomes were reported for the baby.
Comparison 4. 50 g glucose food versus 50 g glucose drink
We included one trial with 30 women in this comparison.
Primary outcomes
No primary outcomes were reported.
Secondary outcomes
Women receiving glucose in their food, rather than as a drink, reported fewer side effects (RR 0.08, 95% CI 0.01 to 0.56; 1 trial, 30 women; Analysis 4.1). No difference was reported in the number of women requiring repeat testing by the same or an alternative method (RR 0.14, 95% CI 0.01 to 2.55; 1 trial, 30 women; Analysis 4.2).
No other maternal outcomes nor neonatal outcomes were reported.
Comparison 5. 75 g OGTT (WHO criteria) versus 75 g OGTT (ADA criteria)
We included one trial with 116 women in this comparison. No differences between treatment groups were observed for any outcome.
Primary outcomes
Birth outcomes for women were similar among treatment groups for caesarean birth (RR 1.07, 95% CI 0.85 to 1.35; Analysis 5.1) and instrumental birth (RR 0.21, 95% CI 0.01 to 3.94; Analysis 5.2). Diagnosis of gestational diabetes (RR 1.47, 95% CI 0.66 to 3.25; Analysis 5.3) and macrosomia (> 90th percentile by ultrasound or birthweight ≥ 4000 g) (RR 0.73, 95% CI 0.19 to 2.79; Analysis 5.4) were also similar between treatment groups.
Secondary outcomes
No differences between treatment groups were reported for the infant outcome stillbirth (RR 0.49, 95% CI 0.02 to 11.68; Analysis 5.5).
Two‐step approach (50 g oral glucose challenge test (OGCT) followed by selective 100 g OGCT, Carpenter and Coustan criteria) versus one‐step approach (universal 75 g OGTT, ADA criteria)
Primary outcomes
We included one trial with 726 women. Risk of being diagnosed with GDM at 11 to 14 weeks' gestation (RR 0.51, 95% CI 0.28 to 0.95) was lower with the two‐step compared to the one‐step approach. No other outcomes were reported (Analysis 6.1).
Secondary outcomes
No secondary outcomes were reported.
Discussion
Five included trials compared different ways of giving a glucose load (Mexico 2003; New Zealand 1985; Nigeria 2004; USA 1992; USA 1994), one compared outcomes when two different criteria were used to diagnose gestational diabetes mellitus (GDM) with the 75 g oral glucose tolerance test (OGTT) (Mexico 2011) and one compared the two and one‐step approaches (Turkey 2014). None evaluated the more important question of when is the best time during pregnancy to test women for GDM, and none compared the standard OGTT, which requires women to fast overnight, with a test that does not require an overnight fast. No comprehensive comparisons examined healthcare service costs associated with different test strategies. We excluded Canada 2005 from this review because the data were reported as percentages only; however, Meltzer 2010b used a subset of participants from Canada 2005 to conduct a simple analysis of laboratory and transportation costs associated with carrying out the one‐step or the two‐step method and with using the 75 g or 100 g OGTT. The two‐step approach was reported to be less expensive than the one‐step approach.
Summary of main results
We included seven small trials that included a total of 1420 women. Primary outcomes reported were diagnosis of GDM, macrosomia, caesarean section and instrumental birth (Mexico 2011; Nigeria 2004Turkey 2014). Nigeria 2004 compared use of a 75 g OGTT versus a 100 g OGTT and reported results for the diagnosis of GDM. Women who received the 75 g OGTT had greater relative risk of being diagnosed with GDM. Although the point estimate suggests a two‐fold to three‐fold increase in relative risk, the CIs are wide and ranged from a 6.75 increase to a 0.04 reduction. Furthermore, evidence for this outcome was assessed as very low‐quality. Mexico 2011 compared use of the 75 g OGTT (WHO criteria) versus the 75 g OGTT (ADA criteria) and reported results for the diagnosis of GDM, macrosomia, caesarean section and instrumental birth. None of these results showed differences between treatment groups. No trial has yet evaluated the effectiveness of the International Association of Diabetes and Pregnancy Study Groups diagnostic criteria for reducing the risk of adverse perinatal outcomes; the 75 g OGTT is recommended (GDM diagnosis is made if any one glucose level is equal to or greater than fasting 5.1 mmol/L, one hour post load 10.0 mmol/L or two hours post load 8.5 mmol/L). Turkey 2014 compared the two‐step (50 g OGCT followed by 100 g OGTT, Carpenter and Coustan criteria) with the one‐step (75 g OGTT, ADA criteria) approach. This trial was conducted to evaluate the performance characteristics of the two approaches, no maternal or infant outcomes were reported with the exception of GDM diagnosis (other outcomes included sensitivity and specificity and positive and negative predicted value). Results suggest a lower risk of being diagnosed with GDM if the two‐step compared to the one‐step approach was used (RR 0.51, 95% CI 0.28 to 0.95).
Overall, few secondary outcomes were reported. However, trials assessing ways of giving a glucose load that are likely to be more palatable to women tended to report that these alternatives were associated with fewer side effects and that women preferred their taste.
Overall completeness and applicability of evidence
Data in this review are incomplete in two key areas. The first is that no trials have evaluated the important questions, such as when is the best time during pregnancy to test women for GDM, and whether women need to fast overnight before testing. The second is that trials included in this review have not reported data for most of the substantive outcomes. Data are therefore missing for most of the prespecified primary and secondary outcomes. Two trials reported outcomes for infants, but these data were incomplete or were not related to one of our prespecified outcomes and so could not be included in the review.
Studies were conducted in various countries, including Mexico, New Zealand, Nigeria, Turkey and the USA, increasing the generalisability of the findings. Most women were between 24 and 28 weeks' gestation, one trial however reported GDM diagnosis at 11 to 14 weeks' gestation. Some women were classed as being at 'high' risk for GDM, but risk for most was unclear.
Quality of the evidence
None of the trials in this review adequately reported all aspects of the methods used and so the risk of bias of the included studies is generally unclear or high. Five trials were judged as having high risk of bias in at least one domain. Only two of the seven trials reported sequence generation, and concealment of allocation was not clearly reported in any of the trials. Blinding of the participant and the clinician to the intervention would not have been possible for most of these trials, but it would have been possible for the glucose monomer and polymer drinks. In three trials blinding of outcome assessors would have been possible. Losses to follow‐up were variable, and in studies that asked women to complete questionnaires, data are missing for women who did not return the completed questionnaire. One trial suffered a 30% loss of participants which is considerable particularly given the women were still pregnant and therefore still receiving care, reasons for these losses were not provided by the authors. One trial included women with twin pregnancies, but did not report whether investigators accounted for this in their analyses, or to how many and to which comparison groups the twin pregnancies were allocated. Three trials reported that some women did not complete testing because of side effects.
We prespecified six outcomes to be assessed for quality using the GRADE (Grades of Recommendation, Assessment, Development and Evaluation) method. Data for assessment were provided for only one outcome ‐ diagnosis of gestational diabetes for the comparison of 75 g OGTT versus 100 g OGTT and the evidence was considered to be of very low quality when assessed by GRADE due to design limitations, wide confidence intervals crossing the line of no effect, few events and small sample size. No data were reported for the following additional outcomes prespecified for assessment in GRADE: caesarean section, macrosomia > 4.5 kg, long‐term type 2 diabetes maternal, long‐term type 2 diabetes infant and economic costs.
Potential biases in the review process
We conducted an extensive search, but it remains possible that studies may have been missed. If we identify any such studies in future searches, we will assess them for potential inclusion in this review.
As the quality of the included trials is unclear, the potential for bias is present. Another significant source of potential bias is missing outcome data. Therefore study results should be interpreted with caution.
Agreements and disagreements with other studies or reviews
To our knowledge one other review has been published to evaluate methods of diagnosing gestational diabetes mellitus (Scott 2002). This review included primary studies that were unrestricted by study design and therefore were more susceptible to bias. Review authors concluded that high‐quality evidence is insufficient to guide practice, and that randomised trials of alternative screening and diagnostic tests should be undertaken.
A recently published report funded by the UK National Institute for Health Research, Health Technology Assessment programme provides a comprehensive assessment of evidence related to the identification and treatment of hyperglycaemia in pregnancy, including analyses of individual participant data from two large UK based contemporary cohorts, systematic reviews and a comprehensive economic analysis (Farrar 2016). Findings reported include differences in glucose and associated maternal and infant outcome prevalence by ethnic group, highlighting the need for further population‐based epidemiological surveys that include ethnically diverse women. The report concluded that given the lack of longer‐term evidence of effectiveness (and using the NICE recommended QALY threshold), the identification and treatment of hyperglycaemia in pregnancy is not cost‐effective.

Study flow diagram.

Risk of bias graph: review authors' judgements about each risk of bias item presented as percentages across all included studies.

Risk of bias summary: review authors' judgements about each risk of bias item for each included study.

Comparison 1 75 g OGTT versus 100 g OGTT, Outcome 1 Diagnosis of gestational diabetes.

Comparison 1 75 g OGTT versus 100 g OGTT, Outcome 2 Plasma glucose (mmol/L).
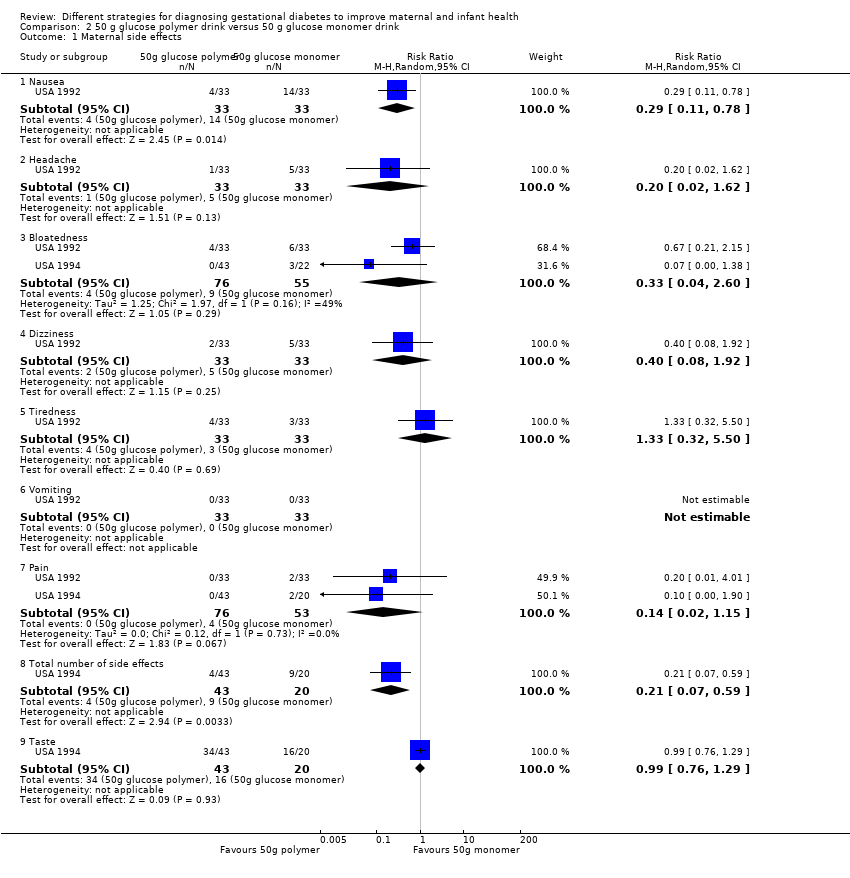
Comparison 2 50 g glucose polymer drink versus 50 g glucose monomer drink, Outcome 1 Maternal side effects.

Comparison 2 50 g glucose polymer drink versus 50 g glucose monomer drink, Outcome 2 Plasma glucose (mmol/L).

Comparison 2 50 g glucose polymer drink versus 50 g glucose monomer drink, Outcome 3 Gestational age at birth (weeks).

Comparison 3 Candy bar versus 50 g glucose monomer drink, Outcome 1 Maternal side effects.

Comparison 3 Candy bar versus 50 g glucose monomer drink, Outcome 2 1‐hour serum glucose level (mmol/L).

Comparison 4 50 g glucose in food versus 50 g glucose drink, Outcome 1 Maternal side effects.
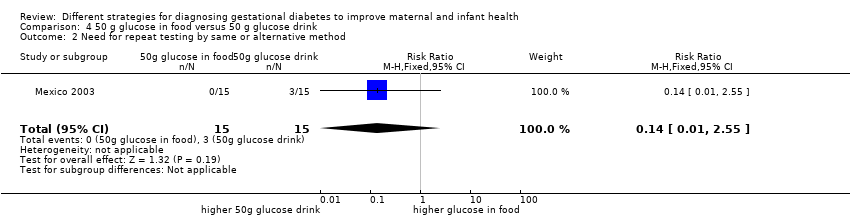
Comparison 4 50 g glucose in food versus 50 g glucose drink, Outcome 2 Need for repeat testing by same or alternative method.

Comparison 5 75 g OGTT (WHO criteria) versus 75 g OGTT (ADA criteria), Outcome 1 Caesarean section.

Comparison 5 75 g OGTT (WHO criteria) versus 75 g OGTT (ADA criteria), Outcome 2 Instrumental delivery.
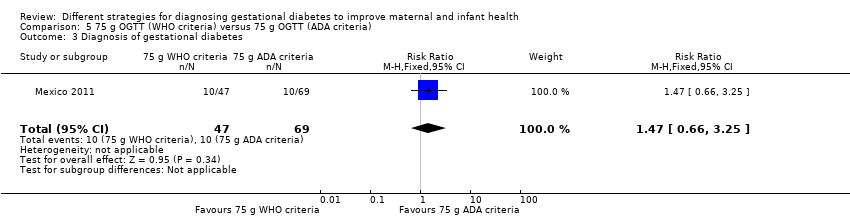
Comparison 5 75 g OGTT (WHO criteria) versus 75 g OGTT (ADA criteria), Outcome 3 Diagnosis of gestational diabetes.

Comparison 5 75 g OGTT (WHO criteria) versus 75 g OGTT (ADA criteria), Outcome 4 Macrosomia.

Comparison 5 75 g OGTT (WHO criteria) versus 75 g OGTT (ADA criteria), Outcome 5 Stillbirth.

Comparison 6 Two‐step (50 g OGCT and 100 g OGTT) versus one‐step (75 g OGTT) approach, Outcome 1 Diagnosis of gestational diabetes.
| 75 g oral glucose tolerance test (OGTT) versus 100 g OGTT for diagnosing gestational diabetes mellitus (GDM) to improve maternal and infant health | ||||||
| Patient or population: pregnant women at low or high risk of gestational diabetes Comparison: 100 g OGTT | ||||||
| Outcomes | Illustrative comparative risks* (95% CI) | Relative effect | Number of participants | Quality of the evidence | Comments | |
| Assumed risk | Corresponding risk | |||||
| 100 g OGTT | 75 g OGTT | |||||
| Diagnosis of gestational diabetes | Study population | RR 2.55 | 248 | ⊕⊝⊝⊝ | Women who received the 75 g OGTT test were 2.55 times more likely to test positive for gestational diabetes. | |
| 45 per 1000 | 116 per 1000 | |||||
| Caesarean section | See comment | See comment | Not estimable | 0 | See comment | None of the included studies reported this outcome. |
| Macrosomia > 4.5 kg or as defined in trial | See comment | See comment | Not estimable | 0 | See comment | None of the included studies reported this outcome. |
| Long‐term type 2 diabetes maternal | See comment | See comment | Not estimable | 0 | See comment | None of the included studies reported this outcome. |
| Long‐term type 2 diabetes infant | See comment | See comment | Not estimable | 0 | See comment | None of the included studies reported this outcome. |
| Economic costs | See comment | See comment | Not estimable | 0 | See comment | None of the included studies reported this outcome. |
| *The basis for the assumed risk (e.g. median control group risk across studies) is the risk. The corresponding risk (and its 95% confidence interval) is based on the assumed risk in the comparison group and the relative effect of the intervention (and its 95% CI). | ||||||
| GRADE Working Group grades of evidence. | ||||||
| aOne study with design limitations (‐1). | ||||||
| Time | Plasma |
| Fasting glucose (≥) | 5.1 mmol/L |
| 1‐hour glucose (≥) | 10.0 mmol/L |
| 2‐hour glucose (≥) | 8.5 mmol/L |
| IADPSG cutoff levels for diagnosis of gestational diabetes for plasma glucose; gestational diabetes is diagnosed if any one value equals or exceeds any other value (Metzger 2010). World Health Organization (WHO) published revised guidance in 2013 recommended IADPSG cutoff levels for the diagnosis of gestational diabetes (WHO 2013). | |
| Time | Whole blood venous | Whole blood capillary | Plasma venous | Plasma capillary |
| Fasting glucose (≥) | 6.1 mmol/L | 6.1 mmol/L | 7.0 mmol/L | 7.0 mmol/L |
| 2‐hour glucose | 6.7 mmol/L | 7.8 mmol/L | 7.8 mmol/L | 8.9 mmol/L |
| Cutoff levels for diagnosis of gestational diabetes for whole blood and plasma glucose. Diabetes is diagnosed if fasting plasma glucose level is > 7.0 mmol/L, or if 2‐hour level is > 11.1 mmol/L (WHO 1999). | ||||
| Time | |||
| Fasting glucose (≥) | 5.0 mmol/L | 5.8 mmol/L | 5.3 mmol/L |
| 1‐hour glucose (≥) | 9.1 mmol/L | 10.0 mmol/L | 10.0 mmol/L |
| 2‐hour glucose (≥) | 8.0 mmol/L | 9.1 mmol/L | 8.6 mmol/L |
| 3‐hour glucose (≥) | 6.9 mmol/L | 8.0 mmol/L | 7.8 mmol/L |
| Gestational diabetes is diagnosed when two or more measurements in a single column exceed stated cutoff levels. aO'Sullivan 1964: cutoff levels for diagnosis of gestational diabetes for whole blood. bNDDG 1997: cutoff for diagnosis of gestational diabetes for plasma glucose. cCarpenter 1982: cutoff for diagnosis of gestational diabetes for plasma glucose. | |||
| Outcome or subgroup title | No. of studies | No. of participants | Statistical method | Effect size |
| 1 Diagnosis of gestational diabetes Show forest plot | 1 | 248 | Risk Ratio (M‐H, Fixed, 95% CI) | 2.55 [0.96, 6.75] |
| 2 Plasma glucose (mmol/L) Show forest plot | 1 | Mean Difference (IV, Fixed, 95% CI) | Subtotals only | |
| 2.1 At 1 hour | 1 | 248 | Mean Difference (IV, Fixed, 95% CI) | ‐0.11 [‐0.44, 0.22] |
| 2.2 At 2 hours | 1 | 248 | Mean Difference (IV, Fixed, 95% CI) | ‐0.31 [‐0.64, 0.02] |
| 2.3 At 3 hours | 1 | 248 | Mean Difference (IV, Fixed, 95% CI) | ‐1.08 [‐1.47, ‐0.69] |
| Outcome or subgroup title | No. of studies | No. of participants | Statistical method | Effect size |
| 1 Maternal side effects Show forest plot | 2 | Risk Ratio (M‐H, Random, 95% CI) | Subtotals only | |
| 1.1 Nausea | 1 | 66 | Risk Ratio (M‐H, Random, 95% CI) | 0.29 [0.11, 0.78] |
| 1.2 Headache | 1 | 66 | Risk Ratio (M‐H, Random, 95% CI) | 0.2 [0.02, 1.62] |
| 1.3 Bloatedness | 2 | 131 | Risk Ratio (M‐H, Random, 95% CI) | 0.33 [0.04, 2.60] |
| 1.4 Dizziness | 1 | 66 | Risk Ratio (M‐H, Random, 95% CI) | 0.4 [0.08, 1.92] |
| 1.5 Tiredness | 1 | 66 | Risk Ratio (M‐H, Random, 95% CI) | 1.33 [0.32, 5.50] |
| 1.6 Vomiting | 1 | 66 | Risk Ratio (M‐H, Random, 95% CI) | 0.0 [0.0, 0.0] |
| 1.7 Pain | 2 | 129 | Risk Ratio (M‐H, Random, 95% CI) | 0.14 [0.02, 1.15] |
| 1.8 Total number of side effects | 1 | 63 | Risk Ratio (M‐H, Random, 95% CI) | 0.21 [0.07, 0.59] |
| 1.9 Taste | 1 | 63 | Risk Ratio (M‐H, Random, 95% CI) | 0.99 [0.76, 1.29] |
| 2 Plasma glucose (mmol/L) Show forest plot | 3 | Mean Difference (IV, Random, 95% CI) | Subtotals only | |
| 2.1 At 1, 2 and 3 hours | 3 | 239 | Mean Difference (IV, Random, 95% CI) | ‐0.20 [‐0.71, 0.32] |
| 2.2 At 2 hours | 1 | 100 | Mean Difference (IV, Random, 95% CI) | ‐0.40 [‐0.85, 0.05] |
| 2.3 At 3 hours | 1 | 100 | Mean Difference (IV, Random, 95% CI) | 0.0 [‐0.45, 0.45] |
| 3 Gestational age at birth (weeks) Show forest plot | 1 | 100 | Mean Difference (IV, Fixed, 95% CI) | ‐0.80 [‐1.69, 0.09] |
| Outcome or subgroup title | No. of studies | No. of participants | Statistical method | Effect size |
| 1 Maternal side effects Show forest plot | 1 | Risk Ratio (M‐H, Fixed, 95% CI) | Subtotals only | |
| 1.1 Pain | 1 | 58 | Risk Ratio (M‐H, Fixed, 95% CI) | 0.17 [0.01, 3.91] |
| 1.2 Bloatedness | 1 | 60 | Risk Ratio (M‐H, Fixed, 95% CI) | 1.08 [0.21, 5.40] |
| 1.3 Total side effects | 1 | 58 | Risk Ratio (M‐H, Fixed, 95% CI) | 1.03 [0.58, 1.82] |
| 1.4 Taste | 1 | 59 | Risk Ratio (M‐H, Fixed, 95% CI) | 0.60 [0.42, 0.86] |
| 2 1‐hour serum glucose level (mmol/L) Show forest plot | 1 | 59 | Mean Difference (IV, Fixed, 95% CI) | ‐1.0 [‐1.13, ‐0.87] |
| Outcome or subgroup title | No. of studies | No. of participants | Statistical method | Effect size |
| 1 Maternal side effects Show forest plot | 1 | 30 | Risk Ratio (M‐H, Fixed, 95% CI) | 0.08 [0.01, 0.56] |
| 2 Need for repeat testing by same or alternative method Show forest plot | 1 | 30 | Risk Ratio (M‐H, Fixed, 95% CI) | 0.14 [0.01, 2.55] |
| Outcome or subgroup title | No. of studies | No. of participants | Statistical method | Effect size |
| 1 Caesarean section Show forest plot | 1 | 116 | Risk Ratio (M‐H, Fixed, 95% CI) | 1.07 [0.85, 1.35] |
| 2 Instrumental delivery Show forest plot | 1 | 116 | Risk Ratio (M‐H, Fixed, 95% CI) | 0.21 [0.01, 3.94] |
| 3 Diagnosis of gestational diabetes Show forest plot | 1 | 116 | Risk Ratio (M‐H, Fixed, 95% CI) | 1.47 [0.66, 3.25] |
| 4 Macrosomia Show forest plot | 1 | 116 | Risk Ratio (M‐H, Fixed, 95% CI) | 0.73 [0.19, 2.79] |
| 5 Stillbirth Show forest plot | 1 | 116 | Risk Ratio (M‐H, Fixed, 95% CI) | 0.49 [0.02, 11.68] |
| Outcome or subgroup title | No. of studies | No. of participants | Statistical method | Effect size |
| 1 Diagnosis of gestational diabetes Show forest plot | 1 | 726 | Risk Ratio (M‐H, Random, 95% CI) | 0.51 [0.28, 0.95] |