Miel para la tos aguda en niños
Referencias
References to studies included in this review
References to studies excluded from this review
References to studies awaiting assessment
References to ongoing studies
Additional references
References to other published versions of this review
Characteristics of studies
Characteristics of included studies [ordered by study ID]
| Methods | Study design: RCT Study duration: 2010 to November 2012 | |
| Participants |
Exclusion criteria Onset of otitis or sinusitis symptoms; onset of symptoms of lower respiratory tract involvement; adding a bacterial infection (purulent nasal discharge, high fever, difficulty breathing, periorbital oedema, facial pain); not using recommended treatments; adding other drugs to recommended treatment; conflicting reports of the carers of the participants | |
| Interventions | Treatment group
Control group
Honey was given in the same volume, frequency, and duration of use as diphenhydramine. | |
| Outcomes |
| |
| Notes |
| |
| Risk of bias | ||
| Bias | Authors' judgement | Support for judgement |
| Random sequence generation (selection bias) | Low risk | Not described but likely done. Randomisation was done by the hospital pharmacist who was not involved in the study. |
| Allocation concealment (selection bias) | Low risk | Not described but probably done. Quote: "The classification of patients was done by the hospital pharmacist" |
| Blinding of participants and personnel (performance bias) | Low risk | Honey was placed in glasses similar to those belonging to diphenhydramine and with a similar concentration, mixed with distilled lukewarm water. The honey and diphenhydramine mixtures were prepared by the pharmacist, who was not part of the study. The paediatricians and parents were unaware of the nature of the treatment each child received. |
| Blinding of outcome assessment (detection bias) | Low risk | Quote: "the treating doctor and the mother were unaware of the nature of the medication (honey or diphenhydramine)"; "In order to prevent the confounding factor of mother’s anxiety or her personal situation, her reports were only accepted if they were corroborated by the reports of a third person close to the child" |
| Incomplete outcome data (attrition bias) | Low risk | All children randomised to treatment arms completed the 2‐day study. |
| Selective reporting (reporting bias) | Low risk | Both outcomes listed in the methods section were reported. |
| Other bias | Unclear risk | Results were presented as the proportion of children with reduced symptom cough instead of the actual mean symptom scores. Furthermore, the scale used for measurement was not clear (a 7‐point Likert‐like scale was used for cough assessment). The protocol was registered retrospectively after completion of the study. |
| Methods | Study design: RCT Study duration: January 2009 to December 2009 | |
| Participants |
Exclusion criteria Quote: "children were excluded if they had signs or symptoms of asthma, pneumonia, laryngotracheobronchitis, sinusitis, and/or allergic rhinitis. Children were also excluded if they had used any cough or cold medication or honey on the night before entering the study" | |
| Interventions | Treatment group
Control group
| |
| Outcomes |
| |
| Notes |
| |
| Risk of bias | ||
| Bias | Authors' judgement | Support for judgement |
| Random sequence generation (selection bias) | Low risk | Randomisation was in blocks of 4. |
| Allocation concealment (selection bias) | Low risk | The envelopes containing the codes for the study preparations were stored at the office of the Ministry of Agriculture, Extension service, Beekeeping Department and were not opened until after the statistical analysis was completed. |
| Blinding of participants and personnel (performance bias) | Low risk | The 3 honeys and the placebo were prepared by someone not involved in the study; interventions were packed in small plastic containers marked A, B, C, and D and distributed to the paediatric community clinics. Silan date extract was used as a placebo because its structure, brown colour, and taste are similar to that of honey. The parents, physicians, and investigators did not know the content of the preparation that was dispensed. |
| Blinding of outcome assessment (detection bias) | Low risk | The parents, physicians, and investigators did not know the content of the preparation that was dispensed. Interventions were packed in small plastic containers marked A, B, C, and D and distributed to the paediatric community clinics. Silan date extract was used as a placebo because its structure, brown colour, and taste are similar to that of honey. |
| Incomplete outcome data (attrition bias) | Unclear risk | 14 (19%), 13 (18%), 2 (3%), and 4 (5%) children were lost to follow‐up in the eucalyptus honey, citrus honey, Labiatae honey, and placebo groups, respectively. The authors stated that the reasons for loss to follow‐up were unknown. However, attrition was significantly high in the eucalyptus honey and citrus honey groups. It is unclear if the reasons for attrition in the treatment groups were related to the study or not and if the reasons were similar. |
| Selective reporting (reporting bias) | Low risk | All outcomes listed in the protocol were reported. |
| Other bias | Low risk | Not detected |
| Methods | RCT | |
| Participants |
Exclusion criteria Quote: "patients were excluded if they had signs or symptoms of a more treatable disease (e.g., asthma, pneumonia, laryngotracheobronchitis, sinusitis, allergic rhinitis). They were also ineligible when they had a history of reactive airways disease, asthma, or chronic lung disease or were using a drug known to inhibit the metabolism of dextromethorphan, such as selective serotonin reuptake inhibitors. Subjects were also excluded if on the prior evening they had taken a medication that included an antihistamine or dextromethorphan hydrobromide within 6 hours of bedtime or dextromethorphan polistirex within 12 hours of bedtime on the evening prior to or on the day of enrolment" (p. 1141) | |
| Interventions | Treatment group
Control group
Parents were instructed that their child’s treatment could be given with a non‐caffeinated beverage and should be administered within 30 minutes of the child going to sleep. Intervention and control were in a 10‐millilitre opaque syringe and kept in brown paper bags. | |
| Outcomes |
| |
| Notes |
| |
| Risk of bias | ||
| Bias | Authors' judgement | Support for judgement |
| Random sequence generation (selection bias) | Low risk | Not described but probably done. Quote: "The randomisation sequence was constructed by a statistician not affiliated with the study and was then used by the study coordinators to assign treatment group" |
| Allocation concealment (selection bias) | Low risk | Not described but probably done. Treatment allocation was concealed in 10‐millilitre opaque syringe and kept in brown paper bags. |
| Blinding of participants and personnel (performance bias) | High risk | The syringes used for all 3 treatment groups were opaque and placed in a brown paper bag to conceal the treatments from the investigators. The no‐treatment group was not blinded to their treatment, but the honey and dextromethorphan arms were blinded. |
| Blinding of outcome assessment (detection bias) | High risk | Although all participants were given syringes in brown paper bags, the no‐treatment group had empty syringes, which could influence the assessment of the outcome. |
| Incomplete outcome data (attrition bias) | Low risk | 2 children from the no‐treatment group were lost to follow‐up; 1 was withdrawn from the dextromethorphan group because the participant did not take the treatment. |
| Selective reporting (reporting bias) | Low risk | All outcomes were adequately reported. |
| Other bias | Low risk | It is unclear whether any of the no‐treatment group revealed to any of the assessors during phone conversations that they were given no treatment. Children lost to follow‐up or withdrawn were not included in the final analysis. |
| Methods | RCT | |
| Participants |
Exclusion criteria Children with history of obstructive pulmonary disease, cystic fibrosis, neuropathies, heart disease, diabetes, or identifiable primary or secondary immunodeficiencies | |
| Interventions | Treatment group
Control group
Quote: "the quality of the honey was certified in both groups and approved by the regulatory agencies and the National Health Surveillance Agency (Anvisa) for sale; the honey had been recently produced and underwent strict bacteriological control" | |
| Outcomes |
| |
| Notes |
| |
| Risk of bias | ||
| Bias | Authors' judgement | Support for judgement |
| Random sequence generation (selection bias) | Low risk | Randomisation was carried out according to a table generated in Microsoft Excel. |
| Allocation concealment (selection bias) | Low risk | Not described but very likely. Treatments were labelled A and B. Quote: "Neither the investigator nor the patient, nor the family knew which product was used"; "The treatment groups were revealed only after the analysis of the study results" |
| Blinding of participants and personnel (performance bias) | Low risk | Quote: "neither the investigator nor the patient, nor the family knew which product was used. The treatment groups were revealed only after the analysis of the study results" |
| Blinding of outcome assessment (detection bias) | Low risk | Quote: "neither the investigator nor the patient, nor the family knew which product was used. The treatment groups were revealed only after the analysis of the study results" |
| Incomplete outcome data (attrition bias) | Low risk | All participants randomised were included in the final analysis. |
| Selective reporting (reporting bias) | Low risk | All outcomes listed in the study protocol and methods section were reported. |
| Other bias | Unclear risk | Used an unvalidated 5‐point cough scale that differed from the cough scale used by the other included studies |
| Methods | RCT | |
| Participants |
Exclusion criteria "asthma, pneumonia, laryngotracheobronchitis, sinusitis, allergic rhinitis, chronic lung disease, congenital heart disease, malignancy, and diabetes were not included in the study. antihistamine, diphenhydramine, or dextromethorphan 4 hours before sleep or had consumed cytochrome P450 inhibitors simultaneously (i.e. serotonin‐reabsorption selective inhibitors) were also excluded from the study. Parents were also excluded if they were using a drug and herbal that had an effect on sleeping, such as sedatives" | |
| Interventions | Treatment group
Control group
| |
| Outcomes |
| |
| Notes |
| |
| Risk of bias | ||
| Bias | Authors' judgement | Support for judgement |
| Random sequence generation (selection bias) | Low risk | Randomisation was by random numbers table. |
| Allocation concealment (selection bias) | Unclear risk | It was not clear whether treatment allocation was concealed. |
| Blinding of participants and personnel (performance bias) | High risk | Neither the investigators nor caregivers were blinded to treatments given, which could greatly influence the assessment of outcome. |
| Blinding of outcome assessment (detection bias) | High risk | Neither the investigators nor caregivers were blinded to treatments given, which could greatly influence the assessment of outcome. |
| Incomplete outcome data (attrition bias) | Unclear risk | 7 participants from the honey group, 4 from the dextromethorphan group, 6 from the diphenhydramine group, and 4 from the no‐treatment group were either lost to follow‐up or withdrawn for violating the protocol. Attrition was high for the honey and diphenhydramine groups. Participants were excluded from analysis for not visiting the physician as scheduled or using the drugs inappropriately. The proportion of children who did not visit physician as scheduled or violated protocol per group was unclear. |
| Selective reporting (reporting bias) | Low risk | All outcomes listed in the protocol were reported. |
| Other bias | Unclear risk | Some of the questions put to mothers were answered by the paediatrician because the questions were ambiguous, which could also have influenced the assessment of outcomes. Since mothers were filling in the questionnaire in the presence of the physician, it is unclear if this could have influenced the assessment of outcomes (p. 788) |
| Methods | RCT | |
| Participants |
Exclusion criteria Prior use (48 hours) of any cough mixture, study agents, oral antihistamines, nasal decongestants, steroids, or antibiotics. Other exclusions were any past history of atopy, asthma, or any chronic lung disease as well as hospitalisation for lower respiratory tract infection in the past 6 months. | |
| Interventions | Treatment group
Control group
| |
| Outcomes |
| |
| Notes |
| |
| Risk of bias | ||
| Bias | Authors' judgement | Support for judgement |
| Random sequence generation (selection bias) | Low risk | Dispensing study drugs was undertaken following a random order previously generated by a statistician not involved in care of study participants. |
| Allocation concealment (selection bias) | Low risk | Not described, but risk of bias unlikely. All 3 study drugs were prepared, bottled, packaged, and labelled as Study Drug A, B, and C by Universal Corporation Ltd, who also held the code until after statistical analysis was completed. |
| Blinding of participants and personnel (performance bias) | Low risk | All 3 study drugs were prepared, bottled, packaged, and labelled as Study Drug A, B, and C by Universal Corporation Ltd, who also held the code until after statistical analysis was completed. |
| Blinding of outcome assessment (detection bias) | Low risk | All 3 study drugs were prepared, bottled, packaged, and labelled as Study Drug A, B, and C by Universal Corporation Ltd, who also held the code until after statistical analysis was completed. |
| Incomplete outcome data (attrition bias) | Unclear risk | 13%, 7%, and 5% of children in the placebo, honey, and salbutamol groups, respectively, were lost to follow‐up or were in violation of study protocol. It is unclear if the reasons for not completing the study were the same across study groups. It is possible that more participants in the placebo group left because their condition worsened. |
| Selective reporting (reporting bias) | Low risk | Not detected |
| Other bias | Low risk | Unlikely |
ITT: intention‐to‐treat; OTC: over‐the‐counter; RCT: randomised controlled trial; SD: standard deviation; URTI: upper respiratory tract infection
Characteristics of excluded studies [ordered by study ID]
| Study | Reason for exclusion |
| Not an RCT; this was a feasibility study of honey for the treatment of cough in children | |
| Quasi‐RCT | |
| Not an RCT; commentary on a previous version of this review (Oduwole 2014a) | |
| Wrong intervention: compared polysaccharide‐resin‐honey to carbocysteine syrup. The study examined honey‐based cough syrup (polysaccharide‐resin‐honey) versus a non‐honey‐based cough syrup (carbocysteine syrup). We would have included this study if the comparisons had been polysaccharide‐resin‐honey versus honey alone/polysaccharide‐resin alone or carbocysteine syrup + honey versus carbocysteine syrup alone. | |
| Not an RCT | |
| Wrong intervention: compared honey and milk versus dextromethorphan and honey and milk versus levodropropizine | |
| Not an RCT |
RCT: randomised controlled trial
Characteristics of studies awaiting assessment [ordered by year of study]
| Methods | Randomised clinical trial |
| Participants | Children aged 2 to 12 years |
| Interventions | 2 types of honey versus diphenhydramine |
| Outcomes | Cough frequency, bothersome nature of cough, and severity |
| Notes | Completed |
Characteristics of ongoing studies [author‐defined order]
| Trial name or title | Comparison of a protective cough syrup against placebo on night cough in children 1 to 5 years coughing since 1 to 2 days due to common cold |
| Methods | Randomised controlled trial |
| Participants | Children aged 1 to 5 years (i.e. 1 day before the 6th birthday, males and females) Inclusion criteria: cough attributed to infection of the upper respiratory tract present in the child for not more than 2 days |
| Interventions | Cough syrup containing specific plant extracts (Poliflav MA) and honey versus placebo |
| Outcomes | Primary
Secondary
(Time frame: First and only night of treatment) |
| Starting date | September 2017 |
| Contact information | Prof Herman A Cohen Email: [email protected] Affiliation: Clalit Health Services |
| Notes | This study is not yet open for participant recruitment (November 2017). |
| Trial name or title | Effectiveness of honey and expectorant for nocturnal cough in children with acute upper respiratory infection: a prospective interventional study |
| Methods | Parallel randomised |
| Participants | Children aged 2 to 16 years Inclusion criteria:
|
| Interventions | Honey (5 g for those age 2 to 5 years, 10 g for those aged 6 years and above) orally before bedtime for a week versus carbocysteine (30 mg/kg/day) and ambroxol (0.9 mg/kg/day) orally for a week |
| Outcomes | Primary outcome: change in frequency of nocturnal cough on the next day when honey or expectorant had been given prior to bedtime compared to that on the first day of presentation when no medication had been given Secondary outcomes: Change in severity of nocturnal cough, bothersome cough, appetite, and quality of sleep at night on the next day when honey or expectorant had been given prior to bedtime compared to that on the first day of presentation when no medication had been given. Improvement of nocturnal cough 1 week after honey or expectorant had been given prior to bedtime compared to that on the first day of presentation when no medication had been given |
| Starting date | 25 January 2016 |
| Contact information | Name: Kazushi Agata; Shun Kishibe Address: 1163 Tatemachi, Hachioji, Tokyo, Japan; 2‐8‐29 Musashidai, Fuchu‐shi, Tokyo, Japan Email: [email protected]; [email protected] Affiliation: Tokyo Medical University Hachioji Medical Center Pediatrics; Tokyo Metropolitan Children's Medical Center Pediatric Emergency Medicine |
| Notes |
Data and analyses
| Outcome or subgroup title | No. of studies | No. of participants | Statistical method | Effect size |
| 1 Honey versus dextromethorphan Show forest plot | 2 | Mean Difference (Random, 95% CI) | Subtotals only | |
| Analysis 1.1  Comparison 1 Pair‐wise comparison, Outcome 1 Honey versus dextromethorphan. | ||||
| 1.1 Frequency of cough (mean reduction in cough frequency) | 2 | 149 | Mean Difference (Random, 95% CI) | ‐0.07 [‐1.07, 0.94] |
| 1.2 Severity of cough (mean reduction in severity of cough) | 2 | 149 | Mean Difference (Random, 95% CI) | ‐0.13 [‐1.25, 0.99] |
| 1.3 Bothersome cough (mean reduction in bothersome cough) | 1 | 69 | Mean Difference (Random, 95% CI) | 0.29 [‐0.56, 1.14] |
| 1.4 Children's sleep (mean reduction in cough impact on sleep score) | 2 | 149 | Mean Difference (Random, 95% CI) | 0.03 [‐1.12, 1.19] |
| 1.5 Parents' sleep (mean reduction in cough impact on sleep score) | 2 | 149 | Mean Difference (Random, 95% CI) | ‐0.16 [‐0.84, 0.53] |
| 1.6 Combined cough score (reduction in combined cough score) | 1 | 69 | Mean Difference (Random, 95% CI) | 2.32 [‐1.24, 5.88] |
| 2 Honey versus diphenhydramine Show forest plot | 1 | Mean Difference (Random, 95% CI) | Subtotals only | |
| Analysis 1.2  Comparison 1 Pair‐wise comparison, Outcome 2 Honey versus diphenhydramine. | ||||
| 2.1 Frequency of cough (mean reduction in cough frequency) | 1 | 80 | Mean Difference (Random, 95% CI) | ‐0.57 [‐0.90, ‐0.24] |
| 2.2 Severity of cough (mean reduction in severity of cough) | 1 | 80 | Mean Difference (Random, 95% CI) | ‐0.6 [‐0.94, ‐0.26] |
| 2.3 Children's sleep (mean reduction in cough impact on sleep score) | 1 | 80 | Mean Difference (Random, 95% CI) | ‐0.55 [‐0.87, ‐0.23] |
| 2.4 Parents' sleep (mean reduction in cough impact on sleep score) | 1 | 80 | Mean Difference (Random, 95% CI) | ‐0.48 [‐0.76, ‐0.20] |
| 3 Honey versus no treatment Show forest plot | 2 | Mean Difference (Random, 95% CI) | Subtotals only | |
| Analysis 1.3  Comparison 1 Pair‐wise comparison, Outcome 3 Honey versus no treatment. | ||||
| 3.1 Frequency of cough (mean reduction in frequency of cough) | 2 | 154 | Mean Difference (Random, 95% CI) | ‐1.05 [‐1.48, ‐0.62] |
| 3.2 Severity of cough (mean reduction in severity of cough) | 2 | 154 | Mean Difference (Random, 95% CI) | ‐1.03 [‐1.59, ‐0.47] |
| 3.3 Bothersome cough (mean reduction in bothersome cough) | 1 | 74 | Mean Difference (Random, 95% CI) | ‐0.93 [‐1.98, 0.12] |
| 3.4 Children's sleep (mean reduction in cough impact on sleep score) | 2 | 154 | Mean Difference (Random, 95% CI) | ‐1.04 [‐1.57, ‐0.51] |
| 3.5 Parents' sleep (mean reduction in cough impact on sleep score) | 2 | 154 | Mean Difference (Random, 95% CI) | ‐0.88 [‐1.23, ‐0.52] |
| 3.6 Combined reduction in symptoms score | 1 | 74 | Mean Difference (Random, 95% CI) | ‐4.31 [‐6.77, ‐1.85] |
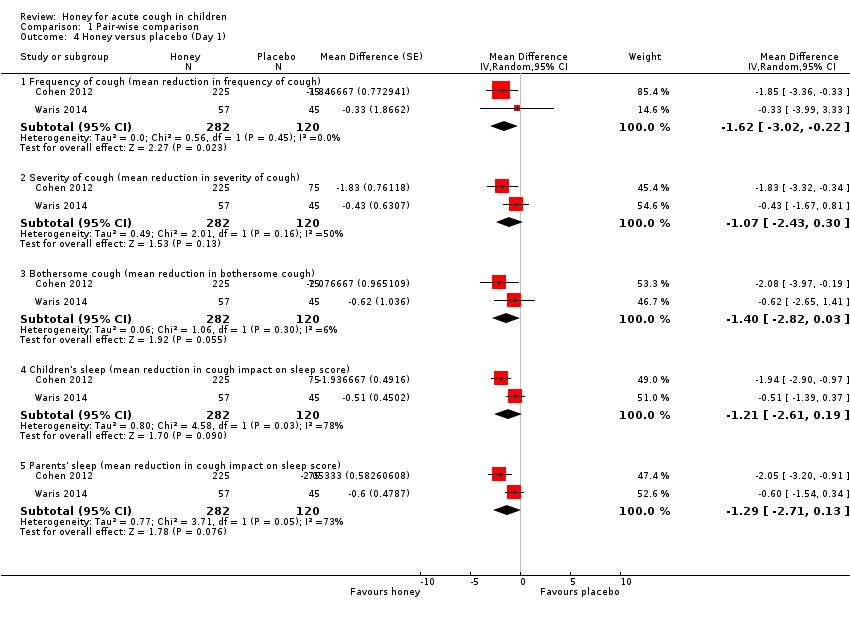
| 4 Honey versus placebo (Day 1) Show forest plot | 2 | Mean Difference (Random, 95% CI) | Subtotals only | |
| Analysis 1.4  Comparison 1 Pair‐wise comparison, Outcome 4 Honey versus placebo (Day 1). | ||||
| 4.1 Frequency of cough (mean reduction in frequency of cough) | 2 | 402 | Mean Difference (Random, 95% CI) | ‐1.62 [‐3.02, ‐0.22] |
| 4.2 Severity of cough (mean reduction in severity of cough) | 2 | 402 | Mean Difference (Random, 95% CI) | ‐1.07 [‐2.43, 0.30] |
| 4.3 Bothersome cough (mean reduction in bothersome cough) | 2 | 402 | Mean Difference (Random, 95% CI) | ‐1.40 [‐2.82, 0.03] |
| 4.4 Children's sleep (mean reduction in cough impact on sleep score) | 2 | 402 | Mean Difference (Random, 95% CI) | ‐1.21 [‐2.61, 0.19] |
| 4.5 Parents' sleep (mean reduction in cough impact on sleep score) | 2 | 402 | Mean Difference (Random, 95% CI) | ‐1.29 [‐2.71, 0.13] |
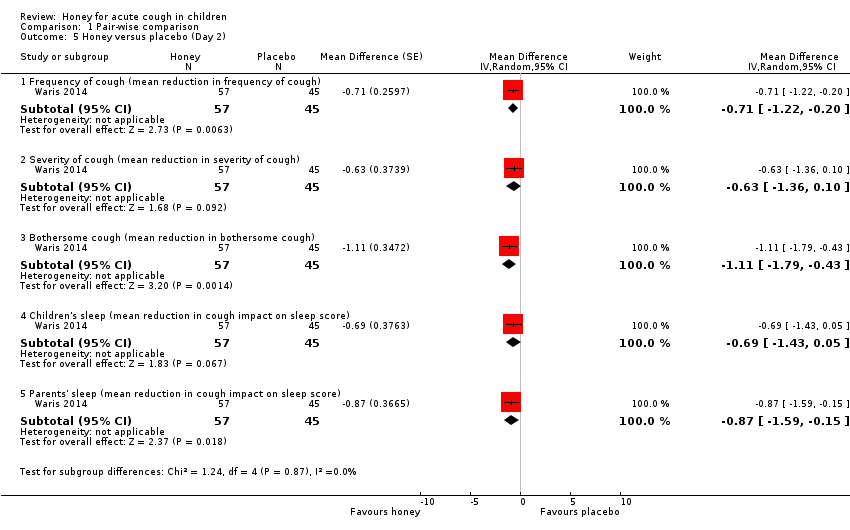
| 5 Honey versus placebo (Day 2) Show forest plot | 1 | Mean Difference (Random, 95% CI) | Subtotals only | |
| Analysis 1.5  Comparison 1 Pair‐wise comparison, Outcome 5 Honey versus placebo (Day 2). | ||||
| 5.1 Frequency of cough (mean reduction in frequency of cough) | 1 | 102 | Mean Difference (Random, 95% CI) | ‐0.71 [‐1.22, ‐0.20] |
| 5.2 Severity of cough (mean reduction in severity of cough) | 1 | 102 | Mean Difference (Random, 95% CI) | ‐0.63 [‐1.36, 0.10] |
| 5.3 Bothersome cough (mean reduction in bothersome cough) | 1 | 102 | Mean Difference (Random, 95% CI) | ‐1.11 [‐1.79, ‐0.43] |
| 5.4 Children's sleep (mean reduction in cough impact on sleep score) | 1 | 102 | Mean Difference (Random, 95% CI) | ‐0.69 [‐1.43, 0.05] |
| 5.5 Parents' sleep (mean reduction in cough impact on sleep score) | 1 | 102 | Mean Difference (Random, 95% CI) | ‐0.87 [‐1.59, ‐0.15] |
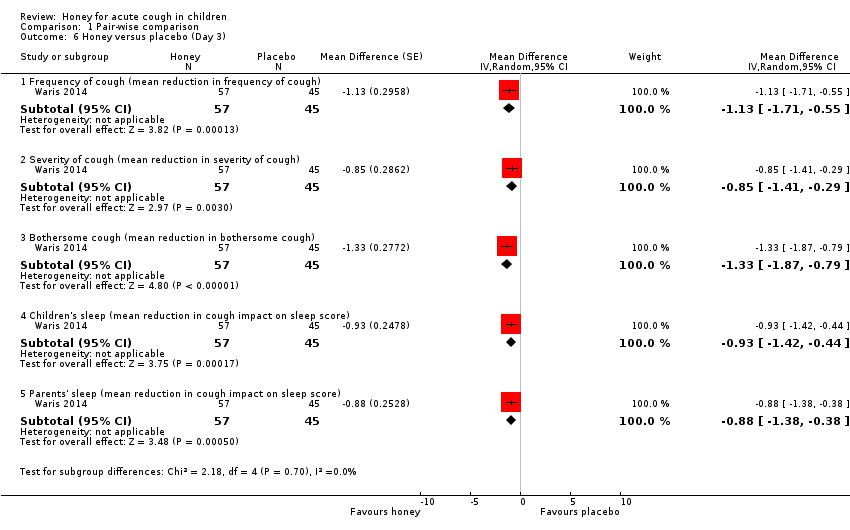
| 6 Honey versus placebo (Day 3) Show forest plot | 1 | Mean Difference (Random, 95% CI) | Subtotals only | |
| Analysis 1.6  Comparison 1 Pair‐wise comparison, Outcome 6 Honey versus placebo (Day 3). | ||||
| 6.1 Frequency of cough (mean reduction in frequency of cough) | 1 | 102 | Mean Difference (Random, 95% CI) | ‐1.13 [‐1.71, ‐0.55] |
| 6.2 Severity of cough (mean reduction in severity of cough) | 1 | 102 | Mean Difference (Random, 95% CI) | ‐0.85 [‐1.41, ‐0.29] |
| 6.3 Bothersome cough (mean reduction in bothersome cough) | 1 | 102 | Mean Difference (Random, 95% CI) | ‐1.33 [‐1.87, ‐0.79] |
| 6.4 Children's sleep (mean reduction in cough impact on sleep score) | 1 | 102 | Mean Difference (Random, 95% CI) | ‐0.93 [‐1.42, ‐0.44] |
| 6.5 Parents' sleep (mean reduction in cough impact on sleep score) | 1 | 102 | Mean Difference (Random, 95% CI) | ‐0.88 [‐1.38, ‐0.38] |
| 7 Honey versus placebo (Day 4) Show forest plot | 1 | Mean Difference (Random, 95% CI) | Subtotals only | |
| Analysis 1.7  Comparison 1 Pair‐wise comparison, Outcome 7 Honey versus placebo (Day 4). | ||||
| 7.1 Frequency of cough (mean reduction in frequency of cough) | 1 | 102 | Mean Difference (Random, 95% CI) | ‐1.16 [‐1.83, ‐0.49] |
| 7.2 Severity of cough (mean reduction in severity of cough) | 1 | 102 | Mean Difference (Random, 95% CI) | ‐0.88 [‐1.59, ‐0.17] |
| 7.3 Bothersome cough (mean reduction in bothersome cough) | 1 | 102 | Mean Difference (Random, 95% CI) | ‐0.90 [‐1.76, ‐0.04] |
| 7.4 Children's sleep (mean reduction in cough impact on sleep score) | 1 | 102 | Mean Difference (Random, 95% CI) | ‐0.7 [‐1.25, ‐0.15] |
| 7.5 Parents' sleep (mean reduction in cough impact on sleep score) | 1 | 102 | Mean Difference (Random, 95% CI) | ‐0.90 [‐1.51, ‐0.29] |
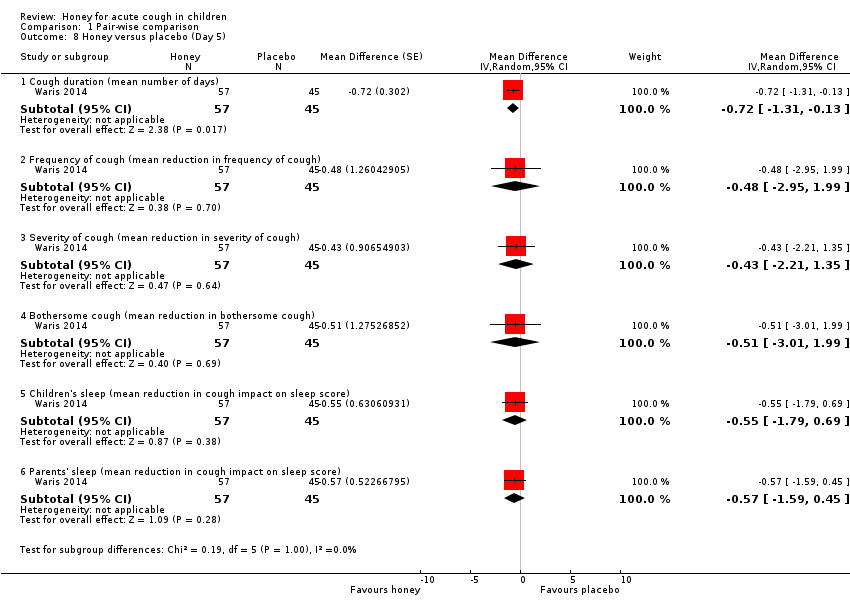
| 8 Honey versus placebo (Day 5) Show forest plot | 1 | Mean Difference (Random, 95% CI) | Subtotals only | |
| Analysis 1.8  Comparison 1 Pair‐wise comparison, Outcome 8 Honey versus placebo (Day 5). | ||||
| 8.1 Cough duration (mean number of days) | 1 | 102 | Mean Difference (Random, 95% CI) | ‐0.72 [‐1.31, ‐0.13] |
| 8.2 Frequency of cough (mean reduction in frequency of cough) | 1 | 102 | Mean Difference (Random, 95% CI) | ‐0.48 [‐2.95, 1.99] |
| 8.3 Severity of cough (mean reduction in severity of cough) | 1 | 102 | Mean Difference (Random, 95% CI) | ‐0.43 [‐2.21, 1.35] |
| 8.4 Bothersome cough (mean reduction in bothersome cough) | 1 | 102 | Mean Difference (Random, 95% CI) | ‐0.51 [‐3.01, 1.99] |
| 8.5 Children's sleep (mean reduction in cough impact on sleep score) | 1 | 102 | Mean Difference (Random, 95% CI) | ‐0.55 [‐1.79, 0.69] |
| 8.6 Parents' sleep (mean reduction in cough impact on sleep score) | 1 | 102 | Mean Difference (Random, 95% CI) | ‐0.57 [‐1.59, 0.45] |
| 9 Honey versus salbutamol (Day 1) Show forest plot | 1 | Mean Difference (Random, 95% CI) | Subtotals only | |
| Analysis 1.9  Comparison 1 Pair‐wise comparison, Outcome 9 Honey versus salbutamol (Day 1). | ||||
| 9.1 Frequency of cough (mean reduction in frequency of cough) | 1 | 100 | Mean Difference (Random, 95% CI) | ‐0.26 [‐3.14, 2.62] |
| 9.2 Severity of cough (mean reduction in severity of cough) | 1 | 100 | Mean Difference (Random, 95% CI) | ‐0.1 [‐0.39, 0.19] |
| 9.3 Bothersome cough (mean reduction in bothersome cough) | 1 | 100 | Mean Difference (Random, 95% CI) | ‐0.21 [‐0.90, 0.48] |
| 9.4 Children's sleep (mean reduction in cough impact on sleep score) | 1 | 100 | Mean Difference (Random, 95% CI) | 0.09 [‐0.05, 0.23] |
| 9.5 Parents' sleep (mean reduction in cough impact on sleep score) | 1 | 100 | Mean Difference (Random, 95% CI) | 0.05 [‐0.03, 0.13] |
| 10 Honey versus salbutamol (Day 2) Show forest plot | 1 | Mean Difference (Random, 95% CI) | Subtotals only | |
| Analysis 1.10  Comparison 1 Pair‐wise comparison, Outcome 10 Honey versus salbutamol (Day 2). | ||||
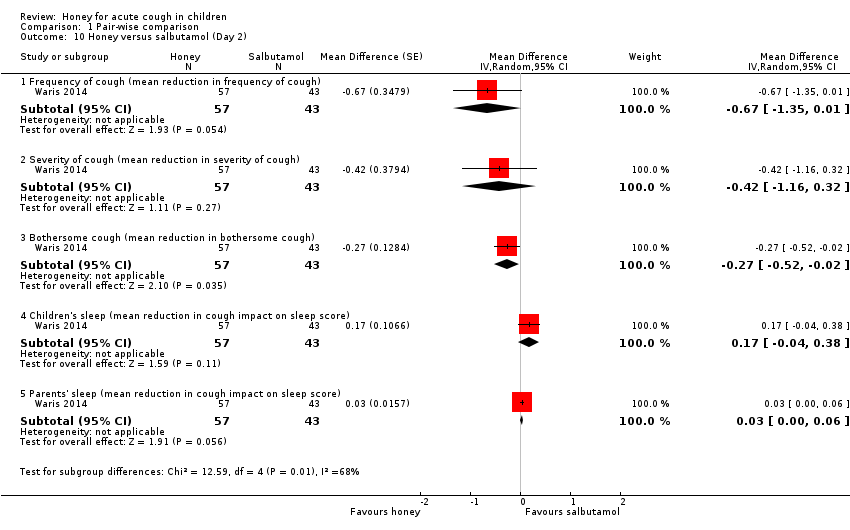
| 10.1 Frequency of cough (mean reduction in frequency of cough) | 1 | 100 | Mean Difference (Random, 95% CI) | ‐0.67 [‐1.35, 0.01] |
| 10.2 Severity of cough (mean reduction in severity of cough) | 1 | 100 | Mean Difference (Random, 95% CI) | ‐0.42 [‐1.16, 0.32] |
| 10.3 Bothersome cough (mean reduction in bothersome cough) | 1 | 100 | Mean Difference (Random, 95% CI) | ‐0.27 [‐0.52, ‐0.02] |
| 10.4 Children's sleep (mean reduction in cough impact on sleep score) | 1 | 100 | Mean Difference (Random, 95% CI) | 0.17 [‐0.04, 0.38] |
| 10.5 Parents' sleep (mean reduction in cough impact on sleep score) | 1 | 100 | Mean Difference (Random, 95% CI) | 0.03 [‐0.00, 0.06] |
| 11 Honey versus salbutamol (Day 3) Show forest plot | 1 | Mean Difference (Random, 95% CI) | Subtotals only | |
| Analysis 1.11 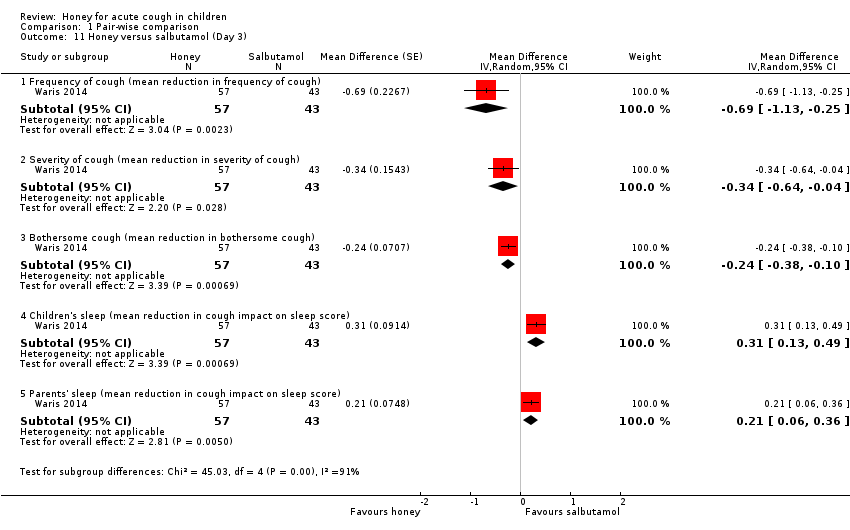 Comparison 1 Pair‐wise comparison, Outcome 11 Honey versus salbutamol (Day 3). | ||||
| 11.1 Frequency of cough (mean reduction in frequency of cough) | 1 | 100 | Mean Difference (Random, 95% CI) | ‐0.69 [‐1.13, ‐0.25] |
| 11.2 Severity of cough (mean reduction in severity of cough) | 1 | 100 | Mean Difference (Random, 95% CI) | ‐0.34 [‐0.64, ‐0.04] |
| 11.3 Bothersome cough (mean reduction in bothersome cough) | 1 | 100 | Mean Difference (Random, 95% CI) | ‐0.24 [‐0.38, ‐0.10] |
| 11.4 Children's sleep (mean reduction in cough impact on sleep score) | 1 | 100 | Mean Difference (Random, 95% CI) | 0.31 [0.13, 0.49] |
| 11.5 Parents' sleep (mean reduction in cough impact on sleep score) | 1 | 100 | Mean Difference (Random, 95% CI) | 0.21 [0.06, 0.36] |
| 12 Honey versus salbutamol (Day 4) Show forest plot | 1 | Mean Difference (Random, 95% CI) | Subtotals only | |
| Analysis 1.12  Comparison 1 Pair‐wise comparison, Outcome 12 Honey versus salbutamol (Day 4). | ||||
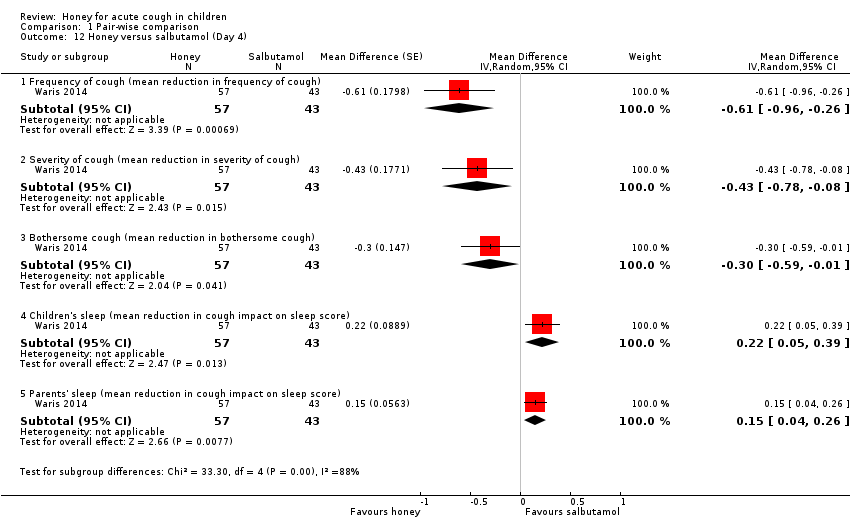
| 12.1 Frequency of cough (mean reduction in frequency of cough) | 1 | 100 | Mean Difference (Random, 95% CI) | ‐0.61 [‐0.96, ‐0.26] |
| 12.2 Severity of cough (mean reduction in severity of cough) | 1 | 100 | Mean Difference (Random, 95% CI) | ‐0.43 [‐0.78, ‐0.08] |
| 12.3 Bothersome cough (mean reduction in bothersome cough) | 1 | 100 | Mean Difference (Random, 95% CI) | ‐0.3 [‐0.59, ‐0.01] |
| 12.4 Children's sleep (mean reduction in cough impact on sleep score) | 1 | 100 | Mean Difference (Random, 95% CI) | 0.22 [0.05, 0.39] |
| 12.5 Parents' sleep (mean reduction in cough impact on sleep score) | 1 | 100 | Mean Difference (Random, 95% CI) | 0.15 [0.04, 0.26] |
| 13 Honey versus salbutamol (Day 5) Show forest plot | 1 | Mean Difference (Random, 95% CI) | Subtotals only | |
| Analysis 1.13  Comparison 1 Pair‐wise comparison, Outcome 13 Honey versus salbutamol (Day 5). | ||||
| 13.1 Cough duration (mean number of days) | 1 | 100 | Mean Difference (Random, 95% CI) | ‐0.54 [‐0.98, ‐0.10] |
| 13.2 Frequency of cough (mean reduction in frequency of cough) | 1 | 100 | Mean Difference (Random, 95% CI) | ‐0.54 [‐1.03, ‐0.05] |
| 13.3 Severity of cough (mean reduction in severity of cough) | 1 | 100 | Mean Difference (Random, 95% CI) | ‐0.41 [‐0.78, ‐0.04] |
| 13.4 Bothersome cough (mean reduction in bothersome cough) | 1 | 100 | Mean Difference (Random, 95% CI) | ‐0.27 [‐0.48, ‐0.06] |
| 13.5 Children's sleep (mean reduction in cough impact on sleep score) | 1 | 100 | Mean Difference (Random, 95% CI) | 0.15 [0.04, 0.26] |
| 13.6 Parents' sleep (mean reduction in cough impact on sleep score) | 1 | 100 | Mean Difference (Random, 95% CI) | 0.04 [0.01, 0.07] |
| Outcome or subgroup title | No. of studies | No. of participants | Statistical method | Effect size |
| 1 Cough frequency (mean reduction in frequency) Show forest plot | 4 | Mean Difference (Fixed, 95% CI) | Subtotals only | |
| Analysis 2.1  Comparison 2 Pre‐ and postintervention comparison, Outcome 1 Cough frequency (mean reduction in frequency). | ||||
| 1.1 Honey | 4 | 357 | Mean Difference (Fixed, 95% CI) | ‐1.71 [‐2.28, ‐1.13] |
| 1.2 Dextromethorphan | 2 | 74 | Mean Difference (Fixed, 95% CI) | ‐1.54 [‐2.30, ‐0.78] |
| 1.3 Diphenhydramine | 1 | 40 | Mean Difference (Fixed, 95% CI) | ‐1.73 [‐2.72, ‐0.74] |
| 1.4 Placebo | 2 | 120 | Mean Difference (Fixed, 95% CI) | ‐0.99 [‐1.79, ‐0.18] |
| 1.5 Salbutamol Day 1 | 1 | 43 | Mean Difference (Fixed, 95% CI) | ‐0.52 [‐6.28, 5.24] |
| 1.6 No treatment | 2 | 79 | Mean Difference (Fixed, 95% CI) | ‐0.98 [‐1.38, ‐0.59] |
| 1.7 Buckwheat honey | 1 | 35 | Mean Difference (Fixed, 95% CI) | ‐1.89 [‐2.96, ‐0.81] |
| 1.8 Natural honey from Kafi‐Abad (Iran) | 1 | 40 | Mean Difference (Fixed, 95% CI) | ‐2.16 [‐3.40, ‐0.92] |
| 1.9 Eucalyptus honey | 1 | 75 | Mean Difference (Fixed, 95% CI) | ‐1.77 [‐3.22, ‐0.32] |
| 1.10 Labiatae honey | 1 | 75 | Mean Difference (Fixed, 95% CI) | ‐1.82 [‐3.30, ‐0.34] |
| 1.11 Citrus honey | 1 | 75 | Mean Difference (Fixed, 95% CI) | ‐1.95 [‐3.55, ‐0.35] |
| 1.12 Salbutamol Day 5 | 1 | 43 | Mean Difference (Fixed, 95% CI) | ‐2.19 [‐3.55, ‐0.83] |
| 1.13 African honey Day 5 | 1 | 57 | Mean Difference (Fixed, 95% CI) | ‐2.65 [‐4.32, ‐0.98] |
| 1.14 Placebo Day 5 | 1 | 45 | Mean Difference (Fixed, 95% CI) | ‐1.95 [‐4.42, 0.52] |
| 2 Severity of cough (mean reduction in severity) Show forest plot | 4 | Mean Difference (Fixed, 95% CI) | Subtotals only | |
| Analysis 2.2  Comparison 2 Pre‐ and postintervention comparison, Outcome 2 Severity of cough (mean reduction in severity). | ||||
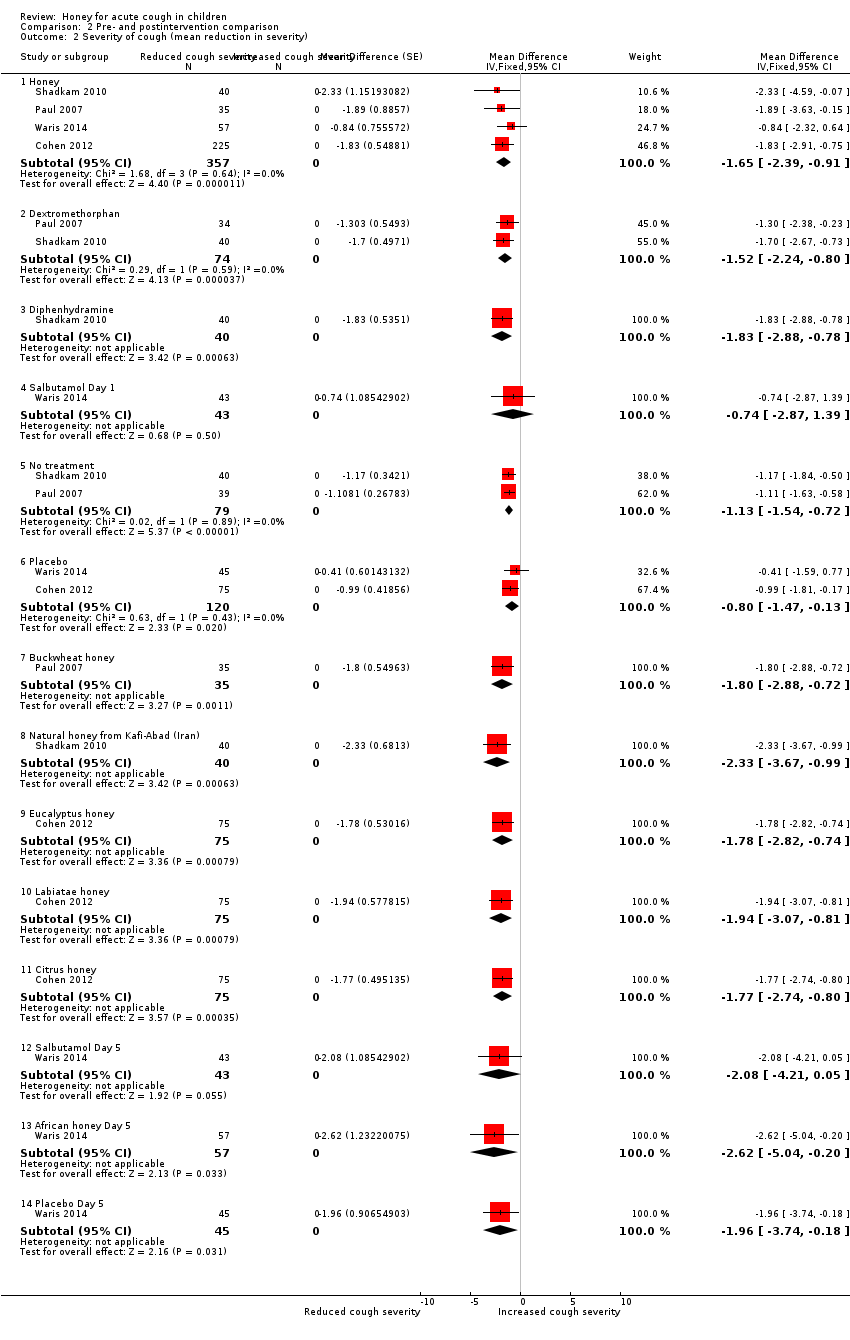
| 2.1 Honey | 4 | 357 | Mean Difference (Fixed, 95% CI) | ‐1.65 [‐2.39, ‐0.91] |
| 2.2 Dextromethorphan | 2 | 74 | Mean Difference (Fixed, 95% CI) | ‐1.52 [‐2.24, ‐0.80] |
| 2.3 Diphenhydramine | 1 | 40 | Mean Difference (Fixed, 95% CI) | ‐1.83 [‐2.88, ‐0.78] |
| 2.4 Salbutamol Day 1 | 1 | 43 | Mean Difference (Fixed, 95% CI) | ‐0.74 [‐2.87, 1.39] |
| 2.5 No treatment | 2 | 79 | Mean Difference (Fixed, 95% CI) | ‐1.13 [‐1.54, ‐0.72] |
| 2.6 Placebo | 2 | 120 | Mean Difference (Fixed, 95% CI) | ‐0.80 [‐1.47, ‐0.13] |
| 2.7 Buckwheat honey | 1 | 35 | Mean Difference (Fixed, 95% CI) | ‐1.80 [‐2.88, ‐0.72] |
| 2.8 Natural honey from Kafi‐Abad (Iran) | 1 | 40 | Mean Difference (Fixed, 95% CI) | ‐2.33 [‐3.67, ‐0.99] |
| 2.9 Eucalyptus honey | 1 | 75 | Mean Difference (Fixed, 95% CI) | ‐1.78 [‐2.82, ‐0.74] |
| 2.10 Labiatae honey | 1 | 75 | Mean Difference (Fixed, 95% CI) | ‐1.94 [‐3.07, ‐0.81] |
| 2.11 Citrus honey | 1 | 75 | Mean Difference (Fixed, 95% CI) | ‐1.77 [‐2.74, ‐0.80] |
| 2.12 Salbutamol Day 5 | 1 | 43 | Mean Difference (Fixed, 95% CI) | ‐2.08 [‐4.21, 0.05] |
| 2.13 African honey Day 5 | 1 | 57 | Mean Difference (Fixed, 95% CI) | ‐2.62 [‐5.04, ‐0.20] |
| 2.14 Placebo Day 5 | 1 | 45 | Mean Difference (Fixed, 95% CI) | ‐1.96 [‐3.74, ‐0.18] |
| 3 Bothersome cough (mean reduction in bothersome cough) Show forest plot | 3 | Mean Difference (Fixed, 95% CI) | Subtotals only | |
| Analysis 2.3  Comparison 2 Pre‐ and postintervention comparison, Outcome 3 Bothersome cough (mean reduction in bothersome cough). | ||||
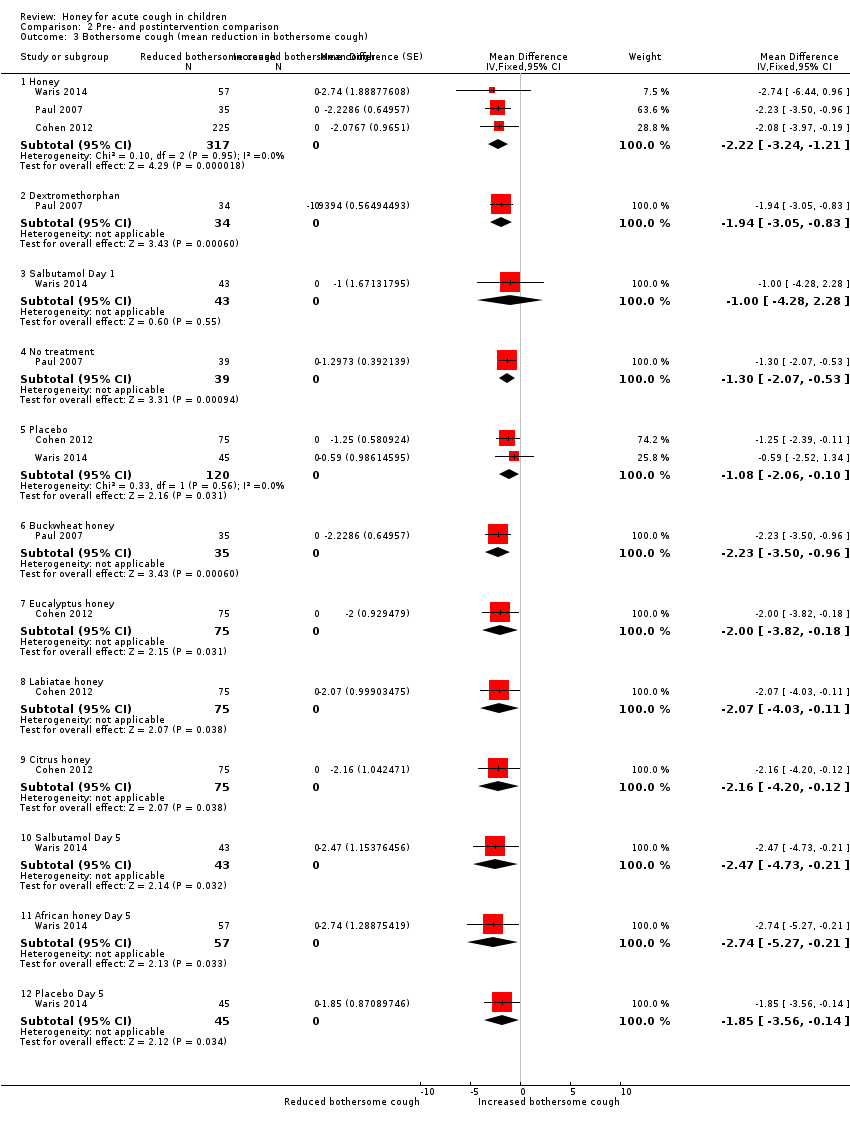
| 3.1 Honey | 3 | 317 | Mean Difference (Fixed, 95% CI) | ‐2.22 [‐3.24, ‐1.21] |
| 3.2 Dextromethorphan | 1 | 34 | Mean Difference (Fixed, 95% CI) | ‐1.94 [‐3.05, ‐0.83] |
| 3.3 Salbutamol Day 1 | 1 | 43 | Mean Difference (Fixed, 95% CI) | ‐1.0 [‐4.28, 2.28] |
| 3.4 No treatment | 1 | 39 | Mean Difference (Fixed, 95% CI) | ‐1.30 [‐2.07, ‐0.53] |
| 3.5 Placebo | 2 | 120 | Mean Difference (Fixed, 95% CI) | ‐1.08 [‐2.06, ‐0.10] |
| 3.6 Buckwheat honey | 1 | 35 | Mean Difference (Fixed, 95% CI) | ‐2.23 [‐3.50, ‐0.96] |
| 3.7 Eucalyptus honey | 1 | 75 | Mean Difference (Fixed, 95% CI) | ‐2.0 [‐3.82, ‐0.18] |
| 3.8 Labiatae honey | 1 | 75 | Mean Difference (Fixed, 95% CI) | ‐2.07 [‐4.03, ‐0.11] |
| 3.9 Citrus honey | 1 | 75 | Mean Difference (Fixed, 95% CI) | ‐2.16 [‐4.20, ‐0.12] |
| 3.10 Salbutamol Day 5 | 1 | 43 | Mean Difference (Fixed, 95% CI) | ‐2.47 [‐4.73, ‐0.21] |
| 3.11 African honey Day 5 | 1 | 57 | Mean Difference (Fixed, 95% CI) | ‐2.74 [‐5.27, ‐0.21] |
| 3.12 Placebo Day 5 | 1 | 45 | Mean Difference (Fixed, 95% CI) | ‐1.85 [‐3.56, ‐0.14] |
| 4 Children's sleep (mean reduction in cough impact on sleep score) Show forest plot | 4 | Mean Difference (Random, 95% CI) | Subtotals only | |
| Analysis 2.4 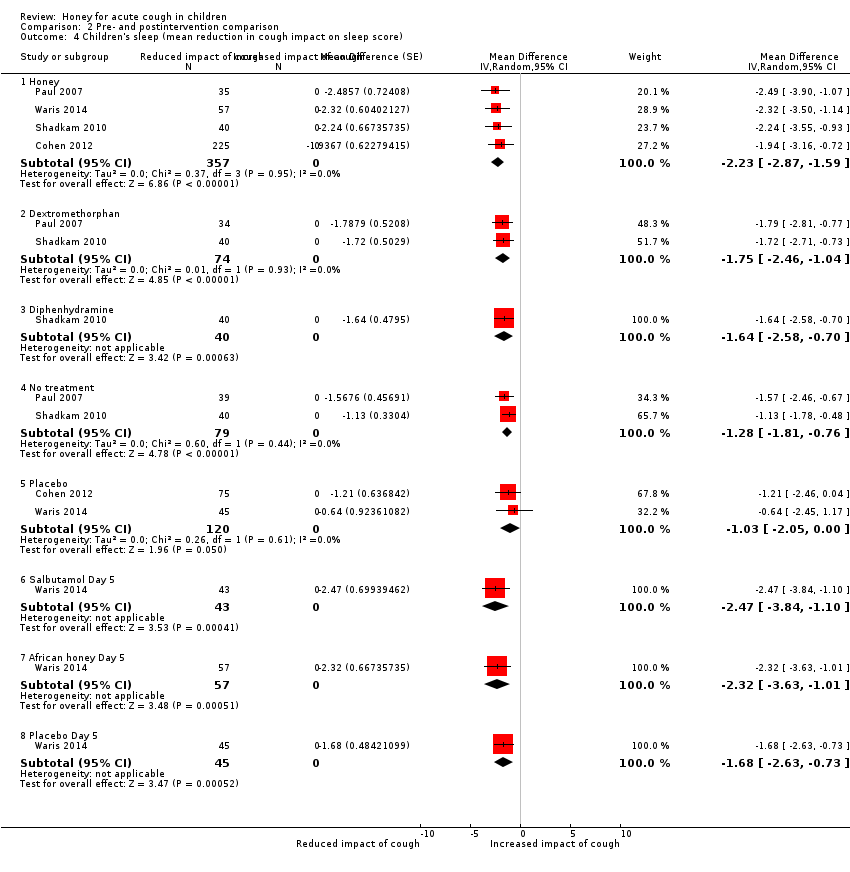 Comparison 2 Pre‐ and postintervention comparison, Outcome 4 Children's sleep (mean reduction in cough impact on sleep score). | ||||
| 4.1 Honey | 4 | 357 | Mean Difference (Random, 95% CI) | ‐2.23 [‐2.87, ‐1.59] |
| 4.2 Dextromethorphan | 2 | 74 | Mean Difference (Random, 95% CI) | ‐1.75 [‐2.46, ‐1.04] |
| 4.3 Diphenhydramine | 1 | 40 | Mean Difference (Random, 95% CI) | ‐1.64 [‐2.58, ‐0.70] |
| 4.4 No treatment | 2 | 79 | Mean Difference (Random, 95% CI) | ‐1.28 [‐1.81, ‐0.76] |
| 4.5 Placebo | 2 | 120 | Mean Difference (Random, 95% CI) | ‐1.03 [‐2.05, 0.00] |
| 4.6 Salbutamol Day 5 | 1 | 43 | Mean Difference (Random, 95% CI) | ‐2.47 [‐3.84, ‐1.10] |
| 4.7 African honey Day 5 | 1 | 57 | Mean Difference (Random, 95% CI) | ‐2.32 [‐3.63, ‐1.01] |
| 4.8 Placebo Day 5 | 1 | 45 | Mean Difference (Random, 95% CI) | ‐1.68 [‐2.63, ‐0.73] |
| 5 Parents' sleep (mean reduction in cough impact on sleep score) Show forest plot | 4 | Mean Difference (Fixed, 95% CI) | Subtotals only | |
| Analysis 2.5  Comparison 2 Pre‐ and postintervention comparison, Outcome 5 Parents' sleep (mean reduction in cough impact on sleep score). | ||||
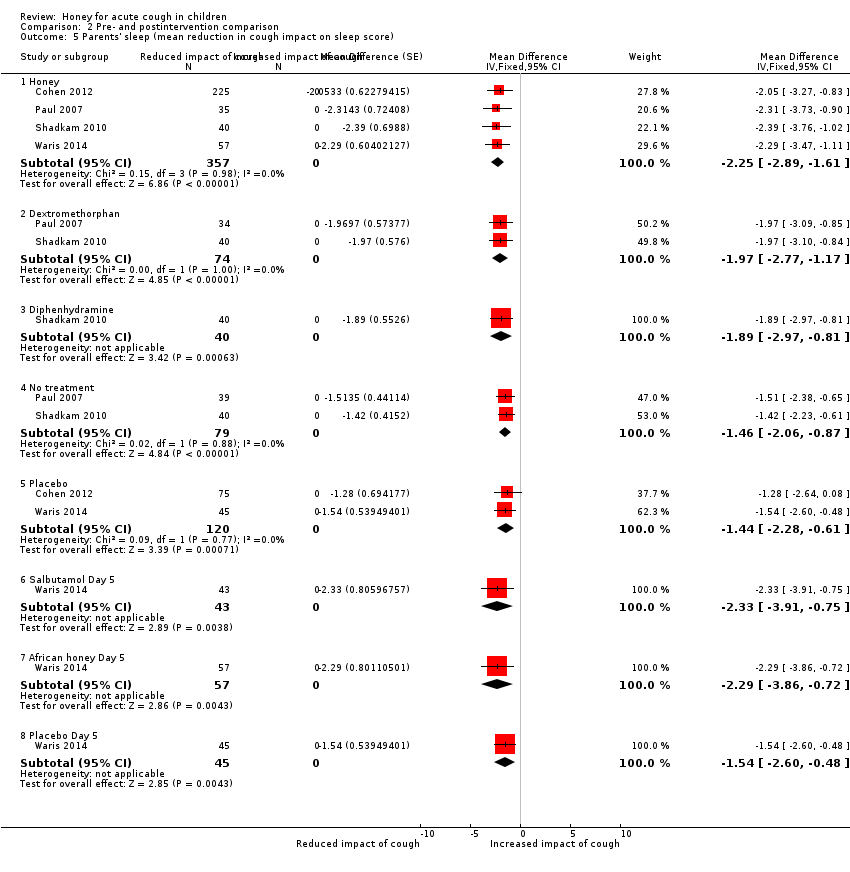
| 5.1 Honey | 4 | 357 | Mean Difference (Fixed, 95% CI) | ‐2.25 [‐2.89, ‐1.61] |
| 5.2 Dextromethorphan | 2 | 74 | Mean Difference (Fixed, 95% CI) | ‐1.97 [‐2.77, ‐1.17] |
| 5.3 Diphenhydramine | 1 | 40 | Mean Difference (Fixed, 95% CI) | ‐1.89 [‐2.97, ‐0.81] |
| 5.4 No treatment | 2 | 79 | Mean Difference (Fixed, 95% CI) | ‐1.46 [‐2.06, ‐0.87] |
| 5.5 Placebo | 2 | 120 | Mean Difference (Fixed, 95% CI) | ‐1.44 [‐2.28, ‐0.61] |
| 5.6 Salbutamol Day 5 | 1 | 43 | Mean Difference (Fixed, 95% CI) | ‐2.33 [‐3.91, ‐0.75] |
| 5.7 African honey Day 5 | 1 | 57 | Mean Difference (Fixed, 95% CI) | ‐2.29 [‐3.86, ‐0.72] |
| 5.8 Placebo Day 5 | 1 | 45 | Mean Difference (Fixed, 95% CI) | ‐1.54 [‐2.60, ‐0.48] |
| 6 Combined reduction in symptoms score Show forest plot | 3 | Mean Difference (Fixed, 95% CI) | Subtotals only | |
| Analysis 2.6  Comparison 2 Pre‐ and postintervention comparison, Outcome 6 Combined reduction in symptoms score. | ||||
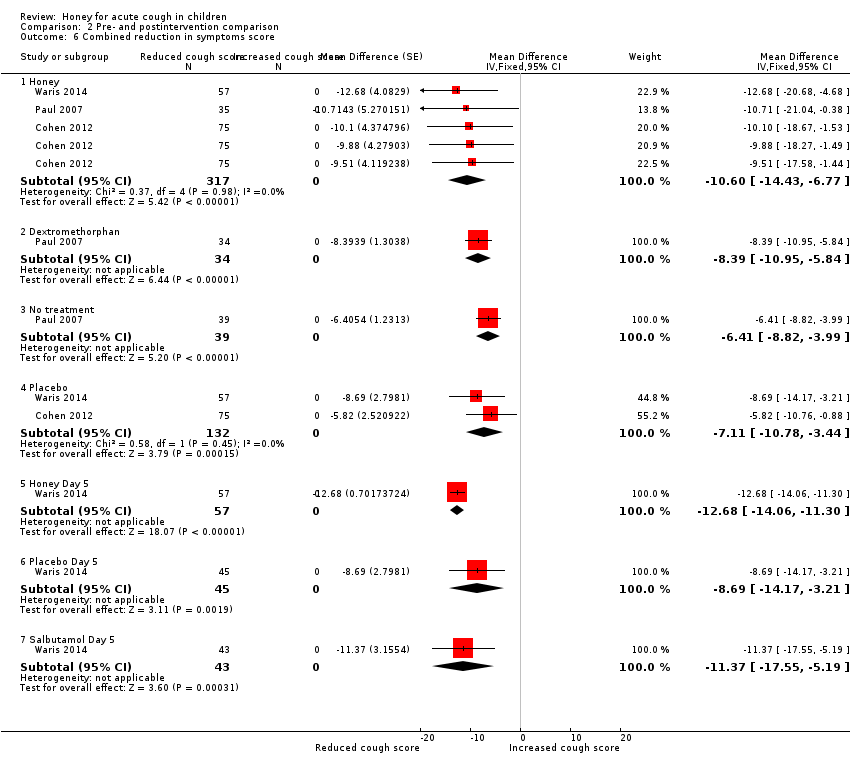
| 6.1 Honey | 3 | 317 | Mean Difference (Fixed, 95% CI) | ‐10.60 [‐14.43, ‐6.77] |
| 6.2 Dextromethorphan | 1 | 34 | Mean Difference (Fixed, 95% CI) | ‐8.39 [‐10.95, ‐5.84] |
| 6.3 No treatment | 1 | 39 | Mean Difference (Fixed, 95% CI) | ‐6.41 [‐8.82, ‐3.99] |
| 6.4 Placebo | 2 | 132 | Mean Difference (Fixed, 95% CI) | ‐7.11 [‐10.78, ‐3.44] |
| 6.5 Honey Day 5 | 1 | 57 | Mean Difference (Fixed, 95% CI) | ‐12.68 [‐14.06, ‐11.30] |
| 6.6 Placebo Day 5 | 1 | 45 | Mean Difference (Fixed, 95% CI) | ‐8.69 [‐14.17, ‐3.21] |
| 6.7 Salbutamol Day 5 | 1 | 43 | Mean Difference (Fixed, 95% CI) | ‐11.37 [‐17.55, ‐5.19] |
| Outcome or subgroup title | No. of studies | No. of participants | Statistical method | Effect size |
| 1 Honey versus dextromethorphan Show forest plot | 2 | Risk Ratio (M‐H, Fixed, 95% CI) | Subtotals only | |
| Analysis 3.1  Comparison 3 Adverse events, Outcome 1 Honey versus dextromethorphan. | ||||
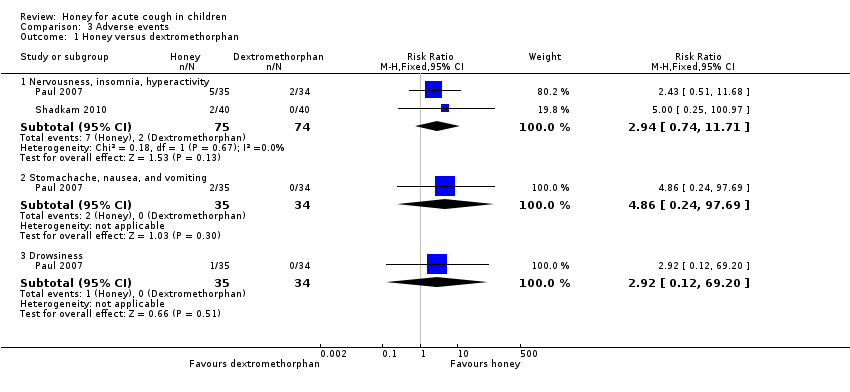
| 1.1 Nervousness, insomnia, hyperactivity | 2 | 149 | Risk Ratio (M‐H, Fixed, 95% CI) | 2.94 [0.74, 11.71] |
| 1.2 Stomachache, nausea, and vomiting | 1 | 69 | Risk Ratio (M‐H, Fixed, 95% CI) | 4.86 [0.24, 97.69] |
| 1.3 Drowsiness | 1 | 69 | Risk Ratio (M‐H, Fixed, 95% CI) | 2.92 [0.12, 69.20] |
| 2 Honey versus diphenhydramine Show forest plot | 1 | 80 | Risk Ratio (M‐H, Fixed, 95% CI) | 0.14 [0.01, 2.68] |
| Analysis 3.2  Comparison 3 Adverse events, Outcome 2 Honey versus diphenhydramine. | ||||
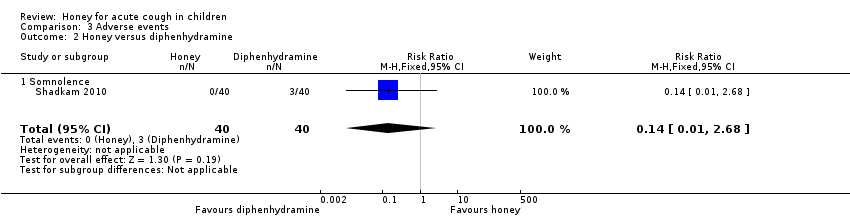
| 2.1 Somnolence | 1 | 80 | Risk Ratio (M‐H, Fixed, 95% CI) | 0.14 [0.01, 2.68] |
| 3 Honey versus placebo Show forest plot | 2 | Risk Ratio (M‐H, Fixed, 95% CI) | Subtotals only | |
| Analysis 3.3  Comparison 3 Adverse events, Outcome 3 Honey versus placebo. | ||||
| 3.1 Stomachache, nausea, and vomiting | 2 | 402 | Risk Ratio (M‐H, Fixed, 95% CI) | 1.91 [1.12, 3.24] |
| 3.2 Diarrhoea | 1 | 102 | Risk Ratio (M‐H, Fixed, 95% CI) | 0.92 [0.33, 2.55] |
| 3.3 Tachycardia | 1 | 102 | Risk Ratio (M‐H, Fixed, 95% CI) | 1.58 [0.15, 16.86] |
| 4 Honey versus salbutamol Show forest plot | 1 | Risk Ratio (M‐H, Random, 95% CI) | Subtotals only | |
| Analysis 3.4 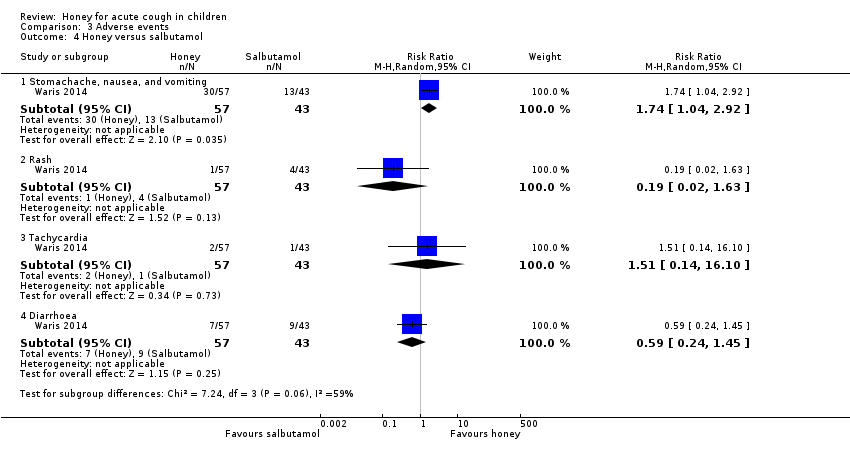 Comparison 3 Adverse events, Outcome 4 Honey versus salbutamol. | ||||
| 4.1 Stomachache, nausea, and vomiting | 1 | 100 | Risk Ratio (M‐H, Random, 95% CI) | 1.74 [1.04, 2.92] |
| 4.2 Rash | 1 | 100 | Risk Ratio (M‐H, Random, 95% CI) | 0.19 [0.02, 1.63] |
| 4.3 Tachycardia | 1 | 100 | Risk Ratio (M‐H, Random, 95% CI) | 1.51 [0.14, 16.10] |
| 4.4 Diarrhoea | 1 | 100 | Risk Ratio (M‐H, Random, 95% CI) | 0.59 [0.24, 1.45] |
| 5 Honey versus no treatment Show forest plot | 2 | 302 | Odds Ratio (M‐H, Fixed, 95% CI) | 6.99 [1.55, 31.58] |
| Analysis 3.5 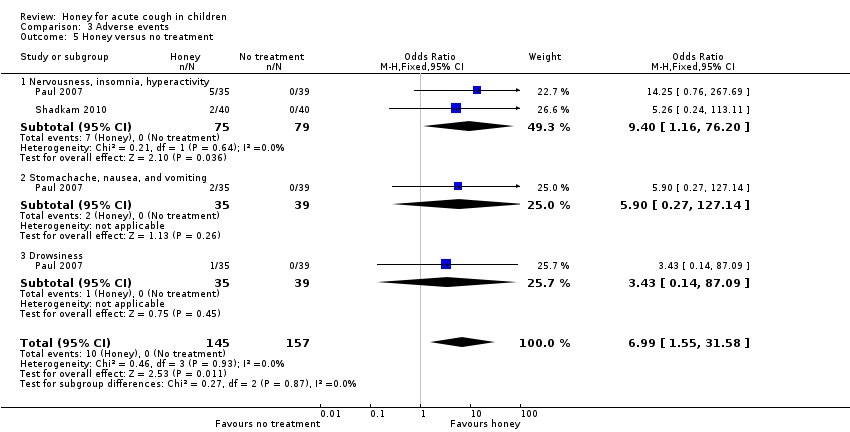 Comparison 3 Adverse events, Outcome 5 Honey versus no treatment. | ||||
| 5.1 Nervousness, insomnia, hyperactivity | 2 | 154 | Odds Ratio (M‐H, Fixed, 95% CI) | 9.40 [1.16, 76.20] |
| 5.2 Stomachache, nausea, and vomiting | 1 | 74 | Odds Ratio (M‐H, Fixed, 95% CI) | 5.90 [0.27, 127.14] |
| 5.3 Drowsiness | 1 | 74 | Odds Ratio (M‐H, Fixed, 95% CI) | 3.43 [0.14, 87.09] |
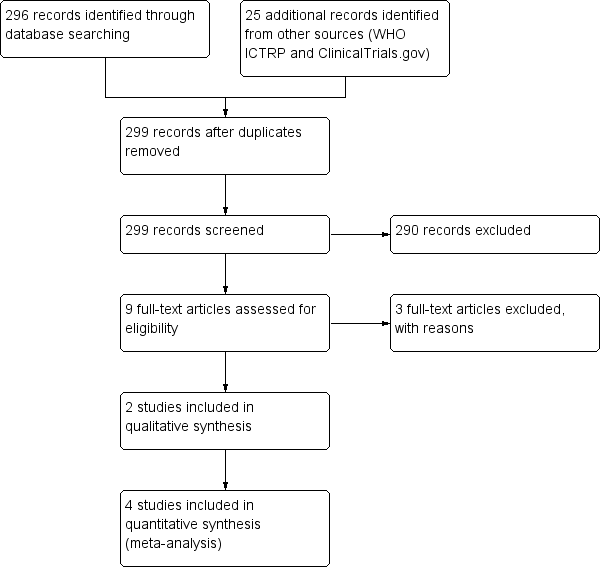
Study flow diagram (2018 update).

Risk of bias graph: review authors' judgements about each risk of bias item presented as percentages across all included studies.
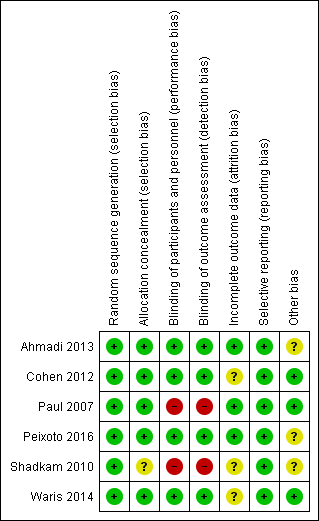
'Risk of bias' summary: review authors' judgements about each risk of bias item for each included study.
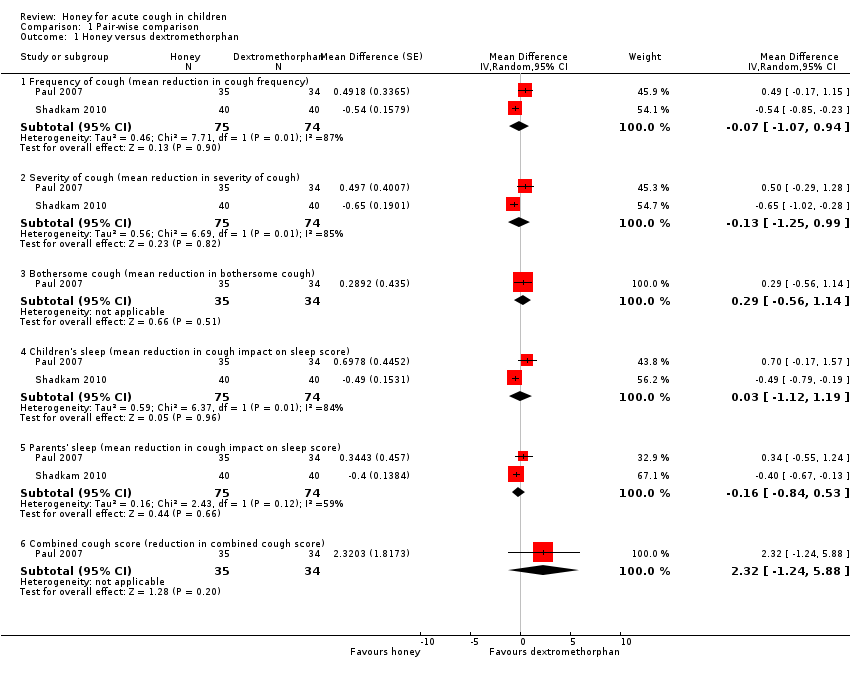
Comparison 1 Pair‐wise comparison, Outcome 1 Honey versus dextromethorphan.

Comparison 1 Pair‐wise comparison, Outcome 2 Honey versus diphenhydramine.
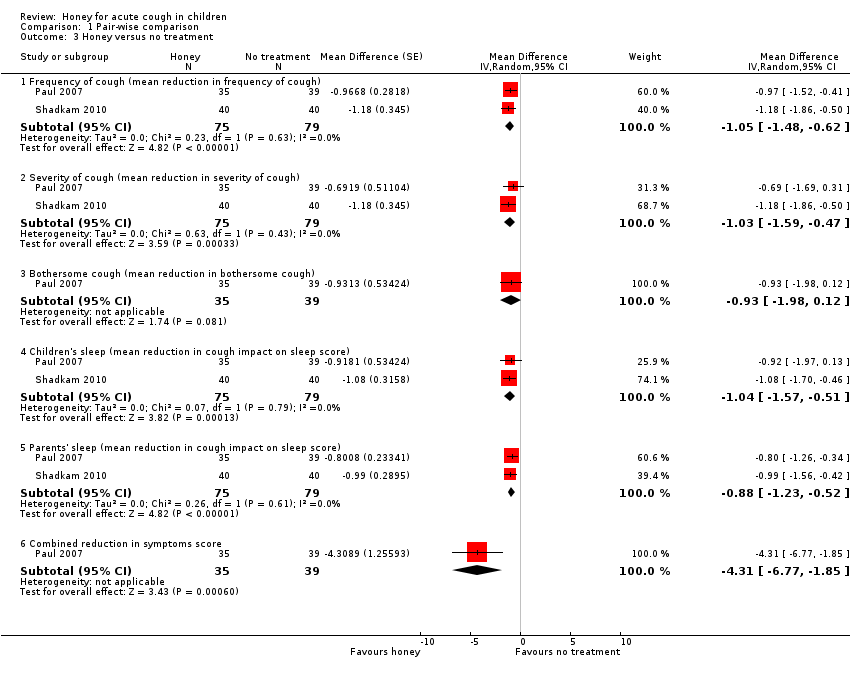
Comparison 1 Pair‐wise comparison, Outcome 3 Honey versus no treatment.
Comparison 1 Pair‐wise comparison, Outcome 4 Honey versus placebo (Day 1).
Comparison 1 Pair‐wise comparison, Outcome 5 Honey versus placebo (Day 2).
Comparison 1 Pair‐wise comparison, Outcome 6 Honey versus placebo (Day 3).

Comparison 1 Pair‐wise comparison, Outcome 7 Honey versus placebo (Day 4).
Comparison 1 Pair‐wise comparison, Outcome 8 Honey versus placebo (Day 5).

Comparison 1 Pair‐wise comparison, Outcome 9 Honey versus salbutamol (Day 1).
Comparison 1 Pair‐wise comparison, Outcome 10 Honey versus salbutamol (Day 2).

Comparison 1 Pair‐wise comparison, Outcome 11 Honey versus salbutamol (Day 3).
Comparison 1 Pair‐wise comparison, Outcome 12 Honey versus salbutamol (Day 4).

Comparison 1 Pair‐wise comparison, Outcome 13 Honey versus salbutamol (Day 5).

Comparison 2 Pre‐ and postintervention comparison, Outcome 1 Cough frequency (mean reduction in frequency).
Comparison 2 Pre‐ and postintervention comparison, Outcome 2 Severity of cough (mean reduction in severity).
Comparison 2 Pre‐ and postintervention comparison, Outcome 3 Bothersome cough (mean reduction in bothersome cough).

Comparison 2 Pre‐ and postintervention comparison, Outcome 4 Children's sleep (mean reduction in cough impact on sleep score).
Comparison 2 Pre‐ and postintervention comparison, Outcome 5 Parents' sleep (mean reduction in cough impact on sleep score).
Comparison 2 Pre‐ and postintervention comparison, Outcome 6 Combined reduction in symptoms score.
Comparison 3 Adverse events, Outcome 1 Honey versus dextromethorphan.
Comparison 3 Adverse events, Outcome 2 Honey versus diphenhydramine.

Comparison 3 Adverse events, Outcome 3 Honey versus placebo.

Comparison 3 Adverse events, Outcome 4 Honey versus salbutamol.

Comparison 3 Adverse events, Outcome 5 Honey versus no treatment.
| Honey compared to dextromethorphan for acute cough in children | ||||||
| Patient or population: acute cough in children | ||||||
| Outcomes | Anticipated absolute effects* (95% CI) | Relative effect | № of participants | Certainty of the evidence | Comments | |
| Risk with dextromethorphan | Risk with honey | |||||
| Duration of cough | ‐ | ‐ | ‐ | ‐ | ‐ | Not assessed |
| Frequency of cough1 | The mean frequency of cough (reduction in frequency of cough score) was ‐1.54. | MD 0.07 score lower | ‐ | 149 | ⊕⊕⊝⊝ | Follow‐up: mean 1 day |
| Severity of cough1 | The mean severity of cough (reduction in severity of cough score) was ‐1.52. | MD 0.13 score lower | ‐ | 149 | ⊕⊕⊝⊝ | Follow‐up: mean 1 day |
| Bothersome cough1 | The mean bothersome cough (reduction in bothersome nature of cough score) was ‐1.94. | MD 0.29 score higher | ‐ | 69 | ⊕⊕⊕⊝ | Follow‐up: mean 1 day |
| Cough impact on children's sleep1 | The mean cough impact on children's sleep (cough impact on children' sleep score) was ‐1.75. | MD 0.03 score higher | ‐ | 149 | ⊕⊕⊝⊝ | Follow‐up: mean 6 days |
| Cough impact on parents' sleep1 | The mean cough impact on parents' sleep (cough impact on parents' sleep score) was ‐1.97. | MD 0.16 score lower | ‐ | 149 | ⊕⊕⊝⊝ | Follow‐up: mean 1 day |
| Adverse events | Population | |||||
| Nervousness, insomnia, hyperactivity | 3 per 100 | 8 per 100 (2 to 32) | RR 2.94 | 149 | ⊕⊕⊝⊝ | Follow‐up: mean 1 day |
| Stomachache, nausea, and vomiting | 1 per 100 | 7 per 100 (0 to 100) | RR 4.86 | 69 | ⊕⊕⊝⊝ | |
| Drowsiness | 1 per 100 | 4 per 100 | RR 2.92 | 69 | ⊕⊕⊝⊝ | |
| *The risk in the intervention group (and its 95% confidence interval) is based on the assumed risk in the comparison group and the relative effect of the intervention (and its 95% CI). | ||||||
| GRADE Working Group grades of evidence | ||||||
| 1Assessed on a 7‐point Likert scale from 0 to 6; lower score is better. | ||||||
| Honey compared to diphenhydramine for acute cough in children | ||||||
| Patient or population: acute cough in children | ||||||
| Outcomes | Anticipated absolute effects* (95% CI) | Relative effect | № of participants | Certainty of the evidence | Comments | |
| Risk with diphenhydramine | Risk with honey | |||||
| Cough duration | ‐ | ‐ | ‐ | ‐ | ‐ | Not assessed |
| Frequency of cough1 | The mean frequency of cough (reduction in cough frequency score) was ‐1.73. | MD 0.57 lower | ‐ | 80 | ⊕⊕⊝⊝ | Follow‐up: mean 1 day |
| Severity of cough1 | The mean severity of cough (reduction in cough severity score) was ‐1.83. | MD 0.6 lower | ‐ | 80 | ⊕⊕⊝⊝ | Follow‐up: mean 1 day |
| Cough impact on children's sleep1 | The mean cough impact on children's sleep (cough impact on children' sleep score) was ‐1.64. | MD 0.55 score lower | ‐ | 80 | ⊕⊕⊝⊝ | Follow‐up: mean 6 days |
| Cough impact on parents' sleep1 | The mean cough impact on parents' sleep (cough impact on parents' sleep score) was ‐1.89. | MD 0.48 lower | ‐ | 80 | ⊕⊕⊝⊝ | Follow‐up: mean 1 day |
| Adverse event: Somnolence | Population | 1 per 100 | RR 0.14 | 80 | ⊕⊕⊝⊝ | Follow‐up: mean 1 day |
| 8 per 100 | ||||||
| *The risk in the intervention group (and its 95% confidence interval) is based on the assumed risk in the comparison group and the relative effect of the intervention (and its 95% CI). | ||||||
| GRADE Working Group grades of evidence | ||||||
| 1Assessed on a 7‐point Likert scale from 0 to 6; lower score is better. | ||||||
| Honey compared to no treatment for acute cough in children | ||||||
| Patient or population: acute cough in children | ||||||
| Outcomes | Anticipated absolute effects* (95% CI) | Relative effect | № of participants | Certainty of the evidence | Comments | |
| Risk with no treatment | Risk with honey | |||||
| Cough duration | ‐ | ‐ | ‐ | ‐ | ‐ | Not assessed |
| Frequency of cough1 | The mean frequency of cough (reduction in cough frequency score) was ‐0.98. | MD 1.05 lower | ‐ | 154 | ⊕⊕⊕⊝ | Follow‐up: mean 1 day |
| Severity of cough1 assessed with: 7‐point Likert scale | The mean severity of cough (reduction in severity of cough score) was ‐1.13. | MD 1.03 score lower | ‐ | 154 | ⊕⊕⊕⊝ | Follow‐up: mean 1 day |
| Bothersome cough1 | The mean bothersome cough (reduction in bothersome nature of cough score) was ‐1.30. | MD 0.93 score lower | ‐ | 74 | ⊕⊕⊝⊝ | Follow‐up: mean 1 day |
| Cough impact on children's sleep1 | The mean cough impact on children's sleep (cough impact on children' sleep score) was ‐1.28. | MD 1.04 score lower | ‐ | 154 | ⊕⊕⊕⊝ | Follow‐up: mean 6 days |
| Cough impact on parents' sleep1 assessed with: 7‐point Likert scale | The mean cough impact on parents' sleep (cough impact on parents' sleep score) was ‐1.46. | MD 0.88 score lower | ‐ | 154 | ⊕⊕⊕⊝ | Follow‐up: mean 1 day |
| Adverse events | Population | |||||
| Nervousness, insomnia, hyperactivity | 1 per 100 | 6 per 100 | RR 9.40 (1.16 to 76.20) | 154 | ⊕⊕⊝⊝ | Follow‐up: mean 1 day |
| Stomachache, nausea, and vomiting | 1 per 100 | 7 per 100 | RR 5.90 (0.27 to 127.14) | 74 | ⊕⊕⊝⊝ | |
| Drowsiness | 1 per 100 | 4 per 100 | RR 3.43 (0.14 to 87.09) | 74 | ⊕⊕⊝⊝ | |
| *The risk in the intervention group (and its 95% confidence interval) is based on the assumed risk in the comparison group and the relative effect of the intervention (and its 95% CI). | ||||||
| GRADE Working Group grades of evidence | ||||||
| 1Assessed on a 7‐point Likert scale from 0 to 6; lower score is better. | ||||||
| Honey compared to placebo for acute cough in children | ||||||
| Patient or population: acute cough in children | ||||||
| Outcomes | Anticipated absolute effects* (95% CI) | Relative effect | № of participants | Certainty of the evidence | Comments | |
| Risk with placebo | Risk with honey | |||||
| Day 1 | ||||||
| Frequency of cough1 | The mean frequency of cough (reduction in cough frequency score) was ‐0.99. | MD 1.62 score lower | ‐ | 402 | ⊕⊕⊕⊝ | Follow‐up: mean 1 day |
| Severity of cough1 | The mean severity of cough (reduction in severity of cough score) was ‐0.80. | MD 1.07 score lower | ‐ | 402 | ⊕⊕⊕⊝ | |
| Bothersome cough (mean improvement score)1 | The mean bothersome cough (reduction in bothersome nature of cough) was ‐1.08. | MD 1.4 score lower | ‐ | 402 | ⊕⊕⊕⊝ | |
| Cough impact on children's sleep1 | The mean cough impact on children's sleep (cough impact on children' sleep score) was ‐1.03. | MD 1.21 score lower | ‐ | 402 | ⊕⊕⊕⊝ | Follow‐up: mean 6 days |
| Cough impact on parents' sleep1 | The mean cough impact on parents' sleep (cough impact on parents' sleep score) was ‐1.44. | MD 1.29 score lower | ‐ | 402 | ⊕⊕⊕⊝ | Follow‐up: mean 1 day |
| Day 3 | ||||||
| Frequency of cough1 | The mean frequency of cough (reduction in frequency of cough score) was ‐0.9. | MD 1.13 score lower | ‐ | 102 | ⊕⊕⊕⊝ | Follow‐up: mean 6 days |
| Severity of cough1 | The mean severity of cough (reduction in severity of cough score) was ‐1.08. | MD 0.85 score lower | ‐ | 102 | ⊕⊕⊕⊝ | |
| Bothersome cough1 | The mean bothersome cough (reduction in bothersome nature of cough score) was ‐0.99. | MD 1.33 score lower | ‐ | 102 | ⊕⊕⊕⊝ | |
| Cough impact on children's sleep1 | The mean cough impact on children's sleep (cough impact on children's sleep score) was ‐0.46. | MD 0.93 score lower | ‐ | 102 | ⊕⊕⊕⊝ | |
| Cough impact on parents' sleep3 | The mean cough impact on parents' sleep (cough impact on parents' sleep score) was ‐1.04. | MD 0.88 score lower | ‐ | 102 | ⊕⊕⊕⊝ | |
| Day 5 | ||||||
| Cough duration | The mean cough duration was 5.18 days. | MD 0.72 days lower | ‐ | 102 | ⊕⊕⊕⊝ | Follow‐up: mean 6 days; assessed with: 7‐point Likert scale |
| Frequency of cough1 | The mean frequency of cough (reduction in frequency of cough score) was ‐1.95. | MD 0.48 score lower | ‐ | 102 | ⊕⊕⊕⊝ | |
| Severity of cough1 | The mean severity of cough (reduction in severity of cough score) was ‐1.96. | MD 0.43 score lower | ‐ | 102 | ⊕⊕⊕⊝ | |
| Bothersome cough1 | The mean bothersome cough (reduction in bothersome nature of cough score) was ‐1.85. | MD 0.51 score lower | ‐ | 102 | ⊕⊕⊕⊝ | |
| Cough impact on children's sleep1 | The mean cough impact on children's sleep (cough impact on children' sleep score) was ‐1.68. | MD 0.55 score lower | ‐ | 102 | ⊕⊕⊕⊝ | |
| Cough impact on parents' sleep | The mean cough impact on parents' sleep (cough impact on parents' sleep score) was ‐1.54. | MD 0.57 score lower | ‐ | 102 | ⊕⊕⊕⊝ | |
| Adverse events | Population | |||||
| Stomachache, nausea, and vomiting | 11 per 100 | 21 per 100 | RR 1.91 | 402 | ⊕⊕⊕⊝ | Follow‐up: mean 6 days |
| Diarrhoea | 13 per 100 | 12 per 100 | RR 0.92 | 102 | ⊕⊕⊝⊝ | |
| Tachycardia | 2 per 100 | 4 per 100 | RR 1.58 | 102 | ⊕⊕⊝⊝ | |
| *The risk in the intervention group (and its 95% confidence interval) is based on the assumed risk in the comparison group and the relative effect of the intervention (and its 95% CI). | ||||||
| GRADE Working Group grades of evidence | ||||||
| 1Assessed on a 7‐point Likert scale from 0 to 6; lower score is better. | ||||||
| Honey compared to salbutamol for acute cough in children | ||||||
| Patient or population: acute cough in children | ||||||
| Outcomes | Anticipated absolute effects* (95% CI) | Relative effect | № of participants | Certainty of the evidence | Comments | |
| Risk with salbutamol | Risk with honey | |||||
| Day 1 | ||||||
| Frequency of cough (mean improvement score)1 | The mean frequency of cough (reduction in frequency of cough score) was ‐0.52. | MD 0.26 lower | ‐ | 100 | ⊕⊕⊕⊝ | Follow‐up: mean 6 days |
| Severity of cough (mean improvement score)1 | The mean severity of cough (reduction in severity of cough score) was ‐0.74. | MD 0.1 lower | ‐ | 100 | ⊕⊕⊕⊝ | |
| Bothersome cough (mean improvement score)1 | The mean bothersome cough (reduction in bothersome nature of cough score) was ‐1.00. | MD 0.21 lower | ‐ | 100 | ⊕⊕⊕⊝ | |
| Cough impact on children's sleep1 | The mean cough impact on children's sleep (cough impact on children' sleep score) was ‐1.24. | MD 0.09 higher | ‐ | 100 | ⊕⊕⊕⊝ | |
| Cough impact on parents' sleep1 | The mean cough impact on parents' sleep (cough impact on parents' sleep score) was ‐1.22. | MD 0.05 higher | ‐ | 100 | ⊕⊕⊕⊝ | |
| Day 3 | ||||||
| Frequency of cough1 | The mean frequency of cough (reduction in frequency of cough score) was ‐1.34. | MD 0.69 lower | ‐ | 100 | ⊕⊕⊕⊝ | Follow‐up: mean 4 days |
| Severity of cough1 | The mean severity of cough (reduction in severity of cough score) was ‐1.59. | MD 0.34 lower | ‐ | 100 | ⊕⊕⊕⊝ | |
| Bothersome cough1 | The mean bothersome cough (reduction in bothersome nature of cough score) was ‐2.08. | MD 0.24 lower | ‐ | 100 | ⊕⊕⊕⊝ | |
| Cough impact on children's sleep1 | The mean cough impact on children's sleep (cough impact on children' sleep score) was ‐2.25. | MD 0.31 higher | ‐ | 100 | ⊕⊕⊕⊝ | Follow‐up: mean 6 days |
| Cough impact on parents' sleep1 | The mean cough impact on parents' sleep (cough impact on parents' sleep score) was ‐2.13. | MD 0.21 higher | ‐ | 100 | ⊕⊕⊕⊝ | Follow‐up: mean 4 days |
| Day 5 | ||||||
| Cough duration | The mean cough duration was 5 days. | MD 0.54 days lower | ‐ | 100 | ⊕⊕⊕⊝ | Follow‐up: mean 6 days |
| Frequency of cough (mean improvement score)1 | The mean frequency of cough (reduction in frequency of cough score) was ‐2.19. | MD 0.54 lower | ‐ | 100 | ⊕⊕⊕⊝ | |
| Severity of cough (mean improvement score)1 | The mean severity of cough (reduction in severity of cough score) was ‐2.08. | MD 0.41 lower | ‐ | 100 | ⊕⊕⊕⊝ | |
| Bothersome cough (mean improvement score)1 | The mean bothersome cough (reduction in bothersome nature of cough score) was ‐2.47. | MD 0.27 lower | ‐ | 100 | ⊕⊕⊕⊝ | |
| Cough impact on children's sleep1 | The mean cough impact on children's sleep (cough impact on children's sleep score) was ‐2.47. | MD 0.15 higher | ‐ | 100 | ⊕⊕⊕⊝ | |
| Cough impact on parents' sleep1 | The mean cough impact on parents' sleep (cough impact on parents' sleep score) was ‐2.33. | MD 0.04 higher | ‐ | 100 | ⊕⊕⊕⊝ | |
| Adverse events | Population | |||||
| Stomachache, nausea, and vomiting | 30 per 100 | 53 per 100 | RR 1.74 | 100 | ⊕⊕⊕⊝ | Follow‐up: mean 6 days |
| Rash | 9 per 100 | 2 per 100 | RR 0.19 | 100 | ⊕⊕⊕⊝ | |
| Tachycardia | 2 per 100 | 4 per 100 | RR 1.51 (0.14 to 16.10) | 100 | ⊕⊕⊝⊝ | |
| Diarrhoea | 21 per 100 | 12 per 100 | RR 0.59 | 100 | ⊕⊕⊕⊝ | |
| *The risk in the intervention group (and its 95% confidence interval) is based on the assumed risk in the comparison group and the relative effect of the intervention (and its 95% CI). | ||||||
| GRADE Working Group grades of evidence | ||||||
| 1Assessed on a 7‐point Likert scale from 0 to 6; lower score is better. | ||||||
| Study ID | Cough | Honey (N = 29) | Bromelin (N = 31) | P value | Certainty of the evidence |
| Frequency of cough1 | |||||
| Before, median (P25 to P75) After, median (P25 to P75) Mean ± SD | 3 (2 to 4) 1 (1 to 1) 1.76 ± 0.87 | 3 (2 to 3) 1 (1 to 1) 1.71 ± 0.78 | 0.832 0.943 | ⊕⊕⊕⊝ | |
| Severity of cough1 | |||||
| Mean ± SD assessed with: unvalidated 5‐point cough scale from 0 to 4 | ‐0.86 ± 0.45 | ‐0.97 ± 0.62 | 0.322 0.223 | ⊕⊕⊕⊝ | |
| Honey (N = 63) | Diphenhydramine (N = 63) | ||||
| Proportion of children with reduction in frequency and severity of daytime cough5 | 84.1% (N = 53) | 58.7% (N = 37) | "< 0.02" | ⊕⊕⊕⊝ | |
| Proportion of children with reduction in frequency and severity of nighttime cough5 | 79.4% (N = 50) | 58.7% (N = 37) | "< 0.02" | ⊕⊕⊕⊝ | |
| SD: standard deviation 1Assessed on an unvalidated 5‐point cough scale from 0 to 4; lower score is better. | |||||
| Outcome or subgroup title | No. of studies | No. of participants | Statistical method | Effect size |
| 1 Honey versus dextromethorphan Show forest plot | 2 | Mean Difference (Random, 95% CI) | Subtotals only | |
| 1.1 Frequency of cough (mean reduction in cough frequency) | 2 | 149 | Mean Difference (Random, 95% CI) | ‐0.07 [‐1.07, 0.94] |
| 1.2 Severity of cough (mean reduction in severity of cough) | 2 | 149 | Mean Difference (Random, 95% CI) | ‐0.13 [‐1.25, 0.99] |
| 1.3 Bothersome cough (mean reduction in bothersome cough) | 1 | 69 | Mean Difference (Random, 95% CI) | 0.29 [‐0.56, 1.14] |
| 1.4 Children's sleep (mean reduction in cough impact on sleep score) | 2 | 149 | Mean Difference (Random, 95% CI) | 0.03 [‐1.12, 1.19] |
| 1.5 Parents' sleep (mean reduction in cough impact on sleep score) | 2 | 149 | Mean Difference (Random, 95% CI) | ‐0.16 [‐0.84, 0.53] |
| 1.6 Combined cough score (reduction in combined cough score) | 1 | 69 | Mean Difference (Random, 95% CI) | 2.32 [‐1.24, 5.88] |
| 2 Honey versus diphenhydramine Show forest plot | 1 | Mean Difference (Random, 95% CI) | Subtotals only | |
| 2.1 Frequency of cough (mean reduction in cough frequency) | 1 | 80 | Mean Difference (Random, 95% CI) | ‐0.57 [‐0.90, ‐0.24] |
| 2.2 Severity of cough (mean reduction in severity of cough) | 1 | 80 | Mean Difference (Random, 95% CI) | ‐0.6 [‐0.94, ‐0.26] |
| 2.3 Children's sleep (mean reduction in cough impact on sleep score) | 1 | 80 | Mean Difference (Random, 95% CI) | ‐0.55 [‐0.87, ‐0.23] |
| 2.4 Parents' sleep (mean reduction in cough impact on sleep score) | 1 | 80 | Mean Difference (Random, 95% CI) | ‐0.48 [‐0.76, ‐0.20] |
| 3 Honey versus no treatment Show forest plot | 2 | Mean Difference (Random, 95% CI) | Subtotals only | |
| 3.1 Frequency of cough (mean reduction in frequency of cough) | 2 | 154 | Mean Difference (Random, 95% CI) | ‐1.05 [‐1.48, ‐0.62] |
| 3.2 Severity of cough (mean reduction in severity of cough) | 2 | 154 | Mean Difference (Random, 95% CI) | ‐1.03 [‐1.59, ‐0.47] |
| 3.3 Bothersome cough (mean reduction in bothersome cough) | 1 | 74 | Mean Difference (Random, 95% CI) | ‐0.93 [‐1.98, 0.12] |
| 3.4 Children's sleep (mean reduction in cough impact on sleep score) | 2 | 154 | Mean Difference (Random, 95% CI) | ‐1.04 [‐1.57, ‐0.51] |
| 3.5 Parents' sleep (mean reduction in cough impact on sleep score) | 2 | 154 | Mean Difference (Random, 95% CI) | ‐0.88 [‐1.23, ‐0.52] |
| 3.6 Combined reduction in symptoms score | 1 | 74 | Mean Difference (Random, 95% CI) | ‐4.31 [‐6.77, ‐1.85] |
| 4 Honey versus placebo (Day 1) Show forest plot | 2 | Mean Difference (Random, 95% CI) | Subtotals only | |
| 4.1 Frequency of cough (mean reduction in frequency of cough) | 2 | 402 | Mean Difference (Random, 95% CI) | ‐1.62 [‐3.02, ‐0.22] |
| 4.2 Severity of cough (mean reduction in severity of cough) | 2 | 402 | Mean Difference (Random, 95% CI) | ‐1.07 [‐2.43, 0.30] |
| 4.3 Bothersome cough (mean reduction in bothersome cough) | 2 | 402 | Mean Difference (Random, 95% CI) | ‐1.40 [‐2.82, 0.03] |
| 4.4 Children's sleep (mean reduction in cough impact on sleep score) | 2 | 402 | Mean Difference (Random, 95% CI) | ‐1.21 [‐2.61, 0.19] |
| 4.5 Parents' sleep (mean reduction in cough impact on sleep score) | 2 | 402 | Mean Difference (Random, 95% CI) | ‐1.29 [‐2.71, 0.13] |
| 5 Honey versus placebo (Day 2) Show forest plot | 1 | Mean Difference (Random, 95% CI) | Subtotals only | |
| 5.1 Frequency of cough (mean reduction in frequency of cough) | 1 | 102 | Mean Difference (Random, 95% CI) | ‐0.71 [‐1.22, ‐0.20] |
| 5.2 Severity of cough (mean reduction in severity of cough) | 1 | 102 | Mean Difference (Random, 95% CI) | ‐0.63 [‐1.36, 0.10] |
| 5.3 Bothersome cough (mean reduction in bothersome cough) | 1 | 102 | Mean Difference (Random, 95% CI) | ‐1.11 [‐1.79, ‐0.43] |
| 5.4 Children's sleep (mean reduction in cough impact on sleep score) | 1 | 102 | Mean Difference (Random, 95% CI) | ‐0.69 [‐1.43, 0.05] |
| 5.5 Parents' sleep (mean reduction in cough impact on sleep score) | 1 | 102 | Mean Difference (Random, 95% CI) | ‐0.87 [‐1.59, ‐0.15] |
| 6 Honey versus placebo (Day 3) Show forest plot | 1 | Mean Difference (Random, 95% CI) | Subtotals only | |
| 6.1 Frequency of cough (mean reduction in frequency of cough) | 1 | 102 | Mean Difference (Random, 95% CI) | ‐1.13 [‐1.71, ‐0.55] |
| 6.2 Severity of cough (mean reduction in severity of cough) | 1 | 102 | Mean Difference (Random, 95% CI) | ‐0.85 [‐1.41, ‐0.29] |
| 6.3 Bothersome cough (mean reduction in bothersome cough) | 1 | 102 | Mean Difference (Random, 95% CI) | ‐1.33 [‐1.87, ‐0.79] |
| 6.4 Children's sleep (mean reduction in cough impact on sleep score) | 1 | 102 | Mean Difference (Random, 95% CI) | ‐0.93 [‐1.42, ‐0.44] |
| 6.5 Parents' sleep (mean reduction in cough impact on sleep score) | 1 | 102 | Mean Difference (Random, 95% CI) | ‐0.88 [‐1.38, ‐0.38] |
| 7 Honey versus placebo (Day 4) Show forest plot | 1 | Mean Difference (Random, 95% CI) | Subtotals only | |
| 7.1 Frequency of cough (mean reduction in frequency of cough) | 1 | 102 | Mean Difference (Random, 95% CI) | ‐1.16 [‐1.83, ‐0.49] |
| 7.2 Severity of cough (mean reduction in severity of cough) | 1 | 102 | Mean Difference (Random, 95% CI) | ‐0.88 [‐1.59, ‐0.17] |
| 7.3 Bothersome cough (mean reduction in bothersome cough) | 1 | 102 | Mean Difference (Random, 95% CI) | ‐0.90 [‐1.76, ‐0.04] |
| 7.4 Children's sleep (mean reduction in cough impact on sleep score) | 1 | 102 | Mean Difference (Random, 95% CI) | ‐0.7 [‐1.25, ‐0.15] |
| 7.5 Parents' sleep (mean reduction in cough impact on sleep score) | 1 | 102 | Mean Difference (Random, 95% CI) | ‐0.90 [‐1.51, ‐0.29] |
| 8 Honey versus placebo (Day 5) Show forest plot | 1 | Mean Difference (Random, 95% CI) | Subtotals only | |
| 8.1 Cough duration (mean number of days) | 1 | 102 | Mean Difference (Random, 95% CI) | ‐0.72 [‐1.31, ‐0.13] |
| 8.2 Frequency of cough (mean reduction in frequency of cough) | 1 | 102 | Mean Difference (Random, 95% CI) | ‐0.48 [‐2.95, 1.99] |
| 8.3 Severity of cough (mean reduction in severity of cough) | 1 | 102 | Mean Difference (Random, 95% CI) | ‐0.43 [‐2.21, 1.35] |
| 8.4 Bothersome cough (mean reduction in bothersome cough) | 1 | 102 | Mean Difference (Random, 95% CI) | ‐0.51 [‐3.01, 1.99] |
| 8.5 Children's sleep (mean reduction in cough impact on sleep score) | 1 | 102 | Mean Difference (Random, 95% CI) | ‐0.55 [‐1.79, 0.69] |
| 8.6 Parents' sleep (mean reduction in cough impact on sleep score) | 1 | 102 | Mean Difference (Random, 95% CI) | ‐0.57 [‐1.59, 0.45] |
| 9 Honey versus salbutamol (Day 1) Show forest plot | 1 | Mean Difference (Random, 95% CI) | Subtotals only | |
| 9.1 Frequency of cough (mean reduction in frequency of cough) | 1 | 100 | Mean Difference (Random, 95% CI) | ‐0.26 [‐3.14, 2.62] |
| 9.2 Severity of cough (mean reduction in severity of cough) | 1 | 100 | Mean Difference (Random, 95% CI) | ‐0.1 [‐0.39, 0.19] |
| 9.3 Bothersome cough (mean reduction in bothersome cough) | 1 | 100 | Mean Difference (Random, 95% CI) | ‐0.21 [‐0.90, 0.48] |
| 9.4 Children's sleep (mean reduction in cough impact on sleep score) | 1 | 100 | Mean Difference (Random, 95% CI) | 0.09 [‐0.05, 0.23] |
| 9.5 Parents' sleep (mean reduction in cough impact on sleep score) | 1 | 100 | Mean Difference (Random, 95% CI) | 0.05 [‐0.03, 0.13] |
| 10 Honey versus salbutamol (Day 2) Show forest plot | 1 | Mean Difference (Random, 95% CI) | Subtotals only | |
| 10.1 Frequency of cough (mean reduction in frequency of cough) | 1 | 100 | Mean Difference (Random, 95% CI) | ‐0.67 [‐1.35, 0.01] |
| 10.2 Severity of cough (mean reduction in severity of cough) | 1 | 100 | Mean Difference (Random, 95% CI) | ‐0.42 [‐1.16, 0.32] |
| 10.3 Bothersome cough (mean reduction in bothersome cough) | 1 | 100 | Mean Difference (Random, 95% CI) | ‐0.27 [‐0.52, ‐0.02] |
| 10.4 Children's sleep (mean reduction in cough impact on sleep score) | 1 | 100 | Mean Difference (Random, 95% CI) | 0.17 [‐0.04, 0.38] |
| 10.5 Parents' sleep (mean reduction in cough impact on sleep score) | 1 | 100 | Mean Difference (Random, 95% CI) | 0.03 [‐0.00, 0.06] |
| 11 Honey versus salbutamol (Day 3) Show forest plot | 1 | Mean Difference (Random, 95% CI) | Subtotals only | |
| 11.1 Frequency of cough (mean reduction in frequency of cough) | 1 | 100 | Mean Difference (Random, 95% CI) | ‐0.69 [‐1.13, ‐0.25] |
| 11.2 Severity of cough (mean reduction in severity of cough) | 1 | 100 | Mean Difference (Random, 95% CI) | ‐0.34 [‐0.64, ‐0.04] |
| 11.3 Bothersome cough (mean reduction in bothersome cough) | 1 | 100 | Mean Difference (Random, 95% CI) | ‐0.24 [‐0.38, ‐0.10] |
| 11.4 Children's sleep (mean reduction in cough impact on sleep score) | 1 | 100 | Mean Difference (Random, 95% CI) | 0.31 [0.13, 0.49] |
| 11.5 Parents' sleep (mean reduction in cough impact on sleep score) | 1 | 100 | Mean Difference (Random, 95% CI) | 0.21 [0.06, 0.36] |
| 12 Honey versus salbutamol (Day 4) Show forest plot | 1 | Mean Difference (Random, 95% CI) | Subtotals only | |
| 12.1 Frequency of cough (mean reduction in frequency of cough) | 1 | 100 | Mean Difference (Random, 95% CI) | ‐0.61 [‐0.96, ‐0.26] |
| 12.2 Severity of cough (mean reduction in severity of cough) | 1 | 100 | Mean Difference (Random, 95% CI) | ‐0.43 [‐0.78, ‐0.08] |
| 12.3 Bothersome cough (mean reduction in bothersome cough) | 1 | 100 | Mean Difference (Random, 95% CI) | ‐0.3 [‐0.59, ‐0.01] |
| 12.4 Children's sleep (mean reduction in cough impact on sleep score) | 1 | 100 | Mean Difference (Random, 95% CI) | 0.22 [0.05, 0.39] |
| 12.5 Parents' sleep (mean reduction in cough impact on sleep score) | 1 | 100 | Mean Difference (Random, 95% CI) | 0.15 [0.04, 0.26] |
| 13 Honey versus salbutamol (Day 5) Show forest plot | 1 | Mean Difference (Random, 95% CI) | Subtotals only | |
| 13.1 Cough duration (mean number of days) | 1 | 100 | Mean Difference (Random, 95% CI) | ‐0.54 [‐0.98, ‐0.10] |
| 13.2 Frequency of cough (mean reduction in frequency of cough) | 1 | 100 | Mean Difference (Random, 95% CI) | ‐0.54 [‐1.03, ‐0.05] |
| 13.3 Severity of cough (mean reduction in severity of cough) | 1 | 100 | Mean Difference (Random, 95% CI) | ‐0.41 [‐0.78, ‐0.04] |
| 13.4 Bothersome cough (mean reduction in bothersome cough) | 1 | 100 | Mean Difference (Random, 95% CI) | ‐0.27 [‐0.48, ‐0.06] |
| 13.5 Children's sleep (mean reduction in cough impact on sleep score) | 1 | 100 | Mean Difference (Random, 95% CI) | 0.15 [0.04, 0.26] |
| 13.6 Parents' sleep (mean reduction in cough impact on sleep score) | 1 | 100 | Mean Difference (Random, 95% CI) | 0.04 [0.01, 0.07] |
| Outcome or subgroup title | No. of studies | No. of participants | Statistical method | Effect size |
| 1 Cough frequency (mean reduction in frequency) Show forest plot | 4 | Mean Difference (Fixed, 95% CI) | Subtotals only | |
| 1.1 Honey | 4 | 357 | Mean Difference (Fixed, 95% CI) | ‐1.71 [‐2.28, ‐1.13] |
| 1.2 Dextromethorphan | 2 | 74 | Mean Difference (Fixed, 95% CI) | ‐1.54 [‐2.30, ‐0.78] |
| 1.3 Diphenhydramine | 1 | 40 | Mean Difference (Fixed, 95% CI) | ‐1.73 [‐2.72, ‐0.74] |
| 1.4 Placebo | 2 | 120 | Mean Difference (Fixed, 95% CI) | ‐0.99 [‐1.79, ‐0.18] |
| 1.5 Salbutamol Day 1 | 1 | 43 | Mean Difference (Fixed, 95% CI) | ‐0.52 [‐6.28, 5.24] |
| 1.6 No treatment | 2 | 79 | Mean Difference (Fixed, 95% CI) | ‐0.98 [‐1.38, ‐0.59] |
| 1.7 Buckwheat honey | 1 | 35 | Mean Difference (Fixed, 95% CI) | ‐1.89 [‐2.96, ‐0.81] |
| 1.8 Natural honey from Kafi‐Abad (Iran) | 1 | 40 | Mean Difference (Fixed, 95% CI) | ‐2.16 [‐3.40, ‐0.92] |
| 1.9 Eucalyptus honey | 1 | 75 | Mean Difference (Fixed, 95% CI) | ‐1.77 [‐3.22, ‐0.32] |
| 1.10 Labiatae honey | 1 | 75 | Mean Difference (Fixed, 95% CI) | ‐1.82 [‐3.30, ‐0.34] |
| 1.11 Citrus honey | 1 | 75 | Mean Difference (Fixed, 95% CI) | ‐1.95 [‐3.55, ‐0.35] |
| 1.12 Salbutamol Day 5 | 1 | 43 | Mean Difference (Fixed, 95% CI) | ‐2.19 [‐3.55, ‐0.83] |
| 1.13 African honey Day 5 | 1 | 57 | Mean Difference (Fixed, 95% CI) | ‐2.65 [‐4.32, ‐0.98] |
| 1.14 Placebo Day 5 | 1 | 45 | Mean Difference (Fixed, 95% CI) | ‐1.95 [‐4.42, 0.52] |
| 2 Severity of cough (mean reduction in severity) Show forest plot | 4 | Mean Difference (Fixed, 95% CI) | Subtotals only | |
| 2.1 Honey | 4 | 357 | Mean Difference (Fixed, 95% CI) | ‐1.65 [‐2.39, ‐0.91] |
| 2.2 Dextromethorphan | 2 | 74 | Mean Difference (Fixed, 95% CI) | ‐1.52 [‐2.24, ‐0.80] |
| 2.3 Diphenhydramine | 1 | 40 | Mean Difference (Fixed, 95% CI) | ‐1.83 [‐2.88, ‐0.78] |
| 2.4 Salbutamol Day 1 | 1 | 43 | Mean Difference (Fixed, 95% CI) | ‐0.74 [‐2.87, 1.39] |
| 2.5 No treatment | 2 | 79 | Mean Difference (Fixed, 95% CI) | ‐1.13 [‐1.54, ‐0.72] |
| 2.6 Placebo | 2 | 120 | Mean Difference (Fixed, 95% CI) | ‐0.80 [‐1.47, ‐0.13] |
| 2.7 Buckwheat honey | 1 | 35 | Mean Difference (Fixed, 95% CI) | ‐1.80 [‐2.88, ‐0.72] |
| 2.8 Natural honey from Kafi‐Abad (Iran) | 1 | 40 | Mean Difference (Fixed, 95% CI) | ‐2.33 [‐3.67, ‐0.99] |
| 2.9 Eucalyptus honey | 1 | 75 | Mean Difference (Fixed, 95% CI) | ‐1.78 [‐2.82, ‐0.74] |
| 2.10 Labiatae honey | 1 | 75 | Mean Difference (Fixed, 95% CI) | ‐1.94 [‐3.07, ‐0.81] |
| 2.11 Citrus honey | 1 | 75 | Mean Difference (Fixed, 95% CI) | ‐1.77 [‐2.74, ‐0.80] |
| 2.12 Salbutamol Day 5 | 1 | 43 | Mean Difference (Fixed, 95% CI) | ‐2.08 [‐4.21, 0.05] |
| 2.13 African honey Day 5 | 1 | 57 | Mean Difference (Fixed, 95% CI) | ‐2.62 [‐5.04, ‐0.20] |
| 2.14 Placebo Day 5 | 1 | 45 | Mean Difference (Fixed, 95% CI) | ‐1.96 [‐3.74, ‐0.18] |
| 3 Bothersome cough (mean reduction in bothersome cough) Show forest plot | 3 | Mean Difference (Fixed, 95% CI) | Subtotals only | |
| 3.1 Honey | 3 | 317 | Mean Difference (Fixed, 95% CI) | ‐2.22 [‐3.24, ‐1.21] |
| 3.2 Dextromethorphan | 1 | 34 | Mean Difference (Fixed, 95% CI) | ‐1.94 [‐3.05, ‐0.83] |
| 3.3 Salbutamol Day 1 | 1 | 43 | Mean Difference (Fixed, 95% CI) | ‐1.0 [‐4.28, 2.28] |
| 3.4 No treatment | 1 | 39 | Mean Difference (Fixed, 95% CI) | ‐1.30 [‐2.07, ‐0.53] |
| 3.5 Placebo | 2 | 120 | Mean Difference (Fixed, 95% CI) | ‐1.08 [‐2.06, ‐0.10] |
| 3.6 Buckwheat honey | 1 | 35 | Mean Difference (Fixed, 95% CI) | ‐2.23 [‐3.50, ‐0.96] |
| 3.7 Eucalyptus honey | 1 | 75 | Mean Difference (Fixed, 95% CI) | ‐2.0 [‐3.82, ‐0.18] |
| 3.8 Labiatae honey | 1 | 75 | Mean Difference (Fixed, 95% CI) | ‐2.07 [‐4.03, ‐0.11] |
| 3.9 Citrus honey | 1 | 75 | Mean Difference (Fixed, 95% CI) | ‐2.16 [‐4.20, ‐0.12] |
| 3.10 Salbutamol Day 5 | 1 | 43 | Mean Difference (Fixed, 95% CI) | ‐2.47 [‐4.73, ‐0.21] |
| 3.11 African honey Day 5 | 1 | 57 | Mean Difference (Fixed, 95% CI) | ‐2.74 [‐5.27, ‐0.21] |
| 3.12 Placebo Day 5 | 1 | 45 | Mean Difference (Fixed, 95% CI) | ‐1.85 [‐3.56, ‐0.14] |
| 4 Children's sleep (mean reduction in cough impact on sleep score) Show forest plot | 4 | Mean Difference (Random, 95% CI) | Subtotals only | |
| 4.1 Honey | 4 | 357 | Mean Difference (Random, 95% CI) | ‐2.23 [‐2.87, ‐1.59] |
| 4.2 Dextromethorphan | 2 | 74 | Mean Difference (Random, 95% CI) | ‐1.75 [‐2.46, ‐1.04] |
| 4.3 Diphenhydramine | 1 | 40 | Mean Difference (Random, 95% CI) | ‐1.64 [‐2.58, ‐0.70] |
| 4.4 No treatment | 2 | 79 | Mean Difference (Random, 95% CI) | ‐1.28 [‐1.81, ‐0.76] |
| 4.5 Placebo | 2 | 120 | Mean Difference (Random, 95% CI) | ‐1.03 [‐2.05, 0.00] |
| 4.6 Salbutamol Day 5 | 1 | 43 | Mean Difference (Random, 95% CI) | ‐2.47 [‐3.84, ‐1.10] |
| 4.7 African honey Day 5 | 1 | 57 | Mean Difference (Random, 95% CI) | ‐2.32 [‐3.63, ‐1.01] |
| 4.8 Placebo Day 5 | 1 | 45 | Mean Difference (Random, 95% CI) | ‐1.68 [‐2.63, ‐0.73] |
| 5 Parents' sleep (mean reduction in cough impact on sleep score) Show forest plot | 4 | Mean Difference (Fixed, 95% CI) | Subtotals only | |
| 5.1 Honey | 4 | 357 | Mean Difference (Fixed, 95% CI) | ‐2.25 [‐2.89, ‐1.61] |
| 5.2 Dextromethorphan | 2 | 74 | Mean Difference (Fixed, 95% CI) | ‐1.97 [‐2.77, ‐1.17] |
| 5.3 Diphenhydramine | 1 | 40 | Mean Difference (Fixed, 95% CI) | ‐1.89 [‐2.97, ‐0.81] |
| 5.4 No treatment | 2 | 79 | Mean Difference (Fixed, 95% CI) | ‐1.46 [‐2.06, ‐0.87] |
| 5.5 Placebo | 2 | 120 | Mean Difference (Fixed, 95% CI) | ‐1.44 [‐2.28, ‐0.61] |
| 5.6 Salbutamol Day 5 | 1 | 43 | Mean Difference (Fixed, 95% CI) | ‐2.33 [‐3.91, ‐0.75] |
| 5.7 African honey Day 5 | 1 | 57 | Mean Difference (Fixed, 95% CI) | ‐2.29 [‐3.86, ‐0.72] |
| 5.8 Placebo Day 5 | 1 | 45 | Mean Difference (Fixed, 95% CI) | ‐1.54 [‐2.60, ‐0.48] |
| 6 Combined reduction in symptoms score Show forest plot | 3 | Mean Difference (Fixed, 95% CI) | Subtotals only | |
| 6.1 Honey | 3 | 317 | Mean Difference (Fixed, 95% CI) | ‐10.60 [‐14.43, ‐6.77] |
| 6.2 Dextromethorphan | 1 | 34 | Mean Difference (Fixed, 95% CI) | ‐8.39 [‐10.95, ‐5.84] |
| 6.3 No treatment | 1 | 39 | Mean Difference (Fixed, 95% CI) | ‐6.41 [‐8.82, ‐3.99] |
| 6.4 Placebo | 2 | 132 | Mean Difference (Fixed, 95% CI) | ‐7.11 [‐10.78, ‐3.44] |
| 6.5 Honey Day 5 | 1 | 57 | Mean Difference (Fixed, 95% CI) | ‐12.68 [‐14.06, ‐11.30] |
| 6.6 Placebo Day 5 | 1 | 45 | Mean Difference (Fixed, 95% CI) | ‐8.69 [‐14.17, ‐3.21] |
| 6.7 Salbutamol Day 5 | 1 | 43 | Mean Difference (Fixed, 95% CI) | ‐11.37 [‐17.55, ‐5.19] |
| Outcome or subgroup title | No. of studies | No. of participants | Statistical method | Effect size |
| 1 Honey versus dextromethorphan Show forest plot | 2 | Risk Ratio (M‐H, Fixed, 95% CI) | Subtotals only | |
| 1.1 Nervousness, insomnia, hyperactivity | 2 | 149 | Risk Ratio (M‐H, Fixed, 95% CI) | 2.94 [0.74, 11.71] |
| 1.2 Stomachache, nausea, and vomiting | 1 | 69 | Risk Ratio (M‐H, Fixed, 95% CI) | 4.86 [0.24, 97.69] |
| 1.3 Drowsiness | 1 | 69 | Risk Ratio (M‐H, Fixed, 95% CI) | 2.92 [0.12, 69.20] |
| 2 Honey versus diphenhydramine Show forest plot | 1 | 80 | Risk Ratio (M‐H, Fixed, 95% CI) | 0.14 [0.01, 2.68] |
| 2.1 Somnolence | 1 | 80 | Risk Ratio (M‐H, Fixed, 95% CI) | 0.14 [0.01, 2.68] |
| 3 Honey versus placebo Show forest plot | 2 | Risk Ratio (M‐H, Fixed, 95% CI) | Subtotals only | |
| 3.1 Stomachache, nausea, and vomiting | 2 | 402 | Risk Ratio (M‐H, Fixed, 95% CI) | 1.91 [1.12, 3.24] |
| 3.2 Diarrhoea | 1 | 102 | Risk Ratio (M‐H, Fixed, 95% CI) | 0.92 [0.33, 2.55] |
| 3.3 Tachycardia | 1 | 102 | Risk Ratio (M‐H, Fixed, 95% CI) | 1.58 [0.15, 16.86] |
| 4 Honey versus salbutamol Show forest plot | 1 | Risk Ratio (M‐H, Random, 95% CI) | Subtotals only | |
| 4.1 Stomachache, nausea, and vomiting | 1 | 100 | Risk Ratio (M‐H, Random, 95% CI) | 1.74 [1.04, 2.92] |
| 4.2 Rash | 1 | 100 | Risk Ratio (M‐H, Random, 95% CI) | 0.19 [0.02, 1.63] |
| 4.3 Tachycardia | 1 | 100 | Risk Ratio (M‐H, Random, 95% CI) | 1.51 [0.14, 16.10] |
| 4.4 Diarrhoea | 1 | 100 | Risk Ratio (M‐H, Random, 95% CI) | 0.59 [0.24, 1.45] |
| 5 Honey versus no treatment Show forest plot | 2 | 302 | Odds Ratio (M‐H, Fixed, 95% CI) | 6.99 [1.55, 31.58] |
| 5.1 Nervousness, insomnia, hyperactivity | 2 | 154 | Odds Ratio (M‐H, Fixed, 95% CI) | 9.40 [1.16, 76.20] |
| 5.2 Stomachache, nausea, and vomiting | 1 | 74 | Odds Ratio (M‐H, Fixed, 95% CI) | 5.90 [0.27, 127.14] |
| 5.3 Drowsiness | 1 | 74 | Odds Ratio (M‐H, Fixed, 95% CI) | 3.43 [0.14, 87.09] |