Tratamiento sistémico de segunda línea para el cáncer colorrectal metastásico
Resumen
Antecedentes
El tratamiento de los pacientes con cáncer colorrectal (CCR) metastásico que no respondieron al tratamiento de primera línea implica un gran desafío.
Objetivos
Determinar la eficacia y la toxicidad del tratamiento sistémico de segunda línea en los pacientes con CCR metastásico.
Métodos de búsqueda
Se hicieron búsquedas en el Registro Cochrane Central de Ensayos Controlados (Cochrane Central Register of Controlled Trials) (CENTRAL) (the Cochrane Library 2016, número 4), Ovid MEDLINE (1950 hasta mayo 2016), Ovid MEDLINE In‐process & Other Non‐Indexed Citations (1946 hasta mayo 2016) y en Ovid Embase (1974 hasta mayo 2016). No hubo restricciones de idioma ni fecha de publicación.
Criterios de selección
Ensayos controlados aleatorios (ECA) que evaluaban la eficacia (supervivencia, respuesta tumoral) y la toxicidad (incidencia de efectos adversos graves [EAG]) del tratamiento sistémico de segunda línea (tratamiento único o combinado con cualquier fármaco anticanceroso, en cualquier dosis y número de ciclos) en pacientes con CCR metastásico que presentaron progresión, recidiva o no respondieron al tratamiento sistémico de primera línea.
Obtención y análisis de los datos
Los autores realizaron un análisis descriptivo de cada ECA incluido en cuanto a las variables principales de evaluación primarias (supervivencia) y secundarias (respuesta tumoral, toxicidad). Teniendo en cuenta la variedad de regímenes farmacológicos evaluados en los ensayos incluidos, fue posible realizar un metanálisis considerando las clases de regímenes anticancerosos (en lugar de los regímenes individuales); para lograrlo, se aplicó el modelo de efectos aleatorios para agrupar los datos. Se utilizaron los cocientes de riesgos instantáneos (CRI) y los cocientes de riesgos (CR) para describir la solidez de la asociación para la supervivencia (supervivencia general [SG] y libre de progresión [SLP]) y los datos dicotómicos (tasa de respuesta general [TRG] y tasa de EAG), respectivamente, con intervalos de confianza (IC) del 95%.
Resultados principales
Treinta y cuatro ECA (con 13 787 participantes) cumplieron con los criterios de elegibilidad. Las pruebas disponibles permitieron considerar temas clínicos múltiples con respecto a los efectos de la supervivencia del tratamiento sistémico de segunda línea en los pacientes con CCR metastásico.
1. La quimioterapia (irinotecán) fue más efectiva que la mejor atención de apoyo (CRI para la SG: 0,58; IC del 95%: 0,43 a 0,80; un ECA; pruebas de calidad moderada); 2. la quimioterapia moderna (FOLFOX [5‐fluorouracilo más leucovorina más oxaliplatino], irinotecán) es más efectiva que la quimioterapia antigua (5‐fluorouracilo) (CRI para la SLP: 0,59; IC del 95%: 0,49 a 0,73; dos ECA; pruebas de alta calidad) (CRI para la SG: 0,69; IC del 95%: 0,51 a 0,94; un ECA; pruebas de calidad moderada); 3. las combinaciones basadas en irinotecán fueron más efectivas que el irinotecán solo (CRI para la SLP: 0,68; IC del 95%: 0,60 a 0,76; seis ECA; pruebas de calidad moderada); 4. los agentes estudiados mejoraron la eficacia de la quimioterapia convencional tanto cuando se los consideró juntos (CRI para la SG: 0,84; IC del 95%: 0,77 a 0,91; seis ECA; pruebas de alta calidad) como cuando el bevacizumab se utilizó solo (CRI para la SLP: 0,67; IC del 95%: 0,60 a 0,75; cuatro ECA; pruebas de alta calidad).
Con respecto a las variables principales de evaluación secundarias, las tasas de respuesta tumoral en general fueron paralelas a los resultados de supervivencia; además, la mayor eficacia anticancerosa en general se asoció con una toxicidad más deficiente relacionada con el tratamiento, con la importante excepción de los regímenes que contienen bevacizumab, en los que el agregado del agente específico a la quimioterapia no dio lugar a un aumento significativo en la tasa de EAG. Por último, se encontró que la administración de fluoropirimidina por vía oral (en lugar de intravenosa) redujo significativamente la incidencia de efectos adversos (sin comprometer la eficacia) en los pacientes tratados con regímenes con oxaliplatino.
No fue posible establecer conclusiones sobre otros aspectos discutidos en esta área de la oncología, como la clasificación de los tratamientos (no todas las comparaciones posibles se han evaluado y muchas comparaciones se basaron en ensayos únicos con un número pequeño de participantes) y la calidad de vida (prácticamente ningún dato disponible).
Conclusiones de los autores
El tratamiento sistémico ofrece un beneficio de supervivencia a los pacientes con CCR metastásico que no respondieron al tratamiento de primera línea, especialmente cuando los agentes específicos se combinan con fármacos quimioterapéuticos convencionales. Se necesita investigación adicional para definir el régimen óptimo y para identificar a los pacientes que se benefician más con cada tratamiento.
PICOs
Resumen en términos sencillos
El tratamiento de segunda línea puede aumentar la supervivencia de los pacientes con cáncer colorrectal metastásico que no respondieron a un primer tratamiento
Pregunta de la revisión
Se examinó la capacidad de los fármacos de quimioterapia (medicación utilizada para tratar el cáncer) para reducir el tamaño tumoral y mejorar la supervivencia en pacientes con cáncer colorrectal metastásico que no habían respondido a un tratamiento previo. También se consideraron los efectos secundarios causados por los diferentes regímenes farmacológicos.
Antecedentes
Pacientes con cáncer colorrectal metastásico (cáncer que se ha propagado a sitios diferentes del colon) y cuyas enfermedades habían progresado a pesar de un tratamiento con quimioterapia previa (tratamiento de primera línea) y a los que se les puede ofrecer un segundo tratamiento (tratamiento de segunda línea) con la intención de mejorar el resultado deficiente (pronóstico). Los regímenes de tratamiento comparados fueron sistémicos (administrados por vía intravenosa [a través de una vena]).
Características de los estudios
Las pruebas están actualizadas hasta mayo 2016. En esta revisión actualizada, se identificaron 34 ensayos clínicos que compararon el tratamiento de segunda línea con ninguna quimioterapia (mejor atención de apoyo) o un tratamiento de segunda línea alternativo, para considerar el tema del rendimiento de los tratamientos de segunda línea en pacientes con cáncer colorrectal metastásico.
Resultados principales
Las pruebas disponibles parecieron apoyar la administración del tratamiento de segunda línea debido a que mejoró las expectativas de supervivencia comparado con el mejor tratamiento médico de apoyo, aunque estos datos se informaron sólo en un ensayo pequeño y el resultado debería confirmarse en la investigación adicional. Además, se encontró que los regímenes modernos de quimioterapia fueron más efectivos que los más antiguos que contenían un fármaco denominado 5‐fluorouracilo, que la quimioterapia combinada fue más efectiva que la quimioterapia de agente único y que los agentes específicos (denominados “fármacos inteligentes” que atacan las células cancerosas y dan lugar a poco daño en las células normales) aumentaron la efectividad de la quimioterapia convencional. En general, la toxicidad aumentó a la par de la efectividad.
Calidad de la evidencia
Las principales conclusiones de esta revisión se basaron en pruebas de moderada a alta calidad. Cuando la calidad de las pruebas se consideró baja o moderada, este hecho se debió en general a la inconsistencia en los resultados principales (es decir el resultado para la supervivencia libre de progresión [tiempo desde el inicio del tratamiento de segunda línea hasta la progresión del cáncer] no se confirmó mediante la supervivencia general [tiempo desde el inicio del tratamiento de segunda línea hasta la muerte por cualquier causa]) y los números reducidos de participantes incluidos en los análisis. No obstante, debe recordarse que la supervivencia libre de progresión actualmente se considera un substituto fiable de la supervivencia general (que incluye todas las muertes, no sólo las relacionadas con el cáncer, y requiere un seguimiento más largo para obtener un cálculo exacto) en el contexto del tratamiento de segunda línea para el cáncer colorrectal metastásico. La mayoría de los ensayos no informó la calidad de vida, lo cual impide la investigación formal del equilibrio entre los beneficios de supervivencia proporcionados por el tratamiento sistémico de segunda línea y la toxicidad relacionada con el tratamiento.
Conclusiones de los autores
Summary of findings
| Modern chemotherapy regimens compared with 5‐fluorouracil | ||||||
| Patient or population: people with metastatic CRC Settings: second‐line treatment Intervention: modern CTX (FOLFOX or irinotecan) Comparison: 5FU | ||||||
| Outcomes | Illustrative comparative risks* (95% CI) | Relative effect | No of participants | Quality of the evidence | Comments | |
| Assumed risk | Corresponding risk | |||||
| 5FU | Modern CTX | |||||
| Overall survival | 800 per 1000 | 671 per 1000 (560 to 780) | HR 0.69 (0.51 to 0.94) | 167 (1 RCT) | + + + ‐ Moderate | Reason for downgrading: only 1 trial available |
| Progression‐free survival | 900 per 1000 | 749 per 1000 (669 to 818) | HR 0.59 (0.49 to 0.73) | 470 (2 RCTs) | + + + + High | ‐ |
| Overall tumour response | 34 per 1000 | 99 per 1000 (50 to 197) | RR 2.96 (1.66 to 5.27) | 866 (3 RCTs) | + + + + High | ‐ |
| Severe adverse effects | 450 per 1000 | 621 per 1000 (481 to 801) | RR 1.39 (1.22 to 1.58) | 843 (3 RCTs) | + + + ‐ Moderate | Reason for downgrading: between‐study heterogeneity |
| *The basis for the assumed risk (median control group risk across studies) for survival outcomes is provided in footnotes. The corresponding risk (and its 95% confidence interval) is based on the assumed risk in the comparison group and the relative effect of the intervention (and its 95% CI). | ||||||
| GRADE Working Group grades of evidence | ||||||
| * Assumed risk in controls: 1‐year progression‐free survival rate = 10%; 1‐year overall survival rate = 20%. | ||||||
| Chemotherapy + bevacizumab compared with chemotherapy | ||||||
| Patient or population: people with metastatic CRC Settings: second‐line treatment Intervention: bevacizumab + CTX Comparison: CTX | ||||||
| Outcomes | Illustrative comparative risks* (95% CI) | Relative effect | No of participants | Quality of the evidence | Comments | |
| Assumed risk | Corresponding risk | |||||
| CTX | Bevacizumab + CTX | |||||
| Overall survival | 600 per 1000 | 515 per 1000 (474 to 554) | HR 0.79 (0.70 to 0.88) | 1723 (4 RCTs) | + + + + High | ‐ |
| Progression‐free survival | 850 per 1000 | 720 per 1000 (680 to 759) | HR 0.67 (0.60 to 0.75) | 1723 (4 RCTs) | + + + + High | ‐ |
| Overall tumour response | 92 per 1000 | 158 per 1000 (113 to 223) | RR 1.72 (1.23 to 2.43) | 1723 (4 RCTs) | + + + + High | ‐ |
| Severe adverse effects | 585 per 1000 | 626 per 1000 (544 to 731) | RR 1.07 (0.93 to 1.25) | 1708 (4 RCTs) | + + ‐ ‐ Low | Reasons for downgrading: 95% CI crossed the null value and between‐study heterogeneity |
| *The basis for the assumed risk (median control group risk across studies) for survival outcomes is provided in footnotes. The corresponding risk (and its 95% confidence interval) is based on the assumed risk in the comparison group and the relative effect of the intervention (and its 95% CI). | ||||||
| GRADE Working Group grades of evidence | ||||||
| * Assumed risk in controls: 1‐year progression‐free survival rate = 15%; 1‐year overall survival rate = 40%. | ||||||
| Irinotecan‐based regimens compared with irinotecan | ||||||
| Patient or population: people with metastatic CRC Settings: second‐line treatment Intervention: irinotecan‐based combination CTX Comparison: irinotecan | ||||||
| Outcomes | Illustrative comparative risks* (95% CI) | Relative effect | No of participants | Quality of the evidence | Comments | |
| Assumed risk | Corresponding risk | |||||
| Irinotecan | Irinotecan combination | |||||
| Progression‐free survival | 850 per 1000 | 725 per 1000 (680 to 764) | HR 0.68 (0.60 to 0.76) | 2615 (6 RCTs) | + + + ‐ Moderate | Reason for downgrading: results inconsistency (progression‐free survival findings not supported by overall survival findings) |
| Overall survival | 600 per 1000 | 565 per 1000 (515 to 614) | HR 0.91 (0.79 to 1.04) | 2615 (6 RCTs) | + + ‐ ‐ Low | Reasons for downgrading: results imprecision (95% CI crossed the null value) and inconsistency (moderate between‐study heterogeneity; overall survival findings not supported by progression‐free survival findings) |
| Overall tumour response | 67 per 1000 | 192 per 1000 (141 to 263) | RR 2.87 (2.10 to 3.93) | 2577 (6 RCTs) | + + + + High | ‐ |
| Severe adverse effects | 480 per 1000 | 566 per 1000 (461 to 696) | RR 1.18 (0.96 to 1.45) | 2510 (6 RCTs) | + + + ‐ Moderate | Reason for downgrading: between‐study heterogeneity |
| *The basis for the assumed risk (median control group risk across studies) for survival outcomes is provided in footnotes. The corresponding risk (and its 95% confidence interval) is based on the assumed risk in the comparison group and the relative effect of the intervention (and its 95% CI). | ||||||
| GRADE Working Group grades of evidence | ||||||
| * Assumed risk in controls: 1‐year progression‐free survival rate = 15%; 1‐year overall survival rate = 40%. | ||||||
| Irinotecan + oxaliplatin compared with irinotecan | ||||||
| Patient or population: people with metastatic CRC Settings: second‐line treatment Intervention: irinotecan + oxaliplatin (IROX) Comparison: irinotecan | ||||||
| Outcomes | Illustrative comparative risks* (95% CI) | Relative effect | No of participants | Quality of the evidence | Comments | |
| Assumed risk | Corresponding risk | |||||
| Irinotecan | IROX | |||||
| Overall survival | 600 per 1000 | 511 per 1000 (459 to 562) | HR 0.78 (0.67 to 0.90) | 627 (1 RCT) | + + + ‐ Moderate | Reason for downgrading: only 1 trial |
| Progression‐free survival | 900 per 1000 | 749 per 1000 (718 to 781) | HR 0.60 (0.55 to 0.66) | 627 (1 RCT) | + + + ‐ Moderate | Reason for downgrading: only 1 trial |
| Overall tumour response | 221 per 1000 | 658 per 1000 (422 to 1025) | RR 2.98 (1.91 to 4.64) | 627 (1 RCT) | + + + ‐ Moderate | Reason for downgrading: only 1 trial |
| Severe adverse effects | 594 per 1000 | 725 per 1000 (647 to 814) | RR 1.22 (1.09 to 1.37) | 627 (1 RCT) | + + + ‐ Moderate | Reason for downgrading: only 1 trial |
| *The basis for the assumed risk (median control group risk across studies) for survival outcomes is provided in footnotes. The corresponding risk (and its 95% confidence interval) is based on the assumed risk in the comparison group and the relative effect of the intervention (and its 95% CI). | ||||||
| GRADE Working Group grades of evidence | ||||||
| * Assumed risk in controls: 1‐year progression‐free survival rate = 10%; 1‐year overall survival rate = 40%. | ||||||
| Chemotherapy compared with best supportive care | ||||||
| Patient or population: people with metastatic CRC Settings: second‐line treatment Intervention: CTX Comparison: BSC | ||||||
| Outcomes | Illustrative comparative risks* (95% CI) | Relative effect | No of participants | Quality of the evidence | Comments | |
| Assumed risk | Corresponding risk | |||||
| BSC | CTX | |||||
| Overall survival | 850 per 1000 | 667 per 1000 (557 to 780) | HR 0.58 (0.43 to 0.80) | 279 (1 RCT) | + + + ‐ Moderate | Reason for downgrading: only 1 trial |
| Progression‐free survival | ‐ | ‐ | ‐ | ‐ | ‐ | ‐ |
| Overall tumour response | ‐ | ‐ | ‐ | ‐ | ‐ | ‐ |
| Severe adverse effects | 12 per 1000 | 14 per 1000 (12 to 17) | RR 1.19 (1.01 to 1.40) | 279 (1 RCT) | + + + ‐ Moderate | Reason for downgrading: only 1 trial |
| *The basis for the assumed risk (median control group risk across studies) for survival outcomes is provided in footnotes. The corresponding risk (and its 95% confidence interval) is based on the assumed risk in the comparison group and the relative effect of the intervention (and its 95% CI). | ||||||
| GRADE Working Group grades of evidence | ||||||
| * Assumed risk in controls: 1‐year overall survival rate = 15%. | ||||||
| FOLFIRI + targeted therapy compared with FOLFIRI | ||||||
| Patient or population: people with metastatic CRC Settings: second‐line treatment Intervention: FOLFIRI + targeted agents Comparison: FOLFIRI | ||||||
| Outcomes | Illustrative comparative risks* (95% CI) | Relative effect | No of participants | Quality of the evidence | Comments | |
| Assumed risk | Corresponding risk | |||||
| FOLFIRI | FOLFIRI + targeted agents | |||||
| Overall survival | 550 per 1000 | 488 per 1000 (459 to 516) | HR 0.84 (0.77 to 0.91) | 3335 (6 RCTs) | + + + + High | ‐ |
| Progression‐free survival | 850 per 1000 | 772 per 1000 (740 to 808) | HR 0.78 (0.71 to 0.87) | 3335 (6 RCTs) | + + + + High | ‐ |
| Overall tumour response | 112 per 1000 | 232 per 1000 (147 to 367) | RR 2.07 (1.31 to 3.28) | 3192 (6 RCTs) | + + + ‐ Moderate | Reason for downgrading: between‐study heterogeneity |
| Severe adverse effects | 494 per 1000 | 642 per 1000 (578 to 716) | RR 1.30 (1.17 to 1.45) | 3341 (6 RCTs) | + + + ‐ Moderate | Reason for downgrading: between‐study heterogeneity |
| *The basis for the assumed risk (median control group risk across studies) for survival outcomes is provided in footnotes. The corresponding risk (and its 95% confidence interval) is based on the assumed risk in the comparison group and the relative effect of the intervention (and its 95% CI). | ||||||
| GRADE Working Group grades of evidence | ||||||
| * Assumed risk in controls: 1‐year progression‐free survival rate = 15%; 1‐year overall survival rate = 45%. | ||||||
| FOLFOX + targeted therapy compared with FOLFOX | ||||||
| Patient or population: people with metastatic CRC Settings: second‐line treatment Intervention: FOLFOX + targeted agents Comparison: FOLFOX | ||||||
| Outcomes | Illustrative comparative risks* (95% CI) | Relative effect | No of participants | Quality of the evidence | Comments | |
| Assumed risk | Corresponding risk | |||||
| FOLFOX | FOLFOX + targeted agents | |||||
| Overall survival | 600 per 1000 | 553 per 1000 (453 to 654) | HR 0.92 (0.82 to 1.04) | 1432 (2 RCTs) | + ‐ ‐ ‐ Very low | Reasons for downgrading: results imprecision (95% CI crosses the null value) and inconsistency (high between‐study heterogeneity; overall survival findings not supported by progression‐free survival findings) |
| Progression‐free survival | 900 per 1000 | 809 per 1000 (705 to 892) | HR 0.76 (0.66 to 0.86) | 1432 (2 RCTs) | + + ‐ ‐ Low | Reasons for downgrading: results inconsistency (between‐study heterogeneity and progression‐free survival findings not conformed by overall survival data) |
| Overall tumour response | 86 per 1000 | 227 per 1000 (147 to 349) | RR 2.64 (1.71 to 4.06) | 578 (1 RCT) | + + + ‐ Moderate | Reason for downgrading: only 1 trial available |
| Severe adverse effects | 669 per 1000 | 803 per 1000 (756 to 856) | RR 1.20 (1.13 to 1.28) | 1414 (2 RCTs) | + + + + High | ‐ |
| *The basis for the assumed risk (median control group risk across studies) is provided in footnotes. The corresponding risk (and its 95% confidence interval) is based on the assumed risk in the comparison group and the relative effect of the intervention (and its 95% CI). | ||||||
| GRADE Working Group grades of evidence | ||||||
| * Assumed risk in controls: 1‐year progression‐free survival rate = 10%; 1‐year overall survival rate = 40%. | ||||||
| Irinotecan + targeted therapy compared with irinotecan | ||||||
| Patient or population: people with metastatic CRC Settings: second‐line treatment Intervention: irinotecan + targeted therapy Comparison: irinotecan | ||||||
| Outcomes | Illustrative comparative risks* (95% CI) | Relative effect | No of participants | Quality of the evidence | Comments | |
| Assumed risk | Corresponding risk | |||||
| Irinotecan | Irinotecan + targeted therapy | |||||
| Overall survival | 600 per 1000 | 596 per 1000 (553 to 603) | HR 0.99 (0.88 to 1.10) | 1758 (2 RCTs) | + + ‐ ‐ Low | Reasons for downgrading: results imprecision (95% CI crosses the null value) and inconsistency (overall survival findings not conformed by progression‐free survival data) |
| Progression‐free survival | 900 per 1000 | 805 per 1000 (771 to 838) | HR 0.71 (0.64 to 0.79) | 1758 (2 RCTs) | + + + ‐ Moderate | Reason for downgrading: results inconsistency (progression‐free survival findings not conformed by overall survival data) |
| Overall tumour response | 61 per 1000 | 206 per 1000 (154 to 276) | RR 3.38 (2.53 to 4.52) | 1758 (2 RCTs) | + + + + High | ‐ |
| Severe adverse effects | 425 per 1000 | 612 per 1000 (557 to 676) | RR 1.44 (1.31 to 1.59) | 1704 (2 RCTs) | + + + + High | ‐ |
| *The basis for the assumed risk (median control group risk across studies) for survival outcomes is provided in footnotes. The corresponding risk (and its 95% confidence interval) is based on the assumed risk in the comparison group and the relative effect of the intervention (and its 95% CI). | ||||||
| GRADE Working Group grades of evidence | ||||||
| * Assumed risk in controls: 1‐year progression‐free survival rate = 10%; 1‐year overall survival rate = 40%. | ||||||
Antecedentes
Descripción de la afección
El cáncer colorrectal (CCR) es una de las causas más frecuentes de cáncer y de muerte debido al cáncer en todo el mundo y la tercera causa en los países occidentales (Ferlay 2015; Torre 2015). La Organización Mundial de la Salud (OMS) calcula que se registran cerca de 1 000 000 de casos por año en todo el mundo y casi 500 000 muertes (WHO 2003). Cerca de la mitad de los pacientes con diagnóstico reciente presentan enfermedad metastásica al momento de la consulta (denominada metástasis sincrónica) o finalmente desarrollarán enfermedad metastásica (metástasis metacrónica), de forma independiente del tratamiento (Cunningham 1998; Cunningham 2010; Saunders 2006). Excepto por los pacientes seleccionados con enfermedad metastásica resecable sólo en el hígado en los que la cirugía radical puede estar seguida de un tiempo de supervivencia prolongado (Adam 2012; Schmoll 2012), el tratamiento sistémico es el tratamiento de elección para la enfermedad metastásica debido a que demostró ser efectivo para prolongar la supervivencia (Best 2000; Cunningham 2010; Gustavsson 2015; Kirstein 2014; Schmoll 2012).
Descripción de la intervención
Hasta la introducción del irinotecán y el oxaliplatino en 2000; el tratamiento con quimioterapia estándar de primera línea para el CCR metastásico se basó en regímenes con 5‐fluorouracilo (5FU) y leucovorina. Actualmente, los regímenes de combinación de FOLFOX (5FU más leucovorina más oxaliplatino) y FOLFIRI (5FU más leucovorina más irinotecán) se consideran regímenes estándar para el tratamiento de primera línea (Grothey 2006; NICE 2005). Además, los denominados tratamientos específicos con agentes que actúan selectivamente en las moléculas que desempeñan una función significativa en la progresión del cáncer (p.ej. receptor del factor de crecimiento epidérmico [RFCE] y factor de crecimiento endotelial vascular [FCEV]) presentan una mejoría adicional en la esperanza de vida (Kirstein 2014; Marques 2014). Sin embargo, la mayoría de los pacientes (si no todos) con enfermedad metastásica con el tiempo presentarán fracaso clínico (es decir recidiva o progresión de la enfermedad) o falta de respuesta al tratamiento de primera línea y, por lo tanto, se convertirán en candidatos potenciales al tratamiento sistémico de segunda línea (Arnold 2013; Cunningham 2010; Goldberg 2006; Gustavsson 2015; Kirstein 2014; Marques 2014; Rougier 2005).
Por qué es importante realizar esta revisión
El rendimiento (es decir eficacia y toxicidad) del tratamiento sistémico de segunda línea no está claro. En particular, hay incertidumbre acerca de la eficacia de la quimioterapia en esta población (en comparación con observación / mejor atención de apoyo), la función de los agentes específicos (p.ej. si aumentan o no la eficacia de la quimioterapia convencional), el régimen óptimo en cuanto al tipo y número de agentes anticancerosos y el esquema de administración del tratamiento. La finalidad de esta revisión sistemática fue resumir las pruebas disponibles sobre la realización del tratamiento sistémico de segunda línea en pacientes con CCR metastásico distante.
Objetivos
Determinar la eficacia y la toxicidad del tratamiento sistémico de segunda línea en los pacientes con CCR metastásico.
Métodos
Criterios de inclusión de estudios para esta revisión
Tipos de estudios
Ensayos controlados aleatorios (ECA) en pacientes con CCR metastásico distante (o localmente avanzado inoperable), en los que un régimen de tratamiento sistémico de segunda línea se comparaba con placebo, la mejor atención de apoyo u otro régimen de tratamiento sistémico de segunda línea. Los ensayos aleatorios grupales y los ensayos cruzados no fueron elegibles para la inclusión.
Tipos de participantes
Pacientes con CCR metastásico distante o localmente avanzado inoperable (o sea, enfermedad en estadio IV del TNM) que habían presentado progresión, recidiva o no habían respondido al tratamiento sistémico de primera línea. No se incluyó a los pacientes aptos para ser sometidos a intervención quirúrgica (p.ej. con metástasis de hígado resecable).
Tipos de intervenciones
Cualquier régimen de tratamiento sistémico de segunda línea (agente único o régimen de combinación). Se consideraron las siguientes comparaciones:
-
tratamiento sistémico de segunda línea versus control (placebo o mejor atención de apoyo);
-
comparaciones de diferentes regímenes de tratamiento sistémico de segunda línea.
Tipos de medida de resultado
Resultados primarios
-
Supervivencia general (SG, tiempo desde el inicio del tratamiento de segunda línea hasta la muerte por cualquier causa).
-
Supervivencia libre de progresión (SLP, tiempo desde el inicio del tratamiento de segunda línea hasta la progresión de la enfermedad).
Resultados secundarios
-
Tasa de respuesta tumoral general (TRG [respuesta completa y parcial], según la OMS [OMS 1979], o los criterios Response Evaluation Criteria In Solid Tumours [RECIST] (Therasse 2000)).
-
Eventos adversos graves (EAG, toxicidad de grado 3 a 5 relacionada con el tratamiento en la escala Common Terminology Criteria for Adverse Events [CTCAE], o su equivalente).
-
Calidad de vida (CdV, según lo evaluado por cuestionarios dedicados como el European Organisation for Research and Treatment of Cancer [EORTC] QLQ‐C30).
Results
Description of studies
Results of the search
We identified 1826 records through the electronic searches of the Cochrane Library (279 records), MEDLINE (332 records), MEDLINE In‐process & Other Non‐indexed citations (548 records) and Embase (667 records). We excluded 791 duplicates and 968 clearly irrelevant records through reading titles and abstracts. We retrieved the remaining 67 records for further assessment. Upon full‐text reading, we excluded 41 studies for reasons listed in the Characteristics of excluded studies table. We identified eight additional studies through scanning reference lists of the identified RCTs.
In total, 34 RCTs fulfilled the inclusion criteria. The study flow diagram is shown in Figure 3.

Study flow diagram.
A list of abbreviations used in the text are reported in Table 1.
| Acronym | Full name |
| 5FU | 5‐fluorouracil |
| Ang1 | Angiopoietin‐1 |
| Ang2 | Angiopoietin‐2 |
| CRC | Colorectal cancer |
| CTX | Chemotherapy |
| DR5 | Death receptor 5 |
| EGFR | Epithelial growth factor receptor |
| FOLFIRI | Fluorouracil + irinotecan + leucovorin |
| FOLFOX | Fluorouracil + oxaliplatin + leucovorin |
| HR | Hazard ratio |
| IGF1R | Insulin‐like growth factor 1 receptor |
| IRIS | S‐1 + irinotecan |
| i.v. | Intravenous |
| KRAS | Name of a gene whose product acts downstream of EGFR |
| ORR | Overall response rate |
| OS | Overall survival |
| PDGFR | Platelet derived growth factor receptor |
| PFS | Progression‐free survival |
| QoL | Quality of life |
| RCT | Randomized controlled trial |
| RR | Risk ratio |
| SAE | Severe adverse event |
| VEGF | Vascular endothelium growth factor |
| VEGFR | VEGF receptor |
| XELOX | Capecitabine + oxaliplatin |
Included studies
The main features of each of the 34 included trials (overall enrolling 13,787 participants; range: 55 to 1298; median: 247) are reported in the Characteristics of included studies table. One trial compared four arms (Bendell 2013_folfiri), four trials compared three arms (Cohn 2013_conat; Élez 2015; O'Neil 2014; Rothenberg 2003_folfox), and the remaining 27 trials compared two arms. Only one trial compared a second‐line chemotherapy regimen with best supportive care (Cunningham 1998). The other included studies compared two or more different second‐line treatments.
All trials were comparable in terms of baseline characteristics (all participants enrolled had metastatic CRC and had not responded to a first‐line treatment), except for the first‐line regimens that could be different. As regards outcomes, OS, PFS, ORR and SAE data were reported in 31, 31, 30 and 34 trials, respectively.
The drug regimens tested were heterogeneous. In particular, 17 different anticancer agents (alone or in combination) were tested: seven chemotherapy agents (5FU, oxaliplatin, irinotecan, mitomycin‐C, raltitrexed, capecitabine, S‐1) and 10 targeted agents (seven monoclonal antibodies: bevacizumab, cetuximab, panituzumab, abituzumab, conatumumab, ganitumab, ramucirumab; two small molecule inhibitors: vatalanib and gefitinib; and two recombinant blocking proteins: aflibercept and trebananib). The main features of these compounds are reported in Table 2. Two compounds (leucovorin and hyaluronan) utilized in some RCTs have no anticancer activity per se, but increase (leucovorin) or are supposed to increase (hyaluronan) the anticancer activity of chemotherapy agents.
| Name (abbreviation) | Class | Mechanism of action | Route of administration |
| 5‐fluorouracil (5FU) | Chemotherapy agent | Antimetabolite (pyrimidine analogue) inhibiting RNA synthesis and the enzyme thymidylate synthase (which converts dUMP to dTMP which in turn is needed for the synthesis of DNA) | Intravenous |
| Oxaliplatin | Chemotherapy agent | Alkylating agent binding covalently to DNA, which in turn inhibits DNA replication or causes DNA breaks | Intravenous |
| Irinotecan | Chemotherapy agent | Inhibits the enzyme topoisomerase‐I, which is involved in DNA replication or transcription | Intravenous |
| Mitomycin‐C | Chemotherapy agent | Alkylating agent binding covalently to DNA, which in turn inhibits DNA replication or causes DNA breaks | Intravenous |
| Raltitrexed | Chemotherapy agent | Antimetabolite that inhibits the enzyme thymidylate synthase (which converts dUMP to dTMP which in turn is needed for the synthesis of DNA) | Intravenous |
| Capecitabine | Chemotherapy agent | It is a prodrug of 5FU: one within the cells, it is transformed into the active drug | Oral |
| S‐1 | Chemotherapy agent | Antimetabolite (pyrimidine analogue) inhibiting RNA synthesis and the enzyme thymidylate synthase (which converts dUMP to dTMP which in turn is needed for the synthesis of DNA) | Oral |
| Bevacizumab | Targeted drug | Monoclonal antibody blocking VEGF (a ligand of VEGFR, a receptor involved in angiogenesis) | Intravenous |
| Cetuximab | Targeted drug | Monoclonal antibody blocking EGFR (a receptor involved in cell proliferation); best works against KRAS wild‐type tumours | Intravenous |
| Panituzumab | Targeted drug | Monoclonal antibody blocking EGFR (a receptor involved in cell proliferation); best works against KRAS wild‐type tumours | Intravenous |
| Conatumumab | Targeted drug | Monoclonal antibody activating DR5 (a receptor involved in cell apoptosis) | Intravenous |
| Ganitumab | Targeted drug | Monoclonal antibody blocking IGF1R (a receptor involved in cell proliferation) | Intravenous |
| Ramucirumab | Targeted drug | Monoclonal antibody blocking VEGFR (a receptor involved in angiogenesis) | Intravenous |
| Abituzumab | Targeted drug | Monoclonal antibody blocking integrin‐alphaV (a molecule involved in cell adhesion) | Intravenous |
| Trebananib | Targeted drug | Recombinant protein blocking Ang1 and Ang2 (ligands of Tie2, a receptor involved in angiogenesis) | Intravenous |
| Aflibercept | Targeted drug | Recombinant protein blocking VEGF (a ligand of VEGFR, a receptor involved in angiogenesis) | Intravenous |
| Vatalanib | Targeted drug | Small molecule inhibitor of multiple tyrosine kinases such as VEGFR (a receptor involved in angiogenesis) and PDGFR (a receptor involved in cell proliferation) | Oral |
| Gefitinib | Targeted drug | Small molecule inhibitor of tyrosine kinase EGFR (a receptor involved in cell proliferation); best works against EGFR mutated/KRAS wild‐type tumours | Oral |
Ang1: angiopoietin‐1, Ang2: angiopoietin‐2; DR5: death receptor 5; dTMP: deoxythymidine monophosphate; dUMP: deoxyuridine monophosphate; IGF1R: insulin‐like growth factor 1 receptor; PDGFR: platelet‐derived growth factor receptor; RNA: ribonucleic acid; VEGF: vascular endothelial growth factor; VEGFR: VEGF receptor.
The RCTs tested the following 25 drug combinations: 1. FOLFOX (5FU plus leucovorin plus oxaliplatin), 2. FOLFIRI (5FU plus leucovorin plus irinotecan), 3. IRIS (S‐1 plus irinotecan), 4. XELOX (capecitabine plus oxaliplatin), 5. bevacizumab plus FOLFIRI, 6. bevacizumab plus FOLFOX, 7. cetuximab plus irinotecan, 8. panitumumab plus FOLFIRI, 9. panitumumab plus irinotecan, 10. panitumumab plus bevacizumab plus FOLFIRI, 11. axitinib plus FOLFOX, 12. axitinib plus FOLFIRI, 13. conatumumab plus FOLFIRI, 14. ganitumab plus FOLFIRI, 15. hyaluronan plus irinotecan, 16. oxaliplatin plus irinotecan, 17. linifanib plus FOLFOX, 18. ramucirumab plus FOLFIRI, 19. vatalanib plus FOLFOX, 20. aflibercept plus FOLFIRI, 21. gefitinib plus raltitrexed, 22. mitomycin plus oxaliplatin, 23. mitomycin plus irinotecan, 24) trebananib plus FOLFIRI and 25. abituzumab plus cetuximab plus irinotecan.
Only one trial used no anticancer treatment (best supportive care) as the control arm (the experimental arm was treatment with irinotecan) (Cunningham 1998).
Excluded studies
After reading the full text of 65 articles, we excluded 39 studies. Main reason for exclusion was that the trial did not focus on second‐line therapy, rather the enrolment of people for first‐line treatment or for third‐ or higher‐line treatment.
Details regarding the reasons for exclusion of each study are reported in the Characteristics of excluded studies table.
Risk of bias in included studies
Figure 1 and Figure 2 show the risk of bias across trials and for each trial, respectively; details are reported in the 'Risk of bias' tables in the Characteristics of included studies table. Considering the risk of single biases across trials, a high risk was present in a significant proportion (greater than 50%) of trials only for performance and detection bias (Figure 1). However, it should be noted that performance bias was unavoidable in some circumstances (e.g. chemotherapy compared to best supportive care); moreover, it is unlikely that this type of bias had a significant impact on the trial results and ultimately on the findings of the meta‐analysis. While evaluating the risk of bias we did not find any difference between different outcomes; therefore, the risk assessment across domains is reported as a single assessment for all outcomes.
Allocation
There was no high risk of selection bias, although the risk was unclear for about 50% of the trials (Figure 1).
Blinding
There was high risk of bias in 22 open‐label trials due to the lack of blinding (performance bias) intrinsic to the study design.
Incomplete outcome data
There was a high risk of attrition bias (incomplete outcome data) in only one study due to the following reasons: 1. for survival outcome, neither the arm the two withdrawn participants belonged to, nor the reasons for withdrawal were reported; and 2. for tumour response, "39 patients were evaluable for response", therefore 16 participants were not evaluable (Graeven 2007).
Selective reporting
There was no high risk of reporting bias.
Other potential sources of bias
There was no high risk of other bias (e.g. baseline imbalances between arms).
Effects of interventions
See: Summary of findings for the main comparison Modern chemotherapy regimens compared with 5‐flourouracil; Summary of findings 2 Chemotherapy + bevacizumab compared with chemotherapy; Summary of findings 3 Irinotecan‐based regimens compared with irinotecan; Summary of findings 4 Irinotecan + oxaliplatin compared with irinotecan; Summary of findings 5 Chemotherapy compared with best supportive care; Summary of findings 6 FOLFIRI + targeted therapy compared with FOLFIRI; Summary of findings 7 FOLFOX + targeted therapy compared with FOLFOX; Summary of findings 8 Irinotecan + targeted therapy compared with irinotecan
Table 3 shows a synopsis of the results (in terms of OS, PFS, ORR and SAEs) generated by each included trial.
| Study | Comparison | OS (HR, 95% CI) | PFS (HR, 95% CI) | ORR (RR, 95% CI) | SAE (RR, 95% CI) |
| Axitinib + FOLFIRI vs bevacizumab + FOLFIRI | 1.36 (0.82 to 2.26) | 1.27 (0.77 to 2.09) | 1.11 (0.55 to 2.22) | 2.09 (1.04 to 4.23) | |
| Axitinib + FOLFOX vs bevacizumab + FOLFOX | 0.69 (0.37 to 1.29) | 1.04 (0.55 to 1.97) | 0.97 (0.38 to 2.49) | 1.94 (0.74 to 5.12) | |
| Bevacizumab + chemotherapy vs chemotherapy | 0.81 (0.69 to 0.95) | 0.68 (0.58 to 0.80) | 1.38 (0.74 to 2.59) | 1.11 (0.99 to 1.24) | |
| Bevacizumab + FOLFIRI vs FOLFIRI | 0.78 (0.55 to 1.11) | 0.71 (0.52 to 0.97) | 1.67 (1.08 to 2.58) | 0.84 (0.67 to 1.05) | |
| FOLFIRI vs irinotecan | 0.72 (0.46 to 1.13) | 0.81 (0.52 to 1.26) | 1.02 (0.32 to 3.28) | 0.98 (0.63 to 1.52) | |
| Conatumumab + FOLFIRI vs FOLFIRI | 0.89 (0.54 to 1.47) | 0.69 (0.41 to 1.16) | 7.14 (0.91 to 55.96) | 1.53 (1.09 to 2.15) | |
| Ganitumab + FOLFIRI vs FOLFIRI | 1.27 (0.76 to 2.12) | 1.01 (0.61 to 1.67) | 4.00 (0.46 to 34.59) | 1.17 (0.80 to 1.71) | |
| Irinotecan vs best supportive care | 0.58 (0.43 to 0.80) | Not available | Not available | 1.19 (1.01 to 1.40) | |
| Abituzumab + cetuximab + irinotecan vs cetuximab + irinotecan | 0.83 (0.54 to 1.28) | 1.13 (0.78 to 1.64) | 1.04 (0.61 to 1.78) | 0.91 (0.60 to 1.38) | |
| Irinotecan schedule 1 vs irinotecan schedule 2 | 0.99 (0.73 to 1.34) | 1.06 (0.76 to 1.47) | Not available | 0.97 (0.81 to 1.17) | |
| Bevacizumab + FOLFOX vs FOLFOX | 0.75 (0.60 to 0.94) | 0.61 (0.48 to 0.78) | 2.64 (1.71 to 4.06) | 1.23 (1.10 to 1.38) | |
| Hyaluronan + irinotecan vs irinotecan | 0.93 (0.49 to 1.76) | 0.56 (0.33 to 0.95) | 3.00 (0.33 to 26.99) | 1.38 (0.87 to 2.20) | |
| FOLFIRI vs irinotecan | 1.31 (0.68 to 2.52) | 0.87 (0.48 to 1.58) | 0.96 (0.21 to 4.37) | 0.34 (0.18 to 0.62) | |
| Oxaliplatin + irinotecan vs irinotecan | 0.78 (0.67 to 0.90) | 0.60 (0.55 to 0.66) | 2.98 (1.91 to 4.64) | 1.22 (1.09 to 1.37) | |
| Panitumumab + FOLFIRI vs bevacizumab + FOLFIRI | 1.06 (0.75 to 1.50) | 1.01 (0.68 to 1.50) | 1.67 (0.98 to 2.85) | 1.40 (0.97 to 2.02) | |
| Bevacizumab schedule 1 + FOLFIRI vs bevacizumab schedule 2 + FOLFIRI | 1.08 (0.75 to 1.56) | 0.95 (0.75 to 1.20) | 1.04 (0.58 to 1.86) | 1.07 (0.92 to 1.26) | |
| FOLFOX vs irinotecan | 0.92 (0.79 to 1.07) | 0.72 (0.60 to 0.88) | 1.80 (1.26 to 2.56) | 1.13 (0.99 to 1.29) | |
| Panitumumab + bevacizumab + FOLFIRI vs FOLFIRI | 0.67 (0.47 to 0.96) | 0.58 (0.35 to 0.95) | 1.66 (1.03 to 2.67) | 1.60 (1.30 to 1.99) | |
| Bevacizumab + chemotherapy vs chemotherapy | 0.77 (0.56 to 1.06) | 0.70 (0.52 to 0.94) | 1.24 (0.70 to 2.19) | 1.05 (0.75 to 1.47) | |
| IRIS vs FOLFIRI | 0.91 (0.71 to 1.16) | 1.08 (0.86 to 1.34) | 1.13 (0.72 to 1.77) | 1.00 (0.84 to 1.18) | |
| Linifanib + FOLFOX vs bevacizumab + FOLFOX | 1.42 (0.94 to 2.15) | 1.45 (0.83 to 2.53) | 0.69 (0.37 to 1.29) | 1.24 (1.01 to 1.53) | |
| Panitumumab + FOLFIRI vs FOLFIRI | 0.85 (0.70 to 1.03) | 0.73 (0.59 to 0.90) | 3.44 (2.36 to 5.02) | 1.40 (1.23 to 1.60) | |
| Trebananib + FOLFIRI vs FOLFIRI | 0.90 (0.53 to 1.53) | 1.23 (0.81 to 1.87) | 13.02 (0.79 to 215.40) | 0.94 (0.73 to 1.22) | |
| Panitumumab vs cetuximab | 0.97 (0.84 to 1.12) | 1.00 (0.88 to 1.14) | 1.11 (0.87 to 1.42) | 1.06 (0.93 to 1.20) | |
| FOLFOX vs 5FU | Not available | 0.55 (0.43 to 0.70) | 5.22 (1.83 to 14.83) | 1.78 (1.43 to 2.22) | |
| Oxaliplatin vs 5FU | Not available | 1.11 (0.93 to 1.33) | 1.29 (0.35 to 4.72) | 1.14 (0.88 to 1.48) | |
| XELOX vs FOLFOX | 1.02 (0.86 to 1.22) | 0.97 (0.83 to 1.13) | 1.11 (0.60 to 2.07) | 0.75 (0.68 to 0.82) | |
| Irinotecan vs 5FU | 0.69 (0.51 to 0.94) | 0.69 (0.49 to 0.97) | 2.90 (1.27 to 6.62) | 1.28 (1.05 to 1.55) | |
| Mitomycin + oxaliplatin vs mitomycin + irinotecan | Not available | Not available | 1.32 (0.47 to 3.71) | 1.62 (0.93 to 2.83) | |
| Panitumumab + irinotecan vs irinotecan | 1.01 (0.83 to 1.23) | 0.78 (0.64 to 0.95) | 2.93 (1.97 to 4.35) | 1.51 (1.24 to 1.84) | |
| Single‐dose irinotecan vs fractionated irinotecan | Not available | Not available | 0.62 (0.11 to 3.53) | 0.97 (0.72 to 1.30) | |
| Cetuximab + irinotecan vs irinotecan | 0.98 (0.85 to 1.11) | 0.69 (0.62 to 0.78) | 3.94 (2.62 to 5.92) | 1.42 (1.28 to 1.59) | |
| Ramucirumab + FOLFIRI vs FOLFIRI | 0.84 (0.73 to 0.97) | 0.79 (0.70 to 0.90) | 1.07 (0.79 to 1.47) | 1.15 (0.97 to 1.36) | |
| Single‐dose irinotecan vs fractionated irinotecan | 0.78 (0.60 to 1.01) | 0.75 (0.53 to 1.06) | 0.87 (0.45 to 1.66) | 0.98 (0.82 to 1.17) | |
| Vatalanib + FOLFOX vs FOLFOX | 1.00 (0.87 to 1.15) | 0.83 (0.71 to 0.97) | Not available | 1.19 (1.10 to 1.28) | |
| Aflibercept + FOLFIRI vs FOLFIRI | 0.82 (0.71 to 0.94) | 0.76 (0.66 to 0.87) | 1.78 (1.32 to 2.39) | 1.34 (1.24 to 1.43) | |
| Gefitinib + raltitrexed vs raltitrexed | 0.99 (0.55 to 1.78) | 1.23 (0.81 to 1.87) | 1.00 (0.15 to 6.74) | 1.67 (0.43 to 6.49) |
CI: confidence interval; FOLFIRI: fluorouracil + irinotecan + leucovorin; FOLFOX: fluorouracil + oxaliplatin + leucovorin; HR: hazard ratio; ORR: overall response rate; OS: overall survival; PFS: progression‐free survival; RR: risk ratio; SAE: severe adverse effects.
The included RCTs rarely tested the same drugs or drug regimens. Therefore, the results of the 34 eligible trials could not be pooled. Nevertheless, the available evidence provided us with the opportunity to group (and meta‐analyze) RCTs addressing the same clinical issue (e.g. does the addition of targeted agents improve the efficacy of conventional chemotherapy?), although ‐ singularly taken ‐ they tested drug regimens that were not always identical (e.g. different targeted agents or different chemotherapy drugs).
Due to space considerations and in order to ease the interpretation of the wealth of data reported in this review, we reported forest plots and 'Summary of findings' tables only for the primary outcome (survival) in case of clinical practice changing results (i.e. for the comparisons on which the main conclusions of this review are based).
Nine out of 34 studies (26%) formally addressed QoL with participant compliance being 50% to 60% (Clarke 2011; Cunningham 1998; Fuchs 2003; Peeters 2010; Price 2014; Rougier 1998; Seymour 2013; Sobrero 2008; Tabernero 2015). Although most investigators used similar questionnaires, the (few) data could not be meta‐analyzed since no article reported the actual scores (neither individual nor summary data). As regards single studies, six trials reported no significant differences in QoL (Clarke 2011; Fuchs 2003; Peeters 2010; Price 2014; Rougier 1998; Tabernero 2015). QoL was better in participants treated with irinotecan compared to those treated with best supportive care (Cunningham 1998), irinotecan plus panitumumab versus irinotecan alone (Seymour 2013), and cetuximab plus irinotecan versus irinotecan alone (Sobrero 2008).
The available evidence enabled us to address the following clinical issues.
Modern chemotherapy regimens versus 5‐fluorouracil
Two RCTs (726 participants) compared 5FU (the first chemotherapeutic agent to be associated with survival advantage in first‐line treatment of people with metastatic CRC) with three different chemotherapy regimens (including more modern drugs): FOLFOX (Rothenberg 2003_folfox), oxaliplatin (Rothenberg 2003_oxa), and irinotecan (Rougier 1998).
Only one trial (167 participants) addressed OS and showed a significant advantage for participants treated with irinotecan (HR 0.69, 95% CI 0.51 to 0.94) (Rougier 1998). Both trials reported PFS: considering the single comparisons, both FOLFOX and irinotecan were better than 5FU, whereas oxaliplatin was not. By pooling the PFS data of the three comparisons, regimens other than 5FU alone performed better than 5FU alone (HR 0.84, 95% CI 0.73 to 0.96) (Figure 4), a finding characterized by a high between‐study heterogeneity (I2 = 91%) sustained by the poor activity of oxaliplatin alone. The 'leave‐one‐out' sensitivity analysis showed that heterogeneity reduced to 11% if the oxaliplatin versus 5FU comparison was excluded; in this case, FOLFOX and irinotecan showed a clinically relevant and statistically significant PFS advantage compared to 5FU in second‐line therapy of metastatic CRC (HR 0.59, 95% CI 0.49 to 0.73). Based on the GRADE system, we rated this evidence as high (no reason for downgrading) (summary of findings Table for the main comparison).

For tumour response data, at meta‐analysis, ORR was significantly higher for other chemotherapy regimens compared to 5FU (RR 2.96, 95% CI 1.66 to 5.27), although this finding was not supported by the oxaliplatin versus 5FU comparison. Finally, the SAE rate was higher in participants treated with modern chemotherapy regimens (RR 1.39, 95% CI 1.22 to 1.58).
Irinotecan plus other anticancer agents versus irinotecan
Six trials assessed the effect of adding other anticancer agents (5FU, oxaliplatin, hyaluronan acid (a drug carrier), panitumumab, cetuximab) to irinotecan (2615 participants) (Clarke 2011; Gibbs 2011; Graeven 2007; Haller 2008; Seymour 2013; Sobrero 2008).
Only one trial (627 participants) found a statistically significant advantage for both OS (HR 0.78, 95% CI 0.67 to 0.90) and PFS (HR 0.60, 95% CI 0.55 to 0.66), when irinotecan was combined with oxaliplatin (also known as IROX regimen) (Haller 2008). The grade of evidence was moderate (because there was only one study) (summary of findings Table 4).
When the results of the six studies were pooled together, there was no OS advantage (HR 0.91, 95% CI 0.79 to 1.04), with a non‐negligible between‐study heterogeneity (I2 = 42%). In contrast, there was both a PFS advantage (HR 0.68, 95% CI 0.60 to 0.76) (Figure 5) and an ORR advantage (RR 2.87, 95% CI 2.10 to 3.93) for combination regimens, with no significant difference in terms of toxicity (RR 1.18, 95% CI 0.96 to 1.45); the grade of evidence was moderate (since the PFS findings were not confirmed by the OS data) (summary of findings Table 3).

Since the between‐study heterogeneity was moderate to high for all outcomes, we searched for more homogeneous results by subgroup analysis. Pooling the data of two trials (144 participants) comparing the same regimens (irinotecan versus FOLFIRI) found no OS, PFS, ORR or SAE differences (Clarke 2011; Graeven 2007).
Heterogeneity was drastically reduced (I2 less than 25%) when we meta‐analyzed the data of the two trials (1758 participants) testing the hypothesis that the addition of targeted agents (panitumumab, cetuximab) might enhance the therapeutic efficacy of irinotecan (Seymour 2013; Sobrero 2008): both PFS (HR 0.71, 95% CI 0.64 to 0.79) and ORR (RR 3.38, 95% CI 2.52 to 4.53) were significantly better in the combination regimen; however, there was no significant OS difference (HR 0.99, 95% CI 0.88 to 1.10), and the rate of SAEs was significantly higher with the combination regimen (RR 1.44, 95% CI 1.31 to 1.59); the grade of evidence was moderate because the PFS findings were not confirmed by the OS data (summary of findings Table 8).
Fractionated irinotecan versus single‐dose irinotecan
Three RCTs compared irinotecan administered as single dose (every three weeks) with that of irinotecan fractionated (with different schedules) (Fuchs 2003, 391 participants; Shoemaker 2004, 85 participants; Tsavaris 2003, 120 participants). There were no statistically significant differences in terms of OS (HR 0.86, 95% CI 0.71 to 1.05; 2 RCTs) (Fuchs 2003; Tsavaris 2003), PFS (HR 0.90, 95% CI 0.71 to 1.14; 2 RCTs) (Fuchs 2003; Tsavaris 2003), ORR (RR 0.83, 95% CI 0.45 to 1.53; 2 RCTs) (Shoemaker 2004;Tsavaris 2003), and SAE (RR 0.97, 95% CI 0.87 to 1.10; 3 RCTs) (Fuchs 2003; Shoemaker 2004; Tsavaris 2003).
Bevacizumab plus chemotherapy versus chemotherapy
Four RCTs (1723 participants) addressed the addition of bevacizumab to chemotherapy (oxaliplatin‐ or irinotecan‐based regimens) (Bennouna 2013; Cao 2015; Giantonio 2007; Masi 2015).
All four studies demonstrated a survival advantage for the combination arms, although this advantage was only statistically significant in two RCTs (Bennouna 2013; Giantonio 2007). Pooling the OS data from all four studies showed that bevacizumab can lead to a survival advantage (HR 0.79, 95% CI 0.70 to 0.88) (Figure 6), with no between‐study heterogeneity (I2 = 0%). The four single trials reported even better results for PFS, which was confirmed by meta‐analysis (HR 0.67, 95% CI 0.60 to 0.75) (Figure 7). Based on the GRADE system, we rated the evidence as high (no reason for downgrading) (summary of findings Table 2).


ORR data were in line with survival data as the response rates were higher in the bevacizumab‐containing regimens (RR 1.72, 95% CI 1.23 to 2.43). Interestingly, the addition of bevacizumab did not significantly increase the risk of SAEs (RR 1.07, 95% CI 0.93 to 1.25).
FOLFIRI plus targeted agents versus FOLFIRI
Six trials (3335 participants) tested the hypothesis that adding other anticancer agents to the FOLFIRI regimen (conventional chemotherapy drugs only) might increase therapeutic efficacy investigating seven different targeted drugs: conatumumab (Cohn 2013_conat), ganitumab (Cohn 2013_ganit), panitumumab (Peeters 2010), bevacizumab (plus panitumumab) (Liu 2015), trebananib (Peeters 2013), ramucirumab (Tabernero 2015), and aflibercept (Van Cutsem 2012). Singularly taken, only three RCTs showed a significant improvement in OS (Liu 2015; Tabernero 2015; Van Cutsem 2012); pooling the data of all six trials, we found that the addition of targeted agents did increase life expectation (HR 0.84, 95% CI 0.77 to 0.91) (Figure 8). There were similar results when pooling PFS data (HR 0.78, 95% CI 0.71 to 0.87) (Figure 9) and ORR data (RR 2.07, 95% CI 1.31 to 3.28).


Importantly, the addition of targeted agents also significantly increased the incidence of SAEs (RR 1.30, 95% CI 1.17 to 1.45). At subgroup analysis, considering the three trials (2440 participants) that investigated targeted agents blocking exclusively the VEGF pathway (bevacizumab, ramucirumab, aflibercept), findings were even more homogeneous in terms of survival (OS: HR 0.82, 95% CI 0.74 to 0.90; PFS: HR 0.77, 95% CI 0.70 to 0.84).
Based on the GRADE system, we rated the evidence as high.
FOLFOX plus targeted agents versus FOLFOX
Two RCTs (1432 participants) tested the hypothesis that adding targeted agents (bevacizumab and vatalanib) to the FOLFOX regimen (chemotherapy drugs only) might increase therapeutic efficacy (bevacizumab: Giantonio 2007; vatalanib: Van Cutsem 2011). The meta‐analysis of the two trials showed a significantly improved PFS when targeted agents were added to FOLFOX (HR 0.76, 95% CI 0.66 to 0.86) (Figure 10), although there was a high degree of heterogeneity (I2 = 78%). Addition of targeted agents also improved OS, although this result did not reach statistical significance (HR 0.92, 95% CI 0.82 to 1.04).

Finally, the incidence of SAEs was significantly higher among participants receiving the combination regimen (RR 1.2, 95% CI 1.13 to 1.28). Only one study reported ORR, which showed an advantage for the regimen including bevacizumab (Giantonio 2007).
Based on the GRADE system, we rated the evidence as low (due to high heterogeneity and PFS data not confirmed by OS data).
FOLFIRI plus bevacizumab versus FOLFIRI plus other targeted agents
Two trials (282 participants) compared the FOLFIRI chemotherapy regimen in combination with either bevacizumab or other targeted agents (axitinib or panitumumab) (Bendell 2013_folfiri; Hecht 2015). Neither study reported a significant OS difference between the two approaches, a result confirmed by data meta‐analysis (HR 1.15, 95% CI 0.86 to 1.53). There were similar findings for PFS and ORR both in single studies and meta‐analysis (PFS: HR 1.10, 95% CI 0.81 to 1.50; ORR: RR 1.44, 95% CI 0.94 to 2.20).
Toxicity findings favoured the bevacizumab‐containing regimen (other agents versus bevacizumab comparison: RR 1.53, 95% CI 1.10 to 2.11). Due to the low number of participants randomized, any result should be interpreted with caution (due to low statistical power considerations).
Using the GRADE system, we rated the evidence as low (due to imprecision and low statistical power).
FOLFOX plus bevacizumab versus FOLFOX plus other targeted agents
Two trials (169 participants) compared the FOLFOX chemotherapy regimen in combination with either bevacizumab or other targeted agents (Axitinib or Linifanib) (Bendell 2013_folfox; O'Neil 2014). Neither study reported a significant OS difference between the two approaches, a result confirmed by data meta‐analysis (HR 1.14, 95% CI 0.81 to 1.61). There were similar findings for PFS and ORR both in single studies and meta‐analysis (PFS: HR 1.26, 95% CI 0.83 to 1.91; ORR: RR 0.77, 95% CI 0.46 to 1.29).
Toxicity findings favoured the bevacizumab‐containing regimen (other agents versus bevacizumab comparison: RR 1.27, 95% CI 1.03 to 1.55). Due to the low number of participants randomized, any result should be interpreted with caution (due to low statistical power considerations).
Using the GRADE system, we rated the evidence as low (due to imprecision and low statistical power).
Other comparisons based on single trials
Single RCTs compared the following regimens (for details see Characteristics of included studies and Table 3).
Irinotecan versus best supportive care
This trial (279 participants) is particularly important because it showed that anticancer therapy (irinotecan) provided a significant OS advantage (HR 0.58, 95% CI 0.43 to 0.80) even in second‐line (all enrolled participants were refractory to first‐line 5FU) compared to best supportive care, although at the cost of a (predictable) higher incidence of SAEs (RR 1.19, 95% CI 1.01 to 1.40) (Cunningham 1998).
Using the GRADE system, we rated the evidence as moderate (since there was only one trial).
IRIS versus FOLFIRI
This trial (426 participants), which compared IRIS versus FOLFIRI (both contained irinotecan), found that the two regimens were very similar in terms of survival, tumour response and toxicity outcomes (Muro 2010).
Using the GRADE system, we rated the evidence as low (due to imprecision and low statistical power).
XELOX versus FOLFOX
This study (627 participants), in which the two combination regimens basically differed by using oral (XELOX: capecitabine) instead of intravenous (FOLFOX: 5FU) fluoropyrimidine, suggested that the survival and tumour response results achieved with XELOX were similar to those with FOLFOX, but with the advantage of a lower incidence of SAEs (RR 0.75, 95% CI 0.68 to 0.82) (Rothenberg 2008).
Using the GRADE system, we rated the evidence as moderate (since there was only one trial).
FOLFOX versus irinotecan
This RCT (491 participants), which compared FOLFOX with single‐agent irinotecan, found no significant difference in OS; however, participants who received FOLFOX showed better PFS and ORR, which were not associated with a significant increase in toxicity (Kim 2009).
Using the GRADE system, we rated the evidence as low (due to imprecision and low statistical power).
Mitomycin plus oxaliplatin versus mitomycin plus irinotecan
The investigators of this trial (64 participants) did not report survival outcomes. There were no statistically significant differences between the two chemotherapy regimens in tumour response and toxicity (Scheithauer 2002).
Using the GRADE system, we rated the evidence as very low (due to imprecision and very low statistical power).
Gefitinib plus raltitrexed versus raltitrexed
The addition of targeted agent gefitinib to chemotherapy agent raltitrexed did not improve OS, PFS or ORR (76 participants). There were no toxicity differences reported between the two study arms (Viéitez 2011).
Using the GRADE system, we rated the evidence as very low (due to imprecision and very low statistical power).
Different bevacizumab dosages
One trial (369 participants) compared two bevacizumab dosages (used in association with FOLFIRI) (Iwamoto 2015). Since there were no statistically significant differences in terms of OS, PFS, ORR or SAEs, the authors concluded that higher‐dose bevacizumab did not perform better than lower‐dose bevacizumab when associated with FOLFIRI.
Using the GRADE system, we rated the evidence as low (due to imprecision and low statistical power).
Panitumumab versus cetuximab
In this trial (999 participants), the investigators did not detect significant differences between the two targeted agents panitumumab and cetuximab in terms of OS, PFS, ORR or SAEs (Price 2014).
Using the GRADE system, we rated the evidence as moderate (since there was only one trial available).
Abituzumab plus cetuximab plus irinotecan versus cetuximab plus irinotecan
The results of this RCT (216 participants) suggested that targeted agent abituzumab (both low and high dose) does not add any advantage (in terms of OS, PFS, ORR or SAEs) to the cetuximab plus irinotecan combination (Élez 2015).
Using the GRADE system, we rated the evidence as low (due to imprecision and low statistical power).
Discusión
Esta es la primera revisión sistemática y metanálisis que considera el tema del rendimiento (eficacia más toxicidad) del tratamiento sistémico de segunda línea en pacientes con CCR metastásico (estadio IV del TNM). Los hallazgos se basan en los datos recopilados de 34 ECA elegibles con 13 787 participantes.
Debido a que los ECA incluidos analizaron diversos regímenes farmacológicos, fue casi siempre imposible agrupar los resultados de comparaciones idénticas. No obstante, se extrajeron las pruebas disponibles para responder preguntas generales clínicamente relevantes, lo cual implicó el metanálisis de los ECA que consideraban el mismo tema (p.ej. ¿los fármacos específicos aumentan la eficacia de la quimioterapia?) aunque ‐ consideraros de forma singular ‐ analizaban diferentes regímenes farmacológicos (p.ej. diferentes agentes específicos).
Resumen de los resultados principales
Los resultados principales del trabajo pueden resumirse como respuestas a las siguientes preguntas clínicas.
-
¿La quimioterapia de segunda línea es efectiva en los pacientes con CCR metastásico?
Sólo un ECA abordó esta cuestión. Demostró una ventaja de supervivencia significativa para los pacientes sometidos a quimioterapia (irinotecán) en comparación con los pacientes tratados con el mejor tratamiento médico de apoyo. Obviamente, la quimioterapia estuvo acompañada por una tasa mayor de toxicidad. El nivel de pruebas fue moderado debido a que este resultado se basó en un único estudio.
-
¿Los regímenes modernos de quimioterapia son superiores al 5FU antiguo?
Los resultados de dos ECA mostraron que los regímenes modernos de quimioterapia (FOLFOX e irinotecán) fueron más efectivos que el 5FU solo, aunque al costo de una tasa de toxicidad mayor. El nivel de las pruebas fue alto.
-
¿Los regímenes con irinotecán son mejores que el irinotecán solo?
En general, los regímenes con irinotecán fueron mejores que el irinotecán solo, aunque los resultados fueron heterogéneos, lo cual probablemente estuvo vinculado a la variedad de tratamientos incluidos. Cuando se consideraron subgrupos más homogéneos, dos combinaciones estuvieron significativamente asociadas con una mejor eficacia: irinotecán más agentes específicos (dos ECA evaluaron los agentes anti‐RFCE cetuximab y panitumumab; grado de las pruebas: moderado, debido a que el resultado de la SLP no fue apoyado por el resultado de la SG) e irinotecán más oxaliplatino (régimen IROX; un ECA; grado de las pruebas: moderado, debido a que hubo sólo un ECA). En ambos casos, la mejor eficacia se vio acompañada por una tasa más alta de EAG. Debe destacarse que el régimen de combinación, FOLFIRI, no fue superior al irinotecán solo.
-
¿El agente específico bevacizumab aumenta la eficacia de la quimioterapia?
Cuatro ECA consideraron este tema y encontraron que el bevacizumab aumentó significativamente la eficacia de la quimioterapia (variedad de regímenes); es interesante destacar que este beneficio no fue equiparado por un aumento significativo de las tasas de toxicidad. El grado de las pruebas fue alto.
-
¿Los agentes específicos aumentan la eficacia del FOLFIRI o el FOLFOX?
Las pruebas de ocho ECA (FOLFIRI, seis ECA; FOLFOX, dos ECA) apoyaron la superioridad de los regímenes de combinación con agentes específicos; sin embargo, el grado de las pruebas fue alto para el FOLFIRI y bajo para el FOLFOX (debido a la heterogeneidad de los resultados y los datos de la SLP no confirmados por datos de la SG). En ambos casos, la mejor eficacia fue acompañada por una tasa mayor de EAG.
Es fundamental destacar que las respuestas a las dos últimas preguntas apoyan firmemente la administración de los agentes específicos en combinación con quimioterapia para el tratamiento de los pacientes con CCR metastásico que no respondieron al tratamiento de primera línea. Resulta interesante que la administración de bevacizumab se haya asociado con una eficacia mayor sin un aumento de la toxicidad, un resultado común al tratar con los regímenes que muestran una mejor actividad anticancerosa (ver las comparaciones “Regímenes modernos de quimioterapia versus 5‐fluorouracilo”, “Irinotecán más otros agentes anticancerosos versus irinotecán” e “Irinotecán y el mejor tratamiento médico de apoyo”). En particular, otros agentes específicos de uso difundido, como los dirigidos a la vía del RFCE (p.ej. cetuximab y panitumumab) que mejoran la supervivencia de los pacientes (cuando se los agrega a la quimioterapia), son acompañados por una tolerabilidad significativamente más deficiente (ver comparación “Irinotecán más otros agentes anticancerosos versus irinotecán”).
Con respecto a las variables principales de evaluación secundarias, tanto las tasas de respuesta como de toxicidad en general son directamente proporcionales a la eficacia (es decir cuanto mayor es la eficacia, mayores son las tasas de encogimiento tumoral y de EAG); este fue el caso para los regímenes comparados con la excepción del bevacizumab (que pareció dar lugar a tasas de respuesta mayores cuando se lo combinó con quimioterapia, sin un aumento de la toxicidad). Otro indicio importante proviene de la comparación entre las fluoropirimidinas orales e intravenosas (combinadas con oxaliplatino), que apoya la administración oral debido a la eficacia similar, las tasas de toxicidad inferiores y la vía de administración más fácil (Rothenberg 2008).
Compleción y aplicabilidad general de las pruebas
Aunque los resultados anteriores proporcionan a los médicos alguna información útil, aún hay algunas preguntas sin respuesta. Por ejemplo, muchas comparaciones que no muestran ninguna diferencia estadísticamente significativa entre los regímenes se basaron en ensayos individuales con un número insuficiente de participantes para obtener un poder estadístico satisfactorio, lo cual impidió establecer conclusiones definitivas basadas en dichos resultados. Además, no todas las comparaciones estaban disponibles, lo cual dio lugar a que no se pudiera generar una jerarquización completa de la variedad de regímenes estudiados. Por ejemplo, hasta ahora ningún ECA ha investigado el irinotecán más bevacizumab (versus irinotecán solo), que sería una combinación potencialmente útil de dos fármacos con eficacia establecida cuando se los administra de manera individual como tratamiento de segunda línea para los pacientes con CCR metastásico.
Como se basan en pruebas de calidad moderada a alta, los resultados principales de esta revisión podrían ser útiles para guiar a los médicos en la práctica clínica habitual en cuanto a la elección del tratamiento de segunda línea para los pacientes con CCR metastásico.
Calidad de la evidencia
Las principales conclusiones de esta revisión (ver Resumen de los principales resultados) se basan en pruebas de moderada a alta calidad; la razón principal de la disminución fue la inconsistencia debido al hecho de que los hallazgos de la SLP no fueron confirmados con datos de la SG. No obstante, debe recordarse que la SLP actualmente se considera un substituto fiable de la SG (que incluye eventos no relacionados con la enfermedad y requiere seguimientos más largos) en el contexto del tratamiento de segunda línea para el CCR metastásico (Buyse 2007; Giessen 2015).
Sesgos potenciales en el proceso de revisión
Aunque siempre es posible, se cree que es improbable que se introdujera un sesgo significativo en la búsqueda de ensayos. Además, se emplearon los métodos Cochrane de alta calidad para evaluar los ensayos y realizar el análisis de datos.
Acuerdos y desacuerdos con otros estudios o revisiones
Sólo se ha publicado una revisión sistemática sobre este tema hasta el presente (Giessen 2015); este trabajo tenía el objetivo específico de investigar la SLP y la TRG como variables de evaluación substitutivas potenciales de la SG y encontró 23 ECA (esta revisión identificó 34 estudios). Además, sólo se ha publicado una revisión sistemática y metanálisis en esta área (Beretta 2013), aunque esta área de interés estuvo limitada a un tratamiento (FOLFIRI más bevacizumab); los resultados de dicho trabajo (basado tanto en ensayos aleatorios como no aleatorios) estuvieron de acuerdo con los resultados de esta revisión.


Comparison 1 All, Outcome 1 Overall survival (OS)_modern chemotherapy (CTX) vs 5‐fluorouracil (5FU).

Comparison 1 All, Outcome 2 Progression‐free survival (PFS)_modern CTX vs 5FU.

Comparison 1 All, Outcome 3 Overall response rate (ORR)_modern CTX vs 5FU.

Comparison 1 All, Outcome 4 Serious adverse events (SAE)_modern CTX vs 5FU.

Comparison 1 All, Outcome 5 OS_irino combination (combo).

Comparison 1 All, Outcome 6 PFS_irino combo.
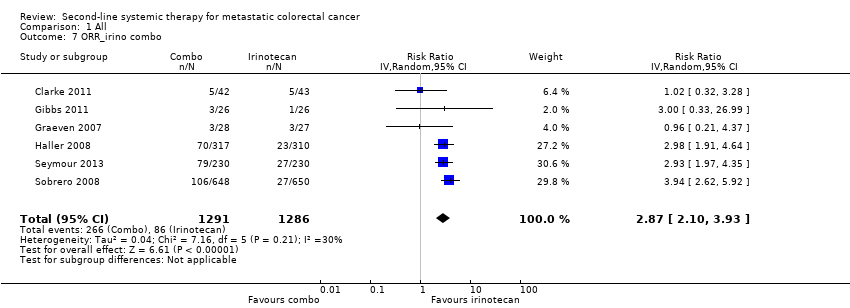
Comparison 1 All, Outcome 7 ORR_irino combo.

Comparison 1 All, Outcome 8 SAE_irino combo.

Comparison 1 All, Outcome 9 OS_bevacizumab (beva) combo.

Comparison 1 All, Outcome 10 PFS_beva combo.

Comparison 1 All, Outcome 11 ORR_beva combo.

Comparison 1 All, Outcome 12 SAE_beva combo.

Comparison 1 All, Outcome 13 OS_FOLFIRI targeted.

Comparison 1 All, Outcome 14 PFS_FOLFIRI targeted.

Comparison 1 All, Outcome 15 ORR_FOLFIRI targeted.

Comparison 1 All, Outcome 16 SAE_FOLFIRI targeted.

Comparison 1 All, Outcome 17 OS_FOLFOX targeted.

Comparison 1 All, Outcome 18 PFS_FOLFOX targeted.

Comparison 1 All, Outcome 19 ORR_FOLFOX targeted.

Comparison 1 All, Outcome 20 SAE_FOLFOX targeted.

Comparison 1 All, Outcome 21 OS_irino fraction.

Comparison 1 All, Outcome 22 PFS_irino fraction.

Comparison 1 All, Outcome 23 ORR_irino fraction.

Comparison 1 All, Outcome 24 SAE_irino fraction.

Comparison 1 All, Outcome 25 OS_FOLFIRI + beva vs other targeted.

Comparison 1 All, Outcome 26 PFS_FOLFIRI + beva vs other targeted.

Comparison 1 All, Outcome 27 ORR_FOLFIRI + beva vs other targeted.

Comparison 1 All, Outcome 28 SAE_FOLFIRI + beva vs other targeted.

Comparison 1 All, Outcome 29 OS_FOLFOX + beva vs other targeted.

Comparison 1 All, Outcome 30 PFS_FOLFOX + beva vs other targeted.

Comparison 1 All, Outcome 31 ORR_FOLFOX + beva vs other targeted.

Comparison 1 All, Outcome 32 SAE_FOLFOX + beva vs other targeted.
| Modern chemotherapy regimens compared with 5‐fluorouracil | ||||||
| Patient or population: people with metastatic CRC Settings: second‐line treatment Intervention: modern CTX (FOLFOX or irinotecan) Comparison: 5FU | ||||||
| Outcomes | Illustrative comparative risks* (95% CI) | Relative effect | No of participants | Quality of the evidence | Comments | |
| Assumed risk | Corresponding risk | |||||
| 5FU | Modern CTX | |||||
| Overall survival | 800 per 1000 | 671 per 1000 (560 to 780) | HR 0.69 (0.51 to 0.94) | 167 (1 RCT) | + + + ‐ Moderate | Reason for downgrading: only 1 trial available |
| Progression‐free survival | 900 per 1000 | 749 per 1000 (669 to 818) | HR 0.59 (0.49 to 0.73) | 470 (2 RCTs) | + + + + High | ‐ |
| Overall tumour response | 34 per 1000 | 99 per 1000 (50 to 197) | RR 2.96 (1.66 to 5.27) | 866 (3 RCTs) | + + + + High | ‐ |
| Severe adverse effects | 450 per 1000 | 621 per 1000 (481 to 801) | RR 1.39 (1.22 to 1.58) | 843 (3 RCTs) | + + + ‐ Moderate | Reason for downgrading: between‐study heterogeneity |
| *The basis for the assumed risk (median control group risk across studies) for survival outcomes is provided in footnotes. The corresponding risk (and its 95% confidence interval) is based on the assumed risk in the comparison group and the relative effect of the intervention (and its 95% CI). | ||||||
| GRADE Working Group grades of evidence | ||||||
| * Assumed risk in controls: 1‐year progression‐free survival rate = 10%; 1‐year overall survival rate = 20%. | ||||||
| Chemotherapy + bevacizumab compared with chemotherapy | ||||||
| Patient or population: people with metastatic CRC Settings: second‐line treatment Intervention: bevacizumab + CTX Comparison: CTX | ||||||
| Outcomes | Illustrative comparative risks* (95% CI) | Relative effect | No of participants | Quality of the evidence | Comments | |
| Assumed risk | Corresponding risk | |||||
| CTX | Bevacizumab + CTX | |||||
| Overall survival | 600 per 1000 | 515 per 1000 (474 to 554) | HR 0.79 (0.70 to 0.88) | 1723 (4 RCTs) | + + + + High | ‐ |
| Progression‐free survival | 850 per 1000 | 720 per 1000 (680 to 759) | HR 0.67 (0.60 to 0.75) | 1723 (4 RCTs) | + + + + High | ‐ |
| Overall tumour response | 92 per 1000 | 158 per 1000 (113 to 223) | RR 1.72 (1.23 to 2.43) | 1723 (4 RCTs) | + + + + High | ‐ |
| Severe adverse effects | 585 per 1000 | 626 per 1000 (544 to 731) | RR 1.07 (0.93 to 1.25) | 1708 (4 RCTs) | + + ‐ ‐ Low | Reasons for downgrading: 95% CI crossed the null value and between‐study heterogeneity |
| *The basis for the assumed risk (median control group risk across studies) for survival outcomes is provided in footnotes. The corresponding risk (and its 95% confidence interval) is based on the assumed risk in the comparison group and the relative effect of the intervention (and its 95% CI). | ||||||
| GRADE Working Group grades of evidence | ||||||
| * Assumed risk in controls: 1‐year progression‐free survival rate = 15%; 1‐year overall survival rate = 40%. | ||||||
| Irinotecan‐based regimens compared with irinotecan | ||||||
| Patient or population: people with metastatic CRC Settings: second‐line treatment Intervention: irinotecan‐based combination CTX Comparison: irinotecan | ||||||
| Outcomes | Illustrative comparative risks* (95% CI) | Relative effect | No of participants | Quality of the evidence | Comments | |
| Assumed risk | Corresponding risk | |||||
| Irinotecan | Irinotecan combination | |||||
| Progression‐free survival | 850 per 1000 | 725 per 1000 (680 to 764) | HR 0.68 (0.60 to 0.76) | 2615 (6 RCTs) | + + + ‐ Moderate | Reason for downgrading: results inconsistency (progression‐free survival findings not supported by overall survival findings) |
| Overall survival | 600 per 1000 | 565 per 1000 (515 to 614) | HR 0.91 (0.79 to 1.04) | 2615 (6 RCTs) | + + ‐ ‐ Low | Reasons for downgrading: results imprecision (95% CI crossed the null value) and inconsistency (moderate between‐study heterogeneity; overall survival findings not supported by progression‐free survival findings) |
| Overall tumour response | 67 per 1000 | 192 per 1000 (141 to 263) | RR 2.87 (2.10 to 3.93) | 2577 (6 RCTs) | + + + + High | ‐ |
| Severe adverse effects | 480 per 1000 | 566 per 1000 (461 to 696) | RR 1.18 (0.96 to 1.45) | 2510 (6 RCTs) | + + + ‐ Moderate | Reason for downgrading: between‐study heterogeneity |
| *The basis for the assumed risk (median control group risk across studies) for survival outcomes is provided in footnotes. The corresponding risk (and its 95% confidence interval) is based on the assumed risk in the comparison group and the relative effect of the intervention (and its 95% CI). | ||||||
| GRADE Working Group grades of evidence | ||||||
| * Assumed risk in controls: 1‐year progression‐free survival rate = 15%; 1‐year overall survival rate = 40%. | ||||||
| Irinotecan + oxaliplatin compared with irinotecan | ||||||
| Patient or population: people with metastatic CRC Settings: second‐line treatment Intervention: irinotecan + oxaliplatin (IROX) Comparison: irinotecan | ||||||
| Outcomes | Illustrative comparative risks* (95% CI) | Relative effect | No of participants | Quality of the evidence | Comments | |
| Assumed risk | Corresponding risk | |||||
| Irinotecan | IROX | |||||
| Overall survival | 600 per 1000 | 511 per 1000 (459 to 562) | HR 0.78 (0.67 to 0.90) | 627 (1 RCT) | + + + ‐ Moderate | Reason for downgrading: only 1 trial |
| Progression‐free survival | 900 per 1000 | 749 per 1000 (718 to 781) | HR 0.60 (0.55 to 0.66) | 627 (1 RCT) | + + + ‐ Moderate | Reason for downgrading: only 1 trial |
| Overall tumour response | 221 per 1000 | 658 per 1000 (422 to 1025) | RR 2.98 (1.91 to 4.64) | 627 (1 RCT) | + + + ‐ Moderate | Reason for downgrading: only 1 trial |
| Severe adverse effects | 594 per 1000 | 725 per 1000 (647 to 814) | RR 1.22 (1.09 to 1.37) | 627 (1 RCT) | + + + ‐ Moderate | Reason for downgrading: only 1 trial |
| *The basis for the assumed risk (median control group risk across studies) for survival outcomes is provided in footnotes. The corresponding risk (and its 95% confidence interval) is based on the assumed risk in the comparison group and the relative effect of the intervention (and its 95% CI). | ||||||
| GRADE Working Group grades of evidence | ||||||
| * Assumed risk in controls: 1‐year progression‐free survival rate = 10%; 1‐year overall survival rate = 40%. | ||||||
| Chemotherapy compared with best supportive care | ||||||
| Patient or population: people with metastatic CRC Settings: second‐line treatment Intervention: CTX Comparison: BSC | ||||||
| Outcomes | Illustrative comparative risks* (95% CI) | Relative effect | No of participants | Quality of the evidence | Comments | |
| Assumed risk | Corresponding risk | |||||
| BSC | CTX | |||||
| Overall survival | 850 per 1000 | 667 per 1000 (557 to 780) | HR 0.58 (0.43 to 0.80) | 279 (1 RCT) | + + + ‐ Moderate | Reason for downgrading: only 1 trial |
| Progression‐free survival | ‐ | ‐ | ‐ | ‐ | ‐ | ‐ |
| Overall tumour response | ‐ | ‐ | ‐ | ‐ | ‐ | ‐ |
| Severe adverse effects | 12 per 1000 | 14 per 1000 (12 to 17) | RR 1.19 (1.01 to 1.40) | 279 (1 RCT) | + + + ‐ Moderate | Reason for downgrading: only 1 trial |
| *The basis for the assumed risk (median control group risk across studies) for survival outcomes is provided in footnotes. The corresponding risk (and its 95% confidence interval) is based on the assumed risk in the comparison group and the relative effect of the intervention (and its 95% CI). | ||||||
| GRADE Working Group grades of evidence | ||||||
| * Assumed risk in controls: 1‐year overall survival rate = 15%. | ||||||
| FOLFIRI + targeted therapy compared with FOLFIRI | ||||||
| Patient or population: people with metastatic CRC Settings: second‐line treatment Intervention: FOLFIRI + targeted agents Comparison: FOLFIRI | ||||||
| Outcomes | Illustrative comparative risks* (95% CI) | Relative effect | No of participants | Quality of the evidence | Comments | |
| Assumed risk | Corresponding risk | |||||
| FOLFIRI | FOLFIRI + targeted agents | |||||
| Overall survival | 550 per 1000 | 488 per 1000 (459 to 516) | HR 0.84 (0.77 to 0.91) | 3335 (6 RCTs) | + + + + High | ‐ |
| Progression‐free survival | 850 per 1000 | 772 per 1000 (740 to 808) | HR 0.78 (0.71 to 0.87) | 3335 (6 RCTs) | + + + + High | ‐ |
| Overall tumour response | 112 per 1000 | 232 per 1000 (147 to 367) | RR 2.07 (1.31 to 3.28) | 3192 (6 RCTs) | + + + ‐ Moderate | Reason for downgrading: between‐study heterogeneity |
| Severe adverse effects | 494 per 1000 | 642 per 1000 (578 to 716) | RR 1.30 (1.17 to 1.45) | 3341 (6 RCTs) | + + + ‐ Moderate | Reason for downgrading: between‐study heterogeneity |
| *The basis for the assumed risk (median control group risk across studies) for survival outcomes is provided in footnotes. The corresponding risk (and its 95% confidence interval) is based on the assumed risk in the comparison group and the relative effect of the intervention (and its 95% CI). | ||||||
| GRADE Working Group grades of evidence | ||||||
| * Assumed risk in controls: 1‐year progression‐free survival rate = 15%; 1‐year overall survival rate = 45%. | ||||||
| FOLFOX + targeted therapy compared with FOLFOX | ||||||
| Patient or population: people with metastatic CRC Settings: second‐line treatment Intervention: FOLFOX + targeted agents Comparison: FOLFOX | ||||||
| Outcomes | Illustrative comparative risks* (95% CI) | Relative effect | No of participants | Quality of the evidence | Comments | |
| Assumed risk | Corresponding risk | |||||
| FOLFOX | FOLFOX + targeted agents | |||||
| Overall survival | 600 per 1000 | 553 per 1000 (453 to 654) | HR 0.92 (0.82 to 1.04) | 1432 (2 RCTs) | + ‐ ‐ ‐ Very low | Reasons for downgrading: results imprecision (95% CI crosses the null value) and inconsistency (high between‐study heterogeneity; overall survival findings not supported by progression‐free survival findings) |
| Progression‐free survival | 900 per 1000 | 809 per 1000 (705 to 892) | HR 0.76 (0.66 to 0.86) | 1432 (2 RCTs) | + + ‐ ‐ Low | Reasons for downgrading: results inconsistency (between‐study heterogeneity and progression‐free survival findings not conformed by overall survival data) |
| Overall tumour response | 86 per 1000 | 227 per 1000 (147 to 349) | RR 2.64 (1.71 to 4.06) | 578 (1 RCT) | + + + ‐ Moderate | Reason for downgrading: only 1 trial available |
| Severe adverse effects | 669 per 1000 | 803 per 1000 (756 to 856) | RR 1.20 (1.13 to 1.28) | 1414 (2 RCTs) | + + + + High | ‐ |
| *The basis for the assumed risk (median control group risk across studies) is provided in footnotes. The corresponding risk (and its 95% confidence interval) is based on the assumed risk in the comparison group and the relative effect of the intervention (and its 95% CI). | ||||||
| GRADE Working Group grades of evidence | ||||||
| * Assumed risk in controls: 1‐year progression‐free survival rate = 10%; 1‐year overall survival rate = 40%. | ||||||
| Irinotecan + targeted therapy compared with irinotecan | ||||||
| Patient or population: people with metastatic CRC Settings: second‐line treatment Intervention: irinotecan + targeted therapy Comparison: irinotecan | ||||||
| Outcomes | Illustrative comparative risks* (95% CI) | Relative effect | No of participants | Quality of the evidence | Comments | |
| Assumed risk | Corresponding risk | |||||
| Irinotecan | Irinotecan + targeted therapy | |||||
| Overall survival | 600 per 1000 | 596 per 1000 (553 to 603) | HR 0.99 (0.88 to 1.10) | 1758 (2 RCTs) | + + ‐ ‐ Low | Reasons for downgrading: results imprecision (95% CI crosses the null value) and inconsistency (overall survival findings not conformed by progression‐free survival data) |
| Progression‐free survival | 900 per 1000 | 805 per 1000 (771 to 838) | HR 0.71 (0.64 to 0.79) | 1758 (2 RCTs) | + + + ‐ Moderate | Reason for downgrading: results inconsistency (progression‐free survival findings not conformed by overall survival data) |
| Overall tumour response | 61 per 1000 | 206 per 1000 (154 to 276) | RR 3.38 (2.53 to 4.52) | 1758 (2 RCTs) | + + + + High | ‐ |
| Severe adverse effects | 425 per 1000 | 612 per 1000 (557 to 676) | RR 1.44 (1.31 to 1.59) | 1704 (2 RCTs) | + + + + High | ‐ |
| *The basis for the assumed risk (median control group risk across studies) for survival outcomes is provided in footnotes. The corresponding risk (and its 95% confidence interval) is based on the assumed risk in the comparison group and the relative effect of the intervention (and its 95% CI). | ||||||
| GRADE Working Group grades of evidence | ||||||
| * Assumed risk in controls: 1‐year progression‐free survival rate = 10%; 1‐year overall survival rate = 40%. | ||||||
| Acronym | Full name |
| 5FU | 5‐fluorouracil |
| Ang1 | Angiopoietin‐1 |
| Ang2 | Angiopoietin‐2 |
| CRC | Colorectal cancer |
| CTX | Chemotherapy |
| DR5 | Death receptor 5 |
| EGFR | Epithelial growth factor receptor |
| FOLFIRI | Fluorouracil + irinotecan + leucovorin |
| FOLFOX | Fluorouracil + oxaliplatin + leucovorin |
| HR | Hazard ratio |
| IGF1R | Insulin‐like growth factor 1 receptor |
| IRIS | S‐1 + irinotecan |
| i.v. | Intravenous |
| KRAS | Name of a gene whose product acts downstream of EGFR |
| ORR | Overall response rate |
| OS | Overall survival |
| PDGFR | Platelet derived growth factor receptor |
| PFS | Progression‐free survival |
| QoL | Quality of life |
| RCT | Randomized controlled trial |
| RR | Risk ratio |
| SAE | Severe adverse event |
| VEGF | Vascular endothelium growth factor |
| VEGFR | VEGF receptor |
| XELOX | Capecitabine + oxaliplatin |
| Name (abbreviation) | Class | Mechanism of action | Route of administration |
| 5‐fluorouracil (5FU) | Chemotherapy agent | Antimetabolite (pyrimidine analogue) inhibiting RNA synthesis and the enzyme thymidylate synthase (which converts dUMP to dTMP which in turn is needed for the synthesis of DNA) | Intravenous |
| Oxaliplatin | Chemotherapy agent | Alkylating agent binding covalently to DNA, which in turn inhibits DNA replication or causes DNA breaks | Intravenous |
| Irinotecan | Chemotherapy agent | Inhibits the enzyme topoisomerase‐I, which is involved in DNA replication or transcription | Intravenous |
| Mitomycin‐C | Chemotherapy agent | Alkylating agent binding covalently to DNA, which in turn inhibits DNA replication or causes DNA breaks | Intravenous |
| Raltitrexed | Chemotherapy agent | Antimetabolite that inhibits the enzyme thymidylate synthase (which converts dUMP to dTMP which in turn is needed for the synthesis of DNA) | Intravenous |
| Capecitabine | Chemotherapy agent | It is a prodrug of 5FU: one within the cells, it is transformed into the active drug | Oral |
| S‐1 | Chemotherapy agent | Antimetabolite (pyrimidine analogue) inhibiting RNA synthesis and the enzyme thymidylate synthase (which converts dUMP to dTMP which in turn is needed for the synthesis of DNA) | Oral |
| Bevacizumab | Targeted drug | Monoclonal antibody blocking VEGF (a ligand of VEGFR, a receptor involved in angiogenesis) | Intravenous |
| Cetuximab | Targeted drug | Monoclonal antibody blocking EGFR (a receptor involved in cell proliferation); best works against KRAS wild‐type tumours | Intravenous |
| Panituzumab | Targeted drug | Monoclonal antibody blocking EGFR (a receptor involved in cell proliferation); best works against KRAS wild‐type tumours | Intravenous |
| Conatumumab | Targeted drug | Monoclonal antibody activating DR5 (a receptor involved in cell apoptosis) | Intravenous |
| Ganitumab | Targeted drug | Monoclonal antibody blocking IGF1R (a receptor involved in cell proliferation) | Intravenous |
| Ramucirumab | Targeted drug | Monoclonal antibody blocking VEGFR (a receptor involved in angiogenesis) | Intravenous |
| Abituzumab | Targeted drug | Monoclonal antibody blocking integrin‐alphaV (a molecule involved in cell adhesion) | Intravenous |
| Trebananib | Targeted drug | Recombinant protein blocking Ang1 and Ang2 (ligands of Tie2, a receptor involved in angiogenesis) | Intravenous |
| Aflibercept | Targeted drug | Recombinant protein blocking VEGF (a ligand of VEGFR, a receptor involved in angiogenesis) | Intravenous |
| Vatalanib | Targeted drug | Small molecule inhibitor of multiple tyrosine kinases such as VEGFR (a receptor involved in angiogenesis) and PDGFR (a receptor involved in cell proliferation) | Oral |
| Gefitinib | Targeted drug | Small molecule inhibitor of tyrosine kinase EGFR (a receptor involved in cell proliferation); best works against EGFR mutated/KRAS wild‐type tumours | Oral |
| Ang1: angiopoietin‐1, Ang2: angiopoietin‐2; DR5: death receptor 5; dTMP: deoxythymidine monophosphate; dUMP: deoxyuridine monophosphate; IGF1R: insulin‐like growth factor 1 receptor; PDGFR: platelet‐derived growth factor receptor; RNA: ribonucleic acid; VEGF: vascular endothelial growth factor; VEGFR: VEGF receptor. | |||
| Study | Comparison | OS (HR, 95% CI) | PFS (HR, 95% CI) | ORR (RR, 95% CI) | SAE (RR, 95% CI) |
| Axitinib + FOLFIRI vs bevacizumab + FOLFIRI | 1.36 (0.82 to 2.26) | 1.27 (0.77 to 2.09) | 1.11 (0.55 to 2.22) | 2.09 (1.04 to 4.23) | |
| Axitinib + FOLFOX vs bevacizumab + FOLFOX | 0.69 (0.37 to 1.29) | 1.04 (0.55 to 1.97) | 0.97 (0.38 to 2.49) | 1.94 (0.74 to 5.12) | |
| Bevacizumab + chemotherapy vs chemotherapy | 0.81 (0.69 to 0.95) | 0.68 (0.58 to 0.80) | 1.38 (0.74 to 2.59) | 1.11 (0.99 to 1.24) | |
| Bevacizumab + FOLFIRI vs FOLFIRI | 0.78 (0.55 to 1.11) | 0.71 (0.52 to 0.97) | 1.67 (1.08 to 2.58) | 0.84 (0.67 to 1.05) | |
| FOLFIRI vs irinotecan | 0.72 (0.46 to 1.13) | 0.81 (0.52 to 1.26) | 1.02 (0.32 to 3.28) | 0.98 (0.63 to 1.52) | |
| Conatumumab + FOLFIRI vs FOLFIRI | 0.89 (0.54 to 1.47) | 0.69 (0.41 to 1.16) | 7.14 (0.91 to 55.96) | 1.53 (1.09 to 2.15) | |
| Ganitumab + FOLFIRI vs FOLFIRI | 1.27 (0.76 to 2.12) | 1.01 (0.61 to 1.67) | 4.00 (0.46 to 34.59) | 1.17 (0.80 to 1.71) | |
| Irinotecan vs best supportive care | 0.58 (0.43 to 0.80) | Not available | Not available | 1.19 (1.01 to 1.40) | |
| Abituzumab + cetuximab + irinotecan vs cetuximab + irinotecan | 0.83 (0.54 to 1.28) | 1.13 (0.78 to 1.64) | 1.04 (0.61 to 1.78) | 0.91 (0.60 to 1.38) | |
| Irinotecan schedule 1 vs irinotecan schedule 2 | 0.99 (0.73 to 1.34) | 1.06 (0.76 to 1.47) | Not available | 0.97 (0.81 to 1.17) | |
| Bevacizumab + FOLFOX vs FOLFOX | 0.75 (0.60 to 0.94) | 0.61 (0.48 to 0.78) | 2.64 (1.71 to 4.06) | 1.23 (1.10 to 1.38) | |
| Hyaluronan + irinotecan vs irinotecan | 0.93 (0.49 to 1.76) | 0.56 (0.33 to 0.95) | 3.00 (0.33 to 26.99) | 1.38 (0.87 to 2.20) | |
| FOLFIRI vs irinotecan | 1.31 (0.68 to 2.52) | 0.87 (0.48 to 1.58) | 0.96 (0.21 to 4.37) | 0.34 (0.18 to 0.62) | |
| Oxaliplatin + irinotecan vs irinotecan | 0.78 (0.67 to 0.90) | 0.60 (0.55 to 0.66) | 2.98 (1.91 to 4.64) | 1.22 (1.09 to 1.37) | |
| Panitumumab + FOLFIRI vs bevacizumab + FOLFIRI | 1.06 (0.75 to 1.50) | 1.01 (0.68 to 1.50) | 1.67 (0.98 to 2.85) | 1.40 (0.97 to 2.02) | |
| Bevacizumab schedule 1 + FOLFIRI vs bevacizumab schedule 2 + FOLFIRI | 1.08 (0.75 to 1.56) | 0.95 (0.75 to 1.20) | 1.04 (0.58 to 1.86) | 1.07 (0.92 to 1.26) | |
| FOLFOX vs irinotecan | 0.92 (0.79 to 1.07) | 0.72 (0.60 to 0.88) | 1.80 (1.26 to 2.56) | 1.13 (0.99 to 1.29) | |
| Panitumumab + bevacizumab + FOLFIRI vs FOLFIRI | 0.67 (0.47 to 0.96) | 0.58 (0.35 to 0.95) | 1.66 (1.03 to 2.67) | 1.60 (1.30 to 1.99) | |
| Bevacizumab + chemotherapy vs chemotherapy | 0.77 (0.56 to 1.06) | 0.70 (0.52 to 0.94) | 1.24 (0.70 to 2.19) | 1.05 (0.75 to 1.47) | |
| IRIS vs FOLFIRI | 0.91 (0.71 to 1.16) | 1.08 (0.86 to 1.34) | 1.13 (0.72 to 1.77) | 1.00 (0.84 to 1.18) | |
| Linifanib + FOLFOX vs bevacizumab + FOLFOX | 1.42 (0.94 to 2.15) | 1.45 (0.83 to 2.53) | 0.69 (0.37 to 1.29) | 1.24 (1.01 to 1.53) | |
| Panitumumab + FOLFIRI vs FOLFIRI | 0.85 (0.70 to 1.03) | 0.73 (0.59 to 0.90) | 3.44 (2.36 to 5.02) | 1.40 (1.23 to 1.60) | |
| Trebananib + FOLFIRI vs FOLFIRI | 0.90 (0.53 to 1.53) | 1.23 (0.81 to 1.87) | 13.02 (0.79 to 215.40) | 0.94 (0.73 to 1.22) | |
| Panitumumab vs cetuximab | 0.97 (0.84 to 1.12) | 1.00 (0.88 to 1.14) | 1.11 (0.87 to 1.42) | 1.06 (0.93 to 1.20) | |
| FOLFOX vs 5FU | Not available | 0.55 (0.43 to 0.70) | 5.22 (1.83 to 14.83) | 1.78 (1.43 to 2.22) | |
| Oxaliplatin vs 5FU | Not available | 1.11 (0.93 to 1.33) | 1.29 (0.35 to 4.72) | 1.14 (0.88 to 1.48) | |
| XELOX vs FOLFOX | 1.02 (0.86 to 1.22) | 0.97 (0.83 to 1.13) | 1.11 (0.60 to 2.07) | 0.75 (0.68 to 0.82) | |
| Irinotecan vs 5FU | 0.69 (0.51 to 0.94) | 0.69 (0.49 to 0.97) | 2.90 (1.27 to 6.62) | 1.28 (1.05 to 1.55) | |
| Mitomycin + oxaliplatin vs mitomycin + irinotecan | Not available | Not available | 1.32 (0.47 to 3.71) | 1.62 (0.93 to 2.83) | |
| Panitumumab + irinotecan vs irinotecan | 1.01 (0.83 to 1.23) | 0.78 (0.64 to 0.95) | 2.93 (1.97 to 4.35) | 1.51 (1.24 to 1.84) | |
| Single‐dose irinotecan vs fractionated irinotecan | Not available | Not available | 0.62 (0.11 to 3.53) | 0.97 (0.72 to 1.30) | |
| Cetuximab + irinotecan vs irinotecan | 0.98 (0.85 to 1.11) | 0.69 (0.62 to 0.78) | 3.94 (2.62 to 5.92) | 1.42 (1.28 to 1.59) | |
| Ramucirumab + FOLFIRI vs FOLFIRI | 0.84 (0.73 to 0.97) | 0.79 (0.70 to 0.90) | 1.07 (0.79 to 1.47) | 1.15 (0.97 to 1.36) | |
| Single‐dose irinotecan vs fractionated irinotecan | 0.78 (0.60 to 1.01) | 0.75 (0.53 to 1.06) | 0.87 (0.45 to 1.66) | 0.98 (0.82 to 1.17) | |
| Vatalanib + FOLFOX vs FOLFOX | 1.00 (0.87 to 1.15) | 0.83 (0.71 to 0.97) | Not available | 1.19 (1.10 to 1.28) | |
| Aflibercept + FOLFIRI vs FOLFIRI | 0.82 (0.71 to 0.94) | 0.76 (0.66 to 0.87) | 1.78 (1.32 to 2.39) | 1.34 (1.24 to 1.43) | |
| Gefitinib + raltitrexed vs raltitrexed | 0.99 (0.55 to 1.78) | 1.23 (0.81 to 1.87) | 1.00 (0.15 to 6.74) | 1.67 (0.43 to 6.49) | |
| CI: confidence interval; FOLFIRI: fluorouracil + irinotecan + leucovorin; FOLFOX: fluorouracil + oxaliplatin + leucovorin; HR: hazard ratio; ORR: overall response rate; OS: overall survival; PFS: progression‐free survival; RR: risk ratio; SAE: severe adverse effects. | |||||
| Outcome or subgroup title | No. of studies | No. of participants | Statistical method | Effect size |
| 1 Overall survival (OS)_modern chemotherapy (CTX) vs 5‐fluorouracil (5FU) Show forest plot | 1 | Hazard Ratio (Random, 95% CI) | 0.69 [0.51, 0.94] | |
| 2 Progression‐free survival (PFS)_modern CTX vs 5FU Show forest plot | 3 | Hazard Ratio (Fixed, 95% CI) | 0.84 [0.73, 0.96] | |
| 2.1 FOLFOX irinotecan (irino) | 2 | Hazard Ratio (Fixed, 95% CI) | 0.59 [0.49, 0.73] | |
| 2.2 Oxaliplatin | 1 | Hazard Ratio (Fixed, 95% CI) | 1.11 [0.93, 1.33] | |
| 3 Overall response rate (ORR)_modern CTX vs 5FU Show forest plot | 3 | 866 | Risk Ratio (IV, Fixed, 95% CI) | 2.96 [1.66, 5.27] |
| 4 Serious adverse events (SAE)_modern CTX vs 5FU Show forest plot | 3 | 843 | Risk Ratio (IV, Fixed, 95% CI) | 1.39 [1.22, 1.58] |
| 5 OS_irino combination (combo) Show forest plot | 6 | Hazard Ratio (Random, 95% CI) | 0.91 [0.79, 1.04] | |
| 6 PFS_irino combo Show forest plot | 6 | Hazard Ratio (Random, 95% CI) | 0.68 [0.60, 0.76] | |
| 7 ORR_irino combo Show forest plot | 6 | 2577 | Risk Ratio (IV, Random, 95% CI) | 2.87 [2.10, 3.93] |
| 8 SAE_irino combo Show forest plot | 6 | 2510 | Risk Ratio (IV, Random, 95% CI) | 1.18 [0.96, 1.45] |
| 9 OS_bevacizumab (beva) combo Show forest plot | 4 | Hazard Ratio (Random, 95% CI) | 0.79 [0.70, 0.88] | |
| 10 PFS_beva combo Show forest plot | 4 | Hazard Ratio (Random, 95% CI) | 0.67 [0.60, 0.75] | |
| 11 ORR_beva combo Show forest plot | 4 | 1714 | Risk Ratio (IV, Random, 95% CI) | 1.72 [1.23, 2.43] |
| 12 SAE_beva combo Show forest plot | 4 | 1708 | Risk Ratio (IV, Random, 95% CI) | 1.07 [0.93, 1.25] |
| 13 OS_FOLFIRI targeted Show forest plot | 7 | Hazard Ratio (Random, 95% CI) | 0.84 [0.77, 0.91] | |
| 14 PFS_FOLFIRI targeted Show forest plot | 7 | Hazard Ratio (Random, 95% CI) | 0.78 [0.71, 0.87] | |
| 15 ORR_FOLFIRI targeted Show forest plot | 7 | 3192 | Risk Ratio (IV, Random, 95% CI) | 2.07 [1.31, 3.28] |
| 16 SAE_FOLFIRI targeted Show forest plot | 7 | 3341 | Risk Ratio (IV, Random, 95% CI) | 1.30 [1.17, 1.45] |
| 17 OS_FOLFOX targeted Show forest plot | 2 | Hazard Ratio (Fixed, 95% CI) | 0.92 [0.82, 1.04] | |
| 18 PFS_FOLFOX targeted Show forest plot | 2 | Hazard Ratio (Fixed, 95% CI) | 0.76 [0.66, 0.86] | |
| 19 ORR_FOLFOX targeted Show forest plot | 1 | 578 | Risk Ratio (IV, Random, 95% CI) | 2.64 [1.71, 4.06] |
| 20 SAE_FOLFOX targeted Show forest plot | 2 | 1414 | Risk Ratio (IV, Fixed, 95% CI) | 1.20 [1.13, 1.28] |
| 21 OS_irino fraction Show forest plot | 2 | Hazard Ratio (Fixed, 95% CI) | 0.86 [0.71, 1.05] | |
| 22 PFS_irino fraction Show forest plot | 2 | Hazard Ratio (Fixed, 95% CI) | 0.90 [0.71, 1.14] | |
| 23 ORR_irino fraction Show forest plot | 2 | 205 | Risk Ratio (IV, Fixed, 95% CI) | 0.83 [0.45, 1.53] |
| 24 SAE_irino fraction Show forest plot | 3 | 489 | Risk Ratio (IV, Fixed, 95% CI) | 0.97 [0.87, 1.10] |
| 25 OS_FOLFIRI + beva vs other targeted Show forest plot | 2 | Hazard Ratio (Fixed, 95% CI) | 1.15 [0.86, 1.53] | |
| 26 PFS_FOLFIRI + beva vs other targeted Show forest plot | 2 | Hazard Ratio (Fixed, 95% CI) | 1.10 [0.81, 1.50] | |
| 27 ORR_FOLFIRI + beva vs other targeted Show forest plot | 2 | 267 | Risk Ratio (IV, Fixed, 95% CI) | 1.43 [0.94, 2.19] |
| 28 SAE_FOLFIRI + beva vs other targeted Show forest plot | 2 | 279 | Risk Ratio (IV, Fixed, 95% CI) | 1.53 [1.10, 2.11] |
| 29 OS_FOLFOX + beva vs other targeted Show forest plot | 2 | Hazard Ratio (Fixed, 95% CI) | 1.14 [0.81, 1.61] | |
| 30 PFS_FOLFOX + beva vs other targeted Show forest plot | 2 | Hazard Ratio (Fixed, 95% CI) | 1.26 [0.83, 1.91] | |
| 31 ORR_FOLFOX + beva vs other targeted Show forest plot | 2 | 170 | Risk Ratio (IV, Fixed, 95% CI) | 0.77 [0.46, 1.29] |
| 32 SAE_FOLFOX + beva vs other targeted Show forest plot | 2 | 169 | Risk Ratio (IV, Fixed, 95% CI) | 1.27 [1.03, 1.55] |