Anticonvulsants for cocaine dependence
Información
- DOI:
- https://doi.org/10.1002/14651858.CD006754.pub4Copiar DOI

- Base de datos:
-
- Cochrane Database of Systematic Reviews
- Versión publicada:
-
- 17 abril 2015see what's new
- Tipo:
-
- Intervention
- Etapa:
-
- Review
- Grupo Editorial Cochrane:
-
Grupo Cochrane de Alcohol y drogas
- Copyright:
-
- Copyright © 2015 The Cochrane Collaboration. Published by John Wiley & Sons, Ltd.
Cifras del artículo
Altmetric:
Citado por:
Autores
Contributions of authors
Amato wrote the background, Pani and Minozzi helped with suggestions and comments and Marina Davoli supervised. Amato inspected the search hits by reading titles and abstracts. Each potentially relevant study identified in the search was obtained in full text and assessed for inclusion independently by two review authors (Minozzi, Amato). Doubts were resolved by discussion between all review authors. Minozzi assessed the quality of the included studies, and Amato and Minozzi extracted data. The other review authors are the former authors of a review of carbamazepine for cocaine dependence, which now is joined with this review.
For the update, Minozzi and Cinquini inspected the search hits by reading titles and abstracts. Each potentially relevant study identified in the search was obtained in full text and assessed for inclusion independently by two review authors (Minozzi, Cinquinii). Pani supervised. Minozzi and Cinquini assessed risk of bias and extracted data. Pani and Amato supervised and contributed to the discussion and the conclusions.
Sources of support
Internal sources
-
Department of Epidemiology, ASL RM E, Italy.
External sources
-
No sources of support supplied
Declarations of interest
None.
Acknowledgements
We would like to thank Zuzana Mitrova for helping with search strategies and for facilitating the editorial process, and Professor Robert Ali, who is the contact editor for this review.
Version history
| Published | Title | Stage | Authors | Version |
| 2015 Apr 17 | Anticonvulsants for cocaine dependence | Review | Silvia Minozzi, Michela Cinquini, Laura Amato, Marina Davoli, Michael F Farrell, Pier Paolo Pani, Simona Vecchi | |
| 2015 Mar 03 | Anticonvulsants for cocaine dependence | Review | Silvia Minozzi, Laura Amato, Marina Davoli, Michael F Farrell, Anelise ARL Lima Reisser, Pier Paolo Pani, Mauricio Silva de Lima, Bernardo GO Soares, Simona Vecchi | |
| 2008 Apr 23 | Anticonvulsants for cocaine dependence | Review | Silvia Minozzi, Laura Amato, Marina Davoli, Michael F Farrell, Anelise ARL Lima Reisser, Pier Paolo Pani, Mauricio Silva de Lima, Bernardo GO Soares, Simona Vecchi | |
| 2007 Oct 17 | Anticonvulsants for cocaine dependence | Protocol | M Minozzi, Laura Amato, Pier Paolo Pani, Simona Vecchi, Marina Davoli, Silvia Minozzi | |
Keywords
MeSH
Medical Subject Headings (MeSH) Keywords
Medical Subject Headings Check Words
Humans;
PICO


Study flow diagram of the updated version.

Risk of bias graph: review authors' judgements about each risk of bias item presented as percentages across all included studies.

Risk of bias summary: review authors' judgements about each risk of bias item for each included study.
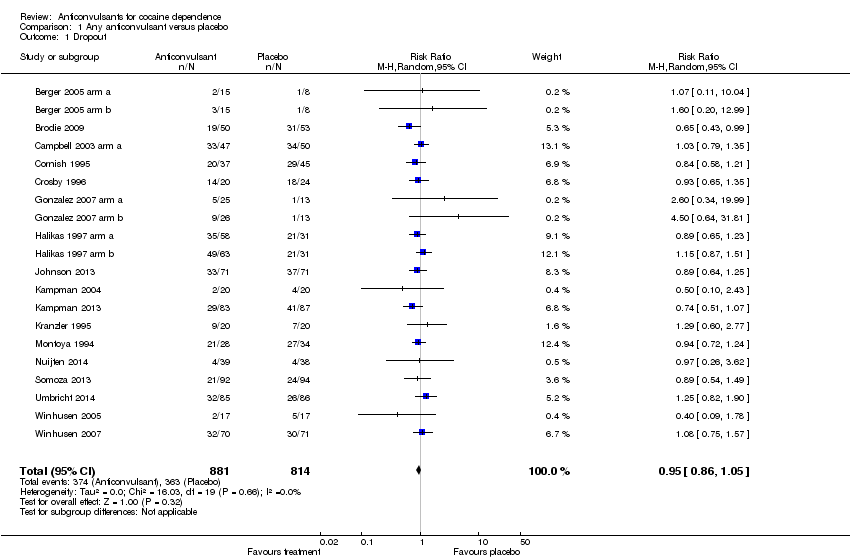
Comparison 1 Any anticonvulsant versus placebo, Outcome 1 Dropout.

Comparison 1 Any anticonvulsant versus placebo, Outcome 2 Use of cocaine (self reported or objective).
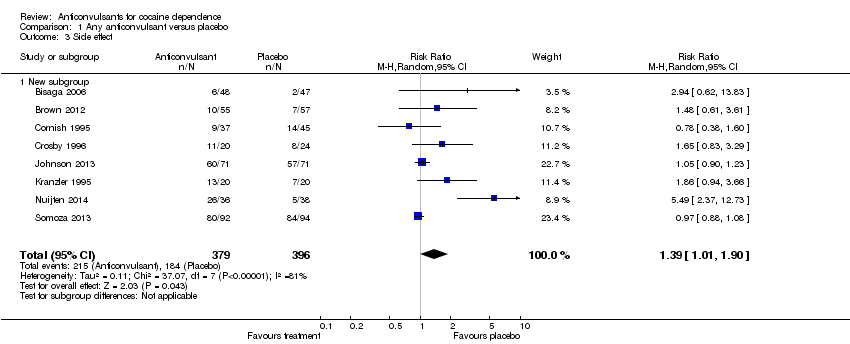
Comparison 1 Any anticonvulsant versus placebo, Outcome 3 Side effect.

Comparison 1 Any anticonvulsant versus placebo, Outcome 4 Craving.

Comparison 1 Any anticonvulsant versus placebo, Outcome 5 Severity of dependence (ASI).

Comparison 1 Any anticonvulsant versus placebo, Outcome 6 Severity of dependence (CGI‐O).

Comparison 1 Any anticonvulsant versus placebo, Outcome 7 Depression (HAM‐D).
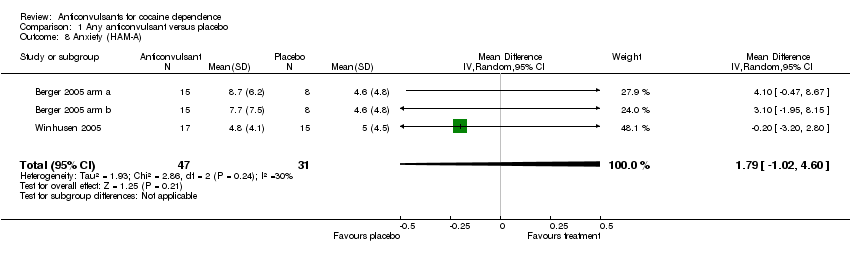
Comparison 1 Any anticonvulsant versus placebo, Outcome 8 Anxiety (HAM‐A).
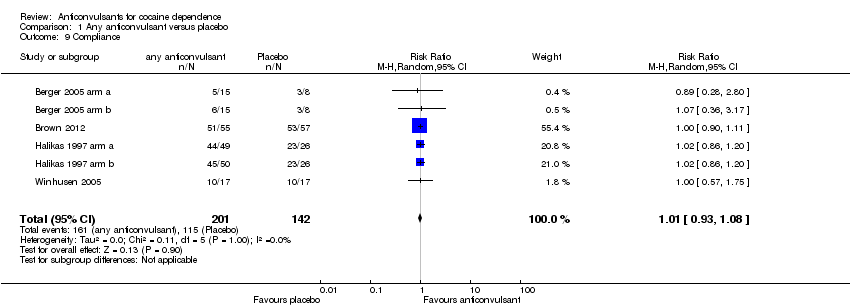
Comparison 1 Any anticonvulsant versus placebo, Outcome 9 Compliance.
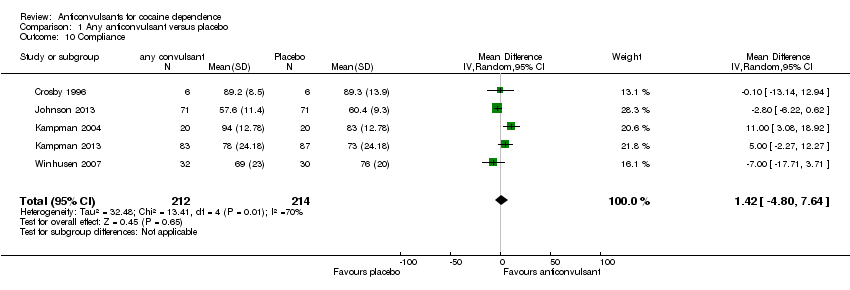
Comparison 1 Any anticonvulsant versus placebo, Outcome 10 Compliance.

Comparison 2 Single anticonvulsant versus placebo, Outcome 1 Dropout.

Comparison 2 Single anticonvulsant versus placebo, Outcome 2 Use of cocaine (self reported or objective).

Comparison 2 Single anticonvulsant versus placebo, Outcome 3 Side effects.
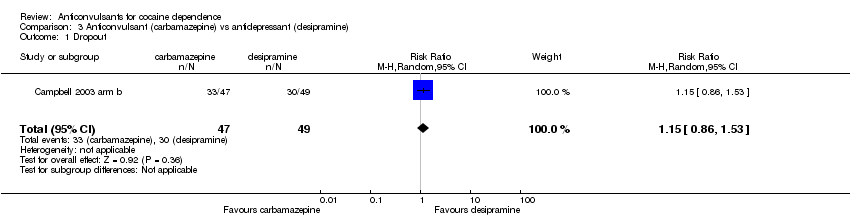
Comparison 3 Anticonvulsant (carbamazepine) vs antidepressant (desipramine), Outcome 1 Dropout.
| Any anticonvulsant versus placebo for cocaine dependence | ||||||
| Patient or population: patients with cocaine dependence | ||||||
| Outcomes | Illustrative comparative risks* (95% CI) | Relative effect | Number of participants | Quality of the evidence | Comments | |
| Assumed risk | Corresponding risk | |||||
| Control | Any anticonvulsant versus placebo | |||||
| Dropout | 45 per 100 | 42 per 100 | RR 0.95 | 1695 | ⊕⊕⊕⊝ | |
| Use of cocaine (self reported or objective) | 77 per 100 | 71 per 100 | RR 0.92 | 867 | ⊕⊕⊕⊝ | |
| Side effect | 46 per 100 | 65 per 100 | RR 1.39 | 775 | ⊕⊕⊝⊝ | |
| Craving (BSCS) | The mean craving (bscs) in the intervention groups was | 428 | ⊕⊕⊝⊝ | |||
| *The basis for the assumed risk (e.g. median control group risk across studies) is provided in footnotes. The corresponding risk (and its 95% confidence interval) is based on the assumed risk in the comparison group and the relative effect of the intervention (and its 95% CI). | ||||||
| GRADE (Grades of Recommendation, Assessment, Development and Evaluation) Working Group grades of evidence. | ||||||
| 1 Range 8 ‐ 24 weeks | ||||||
| Outcome or subgroup title | No. of studies | No. of participants | Statistical method | Effect size |
| 1 Dropout Show forest plot | 20 | 1695 | Risk Ratio (M‐H, Random, 95% CI) | 0.95 [0.86, 1.05] |
| 2 Use of cocaine (self reported or objective) Show forest plot | 11 | 867 | Risk Ratio (M‐H, Random, 95% CI) | 0.92 [0.84, 1.02] |
| 3 Side effect Show forest plot | 8 | 775 | Risk Ratio (M‐H, Random, 95% CI) | 1.39 [1.01, 1.90] |
| 3.1 New subgroup | 8 | 775 | Risk Ratio (M‐H, Random, 95% CI) | 1.39 [1.01, 1.90] |
| 4 Craving Show forest plot | 8 | 428 | Std. Mean Difference (IV, Random, 95% CI) | ‐0.25 [‐0.59, 0.09] |
| 5 Severity of dependence (ASI) Show forest plot | 6 | 290 | Mean Difference (IV, Random, 95% CI) | 0.03 [‐0.02, 0.08] |
| 6 Severity of dependence (CGI‐O) Show forest plot | 5 | 277 | Mean Difference (IV, Random, 95% CI) | ‐0.11 [‐0.42, 0.20] |
| 7 Depression (HAM‐D) Show forest plot | 3 | 80 | Mean Difference (IV, Random, 95% CI) | 1.80 [‐0.59, 4.19] |
| 8 Anxiety (HAM‐A) Show forest plot | 3 | 78 | Mean Difference (IV, Random, 95% CI) | 1.79 [‐1.02, 4.60] |
| 9 Compliance Show forest plot | 6 | 343 | Risk Ratio (M‐H, Random, 95% CI) | 1.01 [0.93, 1.08] |
| 10 Compliance Show forest plot | 5 | 426 | Mean Difference (IV, Random, 95% CI) | 1.42 [‐4.80, 7.64] |
| Outcome or subgroup title | No. of studies | No. of participants | Statistical method | Effect size |
| 1 Dropout Show forest plot | 19 | Risk Ratio (M‐H, Random, 95% CI) | Subtotals only | |
| 1.1 Carbamazepine vs placebo | 6 | 464 | Risk Ratio (M‐H, Random, 95% CI) | 0.99 [0.87, 1.13] |
| 1.2 Tiagabine vs placebo | 3 | 213 | Risk Ratio (M‐H, Random, 95% CI) | 1.01 [0.56, 1.82] |
| 1.3 Gabapentin vs placebo | 2 | 62 | Risk Ratio (M‐H, Random, 95% CI) | 2.78 [0.67, 11.61] |
| 1.4 Phenytoin vs placebo | 1 | 44 | Risk Ratio (M‐H, Random, 95% CI) | 0.93 [0.65, 1.35] |
| 1.5 Lamotrigine vs placebo | 1 | 23 | Risk Ratio (M‐H, Random, 95% CI) | 1.07 [0.11, 10.04] |
| 1.6 Topiramate vs placebo | 4 | 557 | Risk Ratio (M‐H, Random, 95% CI) | 0.92 [0.73, 1.16] |
| 1.7 Vigabatrin vs placebo | 2 | 289 | Risk Ratio (M‐H, Random, 95% CI) | 0.74 [0.53, 1.02] |
| 2 Use of cocaine (self reported or objective) Show forest plot | 12 | Risk Ratio (M‐H, Random, 95% CI) | Subtotals only | |
| 2.1 Carbamazepine vs placebo | 4 | 214 | Risk Ratio (M‐H, Random, 95% CI) | 0.95 [0.70, 1.28] |
| 2.2 Tiagabine vs placebo | 1 | 50 | Risk Ratio (M‐H, Random, 95% CI) | 0.89 [0.61, 1.30] |
| 2.3 Gabapentin vs placebo | 2 | 146 | Risk Ratio (M‐H, Random, 95% CI) | 1.07 [0.87, 1.31] |
| 2.4 Phenytoin vs placebo | 1 | 12 | Risk Ratio (M‐H, Random, 95% CI) | 0.33 [0.05, 2.37] |
| 2.5 Topiramate vs placebo | 2 | 210 | Risk Ratio (M‐H, Random, 95% CI) | 1.19 [0.48, 2.98] |
| 2.6 Vigabatrin vs placebo | 2 | 289 | Risk Ratio (M‐H, Random, 95% CI) | 0.88 [0.69, 1.13] |
| 3 Side effects Show forest plot | 7 | Risk Ratio (M‐H, Random, 95% CI) | Subtotals only | |
| 3.1 Carbamazepine vs placebo | 2 | 122 | Risk Ratio (M‐H, Random, 95% CI) | 1.21 [0.52, 2.86] |
| 3.2 Tiagabine vs placebo | 0 | 0 | Risk Ratio (M‐H, Random, 95% CI) | 0.0 [0.0, 0.0] |
| 3.3 Gabapentin vs placebo | 1 | 95 | Risk Ratio (M‐H, Random, 95% CI) | 2.94 [0.62, 13.83] |
| 3.4 Phenytoin vs placebo | 1 | 44 | Risk Ratio (M‐H, Random, 95% CI) | 1.65 [0.83, 3.29] |
| 3.5 Topiramate vs placebo | 2 | 216 | Risk Ratio (M‐H, Random, 95% CI) | 2.42 [0.27, 21.87] |
| 3.6 Vigabatrin vs placebo | 1 | 186 | Risk Ratio (M‐H, Random, 95% CI) | 0.97 [0.88, 1.08] |
| Outcome or subgroup title | No. of studies | No. of participants | Statistical method | Effect size |
| 1 Dropout Show forest plot | 1 | 96 | Risk Ratio (M‐H, Random, 95% CI) | 1.15 [0.86, 1.53] |