Profilaxis con fármacos antiinflamatorios no esteroideos para la prevención del edema macular después de la cirugía de cataratas
Resumen
Antecedentes
El edema macular (EM) es la acumulación de líquido extracelular en la retina central (la mácula). Puede ocurrir después de la cirugía de cataratas y puede dar lugar a un resultado visual deficiente, a la reducción de la agudeza visual y a la distorsión de la visión central. El EM a menudo desaparece espontáneamente con resolución espontánea, aunque una proporción pequeña de pacientes con EM crónico persistente puede ser difícil de tratar. El edema crónico puede dar lugar a la formación de espacios quísticos en la retina denominado “edema macular cistoide” (EMC). Los fármacos antiinflamatorios no esteroideos (AINE) se usan comúnmente en la cirugía de cataratas y pueden disminuir las perspectivas de desarrollar EM.
Objetivos
El objetivo de esta revisión es responder a la pregunta: ¿hay evidencia para apoyar el uso profiláctico de AINE tópicos como agregado de, o en lugar de, los corticosteroides tópicos de forma postoperatoria para reducir la incidencia del edema macular (EM) y la morbilidad visual asociada?
Métodos de búsqueda
Se buscó en varias bases de datos electrónicas, incluyendo CENTRAL, MEDLINE y Embase. Fecha de la última búsqueda 2 septiembre 2016.
Criterios de selección
Se incluyeron ensayos controlados aleatorizados (ECA) en los cuales los participantes adultos habían sido sometidos a cirugía de cataratas relacionada con la edad. Se incluyó a participantes de forma independiente del riesgo inicial de EM, en particular se incluyó a pacientes con diabetes y uveítis. Se incluyeron ensayos de los AINE tópicos preoperatorios o postoperatorios junto con corticosteroides tópicos postoperatorios. El comparador fueron los corticosteroides tópicos postoperatorios solos. Una comparación secundaria fueron los AINE tópicos preoperatorios o postoperatorios solos versus corticosteroides tópicos postoperatorios solos.
Obtención y análisis de los datos
Dos autores de la revisión, de forma independiente, seleccionaron los estudios para su inclusión, evaluaron el riesgo de sesgo y extrajeron los datos utilizando métodos estándar previstos por Cochrane. Se agruparon los datos mediante el modelo de efectos aleatorios. Se calificó la certeza de la evidencia utilizando GRADE y se consideró lo siguiente: el riesgo de sesgo de los estudios incluidos, la precisión del cálculo del efecto, la consistencia de los efectos entre los estudios, la posibilidad de generalizar la medida de resultado y el sesgo de publicación.
Resultados principales
Se identificaron 34 estudios que se realizaron en las Américas, Europa, la región del Mediterráneo Oriental y Asia Sudoriental. Más de 5000 pacientes fueron asignados al azar en estos ensayos. La mayoría de los estudios incluyeron un ojo por participante; un pequeño subconjunto (cuatro ensayos) incluyó una proporción de pacientes con cirugía bilateral. Veintiocho estudios compararon AINE más corticosteroides con corticosteroides solos. Seis estudios compararon AINE con corticosteroides. Se utilizaron diversos AINE, que incluyeron ketorolaco, diclofenaco, nepafenaco, indometacina, bromfenaco, flurbiprofeno y pranopfeno. El seguimiento varió de uno a 12 meses. En general, los estudios fueron mal informados. Ninguno de los estudios se consideró en riesgo bajo de sesgo en todos los dominios. Seis estudios fueron financiados por la industria, siete estudios fueron financiados por fuentes diferentes de la industria, y el resto de los estudios no informó la fuente de financiación.
Hubo evidencia de certeza baja de que los pacientes que recibieron AINE tópicos en combinación con corticosteroides pueden presentar un riesgo menor de visión deficiente debido al EM tres meses después de la cirugía de cataratas en comparación con los pacientes que recibieron corticosteroides solos (riesgos relativos [RR] 0,41; intervalo de confianza [IC] del 95%: 0,23 a 0,76; ojos = 1360; estudios = 5; I2 = 5%). Se consideró que se trataba de evidencia de baja certeza debido al riesgo de sesgo en los estudios incluidos y a su falta de direccionalidad, ya que el alcance de la pérdida visual no siempre era claro. Sólo un estudio informó una visión deficiente debido al EM a los 12 meses; esta evidencia se consideró de muy baja certeza debido a que hubo sólo dos eventos. La calidad de vida sólo se informó en uno de los 34 estudios que comparaban los AINE más corticosteroides versus corticosteroides solos, y no se informó de manera completa, salvo para comentar la falta de diferencias entre los grupos. Hubo evidencia de un riesgo reducido de EM con los AINE tres meses después de la intervención quirúrgica, aunque la misma se consideró de baja certeza debido al riesgo de sesgo y al sesgo de publicación (RR 0,40; IC del 95%: 0,32 a 0,49; ojos = 3638; estudios = 21). Hubo evidencia inconsistente sobre el grosor de la retina central a los tres meses (I2 = 87%). Los resultados variaron de ‐30,9 µm a favor de los AINE más corticosteroides a 7,44 µm a favor de los corticosteroides solos. De igual manera, los datos sobre la agudeza visual mejor corregida (AVMC) fueron inconsistentes, aunque nueve de diez ensayos que informaron este resultado encontraron diferencias entre los grupos en la agudeza visual de menos de 0,1 logMAR.
Ninguno de los seis estudios que compararon los AINE solos con corticosteroides informó sobre una visión deficiente debido al EM a los tres o 12 meses. Hubo evidencia de certeza baja de que el espesor de la retina central fue inferior en el grupo de AINE tres meses más tarde (diferencia de medias [DM] ‐22,64 µm, IC del 95%: ‐38,86 a ‐6,43; ojos = 121; estudios = 2). Cinco estudios informaron sobre el EM y mostraron un riesgo reducido con los AINE, aunque esta evidencia se consideró de baja certeza (RR 0,27; IC del 95%: 0,18 a 0,41; ojos = 520). Tres estudios informaron la AVMC tres meses más tarde, y los resultados de estos ensayos fueron inconsistentes aunque los tres estudios encontraron diferencias de menos de 0,1 logMAR entre los grupos.
No se observó ningún evento adverso grave ‐ la principal observación consistente fue la sensación de ardor o picor con el uso de AINE.
Conclusiones de los autores
La administración de AINE tópicos puede reducir el riesgo de desarrollar edema macular después de la cirugía de cataratas, aunque es posible que los cálculos actuales sean exagerados en cuanto al tamaño de esta reducción. No está claro el grado al cual esta reducción tiene un impacto sobre la función visual y la calidad de vida de los pacientes. Hay poca evidencia para sugerir algún efecto importante sobre la visión después de la intervención quirúrgica. Por lo tanto, no se conoce el valor de agregar AINE tópicos a los corticosteroides, o de utilizarlos como una alternativa a los corticosteroides tópicos, con objeto de reducir el riesgo de un resultado visual deficiente después de la cirugía de catarata. Los ensayos futuros deben considerar la incertidumbre clínica restante de si los AINE tópicos profilácticos son beneficiosos, en particular, en lo que se refiere al seguimiento a más largo plazo (al menos a los 12 meses) y deben ser lo suficientemente grandes para detectar una reducción del riesgo del resultado de mayor interés para los pacientes, es decir, el edema macular crónico que da lugar a la pérdida de visión.
PICOs
Resumen en términos sencillos
Fármacos antiinflamatorios no esteroideos (AINE) profilácticos para la prevención del edema macular después de la cirugía de cataratas
¿Cuál era el objetivo de esta revisión?
El objetivo de esta revisión Cochrane fue determinar si las gotas para ojos de AINE pueden prevenir una complicación de la cirugía de cataratas que pone en riesgo la visión (edema en la parte posterior del ojo, conocido como edema macular). Los investigadores Cochrane recopilaron y analizaron todos los estudios relevantes para responder a esta pregunta y encontraron 34 estudios.
Mensajes clave
Sólo hay evidencia de certeza baja para apoyar la administración de gotas para ojos de AINE para prevenir el edema macular que afecta la visión después de la cirugía de cataratas.
¿Qué se estudió en la revisión?
Hay una lente clara en el ojo que centra la luz en la parte posterior del ojo. A medida que la persona envejece, esta lente puede volverse turbia. Una lente turbia se conoce como catarata. Los médicos pueden eliminar la catarata y reemplazarla con una lente artificial. Por lo general, esta cirugía es muy exitosa. Ocasionalmente, los pacientes sometidos a cirugía de cataratas pueden desarrollar un edema en la parte posterior del ojo después de la cirugía. Este edema es conocido como edema macular. Generalmente mejora por sí solo, aunque si persiste puede dar lugar a una visión deficiente.
Los AINE son una medicación que puede tratar la inflamación. Podrían disminuir las perspectivas de que suceda este edema. Los AINE estudiados en esta revisión fueron gotas para ojos.
¿Cuáles son los principales resultados de la revisión?
Los autores de la revisión encontraron 34 estudios relevantes. Estos estudios se realizaron en todas las partes del mundo, incluyendo las Américas, Europa, la región del Mediterráneo oriental y Asia sudoriental. La mayoría (28) de estos estudios compararon AINE combinados con corticosteroides versus corticosteroides solos. Algunos de los estudios (6) compararon AINE con corticosteroides solos. Se utilizaron diversos AINE, que incluyeron ketorolaco, diclofenaco, nepafenaco, indometacina, bromfenaco, pranopfeno y flurbiprofeno. Los pacientes que participaron en estos ensayos tuvieron un seguimiento de entre uno y 12 meses. La mayoría de los estudios sólo realizó un seguimiento de dos meses o menos. Seis estudios fueron financiados por la industria, siete estudios fueron financiados por fuentes diferentes de la industria, y el resto de los estudios no informó la fuente de financiación.
Hubo evidencia de certeza baja de que los AINE disminuyen las perspectivas de una visión deficiente debido al edema macular tres meses después de la cirugía de cataratas. Sólo un estudio informó una visión deficiente debido al edema macular a los 12 meses; esta evidencia se consideró de muy baja certeza.
La administración de AINE se asoció con un riesgo reducido de edema macular, aunque los autores de la revisión juzgaron esta evidencia como de baja certeza.
Se observaron resultados inconsistentes para algunas mediciones del edema macular, como el espesor del tejido en la parte posterior del ojo (espesor de la retina central) tres meses después de la intervención quirúrgica. Esta medición no fue informada por ningún estudio a los 12 meses después de la intervención quirúrgica.
De igual manera, se observaron resultados inconsistentes para la medición de la visión (agudeza visual) aunque la mayoría de los estudios encontró diferencias pequeñas entre los pacientes que recibieron AINE y los pacientes que no recibieron AINE.
Sólo un estudio informó la calidad de vida, y el mismo sugirió un impacto pequeño de los AINE en la calidad de vida.
Los eventos adversos consistieron principalmente en una sensación de ardor o picor.
¿Cuál es el grado de actualización de esta revisión?
Los autores de la revisión buscaron estudios que se habían publicado hasta 2 septiembre 2016.
Authors' conclusions
Summary of findings
| NSAIDs plus steroids compared with steroids for the prevention of macular oedema after cataract surgery | ||||||
| Patient or population: people having cataract surgery Setting: eye hospital | ||||||
| Outcomes | Anticipated absolute effects* (95% CI) | Relative effect | № of participants | Certainty of the evidence | Comments | |
| Risk with steroids | Risk with NSAIDs plus steroids | |||||
| Poor vision due to MO at 3 months after surgery | 74 per 1000 | 30 per 1000 | RR 0.41 | 1360 | ⊕⊕⊝⊝ | ‐ |
| Poor vision due to MO at 12 months after surgery | 20 per 1000 | 26 per 1000 | RR 1.32 | 88 | ⊕⊝⊝⊝ | ‐ |
| Quality of life at 3 months after surgery | See comment | ‐ | ‐ | 74 (1 RCT) | ‐ | Reported in 1 study only using COMTOL questionnaire. Data not fully reported but no significant differences in terms of quality of life, compliance and satisfaction scores. |
| Central retinal thickness at 3 months after surgery; | See comment | ‐ | ‐ | 1021 | ‐ | Trial results were inconsistent (I2 = 87%). Results ranged from ‐30.9 microns in favour of NSAIDs plus steroids to +7.44 microns in favour of steroids alone. |
| Adverse effects | See comment | ‐ | ‐ | (18 RCTs) | ‐ | In general, no major adverse effects were noted. The main consistent observation was burning or stinging sensation with use of NSAID drops. |
| MO at 3 months after cataract surgery, clinically symptomatic, | 130 per 1000 | 52 per 1000 (42 to 64) | RR 0.40 (CI 0.32 to 0.49) | 3638 (21 RCTs) | ⊕⊕⊝⊝ | |
| BCVA at 3 months after surgery; | See comment | ‐ | ‐ | 1158 | ‐ | Trial results were inconsistent (I2 = 70%), but all except one study found differences less than 0.1 logMAR, i.e. clinically indistinguishable from no difference. |
| *The risk in the intervention group (and its 95% CI) is based on the assumed risk in the comparison group and the relative effect of the intervention (and its 95% CI). | ||||||
| GRADE Working Group grades of evidence | ||||||
| 1 Downgraded 1 level for risk of bias: studies at unclear or high risk of bias. 5 We considered downgrading an additional 1 level for indirectness as the MO was not always OCT‐verified and it was not always clear if the MO was clinically symptomatic. However, we did not do so partly because the size of the effect was quite strong. | ||||||
| NSAIDscompared with steroids for the prevention of macular oedema after cataract surgery | ||||||
| Patient or population: people having cataract surgery | ||||||
| Outcomes | Anticipated absolute effects* (95% CI) | Relative effect | № of participants | Certainty of the evidence | Comments | |
| Risk with steroids | Risk with NSAIDs | |||||
| Poor vision outcome due to MO at 3 months after surgery | ‐ | ‐ | ‐ | ‐ | ‐ | No data were available for this outcome. |
| Poor vision outcome due to MO at 12 months after surgery | ‐ | ‐ | ‐ | ‐ | ‐ | No data were available for this outcome. |
| Quality of life at 3 months after surgery | No data were available for this outcome. | |||||
| Central retinal thickness at 3 months after surgery; | The mean central retinal thickness at 3 months after surgery was 228 microns | MD 22.64 microns lower | ‐ | 121 | ⊕⊕⊝⊝ | ‐ |
| Adverse effects | ‐ | ‐ | ‐ | 488 | ‐ | 1 study had 2 unspecified complications in 142 participants, 2 studies reported that no adverse events were noted in either group, 1 study (55 people) mentioned 15 mild adverse effects but unclear if related to treatment. |
| MO at 3 months after cataract surgery; clinically symptomatic | 130 per 1000 | 35 per 1000 (23 to 53) | RR 0.27 (0.18 to 0.41) | 520 (5 RCTs) | ⊕⊕⊝⊝ | |
| BCVA at 3 months after surgery; | See comment | ‐ | ‐ | 220 | ‐ | Trial results were inconsistent (I2 = 84%), but all studies found differences less than 0.1 logMAR, i.e. clinically indistinguishable from no difference. |
| *The risk in the intervention group (and its 95% CI) is based on the assumed risk in the comparison group and the relative effect of the intervention (and its 95% CI). | ||||||
| GRADE Working Group grades of evidence | ||||||
| 1 Downgraded 1 level for risk of bias: studies at unclear or high risk of bias. 3 We considered downgrading 1 level for indirectness as the MO was not always OCT‐verified and not always clear if it was clinically symptomatic however we did not do so, partly because the effect was strong. | ||||||
Background
Description of the condition
Cataract refers to the clouding of the natural crystalline lens of the eye. It is the leading cause of avoidable visual impairment and blindness in the world. The World Health Organization (WHO) estimates that unoperated cataract alone accounts for 33% of visual impairment, an estimated 94 million cases worldwide (Pascolini 2012). In many parts of the world, particularly higher‐income countries, availability of cataract surgery at a relatively early stage of visual impairment in the disease process has led to this procedure being one of the most commonly performed surgical procedures worldwide.
Macular oedema (MO) is the accumulation of extracellular fluid in the central retina (the macula) which may present following cataract surgery with lens implantation (pseudophakic macular oedema) or without (aphakic macular oedema) and may give rise to poor visual outcome with reduced visual acuity and distortion of the central vision. The diagnosis of this condition is made both clinically using slit lamp biomicroscopic examination of the macula and with the aid of fundus fluorescein angiography or optical coherence tomography (OCT) (Choi 2005).
The incidence of MO varies with type of surgery, intraoperative complications and pre‐existing risk factors. Reported risk of MO varies between 0.9% and 5% for modern uncomplicated phacoemulsification cataract surgery (Spaide 1993), but can be as high as 10% in the presence of surgical complications such as vitreous loss (Blomquist 2002). Vision is not always affected, and the incidence of MO with decrease in visual acuity is reported at 1% (Ahmed 2013), and is associated with increasing retinal thickness (Hee 1995). A multicentre audit of 55,567 cataract operations in the UK's National Health Service (NHS) showed a risk of 1.62%, at a median postoperative review time of 31 days (Jaycock 2009). This was based on surgeons' reports rather than systematic examination of the macula and was defined as poor visual outcome attributed to MO.
Other risk factors for MO include ocular inflammatory diseases such as uveitis, retinal ischaemic conditions such as central and branch retinal vein conditions, retinal vascular diseases and dystrophies, for example retinitis pigmentosa and retinal telangiectasia, as well as degenerative causes such as age related macular degeneration and diabetic retinopathy while the use of topical prostaglandin analogue therapy in glaucoma remains a theoretical risk (Nelson 2003). The use of topical adrenaline 2% (epinephrine) in aphakic patients has also been described to be associated with macular oedema. Other factors may include cerebrovascular and cardiovascular disease (Jain 2001) but the pathogenesis is unclear.
MO is often self‐limiting with spontaneous resolution (Ahmed 2013). The small proportion of patients with chronic persistent MO may be difficult to treat (Yannuzzi 1995), and they may experience permanent reduction in vision from atrophy of the photoreceptor layer of the retina (Ahmed 2013). Chronic oedema may lead to the formation of cystic spaces in the retina, termed 'cystoid macular oedema' (CMO).
Description of the intervention
The intervention is the topical use of non‐steroidal anti‐inflammatory drugs (NSAIDs), in this case, eyedrops, in addition to topical steroid eyedrops after cataract surgery. They may also be used preoperatively, primarily to reduce the risk of pupil constriction during surgery, but this may potentially also reduce the risk of MO. Non‐steroidal anti‐inflammatory agents are a group of drugs which are in common use orally as over‐the‐counter treatments for the reduction of pain, redness and swelling associated with systemic inflammation. Some of these are also available in eyedrop form as prescription medicines for the reduction of ocular inflammation.
The comparative intervention is the use of topical steroids on the eye after cataract surgery, which is current standard therapy, and may in itself reduce the risk of MO. Steroids are a group of prescription‐only drugs which are used systemically to suppress the symptoms, signs and sequelae of inflammation. They are also used in their topical eyedrop form for the reduction of ocular inflammation.
In the last decade or so, several clinical trials have examined the use of topical NSAIDs in the treatment and prevention of postoperative inflammation and pseudophakic macular oedema, without the adverse effects of topical corticosteroids (Ballonzoli 2010; Carnahan 2000; Heier 1999; Polanski 1992; Solomon 2001). NSAIDs such as ketorolac and indomethacin are cyclo‐oxygenase inhibitors which suppress breakdown of the blood‐aqueous barrier that may occur in the early postoperative period (Flach 1987; Flach 1988; Miyake 1984; Sanders 1984).
Jain 2001 recommended the use of prophylactic NSAIDs in patients with predisposing factors to developing postsurgical MO, irrespective of cause. Other clinical studies suggest that topical NSAIDs may be more effective than topical steroids in re‐establishing the blood‐aqueous barrier postoperatively, suggesting an important role in MO prevention (Flach 1989; Kraff 1990; Ursell 1999).
The meta‐analysis conducted in Rossetti 1998 of the use of NSAIDs suggested possible beneficial effects of NSAIDs for both the prophylaxis and treatment of MO, but concluded that the overall quality of the evidence was insufficient to justify recommendation of its widespread use in prophylaxis. A Cochrane Review on treatment of MO following cataract surgery, found that two out of seven included randomised controlled trials (RCTs) showed a beneficial effect of NSAIDs on chronic MO (Sivaprasad 2004), although problems with trial quality and heterogeneity prevented valid meta‐analysis.
A recent randomised, placebo‐controlled trial looking at the adjunctive effect of topical NSAIDs in addition to intravitreal steroids (triamcinolone) and intravitreal anti‐vascular endothelial growth factor (bevacizumab) in chronic MO, found a statistically significant improvement with the use of topical nepafenac in reduction of retinal thickness and improvement in visual acuity at 16 weeks (Warren 2010). NSAIDs have also been used with good tolerance and efficacy, as an alternate treatment for patients with MO of mixed origin who are steroid responders, and therefore cannot be treated with steroids (Warren 2008).
How the intervention might work
NSAIDs are cyclo‐oxygenase inhibitors and may work by reducing the production of pro‐inflammatory prostaglandins. Inflammation within tissue is caused by the production of pro‐inflammatory products by several pathways. NSAIDs act to suppress the cyclo‐oxygenase pathway of inflammation, inhibiting production of prostaglandins (Eisenach 2010).
Why it is important to do this review
As cataract surgery is the second most commonly performed operation worldwide, and MO occurs in between 1% and 10% of all cataract surgeries (depending on risk and complications) and leads to poor visual outcome, there is a significant volume of visual morbidity which can be potentially prevented if it is found that NSAIDs are effective in its prophylaxis. NSAIDs are relatively inexpensive, easily obtainable and carry the potential to significantly improve the outcome of cataract surgery worldwide.
Despite some evidence in favour of the beneficial effects of NSAIDs in MO, uncertainty remains about whether it has significant benefit in the prevention of MO when used perioperatively in addition to steroids. A recent editorial posed the question as to how prescribing NSAIDs for routine cataract surgery became so popular in the USA without compelling evidence of a visual benefit to patients (Kim 2016a). This uncertainty is reflected in widespread variation in clinical practice. For example, NSAIDs are much less frequently used in the UK for this indication. This review attempts either to resolve the persisting clinical uncertainty or to identify the need for further research to achieve such resolution.
This review is confined to addressing the use of NSAIDs in the prophylaxis of MO. A separate Cochrane Review on treatment of established cystoid macular oedema (CMO) has already been published (Sivaprasad 2004), but the effectiveness of NSAIDs in treatment remains uncertain. MO can lead to permanent structural damage in the central retina, therefore a prevention strategy may be more effective than treatment after the damage has been done.
Objectives
The aim of this review is to answer the question: is there evidence to support the prophylactic use of topical NSAIDs either in addition to, or instead of, topical steroids postoperatively to reduce the incidence of macular oedema (MO) and associated visual morbidity.
Methods
Criteria for considering studies for this review
Types of studies
We included only randomised controlled trials (RCTs) in this review. We excluded within‐person studies i.e. studies where eyes are randomly allocated to the intervention and comparator due to the possibility that the effect of non‐steroidal anti‐inflammatory drugs (NSAIDs) in one eye may affect the outcome in the other.
Types of participants
We included trials in which adult participants had undergone standard surgery for age‐related cataract. We included participants irrespective of their baseline risk of MO, in particular, we included people with diabetes and uveitis.
Types of interventions
The primary comparison of this review was topical NSAIDs in addition to topical steroids versus topical steroids alone in cataract surgery. Surgery can include extracapsular cataract extraction (ECCE; large incision with sutures), manual small incision cataract surgery (MSICS; small incision without sutures), phacoemulsification cataract surgery (mechanised small incision extracapsular extraction) and intracapsular cataract extraction (ICCE; planned and unplanned intracapsular procedures).
We included trials of preoperative and/or postoperative topical NSAIDs in conjunction with postoperative topical steroids. The comparator was postoperative topical steroids alone.
A secondary comparison was preoperative and/or postoperative topical NSAIDs alone versus topical postoperative steroids alone.
We included studies irrespective of whether incident MO was subsequently treated.
Types of outcome measures
Primary outcomes
-
The proportion of people with a poor vision outcome due to MO in the study eye at three months after surgery.
We defined poor vision outcome as best corrected visual acuity (BCVA) not improving to 6/9 or better (or equivalent with other notations of vision) attributed to a diagnosis of MO (detected clinically, angiographically or on optical coherence tomography (OCT)). This included participants who developed MO and required and received treatment.
Our primary outcome was measured at three months after surgery, which we took as any observation between one month and six months after surgery. We also examined poor visual outcome due to MO at 12 months after surgery, which we took as any observation between six and 18 months after surgery.
Secondary outcomes
-
Any quality of life or patient satisfaction measure relating to the patient's experience of surgery on the study eye., at three months and 12 months after surgery
-
Change in central retinal thickness from preoperative assessment in the study eye, at three months and 12 months after surgery, as measured by OCT scan. If change in central retinal thickness was not available we used the final value.
Adverse effects
We looked at known harms of NSAIDs including respiratory effects and gastrointestinal disturbance, in addition to intolerance of medication and allergic reactions. We recorded any other harms such as liver toxicity, as has been reported with some NSAIDs.
Resource use and costs
In our protocol (Abeysiri 2011) we planned to look at economic evaluations of the cost‐effectiveness and cost per quality‐adjusted life year (QALY)/disability‐adjusted life year (DALY) modelling. We amended this to look at resource use and costs more generally.
Additional outcomes (National Institute for Health and Care Excellence (NICE))
We collected data on the following additional outcomes as part of our collaboration with NICE.
-
Macular oedema (MO) (clinically symptomatic, OCT‐verified).
-
Inflammation.
-
BCVA.
Search methods for identification of studies
Electronic searches
We searched CENTRAL (which contains the Cochrane Eyes and Vision Trials Register) (2016, Issue 8), Ovid MEDLINE, Ovid MEDLINE In‐Process and Other Non‐Indexed Citations, Ovid MEDLINE Daily, Ovid OLDMEDLINE (January 1946 to September 2016), Embase (January 1980 to September 2016), Latin American and Caribbean Health Sciences Literature Database (LILACS) (1982 to September 2016), the ISRCTN registry (www.isrctn.com/editAdvancedSearch), ClinicalTrials.gov (www.clinicaltrials.gov), and the World Health Organization (WHO) International Clinical Trials Registry Platform (ICTRP) (www.who.int/ictrp/search/en). We did not use any date or language restrictions in the electronic searches for trials. We last searched the electronic databases on 2 September 2016.
See: Appendices for details of search strategies for CENTRAL (Appendix 1), MEDLINE (Appendix 2), Embase (Appendix 3), LILACS (Appendix 4), ISRCTN (Appendix 5), ClinicalTrials.gov (Appendix 6), and the ICTRP.
Searching other resources
We searched the reference lists of the studies included in the review. We used the Science Citation Index to find studies that have cited the individual trials. We did not handsearch conference proceedings or journals specifically for the review.
Data collection and analysis
Selection of studies
Three review authors (CL, BL, DL) screened the titles and abstracts resulting from the searches independently. We obtained full copies of the potentially relevant trials. Three review authors (CL, BL, DL) independently assessed full copies for inclusion according to the 'Criteria for considering studies for this review.' We resolved disagreements by discussion.
We listed all excluded studies and provided a brief justification for exclusion (See Characteristics of excluded studies).
Data extraction and management
Four review authors (JE, CL, DL, BL) independently extracted data using a pre‐piloted data extraction template in Covidence (Covidence 2016). A fifth review author (CB) generated a random sample of 20% of studies and checked data input for these. We resolved discrepancies by discussion.
We collected the following information on study characteristics (Appendix 8).
-
Study design: parallel group RCT, one or both eyes included and/or reported.
-
Participants: country, total number of participants, age, sex, inclusion and exclusion criteria.
-
Intervention and comparator details: including number randomised to each.
-
Primary and secondary outcomes as measured and reported in the trials, adverse events, methods of measurement (e.g. which chart is used for visual acuity assessment, which OCT scanner was used).
-
Length of follow‐up.
-
Date study conducted.
-
Funding and conflicts of interest reported.
-
Trial registration number.
We collected data on our predefined outcomes separately for intervention and comparator groups. For multi‐arm studies we planned to use data relevant to our intervention and comparator groups. If two groups contain relevant data (for example, if pre/postoperative application of NSAIDs) we combined groups using the RevMan calculator (RevMan 2014).
As far as possible, we extracted data for an intention‐to‐treat (ITT) analysis. We contacted trial investigators as needed. Data were imported directly from Covidence into Review Manager 5 by JE (RevMan 2014), and checked by the other review authors (CL, DL, BL). CB then conducted a final random assessment.
Assessment of risk of bias in included studies
We used Cochrane's 'Risk of bias' tool for assessing risk of bias in each included study. Four review authors (JE, CL, DL, BL) independently assessed risk of bias according to methods set out in Chapter 8 of the Cochrane Handbook for Systematic Reviews of Interventions (Higgins 2011). We followed the specific rules as set out in Table 1 and resolved disagreements by discussion.
| Domain | Risk of bias | ||
| Low | Unclear | High | |
| Sequence generation | Computer‐generated list, random table, other method of generating random list. | Not reported how list was generated. Trial may be described as “randomised” but with no further details. | Alternate allocation, date of birth, records (these RCTs should be excluded). |
| Allocation concealment | Central centre (web/telephone access), sealed opaque envelopes. | Not reported how allocation administered. Trial may be described as “randomised” but with no further details. | Investigator involved in treatment allocation or treatment allocation clearly not masked. |
| Blinding of participants and personnel | Clearly stated that participants and personnel not aware of which treatment received. | Described as “double‐blind” with no information on who was masked. | Open‐label or no information on masking. We assume that in absence of reporting on this outcome, patients and personnel were not masked. |
| Blinding of outcome assessors | Clearly stated that outcome assessors were masked. | Described as “double‐blind” with no information on who was masked. | Open‐label or no information on masking. We assume that in absence of reporting on this outcome, assessors were not masked. |
| Incomplete outcome data | Missing data less than 20% (i.e. more than 80% follow‐up) and equal follow‐up in both groups and no obvious reason why loss to follow‐up should be related to outcome. | Follow‐up not reported or missing data > 20% (i.e. follow‐up < 80%) but follow‐up equal in both groups. | Follow‐up different in each group and/or related to outcome. |
| Selective outcome reporting | All outcomes in protocol and/or trial registry entry are reported. | No access to protocol or trial registry entry. | Outcomes in protocol and/or trial registry entry selectively reported. |
| Other sources of bias Note: we did not identify any important sources of other bias so this domain is omitted from the risk of bias tables. | No other source of bias. | Trial stopped early due to poor recruitment. Baseline imbalance, but not clear that it is important. | Trial stopped early because of outcome. Important baseline imbalance that might have an effect on the results. |
We contacted trial investigators for Miyake 2011 for clarification of random allocation.
Measures of treatment effect
We calculated the risk ratio for outcome measures reported as dichotomous data (for example, poor visual acuity attributed to MO within three months). We calculated the mean difference for measures of retinal thickness. We planned to analyse ordinal outcome data as dichotomous data if an established defensible cut‐off point is available, such as quality of life measures. We did not plan to meta‐analyse adverse effects.
Unit of analysis issues
Trials included may randomise one or both eyes to the intervention or comparator. If both eyes were allocated to the same treatment, we planned to analyse as 'clustered data' if data were available. In the event four trials included data on both eyes, but this was generally a small proportion of the total participants. We have analysed as reported. We excluded studies which allocated different eyes to different treatments as there may be a confounding cross‐over effect due to systemic absorption.
Dealing with missing data
We assessed all included trials for number of participants excluded or lost to follow‐up. We documented reasons for loss to follow‐up by treatment group, if reported. We aimed to do an ITT analysis for included trials using imputed data; if computed by the trialists we did not plan to impute missing data on their behalf.
Assessment of heterogeneity
Where heterogeneity was observed between individual study results we did not combine studies but present a tabulated summary of results. We did not rely on statistical significance of a Chi2 test to indicate heterogeneity but examined the forest plot of the study results and the overall characteristics of the studies. We looked at the consistency between studies by examining the I2 statistic value. We considered I2 values over 50% to indicate substantial inconsistency, but we also considered the direction of effects.
Assessment of reporting biases
We considered selective outcome reporting under the risk of bias assessment (Table 1). We planned to look at funnel plots and consider tests for asymmetry for bias assessment in the event of 10 or more trials contributing data to a meta‐analysis.
Data synthesis
We aimed to use a random‐effects model provided we did not detect substantial inconsistency between individual study results. If there were fewer than three trials in a comparison we planned to use the fixed‐effect model. Where heterogeneity was observed between studies (see Assessment of heterogeneity) we did not combine studies but presented a narrative summary of results.
'Summary of findings' table
We prepared a 'Summary of findings' table presenting relative and absolute risks. We graded the overall certainty of the evidence for each outcome using the GRADE classification (Atkins 2004). We considered the following: risk of bias of included studies, precision of the effect estimate, consistency of effects between studies, directness of the outcome measure and publication bias. JE did the assessment and this was checked by other authors. We included the following outcomes in the 'Summary of findings' tables.
-
Poor vision outcome due to MO at three months after surgery.
-
Poor vision outcome due to MO at 12 months after surgery.
-
Quality of life at three months after surgery.
-
Central retinal thickness at three months after surgery.
-
Adverse effects.
-
MO (clinically symptomatic, OCT‐verified) at three months after surgery
-
BCVA at three months after surgery.
Subgroup analysis and investigation of heterogeneity
We planned to conduct a subgroup analysis on the primary outcome comparing the effect of treatment on people with higher baseline risk of MO (diabetes/uveitis) with people with lower risk of MO (no diabetes/uveitis), but we did not do them as planned as there were not enough data on the primary outcome.
Sensitivity analysis
We planned to perform three sensitivity analyses on the primary outcome, but we did not do them as planned as there were not enough data on the primary outcome.
-
Excluding studies at high risk of bias in one or more domains.
-
Excluding industry‐funded studies.
-
Comparing fixed‐effect and random‐effects models (if three or more trials).
Results
Description of studies
Results of the search
The electronic searches yielded a total of 928 references (Figure 1). The Cochrane Information Specialist removed 337 duplicate records and we screened the remaining 591 reports. We rejected 526 records after reading the abstracts and obtained the full‐text reports of 65 references for further assessment. We identified 43 reports of 34 studies which met the inclusion criteria (see Characteristics of included studies for details), and excluded 18 reports of 18 studies (see Characteristics of excluded studies for details). One unpublished trial is currently awaiting assessment (CTRI/2009/091/001078). We identified three ongoing studies (NCT01694212; NCT01774474; NCT02646072).
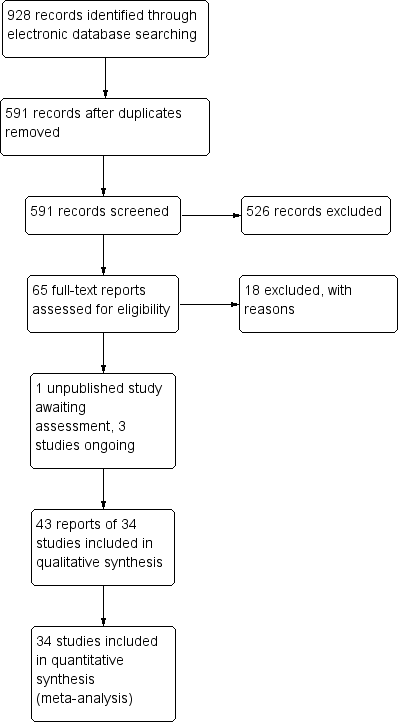
Study flow diagram.
Included studies
We have summarised the characteristics of the 34 included studies below. Details for individual studies can be found in the Characteristics of included studies. The information is also summarised in Table 2; Table 3; Table 4; Table 5; Table 6
| Study | Country | Open‐label | Funding sources | Declaration of interest | Trial registration | Abstract only | |
| 1 | Canada | Yes | Non‐industry | Reported; no CoI | NCT00335439 | No | |
| 2 | Canada | No | Non‐industry | Reported; no CoI | NCT01395069 | No | |
| 3 | Japan | No | Not reported | Reported; no CoI | Not registered | No | |
| 4 | USA | No | Industry | Not reported | Not registered | No | |
| 5 | Mexico | No | Not reported | Reported; no CoI | Not registered | No | |
| 6 | Greece | No | Not reported | Not reported | Not registered | No | |
| 7 | USA | No | Industry/Non‐Industry | CoI | Not registered | No | |
| 8 | Egypt | No | Not reported | Reported; no CoI | Not registered | No | |
| 9 | Japan | Yes | Not reported | Reported; no CoI | Not registered | No | |
| 10 | Italy | No | Not reported | CoI | Not registered | No | |
| 11 | South Korea | No | Non‐industry | Reported; no CoI | Not registered | No | |
| 12 | USA | No | Non‐industry | Not reported | Not registered | No | |
| 13 | China | No | Not reported | Not reported | Not registered | No | |
| 14 | USA | No | Non‐industry | Reported; no CoI | NCT00494494 | No | |
| 15 | Japan | No | Not reported | Reported; no CoI | Not registered | No | |
| 16 | Japan | No | Not reported | CoI | Not registered | No | |
| 17 | Japan | No | Not reported | Not reported | Not registered | No | |
| 18 | Greece | No | Not reported | Reported; no CoI | Not registered | No | |
| 19 | Germany | No | Not reported | Not reported | Not registered | No | |
| 20 | Italy | No | Not reported | Reported; no CoI | Not registered | No | |
| 21 | USA | No | Not reported | CoI | NCT00782717 | No | |
| 22 | Canada (8 sites) and Germany (2 sites) | No | Industry | Reported; no CoI | Not registered | No | |
| 23 | USA | No | Industry | CoI | Not registered | Yes | |
| 24 | Brazil | No | Not reported | Reported; no CoI | Not registered | No | |
| 25 | Turkey | No | Not reported | Not reported | Not registered | No | |
| 26 | Brazil | No | Not reported | Reported; no CoI | NCT02084576 | No | |
| 27 | Switzerland | No | Not reported | Not reported | Not registered | No | |
| 28 | China | Yes | Non‐industry | Not reported | Not registered | No | |
| 29 | USA | No | Industry | CoI | NCT00348244 | No | |
| 30 | USA | No | Non‐industry | Not reported | Not registered | No | |
| 31 | Turkey | No | Not reported | Reported; no CoI | Not registered | No | |
| 32 | USA | No | Not reported | Not reported | Not registered | No | |
| 33 | Sweden | No | Industry/Non‐industry | Reported; no CoI | Not registered | No | |
| 34 | China | No | Not reported | Not reported | Not registered | No |
CoI: conflict of interest
| Study | Number of people randomised | Number of people randomised (missing data imputed)* | Number of eyes | Number of eyes estimated (missing data imputed)* | Number of people followed up | Number of people followed up (missing data imputed)* | Percentage follow‐up | Eyes per person enrolled in the trial | |
| 1 | 98 | 98 | 106 | 106 | ‐ | 74 | 75% | 106 eyes of 98 people | |
| 2 | 193 | 193 | ‐ | 193 | 162 | 162 | 84% | Probably one | |
| 3 | 150 | 150 | 150 | 150 | 142 | 142 | 95% | One eye | |
| 4 | ‐ | ‐ | ‐ | ‐ | ‐ | ‐ | Probably one | ||
| 5 | 60 | 60 | 60 | 60 | 60 | 60 | 100% | One eye | |
| 6 | 145 | 145 | 145 | 145 | 138 | 138 | 95% | Probably one | |
| 7 | 100 | 100 | ‐ | 100 | ‐ | 100 | ‐ | Unclear | |
| 8 | 70 | 70 | 86 | 86 | ‐ | 86 | ‐ | 86 eyes of 70 patients | |
| 9 | 75 | 75 | 75 | 75 | 62 | 62 | 83% | One eye | |
| 10 | 281 | 281 | 281 | 281 | 229 | 229 | 81% | One eye | |
| 11 | 91 | 91 | 91 | 91 | Not reported | 91 | Not reported | One eye | |
| 12 | 500 | 500 | ‐ | 500 | 492 | 492 | 98% | Unclear | |
| 13 | 217 | 217 | 217 | 217 | ‐ | 217 | ‐ | One eye | |
| 14 | 84 | 84 | 84 | 84 | 79 | 79 | 94% | One eye | |
| 15 | 62 | 62 | 62 | 62 | 50 | 50 | 81% | Probably one | |
| 16 | 60 | 60 | 60 | 60 | 55 | 55 | 92% | One eye | |
| 17 | 72 | 72 | 72 | 72 | ‐ | 72 | ‐ | One eye | |
| 18 | 79 | 79 | 79 | 79 | ‐ | 79 | ‐ | One eye | |
| 19 | 179 | 179 | 179 | 179 | 112 | 112 | 63% | One eye | |
| 20 | 88 | 88 | 88 | 88 | ‐ | 88 | ‐ | Probably one | |
| 21 | 263 | 263 | 263 | 263 | 251 | 251 | 95% | One eye | |
| 22 | 681 | 681 | 681 | 681 | 364 | 364 | 53% | Probably one | |
| 23 | ‐ | 32 | ‐ | 32 | 32 | 32 | ‐ | Unclear | |
| 24 | 91 | 91 | 91 | 91 | 81 | 81 | 89% | Probably one | |
| 25 | 75 | 75 | 75 | 75 | 75 | 75 | ‐ | One eye | |
| 26 | 142 | 142 | 142 | 142 | 126 | 126 | 89% | One eye | |
| 27 | ‐ | 73 | ‐ | 73 | 73 | 73 | ‐ | Unclear | |
| 28 | 240 | 240 | ‐ | 240 | 167 | 167 | 70% | Unclear | |
| 29 | 546 | 546 | 546 | 546 | 478 | 478 | 88% | One eye | |
| 30 | ‐ | 201 | 231 | 231 | ‐ | 231 | 59% | 231 eyes of 210 people | |
| 31 | 189 | 189 | 189 | 189 | 179 | 179 | 95% | One eye; right eye only | |
| 32 | 37 | 37 | ‐ | 37 | ‐ | 37 | ‐ | Unclear | |
| 33 | 160 | 160 | 160 | 160 | 152 | 152 | 95% | One eye | |
| 34 | ‐ | 198 | 220 | 220 | ‐ | 220 | 100% | 220 eyes of 198 people |
*For studies that did not report the number randomised, we have estimated this from the number followed up. For studies that did not report the number followed up, we have estimated this from the numbers randomised. Number of eyes estimated assuming one eye per person, if not clearly stated otherwise.
| Study | Average age | Age range | % female | % with diabetes | % with uveitis | |
| 1 | 72 | 45 to 92 | 61% | 21% | 1% | |
| 2 | 72 | 50 to 88 | 54% | ‐ but low risk population | "low risk population" | |
| 3 | 66 | ‐ | 56% | 0% people with diabetes excluded | 0% people with uveitis excluded | |
| 4 | ‐ | ‐ | ‐ | ‐ but people with DR excluded | 0% people with uveitis excluded | |
| 5 | 72 | 51 to 88 | 64% | 20% | 0% people with uveitis excluded | |
| 6 | 74 | ‐ | 40% | 10% | 0% people with uveitis excluded | |
| 7 | 73 | ‐ | 55% | 0% people with diabetes excluded | 0% people with uveitis excluded | |
| 8 | ‐ | ‐ | 37% | 100% | ‐ | |
| 9 | 69 | 37 to 84 | 45% | 100% | 0% people with uveitis excluded | |
| 10 | 68 | ‐ | 52% | ‐ | ‐ | |
| 11 | 67 | ‐ | 55% | 26% | ‐ | |
| 12 | 69 | 37 to 97 | 57% | ‐ | ‐ | |
| 13 | 72 | ‐ | 63% | 100% | ‐ | |
| 14 | 72 | 44 to 90 | 54% | 0% people with diabetes excluded | 0% people with uveitis excluded | |
| 15 | 66 | ‐ | 54% | 0% people with diabetes excluded | 0% people with uveitis excluded | |
| 16 | 65 | 48 to 82 | 46% | 9% | 0% people with uveitis excluded | |
| 17 | 72 | 41 to 86 | 71% | 0% people with diabetes excluded | 0% people with uveitis excluded | |
| 18 | 77 | ‐ | 66% | 0% people with diabetes excluded | 0% people with uveitis excluded | |
| 19 | 73 | ‐ | 55% | ‐ but people with DR excluded | 0% people with uveitis excluded | |
| 20 | 74 | ‐ | 64% | 0% people with diabetes excluded | ‐ | |
| 21 | 67 | 32 to 87 | 63% | 100% | 0% people with uveitis excluded | |
| 22 | 68 | 39 to 100 | 53% | ‐ | 0% people with uveitis excluded | |
| 23 | ‐ | ‐ | ‐ | ‐ | ‐ | |
| 24 | 67 | ‐ | 47% | 0% people with diabetes excluded | 0% people with uveitis excluded | |
| 25 | 61 | ‐ | 39% | 0% people with diabetes excluded | 0% people with uveitis excluded | |
| 26 | ‐ | ‐ | ‐ | ‐ | ‐ | |
| 27 | 69 | ‐ | 52% | ‐ but people with DR excluded | 0% people with uveitis excluded | |
| 28 | 73 | 46 to 92 | 54% | 0% people with diabetes excluded | 0% people with uveitis excluded | |
| 29 | 70 | ‐ | 53% | ‐ | ‐ | |
| 30 | ‐ | ‐ | ‐ | ‐ | ‐ | |
| 31 | 65 | ‐ | 40% | 0% people with diabetes excluded | 0% people with uveitis excluded | |
| 32 | ‐ | ‐ | ‐ | 100% | ‐ | |
| 33 | 69 | ‐ | 65% | ‐ | ‐ | |
| 34 | ‐ | ‐ | ‐ | ‐ | ‐ |
DR: diabetic retinopathy
| Study | Type of cataract surgery | Comparison | NSAIDs | Steroid | Placebo in comparator group | Type of placebo | |
| 1 | Phacoemulsification | NSAIDs plus steroids versus steroids | Ketorolac 0.5% | Prednisolone 1% | No | ‐ | |
| 2 | Phacoemulsification | NSAIDs plus steroids versus steroids | Ketorolac 0.5%, Nepafenac 0.1% | Prednisolone 1% | Yes | Sterile saline drops | |
| 3 | Phacoemulsification | NSAIDs versus steroids | Diclofenac 0.1% | Betamethasone 0.1% | No | ‐ | |
| 4 | Phacoemulsification | NSAIDs versus steroids | Diclofenac 0.1% | Prednisolone 1% | No | ‐ | |
| 5 | Phacoemulsification | NSAIDs plus steroids versus steroids | Nepafenac 0.1% | Dexamethasone (combined with tobramycin) | No | ‐ | |
| 6 | Phacoemulsification | NSAIDs plus steroids versus steroids | Ketorolac 0.5% | Dexamethasone 0.1% (combined with tobramycin 0.3%) | No | ‐ | |
| 7 | Phacoemulsification | NSAIDs plus steroids versus steroids | Ketorolac 0.4% | Prednisolone 1% | Yes | Vehicle | |
| 8 | Phacoemulsification | NSAIDs plus steroids versus steroids | Ketorolac 0.4% | Dexamethasone 0.1%, | No | ‐ | |
| 9 | Phacoemulsification | NSAIDs versus steroids | Bromfenac | Betamethasone (with fradiomycin sulfate) followed by fluorometholone | No | ‐ | |
| 10 | ECCE | NSAIDs versus steroids | Diclofenac 0.1% | Dexamethasone 0.1% | Yes | Not specified | |
| 11 | Phacoemulsification | NSAIDs versus steroids | Bromfenac 0.1%, Ketorolac 0.4% | Prednisolone acetate 1% | No | ‐ | |
| 12 | ECCE and phacoemulsification | NSAIDs plus steroids versus steroids | Indomethacin | Dexamethasone (in combination with neomycin sulfate, polymyxin B sulfate) for 4 days followed by dexamethasone alone for 4 weeks followed by fluorometholone for at least 6 months | Yes | Vehicle | |
| 13 | Phacoemulsification | NSAIDs plus steroids versus steroids | Diclofenac 1% | Dexamethasone (combined with tobramycin) | No | ‐ | |
| 14 | Phacoemulsification | NSAIDs plus steroids versus steroids | Nepafenac 0.1% | Prednisolone 1% | No | ‐ | |
| 15 | Phacoemulsification | NSAIDs versus steroids | Diclofenac 0.1% | Fluorometholone 0.1% | No | ‐ | |
| 16 | Phacoemulsification | NSAIDs versus steroids | Nepafenac 0.1% | Fluorometholone 0.1% | No | ‐ | |
| 17 | Phacoemulsification | NSAIDs plus steroids versus steroids/NSAIDs versus steroids | Bromfenac 0.1% | Betamethasone 0.1%, fluorometholone | No | ‐ | |
| 18 | Phacoemulsification | NSAIDs plus steroids versus steroids | Diclofenac 0.1% | Dexamethasone 0.1% (combined with chloramphenicol 0.5%) | No | ‐ | |
| 19 | ICCE | NSAIDs plus steroids versus steroids | Diclofenac 0.1% | Dexamethasone | Yes | Not specified | |
| 20 | ECCE | NSAIDs plus steroids versus steroids | Diclofenac | Dexamethasone (combined with tobramycin) | Yes | Not specified | |
| 21 | Phacoemulsification | NSAIDs plus steroids versus steroids | Nepafenac 1% | Prednisolone | Yes | Vehicle | |
| 22 | ECCE | NSAIDs plus steroids versus steroids | Flurbiprofen 0.03% Indomethacin 1% | Prednisolone | Yes | Vehicle | |
| 23 | Phacoemulsification | NSAIDs plus steroids versus steroids | Ketorolac 0.4% | Prednisolone 1% | No | ‐ | |
| 24 | Phacoemulsification | NSAIDs plus steroids versus steroids | Ketorolac 0.4% | Prednisolone 1% | Yes | Dextran 70/hypromellose | |
| 25 | ECCE | NSAIDs plus steroids versus steroids | Diclofenac 0.1% | Dexamethasone 1% | No | ‐ | |
| 26 | Phacoemulsification | NSAIDs plus steroids versus steroids | Ketorolac 0.4%, Nepafenac 0.1% | Prednisolone 1% | Yes | Artificial tears | |
| 27 | ECCE/ICCE | NSAIDs plus steroids versus steroids | Indomethacin 1% | Dexamethasone (combined with either chloramphenicol or neomycin) | Yes | Vehicle | |
| 28 | Phacoemulsification | NSAIDs plus steroids versus steroids | Bromfenac 0.1% | fluorometholone 0.1% and dexamethasone 0.1% | No | ‐ | |
| 29 | Phacoemulsification | NSAIDs plus steroids versus steroids | Ketorolac 0.4% | Prednisolone 1% | Yes | Artificial tears | |
| 30 | ICCE | NSAIDs plus steroids versus steroids | Indomethacin 1% | Steroids given as part of standard care, not specified exactly what | Yes | Vehicle | |
| 31 | Phacoemulsification | NSAIDs plus steroids versus steroids | Indomethacin 0.1% | Prednisolone 1% | No | ‐ | |
| 32 | Phacoemulsification | NSAIDs plus steroids versus steroids | Ketorolac 0.5% | Prednisolone 1% | Yes | Artificial tears | |
| 33 | Phacoemulsification | NSAIDs plus steroids versus steroids | Nepafenac 0.1% | Dexamethasone 0.1% | Yes | Artifical tears | |
| 34 | Phacoemulsification | NSAIDs plus steroids versus steroids | Pranoprofen | Dexamethasone (combined with tobramycin) | No | ‐ |
ECCE: extracapsular cataract extraction
ICCE: intracapsular cataract extraction
NSAIDs: non‐steroidal anti‐inflammatory drugs
| Poor vision outcome due to MO | Quality of life/patient satisfaction | Central retinal thickness | Adverse effects reported | CMO | Inflammation | BCVA | Additional outcomes | ||
| Study | Follow‐up | No analysis; only one study reported this | |||||||
| 1 month | Yes | OCT used but CMO not defined | Change in total macular volume | ||||||
| 1 month | COMTOL questionnaire | Mean change reported but not possible to calculate SD | LogMAR | Change in total macular volume; change in average macular cube thickness | |||||
| 8 weeks | Yes | Fluorescein angiography using Miyake 1977 classification (at 5 weeks only) | Laser flare‐cell photometry, mean value of anterior chamber flare (photons/millisecond) | LogMAR, final value | |||||
| 1 month | Laser flare‐cell photometry, mean value of anterior chamber flare reported (photons) but was not possible to calculate SD | ||||||||
| 6 weeks | Quote: "None of the patients developed clinically significant macular oedema associated with vision loss" | Final value | Yes | Only reported CMO associated with vision loss | "Inflammatory cells greater than 1+ during first week of postoperative visits" | Total macular volume | |||
| 6 weeks | Fundoscopy and Amsler grid test Quote: "no evidence of clinically significant CME" | Yes | "No evidence of clinically significant CME was detected in any patient via fundoscopy and the Amsler grid test" | Corneal oedema or Tyndall reaction or conjunctival hyperaemia | LogMAR, final value | ||||
| 3 months | Yes | "Clinically significant CME" but otherwise not defined, at 2 weeks only | "Mean inflammation score" but was not possible to calculate SD | LogMAR, final value but could not extract data on SD | |||||
| 12 weeks | Clinical examination, unclear if OCT‐verified | ||||||||
| 6 weeks | Final value | Yes | Anterior chamber flare values, photon count per millisecond | LogMAR, final value | |||||
| 140 days | Yes | Fluorescein angiography using Miyake 1977 classification | |||||||
| 1 month | Change | Yes | "Inflammatory score" (sum of anterior chamber cells and flare grade" | Change in macular volume | |||||
| Between 2.5 and 12 months | Yes | Fluorescein angiography using Miyake 1977 classification | Snellen acuity only, not included in analyses | ||||||
| 1 month | Final value | OCT, "clinically apparent" CME otherwise not defined | Snellen acuity only, not included in analyses | ||||||
| 2 months | Change from baseline | Yes | LogMAR | Change in foveal thickness, change in macular volume | |||||
| 5 weeks | Fluorescein angiography using Miyake 1977 classification | Unit of measurement unclear | Snellen acuity only, not included in analyses | ||||||
| 5 weeks | Final value | Yes | Fluorescein angiography using Miyake 1977 classification | Flare (photons/millisec), final value | Change in logMAR BCVA, categorical 3+, 2, 1 lines increase and no change | ||||
| 2 months | Yes | "Obvious CMO confirmed by OCT" | Aqueous flare (photons/millisecond) | LogMAR, final value | |||||
| 1 month | Final value | LogMAR, final value | |||||||
| 180 days | Yes | Fluorescein angiography using Miyake 1977 classification | Snellen acuity only, not included in analyses | ||||||
| 6 months | Yes | Fluorescein angiography using Miyake 1977 classification | Snellen acuity only, not included in analyses | ||||||
| 90 days | Change from baseline | Yes | ">= 30% increase in central subfield macular thickness from baseline" | Flare mentioned but data not reported | Corrected BCVA loss of more than 5 letters from day 7 postop | ||||
| 6 months | Days 21 to 60, MO = positive angiography and visual acuity <= 20/40 | Yes | Fluorescein angiography using classification*** | Snellen acuity but not reported by treatment group | |||||
| 30 days (3 months mentioned but not reported) | Reported but no mean/SD | Proportion with > 10% increase in retinal thickness | |||||||
| 5 weeks | Final value | Yes | Fluorescein angiography using Miyake 1977 classification | LogMAR | |||||
| 2 months | Fluorescein angiography 0 no leakage (CME absent),1 oedema less than perifoveal, 2 mild perifoveal oedema, 3 moderate perifoveal oedema (approx. 1 disc diameter), 4 severe perifoveal oedema plus drop of 1 line of Snellen acuity since second postoperative week defined as "clinically significant" | ||||||||
| 12 weeks | Final value | Yes | LogMAR, final value (at 30 days only) | ||||||
| 12 weeks | Yes | Fluorescein angiography using Miyake 1977 classification | Snellen acuity only, not included in analyses | ||||||
| 2 months | OCT‐confirmed CMO with "visual impairment" (not specified cutpoint) | Final value | Yes | "CME was defined as central retinal | Mean photon count values | LogMAR, final value | |||
| 4 weeks | OCT‐confirmed CMO with visual acuity < 6/9 | Yes | Clinical and OCT‐based | ||||||
| 1 year | CMO on fluorescein angiography with visual acuity < 6/60 | Yes | Fluorescein angiography, evidence but not defined | ||||||
| 3 months | "Slight fluorescein leakage | LogMAR, final value | |||||||
| 12 weeks | |||||||||
| 6 weeks | Yes | OCT‐verified but not defined | Mean anterior chamber flare reported in figure but no SD | LogMAR, final value | Change in total macular volume | ||||
| 1 month | OCT‐verified but not defined | Tyn granule + |
BCVA: best corrected visual acuity
CME: cystoid macular oedema (edema)
CMO: cystoid macular oedema
COMTOL: Comparison of Ophthalmic Medications for Tolerability (questionnaire)
MO: macular oedema
OCT: ocular coherence tomography
SD: standard deviation
Setting and conduct of Study
See Table 2.
The studies were conducted in Brazil (Ticly 2014; Tzelikis 2015), Canada (Almeida 2008; Almeida 2012; Solomon 1995), China (Li 2011; Wang 2013; Zhang 2008), Egypt (Elsawy 2013), Germany (Quentin 1989; Solomon 1995), Greece (Chatziralli 2011; Moschos 2012) , Italy (Italian Diclofenac Study Group 1997; Rossetti 1996), Japan (Asano 2008; Endo 2010; Miyake 2007; Miyake 2011; Miyanaga 2009), Mexico (Cervantes‐Coste 2009), South Korea (Jung 2015), Sweden (Zaczek 2014), Switzerland (Umer‐Bloch 1983), Turkey (Tunc 1999; Yavas 2007) and the USA (Brown 1996; Donnenfeld 2006; Kraff 1982; Mathys 2010; Singh 2012; Tauber 2006; Wittpenn 2008; Yannuzzi 1981; Yung 2007).
They were all parallel group RCTs, i.e. participants were randomly allocated to intervention or comparator. Three of the studies were described as “open‐label” (Almeida 2008;; Endo 2010; Wang 2013).
Four studies were funded by industry alone (Brown 1996; ; Solomon 1995; Tauber 2006; Wittpenn 2008; ); seven studies reported only non‐industry funding (Almeida 2008; Almeida 2012; Jung 2015; Kraff 1982; Mathys 2010; Wang 2013; Yannuzzi 1981); two studies had funding from both industry and non‐industry sources (Donnenfeld 2006; Zaczek 2014) and the rest of the studies did not report the source of funding.
Declarations of interest were not reported in 12 studies; 17 studies reported that they had no conflicts of interest and six studies reported conflicts of interest for one or more investigators (Donnenfeld 2006; Italian Diclofenac Study Group 1997; Miyake 2011; Singh 2012; Tauber 2006; Wittpenn 2008).
Six trials were registered on a publicly available database. For three of these trials the registration was probably prospective as the month of registration was the same, or before, the month the study started (Almeida 2008; Mathys 2010; Singh 2012).Three trials were registered retrospectively (Almeida 2012; Tzelikis 2015; Wittpenn 2008).
Two trials were reported in abstract form only (Tauber 2006; Yung 2007). However, we contacted the first authors of Tauber 2006 and Yung 2007 and we received additional information in the form of a poster from Yung 2007.
Participants
There were variations in the reporting of recruited and randomised participants. As such it is difficult to establish definitively the total number of people that were randomised in these trials. We estimate that there were 5532 people (5608 eyes) enrolled in these 34 studies and 4476 followed up. (Table 3).
Five studies did not report the number of people randomised (Brown 1996; Tauber 2006; Umer‐Bloch 1983; Yannuzzi 1981; Zhang 2008). For four of these five studies we estimated the number of people in the trial from the number analysed. One study provided no information on the number of participants (Brown 1996).
For those studies that did not report follow‐up clearly we have assumed the number randomised and number followed up was the same.
The majority of the studies (n = 24) enrolled one eye person in the trial, although this was not always clearly described. In six studies the number of eyes/people was not reported in enough detail to be confident how many eyes per person had been enrolled (Donnenfeld 2006; Kraff 1982; Tauber 2006; Umer‐Bloch 1983; Wang 2013; Yung 2007), although it is likely that they too largely performed unilateral surgery.
Four studies performed bilateral surgery on a subset of patients, and so had more eyes than people in the trial (Almeida 2008; Elsawy 2013; Yannuzzi 1981; Zhang 2008). The proportion of people with bilateral surgery was 1% (Yannuzzi 1981), 8% (Almeida 2008), 11% (Zhang 2008) and 23% (Elsawy 2013). None of the studies adjusted for within‐person correlation. We have analysed the data as reported.
For the studies that reported average age, the median average age of participants was 70 years (Table 4). Ages ranged from 37 to 100 years. For the studies that reported gender, the median percentage of women was 54%.
Fifteen studies reported that they excluded patients with diabetes or diabetic retinopathy, or were a “low risk population”. Nine studies did not report the diabetes status of their participants. Nine studies included people with diabetes and reported the percentage of the participants with diabetes. The percentage with diabetes was 10%/9% (Chatziralli 2011; Miyake 2011), 21%/20% (Almeida 2008; Cervantes‐Coste 2009) and 26% (Jung 2015). Five studies only included people with diabetes (Elsawy 2013; Endo 2010; Li 2011; Singh 2012; Yung 2007).
The majority of studies either excluded people with uveitis (n = 19) or had a “low risk population” (Almeida 2012), or very low proportion with uveitis (1/56 people) (Almeida 2008). Thirteen studies did not report uveitis and it was not included in the exclusion criteria.
Interventions
See Table 5
Type of surgery
Twenty‐four of the 34 studies reported that only phacoemulsification was performed for cataract extraction (Table 5). In one study both extracapsular cataract extraction (ECCE) and phacoemulsification were performed (Kraff 1982). Four studies reported that they performed ECCE (Italian Diclofenac Study Group 1997; Rossetti 1996; Solomon 1995; Tunc 1999), two studies performed ICCE (Quentin 1989; Yannuzzi 1981) and one study performed a mixture of ECCE/intracapsular cataract extraction (ICCE) (Umer‐Bloch 1983). In two studies that were reported in abstract form only there was no information on type of surgery but we have assumed that they used phacoemulsification because of the date published and location of the study (Tauber 2006; Yung 2007).
Comparison
Twenty‐eight of the 34 studies compared non‐steroidal anti‐inflammatory drugs (NSAIDs) with steroids versus steroids. In 14 of these 28 studies, a placebo (for the NSAIDs) was used in the comparator group. This placebo was not specified in two trials (Quentin 1989; Rossetti 1996;); was artificial tears in five trials (Ticly 2014; Tzelikis 2015; Wittpenn 2008; Yung 2007; Zaczek 2014); a vehicle in six studies (Donnenfeld 2006; Kraff 1982; Singh 2012; Solomon 1995; Umer‐Bloch 1983; Yannuzzi 1981); and sterile saline drops in Almeida 2012. .
Six of the 34 studies compared NSAIDs (on their own) with steroids (Asano 2008; Brown 1996; Endo 2010; Italian Diclofenac Study Group 1997; Miyake 2007; Miyake 2011). Only one of these studies used a placebo in the steroid group; the contents of this placebo were not specified. (Italian Diclofenac Study Group 1997).
NSAIDs
The most frequently used NSAID was ketorolac (11 studies) followed by diclofenac (9 studies), nepafenac (7 studies), indomethacin (5 studies), bromfenac (4 studies), pranoprofen (1 study) and flurbiprofen (1 study). Four studies had two different NSAID groups ‐ ketorolac and nepafenac (Almeida 2012; Tzelikis 2015), ketorolac and bromfenac (Jung 2015) and flurbiprofen and indomethacin (Solomon 1995). We combined these groups for the analysis.
The ketorolac concentration was either 0.4% or 0.5%. Diclofenac was largely used at a concentration of 0.1% (7 studies) but also used at 1% in Li 2011 and concentration was not specified in one study (; Rossetti 1996). Nepafenac was used at 0.1% in six studies and 1% in one study (Singh 2012). Indomethacin 1% was used in three studies (Solomon 1995; Umer‐Bloch 1983; Yannuzzi 1981), 0.1% in Yavas 2007 while the concentration used was not specified in Kraff 1982. Bromfenac 0.1% was used in Miyanaga 2009, Jung 2015 and Wang 2013; it was not specified in Endo 2010. Flubiprofen was used at 0.03% (Solomon 1995). Pranopfen concentration was not specified (Zhang 2008).
Steroids
Prednisolone was used in 13 studies, usually at 1%.
Dexamethasone was used in 15 studies, at a concentration of 0.1% in eight studies and 1% in one study (Tunc 1999). The concentration used was not specified in 6 studies. It was combined with tobramycin in four studies (Cervantes‐Coste 2009; Li 2011; Rossetti 1996; Zhang 2008) and other antibiotics (Kraff 1982; Moschos 2012; Umer‐Bloch 1983).
Betamethasone was used at 0.1% in two studies (Asano 2008; Miyanaga 2009) and not specified in one study (Endo 2010).
Fluorometholone 0.1% was used as the sole topical corticosteroid therapy in three studies (Miyake 2007; Miyake 2011; Wang 2013) and used as part of a tapering regimen in one study (Kraff 1982).
The type of steroids used in Yannuzzi 1981 were not specified.
Other medications
Most studies reported the use of additional antibiotics. See Characteristics of included studies.
Outcomes
Maximum follow‐up ranged from one month (8 studies) to 12 months postoperatively (Kraff 1982; Yannuzzi 1981) (Table 6).
The majority of trials followed up to two months or less (23 studies). Five studies followed up to three months (Elsawy 2013; Singh 2012; Umer‐Bloch 1983; Yavas 2007; Yung 2007) and six studies followed up longer: 140 days (Italian Diclofenac Study Group 1997), six months (Quentin 1989; Rossetti 1996; Solomon 1995) and 12 months (Kraff 1982; Yannuzzi 1981). Kraff 1982 had a low follow‐up of 10 % at 12 months
Table 6 shows the outcomes reported in the studies.
Excluded studies
Risk of bias in included studies
See Figure 2

Risk of bias summary: review authors' judgements about each risk of bias item for each included study.
Allocation
The majority of trialists did not report sufficient information to judge selection bias. These trials were marked as unclear for sequence generation and allocation concealment. Only two trials were judged at low risk of bias on both sequence generation and allocation concealment (Tzelikis 2015; Wittpenn 2008).
Eight trials reported a method of sequence generation judged to be likely to generate an unpredictable sequence. Some trials used random number tables (Kraff 1982; Rossetti 1996; Wang 2013), other reports suggested computer‐generated random numbers or allocation schedules (Mathys 2010; Tzelikis 2015), others referred to random numbers or randomly generated lists but did not specify how these were created (Donnenfeld 2006; Moschos 2012; Wittpenn 2008).
Four trials reported a convincing method of allocation concealment (Asano 2008; Tzelikis 2015; Wittpenn 2008; Zaczek 2014). In Asano 2008 the assignment code was kept secret by a named individual until the end of the study; in Tzelikis 2015 all investigators were masked to treatment group; Wittpenn 2008 used a central co‐ordination centre for allocation and in Zaczek 2014 the allocation was prepared in such a way that neither investigators nor participants could identify the group.
In three studies, we judged that the allocation was probably not concealed adequately (Almeida 2008, Wang 2013; Yannuzzi 1981).
Blinding
Ten studies were not masked and we judged them to be at high risk of both performance and detection bias (Almeida 2008; Elsawy 2013; Endo 2010; Jung 2015; Li 2011; Miyanaga 2009; Moschos 2012; Tauber 2006; Wang 2013; Zhang 2008).
Eight studies were masked and we judged them to be at low risk of both performance and detection bias (Almeida 2012; Asano 2008; Kraff 1982; Singh 2012; Ticly 2014; Tzelikis 2015; Umer‐Bloch 1983; Zaczek 2014).
Two studies that did not mask participants, stated explicitly that outcome assessors were masked (Mathys 2010; Wittpenn 2008).
For six studies, there was not enough information to judge the risk of either performance or detection bias (Donnenfeld 2006; Miyake 2011; Quentin 1989; Rossetti 1996; Solomon 1995; Yung 2007).
Incomplete outcome data
We judged five studies to be at high risk of attrition bias. In Asano 2008, there was variable follow‐up by outcome, and it was not clearly explained why. Some of the stated exclusion criteria for the study, such as inflammation after surgery, would have been related to the outcome. In Endo 2010, follow‐up was unequal between study groups and reason for loss to follow‐up was not clearly reported. In Umer‐Bloch 1983, 35 people withdrew before the end of the study because of intraoperative complications or they had, as only later recognised, an exclusion criteria as defined as maculopathy, diabetic retinopathy, prior uveitis or a systemic steroid therapy. It was not reported to which groups these patients belonged. In Wittpenn 2008, there was very low follow‐up at six weeks, with 77/546 (14%) people followed‐up. In Yannuzzi 1981 there was a high loss to follow‐up at 12 months: 38/100 (38%) in the NSAIDs group and 50/131 (38%) in the control group were followed‐up.
We judged 11 studies to be at low risk of attrition bias. For the other studies there was not enough information to judge.
Selective reporting
For most studies there was little information to judge selective outcome reporting because we did not have access to a trial registry entry or study protocol. We judged three studies to be at low risk of selective outcome reporting on the basis that the trial was prospectively registered and all outcomes prespecified on the clinical trials registry entry were reported (Almeida 2008; Mathys 2010; Singh 2012). For three studies it was clear that some outcomes were not fully reported and so we judged them to be at high risk of selective outcome reporting bias (Asano 2008; Solomon 1995; Tauber 2006).
Effects of interventions
See: Summary of findings for the main comparison NSAIDS plus steroids compared with steroids for the prevention of macular oedema after cataract surgery; Summary of findings 2 NSAIDS compared with steroids for the prevention of macular oedema after cataract surgery
Non‐steroidal anti‐inflammatory drugs plus steroids versus steroids
Primary outcome
Poor vision due to macular oedema
Five studies reported this outcome at three months (eyes = 1360) (Analysis 1.1). Follow‐up ranged from four weeks to two months. Two studies reported optical coherence tomography (OCT)‐confirmed macular oedema (MO) with visual acuity < 6/9 in one study (Wittpenn 2008) but the level of visual impairment not defined in the other (Wang 2013). Solomon 1995 defined the presence of clinical MO as visual acuity <=20/40 and angiographic evidence of CMO. Cervantes‐Coste 2009 reported that none of the participants developed clinically significant macular oedema nor vision loss. Chatziralli 2011 reported that none of the participants developed clinically significant CMO as assessed via fundoscopy and the Amsler grid test. There was some evidence of selective reporting in Solomon 1995, which provided most of the information for the meta‐analysis. Data were only reported for the earlier follow‐up at days 21 to 60. Quote: "By day 121‐240 the incidence of clinical CME [cystoid macular edema] was less than 2% in all three groups and no significant differences were seen."
People receiving non‐steroidal anti‐inflammatory drugs (NSAIDs) combined with steroids had a lower risk of poor vision due to macular oedema (MO) at three months after surgery compared with people receiving steroids alone. The pooled risk ratio (RR) was 0.41, 95% confidence interval (CI) 0.23 to 0.76; eyes = 1360; studies = 5. There was no evidence of any major inconsistency (I2 = 5%). We judged this to be low‐certainty evidence (summary of findings Table for the main comparison). We downgraded for risk of bias, as the trials were poorly reported and were largely at high or unclear risk of bias. We downgraded for indirectness, as the outcomes reported by the trials only approximated the outcome which we wished to collect, which was poor vision (best corrected visual acuity (BCVA) < 6/9) due to MO.
One study reported this outcome at 12 months (Yannuzzi 1981). There was high attrition in this study (only 38% of eyes followed up) and only two events (RR 1.32, 95% CI 0.09 to 20.37; eyes = 88). We judged this to be very low‐certainty evidence, downgrading for risk of bias and imprecision (2 levels; summary of findings Table for the main comparison).
Secondary outcomes
Quality of life/patient satisfaction
One study reported quality of life at 1 month after surgery using the Comparison of Ophthalmic Medications for Tolerability (COMTOL) questionnaire (Almeida 2012), No differences in the impact upon quality of life measures were identified between the treatment and control groups. The use of topical NSAIDs was also reported to have good tolerability and comparable side‐effect profile to placebo. However the data in this study were not fully reported and a response rate of only 60% was achieved with significant attrition with 65 out of 162 patients declining to answer the interview after surgery for "logistical reasons".
Quote: "The global [health‐related quality of life] HRQOL questions showed no difference in the extent to which quality of life was affected by medication side effects between “not at all” and any reported effect (question 6; P = 0.8476). Regarding the extent quality of life was affected by activity limitations, there was no difference between “not at all” and any reported limitations (question 9; P = 0.8584). According to the COMTOL questionnaire, there was no difference in compliance between the 3 study groups (question 10; P = 0.3801). Most patients in all 3 groups reported being satisfied with the medication, and there was no difference between satisfied responses and dissatisfied responses (question 11; P = 0.4777)").
Central retinal thickness
Nine studies reported this outcome (eyes = 1112) (Analysis 1.2). Follow‐up ranged from one to two months. Six studies reported central retinal thickness at the end of the follow‐up period, three studies reported change in thickness from baseline. Trial results were inconsistent (I2 = 87%). Results ranged from ‐30.9 µm in favour of NSAIDs plus steroids to +7.44µm in favour of steroids alone (summary of findings Table for the main comparison).
Six studies reported change in macular volume (eyes = 570) (Analysis 1.3). The pooled mean difference (MD) was ‐0.14 mm3 (95% CI ‐0.21 to ‐0.07). There was some inconsistency (I2 = 50%), mainly attributable to Mathys 2010.
Adverse effects
See Table 7. In the studies that reported adverse effects, no evidence of serious adverse events were seen. The most notable adverse effect associated with NSAID use was burning or stinging sensation.
| Study | Follow‐up | Number of people followed up | Adverse effects |
| 1 month | 74 | Quote: "There were 3 dropouts in the treatment group related to ketorolac corneal toxicity, most notably pain attributed to the drops." | |
| 1 month | 162 | Quote: “One patient in the ketorolac group was hospitalized with a cardiovascular event and could not complete the follow‐up. Finally, 1 patient on nepafenac had side effects of ocular redness and irritation and could not continue with the study.” | |
| 8 weeks | 142 | 2 "complications" not specified. | |
| 1 month | NR | Adverse effects not reported. | |
| 6 weeks | 60 | Quote: "There were no serious treatment‐related adverse events or toxicity related to the use of nepafenac 0.1%." | |
| 6 weeks | 138 | Quote: "All patients reported pain and ocular discomfort lower than 1/10 on the visual analog scale at all time points." | |
| 2 weeks | 100 | Quote: "Use of ketorolac 0.4% for 1 or 3 days provided decreased levels of patient discomfort intraoperatively and postoperatively. Intraoperatively, 3 days of ketorolac 0.4% provided significantly lower discomfort scores than with 1‐hour and placebo dosing (P < 0.001). One day of ketorolac 0.4% also provided significantly reduced intraoperative discomfort scores than with 1‐hour dosing (P = 0.001) and placebo dosing (P < 0.001). Postoperatively, 3 days of ketorolac 0.4% provided significantly lower discomfort scores than 1‐hour dosing or control dosing (P < 0.001) (Figure 5). In addition, patients randomised to 1 or 3 days of ketorolac 0.4% were significantly less likely to require additional intravenous anesthesia (8% in each group) than patients in the control group (40%) (P = 0.008). Twenty percent of patients in the 1‐hour group required additional anesthesia for pain control." | |
| 12 weeks | 86 | Adverse effects not reported. | |
| 6 weeks | 62 | Quote: "No adverse events were noted in either group." | |
| 140 days | 229 | Quote: "No major adverse effects were noted in either group." "Subjective tolerance of the two treatments was good and remained similar throughout the study, although a trend towards increased burning was seen in the diclofenac group." | |
| 1 month | 91 | Quote: "There were no adverse events except for a mild burning sensation in one patient in the ketorolac group; the symptom was tolerable and did not lead to discontinuation of the medication." | |
| between 2.5 and 12 months | 492 | Quote: "There were no complications that could be ascribed to the use of topical indomethacin other than minor stinging and burning noted by the patients." | |
| 1 month | 217 | Adverse effects not reported. | |
| 2 months | 79 | Quote: "There were no adverse events reported by patients using nepafenac." | |
| 5 weeks | 50 | Adverse effects not reported. | |
| 5 weeks | 55 | NSAIDs: 6 adverse effects: decreased lacrimation, conjunctivitis allergic, abnormal sensation in eye, vomiting (2), constipation. Steroid group: 9 adverse effects: decreased lacrimation, conjunctivitis allergic, retinal haemorrhage, keratoconjunctivitis sicca, chorioretinopathy, influenza, insomnia, diarrhoea, humeral fracture. | |
| 2 months | 72 | Adverse effects not reported. | |
| 1 month | 79 | Adverse effects not reported. | |
| 180 days | 112 | Quote: "Diclofenac group: two patients were feeling burning after application of eye drops during the stationary care, for placebo: none. In both groups burning was reported later on in the examinations." | |
| 6 months | 88 | Quote: "Treatment regimens were well tolerated with no evidence of relevant side effects." | |
| 90 days | 251 | Quote: "No patient deaths were reported during the study. Overall, 13 patients reported other serious adverse events, none of which were related to treatment. Three of the serious adverse events reported in the vehicle group (cardiac failure congestive, coronary artery occlusion, and pancreatitis) led to patient discontinuation; no other serious adverse events led to discontinuation in either treatment group. Separate from the three patients who discontinued due to serious adverse events, four other patients discontinued study participation due to nonserious adverse events. Of these nonserious events, two reported instances of punctate keratitis (one in each treatment group) were assessed as being related to the study drugs. No instances of targeted adverse events (defined as corneal erosions) were reported during the study. Two reports of punctate keratitis and a single report of corneal epithelium defect were assessed as being related to treatment with nepafenac. A single report of punctate keratitis was assessed as being related to treatment with vehicle. No other ocular or nonocular adverse events reported in the study were assessed as being related to the study drugs. In both treatment groups, corneal staining and intraocular pressure were each generally similar at the presurgical baseline and at the day 90 visit (or early exit). Additionally, no safety issues or trends were identified based upon changes from baseline in fundus parameters (retina/macula/choroid and optic nerve) and ocular signs (inflammatory cells, aqueous flare, corneal oedema, and bulbar conjunctival injection). The study results indicate no new clinically relevant risks associated with increasing the dosing of nepafenac from 14 days to 90 days, even in the higher‐risk diabetic patient population." | |
| 6 months | 364 | Quote: "During the study, the mean severity of foreign‐body sensation, pain, photophobia, and tearing did not become more than mild (1 +) in any treatment group. This was also true of burning and stinging following treatment instillation (Figure 4). The severity of burning and stinging was significantly greater in the flurbiprofen group on days 4‐20 and 21‐60 and in the indomethacin group on days 1‐3, 4‐20, 21‐60, and 61‐120 than in the vehicle group. At day 1‐3, moderate to severe burning and stinging were reported by 7.0% (16/230) of the patients treated with flurbiprofen, 9.7% (23/237) of the patients treated with indomethacin, and 3.1% (7/224) of the patients treated with vehicle." | |
| 30 days (3 months mentioned but not reported) | 32 | Adverse effects not reported. | |
| 5 weeks | 81 | One patient withdrew because of burning. | |
| 2 months | 75 | Adverse effects not reported. | |
| 1 month | 126 | Quote: "There were no adverse side effects in either group." | |
| 12 weeks | 73 | Quote from translation: "40% reported a short burning after using indomethacin eye drops, only rare in patients of the placebo group. One patient had 6 weeks after treatment an allergic blepharitis due to indomethacin. Long‐term: 52 patients were followed for 6 months and 34 patients one year. 4 patients with indomethacin had visual acuity reduction because of a clinically new cystoid edema; 2 of these patients had spontaneous healing after 4‐6 weeks, the other 2 edema cases did not resolve. 2 patients had a new senile macula pathology, and 2 patients had a retinal detachment due to aphakia. Placebo: 2 patients still had an edema after 12 weeks, while one patient developed a new edema later." | |
| 2 months | 167 | Quote: "No drug‐related adverse events were identified." | |
| 4 weeks | 478 | Quote: "The most commonly reported adverse events (investigator self‐report) in the ketorolac/steroid group were burning/stinging/tearing (4/268). Transient elevations in intraocular pressure (IOP) were the most commonly reported adverse event in the steroid group (3/278). There were two serious adverse events, both in the steroid group: one patient developed endophthalmitis and one patient died (cause determined to be unrelated to the study medication)." | |
| 1 year | 231 | Adverse effects not reported. | |
| 3 months | 179 | Adverse effects not reported. | |
| 12 weeks | 37 | Adverse effects not reported. | |
| 6 weeks | 152 | Quote: "Mild to moderate punctuate epithelial defects of the cornea were found in both groups 3 weeks after treatment.Statistically significantly more patients in the nepafenac group than in the control group had corneal fluorescein staining (20 [26.7%] versus 8 [10.4%]) (PZ.0119). Headache was reported by 3 patients (4.0%) in the nepafenac group and 2 patients (2.6%) in the control group (PZ.9750). No other systemic or local untoward effects were recorded during 3 weeks of treatment in either study group." | |
| 1 month | 220 | Adverse effects not reported. |
Resource use and costs
None of the studies commented on this.
Additional National Institute for Health and Care Excellence (NICE) outcomes
Macular oedema (MO) (clinically symptomatic, optical coherence tomography‐verified)
Twenty‐one studies reported this outcome (eyes = 3638) (Analysis 1.4). Follow‐up ranged from two weeks to just less than six months.
Most studies reported "cystoid" macular oedema but it was not always clearly defined nor was it clear that it was clinically significant. Nine studies used OCT, although it was not always clear if the OCT was used to verify the MO; nine studies used fluorescein angiography, often using the Miyake 1977 classification; clinical assessment for the presence of MO was made in two studies.
There was an asymmetric funnel plot, suggesting that publication bias might be an issue (Figure 3).

Funnel plot of comparison: 1 NSAIDs plus steroids versus steroids, outcome: 1.4 Macular oedema.
People receiving NSAIDs combined with steroids had a lower risk of MO after surgery compared with people receiving steroids alone. The pooled RR was 0.40, 95% CI 0.32 to 0.49; I2 = 0%. We judged this to be low‐certainty evidence (summary of findings Table for the main comparison). We downgraded one level for risk of bias, as the studies were at unclear or high risk of bias and we downgraded one level for publication bias as an asymmetric funnel plot was suggestive of publication bias. We considered downgrading one level for indirectness, as the MO was not always OCT‐verified and it was not always clear if the MO was clinically significant but in the event did not as the size of the effect was strong.
Inflammation
Three studies reported inflammation as a dichotomous outcome (Analysis 1.5). In Cervantes‐Coste 2009 there were no cases of "inflammatory cells greater than 1+ during first week of postoperative visits." In Chatziralli 2011, at day 28, inflammation, which was defined as corneal oedema or Tyndall reaction or conjunctival hyperemia was seen in two participants in the NSAIDs plus steroid group (RR 4.86, 95% CI 0.24 to 99.39); by day 35 this had disappeared. In Zhang 2008, 20 participants in the steroids group had inflammation defined as "Tyn granule +" compared to 0 participants in the NSAIDs plus steroids group at one month (RR 0.02, 95% CI 0.00 to 0.38). In view of such different results, we did not pool the data from these trials.
Two studies reported flare in photons/millisecond (eyes = 216) (Analysis 1.6). The MD was ‐1.41 photons/millisecond in favour of NSAIDs plus steroids (95% CI ‐2.30 to ‐0.52), but there was some inconsistency between the two studies (I2 = 49%). There was some evidence of skew for the control group of Miyanaga 2009 (mean/standard deviation (SD) < 2).
Jung 2015 reported "summed ocular inflammation score" which was the sum of the scores of cells and flare, scored against a maximum total score of 9. The inflammatory score at one month was 0.21 ± 0.42 in the bromfenac group and 0.32 ± 0.48 in the ketorolac group (P = 0.853). The score in the control group was 0.84 ± 0.76.
Best corrected visual acuity
Ten studies reported BCVA (eyes = 1158) (Analysis 1.7). For Mathys 2010 change in BCVA was reported in letters. We converted this to logMAR score by multiplying by ‐0.02 and we estimated the SD from the P value.
There was statistical heterogeneity (I2 = 70%), and not all effect estimates were in the same direction, so we did not provide a pooled estimate. However, we note that most studies found differences clinically indistinguishable from no difference.
Non‐steroidal anti‐inflammatory drugs versus steroids
Primary outcome
Poor vision due to macular oedema
None of the studies reported this outcome.
Secondary outcomes
Quality of life/patient satisfaction
None of the studies reported this outcome.
Central retinal thickness
Two studies reported central retinal thickness (Analysis 2.1). The pooled MD was ‐22.64 µm (95% CI ‐38.86 to ‐6.43; I2 = 0%) in favour of NSAIDs. We judged this to be low‐certainty evidence (summary of findings Table 2). We downgraded one level for risk of bias, as the studies were at unclear or high risk of bias, and we downgraded one level for imprecision as the confidence intervals include a clinically unimportant effect.
Adverse effects
See Table 7. In the studies that reported adverse effects, no evidence of serious adverse events were seen. The most notable adverse effect associated with NSAID use was burning or stinging.
Resource use and costs
None of the studies commented on this.
Additional NICE outcomes
Macular oedema (clinically symptomatic, optical coherence tomography‐verified)
Five studies reported this outcome (eyes = 520) (Analysis 2.2). All studies assessed MO using fluorescein angiography. The pooled RR was 0.27 (95% CI 0.18 to 0.41) in favour of NSAIDs. We note that for Asano 2008 there may have been selective reporting ‐ data on MO were reported only at five weeks, but were not reported at the end of eight weeks follow‐up in that study.
We judged this to be low‐certainty evidence (summary of findings Table 2). We downgraded one level for risk of bias, as the studies were at unclear or high risk of bias and we downgraded one level for publication bias because of an asymmetric funnel plot suggestive of publication bias (Figure 4). We would not usually do a funnel plot with so few studies, but as the funnel plot for this outcome, for the comparison NSAIDs plus steroids versus steroids alone was asymmetric (Figure 3), we felt that publication bias may be an issue here as well.
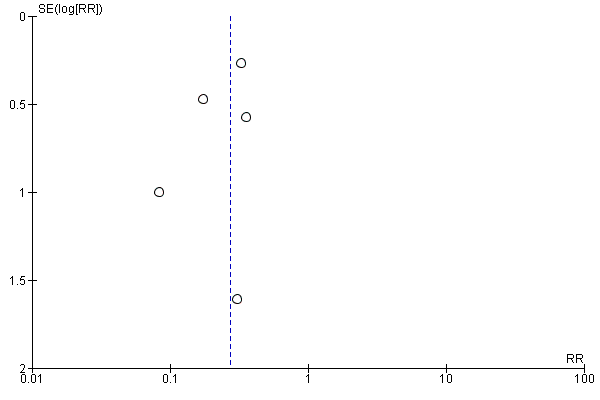
Funnel plot of comparison: 2 NSAIDs versus steroids, outcome: 2.2 Macular oedema.
Inflammation
Five studies reported aqueous flare (eyes = 346) (Analysis 2.3). There was substantial inconsistency ( I2 = 68%) and some evidence of skewed data so we did not report a pooled value.
Best corrected visual acuity
Three studies reported BCVA (eyes = 220) (Analysis 2.4). There was statistical heterogeneity (I2 = 84%) so we did not report a pooled value, but we note that all three studies found between group differences that were clinically indistinguishable from no difference.
Discussion
Summary of main results
See summary of findings Table for the main comparison; summary of findings Table 2.
We identified 34 studies that were conducted in the Americas, Europe, the Eastern Mediterranean region and South‐East Asia.
Over 5000 people were randomised in these trials. The majority of studies probably enrolled one eye per participant, a small subset (4 trials) enrolled a proportion of people with bilateral surgery. Twenty‐eight of these 34 studies compared non‐steroidal anti‐inflammatory drugs (NSAIDs) plus steroids with steroids alone. Six studies compared NSAIDs (on their own or with placebo) with steroids. A variety of NSAIDs were used, including ketorolac, diclofenac, nepafenac, indomethacin, bromfenac and pranopfen. Follow‐up ranged from one month to 12 months. The majority of studies (n = 23) followed up to two months or less. In general, the studies were poorly reported. We did not judge any of the studies at low risk of bias in all domains.
There was low‐certainty evidence that people receiving topical NSAIDs in combination with steroids may have a lower risk of poor vision due to macular oedema (MO) at three months after cataract surgery compared with people receiving steroids alone (risk ratio (RR) 0.40, 95% confidence interval (CI) 0.27 to 0.61; eyes = 1360; studies = 5; I2 = 5%). There were very little data for 12 months (only one study reported poor vision due to MO at this time point) and we judged this to have very low‐certainty evidence. Similarly, we judged the evidence on 'clinically symptomatic MO' to be low‐certainty. There was evidence on central retinal thickness at three months, but this was inconsistent (I2 = 87%). Results ranged from ‐30.9 microns in favour of NSAIDs plus steroids to 7.44 microns in favour of steroids alone. Similarly, data on best corrected visual acuity (BCVA) were inconsistent. Nine out of 10 trials reporting this outcome found between‐group differences of less than 0.1 logMAR.
None of the six studies comparing NSAIDs alone with steroids reported on poor vision due to MO at three months or 12 months. We judged the evidence on MO to be low‐certainty. There was low‐certainty evidence that mean central retinal thickness was lower in the NSAIDs group at three months (mean difference (MD) ‐22.64 microns, 95% CI ‐38.86 to ‐6.43; eyes = 121; studies = 2; I2 = 0%). Two studies reported BCVA at three months, and the results of these trials were inconsistent, but both found differences of less than 0.1 logMAR between groups.
Quality of life was only reported in one of the 34 studies, and it was not fully reported other than to comment on lack of differences between groups. In general, no major adverse events were noted ‐ the main consistent observation was burning or stinging.
Overall completeness and applicability of evidence
There were a relatively large number of trials, and these studies have a wide global range which means their results will be globally applicable.
The included studies compared NSAIDs and steroids in cataract surgery using phacoemulsification, extracapsular cataract extraction (ECCE) and intracapsular cataract extraction (ICCE) surgical techniques. However, the more recent trials exclusively used phacoemulsification, which may make their findings less applicable to parts of the world where resources are less available and ECCE is standard.
The aim of this review was to assess whether the use of NSAIDs had an impact on visual loss due to MO in the long‐term. The evidence is very sparse with respect to that question, with only one study with high attrition, reporting on visual loss due to MO at 12 months after surgery. This is clearly an important gap in the evidence.
There are many trials looking at the short‐term effects of NSAIDs, but there is considerable variation in terms of types, doses and regimens of NSAIDs and steroids used. One aspect that we have not highlighted in this review, but has been discussed elsewhere (Kim 2016a), is the potency of the steroid used in the comparison group. Use of low potency steroids, such as fluorometholone 0.1%, may lead to an overestimate of the relative effect of NSAIDs.
Certainty of the evidence
We graded the evidence as low‐ to very low‐certainty. In general, the trials were poorly reported and it was difficult to judge the extent to which bias had been avoided. We did not judge any of the studies at low risk of bias for all domains. Many trials were not properly masked and, in a few studies, there were problems with attrition bias and selective outcome reporting. For outcomes that had more data we identified the possibility of publication bias with an asymmetric funnel plot. There were also problems with directness. For example, many studies reported "CMO" but were not clear whether or not this was 'clinically significant', or indeed what this meant in terms of whether it caused both symptoms and signs. And in many of the older studies this could not be verified by optical coherence tomography (OCT).
Potential biases in the review process
We have made several modifications to the original protocol (see Differences between protocol and review), but these were made before the data extraction and analysis phases of the review.
Agreements and disagreements with other studies or reviews
A recent systematic review and meta‐analysis has been published (Wielders 2015). This review included 17 trials. The reason why they had fewer trials than the current review was because they only included studies of phacoemulsification cataract surgery and they excluded studies that did not report the incidence of cystoid macular oedema (CMO).
The review by Wielders 2015 reported effect measures in the same order of magnitude as that suggested by this review, but because they reported odds ratios (ORs), rather than risk ratios (RRs), these effect estimates are exaggerated (further away from null). The authors concluded that the odds of CMO were reduced in people who were given NSAIDs, but they did not incorporate a judgement on the overall certainty (or quality) of the evidence in their conclusions, even though they had assessed the risk of bias in the included trials using two different methods. It is also notable that, although the abstract highlights the fact that 17 trials were included in the review, it is less clearly pointed out that the effect estimates were based on a relatively small subset of these trials. This review was subsequently criticised because it did not fully incorporate an assessment of visual loss due to CMO, because the conclusions were based on so few trials, and because of the likely exclusion of studies that did not report any events (Kim 2016).
A report by the American Academy of Ophthalmology, also published in 2015, was more conservative in its conclusions (Kim 2015). This was a narrative review of the literature with no meta‐analysis, nor any assessment of the quality of the evidence. They concluded that NSAIDs reduced the incidence of CMO, and may increase visual recovery, depending on the treatment of the comparator group, however, they concluded that the use of NSAIDs did not alter long‐term (3 months) visual outcomes, a finding which is supported by the current review.
One slightly older systematic review published in 2014, included 15 trials and did include an overall GRADE assessment of the certainty of the evidence, which they judged to be low‐ to moderate‐certainty for inflammation, low‐certainty for visual acuity and high‐certainty for CMO (Kessel 2014). This review again focused on phacoemulsification. It was restricted to the comparison of NSAIDs (on their own or with placebo) versus steroids alone. They cited the previously published protocol of this review justifying theirs as being different for these two reasons. They evaluated inflammation within one week of surgery and MO at any time point. There are some differences between the current review and Kessel 2014 in terms of the included studies. This is because the searches for the current review were restricted to evidence relating to MO. However, the trials contributing data to the analysis of MO are similar in the two reviews. Kessel 2014 included one study that we judged was probably not a randomised controlled trial (RCT) (Miyake 2000), and one study that we have included in the NSAIDs plus steroids comparison (Wang 2013). The estimates of effect for MO reported in Kessel 2014 and reported in this review are of a similar order of magnitude, although Kessel 2014 reports a stronger effect. This can be attributed to the fact that, when extracting data from studies using the Miyake 1977 classification, Kessel 2014 considered Grades 2 to 3 as MO, whereas in the current review we considered Grades 1 to 3. The main difference between the reviews is in the grading of the certainty of the evidence. Kessel 2014 considered the evidence to be high‐certainty. It is not clearly stated why, but the footnote refers to a RR of 6, which we understand to mean that it is a strong effect, therefore they have not downgraded. We have considered the evidence on MO to be low‐certainty, downgrading for risk of bias and publication bias (summary of findings Table 2).
Risk of bias summary: review authors' judgements about each risk of bias item for each included study.
Funnel plot of comparison: 1 NSAIDs plus steroids versus steroids, outcome: 1.4 Macular oedema.
Funnel plot of comparison: 2 NSAIDs versus steroids, outcome: 2.2 Macular oedema.

Comparison 1 NSAIDs plus steroids versus steroids, Outcome 1 Poor vision due to MO.

Comparison 1 NSAIDs plus steroids versus steroids, Outcome 2 Central retinal thickness.

Comparison 1 NSAIDs plus steroids versus steroids, Outcome 3 Total macular volume.

Comparison 1 NSAIDs plus steroids versus steroids, Outcome 4 Macular oedema.

Comparison 1 NSAIDs plus steroids versus steroids, Outcome 5 Inflammation.

Comparison 1 NSAIDs plus steroids versus steroids, Outcome 6 Inflammation (flare).

Comparison 1 NSAIDs plus steroids versus steroids, Outcome 7 BCVA.

Comparison 2 NSAIDs versus steroids, Outcome 1 Central retinal thickness.

Comparison 2 NSAIDs versus steroids, Outcome 2 Macular oedema.

Comparison 2 NSAIDs versus steroids, Outcome 3 Inflammation (flare).

Comparison 2 NSAIDs versus steroids, Outcome 4 BCVA.
| NSAIDs plus steroids compared with steroids for the prevention of macular oedema after cataract surgery | ||||||
| Patient or population: people having cataract surgery Setting: eye hospital | ||||||
| Outcomes | Anticipated absolute effects* (95% CI) | Relative effect | № of participants | Certainty of the evidence | Comments | |
| Risk with steroids | Risk with NSAIDs plus steroids | |||||
| Poor vision due to MO at 3 months after surgery | 74 per 1000 | 30 per 1000 | RR 0.41 | 1360 | ⊕⊕⊝⊝ | ‐ |
| Poor vision due to MO at 12 months after surgery | 20 per 1000 | 26 per 1000 | RR 1.32 | 88 | ⊕⊝⊝⊝ | ‐ |
| Quality of life at 3 months after surgery | See comment | ‐ | ‐ | 74 (1 RCT) | ‐ | Reported in 1 study only using COMTOL questionnaire. Data not fully reported but no significant differences in terms of quality of life, compliance and satisfaction scores. |
| Central retinal thickness at 3 months after surgery; | See comment | ‐ | ‐ | 1021 | ‐ | Trial results were inconsistent (I2 = 87%). Results ranged from ‐30.9 microns in favour of NSAIDs plus steroids to +7.44 microns in favour of steroids alone. |
| Adverse effects | See comment | ‐ | ‐ | (18 RCTs) | ‐ | In general, no major adverse effects were noted. The main consistent observation was burning or stinging sensation with use of NSAID drops. |
| MO at 3 months after cataract surgery, clinically symptomatic, | 130 per 1000 | 52 per 1000 (42 to 64) | RR 0.40 (CI 0.32 to 0.49) | 3638 (21 RCTs) | ⊕⊕⊝⊝ | |
| BCVA at 3 months after surgery; | See comment | ‐ | ‐ | 1158 | ‐ | Trial results were inconsistent (I2 = 70%), but all except one study found differences less than 0.1 logMAR, i.e. clinically indistinguishable from no difference. |
| *The risk in the intervention group (and its 95% CI) is based on the assumed risk in the comparison group and the relative effect of the intervention (and its 95% CI). | ||||||
| GRADE Working Group grades of evidence | ||||||
| 1 Downgraded 1 level for risk of bias: studies at unclear or high risk of bias. 5 We considered downgrading an additional 1 level for indirectness as the MO was not always OCT‐verified and it was not always clear if the MO was clinically symptomatic. However, we did not do so partly because the size of the effect was quite strong. | ||||||
| NSAIDscompared with steroids for the prevention of macular oedema after cataract surgery | ||||||
| Patient or population: people having cataract surgery | ||||||
| Outcomes | Anticipated absolute effects* (95% CI) | Relative effect | № of participants | Certainty of the evidence | Comments | |
| Risk with steroids | Risk with NSAIDs | |||||
| Poor vision outcome due to MO at 3 months after surgery | ‐ | ‐ | ‐ | ‐ | ‐ | No data were available for this outcome. |
| Poor vision outcome due to MO at 12 months after surgery | ‐ | ‐ | ‐ | ‐ | ‐ | No data were available for this outcome. |
| Quality of life at 3 months after surgery | No data were available for this outcome. | |||||
| Central retinal thickness at 3 months after surgery; | The mean central retinal thickness at 3 months after surgery was 228 microns | MD 22.64 microns lower | ‐ | 121 | ⊕⊕⊝⊝ | ‐ |
| Adverse effects | ‐ | ‐ | ‐ | 488 | ‐ | 1 study had 2 unspecified complications in 142 participants, 2 studies reported that no adverse events were noted in either group, 1 study (55 people) mentioned 15 mild adverse effects but unclear if related to treatment. |
| MO at 3 months after cataract surgery; clinically symptomatic | 130 per 1000 | 35 per 1000 (23 to 53) | RR 0.27 (0.18 to 0.41) | 520 (5 RCTs) | ⊕⊕⊝⊝ | |
| BCVA at 3 months after surgery; | See comment | ‐ | ‐ | 220 | ‐ | Trial results were inconsistent (I2 = 84%), but all studies found differences less than 0.1 logMAR, i.e. clinically indistinguishable from no difference. |
| *The risk in the intervention group (and its 95% CI) is based on the assumed risk in the comparison group and the relative effect of the intervention (and its 95% CI). | ||||||
| GRADE Working Group grades of evidence | ||||||
| 1 Downgraded 1 level for risk of bias: studies at unclear or high risk of bias. 3 We considered downgrading 1 level for indirectness as the MO was not always OCT‐verified and not always clear if it was clinically symptomatic however we did not do so, partly because the effect was strong. | ||||||
| Domain | Risk of bias | ||
| Low | Unclear | High | |
| Sequence generation | Computer‐generated list, random table, other method of generating random list. | Not reported how list was generated. Trial may be described as “randomised” but with no further details. | Alternate allocation, date of birth, records (these RCTs should be excluded). |
| Allocation concealment | Central centre (web/telephone access), sealed opaque envelopes. | Not reported how allocation administered. Trial may be described as “randomised” but with no further details. | Investigator involved in treatment allocation or treatment allocation clearly not masked. |
| Blinding of participants and personnel | Clearly stated that participants and personnel not aware of which treatment received. | Described as “double‐blind” with no information on who was masked. | Open‐label or no information on masking. We assume that in absence of reporting on this outcome, patients and personnel were not masked. |
| Blinding of outcome assessors | Clearly stated that outcome assessors were masked. | Described as “double‐blind” with no information on who was masked. | Open‐label or no information on masking. We assume that in absence of reporting on this outcome, assessors were not masked. |
| Incomplete outcome data | Missing data less than 20% (i.e. more than 80% follow‐up) and equal follow‐up in both groups and no obvious reason why loss to follow‐up should be related to outcome. | Follow‐up not reported or missing data > 20% (i.e. follow‐up < 80%) but follow‐up equal in both groups. | Follow‐up different in each group and/or related to outcome. |
| Selective outcome reporting | All outcomes in protocol and/or trial registry entry are reported. | No access to protocol or trial registry entry. | Outcomes in protocol and/or trial registry entry selectively reported. |
| Other sources of bias Note: we did not identify any important sources of other bias so this domain is omitted from the risk of bias tables. | No other source of bias. | Trial stopped early due to poor recruitment. Baseline imbalance, but not clear that it is important. | Trial stopped early because of outcome. Important baseline imbalance that might have an effect on the results. |
| Study | Country | Open‐label | Funding sources | Declaration of interest | Trial registration | Abstract only | |
| 1 | Canada | Yes | Non‐industry | Reported; no CoI | NCT00335439 | No | |
| 2 | Canada | No | Non‐industry | Reported; no CoI | NCT01395069 | No | |
| 3 | Japan | No | Not reported | Reported; no CoI | Not registered | No | |
| 4 | USA | No | Industry | Not reported | Not registered | No | |
| 5 | Mexico | No | Not reported | Reported; no CoI | Not registered | No | |
| 6 | Greece | No | Not reported | Not reported | Not registered | No | |
| 7 | USA | No | Industry/Non‐Industry | CoI | Not registered | No | |
| 8 | Egypt | No | Not reported | Reported; no CoI | Not registered | No | |
| 9 | Japan | Yes | Not reported | Reported; no CoI | Not registered | No | |
| 10 | Italy | No | Not reported | CoI | Not registered | No | |
| 11 | South Korea | No | Non‐industry | Reported; no CoI | Not registered | No | |
| 12 | USA | No | Non‐industry | Not reported | Not registered | No | |
| 13 | China | No | Not reported | Not reported | Not registered | No | |
| 14 | USA | No | Non‐industry | Reported; no CoI | NCT00494494 | No | |
| 15 | Japan | No | Not reported | Reported; no CoI | Not registered | No | |
| 16 | Japan | No | Not reported | CoI | Not registered | No | |
| 17 | Japan | No | Not reported | Not reported | Not registered | No | |
| 18 | Greece | No | Not reported | Reported; no CoI | Not registered | No | |
| 19 | Germany | No | Not reported | Not reported | Not registered | No | |
| 20 | Italy | No | Not reported | Reported; no CoI | Not registered | No | |
| 21 | USA | No | Not reported | CoI | NCT00782717 | No | |
| 22 | Canada (8 sites) and Germany (2 sites) | No | Industry | Reported; no CoI | Not registered | No | |
| 23 | USA | No | Industry | CoI | Not registered | Yes | |
| 24 | Brazil | No | Not reported | Reported; no CoI | Not registered | No | |
| 25 | Turkey | No | Not reported | Not reported | Not registered | No | |
| 26 | Brazil | No | Not reported | Reported; no CoI | NCT02084576 | No | |
| 27 | Switzerland | No | Not reported | Not reported | Not registered | No | |
| 28 | China | Yes | Non‐industry | Not reported | Not registered | No | |
| 29 | USA | No | Industry | CoI | NCT00348244 | No | |
| 30 | USA | No | Non‐industry | Not reported | Not registered | No | |
| 31 | Turkey | No | Not reported | Reported; no CoI | Not registered | No | |
| 32 | USA | No | Not reported | Not reported | Not registered | No | |
| 33 | Sweden | No | Industry/Non‐industry | Reported; no CoI | Not registered | No | |
| 34 | China | No | Not reported | Not reported | Not registered | No | |
| CoI: conflict of interest | |||||||
| Study | Number of people randomised | Number of people randomised (missing data imputed)* | Number of eyes | Number of eyes estimated (missing data imputed)* | Number of people followed up | Number of people followed up (missing data imputed)* | Percentage follow‐up | Eyes per person enrolled in the trial | |
| 1 | 98 | 98 | 106 | 106 | ‐ | 74 | 75% | 106 eyes of 98 people | |
| 2 | 193 | 193 | ‐ | 193 | 162 | 162 | 84% | Probably one | |
| 3 | 150 | 150 | 150 | 150 | 142 | 142 | 95% | One eye | |
| 4 | ‐ | ‐ | ‐ | ‐ | ‐ | ‐ | Probably one | ||
| 5 | 60 | 60 | 60 | 60 | 60 | 60 | 100% | One eye | |
| 6 | 145 | 145 | 145 | 145 | 138 | 138 | 95% | Probably one | |
| 7 | 100 | 100 | ‐ | 100 | ‐ | 100 | ‐ | Unclear | |
| 8 | 70 | 70 | 86 | 86 | ‐ | 86 | ‐ | 86 eyes of 70 patients | |
| 9 | 75 | 75 | 75 | 75 | 62 | 62 | 83% | One eye | |
| 10 | 281 | 281 | 281 | 281 | 229 | 229 | 81% | One eye | |
| 11 | 91 | 91 | 91 | 91 | Not reported | 91 | Not reported | One eye | |
| 12 | 500 | 500 | ‐ | 500 | 492 | 492 | 98% | Unclear | |
| 13 | 217 | 217 | 217 | 217 | ‐ | 217 | ‐ | One eye | |
| 14 | 84 | 84 | 84 | 84 | 79 | 79 | 94% | One eye | |
| 15 | 62 | 62 | 62 | 62 | 50 | 50 | 81% | Probably one | |
| 16 | 60 | 60 | 60 | 60 | 55 | 55 | 92% | One eye | |
| 17 | 72 | 72 | 72 | 72 | ‐ | 72 | ‐ | One eye | |
| 18 | 79 | 79 | 79 | 79 | ‐ | 79 | ‐ | One eye | |
| 19 | 179 | 179 | 179 | 179 | 112 | 112 | 63% | One eye | |
| 20 | 88 | 88 | 88 | 88 | ‐ | 88 | ‐ | Probably one | |
| 21 | 263 | 263 | 263 | 263 | 251 | 251 | 95% | One eye | |
| 22 | 681 | 681 | 681 | 681 | 364 | 364 | 53% | Probably one | |
| 23 | ‐ | 32 | ‐ | 32 | 32 | 32 | ‐ | Unclear | |
| 24 | 91 | 91 | 91 | 91 | 81 | 81 | 89% | Probably one | |
| 25 | 75 | 75 | 75 | 75 | 75 | 75 | ‐ | One eye | |
| 26 | 142 | 142 | 142 | 142 | 126 | 126 | 89% | One eye | |
| 27 | ‐ | 73 | ‐ | 73 | 73 | 73 | ‐ | Unclear | |
| 28 | 240 | 240 | ‐ | 240 | 167 | 167 | 70% | Unclear | |
| 29 | 546 | 546 | 546 | 546 | 478 | 478 | 88% | One eye | |
| 30 | ‐ | 201 | 231 | 231 | ‐ | 231 | 59% | 231 eyes of 210 people | |
| 31 | 189 | 189 | 189 | 189 | 179 | 179 | 95% | One eye; right eye only | |
| 32 | 37 | 37 | ‐ | 37 | ‐ | 37 | ‐ | Unclear | |
| 33 | 160 | 160 | 160 | 160 | 152 | 152 | 95% | One eye | |
| 34 | ‐ | 198 | 220 | 220 | ‐ | 220 | 100% | 220 eyes of 198 people | |
| *For studies that did not report the number randomised, we have estimated this from the number followed up. For studies that did not report the number followed up, we have estimated this from the numbers randomised. Number of eyes estimated assuming one eye per person, if not clearly stated otherwise. | |||||||||
| Study | Average age | Age range | % female | % with diabetes | % with uveitis | |
| 1 | 72 | 45 to 92 | 61% | 21% | 1% | |
| 2 | 72 | 50 to 88 | 54% | ‐ but low risk population | "low risk population" | |
| 3 | 66 | ‐ | 56% | 0% people with diabetes excluded | 0% people with uveitis excluded | |
| 4 | ‐ | ‐ | ‐ | ‐ but people with DR excluded | 0% people with uveitis excluded | |
| 5 | 72 | 51 to 88 | 64% | 20% | 0% people with uveitis excluded | |
| 6 | 74 | ‐ | 40% | 10% | 0% people with uveitis excluded | |
| 7 | 73 | ‐ | 55% | 0% people with diabetes excluded | 0% people with uveitis excluded | |
| 8 | ‐ | ‐ | 37% | 100% | ‐ | |
| 9 | 69 | 37 to 84 | 45% | 100% | 0% people with uveitis excluded | |
| 10 | 68 | ‐ | 52% | ‐ | ‐ | |
| 11 | 67 | ‐ | 55% | 26% | ‐ | |
| 12 | 69 | 37 to 97 | 57% | ‐ | ‐ | |
| 13 | 72 | ‐ | 63% | 100% | ‐ | |
| 14 | 72 | 44 to 90 | 54% | 0% people with diabetes excluded | 0% people with uveitis excluded | |
| 15 | 66 | ‐ | 54% | 0% people with diabetes excluded | 0% people with uveitis excluded | |
| 16 | 65 | 48 to 82 | 46% | 9% | 0% people with uveitis excluded | |
| 17 | 72 | 41 to 86 | 71% | 0% people with diabetes excluded | 0% people with uveitis excluded | |
| 18 | 77 | ‐ | 66% | 0% people with diabetes excluded | 0% people with uveitis excluded | |
| 19 | 73 | ‐ | 55% | ‐ but people with DR excluded | 0% people with uveitis excluded | |
| 20 | 74 | ‐ | 64% | 0% people with diabetes excluded | ‐ | |
| 21 | 67 | 32 to 87 | 63% | 100% | 0% people with uveitis excluded | |
| 22 | 68 | 39 to 100 | 53% | ‐ | 0% people with uveitis excluded | |
| 23 | ‐ | ‐ | ‐ | ‐ | ‐ | |
| 24 | 67 | ‐ | 47% | 0% people with diabetes excluded | 0% people with uveitis excluded | |
| 25 | 61 | ‐ | 39% | 0% people with diabetes excluded | 0% people with uveitis excluded | |
| 26 | ‐ | ‐ | ‐ | ‐ | ‐ | |
| 27 | 69 | ‐ | 52% | ‐ but people with DR excluded | 0% people with uveitis excluded | |
| 28 | 73 | 46 to 92 | 54% | 0% people with diabetes excluded | 0% people with uveitis excluded | |
| 29 | 70 | ‐ | 53% | ‐ | ‐ | |
| 30 | ‐ | ‐ | ‐ | ‐ | ‐ | |
| 31 | 65 | ‐ | 40% | 0% people with diabetes excluded | 0% people with uveitis excluded | |
| 32 | ‐ | ‐ | ‐ | 100% | ‐ | |
| 33 | 69 | ‐ | 65% | ‐ | ‐ | |
| 34 | ‐ | ‐ | ‐ | ‐ | ‐ | |
| DR: diabetic retinopathy | ||||||
| Study | Type of cataract surgery | Comparison | NSAIDs | Steroid | Placebo in comparator group | Type of placebo | |
| 1 | Phacoemulsification | NSAIDs plus steroids versus steroids | Ketorolac 0.5% | Prednisolone 1% | No | ‐ | |
| 2 | Phacoemulsification | NSAIDs plus steroids versus steroids | Ketorolac 0.5%, Nepafenac 0.1% | Prednisolone 1% | Yes | Sterile saline drops | |
| 3 | Phacoemulsification | NSAIDs versus steroids | Diclofenac 0.1% | Betamethasone 0.1% | No | ‐ | |
| 4 | Phacoemulsification | NSAIDs versus steroids | Diclofenac 0.1% | Prednisolone 1% | No | ‐ | |
| 5 | Phacoemulsification | NSAIDs plus steroids versus steroids | Nepafenac 0.1% | Dexamethasone (combined with tobramycin) | No | ‐ | |
| 6 | Phacoemulsification | NSAIDs plus steroids versus steroids | Ketorolac 0.5% | Dexamethasone 0.1% (combined with tobramycin 0.3%) | No | ‐ | |
| 7 | Phacoemulsification | NSAIDs plus steroids versus steroids | Ketorolac 0.4% | Prednisolone 1% | Yes | Vehicle | |
| 8 | Phacoemulsification | NSAIDs plus steroids versus steroids | Ketorolac 0.4% | Dexamethasone 0.1%, | No | ‐ | |
| 9 | Phacoemulsification | NSAIDs versus steroids | Bromfenac | Betamethasone (with fradiomycin sulfate) followed by fluorometholone | No | ‐ | |
| 10 | ECCE | NSAIDs versus steroids | Diclofenac 0.1% | Dexamethasone 0.1% | Yes | Not specified | |
| 11 | Phacoemulsification | NSAIDs versus steroids | Bromfenac 0.1%, Ketorolac 0.4% | Prednisolone acetate 1% | No | ‐ | |
| 12 | ECCE and phacoemulsification | NSAIDs plus steroids versus steroids | Indomethacin | Dexamethasone (in combination with neomycin sulfate, polymyxin B sulfate) for 4 days followed by dexamethasone alone for 4 weeks followed by fluorometholone for at least 6 months | Yes | Vehicle | |
| 13 | Phacoemulsification | NSAIDs plus steroids versus steroids | Diclofenac 1% | Dexamethasone (combined with tobramycin) | No | ‐ | |
| 14 | Phacoemulsification | NSAIDs plus steroids versus steroids | Nepafenac 0.1% | Prednisolone 1% | No | ‐ | |
| 15 | Phacoemulsification | NSAIDs versus steroids | Diclofenac 0.1% | Fluorometholone 0.1% | No | ‐ | |
| 16 | Phacoemulsification | NSAIDs versus steroids | Nepafenac 0.1% | Fluorometholone 0.1% | No | ‐ | |
| 17 | Phacoemulsification | NSAIDs plus steroids versus steroids/NSAIDs versus steroids | Bromfenac 0.1% | Betamethasone 0.1%, fluorometholone | No | ‐ | |
| 18 | Phacoemulsification | NSAIDs plus steroids versus steroids | Diclofenac 0.1% | Dexamethasone 0.1% (combined with chloramphenicol 0.5%) | No | ‐ | |
| 19 | ICCE | NSAIDs plus steroids versus steroids | Diclofenac 0.1% | Dexamethasone | Yes | Not specified | |
| 20 | ECCE | NSAIDs plus steroids versus steroids | Diclofenac | Dexamethasone (combined with tobramycin) | Yes | Not specified | |
| 21 | Phacoemulsification | NSAIDs plus steroids versus steroids | Nepafenac 1% | Prednisolone | Yes | Vehicle | |
| 22 | ECCE | NSAIDs plus steroids versus steroids | Flurbiprofen 0.03% Indomethacin 1% | Prednisolone | Yes | Vehicle | |
| 23 | Phacoemulsification | NSAIDs plus steroids versus steroids | Ketorolac 0.4% | Prednisolone 1% | No | ‐ | |
| 24 | Phacoemulsification | NSAIDs plus steroids versus steroids | Ketorolac 0.4% | Prednisolone 1% | Yes | Dextran 70/hypromellose | |
| 25 | ECCE | NSAIDs plus steroids versus steroids | Diclofenac 0.1% | Dexamethasone 1% | No | ‐ | |
| 26 | Phacoemulsification | NSAIDs plus steroids versus steroids | Ketorolac 0.4%, Nepafenac 0.1% | Prednisolone 1% | Yes | Artificial tears | |
| 27 | ECCE/ICCE | NSAIDs plus steroids versus steroids | Indomethacin 1% | Dexamethasone (combined with either chloramphenicol or neomycin) | Yes | Vehicle | |
| 28 | Phacoemulsification | NSAIDs plus steroids versus steroids | Bromfenac 0.1% | fluorometholone 0.1% and dexamethasone 0.1% | No | ‐ | |
| 29 | Phacoemulsification | NSAIDs plus steroids versus steroids | Ketorolac 0.4% | Prednisolone 1% | Yes | Artificial tears | |
| 30 | ICCE | NSAIDs plus steroids versus steroids | Indomethacin 1% | Steroids given as part of standard care, not specified exactly what | Yes | Vehicle | |
| 31 | Phacoemulsification | NSAIDs plus steroids versus steroids | Indomethacin 0.1% | Prednisolone 1% | No | ‐ | |
| 32 | Phacoemulsification | NSAIDs plus steroids versus steroids | Ketorolac 0.5% | Prednisolone 1% | Yes | Artificial tears | |
| 33 | Phacoemulsification | NSAIDs plus steroids versus steroids | Nepafenac 0.1% | Dexamethasone 0.1% | Yes | Artifical tears | |
| 34 | Phacoemulsification | NSAIDs plus steroids versus steroids | Pranoprofen | Dexamethasone (combined with tobramycin) | No | ‐ | |
| ECCE: extracapsular cataract extraction | |||||||
| Poor vision outcome due to MO | Quality of life/patient satisfaction | Central retinal thickness | Adverse effects reported | CMO | Inflammation | BCVA | Additional outcomes | ||
| Study | Follow‐up | No analysis; only one study reported this | |||||||
| 1 month | Yes | OCT used but CMO not defined | Change in total macular volume | ||||||
| 1 month | COMTOL questionnaire | Mean change reported but not possible to calculate SD | LogMAR | Change in total macular volume; change in average macular cube thickness | |||||
| 8 weeks | Yes | Fluorescein angiography using Miyake 1977 classification (at 5 weeks only) | Laser flare‐cell photometry, mean value of anterior chamber flare (photons/millisecond) | LogMAR, final value | |||||
| 1 month | Laser flare‐cell photometry, mean value of anterior chamber flare reported (photons) but was not possible to calculate SD | ||||||||
| 6 weeks | Quote: "None of the patients developed clinically significant macular oedema associated with vision loss" | Final value | Yes | Only reported CMO associated with vision loss | "Inflammatory cells greater than 1+ during first week of postoperative visits" | Total macular volume | |||
| 6 weeks | Fundoscopy and Amsler grid test Quote: "no evidence of clinically significant CME" | Yes | "No evidence of clinically significant CME was detected in any patient via fundoscopy and the Amsler grid test" | Corneal oedema or Tyndall reaction or conjunctival hyperaemia | LogMAR, final value | ||||
| 3 months | Yes | "Clinically significant CME" but otherwise not defined, at 2 weeks only | "Mean inflammation score" but was not possible to calculate SD | LogMAR, final value but could not extract data on SD | |||||
| 12 weeks | Clinical examination, unclear if OCT‐verified | ||||||||
| 6 weeks | Final value | Yes | Anterior chamber flare values, photon count per millisecond | LogMAR, final value | |||||
| 140 days | Yes | Fluorescein angiography using Miyake 1977 classification | |||||||
| 1 month | Change | Yes | "Inflammatory score" (sum of anterior chamber cells and flare grade" | Change in macular volume | |||||
| Between 2.5 and 12 months | Yes | Fluorescein angiography using Miyake 1977 classification | Snellen acuity only, not included in analyses | ||||||
| 1 month | Final value | OCT, "clinically apparent" CME otherwise not defined | Snellen acuity only, not included in analyses | ||||||
| 2 months | Change from baseline | Yes | LogMAR | Change in foveal thickness, change in macular volume | |||||
| 5 weeks | Fluorescein angiography using Miyake 1977 classification | Unit of measurement unclear | Snellen acuity only, not included in analyses | ||||||
| 5 weeks | Final value | Yes | Fluorescein angiography using Miyake 1977 classification | Flare (photons/millisec), final value | Change in logMAR BCVA, categorical 3+, 2, 1 lines increase and no change | ||||
| 2 months | Yes | "Obvious CMO confirmed by OCT" | Aqueous flare (photons/millisecond) | LogMAR, final value | |||||
| 1 month | Final value | LogMAR, final value | |||||||
| 180 days | Yes | Fluorescein angiography using Miyake 1977 classification | Snellen acuity only, not included in analyses | ||||||
| 6 months | Yes | Fluorescein angiography using Miyake 1977 classification | Snellen acuity only, not included in analyses | ||||||
| 90 days | Change from baseline | Yes | ">= 30% increase in central subfield macular thickness from baseline" | Flare mentioned but data not reported | Corrected BCVA loss of more than 5 letters from day 7 postop | ||||
| 6 months | Days 21 to 60, MO = positive angiography and visual acuity <= 20/40 | Yes | Fluorescein angiography using classification*** | Snellen acuity but not reported by treatment group | |||||
| 30 days (3 months mentioned but not reported) | Reported but no mean/SD | Proportion with > 10% increase in retinal thickness | |||||||
| 5 weeks | Final value | Yes | Fluorescein angiography using Miyake 1977 classification | LogMAR | |||||
| 2 months | Fluorescein angiography 0 no leakage (CME absent),1 oedema less than perifoveal, 2 mild perifoveal oedema, 3 moderate perifoveal oedema (approx. 1 disc diameter), 4 severe perifoveal oedema plus drop of 1 line of Snellen acuity since second postoperative week defined as "clinically significant" | ||||||||
| 12 weeks | Final value | Yes | LogMAR, final value (at 30 days only) | ||||||
| 12 weeks | Yes | Fluorescein angiography using Miyake 1977 classification | Snellen acuity only, not included in analyses | ||||||
| 2 months | OCT‐confirmed CMO with "visual impairment" (not specified cutpoint) | Final value | Yes | "CME was defined as central retinal | Mean photon count values | LogMAR, final value | |||
| 4 weeks | OCT‐confirmed CMO with visual acuity < 6/9 | Yes | Clinical and OCT‐based | ||||||
| 1 year | CMO on fluorescein angiography with visual acuity < 6/60 | Yes | Fluorescein angiography, evidence but not defined | ||||||
| 3 months | "Slight fluorescein leakage | LogMAR, final value | |||||||
| 12 weeks | |||||||||
| 6 weeks | Yes | OCT‐verified but not defined | Mean anterior chamber flare reported in figure but no SD | LogMAR, final value | Change in total macular volume | ||||
| 1 month | OCT‐verified but not defined | Tyn granule + | |||||||
| BCVA: best corrected visual acuity | |||||||||
| Study | Follow‐up | Number of people followed up | Adverse effects |
| 1 month | 74 | Quote: "There were 3 dropouts in the treatment group related to ketorolac corneal toxicity, most notably pain attributed to the drops." | |
| 1 month | 162 | Quote: “One patient in the ketorolac group was hospitalized with a cardiovascular event and could not complete the follow‐up. Finally, 1 patient on nepafenac had side effects of ocular redness and irritation and could not continue with the study.” | |
| 8 weeks | 142 | 2 "complications" not specified. | |
| 1 month | NR | Adverse effects not reported. | |
| 6 weeks | 60 | Quote: "There were no serious treatment‐related adverse events or toxicity related to the use of nepafenac 0.1%." | |
| 6 weeks | 138 | Quote: "All patients reported pain and ocular discomfort lower than 1/10 on the visual analog scale at all time points." | |
| 2 weeks | 100 | Quote: "Use of ketorolac 0.4% for 1 or 3 days provided decreased levels of patient discomfort intraoperatively and postoperatively. Intraoperatively, 3 days of ketorolac 0.4% provided significantly lower discomfort scores than with 1‐hour and placebo dosing (P < 0.001). One day of ketorolac 0.4% also provided significantly reduced intraoperative discomfort scores than with 1‐hour dosing (P = 0.001) and placebo dosing (P < 0.001). Postoperatively, 3 days of ketorolac 0.4% provided significantly lower discomfort scores than 1‐hour dosing or control dosing (P < 0.001) (Figure 5). In addition, patients randomised to 1 or 3 days of ketorolac 0.4% were significantly less likely to require additional intravenous anesthesia (8% in each group) than patients in the control group (40%) (P = 0.008). Twenty percent of patients in the 1‐hour group required additional anesthesia for pain control." | |
| 12 weeks | 86 | Adverse effects not reported. | |
| 6 weeks | 62 | Quote: "No adverse events were noted in either group." | |
| 140 days | 229 | Quote: "No major adverse effects were noted in either group." "Subjective tolerance of the two treatments was good and remained similar throughout the study, although a trend towards increased burning was seen in the diclofenac group." | |
| 1 month | 91 | Quote: "There were no adverse events except for a mild burning sensation in one patient in the ketorolac group; the symptom was tolerable and did not lead to discontinuation of the medication." | |
| between 2.5 and 12 months | 492 | Quote: "There were no complications that could be ascribed to the use of topical indomethacin other than minor stinging and burning noted by the patients." | |
| 1 month | 217 | Adverse effects not reported. | |
| 2 months | 79 | Quote: "There were no adverse events reported by patients using nepafenac." | |
| 5 weeks | 50 | Adverse effects not reported. | |
| 5 weeks | 55 | NSAIDs: 6 adverse effects: decreased lacrimation, conjunctivitis allergic, abnormal sensation in eye, vomiting (2), constipation. Steroid group: 9 adverse effects: decreased lacrimation, conjunctivitis allergic, retinal haemorrhage, keratoconjunctivitis sicca, chorioretinopathy, influenza, insomnia, diarrhoea, humeral fracture. | |
| 2 months | 72 | Adverse effects not reported. | |
| 1 month | 79 | Adverse effects not reported. | |
| 180 days | 112 | Quote: "Diclofenac group: two patients were feeling burning after application of eye drops during the stationary care, for placebo: none. In both groups burning was reported later on in the examinations." | |
| 6 months | 88 | Quote: "Treatment regimens were well tolerated with no evidence of relevant side effects." | |
| 90 days | 251 | Quote: "No patient deaths were reported during the study. Overall, 13 patients reported other serious adverse events, none of which were related to treatment. Three of the serious adverse events reported in the vehicle group (cardiac failure congestive, coronary artery occlusion, and pancreatitis) led to patient discontinuation; no other serious adverse events led to discontinuation in either treatment group. Separate from the three patients who discontinued due to serious adverse events, four other patients discontinued study participation due to nonserious adverse events. Of these nonserious events, two reported instances of punctate keratitis (one in each treatment group) were assessed as being related to the study drugs. No instances of targeted adverse events (defined as corneal erosions) were reported during the study. Two reports of punctate keratitis and a single report of corneal epithelium defect were assessed as being related to treatment with nepafenac. A single report of punctate keratitis was assessed as being related to treatment with vehicle. No other ocular or nonocular adverse events reported in the study were assessed as being related to the study drugs. In both treatment groups, corneal staining and intraocular pressure were each generally similar at the presurgical baseline and at the day 90 visit (or early exit). Additionally, no safety issues or trends were identified based upon changes from baseline in fundus parameters (retina/macula/choroid and optic nerve) and ocular signs (inflammatory cells, aqueous flare, corneal oedema, and bulbar conjunctival injection). The study results indicate no new clinically relevant risks associated with increasing the dosing of nepafenac from 14 days to 90 days, even in the higher‐risk diabetic patient population." | |
| 6 months | 364 | Quote: "During the study, the mean severity of foreign‐body sensation, pain, photophobia, and tearing did not become more than mild (1 +) in any treatment group. This was also true of burning and stinging following treatment instillation (Figure 4). The severity of burning and stinging was significantly greater in the flurbiprofen group on days 4‐20 and 21‐60 and in the indomethacin group on days 1‐3, 4‐20, 21‐60, and 61‐120 than in the vehicle group. At day 1‐3, moderate to severe burning and stinging were reported by 7.0% (16/230) of the patients treated with flurbiprofen, 9.7% (23/237) of the patients treated with indomethacin, and 3.1% (7/224) of the patients treated with vehicle." | |
| 30 days (3 months mentioned but not reported) | 32 | Adverse effects not reported. | |
| 5 weeks | 81 | One patient withdrew because of burning. | |
| 2 months | 75 | Adverse effects not reported. | |
| 1 month | 126 | Quote: "There were no adverse side effects in either group." | |
| 12 weeks | 73 | Quote from translation: "40% reported a short burning after using indomethacin eye drops, only rare in patients of the placebo group. One patient had 6 weeks after treatment an allergic blepharitis due to indomethacin. Long‐term: 52 patients were followed for 6 months and 34 patients one year. 4 patients with indomethacin had visual acuity reduction because of a clinically new cystoid edema; 2 of these patients had spontaneous healing after 4‐6 weeks, the other 2 edema cases did not resolve. 2 patients had a new senile macula pathology, and 2 patients had a retinal detachment due to aphakia. Placebo: 2 patients still had an edema after 12 weeks, while one patient developed a new edema later." | |
| 2 months | 167 | Quote: "No drug‐related adverse events were identified." | |
| 4 weeks | 478 | Quote: "The most commonly reported adverse events (investigator self‐report) in the ketorolac/steroid group were burning/stinging/tearing (4/268). Transient elevations in intraocular pressure (IOP) were the most commonly reported adverse event in the steroid group (3/278). There were two serious adverse events, both in the steroid group: one patient developed endophthalmitis and one patient died (cause determined to be unrelated to the study medication)." | |
| 1 year | 231 | Adverse effects not reported. | |
| 3 months | 179 | Adverse effects not reported. | |
| 12 weeks | 37 | Adverse effects not reported. | |
| 6 weeks | 152 | Quote: "Mild to moderate punctuate epithelial defects of the cornea were found in both groups 3 weeks after treatment.Statistically significantly more patients in the nepafenac group than in the control group had corneal fluorescein staining (20 [26.7%] versus 8 [10.4%]) (PZ.0119). Headache was reported by 3 patients (4.0%) in the nepafenac group and 2 patients (2.6%) in the control group (PZ.9750). No other systemic or local untoward effects were recorded during 3 weeks of treatment in either study group." | |
| 1 month | 220 | Adverse effects not reported. |
| Outcome or subgroup title | No. of studies | No. of participants | Statistical method | Effect size |
| 1 Poor vision due to MO Show forest plot | 6 | Risk Ratio (M‐H, Random, 95% CI) | Subtotals only | |
| 1.1 3 months | 5 | 1360 | Risk Ratio (M‐H, Random, 95% CI) | 0.41 [0.23, 0.76] |
| 1.2 12 months | 1 | 88 | Risk Ratio (M‐H, Random, 95% CI) | 1.32 [0.09, 20.37] |
| 2 Central retinal thickness Show forest plot | 9 | Mean Difference (IV, Random, 95% CI) | Totals not selected | |
| 2.1 Change from baseline | 3 | Mean Difference (IV, Random, 95% CI) | 0.0 [0.0, 0.0] | |
| 2.2 FInal value | 6 | Mean Difference (IV, Random, 95% CI) | 0.0 [0.0, 0.0] | |
| 3 Total macular volume Show forest plot | 6 | 570 | Mean Difference (IV, Random, 95% CI) | ‐0.14 [‐0.21, ‐0.07] |
| 4 Macular oedema Show forest plot | 21 | 3638 | Risk Ratio (M‐H, Random, 95% CI) | 0.40 [0.32, 0.49] |
| 5 Inflammation Show forest plot | 3 | Risk Ratio (M‐H, Random, 95% CI) | Totals not selected | |
| 6 Inflammation (flare) Show forest plot | 2 | 216 | Mean Difference (IV, Fixed, 95% CI) | ‐1.41 [‐2.30, ‐0.52] |
| 7 BCVA Show forest plot | 10 | Mean Difference (IV, Random, 95% CI) | Totals not selected | |
| 7.1 Final value | 7 | Mean Difference (IV, Random, 95% CI) | 0.0 [0.0, 0.0] | |
| 7.2 Change from baseline | 3 | Mean Difference (IV, Random, 95% CI) | 0.0 [0.0, 0.0] | |
| Outcome or subgroup title | No. of studies | No. of participants | Statistical method | Effect size |
| 1 Central retinal thickness Show forest plot | 2 | 121 | Mean Difference (IV, Fixed, 95% CI) | ‐22.64 [‐38.86, ‐6.43] |
| 2 Macular oedema Show forest plot | 5 | 520 | Risk Ratio (M‐H, Random, 95% CI) | 0.27 [0.18, 0.41] |
| 3 Inflammation (flare) Show forest plot | 5 | Mean Difference (IV, Random, 95% CI) | Totals not selected | |
| 4 BCVA Show forest plot | 3 | Mean Difference (IV, Random, 95% CI) | Totals not selected | |