Técnicas perineales durante el período expulsivo del trabajo de parto para reducir el traumatismo perineal
Resumen
Antecedentes
La mayoría de los partos vaginales se asocian con traumatismo del tracto genital. La morbilidad asociada con el traumatismo perineal es significativa, especialmente cuando se trata de desgarros de tercer y cuarto grado. Se han utilizado diferentes intervenciones como el masaje perineal, las compresas frías o calientes y las técnicas de tratamiento perineal para prevenir el traumatismo. Ésta es una actualización de una revisión Cochrane publicada por primera vez en el 2011.
Objetivos
Evaluar el efecto de las técnicas perineales durante el periodo expulsivo del trabajo de parto sobre la incidencia y la morbilidad asociadas con el traumatismo perineal.
Métodos de búsqueda
Se hicieron búsquedas en el registro de ensayos del Grupo Cochrane de Embarazo y Parto (Cochrane Pregnancy and Childbirth Group) (26 de septiembre 2016) y en las listas de referencias de los estudios recuperados.
Criterios de selección
Ensayos controlados aleatorizados y cuasialeatorizados publicados y no publicados que evaluaron cualquier técnica perineal descrita durante el período expulsivo. Los ensayos cruzados (cross‐over) no fueron elegibles para su inclusión.
Obtención y análisis de los datos
Tres autores de la revisión de forma independiente evaluaron los ensayos para su inclusión, extrajeron los datos y examinaron la calidad metodológica. Se verificó la exactitud de los datos.
Resultados principales
Veintidós ensayos fueron elegibles para su inclusión (20 ensayos proporcionaron datos e incluyeron 15 181 mujeres). Los ensayos tuvieron riesgo de sesgo moderado a alto; en ninguno el cegamiento fue adecuado, y en la mayoría el riesgo fue incierto para la ocultación de la asignación y para los datos de resultados incompletos. Las intervenciones comparadas incluyeron el masaje perineal, las compresas frías y calientes y otras técnicas de tratamiento perineal.
La mayoría de los estudios no informaron datos sobre los resultados secundarios. La calidad de la evidencia se disminuyó debido al riesgo de sesgo, la inconsistencia y la imprecisión en todas las comparaciones.
No intervenir (o preparado) en comparación con intervenir
No hubo diferencias claras entre no intervenir o intervenir en el perineo en cuanto a la incidencia del perineo intacto (riesgo relativo [RR] promedio 1,03; intervalo de confianza [IC] del 95%: 0,95 a 1,12; dos estudios, Tau² 0,00; I² 37%; 6547 mujeres; evidencia de calidad moderada), desgarros perineales de primer grado (RR promedio 1,32; IC del 95%: 0,99 a 1,77; dos estudios, 700 mujeres; evidencia de calidad baja), desgarros de segundo grado (RR promedio 0,77; IC del 95%: 0,47 a 1,28; dos estudios, 700 mujeres; evidencia de calidad baja), o desgarros de tercer o cuarto grado (RR promedio 0,68; IC del 95%: 0,21 a 2,26; cinco estudios, Tau² 0,92; I² 72%; 7317 mujeres; evidencia de calidad muy baja). La considerable heterogeneidad para los desgarros de tercer o cuarto grado significa que estos datos se deben interpretar con cautela. La episiotomía fue más frecuente en el grupo de intervenir (RR promedio 0,58; IC del 95%: 0,43 a 0,79, Tau² 0,07; I² = 74%; cuatro estudios, 7247 mujeres; evidencia de calidad baja), pero hubo heterogeneidad considerable entre los cuatro estudios incluidos.
No hubo datos sobre el trauma perineal que requirió sutura.
Compresas calientes versus control (no intervenir o ninguna compresa caliente)
Una compresa caliente no tuvo un efecto claro sobre la incidencia de perineo intacto (RR promedio 1,02; IC del 95%: 0,85 a 1,21; 1799 mujeres; cuatro estudios; evidencia de calidad moderada), traumatismo perineal que requirió sutura (RR promedio 1,14; IC del 95%: 0,79 a 1.66; 76 mujeres; un estudio; evidencia de calidad muy baja), desgarros de segundo grado (RR promedio 0,95; IC del 95%: 0,58 a 1,56; 274 mujeres; dos estudios; evidencia de calidad muy baja), o episiotomía (RR promedio 0,86; IC del 95%: 0,60 a 1,23; 1799 mujeres; cuatro estudios; evidencia de calidad baja). No se conoce con certeza si la compresa caliente aumenta o reduce la incidencia de desgarros de primer grado (RR promedio 1,19; IC del 95%: 0,38 a 3,79; 274 mujeres; dos estudios; I² 88%; evidencia de calidad muy baja).
Se informó de menos desgarros perineales de tercer o cuarto grado en el grupo de compresas calientes (RR promedio 0,46; IC del 95%: 0,27 a 0,79; 1799 mujeres; cuatro estudios; evidencia de calidad moderada).
Masaje versus control (no intervenir o atención habitual)
La incidencia de perineo intacto aumentó en el grupo de masaje perineal (RR promedio 1,74; IC del 95%: 1,11 a 2,73, seis estudios, 2618 mujeres; I² 83%; evidencia de calidad baja), pero hubo heterogeneidad considerable entre los estudios. Este grupo presentó menos desgarros de tercer o cuarto grado (RR promedio 0,49; IC del 95%: 0,25 a 0,94; cinco estudios, 2477 mujeres; evidencia de calidad moderada).
No hubo diferencias claras entre los grupos en cuanto a los traumatismos perineales que requirieron sutura (RR promedio 1,10; IC del 95%: 0,75 a 1,61; un estudio, 76 mujeres; evidencia de calidad muy baja), los desgarros de primer grado (RR promedio 1,55; IC del 95%: 0.79 a 3,05, cinco estudios, Tau² 0,47; I² 85%, 537 mujeres; evidencia de calidad muy baja), o los desgarros de segundo grado (RR promedio 1,08; IC del 95%: 0,55 a 2,12, cinco estudios, Tau² 0,32; I² 62%, 537 mujeres; evidencia de calidad muy baja). El masaje perineal puede reducir la episiotomía, aunque hubo incertidumbre considerable en torno a la estimación del efecto (RR medio 0,55; IC del 95%: 0,29 a 1,03; siete estudios, Tau² 0,43; I² 92%; 2684 mujeres; evidencia de calidad muy baja). La heterogeneidad fue alta para el desgarro de primer grado, el desgarro de segundo grado y para la episiotomía, pero los datos se deben interpretar con cautela.
Maniobra de Ritgen versus atención estándar
Un estudio (66 mujeres) encontró que las mujeres a las que se les realizó la maniobra de Ritgen tuvieron menos probabilidades de presentar un desgarro de primer grado (RR 0,32; IC del 95%: 0,14 a 0,69; evidencia de calidad muy baja), más probabilidades de presentar un desgarro de segundo grado (RR 3,25; IC del 95%: 1,73 a 6,09; evidencia de calidad muy baja), y ni más ni menos probabilidades de tener el perineo intacto (RR 0,17; IC del 95%: 0,02 a 1,31; evidencia de calidad muy baja). Un estudio más grande informó que la maniobra de Ritgen no tuvo efecto sobre la incidencia de desgarros de tercer o cuarto grado (RR 1,24; IC del 95%: 0,78 a 1,96.1423 mujeres; evidencia de calidad baja). La episiotomía no fue claramente diferente entre los grupos (RR 0,81; IC del 95%: 0,63 a 1,03, dos estudios, 1489 mujeres; evidencia de calidad baja).
Otras comparaciones
El parto primero del hombro posterior versus el anterior, el uso de un dispositivo de protección perineal, diferentes aceites/ceras y las compresas frías no mostraron efecto sobre los resultados, con la excepción de una mayor incidencia de perineo intacto con el dispositivo perineal. Solo un estudio contribuyó a cada una de estas comparaciones.
Conclusiones de los autores
Evidencia de calidad moderada indica que las compresas calientes y el masaje pueden reducir los desgarros de tercer y cuarto grado, pero la repercusión de estas técnicas sobre otros resultados no estuvo clara o no fue consistente. Evidencia de calidad deficiente indica que las técnicas de no intervenir pueden reducir la episiotomía, pero esta técnica no tuvo una repercusión clara sobre otros resultados. No hubo datos suficientes para demostrar si otras técnicas perineales dan lugar a mejores resultados.
Se podrían realizar estudios de investigación adicionales para evaluar las técnicas perineales, las compresas calientes y el masaje, y cómo los diferentes tipos de aceite utilizados durante el masaje afectan a las mujeres y a los recién nacidos. Es importante que en cualquier estudio de investigación futuro se recopile información sobre las opiniones de las mujeres.
PICO
Resumen en términos sencillos
Técnicas perineales durante el período expulsivo del trabajo de parto para reducir el traumatismo perineal
¿Cuál es el problema?
Los partos vaginales se suelen asociar con algún tipo de traumatismo en el tracto genital, y los desgarros que afectan al esfínter anal o a la mucosa (desgarros de tercer y cuarto grado) pueden causar graves problemas. El trauma perineal puede ocurrir espontáneamente o ser el resultado de una incisión quirúrgica (episiotomía). Actualmente se utilizan diferentes técnicas perineales para retrasar el parto de la cabeza del feto y permitir que el perineo se estire lentamente para evitar lesiones. Las parteras y los asistentes del parto utilizan ampliamente el masaje perineal, las compresas calientes y diferentes técnicas de tratamiento perineal. El objetivo de esta revisión fue evaluar el efecto de las técnicas perineales durante el período expulsivo del trabajo de parto sobre la incidencia del traumatismo perineal. Esta es una actualización de una revisión que se publicó por última vez en 2011.
¿Por qué es esto importante?
Un traumatismo en el perineo puede causar dolor y otros problemas a las mujeres después del parto. El daño se describe como desgarros de primer, segundo, tercer y cuarto grado; los de primer grado son los menos dañinos y los de cuarto grado los más importantes. Los desgarros de tercer y cuarto grado afectan al esfínter anal o a la mucosa, y causan la mayoría de los problemas. Reducir el uso de episiotomías reducirá el traumatismo perineal. Además, se utilizan diferentes técnicas perineales para retrasar el parto de la cabeza del feto. Las parteras y los asistentes del parto utilizan ampliamente el masaje perineal, las compresas calientes y diferentes técnicas de tratamiento perineal. Es importante conocer si estos procedimientos reducen el traumatismo y el dolor de las mujeres.
¿Qué evidencia se encontró?
Se buscaron estudios en septiembre 2016. Veintidós ensayos fueron elegibles para su inclusión en esta revisión actualizada, pero solo veinte estudios (con 15 181 mujeres) contribuyeron con resultados a la revisión. Las participantes en los estudios incluidos fueron mujeres sin complicaciones médicas en las que se esperaba un parto vaginal. Los estudios variaron en cuanto al riesgo de sesgo, y la calidad de los estudios fue muy baja a moderada.
No intervenir (o preparado) en comparación con intervenir
"No intervenir" en el perineo dio lugar a que menos mujeres se sometieran a una episiotomía (evidencia de calidad baja), pero no supuso una diferencia en cuanto al número de mujeres sin desgarros (evidencia de calidad moderada), desgarros de primer grado (evidencia de calidad baja), desgarros de segundo grado (evidencia de calidad baja) o desgarros de tercer o cuarto grado (evidencia de calidad muy baja). Hubo considerables diferencias inexplicables en los resultados entre los cuatro estudios. Ninguno de los estudios proporcionó datos sobre el número de desgarros que requirieron sutura.
Compresas calientes versus control (no intervenir o ninguna compresas caliente)
Menos mujeres del grupo de compresas calientes presentaron desgarros de tercer o cuarto grado (evidencia de calidad moderada). Una compresa caliente no afectó al número de mujeres con el perineo intacto (evidencia de calidad moderada), los desgarros que requirieron sutura (evidencia de calidad muy baja), los desgarros de segundo grado (evidencia de calidad muy baja) o las episiotomías (evidencia de calidad baja). No se conoce si las compresas calientes aumentan o reducen la incidencia de los desgarros de primer grado (evidencia de calidad muy baja).
Masaje versus control (no intervenir o atención habitual)
Hubo más mujeres con el perineo intacto en el grupo de masaje perineal (evidencia de calidad baja), y menos mujeres con desgarros de tercer o cuarto grado (evidencia de calidad moderada). El masaje no pareció hacer una diferencia en las mujeres con traumatismo perineal que requirió sutura (evidencia de calidad muy baja), desgarros de primer grado (evidencia de calidad muy baja), desgarros de segundo grado (evidencia de calidad muy baja) o episiotomías (evidencia de calidad muy baja).
Maniobra de Ritgen versus atención estándar
Un estudio pequeño encontró que las mujeres a las que se les realizó la maniobra de Ritgen tuvieron menos desgarros de primer grado (evidencia de calidad muy baja), pero más desgarros de segundo grado (evidencia de calidad muy baja). No hubo diferencias entre los grupos en cuanto al número de desgarros de tercer o cuarto grado, ni en cuanto a las episiotomías (ambas evidencia de calidad baja).
¿Qué significa esto?
Se encontró que el masaje y las compresas tibias pueden reducir el trauma perineal grave (desgarros de tercer y cuarto grado). Las técnicas de no intervenir pueden reducir el número de episiotomías, pero no estuvo claro si esas técnicas tuvieron un efecto beneficioso sobre otros traumas perineales. Aún existe incertidumbre sobre el valor de otras técnicas para reducir los daños en el perineo durante el parto.
Se necesitan estudios de investigación adicionales para evaluar las diferentes técnicas perineales y responder las preguntas sobre cómo minimizar el trauma perineal. No hay evidencia suficiente sobre las experiencias y opiniones de las mujeres (solo un estudio incluido reunió información al respecto). Es importante que los estudios de investigación futuros determinen si estas intervenciones son aceptables para las mujeres.
Authors' conclusions
Summary of findings
| Hands off (or poised) compared to hands on for reducing perineal trauma | ||||||
| Patient or population: pregnant women expecting a vaginal birth, singleton vertex presentation at term, with no medical complications | ||||||
| Outcomes | Anticipated absolute effects* (95% CI) | Relative effect | № of participants | Quality of the evidence | Comments | |
| Risk with hands on | Risk with hands off (or poised) | |||||
| Intact perineum | Study population | RR 1.03 | 6547 | ⊕⊕⊕⊝ | ||
| 354 per 1000 | 364 per 1000 | |||||
| Perineal trauma requiring suturing | Study population | ‐ | (0 RCTs) | ‐ | No trial reported this outcome | |
| See comment | See comment | |||||
| 1st degree tear | Study population | RR 1.32 | 700 | ⊕⊕⊝⊝ | ||
| 180 per 1000 | 238 per 1000 | |||||
| 2nd degree tear | Study population | RR 0.77 | 700 | ⊕⊕⊝⊝ | ||
| 86 per 1000 | 66 per 1000 | |||||
| 3rd or 4th degree tears | Study population | RR 0.68 | 7317 | ⊕⊝⊝⊝ | ||
| 15 per 1000 | 10 per 1000 | |||||
| Episiotomy | Study population | RR 0.58 | 7247 | ⊕⊕⊝⊝ | ||
| 146 per 1000 | 85 per 1000 | |||||
| *The risk in the intervention group (and its 95% confidence interval) is based on the assumed risk in the comparison group and the relative effect of the intervention (and its 95% CI). | ||||||
| GRADE Working Group grades of evidence | ||||||
| 1Most studies had design limitations, one study had serious design limitations (downgraded 1 level). | ||||||
| Warm compresses compared to control (hands off or no warm compress) for reducing perineal trauma | ||||||
| Patient or population: pregnant women expecting a vaginal birth, singleton vertex presentation at term, with no medical complications | ||||||
| Outcomes | Anticipated absolute effects* (95% CI) | Relative effect | № of participants | Quality of the evidence | Comments | |
| Risk with control (hands off or no warm compress) | Risk with warm compresses | |||||
| Intact perineum | Study population | RR 1.02 | 1799 | ⊕⊕⊕⊝ | ||
| 236 per 1000 | 241 per 1000 | |||||
| Perineal trauma requiring suturing | Study population | RR 1.14 | 76 | ⊕⊝⊝⊝ | ||
| 553 per 1000 | 630 per 1000 | |||||
| 1st degree tear | Study population | RR 1.19 | 274 | ⊕⊝⊝⊝ | ||
| 288 per 1000 | 343 per 1000 | |||||
| 2nd degree tear | Study population | RR 0.95 | 274 | ⊕⊝⊝⊝ | ||
| 192 per 1000 | 183 per 1000 | |||||
| 3rd or 4th degree tears | Study population | RR 0.46 | 1799 | ⊕⊕⊕⊝ | ||
| 45 per 1000 | 21 per 1000 | |||||
| Episiotomy | Study population | RR 0.86 | 1799 | ⊕⊕⊝⊝ | ||
| 62 per 1000 | 54 per 1000 | |||||
| *The risk in the intervention group (and its 95% confidence interval) is based on the assumed risk in the comparison group and the relative effect of the intervention (and its 95% CI). | ||||||
| GRADE Working Group grades of evidence | ||||||
| 1One study with design limitations and one study with serious design limitations though contributing < 40% weight (downgraded 1 level). | ||||||
| Massage compared to control (hands off or care as usual) for reducing perineal trauma | ||||||
| Patient or population: pregnant women expecting a vaginal birth, singleton vertex presentation at term, with no medical complications | ||||||
| Outcomes | Anticipated absolute effects* (95% CI) | Relative effect | № of participants | Quality of the evidence | Comments | |
| Risk with control (hands off or care as usual) | Risk with massage | |||||
| Intact perineum | Study population | RR 1.74 | 2618 | ⊕⊕⊝⊝ | ||
| 227 per 1000 | 396 per 1000 | |||||
| Perineal trauma requiring suturing | Study population | RR 1.10 | 76 | ⊕⊝⊝⊝ | ||
| 553 per 1000 | 608 per 1000 | |||||
| 1st degree perineal tear | Study population | RR 1.55 | 537 | ⊕⊝⊝⊝ | ||
| 287 per 1000 | 445 per 1000 | |||||
| 2nd degree perineal tear | Study population | RR 1.08 | 537 | ⊕⊝⊝⊝ | ||
| 213 per 1000 | 230 per 1000 | |||||
| 3rd or 4th degree tears | Study population | RR 0.49 | 2477 | ⊕⊕⊕⊝ | ||
| 29 per 1000 | 14 per 1000 | |||||
| Episiotomy | Study population | RR 0.55 | 2684 | ⊕⊝⊝⊝ | ||
| 249 per 1000 | 137 per 1000 | |||||
| *The risk in the intervention group (and its 95% confidence interval) is based on the assumed risk in the comparison group and the relative effect of the intervention (and its 95% CI). | ||||||
| GRADE Working Group grades of evidence | ||||||
| 1Most studies contributing data had design limitations (downgraded 1 level). | ||||||
| Ritgen's manoeuvre compared to standard care for reducing perineal trauma | ||||||
| Patient or population: pregnant women expecting a vaginal birth, singleton vertex presentation at term, with no medical complications | ||||||
| Outcomes | Anticipated absolute effects* (95% CI) | Relative effect | № of participants | Quality of the evidence | Comments | |
| Risk with standard care | Risk with Ritgen's manoeuvre | |||||
| Intact perineum | Study population | RR 0.17 | 66 | ⊕⊝⊝⊝ | ||
| 182 per 1000 | 31 per 1000 | |||||
| Perineal trauma requiring suturing | Study population | ‐ | (0 studies) | ‐ | No trial reported this outcome | |
| See comment | See comment | |||||
| 1st degree tear | Study population | RR 0.32 | 66 | ⊕⊝⊝⊝ | ||
| 576 per 1000 | 184 per 1000 | |||||
| 2nd degree tear | Study population | RR 3.25 | 66 | ⊕⊝⊝⊝ | ||
| 242 per 1000 | 788 per 1000 | |||||
| 3rd or 4th degree tears | Study population | RR 1.24 | 1423 | ⊕⊕⊝⊝ | ||
| 44 per 1000 | 55 per 1000 | |||||
| Episiotomy | Study population | RR 0.81 | 1489 | ⊕⊕⊝⊝ | ||
| 162 per 1000 | 131 per 1000 | |||||
| *The risk in the intervention group (and its 95% confidence interval) is based on the assumed risk in the comparison group and the relative effect of the intervention (and its 95% CI). | ||||||
| GRADE Working Group grades of evidence | ||||||
| 1One study with serious design limitations (downgraded 2 levels). | ||||||
Background
Description of the condition
Most vaginal births are associated with some form of trauma to the genital tract (Albers 2003). Anterior perineal trauma is injury to the labia, anterior vagina, urethra, or clitoris and is usually associated with little morbidity. Posterior perineal trauma is any injury to the posterior vagina wall, perineal muscles or anal sphincter (Fernando 2015; Kettle 2008). Spontaneous tears are defined as first degree when they involve the perineal skin only; second‐degree tears involve the perineal muscles and skin; third‐degree tears involve the anal sphincter complex (classified as 3a where less than 50% of the external anal sphincter is torn; 3b where more than 50% of the external anal sphincter is torn; 3c where the internal and external anal sphincter is torn); fourth‐degree tears involve the anal sphincter complex and anal epithelium (Fernando 2015; Kettle 2008). The term obstetric anal sphincter injuries (OASIS) is used for both third‐ and fourth‐degree perineal tears (Fernando 2015). Perineal trauma can occur spontaneously or result from a surgical incision of the perineum, called episiotomy. The incidence of some form of perineal trauma is reported to be 85% (McCandlish 1998) and the incidence of trauma that affects the anal sphincter is reported to be from 0.5% to 7.0% for all vaginal deliveries (Sultan 1999) and between 0.5% and 2.5% of spontaneous vaginal deliveries (Byrd 2005). There is considerable variation in the number of reported rates of perineal trauma between countries, partly due to differences in definitions and reporting practices (Byrd 2005), and studies also show that the extent of perineal trauma often is underestimated (Andrews 2006; Groom 2002). Studies with restrictive use of episiotomy report rates of perineal trauma that require suturing between 44% and 79% (Dahlen 2007; Soong 2005), and a recent Cochrane Review found no evidence to support the routine use of episiotomy (Jiang 2017). Higher rates of perineal injury are consistently noted in first vaginal births and with instrumental birth (Christianson 2003).
Morbidity associated with perineal trauma
Perineal trauma is associated with significant short‐ and long‐term morbidity. Perineal pain is reported to be most severe in the immediate postnatal period (Macarthur 2004). However, discomfort continues for up to two weeks postpartum in about 30% of women and 7% report pain at three months (McCandlish 1998). Women who sustain obstetric anal sphincter injury are shown to report more pain seven weeks after birth than those with lesser degree of perineal trauma (Andrews 2007). Women giving birth with an intact perineum, however, report pain less frequently at one, seven and 45 days postpartum (Macarthur 2004). Perineal pain can be intense and often requires pain relief (Andrews 2007; Hedayati 2003). Maternal morbidity associated with perineal trauma also includes dyspareunia (Barrett 2000) and fecal incontinence (Reid 2014; Sultan 2002) and can lead to major physical problems, psychological and social problems, and affect the woman's ability to care for her new baby and cope with the daily tasks of motherhood (Sleep 1991). Urinary problems following childbirth have been reported to be more prevalent in association with perineal trauma (Boyles 2009). Anal sphincter injury can be occult or wrongly classified as a minor degree of perineal tear (Andrews 2006). Women with an intact perineum are more likely to resume intercourse earlier, report less pain with first and subsequent sexual intercourse, report greater satisfaction with sexual experience and report greater sexual sensation and likelihood of orgasm at six months postpartum (Radestad 2008; Williams 2007).
Generally, the degree of morbidity is directly related to the degree of the perineal injury sustained, that is, first‐ and second‐degree perineal trauma causing less severe morbidity than third‐ and fourth‐degree tears (Radestad 2008; Williams 2007). Anal sphincter or mucosal injuries are identified following 3% to 5% of all vaginal births (Ekeus 2008). Around 8% of women experience incontinence of stool and 45% suffer involuntary escape of flatus following anal sphincter injury (Eason 2002). The type of suture material used (Kettle 2002), skills of the operator and technique of suturing influence morbidity experienced by women (Fernando 2006; Sultan 2002). If immediate repair is adequate, the likelihood of better long‐term outcomes are improved, both when it comes to symptoms and quality of life (QoL) (Reid 2014).
Factors associated with perineal trauma
Numerous factors have been suggested as potential determinants of perineal trauma. Some determinants of perineal trauma appear to be present before pregnancy and may be intrinsic to the pregnant woman (Klein 1997). It is uncertain which role demographic factors and nutrition in the years before and during pregnancy play in the occurrence of perineal trauma (Klein 1997). Ethnicity is a factor that may affect perineal trauma and association has been found between Asian ethnicity and severe perineal trauma (Dahlen 2007b; Goldberg 2003). A familial risk of obstetric anal sphincter injuries has also been suggested (Baghestan 2013), maybe with contribution of both maternal and paternal factors.
Nulliparity, maternal age greater than 30 years, a large baby (both weight and head circumference), a prolonged second stage and malposition increase the risk for perineal trauma (Andrews 2006; Baghestan 2010; Fitzpatrick 2001; Mayerhofer 2002; Soong 2005). Restrictive use of episiotomy is associated with less perineal trauma (Jiang 2017), as is the use of vacuum extraction for instrumental birth as opposed to forceps (Fitzpatrick 2003; O'Mahony 2010). Antenatal digital perineal massage from approximately 35 weeks' gestation reduces the incidence of perineal trauma requiring suturing (Beckmann 2006). Maternal upright position in the second stage of labour, for women without epidural anaesthesia, results in a reduction in assisted deliveries and episiotomy usage, no difference regarding severe perineal trauma and, on the other hand, an increased risk of blood loss greater than 500 mL (Gupta 2012). Physical inactivity before pregnancy may represent an independent risk factor for third‐ and fourth‐degree tears (Voldner 2009). Giving birth in alternative birth settings and planned home birth have been shown to be associated with a reduced prevalence of episiotomy (Hodnett 2010; Radestad 2008), as has the midwifery model of care (Hatem 2008). Planned home birth has also been shown to be associated with a lower prevalence of sphincter rupture (Radestad 2008) and a low prevalence of perineal trauma has been found among women opting for home birth (Edqvist 2016).
Retrospective studies on water birth report fewer episiotomies, an overall decrease in perineal trauma and no significant difference in third‐ and fourth‐degree tears (Bodner 2002; Otigbah 2000) and an observational study found fewer episiotomies as well as third‐ and fourth‐degree tears in the water‐birth group (Geissbuehler 2004). However, a Cochrane Review did not find any association between immersion in water during labour/water birth and perineal trauma (Cluett 2009).
Trauma to the birth genital tract does not seem affected by active directed pushing versus spontaneous pushing (Bloom 2006; Schaffer 2005). A recent Cochrane Review (Lemos 2015) concludes that due to insufficient evidence, women's preferences and clinical situations should guide decisions concerning pushing/bearing down methods, regardless of use of epidural analgesia. Retrospective studies on the occurrence of perineal trauma suggest an association between augmentation of labour and trauma (Jandér 2001). One observational study found a higher prevalence of anal sphincter injuries when oxytocin was used in the second stage of labour during spontaneous deliveries of normal‐sized infants (Rygh 2014). An association has also been found between accoucheur type (Bodner‐Adler 2004) and perineal trauma.
Description of the intervention
Awareness of morbidity following perineal trauma has led to the search for different interventions to be used during the second stage of labour to reduce perineal trauma. These interventions include the use of perineal massage, warm and cold compresses, and perineal‐management techniques (Albers 2005; Dahlen 2007; Myrfield 1997; Pirhonen 1998; Shirvani 2014a; Stamp 2001). Different massage techniques are performed using different lubricants; different oils, jelly, Vaseline or wax (Araujo 2008; Harlev 2013; Geranmayeh 2012). Perineal management techniques, termed as guiding or support techniques, are believed to reduce perineal trauma (Myrfield 1997; Pirhonen 1998). A wide variety of techniques are practiced, among them the flexion technique and Ritgen’s manoeuvre. Each technique claims to reduce perineal trauma by reducing the presenting diameter of the fetal head through the woman's vaginal opening (Myrfield 1997). The flexion technique involves the maintenance of flexion of the emerging fetal head, by exerting pressure on the emerging occiput in a downwards direction towards the perineum, preventing extension until crowning; and the guarding of the perineum by placing a hand against the perineum to support this structure (Mayerhofer 2002; Myrfield 1997). In Ritgen's manoeuvre the fetal chin is reached for between the anus and coccyx and pulled interiorly, while using the fingers of the other hand on the fetal occiput to control speed of birth and keep flexion of the fetal head (Cunningham 2005; Jönsson 2008). Ritgen's manoeuvre is called 'modified' (Jönsson 2008) when performed during a contraction, rather than between contractions as originally recommended (Cunningham 2008). A recent systematic review, including both randomised and non randomised studies (Bulchandani 2015) concludes that current evidence regarding perineal techniques are insufficient to drive change of practice.
How the intervention might work
Support techniques slow down the birth of the head, allowing the perineum to stretch slowly, thus reducing perineal trauma (Downe 2003). This is why birth attendants, together with the use of support techniques, commonly ask women to breathe instead of push as the head is delivered. The birth of the infant's shoulders is usually assisted by downward traction first, to free the anterior shoulder, and subsequently the posterior shoulder is delivered by guiding the baby in an upward curve (Downe 2003). An alternative technique to the usual practice of birth of the anterior shoulder first is a primary delivery of the posterior shoulder (Aabakke 2016).
Why it is important to do this review
It has been suggested that both the flexion technique and Ritgen's manoeuvre act against the normal mechanism of labour in which the baby naturally angles itself in the most appropriate attitude to pass through the birth canal (Myrfield 1997). This poses the question of which support and other perineal techniques are beneficial for preventing perineal trauma. In this review we update the initial version of this review (Aasheim 2011), which was the first published systematic review comparing different perineal support and other techniques used during the second stage of labour for reducing perineal trauma.
Objectives
The objective of this updated review was to assess the effect of perineal techniques during the second stage of labour on the incidence and morbidity associated with perineal trauma.
Methods
Criteria for considering studies for this review
Types of studies
We included all published and unpublished randomised and quasi‐randomised controlled trials evaluating any described perineal techniques during the second stage of labour. Trials using a cross‐over design were not eligible for inclusion in this review. We included abstracts when enough information was provided to assess eligibility. Where further information was required, we contacted trial authors.
Types of participants
Pregnant women planning to have a spontaneous vaginal birth (after 36 weeks of pregnancy, pregnant with single fetus, cephalic presentation).
Types of interventions
Any perineal techniques, for example: perineal massage, flexion technique, Ritgen's manoeuvre, warm compresses, hands‐on or hands‐poised, etc. all performed during the second stage of labour.
Types of outcome measures
Primary outcomes
-
Intact perineum
-
Perineal trauma not requiring suturing
-
Perineal trauma requiring suturing
-
First‐degree perineal tear
-
Second‐degree perineal tear
-
Third‐ and fourth‐degree tears
-
Incidence of episiotomy
Secondary outcomes
-
Third‐degree perineal tear
-
Fourth‐degree perineal tear
-
Length of second stage
-
For the newborn: Apgar less than seven at five minutes
-
Admission to special care baby unit
-
Perineal pain postpartum
-
Perineal pain at three and at six months after birth
-
Breastfeeding: initiation
-
Breastfeeding: at three months and at six months after birth
-
Women's satisfaction (as defined by trial authors)
-
Morbidity after birth related to sexual health (i.e. stress incontinence and dyspareunia)
Search methods for identification of studies
The following methods section of this review is based on a standard template used by Cochrane Pregnancy and Childbirth.
Electronic searches
We searched Cochrane Pregnancy and Childbirth’s Trials Register by contacting their Information Specialist (26 September 2016).
The Register is a database containing over 22,000 reports of controlled trials in the field of pregnancy and childbirth. For full search methods used to populate Pregnancy and Childbirth’s Trials Register, including the detailed search strategies for CENTRAL, MEDLINE, Embase and CINAHL; the list of handsearched journals and conference proceedings, and the list of journals reviewed via the current awareness service, please follow this link to the editorial information about Cochrane Pregnancy and Childbirth in the Cochrane Library and select the ‘Specialized Register ’ section from the options on the left side of the screen.
Briefly, Cochrane Pregnancy and Childbirth’s Trials Register is maintained by their Information Specialist and contains trials identified from:
-
monthly searches of the Cochrane Central Register of Controlled Trials (CENTRAL);
-
weekly searches of MEDLINE (Ovid);
-
weekly searches of Embase (Ovid);
-
monthly searches of CINAHL (EBSCO);
-
handsearches of 30 journals and the proceedings of major conferences;
-
weekly current awareness alerts for a further 44 journals plus monthly BioMed Central email alerts.
Search results are screened by two people and the full text of all relevant trial reports identified through the searching activities described above is reviewed. Based on the intervention described, each trial report is assigned a number that corresponds to a specific Pregnancy and Childbirth review topic (or topics), and is then added to the Register. The Information Specialist searches the Register for each review using this topic number rather than keywords. This results in a more specific search set, which has been fully accounted for in the relevant review sections (Included studies; Excluded studies; Studies awaiting classification; Ongoing studies).
(See: Aasheim 2011 for additional author searches carried out in the previous version of the review. We did not carry out additional searches for this update.)
Searching other resources
We searched the reference lists of retrieved studies.
We did not apply any language or date restrictions.
Data collection and analysis
For methods used in the previous version of this review, see Aasheim 2011.
For this update, we used the following methods ‐ these are based on a standard methods template used by Cochrane Pregnancy and Childbirth.
Selection of studies
Two review authors V Aasheim (VAA) and ABV Nilsen (ABVN), independently assessed for inclusion all the potential studies identified as a result of the search strategy. We resolved any disagreement through discussion or, if required, we consulted the third review author M Lukasse (ML).
Data extraction and management
We designed a form to extract data. For eligible studies, two review authors (ML and Liv Merete Reinar (LMR)) extracted the data using the agreed form. Data were also extracted by research assistant Anna Cuthbert (AC) and the studies in Persian were extracted by Bita Mesgarpour (BM). We resolved discrepancies through discussion in the team. We entered data into Review Manager 5 (RevMan 5) software (RevMan 2014) and checked them for accuracy.
When information regarding any of the above was unclear, we contacted authors of the original reports to provide further details.
Assessment of risk of bias in included studies
Review authors (ML, LMR, AC or BM) independently assessed risk of bias for each study using the criteria outlined in the Cochrane Handbook for Systematic Reviews of Interventions (Higgins 2011a). Any disagreement was resolved by discussion or by involving all the review team (ML, LMR, ABVN and VAA).
(1) Random sequence generation (checking for possible selection bias)
We described for each included study the method used to generate the allocation sequence in sufficient detail to allow an assessment of whether it should produce comparable groups.
We assessed the method as:
-
low risk of bias (any truly random process, e.g. random number table; computer random number generator);
-
high risk of bias (any non‐random process, e.g. odd or even date of birth; hospital or clinic record number);
-
unclear risk of bias.
(2) Allocation concealment (checking for possible selection bias)
We described for each included study the method used to conceal allocation to interventions prior to assignment and assessed whether intervention allocation could have been foreseen in advance of, or during recruitment, or changed after assignment.
We assessed the methods as:
-
low risk of bias (e.g. telephone or central randomisation; consecutively‐numbered sealed opaque envelopes);
-
high risk of bias (open random allocation; unsealed or non‐opaque envelopes, alternation; date of birth);
-
unclear risk of bias.
(3.1) Blinding of participants and personnel (checking for possible performance bias)
We described for each included study the methods used, if any, to blind study participants and personnel from knowledge of which intervention a participant received. We considered that studies were at low risk of bias if they were blinded, or if we judged that the lack of blinding was unlikely to affect results. We assessed blinding separately for different outcomes or classes of outcomes.
We assessed the methods as:
-
low, high or unclear risk of bias for participants;
-
low, high or unclear risk of bias for personnel.
(3.2) Blinding of outcome assessment (checking for possible detection bias)
We described for each included study the methods used, if any, to blind outcome assessors from knowledge of which intervention a participant received. We assessed blinding separately for different outcomes or classes of outcomes.
We assessed methods used to blind outcome assessment as:
-
low, high or unclear risk of bias.
(4) Incomplete outcome data (checking for possible attrition bias due to the amount, nature and handling of incomplete outcome data)
We described for each included study, and for each outcome or class of outcomes, the completeness of data including attrition and exclusions from the analysis. We stated whether attrition and exclusions were reported and the numbers included in the analysis at each stage (compared with the total randomised participants), reasons for attrition or exclusion where reported, and whether missing data were balanced across groups or were related to outcomes. Where sufficient information was reported, or could be supplied by the trial authors, we planned to re‐include missing data in the analyses we undertook.
We assessed methods as:
-
low risk of bias (e.g. no missing outcome data; missing outcome data balanced across groups);
-
high risk of bias (e.g. numbers or reasons for missing data imbalanced across groups; ‘as‐treated’ analysis done with substantial departure of intervention received from that assigned at randomisation);
-
unclear risk of bias.
(5) Selective reporting (checking for reporting bias)
We described for each included study how we investigated the possibility of selective outcome reporting bias and what we found.
We assessed the methods as:
-
low risk of bias (where it is clear that all of the study’s pre‐specified outcomes and all expected outcomes of interest to the review have been reported);
-
high risk of bias (where not all the study’s pre‐specified outcomes have been reported; one or more reported primary outcomes were not pre‐specified; outcomes of interest were reported incompletely and so could not be used; study failed to include results of a key outcome that would have been expected to have been reported);
-
unclear risk of bias.
(6) Other bias (checking for bias due to problems not covered by (1) to (5) above)
We described for each included study any important concerns we had about other possible sources of bias.
(7) Overall risk of bias
We made explicit judgements about whether studies were at high risk of bias, according to the criteria given in the Cochrane Handbook for Systematic Reviews of Interventions (Higgins 2011a). With reference to (1) to (6) above, we planned to assess the likely magnitude and direction of the bias and whether we considered it was likely to impact on the findings. In future updates, we will explore the impact of the level of bias through undertaking sensitivity analyses ‐ see Sensitivity analysis.
Assessment of the quality of the evidence using the GRADE approach
For this update we assessed the quality of the evidence using the GRADE approach as outlined in the GRADE handbook in order to assess the quality of the body of evidence relating to the following outcomes for the main comparisons (comparisons 1 to 4).
-
Intact perineum
-
Perineal trauma requiring suturing
-
First‐degree perineal tear
-
Second‐degree perineal tear
-
Third‐degree or fourth‐degree perineal tear
-
Incidence of episiotomy
We used the GRADEpro Guideline Development Tool (GRADEpro GDT) to import data from RevMan 5 (RevMan 2014) in order to create summary of findings Table for the main comparison; summary of findings Table 2; summary of findings Table 3; and summary of findings Table 4. We produced a summary of the intervention effect and a measure of quality for each of the above outcomes using the GRADE approach. The GRADE approach uses five considerations (study limitations, consistency of effect, imprecision, indirectness and publication bias) to assess the quality of the body of evidence for each outcome. The evidence can be downgraded from 'high quality' by one level for serious (or by two levels for very serious) limitations, depending on assessments for risk of bias, indirectness of evidence, serious inconsistency, imprecision of effect estimates or potential publication bias.
Measures of treatment effect
Dichotomous data
For dichotomous data, we presented results as summary risk ratio (RR) with 95% confidence intervals (CIs).
Continuous data
We did not identify any continuous outcome data for inclusion in this update. In future updates, we will use mean difference if outcomes were measured in the same way between trials. We will use standardised mean difference to combine trials that measured the same outcome, but used different methods.
Unit of analysis issues
Cluster‐randomised trials
In future updates we will include cluster‐randomised trials in the analyses along with individually randomised trials. We will adjust their sample sizes or standard errors using the methods described in the Cochrane Handbook for Systematic Reviews of Interventions (Section 16.3.4 or 16.3.6 as appropriate; Higgins 2011b) using an estimate of the intra cluster correlation co‐efficient (ICC) derived from the trial (if possible), from a similar trial or from a study of a similar population. If we use ICCs from other sources, we will report this and conduct sensitivity analyses to investigate the effect of variation in the ICC. If we identify both cluster‐randomised trials and individually‐randomised trials, we plan to synthesise the relevant information. We will consider it reasonable to combine the results from both if there is little heterogeneity between the study designs and the interaction between the effect of intervention and the choice of randomisation unit is considered to be unlikely.
We will also acknowledge heterogeneity in the randomisation unit and perform a sensitivity analysis to investigate the effects of the randomisation unit.
Other unit of analysis issue
Trials with multiple treatment arms
We included trials with multiple treatment arms; the interventions were analysed in different comparisons (Albers 2005; Fahami 2012; Sohrabi 2012), or were combined to create one comparison group (Terre‐Rull 2014). In future updates, if we identify more trials with multiple arms, which require inclusion in the same comparison, we will split the control group to form independent comparisons and avoid double counting as described in the Cochrane Handbook for Systematic Reviews of Interventions (Section 16.5.4; Higgins 2011b).
Dealing with missing data
For included studies, we noted levels of attrition. In future updates, if more eligible studies are included, we will explore the impact of including studies with high levels of missing data in the overall assessment of treatment effect using sensitivity analysis.
For all outcomes, analyses were carried out, as far as possible, on an intention‐to‐treat basis, that is, we attempted to include all participants randomised to each group in the analyses. The denominator for each outcome in each trial was the number randomised minus any participants whose outcomes were known to be missing.
Assessment of heterogeneity
We assessed statistical heterogeneity in each meta‐analysis using the Tau², I² (Higgins 2003) and Chi² (Deeks 2011) statistics. We regarded heterogeneity as substantial if I² was greater than 50% and either Tau² was greater than zero, or there was a low P value (less than 0.10) in the Chi² test for heterogeneity. If we identified substantial heterogeneity (above 50%), we planned to explore it by pre‐specified subgroup analysis.
Assessment of reporting biases
In future updates, if there are 10 or more studies in the meta‐analysis we will investigate reporting biases (such as publication bias) using funnel plots. We will assess funnel plot asymmetry visually. If asymmetry is suggested by a visual assessment, we will perform exploratory analyses to investigate it.
Data synthesis
We carried out statistical analysis using the RevMan 5 software (RevMan 2014). Because there was clinical heterogeneity sufficient to expect that the underlying treatment effect differed between trials, and substantial statistical heterogeneity was detected, we used random‐effects meta‐analysis to produce an overall summary where an average treatment effect across trials was considered clinically meaningful. The random‐effects summary was treated as the average range of possible treatment effects and we discussed the clinical implications of treatment effects differing between trials. When the average treatment effect was not clinically meaningful, we did not combine trials. The results were presented as the average treatment effect (RR) with 95% CI, and the estimates of Tau² and I².
Subgroup analysis and investigation of heterogeneity
If we, in future reviews, identify substantial heterogeneity, we will investigate it using subgroup analyses and sensitivity analyses. We will consider whether an overall summary is meaningful, and if it is, use random‐effects analysis to produce it.
There were insufficient data in each analysis to carry out our prespecified subgroup analyses. However, in future updates of this review, as more data become available, we will carry out the following subgroup analyses.
-
Nulliparous women versus multiparous women
-
Birthweight: less than 4000 g versus 4000 g or more
-
Maternal age: less than 35 years versus 35 years or more
-
Ethnicity: women from one ethnic group versus women from another ethnic group
We will use the following outcomes in subgroup analysis.
-
Intact perineum
-
Perineal trauma requiring suturing
-
Third‐ or fourth‐degree perineal tear
For random‐effects meta‐analyses using methods other than inverse variance, we will assess differences between subgroups by inspection of the subgroups’ CIs; non‐overlapping CIs indicate a statistically significant difference in treatment effect between the subgroups.
Sensitivity analysis
We planned to carry out sensitivity analyses to explore the effect of trial quality assessed by concealment of allocation, high attrition rates, or both, with poor‐quality studies being excluded from the analyses in order to assess whether this makes any difference to the overall result. We also planned to carry out sensitivity analysis to examine the effect of the randomisation unit where we include cluster‐RCTs along with individually‐randomised trials. It was not possible to carry out our planned sensitivity analysis because mostly the included trials were at moderate to high risk of bias, and we did not identify any cluster‐RCTs for inclusion in this update. In future updates, we will carry out planned sensitivity analyses, where appropriate.
Results
Description of studies
Results of the search
See: Figure 1
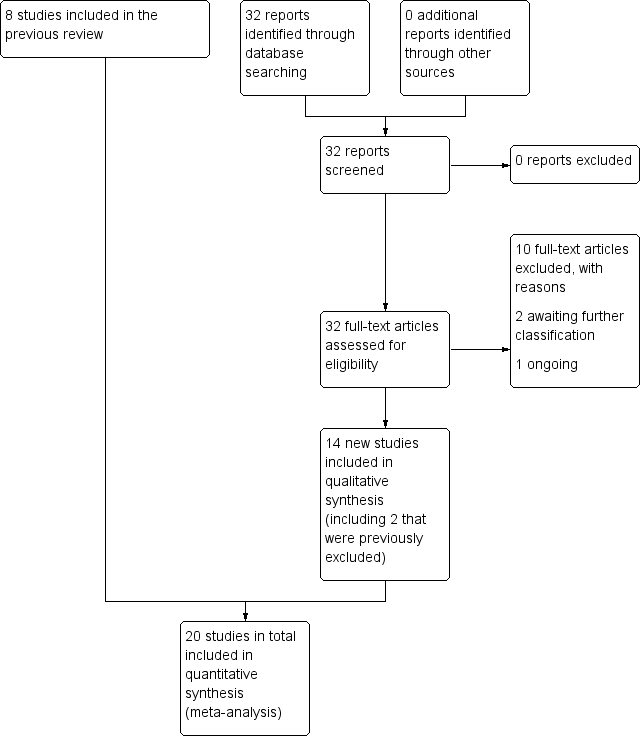
Study flow diagram
Our 2011 search identified 17 citations related to 12 trials. They were identified by the Information Specialist and we found no additional trials by the MEDLINE and CINAHL search. We found one additional unpublished study from a reference list (Musgrove 1997). Of the identified studies, we included data from eight trials involving 11,651 randomised women; two further trials (Most 2008; Musgrove 1997) were otherwise eligible for inclusion but did not contribute any data to the review as either relevant outcomes were not reported or were reported in a way that did not allow us to include them in the review. As they do not contribute to the results of the review, these two studies are not discussed in the effects of interventions sections below.
The updated search in September 2016 identified a further 32 citations relating to 23 trials. We included 12 new trials, and two previously excluded trials, so this review now involves 15,181 randomised women in 22 studies. (See Characteristics of included studies.) Overall, we excluded 10 trials.
Two trials are awaiting further assessment pending further information from trial authors (Taavoni 2015; Velev 2013) (see Characteristics of studies awaiting classification). One study is ongoing (NCT02588508).
Included studies
Two trials did not contribute data to the review; Most 2008 examined a gel lubricant and Musgrove 1997 warm packs applied to the perineum in the second stage of labour. Neither study reported outcome data that we were able to include in this review update.
We included data from 20 trials with data involving 15,181 randomised women (Aabakke 2016; Albers 2005; Araujo 2008; Attarha 2009; Dahlen 2007; De Costa 2006; Fahami 2012; Foroughipour 2011; Galledar 2010; Geranmayeh 2012; Harlev 2013; Jönsson 2008; Lavesson 2014; Mayerhofer 2002; McCandlish 1998; Rezaei 2014; Shirvani 2014a; Sohrabi 2012; Stamp 2001; Terre‐Rull 2014). For more details seeCharacteristics of included studies.
The studies varied in size. Aabakke 2016 included 650 women, Albers 2005 1211 women, Araujo 2008 106 women, Attarha 2009 204 women, Dahlen 2007 717 women, De Costa 2006 70 women, Fahami 2012 99 women, Foroughipour 2011 100 women, Galledar 2010 141 women, Geranmayeh 2012 82 women, Harlev 2013 164 women, Jönsson 2008 1575 women, Lavesson 2014 1148 women, Mayerhofer 2002 1161 women, McCandlish 1998 5471 women, Rezaei 2014 600 women, Shirvani 2014a 64 women, Sohrabi 2012 120 women, Stamp 2001 1340 women and Terre‐Rull 2014 198 women.
Four studies included three treatment arms (Albers 2005; Fahami 2012; Sohrabi 2012; Terre‐Rull 2014); three of these studies (Albers 2005; Fahami 2012; Sohrabi 2012) were analysed in different comparisons, and one was combined to create one comparison group (Terre‐Rull 2014).
Settings
The studies contributing data were conducted in hospital settings in the following countries: Denmark (Aabakke 2016); Iran (Attarha 2009; Fahami 2012; Foroughipour 2011; Galledar 2010; Geranmayeh 2012; Rezaei 2014; Shirvani 2014a; Sohrabi 2012); USA (Albers 2005); Australia (Dahlen 2007; Stamp 2001); Brazil (Araujo 2008; De Costa 2006); Sweden (Jönsson 2008; Lavesson 2014); Austria (Mayerhofer 2002); Spain (Terre‐Rull 2014); Israel (Harlev 2013) and UK (McCandlish 1998).
Participants
The participants in the studies contributing data to the review were nulliparous and multiparous women expecting a vaginal birth, singleton vertex presentation at term, with no medical complications. Thirteen studies had nulliparous as an inclusion criteria (Aabakke 2016; Araujo 2008; Attarha 2009; Dahlen 2007; De Costa 2006; Fahami 2012; Foroughipour 2011; Galledar 2010; Geranmayeh 2012; Jönsson 2008; Rezaei 2014; Shirvani 2014a; Sohrabi 2012).
Interventions
Various interventions/perineal management techniques are described in the included studies. One study compared birth of the anterior versus the posterior shoulder first (Aabakke 2016). One study compared warm compresses held to the mother's perineum and external genitalia versus hands‐off, and perineal massage inside the woman's vagina versus hands‐off (Albers 2005). One study compared warm compresses versus Ritgen's manoeuvre and standard care, and perineal massage versus Ritgen's manoeuvre and standard care (Sohrabi 2012). One study compared warm packs on the perineum versus not having warm packs (Dahlen 2007). One study compared the use of moist and dry heat to the perineum versus control (Terre‐Rull 2014). Five studies compared hands off versus hands on the perineum (De Costa 2006; Foroughipour 2011; Mayerhofer 2002; McCandlish 1998; Rezaei 2014). Seven studies compared massage of the perineum with no massage or routine care (Albers 2005; Attarha 2009; Fahami 2012; Galledar 2010; Geranmayeh 2012; Sohrabi 2012; Stamp 2001). Ritgen's manoeuvre was included as part of routine care in Sohrabi 2012. One study compared a modified Ritgen's manoeuvre with standard practice (with one hand to apply pressure on the perineum, and the other hand on the fetal occiput) (Jönsson 2008) and one study compared Ritgen's manoeuvre with no touch of the perineum (Fahami 2012). One study compared the use of a perineal protection device versus perineal support (Lavesson 2014), one study compared the use of enriched oil versus liquid wax (Harlev 2013), one study compared cold compresses towards the perineum versus no cold compresses (Shirvani 2014a) and one study compared application of petroleum jelly to the perineum with no application of jelly (Araujo 2008). See Characteristics of included studies for a more detailed description of the experimental and comparison interventions.
Outcomes
The included trials had various primary outcomes. Aabakke 2016 had any perineal trauma requiring suturing as a primary outcome. In Albers 2005 the primary outcome was an intact perineum (defined as no tissue separation). In Araujo 2008 the primary outcome was frequency of perineal trauma, intact perineum or trauma, degree of trauma (first or second) and location (posterior or anterior or both). Attarha 2009 had incidence of episiotomy, intact perineum, perineal tear as primary outcomes. Dahlen 2007 had suturing after birth as the primary outcome (defined as perineal trauma greater than first‐degree tear, any tear that was bleeding and any tear that did not fall into anatomical apposition). In De Costa 2006 the primary outcome was the degree of perineal trauma and in Fahami 2012 the primary outcome was perineal laceration and perineal pain. In Foroughipour 2011 the outcomes were perineal traumas, need for episiotomy, severity of perineal tears, haemorrhage, perineal pain and haematoma, and birth outcome including the duration of each labour stage, amount of haemorrhage in first, second, third and fourth stage of labour, and neonatal Apgar score. Galledar 2010 had duration of the second stage of labour, intact perineum, perineal tear, episiotomy, degree of perineal tear and intensity of perineal pain as outcomes. Geranmayeh 2012 had oxytocin consumption during labour, the length of the second stage of labour, nuchal cord, neonate’s weight, perineal tears and episiotomy, Apgar scores and neonatal complications as primary outcomes. Harlev 2013 had birthweight, perineal tears and episiotomy. In Jönsson 2008 outcomes were the rate of third‐ to fourth‐degree perineal ruptures, including external anal sphincter. In Lavesson 2014 perineal tears and incidence of episiotomy were primary outcomes. In the Mayerhofer 2002 study the primary outcome was perineal trauma (degree and episiotomy) and in the McCandlish 1998 study it was perineal pain 10 days postpartum. In Rezaei 2014 the outcomes were perineal trauma, in Shirvani 2014a the duration of second and fourth stage, fetal heart rate, Apgar score, episiotomy and laceration; Sohrabi 2012 had severity and degree of perineal ruptures, the rate of lacerations in the anterior perineal region and the amount of stitches required for repair as outcomes. In Stamp 2001, the primary outcomes were: rates of intact perineum; episiotomy; and first‐, second‐, third‐ and fourth‐degree tear and finally Terre‐Rull 2014 had perineal trauma and Apgar score as outcomes.
One study (Shirvani 2014a) described perineal tears as degree one. Three studies (Araujo 2008; Galledar 2010; Geranmayeh 2012) described perineal tears (non sphincter) as degrees one and two; one study (Aabakke 2016) described perineal tears as any perineal trauma, any anterior or posterior trauma. Four studies described perineal tears as degrees one, two and three (Foroughipour 2011; Harlev 2013; Mayerhofer 2002; Terre‐Rull 2014); one study (Jönsson 2008) described perineal tears as degrees three and four, one study (Lavesson 2014) described degrees one and two, and anal sphincter rupture; and the other studies described perineal tears as degrees one, two, three and four (Albers 2005; Attarha 2009; Dahlen 2007; De Costa 2006; Fahami 2012; McCandlish 1998; Rezaei 2014; Sohrabi 2012; Stamp 2001).
Excluded studies
We excluded 10 trials (Ashwal 2016; Barbieri 2013; Behmanesh 2009; Corton 2012; Demirel 2015; Hassaballa 2015; Karacam 2012; Low 2013; Schaub 2008; Taavoni 2013).
Eight trials were excluded because they examined interventions that took place in the first stage of labour (Ashwal 2016; Barbieri 2013; Behmanesh 2009; Demirel 2015; Hassaballa 2015; Karacam 2012; Schaub 2008; Taavoni 2013). One trial (Low 2013) looked at an intervention in pregnancy and one trial (Corton 2012) looked at the use of stirrups, which is not a relevant intervention for this review of perineal techniques. (For further information see Characteristics of excluded studies.)
Risk of bias in included studies
We have provided details for each trial in Characteristics of included studies. We have presented a summary of the methodological quality for each individual study in Figure 2 and a summary of methodological quality across all studies in Figure 3.
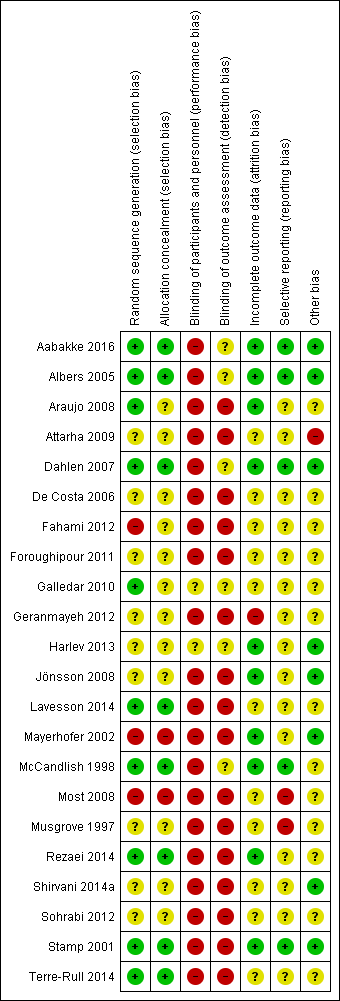
Methodological quality summary: review authors' judgements about each methodological quality item for each included study
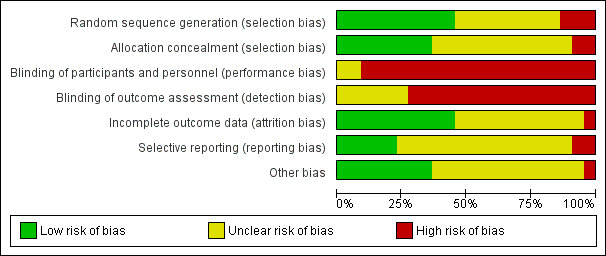
Methodological quality graph: review authors' judgements about each methodological quality item presented as percentages across all included studies
Allocation
We assessed random sequence generation as 'low risk of bias' in 10 included studies (Aabakke 2016; Albers 2005; Araujo 2008; Dahlen 2007; Galledar 2010; Lavesson 2014; McCandlish 1998; Rezaei 2014; Stamp 2001; Terre‐Rull 2014). Two studies contributing data were assessed as high risk of bias for sequence generation: Fahami 2012 used a randomly‐generated number table but the selection was performed by a researcher pointing at the table of numbers with their eyes closed, and Mayerhofer 2002 randomised according to date of birth. All the remaining studies were assessed as unclear risk of bias in this domain.
We assessed allocation concealment as 'low risk of bias' in eight of 20 included studies contributing data (Aabakke 2016; Albers 2005; Dahlen 2007; Lavesson 2014; McCandlish 1998; Rezaei 2014; Stamp 2001; Terre‐Rull 2014). The only study that was assessed as having high risk of bias on this criteria was Mayerhofer 2002, where women were randomised according to date of birth (even or odd days). The others were assessed as having an unclear risk of bias (Araujo 2008; Attarha 2009; De Costa 2006; Fahami 2012; Foroughipour 2011; Galledar 2010; Geranmayeh 2012; Harlev 2013; Jönsson 2008; Shirvani 2014a; Sohrabi 2012).
For the two included studies that did not contribute data, Most 2008 was a quasi‐randomised trial with allocation by hospital number and we assessed this as high risk of bias for sequence generation and allocation concealment, while the other (Musgrove 1997) was assessed as unclear for both of these domains.
Blinding
Performance bias
Given the nature of the intervention, it was not possible to blind the intervention for the clinician/the midwife performing the technique. It was also impossible to blind women to the allocated group therefore we assessed most studies to be at high risk of performance bias. In Aabakke 2016 the randomisation envelope was opened by the midwife when the women entered the second stage of labour and was destroyed thereafter. The allocation was only shown to the midwife and the assistant, and if necessary the obstetrician, and the participants might have been blinded. Some women may have been disappointed with the allocation group, thus affecting the results. Also, some women may have been convinced that the technique they received was best, thus causing a 'placebo' effect. In McCandlish 1998, women were not told which group they ended up in, unless the women asked for that information. When a women was informed, it was noted in the data form. About a third of the women in each group were informed of their allocation.
We assessed two studies to be at unclear risk of performance bias. In Harlev 2013 both the oils for the intervention were contained in similar bottles differentiated only by a number on the bottle and the midwives and the physicians who delivered the woman were blinded to the oil type. It is possible that this blinding was broken. It was unclear Galledar 2010's report if blinding was attempted.
Detection bias
The outcome assessors could have been blinded to the perineal technique. In Dahlen 2007, the outcome assessor was blinded and the midwives were asked not to discuss allocation. As this method of blinding could be easily broken, this study was assessed to be at unclear risk of detection bias. In most of the included studies there was some degree of blinding. Five other studies were at unclear risk of detection bias; Aabakke 2016 used a blinded midwife to assess the perineum but other outcomes were recorded by unblinded midwives; Albers 2005 used the midwife caring for the woman as outcome assessor but 25% of births were attended by an independent observing midwife; another study attempted to blind staff to allocation but is not explicit in whether women were blinded which could have broken blinding of staff (McCandlish 1998); it was unclear in two studies whether assessors were blinded (Galledar 2010; Harlev 2013). The remaining studies were at high risk of detection bias; Araujo 2008, Fahami 2012, Jönsson 2008; Lavesson 2014; Mayerhofer 2002; Rezaei 2014; Shirvani 2014a; Terre‐Rull 2014 did not blind outcome assessors; Attarha 2009, De Costa 2006, Foroughipour 2011, Geranmayeh 2012; Sohrabi 2012 did not give enough information to allow assessment of this domain and it was assumed blinding was not attempted; and Stamp 2001 used an independent assessor when available though it is not clear how often this occurred.
For the two included studies that did not contribute data, we assessed both as high risk of performance and detection bias due to lack of blinding (Most 2008; Musgrove 1997).
Incomplete outcome data
We assessed incomplete outcome data as unclear in nine of 20 studies contributing data; Attarha 2009; De Costa 2006; Fahami 2012; Foroughipour 2011; Galledar 2010; Lavesson 2014; Shirvani 2014a; Sohrabi 2012;Terre‐Rull 2014. We assessed 10 studies as low risk of attrition bias (Aabakke 2016; Albers 2005; Araujo 2008; Dahlen 2007; Harlev 2013; Jönsson 2008; Mayerhofer 2002; McCandlish 1998; Rezaei 2014; Stamp 2001). The only study that we assessed as having high risk of attrition bias was Geranmayeh 2012.
For the two included studies that did not contribute data, we assessed attrition bias as unclear in both cases (Most 2008; Musgrove 1997).
Selective reporting
From the 20 studies contributing data to this review, we assessed five studies (Aabakke 2016; Albers 2005; Dahlen 2007; McCandlish 1998; Stamp 2001) as being free of selective reporting bias (low risk of bias). The others we assessed as having an unclear risk of bias on this domain (Araujo 2008; Attarha 2009; De Costa 2006; Fahami 2012; Foroughipour 2011; Galledar 2010; Geranmayeh 2012; Harlev 2013; Jönsson 2008; Lavesson 2014; Mayerhofer 2002; Rezaei 2014; Shirvani 2014a; Sohrabi 2012; Terre‐Rull 2014).
For the two included studies that did not contribute data, due to inconsistencies in data and selective reporting, we assessed both Most 2008 and Musgrove 1997 as high risk of bias for this domain.
Other potential sources of bias
From the 20 studies contributing data to this review, we considered eight studies to be free of problems that could put them at risk of bias (Aabakke 2016; Albers 2005; Dahlen 2007; Harlev 2013; Jönsson 2008; Mayerhofer 2002; Shirvani 2014a; Stamp 2001). We considered the risk of other bias to be 'unclear' for 11 studies (Araujo 2008; De Costa 2006; Fahami 2012; Foroughipour 2011; Galledar 2010; Geranmayeh 2012; Lavesson 2014; McCandlish 1998; Rezaei 2014; Sohrabi 2012; Terre‐Rull 2014) and one study (Attarha 2009) to be at high risk of bias. We have described the sources of other bias under Characteristics of included studies.
For the two included studies that did not contribute data, we assessed other sources of bias for Most 2008 and Musgrove 1997 as unclear. In both cases results were published in brief abstracts.
Effects of interventions
See: Summary of findings for the main comparison Hands off (or poised) compared to hands on for reducing perineal trauma; Summary of findings 2 Warm compresses compared to control (hands off or no warm compress) for reducing perineal trauma; Summary of findings 3 Massage compared to control (hands off or care as usual) for reducing perineal trauma; Summary of findings 4 Ritgen's manoeuvre compared to standard care for reducing perineal trauma
We included data for the following comparisons:
-
hands off (or poised) versus hands on (five studies);
-
warm compresses versus control (hands off or no warm compress) (four studies);
-
massage versus control (hands off/care as usual) (seven studies);
-
Ritgen's manoeuvre versus standard care (two studies);
-
primary delivery of posterior versus anterior shoulder (one study);
-
perineal protection device versus perineal support (one study);
-
enriched oil versus liquid wax (one study);
-
cold compresses versus control (one study).
As many of the studies reported third‐ and fourth‐degree tears together, we chose to combine third‐ and fourth‐degree tears as one outcome for the meta‐analyses, except for Analysis 7.4.
1. Hands off (or poised) versus hands on
Five studies compared hands off versus hands on the perineum (De Costa 2006; Foroughipour 2011; Mayerhofer 2002; McCandlish 1998; Rezaei 2014). One of the studies was small and did not give any estimable effect (De Costa 2006).
Primary outcomes
Intact perineum
When measuring the incidence of intact perineum, an outcome reported in two studies (Mayerhofer 2002; McCandlish 1998), the incidence was similar in each group (average risk ratio (RR) 1.03, 95% confidence interval (CI) 0.95 to 1.12, Tau² = 0.00, I² = 37%, two studies, 6547 women); see Analysis 1.1. We graded this evidence as moderate quality.
Perineal trauma not requiring suturing
The included studies under this comparison did not report on this outcome.
Perineal trauma requiring suturing
The included studies under this comparison did not report on this outcome.
First‐degree perineal tear
When measuring the incidence of first‐degree perineal tear, an outcome reported in two studies (Foroughipour 2011; Rezaei 2014), the treatment effect was not clear though it appeared to favour 'hands on' (average RR 1.32, 95% CI 0.99 to 1.77, two studies, 700 women); see Analysis 1.2. We graded this evidence as low quality.
Second‐degree perineal tear
When measuring the incidence of second‐degree perineal tear, an outcome reported in two studies (Foroughipour 2011; Rezaei 2014), the treatment effect was not clear (average RR 0.77, 95% CI 0.47 to 1.28, two studies, 700 women); see analyses Analysis 1.3. We graded this evidence as low quality.
Third‐degree or fourth‐degree perineal tear
Five studies reported the incidence of third‐degree and fourth‐degree perineal tear (De Costa 2006; Foroughipour 2011; Mayerhofer 2002; McCandlish 1998; Rezaei 2014). One study reported only on third‐degree tears (Mayerhofer 2002), and one study (McCandlish 1998) reported third‐ and fourth‐degree tears together. The average treatment effect was not clear (average RR 0.68, 95% CI 0.21 to 2.26, Tau² = 0.92, I² = 72%, five studies, 7317 women); however, the substantial heterogeneity means that the treatment effects in any individual study could be in either direction; see Analysis 1.4. We graded this evidence as very low quality.
Incidence of episiotomy
Four studies (Foroughipour 2011; Mayerhofer 2002; McCandlish 1998; Rezaei 2014) measured the incidence of episiotomy. The average the treatment effect was not clear (RR 0.58, 95% CI 0.43 to 0.79, Tau² = 0.07, I² = 74%, four studies, 7247 women), but there was considerable unexplained heterogeneity between the four included studies (Foroughipour 2011; Mayerhofer 2002, McCandlish 1998; Rezaei 2014); see Analysis 1.5. We graded this evidence as low quality. Women receiving hands off (or poised) as opposed to hands on treatment were, on average, less likely to experience episiotomy; see Analysis 1.5, though the magnitude of the effect is not clear.
Secondary outcomes
Third‐degree tear
Four studies reported third‐degree tears alone (De Costa 2006; Foroughipour 2011; Mayerhofer 2002; Rezaei 2014) but found no clear difference between the two groups (average RR 0.49, 95% CI 0.09 to 2.73, Tau² = 1.37, I² = 59%, four studies, 1846 women); see Analysis 1.6. Heterogeneity is high for this outcome.
Fourth‐degree tear
Only one small study (De Costa 2006) reported fourth‐degree tears separately and reported zero in both groups (Analysis 1.7).
The included studies under this comparison did not report data on any of the review's secondary outcomes, these are: length of second stage; Apgar less than seven at five minutes; admission to special care baby unit; perineal pain postpartum; perineal pain at three and at six months after birth; breastfeeding initiation; breastfeeding at three months and at six months after birth; women's satisfaction; maternal morbidity after birth related to sexual health (i.e. stress incontinence and dyspareunia).
2. Warm compresses versus control (hands off or no warm compress)
Four studies (Albers 2005; Dahlen 2007; Sohrabi 2012; Terre‐Rull 2014) compared warm compresses versus hands off or no warm compress.
Primary outcomes
Intact perineum
All four studies reported on intact perineum but there was no clear difference between the groups. Warm compresses did not result in a treatment effect when the presence of intact perineum was used as an outcome (average RR 1.02, 95% CI 0.85 to 1.21, four studies, 1799 women); see Analysis 2.1. We graded this evidence as moderate quality.
Perineal trauma not requiring suturing
One study (Sohrabi 2012) reported similar rates of perineal trauma not requiring suturing in the two groups (RR 0.82, 95% CI 0.48 to 1.42, one study, 76 women); see Analysis 2.2.
Perineal trauma requiring suturing
One study (Sohrabi 2012) reported similar rates of perineal trauma requiring suturing in the two groups (RR 1.14, 95% CI 0.79 to 1.66, one study, 76 women); see Analysis 2.3. We graded this evidence as very low quality.
First‐degree perineal tear
Two studies (Sohrabi 2012; Terre‐Rull 2014) reported this outcome. The evidence was graded as very low quality and it is uncertain whether warm compress is likely to increase or reduce the likelihood of having a first‐degree tear (average RR 1.19, 95% CI 0.38 to 3.79, Tau² = 1.37, I² = 88%, two studies, 274 women); see Analysis 2.4. We observed substantial heterogeneity in this analysis so these results should be interpreted with caution.
Second‐degree perineal tear
When measuring the incidence of second‐degree perineal tear, an outcome reported in two studies (Sohrabi 2012; Terre‐Rull 2014), there was no clear difference between the groups (average RR 0.95, 95% CI 0.58 to 1.56, two studies, 274 women); see Analysis 2.5. We graded this evidence as very low quality.
Third‐degree or fourth‐degree perineal tear
Four studies reported on third‐or fourth‐degree perineal tear (Albers 2005; Dahlen 2007; Sohrabi 2012; Terre‐Rull 2014). Women receiving warm compresses as opposed to hands off or no warm compresses were, on average, less likely to experience third‐ or fourth‐degree perineal tear. The use of warm compresses led to a reduction in the average number of third‐ and fourth‐degree tears (average RR 0.46, 95% CI 0.27 to 0.79, four studies, 1799 women); see Analysis 2.6. We graded this evidence as moderate quality.
Incidence of episiotomy
Four studies reported on episiotomy (Albers 2005; Dahlen 2007; Sohrabi 2012; Terre‐Rull 2014) and there were similar rates of episiotomies (55/54) in each group (RR 0.86, 95% CI 0.60 to 1.23, four studies, 1799 women); see Analysis 2.7. No episiotomies were reported in either group in Sohrabi 2012. We graded this evidence as low quality.
Secondary outcomes
Third‐degree tear
Three studies reported on third‐degree tears (Albers 2005; Sohrabi 2012; Terre‐Rull 2014) and found no clear difference between the treatment and control groups (average RR 0.51, 95% CI 0.04 to 7.05, Tau² = 2.12, I² = 57%; 1082 women; three studies); see Analysis 2.8. Heterogeneity is high for this outcome and the results should be viewed with caution. Sohrabi 2012 did not report any third‐degree tears. Terre‐Rull 2014 used both damp and dry compresses which may have affected results.
Fourth‐degree tear
Two studies (Albers 2005; Sohrabi 2012) reported fourth‐degree tears but there were zero events in the Sohrabi 2012 study. The meta‐analysis suggests that warm compress favours fewer fourth‐degree tears but the wide confidence intervals cross the line of no effect, so this result may be due to chance (average RR 0.11, 95% CI 0.01 to 2.06, two studies, 884 women); see Analysis 2.9.
None of the included studies under this comparison reported data on any other of this review's secondary outcomes, these are: length of second stage; Apgar less than seven at five minutes; admission to special care baby unit; perineal pain postpartum; perineal pain at three and at six months after birth; breastfeeding initiation; breastfeeding at three months and at six months after birth; women's satisfaction; maternal morbidity after birth related to sexual health (i.e. stress incontinence and dyspareunia).
3. Massage versus control (hands off or care as usual)
Seven studies (Albers 2005; Attarha 2009; Fahami 2012; Galledar 2010; Geranmayeh 2012; Sohrabi 2012; Stamp 2001) compared massage versus hands off or care as usual.
Primary outcomes
Intact perineum
This outcome was reported in six studies (Albers 2005; Attarha 2009; Galledar 2010; Geranmayeh 2012; Sohrabi 2012; Stamp 2001). Massage was associated with a higher incidence in the average number of women with intact perineum (average RR 1.74, 95% CI 1.11 to 2.73, Tau² = 0.20, I² = 83%, six studies, 2618 women); see Analysis 3.1. We graded this evidence as low quality. However, the substantial heterogeneity means that the treatment effects in any individual study could be in either direction. Two studies (Attarha 2009; Geranmayeh 2012) seem to contribute substantially to the heterogeneity by their implausibly large treatment effects. This could be caused by a number of factors, both studies were assessed as having a high risk of bias.
Perineal trauma not requiring suturing
The included studies under this comparison did not report on this outcome.
Perineal trauma requiring suturing
One study (Sohrabi 2012) reported this outcome and there were similar rates in both groups (23/21) (RR 1.10, 95% CI 0.75 to 1.61, one study, 76 women); see Analysis 3.2. We graded this evidence as very low quality.
First‐degree perineal tear
When measuring the incidence of first‐degree perineal tear, an outcome reported in five studies (Attarha 2009; Fahami 2012; Galledar 2010; Geranmayeh 2012; Sohrabi 2012), there was no clear difference between the groups (average RR 1.55, 95% CI 0.79 to 3.05, Tau² = 0.47, I² = 85%, five studies, 537 women); see Analysis 3.3. We graded this evidence as very low quality. However, the substantial heterogeneity means that the treatment effects in any individual study could be in either direction, and this result should be interpreted with caution.
Second‐degree perineal tear
When measuring the incidence of second‐degree perineal tear, an outcome reported in five studies (Attarha 2009; Fahami 2012; Galledar 2010; Geranmayeh 2012; Sohrabi 2012), there was no clear difference between the groups (average RR 1.08, 95% CI 0.55 to 2.12, Tau² = 0.32, I² = 62%, five studies, 537 women); see Analysis 3.4. We graded this evidence as very low quality. However, the substantial heterogeneity means that the treatment effects in any individual study could be in either direction.
Third‐degree or fourth‐degree perineal tear
The incidence of third‐degree and fourth‐degree perineal tear was reported in five studies (Albers 2005; Attarha 2009; Geranmayeh 2012; Sohrabi 2012; Stamp 2001). However two of the studies (Geranmayeh 2012; Sohrabi 2012) did not contribute in the analyses (zero events, effect not estimable). Women receiving warm massage as opposed to control (hands off or care as usual) were, on average, less likely to experience third‐ or fourth‐degree perineal tears (average RR 0.49, 95% CI 0.25 to 0.94, five studies, 2477 women); see Analysis 3.5. We graded this evidence as moderate quality.
Incidence of episiotomy
When measuring the incidence of episiotomy, an outcome reported by seven studies (Albers 2005; Attarha 2009; Fahami 2012; Galledar 2010; Geranmayeh 2012; Sohrabi 2012; Stamp 2001), there was no clear difference between the groups (average RR 0.55, 95% CI 0.29 to 1.03, Tau² = 0.43, I² = 92%, seven studies, 2684 women); see Analysis 3.6. We graded this evidence as very low quality. However, the substantial heterogeneity means that the treatment effects in any individual study could be in either direction, and these results should be viewed with caution.
Secondary outcomes
Third‐degree perineal tear
Five studies reported the outcome third‐degree tears (Albers 2005; Attarha 2009; Geranmayeh 2012; Sohrabi 2012; Stamp 2001), and found no clear difference between the groups (RR 0.57, 95% CI 0.16 to 2.02; Tau² = 0.64, I² = 50%, five studies, 2477 women); see Analysis 3.7. However, the heterogeneity means that the treatment effects in any individual study could be in either direction. Geranmayeh 2012 and Sohrabi 2012 did not report any third‐degree tears.
Fourth‐degree perineal tear
The same five studies reported this outcome (Albers 2005; Attarha 2009; Geranmayeh 2012; Sohrabi 2012; Stamp 2001) but we observed three zero events in three studies (Attarha 2009; Geranmayeh 2012; Sohrabi 2012). No clear difference was found although the results appear to favour massage (RR 0.26, 95% CI 0.04 to 1.61; five studies, 2477 women); see Analysis 3.8.
None of the included studies under this comparison reported data on any other of this review's secondary outcomes, these are: length of second stage; Apgar less than seven at five minutes; admission to special care baby unit; perineal pain postpartum; perineal pain at three and at six months after birth; breastfeeding initiation; breastfeeding at three months and at six months after birth; women's satisfaction; maternal morbidity after birth related to sexual health (i.e. stress incontinence and dyspareunia).
4 Ritgen's manoeuvre versus standard care
Two studies (involving 1489 women) evaluating Ritgen's manoeuvre met the inclusion criteria for this review (Fahami 2012; Jönsson 2008).
Primary outcomes
Intact perineum
This outcome was only reported in one small study (Fahami 2012), the treatment effect was not clearly different between the two groups (RR 0.17, 95% CI 0.02 to 1.31, one study, 66 women) and we graded this evidence as very low quality. See Analysis 4.1.
Perineal trauma not requiring suturing
Neither of the included studies under this comparison reported on this outcome.
Perineal trauma requiring suturing
Neither of the included studies under this comparison reported on this outcome.
First‐degree perineal tear
When measuring the incidence of first‐degree perineal tear, an outcome reported in one small study (Fahami 2012), women receiving Ritgen's manoeuvre versus standard care were less likely to experience first‐degree perineal tears (RR 0.32, 95% CI 0.14 to 0.69, one study, 66 women); see Analysis 4.2. Women receiving Ritgen's manoeuvre versus standard care were, on average, less likely to experience first‐degree perineal tears. We graded this evidence as very low quality.
Second‐degree perineal tear
The incidence of second‐degree perineal tear was reported in one small study (Fahami 2012). Women receiving Ritgen's manoeuvre versus standard care were more likely to experience second‐degree perineal tears (RR 3.25, 95% CI 1.73 to 6.09, one study, 66 women); see Analysis 4.3. We graded this evidence as very low quality. It seems improbable that women receiving Ritgens' manoeuvre should be less likely to have a first‐degree tear but more likely to have a second‐degree tear; this could be due to lack of blinding, or chance.
Third‐degree or fourth‐degree perineal tear
One study (Jönsson 2008) reported this outcome. For third‐ and fourth‐degree tears together, there was no clear difference between the groups (RR 1.24, 95% CI 0.78 to 1.96, one study, 1423 women); see Analysis 4.4. We graded this evidence as low quality.
Incidence of episiotomy
The incidence of episiotomy was reported in two studies (Fahami 2012; Jönsson 2008), although there were no events observed in Fahami 2012. There was no clear difference between the groups (RR 0.81, 95% CI 0.63 to 1.03, two studies, 1489 women); see Analysis 4.5. We graded this evidence as low quality.
Secondary outcomes
Third‐degree perineal tear
When measuring the incidence of third‐degree perineal tear, an outcome reported in one study (Jönsson 2008), there was no clear difference between the groups (RR 1.42, 95% CI 0.86 to 2.36, one study, 1423 women); see Analysis 4.6.
Fourth‐degree perineal tear
When measuring the incidence of fourth‐degree perineal tear, an outcome reported in one study (Jönsson 2008), there were similar rates (4/7) between the two groups (RR 0.60, 95% CI 0.18 to 2.03, one study, 1423 women); see Analysis 4.7.
None of the included studies under this comparison reported data on any of the other secondary outcomes, these are: length of second stage; Apgar less than seven at five minutes; admission to special care baby unit; perineal pain postpartum; perineal pain at three and at six months after birth; breastfeeding initiation; breastfeeding at three months and at six months after birth; women's satisfaction; maternal morbidity after birth related to sexual health (i.e. stress incontinence and dyspareunia).
5 Primary delivery of posterior versus anterior shoulder
One study (involving 543 women) evaluating primary delivery of posterior versus anterior shoulder met the inclusion criteria for this review (Aabakke 2016).
Primary outcomes
Intact perineum
The included study under this comparison did not report on this outcome.
Perineal trauma requiring suturing
The included study under this comparison did not report on this outcome.
Perineal trauma requiring suturing
When measuring the incidence of perineal trauma requiring suturing, an outcome reported in one study (Aabakke 2016), there was no clear difference between the groups (RR 1.01, 95% CI 0.96 to 1.07, one study, 543 women); see Analysis 5.1.
First‐degree perineal tear
The included study under this comparison did not report on this outcome.
Second‐degree perineal tear
The included study under this comparison did not report on this outcome.
Third‐degree or fourth‐degree perineal tear
When measuring the incidence of third‐degree or fourth‐degree perineal tear, an outcome reported in one study (Aabakke 2016), there was no clear difference between the groups (RR 0.81, 95% CI 0.39 to 1.67, one study, 543 women); see Analysis 5.2.
Incidence of episiotomy
The included study under this comparison did not report on this outcome.
Secondary outcomes
The included study under this comparison did not report data on any other of this review's secondary outcomes, these are: third‐degree tear; fourth‐degree tear; length of second stage; Apgar less than seven at five minutes; admission to special care baby unit; perineal pain postpartum; perineal pain at three and at six months after birth; breastfeeding initiation; breastfeeding at three months and at six months after birth; women's satisfaction; maternal morbidity after birth related to sexual health (i.e. stress incontinence and dyspareunia).
6 Perineal protection device versus perineal support
One study (involving 1098 women) evaluating the use of a perineal protection device versus perineal support met the inclusion criteria for this review (Lavesson 2014). Some of the data for this outcome was provided by the authors. One author is a shareholder in the company that produces the device.
Primary outcomes
Intact perineum
More women in the perineal device group had an intact perineum (RR 1.34, 95% CI 1.10 to 1.62; one study; 1098 women); see Analysis 6.1 (data from author).
Perineal trauma not requiring suturing
The included study under this comparison did not report on this outcome.
Perineal trauma requiring suturing
The included study under this comparison did not report on this outcome.
First‐ and second‐degree perineal tear
When measuring the incidence of first‐ and second‐degree perineal tears, there was no clear difference between the groups (RR 0.94, 95% CI 0.86 to 1.03, one study, 1098 women); see Analysis 6.2 (data clarified with author).
Third‐ and fourth‐degree perineal tear
When measuring the incidence of third‐ and fourth‐degree perineal tears, there was no clear difference between the groups (RR 1.01, 95% CI 0.54 to 1.89; one study, 1098 women); see Analysis 6.3.
Incidence of episiotomy
When measuring the incidence of episiotomy, there was no clear difference between the groups (RR 0.90, 95% CI 0.53 to 1.53, one study, 1098 women); see Analysis 6.4.
Secondary outcomes
Third‐degree perineal tear
When measuring the incidence of third‐degree perineal tears, an outcome reported in one study (Lavesson 2014), there was no clear difference between the groups (RR 1.07, 95% CI 0.55 to 2.10, one study, 1098 women); see Analysis 6.5.
Fourth‐degree perineal tear
When measuring the incidence of fourth‐degree perineal tears, an outcome reported in one study (Lavesson 2014), there was no clear difference between the groups (RR 0.67, 95% CI 0.11 to 4.02, one study, 1098 women); see Analysis 6.6.
The included study under this comparison did not report data on any other of this review's secondary outcomes, these are: length of second stage; Apgar less than seven at five minutes; admission to special care baby unit; perineal pain postpartum; perineal pain at three and at six months after birth; breastfeeding initiation; breastfeeding at three months and at six months after birth; women's satisfaction; maternal morbidity after birth related to sexual health (i.e. stress incontinence and dyspareunia).
7 Enriched oil versus liquid wax
One study (involving 164 women) evaluating the use of an enriched oil versus liquid wax met the inclusion criteria for this review (Harlev 2013).
Primary outcomes
Intact perineum
The included study under this comparison did not report on this outcome.
Perineal trauma not requiring suturing
The included study under this comparison did not report on this outcome.
Perineal trauma requiring suturing
The included study under this comparison did not report on this outcome.
First‐degree perineal tear
When measuring the incidence of first‐degree perineal tear, an outcome reported in one study (Harlev 2013), there was no clear difference between the groups (RR 1.09, 95% CI 0.84 to 1.40, one study, 164 women); see Analysis 7.1.
Second‐degree perineal tear
When measuring the incidence of second‐degree perineal tear, an outcome reported in one study (Harlev 2013), there was no clear difference between the groups (RR 0.88, 95% CI 0.58 to 1.31, one study, 164 women); see Analysis 7.2.
Third‐ and fourth‐degree perineal tears
The included study under this comparison did not report on this outcome.
Incidence of episiotomy
When measuring the incidence of episiotomy, an outcome reported in one study (Harlev 2013), there was no clear difference between the groups (RR 1.33, 95% CI 0.48 to 3.67, one study, 164 women); see Analysis 7.3.
Secondary outcomes
Third‐degree perineal tear
When measuring the incidence of third‐degree perineal tear, an outcome reported in one study (Harlev 2013), there was no clear difference between the groups (RR 1.00, 95% CI 0.14 to 6.93, one study, 164 women); see Analysis 7.4.
The included study under this comparison did not report data on any other of this review's secondary outcomes, these are: fourth‐degree tear; length of second stage; Apgar less than seven at five minutes; admission to special care baby unit; perineal pain postpartum; perineal pain at three and at six months after birth; breastfeeding initiation; breastfeeding at three months and at six months after birth; women's satisfaction; maternal morbidity after birth related to sexual health (i.e. stress incontinence and dyspareunia).
8 Cold compresses versus control
One study (involving 64 women) evaluating the use of cold compresses versus control met the inclusion criteria for this review (Shirvani 2014a).
Intact perineum
The included study under this comparison did not report on this outcome.
Perineal trauma not requiring suturing
The included study under this comparison did not report on this outcome.
Perineal trauma requiring suturing
The included study under this comparison did not report on this outcome.
First‐degree perineal tear
When measuring the incidence of first‐degree perineal tear, an outcome reported in one study (Shirvani 2014a), there was no clear difference between the groups (RR 2.50, 95% CI 0.52 to 11.96, one study, 64 women); see Analysis 8.1.
Second‐degree perineal tear
The included study under this comparison did not report on this outcome.
Third‐ and fourth‐perineal tears
The included study under this comparison did not report on this outcome.
Incidence of episiotomy
When measuring the incidence of episiotomy, an outcome reported in one study (Shirvani 2014a), there was no clear difference between the groups (RR 0.90, 95% CI 0.76 to 1.07, one study, 64 women); see Analysis 8.2.
Secondary outcomes
The included study under this comparison did not report data on any of this review's secondary outcomes, these are: third‐degree tear; fourth‐degree tear; length of second stage; Apgar less than seven at five minutes; admission to special care baby unit; perineal pain postpartum; perineal pain at three and at six months after birth; breastfeeding initiation; breastfeeding at three months and at six months after birth; women's satisfaction; maternal morbidity after birth related to sexual health (i.e. stress incontinence and dyspareunia).
Discussion
Summary of main results
This systematic review is an update of a review that was published in 2011 (Aasheim 2011). This review aimed to evaluate the research evidence of how different perineal techniques could contribute in reducing the severity and frequency of perineal trauma.
While 22 trials were eligible for inclusion in this updated review, we were only able to include data from 20 trials involving 15,181 randomised women. These trials took place in 10 different countries, all in hospital settings. All the included trials explored different perineal management techniques. These techniques included: compresses held to the mother’s perineum or perineal massage inside the woman's vagina versus hands off, warm compresses on the perineum versus not having warm compresses, various hands‐on techniques versus hands‐off techniques, massage of the perineum versus no massage, the use of different oils versus liquid wax, a modified Ritgen's manoeuvre versus standard practice, the use of a perineal protection device versus perineal support, and birth of the anterior shoulder versus the posterior shoulder first. The studies measured various outcomes, but they all reported on condition of the perineum in one way or another, for example, by presenting the number of women with an intact perineum, the frequency of the need for suturing after birth or the degree and location of perineal tear.
The results of our meta‐analyses comparing hands off (or poised) versus hands on suggests that practicing the hands‐off technique reduces the use of episiotomy but does not affect rates of intact perineum, perineal trauma requiring suturing, or perineal trauma rates of any degree. Even though the rate of episiotomy was reduced, there was no increase of third‐ and fourth‐degree tears. There was a high degree of heterogeneity in this analysis and as episiotomy is heavily influenced by individual practice, this analysis should be viewed with caution. These results are based on moderate‐ to very low‐quality evidence.
We did observe a reduction in incidence of third‐ and fourth‐degree perineal tears when the perineal technique of holding warm compresses against the perineum was used compared to no application of warm compresses against the perineum, however the effect of warm compresses on other the incidence of perineal trauma and grades of perineal tears is uncertain. Substantial heterogeneity was observed in our analyses for first‐degree tears and third‐degree tears. Similar rates of episiotomy were observed. These results are based on moderate‐ to very low‐quality evidence.
Perineal massage was associated with a reduced risk of third‐ and fourth‐degree tears. The effect of perineal massage on perineal trauma requiring suturing or first‐degree tears or second‐degree tears is uncertain (with high levels of heterogeneity observed for both first‐ and second‐degree tears). Perineal massage was also associated with an increase in the number of women with intact perineum but this outcome should be interpreted with caution due to substantial heterogeneity. There was some reduction in the rate of episiotomy but there was considerable uncertainty around the effect estimate, and again, high levels of heterogeneity were evident. These results are based on moderate‐ to very low‐quality evidence.
Women receiving Ritgen's manoeuvre versus standard care were less likely to experience first‐degree perineal tears, but more likely to experience second‐degree perineal tears. We are uncertain what effect the intervention has on the incidence of intact perineum. There were no clear differences in the risk of third‐ and fourth‐degree perineal tears, intact perineum, and episiotomy. There were no data for the outcome of perineal trauma requiring suturing. Data for these outcomes were based on one small study and the evidence ranged from low to very low quality.
With the exception of more intact perineums with the perineal protection device, the use of this device, delivery of posterior versus anterior shoulder first, use of different oils/wax and use of cold compresses did not show any effects on other perineal outcomes. Only one study contributed to each of these comparisons, so data were insufficient to draw conclusions.
Overall completeness and applicability of evidence
The question of how to prevent perineal trauma is an important research topic in midwifery and obstetrics. Despite a large overall sample size, within most individual comparisons sample sizes were small and did not give sufficient good‐quality data to allow us to draw reliable conclusions. There is no strong evidence for perineal techniques during the second stage of labour to reduce perineal trauma. Very few secondary outcomes were reported in any of the included studies. Women's views and choice on perineal techniques should be central to which method is implemented, however the included studies did not report women’s opinion of the method studied, except for the use of warm compresses which was acceptable to both women and midwives (Dahlen 2009). Further research is required to ascertain which technique prevents perineal trauma and is acceptable to women and their caregivers.
Quality of the evidence
There was great variation in methodological quality of the trials (Figure 2). Five of the studies contributing data had low risk of problems that could put them at risk of bias (Aabakke 2016; Albers 2005; Dahlen 2007; McCandlish 1998; Stamp 2001). We were uncertain about the risk of bias in seven of the studies due to methods of reporting (Araujo 2008; Harlev 2013; Jönsson 2008; Lavesson 2014; Mayerhofer 2002; Rezaei 2014; Terre‐Rull 2014). The rest of the studies had a high risk of bias (Attarha 2009; De Costa 2006; Fahami 2012; Foroughipour 2011; Galledar 2010; Geranmayeh 2012; Shirvani 2014a; Sohrabi 2012).
The studies in our meta‐analyses have considerable clinical heterogeneity. The perineal techniques used in the included studies varied. The terms 'hands on', 'hands off', 'standard care' and 'perineal support' meant different things across the studies and were not always defined sufficiently. In McCandlish 1998, 'hands off' not only meant no hand on the perineum and infant's head until the head was born but, also no manual assistance for the birth of the shoulders. While Mayerhofer 2002 defined 'hands off' as no hands on the perineum or fetal head until the head was born, but made no distinction between 'hands on' and 'hands off' for the assistance of the birth of the shoulders. Most extreme is the 'hands off' in Albers 2005, where 'hands off' only meant no hands on the perineum until crowning of the head. Although the standard care or 'hands on' manual support techniques are poorly described in most of the studies, it is clear that all studies aimed at a slow and controlled birth of the head.
The results of our meta‐analyses comparing hands on versus hands off suggest that practicing the hands‐off technique reduces the use of episiotomy, but we graded the quality of the evidence as low. The quality of the evidence from the meta analyses of warm compresses for a reduction in incidence of third‐ and fourth‐degree perineal tears is moderate. The use of warm compresses probably prevents perineal trauma (third‐ and fourth‐degree tears). The quality of the evidence from the meta analyses of massage for a reduction in incidence of third‐ and fourth‐degree perineal tears is moderate. The use of massage probably prevents perineal trauma (third‐ and fourth‐degree tears) and the practice of massage may also improve the rate of intact perineum (low quality of evidence). It is uncertain whether Ritgen's manoeuvre versus standard care decreased the rate of first‐degree perineal tears and also increased the rate of second‐degree tears because the quality of the evidence is very low. The delivery of posterior versus anterior shoulder first, the use of perineal protection device, the use of different oils/wax and the use of cold compresses did not show any effects on perineal outcomes.
We used GRADEpro GDT software to assess the evidence for the four main comparisons. The evidence was, at best, of moderate quality. For hands off (or poised) compared to hands on for reducing perineal trauma, we graded evidence for intact perineum as moderate‐quality. We graded evidence for first‐degree, and second‐degree tears, and episiotomy as being of low‐quality, and for third‐ or fourth‐degree tears as very low‐quality. We downgraded evidence for risk of bias, inconsistency, and imprecision of effect estimates. For the comparison warm compresses compared to control (hands off or no warm compress), intact perineum and third‐ or fourth‐degree tears, we graded evidence as moderate‐quality, evidence for episiotomy was low‐quality, and evidence for first‐ and second‐degree tears was very low‐quality. We downgraded evidence for risk of bias, inconsistency, and imprecision of effect estimates with small sample sizes and few events. For massage compared to control (hands off or care as usual), we graded evidence for third‐ or fourth‐degree tears as moderate‐quality, intact perineum as low‐quality, and perineal trauma requiring suturing, first‐degree tears, second‐degree tears, and episiotomy as very low‐quality evidence. We downgraded evidence for risk of bias, inconsistency, and imprecision of effect estimates with small sample sizes and few events. Only two studies contributed data to the comparison Ritgen's manoeuvre compared to standard care. We graded evidence for third‐ or fourth‐degree tears, and episiotomy as low‐quality, for intact perineum, first‐degree tear, and second‐degree tear as very low‐quality. Again, we downgraded evidence for risk of bias, inconsistency, and imprecision of effect estimates with small sample sizes and few events. For some of the comparisons there was only one study; the delivery of posterior versus anterior shoulder (Aabakke 2016), the perineal device (Lavesson 2014), the use of oil (Harlev 2013) and the use of cold compresses (Shirvani 2014a), and we did not use the GRADE assessment tool for these studies.
It was not possible to blind the intervention for the midwives or birth attendants in the involved trials. It may be difficult to blind the outcome assessor, but it is not impossible and future trials should definitely attempt to do so. Theoretically, midwives' convictions about the advantage or disadvantage of the intervention could influence their evaluation of the perineal outcome.
We were not able to perform all the analyses proposed in the protocol for all the primary and secondary outcomes recorded, as the included studies did not contribute enough data.
Potential biases in the review process
We are aware of the possibility of adding bias at any stage of the review process. We tried to minimise this possibility by two review authors independently assessing each trial for eligibility and extracting data from relevant studies. We resolved discrepancies through discussion in the team. Data were entered into RevMan 5 software (RevMan 2014) and checked for accuracy. When information regarding any of the above was unclear, we contacted authors of the original reports to provide further details.
As to the studies in Persian language, and one in Spanish, these studies were read by only one person, but we believe that both consideration of inclusion of the studies and the data extraction are of sufficient quality.
Agreements and disagreements with other studies or reviews
The conclusion in this revised form of the review is the same as in the first version of the review.
Another Cochrane Review found that selective episiotomy resulted in less severe perineal trauma than routine episiotomy (Jiang 2017). A non‐Cochrane systematic review (Eason 2000) with a broader scope than this review (including antenatal techniques, mode of birth, and birth position) also found that selective use of episiotomy produced less severe trauma to the perineum. This review found that perineal massage in the weeks leading up to labour appeared to reduce perineal trauma but also reported a lack of evidence around perineal techniques restricted to the second stage of labour.

Study flow diagram

Methodological quality summary: review authors' judgements about each methodological quality item for each included study

Methodological quality graph: review authors' judgements about each methodological quality item presented as percentages across all included studies

Comparison 1 Hands off (or poised) versus hands on, Outcome 1 Intact perineum.

Comparison 1 Hands off (or poised) versus hands on, Outcome 2 1st degree tear.

Comparison 1 Hands off (or poised) versus hands on, Outcome 3 2nd degree tear.

Comparison 1 Hands off (or poised) versus hands on, Outcome 4 3rd or 4th degree tears.

Comparison 1 Hands off (or poised) versus hands on, Outcome 5 Episiotomy.

Comparison 1 Hands off (or poised) versus hands on, Outcome 6 3rd degree tear.
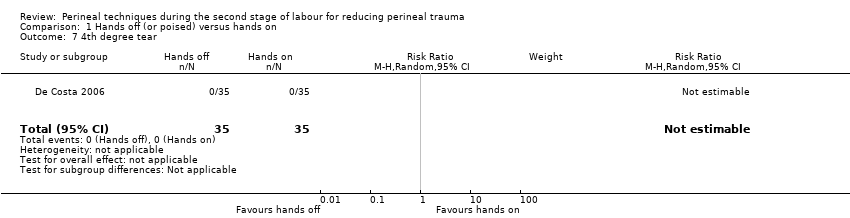
Comparison 1 Hands off (or poised) versus hands on, Outcome 7 4th degree tear.
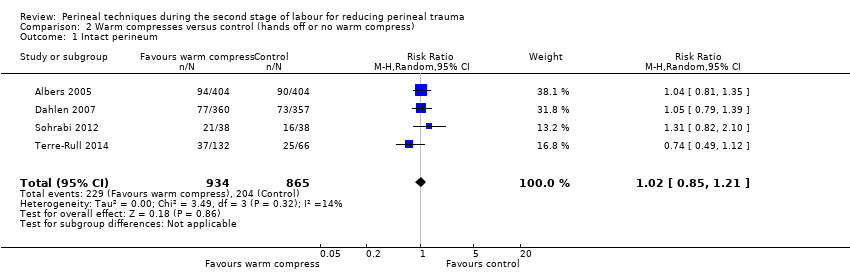
Comparison 2 Warm compresses versus control (hands off or no warm compress), Outcome 1 Intact perineum.

Comparison 2 Warm compresses versus control (hands off or no warm compress), Outcome 2 Perineal trauma not requiring suturing.

Comparison 2 Warm compresses versus control (hands off or no warm compress), Outcome 3 Perineal trauma requiring suturing.

Comparison 2 Warm compresses versus control (hands off or no warm compress), Outcome 4 1st degree tear.

Comparison 2 Warm compresses versus control (hands off or no warm compress), Outcome 5 2nd degree tear.

Comparison 2 Warm compresses versus control (hands off or no warm compress), Outcome 6 3rd or 4th degree tears.

Comparison 2 Warm compresses versus control (hands off or no warm compress), Outcome 7 Episiotomy.

Comparison 2 Warm compresses versus control (hands off or no warm compress), Outcome 8 3rd degree tears.

Comparison 2 Warm compresses versus control (hands off or no warm compress), Outcome 9 4th degree tears.

Comparison 3 Massage versus control (hands off or care as usual), Outcome 1 Intact perineum.

Comparison 3 Massage versus control (hands off or care as usual), Outcome 2 Perineal trauma requiring suturing.

Comparison 3 Massage versus control (hands off or care as usual), Outcome 3 1st degree perineal tear.

Comparison 3 Massage versus control (hands off or care as usual), Outcome 4 2nd degree perineal tear.

Comparison 3 Massage versus control (hands off or care as usual), Outcome 5 3rd or 4th degree tears.

Comparison 3 Massage versus control (hands off or care as usual), Outcome 6 Episiotomy.

Comparison 3 Massage versus control (hands off or care as usual), Outcome 7 3rd degree tear.

Comparison 3 Massage versus control (hands off or care as usual), Outcome 8 4th degree tear.

Comparison 4 Ritgen's manoeuvre versus standard care, Outcome 1 Intact perineum.

Comparison 4 Ritgen's manoeuvre versus standard care, Outcome 2 1st degree tear.

Comparison 4 Ritgen's manoeuvre versus standard care, Outcome 3 2nd degree tear.

Comparison 4 Ritgen's manoeuvre versus standard care, Outcome 4 3rd or 4th degree tears.

Comparison 4 Ritgen's manoeuvre versus standard care, Outcome 5 Episiotomy.

Comparison 4 Ritgen's manoeuvre versus standard care, Outcome 6 3rd degree tears.
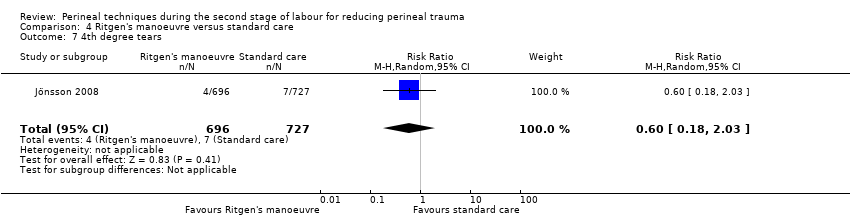
Comparison 4 Ritgen's manoeuvre versus standard care, Outcome 7 4th degree tears.

Comparison 5 Primary delivery of posterior versus anterior shoulder, Outcome 1 Perineal trauma requiring suturing.

Comparison 5 Primary delivery of posterior versus anterior shoulder, Outcome 2 3rd or 4th degree tears.

Comparison 6 Perineal protection device versus perineal support, Outcome 1 Intact perineum.

Comparison 6 Perineal protection device versus perineal support, Outcome 2 1st and 2nd degree tears.

Comparison 6 Perineal protection device versus perineal support, Outcome 3 3rd or 4th degree tears.
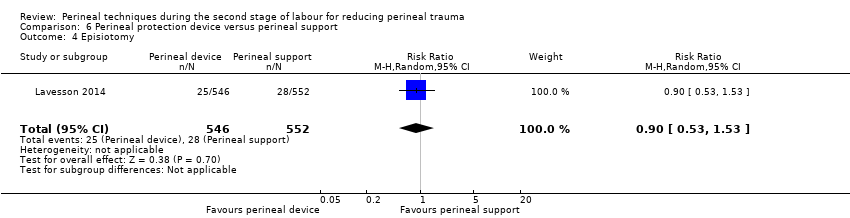
Comparison 6 Perineal protection device versus perineal support, Outcome 4 Episiotomy.

Comparison 6 Perineal protection device versus perineal support, Outcome 5 3rd degree tears.
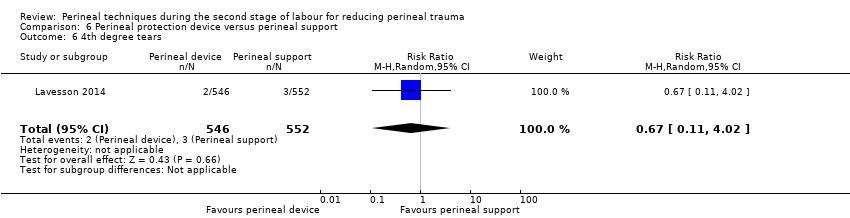
Comparison 6 Perineal protection device versus perineal support, Outcome 6 4th degree tears.

Comparison 7 Enriched oil versus liquid wax, Outcome 1 1st degree tear.

Comparison 7 Enriched oil versus liquid wax, Outcome 2 2nd degree tear.

Comparison 7 Enriched oil versus liquid wax, Outcome 3 Episiotomy.

Comparison 7 Enriched oil versus liquid wax, Outcome 4 3rd degree tears.

Comparison 8 Cold compresses versus control, Outcome 1 1st degree tear.
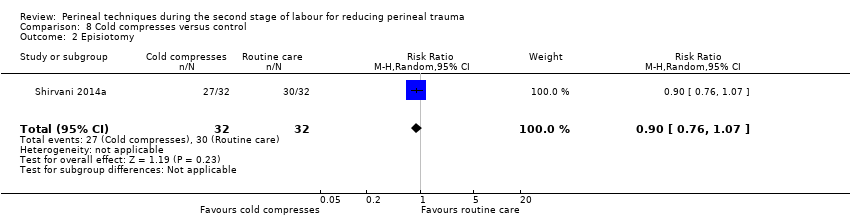
Comparison 8 Cold compresses versus control, Outcome 2 Episiotomy.
| Hands off (or poised) compared to hands on for reducing perineal trauma | ||||||
| Patient or population: pregnant women expecting a vaginal birth, singleton vertex presentation at term, with no medical complications | ||||||
| Outcomes | Anticipated absolute effects* (95% CI) | Relative effect | № of participants | Quality of the evidence | Comments | |
| Risk with hands on | Risk with hands off (or poised) | |||||
| Intact perineum | Study population | RR 1.03 | 6547 | ⊕⊕⊕⊝ | ||
| 354 per 1000 | 364 per 1000 | |||||
| Perineal trauma requiring suturing | Study population | ‐ | (0 RCTs) | ‐ | No trial reported this outcome | |
| See comment | See comment | |||||
| 1st degree tear | Study population | RR 1.32 | 700 | ⊕⊕⊝⊝ | ||
| 180 per 1000 | 238 per 1000 | |||||
| 2nd degree tear | Study population | RR 0.77 | 700 | ⊕⊕⊝⊝ | ||
| 86 per 1000 | 66 per 1000 | |||||
| 3rd or 4th degree tears | Study population | RR 0.68 | 7317 | ⊕⊝⊝⊝ | ||
| 15 per 1000 | 10 per 1000 | |||||
| Episiotomy | Study population | RR 0.58 | 7247 | ⊕⊕⊝⊝ | ||
| 146 per 1000 | 85 per 1000 | |||||
| *The risk in the intervention group (and its 95% confidence interval) is based on the assumed risk in the comparison group and the relative effect of the intervention (and its 95% CI). | ||||||
| GRADE Working Group grades of evidence | ||||||
| 1Most studies had design limitations, one study had serious design limitations (downgraded 1 level). | ||||||
| Warm compresses compared to control (hands off or no warm compress) for reducing perineal trauma | ||||||
| Patient or population: pregnant women expecting a vaginal birth, singleton vertex presentation at term, with no medical complications | ||||||
| Outcomes | Anticipated absolute effects* (95% CI) | Relative effect | № of participants | Quality of the evidence | Comments | |
| Risk with control (hands off or no warm compress) | Risk with warm compresses | |||||
| Intact perineum | Study population | RR 1.02 | 1799 | ⊕⊕⊕⊝ | ||
| 236 per 1000 | 241 per 1000 | |||||
| Perineal trauma requiring suturing | Study population | RR 1.14 | 76 | ⊕⊝⊝⊝ | ||
| 553 per 1000 | 630 per 1000 | |||||
| 1st degree tear | Study population | RR 1.19 | 274 | ⊕⊝⊝⊝ | ||
| 288 per 1000 | 343 per 1000 | |||||
| 2nd degree tear | Study population | RR 0.95 | 274 | ⊕⊝⊝⊝ | ||
| 192 per 1000 | 183 per 1000 | |||||
| 3rd or 4th degree tears | Study population | RR 0.46 | 1799 | ⊕⊕⊕⊝ | ||
| 45 per 1000 | 21 per 1000 | |||||
| Episiotomy | Study population | RR 0.86 | 1799 | ⊕⊕⊝⊝ | ||
| 62 per 1000 | 54 per 1000 | |||||
| *The risk in the intervention group (and its 95% confidence interval) is based on the assumed risk in the comparison group and the relative effect of the intervention (and its 95% CI). | ||||||
| GRADE Working Group grades of evidence | ||||||
| 1One study with design limitations and one study with serious design limitations though contributing < 40% weight (downgraded 1 level). | ||||||
| Massage compared to control (hands off or care as usual) for reducing perineal trauma | ||||||
| Patient or population: pregnant women expecting a vaginal birth, singleton vertex presentation at term, with no medical complications | ||||||
| Outcomes | Anticipated absolute effects* (95% CI) | Relative effect | № of participants | Quality of the evidence | Comments | |
| Risk with control (hands off or care as usual) | Risk with massage | |||||
| Intact perineum | Study population | RR 1.74 | 2618 | ⊕⊕⊝⊝ | ||
| 227 per 1000 | 396 per 1000 | |||||
| Perineal trauma requiring suturing | Study population | RR 1.10 | 76 | ⊕⊝⊝⊝ | ||
| 553 per 1000 | 608 per 1000 | |||||
| 1st degree perineal tear | Study population | RR 1.55 | 537 | ⊕⊝⊝⊝ | ||
| 287 per 1000 | 445 per 1000 | |||||
| 2nd degree perineal tear | Study population | RR 1.08 | 537 | ⊕⊝⊝⊝ | ||
| 213 per 1000 | 230 per 1000 | |||||
| 3rd or 4th degree tears | Study population | RR 0.49 | 2477 | ⊕⊕⊕⊝ | ||
| 29 per 1000 | 14 per 1000 | |||||
| Episiotomy | Study population | RR 0.55 | 2684 | ⊕⊝⊝⊝ | ||
| 249 per 1000 | 137 per 1000 | |||||
| *The risk in the intervention group (and its 95% confidence interval) is based on the assumed risk in the comparison group and the relative effect of the intervention (and its 95% CI). | ||||||
| GRADE Working Group grades of evidence | ||||||
| 1Most studies contributing data had design limitations (downgraded 1 level). | ||||||
| Ritgen's manoeuvre compared to standard care for reducing perineal trauma | ||||||
| Patient or population: pregnant women expecting a vaginal birth, singleton vertex presentation at term, with no medical complications | ||||||
| Outcomes | Anticipated absolute effects* (95% CI) | Relative effect | № of participants | Quality of the evidence | Comments | |
| Risk with standard care | Risk with Ritgen's manoeuvre | |||||
| Intact perineum | Study population | RR 0.17 | 66 | ⊕⊝⊝⊝ | ||
| 182 per 1000 | 31 per 1000 | |||||
| Perineal trauma requiring suturing | Study population | ‐ | (0 studies) | ‐ | No trial reported this outcome | |
| See comment | See comment | |||||
| 1st degree tear | Study population | RR 0.32 | 66 | ⊕⊝⊝⊝ | ||
| 576 per 1000 | 184 per 1000 | |||||
| 2nd degree tear | Study population | RR 3.25 | 66 | ⊕⊝⊝⊝ | ||
| 242 per 1000 | 788 per 1000 | |||||
| 3rd or 4th degree tears | Study population | RR 1.24 | 1423 | ⊕⊕⊝⊝ | ||
| 44 per 1000 | 55 per 1000 | |||||
| Episiotomy | Study population | RR 0.81 | 1489 | ⊕⊕⊝⊝ | ||
| 162 per 1000 | 131 per 1000 | |||||
| *The risk in the intervention group (and its 95% confidence interval) is based on the assumed risk in the comparison group and the relative effect of the intervention (and its 95% CI). | ||||||
| GRADE Working Group grades of evidence | ||||||
| 1One study with serious design limitations (downgraded 2 levels). | ||||||
| Outcome or subgroup title | No. of studies | No. of participants | Statistical method | Effect size |
| 1 Intact perineum Show forest plot | 2 | 6547 | Risk Ratio (M‐H, Random, 95% CI) | 1.03 [0.95, 1.12] |
| 2 1st degree tear Show forest plot | 2 | 700 | Risk Ratio (M‐H, Random, 95% CI) | 1.32 [0.99, 1.77] |
| 3 2nd degree tear Show forest plot | 2 | 700 | Risk Ratio (M‐H, Random, 95% CI) | 0.77 [0.47, 1.28] |
| 4 3rd or 4th degree tears Show forest plot | 5 | 7317 | Risk Ratio (M‐H, Random, 95% CI) | 0.68 [0.21, 2.26] |
| 5 Episiotomy Show forest plot | 4 | 7247 | Risk Ratio (M‐H, Random, 95% CI) | 0.58 [0.43, 0.79] |
| 6 3rd degree tear Show forest plot | 4 | 1846 | Risk Ratio (M‐H, Random, 95% CI) | 0.49 [0.09, 2.73] |
| 7 4th degree tear Show forest plot | 1 | 70 | Risk Ratio (M‐H, Random, 95% CI) | 0.0 [0.0, 0.0] |
| Outcome or subgroup title | No. of studies | No. of participants | Statistical method | Effect size |
| 1 Intact perineum Show forest plot | 4 | 1799 | Risk Ratio (M‐H, Random, 95% CI) | 1.02 [0.85, 1.21] |
| 2 Perineal trauma not requiring suturing Show forest plot | 1 | 76 | Risk Ratio (M‐H, Random, 95% CI) | 0.82 [0.48, 1.42] |
| 3 Perineal trauma requiring suturing Show forest plot | 1 | 76 | Risk Ratio (M‐H, Random, 95% CI) | 1.14 [0.79, 1.66] |
| 4 1st degree tear Show forest plot | 2 | 274 | Risk Ratio (M‐H, Random, 95% CI) | 1.19 [0.38, 3.79] |
| 5 2nd degree tear Show forest plot | 2 | 274 | Risk Ratio (M‐H, Random, 95% CI) | 0.95 [0.58, 1.56] |
| 6 3rd or 4th degree tears Show forest plot | 4 | 1799 | Risk Ratio (M‐H, Random, 95% CI) | 0.46 [0.27, 0.79] |
| 7 Episiotomy Show forest plot | 4 | 1799 | Risk Ratio (M‐H, Random, 95% CI) | 0.86 [0.60, 1.23] |
| 8 3rd degree tears Show forest plot | 3 | 1082 | Risk Ratio (M‐H, Random, 95% CI) | 0.51 [0.04, 7.05] |
| 9 4th degree tears Show forest plot | 2 | 884 | Risk Ratio (M‐H, Random, 95% CI) | 0.11 [0.01, 2.06] |
| Outcome or subgroup title | No. of studies | No. of participants | Statistical method | Effect size |
| 1 Intact perineum Show forest plot | 6 | 2618 | Risk Ratio (M‐H, Random, 95% CI) | 1.74 [1.11, 2.73] |
| 2 Perineal trauma requiring suturing Show forest plot | 1 | 76 | Risk Ratio (M‐H, Random, 95% CI) | 1.10 [0.75, 1.61] |
| 3 1st degree perineal tear Show forest plot | 5 | 537 | Risk Ratio (M‐H, Random, 95% CI) | 1.55 [0.79, 3.05] |
| 4 2nd degree perineal tear Show forest plot | 5 | 537 | Risk Ratio (M‐H, Random, 95% CI) | 1.08 [0.55, 2.12] |
| 5 3rd or 4th degree tears Show forest plot | 5 | 2477 | Risk Ratio (M‐H, Random, 95% CI) | 0.49 [0.25, 0.94] |
| 6 Episiotomy Show forest plot | 7 | 2684 | Risk Ratio (M‐H, Random, 95% CI) | 0.55 [0.29, 1.03] |
| 7 3rd degree tear Show forest plot | 5 | 2477 | Risk Ratio (M‐H, Random, 95% CI) | 0.57 [0.16, 2.02] |
| 8 4th degree tear Show forest plot | 5 | 2477 | Risk Ratio (M‐H, Random, 95% CI) | 0.26 [0.04, 1.61] |
| Outcome or subgroup title | No. of studies | No. of participants | Statistical method | Effect size |
| 1 Intact perineum Show forest plot | 1 | 66 | Risk Ratio (M‐H, Random, 95% CI) | 0.17 [0.02, 1.31] |
| 2 1st degree tear Show forest plot | 1 | 66 | Risk Ratio (M‐H, Random, 95% CI) | 0.32 [0.14, 0.69] |
| 3 2nd degree tear Show forest plot | 1 | 66 | Risk Ratio (M‐H, Random, 95% CI) | 3.25 [1.73, 6.09] |
| 4 3rd or 4th degree tears Show forest plot | 1 | 1423 | Risk Ratio (M‐H, Random, 95% CI) | 1.24 [0.78, 1.96] |
| 5 Episiotomy Show forest plot | 2 | 1489 | Risk Ratio (M‐H, Random, 95% CI) | 0.81 [0.63, 1.03] |
| 6 3rd degree tears Show forest plot | 1 | 1423 | Risk Ratio (M‐H, Random, 95% CI) | 1.42 [0.86, 2.36] |
| 7 4th degree tears Show forest plot | 1 | 1423 | Risk Ratio (M‐H, Random, 95% CI) | 0.60 [0.18, 2.03] |
| Outcome or subgroup title | No. of studies | No. of participants | Statistical method | Effect size |
| 1 Perineal trauma requiring suturing Show forest plot | 1 | 543 | Risk Ratio (M‐H, Random, 95% CI) | 1.01 [0.96, 1.07] |
| 2 3rd or 4th degree tears Show forest plot | 1 | 543 | Risk Ratio (M‐H, Random, 95% CI) | 0.81 [0.39, 1.67] |
| Outcome or subgroup title | No. of studies | No. of participants | Statistical method | Effect size |
| 1 Intact perineum Show forest plot | 1 | 1098 | Risk Ratio (M‐H, Random, 95% CI) | 1.34 [1.10, 1.62] |
| 2 1st and 2nd degree tears Show forest plot | 1 | 1098 | Risk Ratio (M‐H, Random, 95% CI) | 0.94 [0.86, 1.03] |
| 3 3rd or 4th degree tears Show forest plot | 1 | 1098 | Risk Ratio (M‐H, Random, 95% CI) | 1.01 [0.54, 1.89] |
| 4 Episiotomy Show forest plot | 1 | 1098 | Risk Ratio (M‐H, Random, 95% CI) | 0.90 [0.53, 1.53] |
| 5 3rd degree tears Show forest plot | 1 | 1098 | Risk Ratio (M‐H, Random, 95% CI) | 1.07 [0.55, 2.10] |
| 6 4th degree tears Show forest plot | 1 | 1098 | Risk Ratio (M‐H, Random, 95% CI) | 0.67 [0.11, 4.02] |
| Outcome or subgroup title | No. of studies | No. of participants | Statistical method | Effect size |
| 1 1st degree tear Show forest plot | 1 | 164 | Risk Ratio (M‐H, Random, 95% CI) | 1.09 [0.84, 1.40] |
| 2 2nd degree tear Show forest plot | 1 | 164 | Risk Ratio (M‐H, Random, 95% CI) | 0.88 [0.58, 1.31] |
| 3 Episiotomy Show forest plot | 1 | 164 | Risk Ratio (M‐H, Random, 95% CI) | 1.33 [0.48, 3.67] |
| 4 3rd degree tears Show forest plot | 1 | 164 | Risk Ratio (M‐H, Random, 95% CI) | 1.0 [0.14, 6.93] |
| Outcome or subgroup title | No. of studies | No. of participants | Statistical method | Effect size |
| 1 1st degree tear Show forest plot | 1 | 64 | Risk Ratio (M‐H, Random, 95% CI) | 2.5 [0.52, 11.96] |
| 2 Episiotomy Show forest plot | 1 | 64 | Risk Ratio (M‐H, Random, 95% CI) | 0.9 [0.76, 1.07] |