Parenteral anticoagulation in ambulatory patients with cancer
Abstract
Background
Anticoagulation may improve survival in patients with cancer through an antitumor effect in addition to the perceived antithrombotic effect.
Objectives
To evaluate the efficacy and safety of parenteral anticoagulants in ambulatory patients with cancer who, typically, are undergoing chemotherapy, hormonal therapy or radiotherapy, but otherwise have no standard therapeutic or prophylactic indication for anticoagulation.
Search methods
A comprehensive search included (1) an electronic search (February 2013) of the following databases: Cochrane Central Register of Controlled Trials (CENTRAL) (2013, Issue 1), MEDLINE (1966 to February 2013; accessed via OVID) and EMBASE(1980 to February 2013; accessed via OVID); (2) handsearching of conference proceedings; (3) checking of references of included studies; (4) use of the 'related citation' feature in PubMed and (5) a search for ongoing studies.
Selection criteria
Randomized controlled trials (RCTs) assessing the benefits and harms of parenteral anticoagulation in ambulatory patients with cancer. Typically, these patients are undergoing chemotherapy, hormonal therapy or radiotherapy, but otherwise have no standard therapeutic or prophylactic indication for anticoagulation.
Data collection and analysis
Using a standardized form we extracted data in duplicate on methodological quality, participants, interventions and outcomes of interest including all‐cause mortality, symptomatic venous thromboembolism (VTE), symptomatic deep vein thrombosis (DVT), symptomatic pulmonary embolism (PE), arterial thrombosis (e.g. stroke, myocardial infarction), major bleeding, minor bleeding and quality of life.
Main results
Of 9559 identified citations, 15 RCTs fulfilled the eligibility criteria. These trials enrolled 7622 participants for whom follow‐up data were available. In all included RCTs the intervention consisted of heparin (either unfractionated heparin or low molecular weight heparin). Overall, heparin may have a small effect on mortality at 12 months and 24 months (risk ratio (RR) 0.97; 95% confidence interval (CI) 0.92 to 1.01 and RR 0.95; 95% CI 0.90 to 1.00, respectively). Heparin therapy was associated with a statistically and clinically important reduction in venous thromboembolism (RR 0.56; 95% CI 0.43 to 0.74) and a clinically important increase in the risk of minor bleeding (RR 1.32; 95% 1.02 to 1.71). Results failed to show or to exclude a beneficial or detrimental effect of heparin on major bleeding (RR 1.13; 95% CI 0.63 to 2.01) or quality of life. Our confidence in the effect estimates (i.e. quality of evidence) was high for symptomatic venous thromboembolism, moderate for mortality, major bleeding and minor bleeding, and low for quality of life.
Authors' conclusions
Heparin may have a small effect on mortality at 12 months and 24 months. It is associated with a reduction in venous thromboembolism and a likely increase in minor bleeding. Future research should further investigate the survival benefit of different types of anticoagulants in patients with different types and stages of cancer. The decision for a patient with cancer to start heparin therapy for survival benefit should balance the benefits and downsides, and should integrate the patient's values and preferences.
PICOs
Plain language summary
Injectable blood thinners (anticoagulants) in patients with cancer
Background
Research evidence suggests that blood thinners may improve the survival of patients with cancer. This benefit could be related to a direct antitumor effect in addition to preventing blood clots.
Study characteristics
We searched the scientific literature for studies of anticoagulants in people with cancer. The evidence is current to February 2013. Fifteen eligible trials
Key results
We selected 15 trials including 7662 participants with cancer. Most trials included participants with various types of cancer especially small cell lung cancer, non‐small cell lung cancer, and pancreatic cancer. All studies were conducted in the outpatient setting. suggest that injectable blood thinners reduce the risk of blood clots by about half and possibly increase the risk of minor bleeding by 30%. The effects on survival and quality of life are uncertain, but if anything of small size.
Quality of evidence
We judged the quality of evidence to be high for symptomatic venous thromboembolism, moderate for mortality, major bleeding and minor bleeding, and low for quality of life.
Authors' conclusions
Summary of findings
| Heparin compared to placebo for ambulatory patients with cancer who have no therapeutic or prophylactic indication for anticoagulation | ||||||
| Patient or population: Ambulatory patients with cancer who have no therapeutic or prophylactic indication for anticoagulation | ||||||
| Outcomes | Illustrative comparative risks* (95% CI) | Relative effect | No of participants | Quality of the evidence | Comments | |
| Assumed risk | Corresponding risk | |||||
| Placebo | Heparin | |||||
| Mortality at 12 months | Study population | RR 0.97 | 7013 | ⊕⊕⊕⊝ | Moderate‐quality evidence owing to imprecision. A survival analysis based on data from 11 studies found a hazard ratio of 0.84 (95% CI 0.74 to 0.96); however heterogeneity in that analysis was relatively high (I2 = 58%) and subgroup analyses did not conclusively identify any subgroup effect | |
| 472 per 1000 | 458 per 1000 | |||||
| Symptomatic VTE | Study population | RR 0.56 | 6809 | ⊕⊕⊕⊕ | The data are combined for pulmonary embolism and symptomatic deep venous thrombosis | |
| 55 per 1000 | 31 per 1000 | |||||
| Major bleeding | Study population | RR 1.14 | 7363 | ⊕⊕⊕⊝ | Moderate‐quality evidence owing to imprecision | |
| 19 per 1000 | 21 per 1000 | |||||
| Minor bleeding | Study population | RR 1.32 | 6884 | ⊕⊕⊕⊝ | Moderate‐quality evidence owing to imprecision | |
| 30 per 1000 | 40 per 1000 | |||||
| *The basis for the assumed risk (e.g. the median control group risk across studies) is provided in footnotes. The corresponding risk (and its 95% confidence interval) is based on the assumed risk in the comparison group and the relative effect of the intervention (and its 95% CI). | ||||||
| GRADE Working Group grades of evidence | ||||||
| 1Confidence interval includes values suggesting clinically significant benefit and values suggesting no effect. 2Confidence interval includes values suggesting clinically significant benefit and values suggesting harm. 3Confidence interval includes values suggesting clinically significant harm and values suggesting no effect. | ||||||
Background
Please refer to the glossary for the definitions of technical terms (Table 1).
| Term | Definition |
| Adjuvant therapy | Assisting in the amelioration or cure of disease |
| Anticoagulation | The process of hindering the clotting of blood especially by treatment with an anticoagulant |
| Antithrombotic | Used against or tending to prevent thrombosis (clotting) |
| Bacteremia | The presence of bacteria in the blood |
| Central venous line | Synthetic tube that is inserted into a central (large) vein of a patient to provide temporary intravenous access for the administration of fluid, medication or nutrients |
| Coagulation | Clotting |
| Deep vein thrombosis (DVT) | A condition marked by the formation of a thrombus within a deep vein (as of the leg or pelvis) that may be asymptomatic or be accompanied by symptoms (such as swelling and pain) and that is potentially life‐threatening if dislodgment of the thrombus results in pulmonary embolism |
| Fibrin | A white insoluble fibrous protein formed from fibrinogen by the action of thrombin, especially in the clotting of blood |
| Fondaparinux | An anticoagulant medication |
| Hemostatic system | The system that shortens the clotting time of blood and stops bleeding |
| Heparin | An enzyme occurring especially in the liver and lungs that prolongs the clotting time of blood by preventing the formation of fibrin. Two forms of heparin that are used as anticoagulant medications are: unfractionated heparin (UFH) and low molecular weight heparins (LMWH) |
| Impedance plethysmography | A technique that measures the change in blood volume (venous blood volume as well as the pulsation of the arteries) for a specific body segment |
| Kappa statistics | A measure of degree of non‐random agreement between observers and/or measurements of a specific categorical variable |
| Metastasis | The spread of cancer cells from the initial or primary site of disease to another part of the body |
| Oncogene | A gene having the potential to cause a normal cell to become cancerous |
| Osteoporosis | A condition that especially affects older women and is characterized by a decrease in bone mass with decreased density and enlargement of bone spaces producing porosity and brittleness |
| Parenteral nutrition | The practice of feeding a patient intravenously, circumventing the gut |
| Pulmonary embolism (PE) | Embolism of a pulmonary artery or one of its branches that is produced by foreign matter and most often a blood clot originating in a vein of the leg or pelvis and that is marked by labored breathing, chest pain, fainting, rapid heart rate, cyanosis, shock and sometimes death |
| Stroma | The supporting framework of an organ typically consisting of connective tissue |
| Thrombin | A proteolytic enzyme formed from prothrombin that facilitates the clotting of blood by catalyzing conversion of fibrinogen to fibrin |
| Thrombocytopenia | Persistent decrease in the number of blood platelets that is often associated with hemorrhagic conditions |
| Thrombosis | The formation or presence of a blood clot within a blood vessel |
| Vitamin K antagonists | Anticoagulant medications that are used for anticoagulation. Warfarin is a vitamin K antagonist |
| Warfarin | An anticoagulant medication that is a vitamin K antagonist, which is used for anticoagulation |
| Ximelagatran | An anticoagulant medication |
Description of the condition
Since the 1930s, basic scientists have been exploring the effects of anticoagulation on cancer (Smorenburg 2001). Studies have implicated the tumor‐mediated activation of the hemostatic system in both the formation of tumor stroma and in tumor metastasis (Dvorak 1986; Francis 1998; Levine 2003). There is also evidence that heparin inhibits expression of oncogenes and formation of thrombin and fibrin induced by cancer cells (Smorenburg 2001). In addition, heparin potentially inhibits intravascular arrest of cancer cells and thus metastasis (Smorenburg 2001).
Description of the intervention
Heparin, low molecular weight heparins (LMWHs), fondaparinux and danaparoid do not have intrinsic anticoagulant activity but potentiate the activity of antithrombin III in inhibiting activated coagulation factors. These agents constitute indirect anticoagulants as their activity is mediated by plasma cofactors. Recombinant hirudin, bivalirudin and argatroban directly inhibit thrombin and are classified as direct anticoagulants (Hirsh 2008). Heparin and its low molecular weight derivatives are not absorbed orally and must be administered parenterally by intravenous infusion or subcutaneous injections (Hirsh 1993).
How the intervention might work
Researchers have hypothesized that heparin may improve outcomes in cancer patients through an antitumor effect in addition to its antithrombotic effect (Thodiyil 2002). In a 1992 clinical trial comparing nadroparin, a LMWH, to unfractionated heparin in patients with proven deep vein thrombosis (DVT), nadroparin unexpectedly reduced mortality in the subgroup of patients with cancer (Prandoni 1992). At the same time, anticoagulants increase the risk for bleeding. This risk is higher in cancer patients compared to those without cancer. In fact, in patients with venous thrombosis on anticoagulation the risk of bleeding was higher if patients had cancer and correlated with the extent of cancer (Prandoni 2002). Heparins are also known to cause thrombocytopenia and heparin‐induced thrombocytopenia (HIT) syndrome (Girolami 2006).
Why it is important to do this review
The previous update of this systematic review, published in 2011, identified nine trials enrolling 2857 participants (Agnelli 2009; Altinbas 2004; Kakkar 2004; Klerk 2005; Lebeau 1994; Pelzer 2009; Perry 2010; Sideras 2006; Weber 2008). The findings included a statistically significant reduction of death at 24 months and venous thromboembolism with heparin thromboprophylaxis compared to no heparin thromboprophylaxis. Since then a number of trials addressing this question have been published (Agnelli 2012; Lecumberri 2013).
Objectives
To evaluate the effectiveness and safety of parenteral anticoagulants in patients with ambulatory cancer. Typically, these patients are undergoing chemotherapy, hormonal therapy or radiotherapy, but otherwise have no standard therapeutic or prophylactic indication for anticoagulation.
Methods
Criteria for considering studies for this review
Types of studies
Randomized controlled trials (RCTs).
Types of participants
Patients with cancer with no standard indication for prophylactic anticoagulation (e.g. for acute illness, for central venous line placement, perioperatively) or for therapeutic anticoagulation (e.g. for the treatment of DVT or pulmonary embolism (PE)). Typically, these patients are undergoing chemotherapy, hormonal therapy or radiotherapy.
Types of interventions
Experimental intervention: parenteral anticoagulants such as unfractionated heparin, low molecular weight heparin (LMWH) and fondaparinux.
Comparator intervention: placebo or no intervention.
We also considered studies comparing different parenteral anticoagulants. The trial protocol should have planned to provide all other co‐interventions (e.g. chemotherapy) similarly.
Types of outcome measures
Primary outcomes
-
All‐cause mortality; pre‐specified at 12 months, 24 months and over the duration of the trial.
Secondary outcomes
-
Symptomatic venous thromboembolism (VTE) (DVT and/or PE): DVT events had to be diagnosed using an objective diagnostic test such as: venography, 125I‐fibrinogen‐uptake test, impedance plethysmography or compression ultrasound. PE events had to be diagnosed using an objective diagnostic test such as: pulmonary perfusion/ventilation scans, computed tomography, pulmonary angiography or autopsy
-
Major bleeding: we accepted the authors' definitions of major bleeding.
-
Minor bleeding: we accepted the authors' definitions of minor bleeding.
-
Health‐related quality of life: had to be measured using a validated tool.
-
Thrombocytopenia.
Search methods for identification of studies
Electronic searches
The search was part of a comprehensive search for studies of anticoagulation in patients with cancer. We did not use language restrictions. We conducted the original electronic search in January 2007 and updated it in February 2010 and in February 2013. We electronically searched the following databases: the Cochrane Central Register of Controlled Trials (CENTRAL)(2013, Issue 1), MEDLINE (1966 to February 2013; accessed via OVID), EMBASE (1980 to February 2013; accessed via OVID) and the ISI Web of Science. The search strategies combined terms for anticoagulants, terms for cancer and a search filter for RCTs. We used no language restrictions. We list the full search strategies for each of the electronic databases in Appendix 1 and Appendix 2.
Searching other resources
We handsearched the conference proceedings of the American Society of Clinical Oncology (ASCO, starting with its first volume, 1982 up to June 2013) and of the American Society of Hematology (ASH, starting with its 2003 issue up to June 2013). We reviewed the reference lists of papers included this review and of other relevant systematic reviews. We used the 'related citation' feature in PubMed to identify additional articles. We also searched ClinicalTrials.gov for ongoing studies.
Data collection and analysis
Selection of studies
Two review authors independently screened the titles and abstracts of identified articles for eligibility. We retrieved the full text of articles judged as potentially eligible by at least one review author. Two review authors then independently screened the full‐text articles for eligibility using a standardized form with explicit inclusion and exclusion criteria. The two review authors resolved their disagreements by discussion or by consulting a third review author.
Data extraction and management
Two authors independently extracted data from each included study and resolved their disagreements by discussion. We aimed to collect data related to the following.
Participants
-
Number of patients randomized to each treatment arm.
-
Number of patients followed up in each treatment arm.
-
Number of withdrawals from treatment in each treatment arm.
-
Population characteristics (age, gender, co‐morbidity).
-
History of venous thromboembolism (VTE).
-
Type of cancer.
-
Stage of cancer.
-
Time since cancer diagnosis.
Interventions
-
Type of anticoagulant: unfractionated heparin, LMWH or fondaparinux.
-
Dose: prophylactic versus therapeutic (Table 2).
Open in table viewer
Table 2. LMWH: definitions of prophylactic and therapeutic dosagesLMWH
Generic name
Prophylactic dose
Therapeutic dose
Lovenox
Enoxaparin
40 mg once daily
1 mg/kg twice daily
Fragmin
Dalteparin
2500 to 5000 units once daily
200 U/kg once daily or
100 U/kg twice dailyInnohep, Logiparin
Tinzaparin,
4500 units once daily
90 U/kg twice daily
Fraxiparine
Nadroparin
35 to 75 anti‐Xa international units/kg once daily
175 anti‐Xa int. units/kg once daily
Certoparin
Sandoparin
3000 anti‐Xa international units once daily
—
-
Duration of treatment.
-
Control: placebo or no intervention.
-
Co‐interventions including radiotherapy, chemotherapy and hormonal therapy (type and duration).
Outcomes
We extracted both time‐to‐event data (for the survival outcome) and dichotomous data (for all outcomes). For mortality we collected data for the pre‐specified time point of 12 months, but also for 24 months and for over the duration of follow‐up.
For time‐to‐event survival data, we abstracted the log(hazard ratio (HR)) and its variance from trial reports. If these were not reported, we digitized the published Kaplan‐Meier survival curves and estimated the log(HR) and its variance using Parmar's methods (Parmar 1998). We also noted the minimum and maximum duration of follow‐up, which are required to make these estimates. We performed these calculations in Stata 9, using a specially written program, which yielded the reported log(HR) and variance when used on the data presented in Table V of Parmar 1998. Agreement between the two authors who extracted data from survival curves was high, with an average percentage difference of 2.5%.
For dichotomous data, we extracted data necessary to conduct complete case analysis as the primary analysis. We collected all‐cause mortality at one year (time point defined a priori in the protocol) and at two years (time point defined post hoc based upon results reported in the individual RCTs). When we could not obtain the number of events at the time points of interest from the paper or from the authors, two review authors calculated these numbers independently and in duplicate from survival curves, if available (Altinbas 2004; Kakkar 2004). We used the mean of the two estimates when they differed. We assessed agreement between the two authors for each estimated value by calculating the percentage difference, which is the difference between the two estimates divided by the denominator (number of subjects at risk for the event) and multiplied by 100. For some studies, where VTE is not reported as a separate outcome, we added the number of events of DVT and PE.
We attempted to contact authors for incompletely reported data. We decided a priori to consider abstracts only if authors supplied us with full reports of their methods and results.
Assessment of risk of bias in included studies
We assessed risk of bias at the study level using the Cochrane 'Risk of bias' tool. Two review authors independently assessed the methodological quality of each included study and resolved their disagreements by discussion. Methodological criteria included:
-
adequate sequence generation;
-
allocation concealment;
-
patient blinding;
-
provider blinding;
-
data collector blinding;
-
outcome assessor blinding;
-
analyst blinding;
-
percentage of follow‐up and whether incomplete outcome data were addressed;
-
whether the study was free of selective reporting;
-
whether the study was stopped early for benefit; and
-
whether the analysis followed the intention‐to‐treat (ITT) principle.
See section on Dealing with missing data about assessing risk of bias associated with participants with missing data.
Measures of treatment effect
We collected and analyzed hazard ratios (HRs) for time‐to‐event data and risk ratios (RRs) for dichotomous data. None of the outcomes of interest was meta‐analyzed as a continuous variable.
Unit of analysis issues
The unit of analysis was the individual participant.
Dealing with missing data
Determining participants with missing data
It was not clear whether certain participant categories (e.g. those described as "withdrew consent" or "experienced adverse events") were actually followed up by the trialists (versus had missing participant data). To deal with this issue, we made the following considerations:
-
"ineligible participants" and "did not receive the first dose" participant categories, which are defined prior to the initiation of the study intervention, most likely have missing participant data;
-
"withdrew consent" and "lost to follow‐up" participant categories, which are defined after the initiation of the study intervention, most likely have missing participant data;
-
"dead", "experienced adverse events", "non‐compliant", "discontinued prematurely" and similarly described participant categories are less likely to have missing participant data.
Dealing with participants with missing data in the primary meta‐analysis
In the primary meta‐analysis, we used a complete case analysis approach, i.e. we excluded participants considered to have missing data.
For categorical data, we used the following calculations for each study arm:
-
Denominator: (number of participants randomized) ‐ (number of participants most likely with missing data, both pre‐ and post‐intervention initiation).
-
Numerator: number of participants with observed events (i.e. participants who suffered at least one event for the outcome of interest during their available follow‐up time).
For continuous data, we used for each study arm the reported mean and standard deviation for participants actually followed up by the trialists.
Assessing the risk of bias associated with participants with missing data
When the primary meta‐analysis of a specific outcome found a statistically significant effect, we conducted sensitivity meta‐analyses to assess the risk of bias associated with missing participant data. Those sensitivity meta‐analyses used a priori plausible assumptions about the outcomes of participants considered to have missing data. The assumptions we used in the sensitivity meta‐analyses were increasingly stringent in order to progressively challenge the statistical significance of the results of the primary analysis (Akl 2013; Ebrahim 2013).
For categorical data, and for RR showing a reduction in effect (RR < 1), we used the following increasingly stringent but plausible assumptions (Akl 2013):
-
for the control arm, relative incidence (RI) among those with missing data (lost to follow‐up (LTFU)) compared to those with available data (followed up, FU) in the same arm (RILTFU/FU) = 1; for the intervention arm, RILTFU/FU = 1.5;
-
for the control arm, RILTFU/FU = 1; for the intervention arm, RILTFU/FU = 2;
-
for the control arm, RILTFU/FU = 1; for the intervention arm, RILTFU/FU = 3;
-
for the control arm, RILTFU/FU = 1; for the intervention arm, RILTFU/FU = 5;
For RR showing an increase in effect (RR > 1), we switched the above assumptions between the control and interventions arms (i.e. used RILTFU/FU = 1 for the intervention arm).
Specifically, we used the following calculations for each study arm:
-
Denominator: (number of participants randomized) ‐ (number of participants most likely with missing data, pre‐intervention initiation).
-
Numerator: (number of participants with observed events) + (number of participants most likely with missing data post‐intervention initiation, with assumed events).
Assumed events are calculated by applying the a priori plausible assumptions to the participants considered most likely with missing data post‐intervention initiation.
For continuous data, we used the four strategies suggested by Ebrahim et al. The strategies imputed the means for participants with missing data based on the means of participants actually followed up in individual trials included in the systematic review. To impute standard deviation (SD), we used the median SD from the control arms of all included trials (Ebrahim 2013).
Assessment of heterogeneity
We assessed heterogeneity between trials by visual inspection of forest plots, by estimation of the percentage heterogeneity between trials which cannot be ascribed to sampling variation (Higgins 2003), and by a formal statistical test of the significance of the heterogeneity (Deeks 2001). If there was evidence of substantial heterogeneity, we attempted to investigate the possible reasons for this (see section on Subgroup analysis and investigation of heterogeneity).
Assessment of reporting biases
We assessed for selective outcome reporting by trying to identify whether the study was included in a trial registry, whether a protocol is available, and whether the methods section provided a list of outcomes. We compared the list of outcomes from those sources to the outcomes reported in the published paper. We also assessed for possible publication bias by creating an inverted funnel plot for the primary outcome of survival.
Data synthesis
We calculated the agreement between the two independent review authors for the assessment of eligibility using a kappa statistic.
For time‐to‐event data, we pooled the log(HRs) using a random‐effects model (DerSimonian 1986), and the generic inverse variance facility of RevMan 5.2 (RevMan 2012).
For dichotomous data, we calculated the RR separately for each study. We then pooled the results of the different studies using a random‐effects model.
We assessed the quality of evidence at the outcome level using the Grading of Recommendations Assessment, Development and Evaluation (GRADE) approach (Cochrane Handbook).
Subgroup analysis and investigation of heterogeneity
We planned to explore heterogeneity by conducting subgroup analyses based on the type of intervention (LMWH versus unfractionated heparin) and the characteristics of participants (type, severity and stage of cancer, and whether patients were on cancer treatment or not).
Sensitivity analysis
We planned for sensitivity analyses excluding lower quality trials. As described above, we also planned for sensitivity meta‐analyses to assess the risk of bias associated with missing participant data when the primary meta‐analysis of a specific outcome found a statistically significant effect.
Results
Description of studies
Results of the search
Figure 1 shows the study flow. The February 2013 search strategy identified a total of 9559 citations from which we removed the results of our February 2010 search. In total, the title and abstract screening identified 76 potentially eligible citations. The full‐text screening of the 76 citations identified 15 eligible RCTs published either as full reports (Agnelli 2009; Agnelli 2012; Altinbas 2004; Haas 2012 TOPIC 1; Haas 2012 TOPIC 2; Kakkar 2004; Klerk 2005; Lebeau 1994; Lecumberri 2013; Maraveyas 2012; Perry 2010; Sideras 2006; van Doormaal 2011; Weber 2008), or as an abstract with additional information provided by the author (Pelzer 2009). We identified 16 published abstracts for eight of the 15 included RCTs (Agnelli 2009; Altinbas 2004; Haas 2012 TOPIC 1; Haas 2012 TOPIC 2; Klerk 2005; Sideras 2006; Pelzer 2009; Perry 2010). We also identified two eligible studies published as abstracts but for which we were not able to obtain the necessary data from the authors: Salat 1990 and Chazouilleres 1994. Agreement between authors on study eligibility was excellent (kappa = 0.94).

Study flow diagram.
Included studies
The 15 included studies reported follow‐up data on 7622 participants. One study used unfractionated heparin as the intervention (Lebeau 1994), while the other 14 used LMWH as the intervention (Agnelli 2009; Agnelli 2012; Altinbas 2004; Haas 2012 TOPIC 1; Haas 2012 TOPIC 2; Kakkar 2004; Klerk 2005; Lecumberri 2013; Maraveyas 2012; Pelzer 2009; Perry 2010; Sideras 2006; van Doormaal 2011; Weber 2008). We did not identify any study using fondaparinux as the intervention.
Lebeau et al recruited 277 patients with both limited and extensive small cell lung cancer (SCLC), 78% of which had a Karnofsky Performance Scale Index > 80 (Lebeau 1994). The Karnofsky Performance Scale Index ranges from 0 (dead) to 100 (normal) (Karnofsky 1948). Patients were randomized to receive, along with their chemotherapy, either a prophylactic dose of unfractionated heparin for five weeks or no intervention. The study outcome was mortality (at one, two and three years). Follow‐up was complete (100%). The minimum duration of follow‐up was not reported. The maximum duration of follow‐up was 59 months. HRs were estimated from published survival curves, assuming all patients were followed up for 59 months.
Kakkar et al (the FAMOUS trial) recruited 385 patients with advanced stage III or IV malignant disease of the breast, lung, gastrointestinal tract, pancreas, liver, genitourinary tract, ovary or uterus and a minimum life expectancy of three months (Kakkar 2004). Patients were randomized to receive either a prophylactic dose of a LMWH (dalteparin) or placebo for 12 months with no restriction on concomitant chemotherapy or radiotherapy. The study outcomes included mortality (at one, two and three years), pulmonary embolism, DVT, major bleeding and minor bleeding. Follow‐up data were available for 374 patients (97%). The minimum duration of follow‐up was not reported. The maximum duration of follow‐up was 77 months. HRs were estimated from published survival curves, assuming all patients were followed up for 77 months.
Altinbas et al recruited 84 patients with both limited and extensive SCLC and an Eastern Cooperative Oncology Group (ECOG) state < 3 (Altinbas 2004). The ECOG Performance Status scale ranges from 0 (fully active) to 5 (dead) (Oken 1982). Patients were randomized to receive either a prophylactic dose of a LMWH (dalteparin) or placebo for 18 weeks or less in combination with chemotherapy in case of disease progression. Study outcomes included mortality (at one and two years), DVT and minor bleeding. Follow‐up was complete (100%). The minimum and maximum duration of follow‐up were two and 33 months respectively. HRs were estimated from published survival curves.
Klerk et al (MALT trial) recruited 302 patients with different types of solid malignant tumors that could not be treated curatively and a minimum life expectancy of one month (Klerk 2005). Cancer types included: colorectal, breast, lung, gastric, esophageal, liver, gallbladder, Klatskin, prostate, pancreatic, cervical, urothelial, renal, ovarian, melanoma, endometrial and other cancers. Patients were randomized to receive either a LMWH (nadroparin; two weeks therapeutic dose followed by four weeks of a prophylactic dose) or a placebo for six weeks without any concomitant chemotherapy or radiotherapy. Study outcomes included mortality (at six, months, one year and two years), major bleeding, and major or minor bleeding. Follow‐up was complete (100%). The minimum duration of follow‐up was not reported. The maximum duration of follow‐up was 84 months. The HR and its standard error were reported.
Sideras et al recruited 141 patients with different types of advanced cancer and a minimum life expectancy of 12 weeks and ECOG state 0 to 2 (Sideras 2006). Patients were randomized either to a prophylactic dose of a LMWH (dalteparin) or to placebo or no intervention. Study outcomes included mortality (at one, two and three years), VTE and major bleeding. Follow‐up data were available for 138 patients (98%). The minimum duration of follow‐up was not reported. The maximum duration of follow‐up was 24 months. The authors supplied us with unpublished data, giving the HR and its standard error.
Weber et al recruited 20 patients aged 55 to 88 years with advanced cancer and an estimated life expectancy of less than six months (Weber 2008). Patients were randomized to receive either a prophylactic dose of LMWH (nadroparin) or no treatment. Study outcomes included death, venous thromboembolism and major bleeding.
Pelzer et al (CONKO 004 trial) recruited 312 chemotherapy‐naive patients with histologically or cytologically confirmed advanced pancreatic cancer (Pelzer 2009). Patients were randomized to receive or not to receive additional LMWH (enoxaparin) starting simultaneously with palliative systemic chemotherapy. Study outcomes included symptomatic VTE, overall survival, major bleeding and time to progression (TTP). The median duration of follow‐up was 30.4 weeks.
Agnelli et al (PROTECHT trial) recruited 1150 ambulatory patients with metastatic or locally advanced lung, gastrointestinal, pancreatic, breast, ovarian or head and neck cancer (Agnelli 2009). Patients were randomized to receive a prophylactic dose of nadroparin (3800 IU anti‐Xa once a day) or placebo. The study treatment was started on the same day as chemotherapy (the first cycle or a new course) for a maximum of four months. The primary efficacy outcome was the composite of symptomatic DVT of lower or upper limbs, pulmonary embolism (PE), visceral or cerebral venous thrombosis, acute myocardial infarction, ischemic stroke, acute peripheral arterial thromboembolism, and unexplained death of possible VTE origin occurring during the study treatment plus 10 days. The secondary efficacy outcomes were asymptomatic thromboembolic events incidentally diagnosed, survival at the end of study treatment and at 12 months, superficial thrombophlebitis of the lower limbs, response to chemotherapy and, for patients with a central venous catheter (CVC), CVC‐related complications of possible thrombotic origin.
Perry et al (PRODIGE trial) recruited 186 adults with newly diagnosed malignant glioma (Perry 2010). Patients were randomized to receive a prophylactic dose of LMWH (dalteparin) or placebo. Study outcomes included objectively documented symptomatic DVT or pulmonary embolism (primary outcome), bleeding (major and all bleeding), quality of life, cognition assessments and death. The duration of follow‐up was 12 months
Doormaal et al recruited 503 patients with histologically or cytologically documented prostate carcinoma within six months after diagnosis of hormone‐refractory state, NSCLC without clinically significant pleural effusion within three months after diagnosis of stage IIIB, or with a locally advanced pancreatic cancer within three months after diagnosis and a minimum life expectancy of less than three months at entry with a minimum Karnofsky score of 60 (van Doormaal 2011). Patients were randomized to receive either body weight–adjusted therapeutic doses of subcutaneous nadroparin for two weeks followed by half‐therapeutic doses for an additional four weeks or no nadroparin. After these initial six weeks, patients were eligible to receive additional cycles of nadroparin (two weeks at therapeutic dose, and four weeks of washout period). The total duration of study drug administration was 46 weeks, including the washout periods, which was also the minimum duration of follow‐up. The median duration of follow‐up was 10.5 months in the nadroparin group and 10.4 months in the control group. The study outcomes included mortality (at one, two and three years versus at 5, 10, 15, 20, 25, 30, 35, 40 months), pulmonary embolism, DVT, myocardial infarction, ischemic stroke, systemic embolism major bleeding and minor bleeding. The percentage of patients lost to follow‐up was 0.8% and 3.5% from the nadroparin group and the control group respectively.
Agnelli et al (SAVE‐ONCO) recruited 3212 patients with advanced metastatic or locally advanced cancer of the lung, pancreas, stomach, colon, rectum, bladder or ovary solid tumors, who were planned to receive chemotherapy, with a minimum life expectancy of three months. Of the patients, 91% had an ECOG performance status of 0 or 1 and 42% had at least one risk factor for VTE (Agnelli 2012). Patients were randomized to receive either subcutaneous injection of semuloparin 20 mg once daily or placebo for a minimum of three months. The study outcomes included mortality, pulmonary embolism, symptomatic DVT, major bleeding and minor bleeding. Follow‐up data were available for 374 patients (97%). The minimum duration of follow‐up was up to three days after last injection, with a median of 3.5 months. The maximum duration of follow‐up was 12 months.
Haas et al conducted two double‐blind studies and recruited 900 ambulatory patients receiving first‐ or second‐line chemotherapy for objectively proven, disseminated metastatic breast carcinoma (Haas 2012 TOPIC 1; n = 353) or stage III/IV non–small cell lung carcinoma (Haas 2012 TOPIC 2; n = 547) from 39 centers in Germany, Czech Republic, Ukraine, Romania and Belarus. Patients were randomized to receive either subcutaneous certoparin 3000 IU once daily or placebo for six months. The study outcomes included mortality, confirmed VTE, PE, DVT, thrombocytopenia, skeletal events, superficial thrombophlebitis, any thrombotic event (arterial thrombotic events, superficial thrombophlebitis and central line thrombosis), thrombosis of the jugular or subclavian veins, major bleeding and minor bleeding. Follow‐up data were available for 374 patients (97%). The minimum duration of follow‐up was six months.
Maraveyas et al recruited 123 patients with histopathological or cytological diagnosis of non‐resectable, recurrent or metastatic pancreatic adenocarcinoma. Karnofsky performance status (KPS) of 60 to 100, and estimated life expectancy of more than 12 weeks (Maraveyas 2012). Patients were randomized to receive either subcutaneous weight‐adjusted dalteparin 200 IU/kg once daily for four weeks followed by a stepdown to 150 IU/kg for a further eight weeks or placebo. During the first four weeks patients received a mean of 99% of the theoretical (200 IU/kg) dose. In weeks 5 to 12, a mean of 105% of the theoretical (150 IU/kg) dose was delivered. The study outcomes included mortality, all‐type VTE, DVT, pulmonary embolism, myocardial infarction, cerebrovascular accidents, visceral thromboembolic events, chemotherapy toxicity and time to progression. Data from a range of 55 to 62 participants were used for different outcome assessments. All outcomes were assessed at 12 weeks and one year follow‐up.
Lecumberri et al (ABEL study) recruited 38 patients diagnosed with limited small cell lung cancer in a multicenter, open‐label study (Lecumberri 2013). Participants were randomized to receive standard chemoradiotherapy or the same therapy plus 3500 IU daily of bemiparin for a maximum of 26 weeks. The study outcomes included progression‐free survival, all‐cause mortality, incidence of VTE, major and minor bleeding, and thrombocytopenia. All outcomes were assessed at 18 months and 0% were lost to follow‐up.
Excluded studies
We excluded 62 articles from this review for the following reasons: intervention was topical heparin (n = 1), intervention was oral anticoagulant (n = 10) or intraportal infusion of heparin (n = 3); intervention consisted of only two doses of LMWH (n = 3); comparison was of heparin versus vitamin K antagonist (n = 3); comparison was of heparin versus aspirin (n = 2); comparison was of heparin versus enoxaparin versus aspirin (n = 1); comparison was of three different doses of LMWH and control group was not randomly assigned (n = 1); no control group (n = 5); studies included no cancer patients (n = 2); no survival outcome (n = 3); study design was not a RCT (n = 11); letter to the editor or editorial (n = 12); publication was a review (n = 5).
Risk of bias in included studies
Allocation
Allocation was adequately concealed in 12 of the 15 studies (Agnelli 2009; Agnelli 2012; Haas 2012 TOPIC 1; Haas 2012 TOPIC 2; Kakkar 2004; Klerk 2005; Lebeau 1994; Lecumberri 2013; Pelzer 2009; Perry 2010; Sideras 2006; van Doormaal 2011; Weber 2008), and it was not concealed in one study (Altinbas 2004). Allocation concealment was not reported in one study (Maraveyas 2012).
Blinding
While six studies blinded patients, providers, data collectors and outcome adjudicators (Agnelli 2009; Agnelli 2012; Haas 2012 TOPIC 1; Haas 2012 TOPIC 2; Kakkar 2004; Klerk 2005; Perry 2010), one study blinded only data analysts (Pelzer 2009), one study blinded only outcome adjudicators (van Doormaal 2011), and six studies did not have any blinding (Altinbas 2004; Lebeau 1994; Lecumberri 2013; Maraveyas 2012; Sideras 2006; Weber 2008).
Incomplete outcome data
Agnelli et al reported an approximate 98.5% follow‐up rate in both studies (Agnelli 2009; Agnelli 2012). Pelzer et al reported a 94% follow‐up rate for thromboembolic events and an 87% follow‐up rate for survival (Pelzer 2009). Sideras et al reported a 98% follow‐up rate (Sideras 2006). van Doormaal et al reported a 97.85% follow‐up rate (van Doormaal 2011). The remaining studies reported a 100% follow‐up rate. Maraveyas was the only paper that reported follow‐up data per outcome and not per participant (Maraveyas 2012). Data from 59 to 62 participants in the intervention arm were used for different outcome assessments. Data from 55 to 59 participants in the control arm were used for different outcome assessments.
Selective reporting
The outcomes listed in the methods section were reported in the results section for 11 studies (Agnelli 2009; Agnelli 2012; Haas 2012 TOPIC 1; Haas 2012 TOPIC 2; Kakkar 2004; Klerk 2005; Lebeau 1994; Maraveyas 2012; Pelzer 2009; Sideras 2006; van Doormaal 2011; Weber 2008). One study reported on all outcomes except for two listed in the methods section (quality of life and cognition assessment) (Perry 2010). The outcomes were not listed in the methods section for one study (Altinbas 2004). Seven studies were registered with ClinicalTrials.gov (Agnelli 2009; Agnelli 2012; Lecumberri 2013; Maraveyas 2012; Pelzer 2009; Perry 2010; van Doormaal 2011). Only one study had a published protocol and did report on all outcomes described in that protocol (Pelzer 2009).
Other potential sources of bias
We questioned whether in the study by Agnelli et al the follow‐up time "occurring between randomization and 3 days after the last injection of the study drug" could have potentially led to differential follow‐up time between the two groups (Agnelli 2012). However, the authors report that "the duration of treatment was similar in the two study groups, with a median of approximately 3.5 months".
Klerk et al reported that "chemotherapy was more frequently administered during the period of study treatment in patients receiving placebo, whereas radiotherapy was more frequently given to patients receiving nadroparin"; thus 25% of the nadroparin group and 34% of the placebo group received chemotherapy; 32% of the nadroparin group and 18% of the placebo group received radiotherapy. Having different co‐interventions between the two groups might lead to performance bias (Klerk 2005).
Only one study was stopped early by the patient monitoring committee due to insufficient accrual (Sideras 2006).
We judged that in the study by Lebeau et al patients received similar co‐interventions although brain and thoracic irradiation depended on response to treatment. In that study, 11% and 7% respectively of patients randomized to heparin and control groups received radiotherapy (Lebeau 1994).
All but two studies reported using the intention‐to‐treat (ITT) principle (Maraveyas 2012; Sideras 2006).
Effects of interventions
Appendix 3 shows the detailed statistical data abstraction.
All‐cause mortality
All‐ cause mortality at 12 months
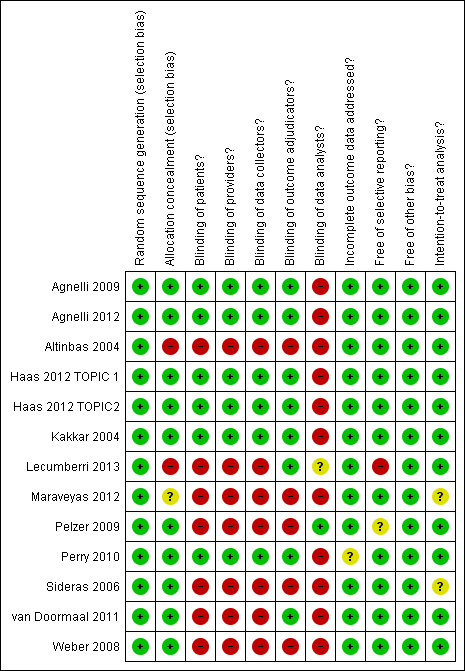
Meta‐analysis of the 13 randomized controlled trials (RCTs), including 7013 participants, found that the use of heparin compared to no heparin has no effect on mortality rates at 12 months (risk ratio (RR) 0.97; 95% confidence interval (CI) 0.92 to 1.01) (see Analysis 1.1). The I2 value indicates that the percentage of the variability in effect estimates that is due to heterogeneity rather than sampling error (chance) is not important (I2 = 6%). The associated risk of bias is presented in Figure 2. The quality of evidence was moderate due to imprecision (summary of findings Table for the main comparison). The inverted funnel plot for the primary outcome of mortality at one year did not suggest publication bias, but there were relatively few trials to permit an accurate assessment (Figure 3).
'Risk of bias' summary ‐ mortality at 12 months: review authors' judgements about each methodological quality item for each included study that evaluated mortality at 12 months

Funnel plot of comparison: 1 Heparin versus placebo, outcome: 1.1 Mortality at 12 months.
In a subgroup analysis of patients with small cell lung cancer (SCLC) (Altinbas 2004; Lebeau 1994), versus other types of cancer, the test for subgroup difference had a P value of 0.05): RR 0.86 (95% CI 0.75 to 0.98) for SCLC versus RR 0.98 (95% CI 0.93 to 1.03) for other types of cancer.
In a subgroup analysis of patients with advanced cancer (including patients with extensive SCLC) (Altinbas 2004; Kakkar 2004; Klerk 2005; Lebeau 1994; Sideras 2006; van Doormaal 2011), versus patients with non‐advanced cancer (including patients with limited SCLC), we found no significant difference between the effects of heparin in the two subgroups (P value = 0.61).
All‐cause mortality at 24 months
In a post hoc meta‐analysis of seven RCTs, including 1621 participants, we found that heparin compared to no heparin has no effect on mortality rates at 24 months (RR 0.95; 95% CI 0.90 to 1.00) (see Analysis 1.2). The I2 value indicates that the percentage of the variability in effect estimates that is due to heterogeneity rather than chance may represent moderate heterogeneity (I2 = 29%).
The test for subgroup effect was not statistically significant for either of the two subgroup analyses (advanced versus non‐advanced with a P value of 0.60, and SCLC versus non SCLC with a P value of 0.29).
All‐cause mortality ‐ time‐to‐event analysis
Eleven studies, including 5254 participants, reported data allowing their inclusion in the time‐to‐event meta‐analysis. Meta‐analysis indicated that heparin was associated with a statistically significant reduction in the risk of death compared to no heparin (hazard ratio (HR) 0.84; 95% CI 0.74 to 0.96) (see Analysis 1.3). The I2 value indicates that the percentage of the variability in effect estimates that is due to heterogeneity rather than sampling error (chance) may represent moderate heterogeneity (I2 = 58%).
Symptomatic venous thromboembolism (VTE)
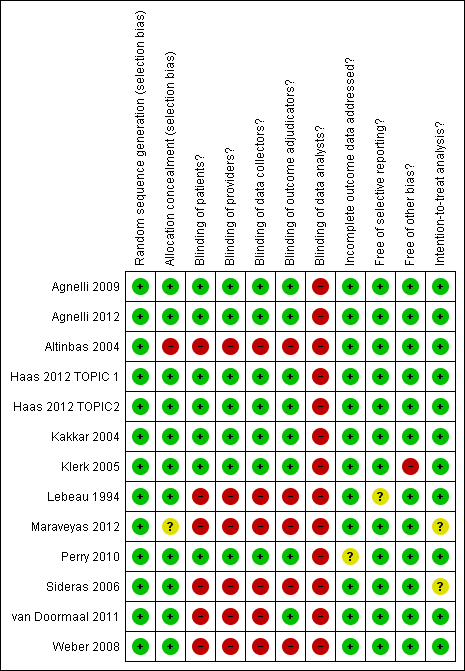
Meta‐analysis of 13 RCTs, including 6809 participants, found that heparin was associated with a statistically significant reduction in the risk of symptomatic VTE compared to no heparin (RR 0.56; 95% CI 0.43 to 0.74) (see Analysis 1.4). The I2 value indicates that the percentage of the variability in effect estimates that is due to heterogeneity rather than chance may represent minor heterogeneity (I2 = 18%). The associated risk of bias is presented in Figure 4. Since the primary meta‐analysis found a statistically significant effect, and in order to assess the risk of bias associated with missing participant data, we conducted sensitivity meta‐analyses using the a priori plausible assumptions detailed in the Methods section. The effect estimate remained significant across all five stringent assumptions. Please see Appendix 4. The quality of evidence was high (summary of findings Table for the main comparison). Analysis 1.5 and Analysis 1.6 respectively show the separate analyses for symptomatic DVT and symptomatic PE.
'Risk of bias' summary ‐ venous thromboembolism: review authors' judgements about each methodological quality item for each included study that evaluated venous thromboembolism
Major bleeding
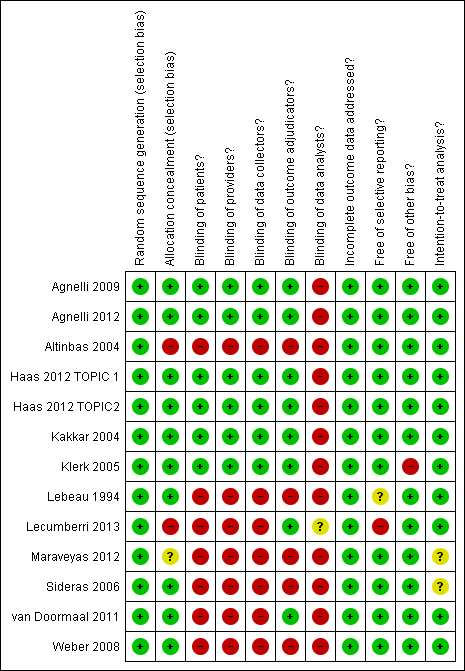
Meta‐analysis of the 15 RCTs, including 7363 participants, failed to show or to exclude a beneficial or detrimental effect of heparin on the risk of major bleeding compared to no heparin (RR 1.13; 95% CI 0.63 to 2.01) (see Analysis 1.7). The I2 value indicates that the percentage of the variability in effect estimates that is due to heterogeneity rather than sampling error (chance) may represent moderate heterogeneity (I2 = 29%). The associated risk of bias is presented in Figure 5. The quality of evidence was moderate due to imprecision (summary of findings Table for the main comparison).

'Risk of bias' summary ‐ major bleeding: review authors' judgements about each methodological quality item for each included study that evaluated major bleeding
Minor bleeding
Meta‐analysis of 13 RCTs, including 6884 participants, found that heparin was associated with a statistically significant increase in the risk of minor bleeding compared to no heparin (RR 1.32; 95% CI 1.02 to 1.71) (see Analysis 1.8). The I2 value indicates that the percentage of the variability in effect estimates that is due to heterogeneity rather than chance is not important (I2 = 5%). The associated risk of bias is presented in Figure 6. Since the primary meta‐analysis found a statistically significant effect, and in order to assess the risk of bias associated with missing participant data, we conducted sensitivity meta‐analyses using the a priori plausible assumptions detailed in the Methods section. The effect estimate lost significance across all five stringent assumptions. Please see Appendix 4. The quality of evidence was moderate due to imprecision (summary of findings Table for the main comparison).
'Risk of bias' summary ‐ minor bleeding: review authors' judgements about each methodological quality item for each included study that evaluated minor bleeding
Health‐related quality of life
One study assessed quality of life using the Uniscale and the Symptom Distress Scale (SDS) (Sideras 2006). The authors reported that the scores for the two scales were similar for the two study groups, both at baseline and at follow‐up..
Thrombocytopenia
Meta‐analysis of nine RCTs, including 4890 participants, failed to show or to exclude a beneficial or detrimental effect of heparin on the risk of thrombocytopenia compared to no heparin (RR 0.54; 95% CI 0.26 to 1.12) (see Analysis 1.9). The I2 value indicates that the percentage of the variability in effect estimates that is due to heterogeneity rather than chance may represent high heterogeneity (I2 = 87%). The quality of evidence was low due to inconsistency and imprecision, assuming the pooled effect estimates suggests no effect.
Sensitivity analyses
The sensitivity analysis excluding the lower quality study, Altinbas 2004, from the analyses did not change the results significantly. We have presented above the sensitivity meta‐analyses to assess the risk of bias associated with missing participant data.
Discussion
Summary of main results
The effect of parenteral anticoagulation (with either unfractionated heparin or low molecular weight heparin (LMWH)) on mortality of patients with cancer, who have no therapeutic or prophylactic indication for anticoagulation, was statistically and clinically significant during the overall duration of the studies but not at 12 and 24 months. Typically these patients are undergoing chemotherapy, hormonal therapy or radiotherapy, but otherwise have no standard therapeutic or prophylactic indication for anticoagulation. While parenteral anticoagulation was associated with a reduction in venous thromboembolic events and minor bleeding, it was not associated with a statistically significant effect on major bleeding or thrombocytopenia. We did not identify any study using fondaparinux as the anticoagulant. A subgroup analysis suggested a potential reduction in mortality in small cell lung cancer (SCLC) as opposed to other types of cancer.
Overall completeness and applicability of evidence
The included studies recruited patients with variety of cancer types and stages, which should increase the applicability of the results. The results apply best to LMWH, given that only one study evaluated unfractionated heparin. Unfortunately, not enough data were available to evaluate the impact of the intervention on bleeding outcomes or on quality of life. The latter outcome is important given the potential burden of daily subcutaneous injections.
As mentioned above, we identified two eligible studies for which we were not able to obtain the necessary data from the authors. Chazouilleres 1994 recruited 51 patients with unresectable hepatocellular carcinoma and reported a lower short‐term mortality rate with LMWH. Salat 1990 did not report on mortality outcome.
Quality of the evidence
Our systematic approach to searching, study selection and data extraction should have minimized the likelihood of missing relevant studies. The quality of evidence was high for symptomatic venous thromboembolism, moderate for mortality, major bleeding and minor bleeding, and low for quality of life.
Potential biases in the review process
The small number of studies and the inclusion of different types of cancer in the same study precluded us from conducting the subgroup analyses to explore effect modifiers such as type and stage of cancer. The interpretation of findings is also limited by not including data from the trials published as abstracts only. Also, for two studies we had to calculate the number of mortality events at 12 and 24 months from the survival curves (Altinbas 2004; Kakkar 2004).
Agreements and disagreements with other studies or reviews
A recent review by Che at al assessed the effect of LMWH compared to no heparin in patients with cancer with no history of VTE (Che 2013). Similar to our findings, the review found that LMWH significantly reduced the risk of venous thromboembolism (VTE) and increased the risk of bleeding. Moreover, this study did not focus on the type of intervention or type of participants, for example the pooled participants included patients being started on thromboprophylaxis due the placement of a central venous catheter, or in the perioperative setting. Our review eligibility criteria focused on parenteral anticoagulation in ambulatory patients with cancer, i.e. reducing clinical heterogeneity.
Another Cochrane systematic review conducted by Di Nisio et al assessed the efficacy and safety of primary thromboprophylaxis in ambulatory cancer patients receiving chemotherapy (Di Nisio 2014). The authors found that LMWH, when compared with inactive control, significantly reduced the incidence of symptomatic VTE whereas there was no statistically significant benefit or harm for asymptomatic VTE, minor bleeding, one‐year mortality, symptomatic arterial thromboembolism, superficial thrombophlebitis or serious adverse events.
Another recent publication by Phan et al, studying the efficacy of heparin‐based medications for prevention of VTE, found a significant reduction in VTE with an odds ratio (OR) of 0.56 (95% confidence interval (CI) 0.45 to 0.71) (Phan 2014). However, this study had few limitations in comparison to ours. That review did not include four studies we deemed to be eligible (Altinbas 2004; Pelzer 2009; Sideras 2006; Weber 2008). The reported reason for not including two of these studies was that VTE was not assessed (Altinbas 2004; Sideras 2006). There was no reference to the two other studies (Sideras 2006; Weber 2008). Secondly, one trial, Young 2009, assessing anticoagulation in patients with a central venous catheter was also included in their review, which could have contributed to the review's heterogeneity. In our review, we excluded studies evaluating prophylaxis for catheter‐related thrombosis, as this was the subject of another Cochrane systematic review (Akl 2011). Unlike the review conducted by Phan 2014, we did not include in the VTE meta‐analysis the trial conducted by Klerk et al (Klerk 2005). This is because the number of VTE events reported pertains to participants who discontinued the study drug prematurely because they developed VTE. Moreover, Phan 2014 focused solely on VTE and did not assess other patient‐important outcomes, such as mortality.
'Risk of bias' summary ‐ mortality at 12 months: review authors' judgements about each methodological quality item for each included study that evaluated mortality at 12 months
Funnel plot of comparison: 1 Heparin versus placebo, outcome: 1.1 Mortality at 12 months.
'Risk of bias' summary ‐ venous thromboembolism: review authors' judgements about each methodological quality item for each included study that evaluated venous thromboembolism
'Risk of bias' summary ‐ major bleeding: review authors' judgements about each methodological quality item for each included study that evaluated major bleeding
'Risk of bias' summary ‐ minor bleeding: review authors' judgements about each methodological quality item for each included study that evaluated minor bleeding

Comparison 1 Heparin versus placebo, Outcome 1 Mortality at 12 months.

Comparison 1 Heparin versus placebo, Outcome 2 Mortality at 24 months.

Comparison 1 Heparin versus placebo, Outcome 3 Mortality over duration of study.
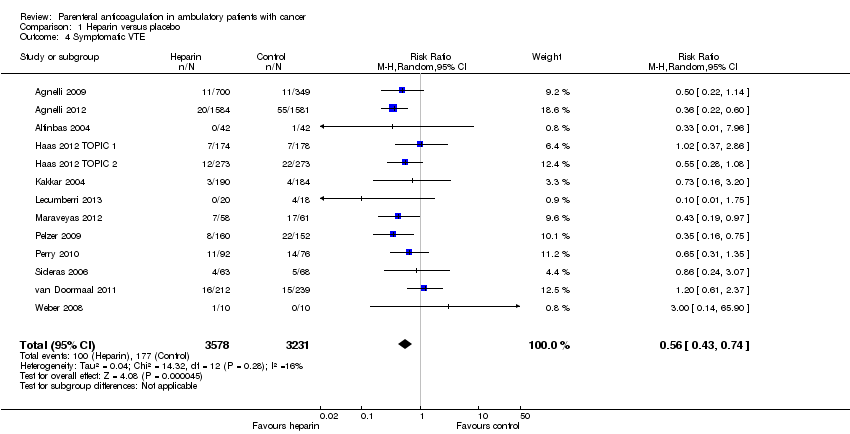
Comparison 1 Heparin versus placebo, Outcome 4 Symptomatic VTE.

Comparison 1 Heparin versus placebo, Outcome 5 Symptomatic DVT.
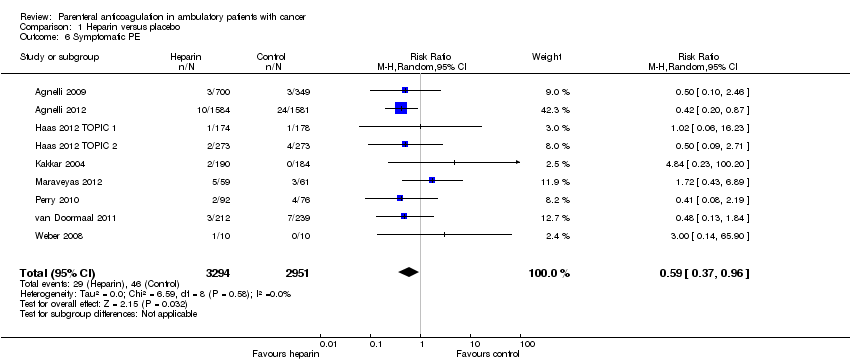
Comparison 1 Heparin versus placebo, Outcome 6 Symptomatic PE.

Comparison 1 Heparin versus placebo, Outcome 7 Major bleeding.

Comparison 1 Heparin versus placebo, Outcome 8 Minor bleeding.
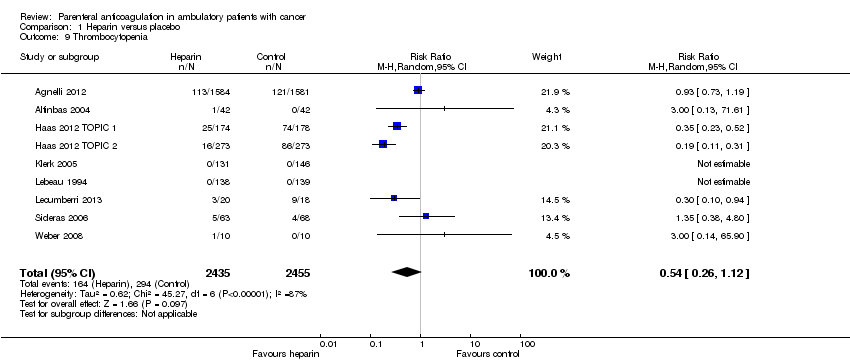
Comparison 1 Heparin versus placebo, Outcome 9 Thrombocytopenia.
| Heparin compared to placebo for ambulatory patients with cancer who have no therapeutic or prophylactic indication for anticoagulation | ||||||
| Patient or population: Ambulatory patients with cancer who have no therapeutic or prophylactic indication for anticoagulation | ||||||
| Outcomes | Illustrative comparative risks* (95% CI) | Relative effect | No of participants | Quality of the evidence | Comments | |
| Assumed risk | Corresponding risk | |||||
| Placebo | Heparin | |||||
| Mortality at 12 months | Study population | RR 0.97 | 7013 | ⊕⊕⊕⊝ | Moderate‐quality evidence owing to imprecision. A survival analysis based on data from 11 studies found a hazard ratio of 0.84 (95% CI 0.74 to 0.96); however heterogeneity in that analysis was relatively high (I2 = 58%) and subgroup analyses did not conclusively identify any subgroup effect | |
| 472 per 1000 | 458 per 1000 | |||||
| Symptomatic VTE | Study population | RR 0.56 | 6809 | ⊕⊕⊕⊕ | The data are combined for pulmonary embolism and symptomatic deep venous thrombosis | |
| 55 per 1000 | 31 per 1000 | |||||
| Major bleeding | Study population | RR 1.14 | 7363 | ⊕⊕⊕⊝ | Moderate‐quality evidence owing to imprecision | |
| 19 per 1000 | 21 per 1000 | |||||
| Minor bleeding | Study population | RR 1.32 | 6884 | ⊕⊕⊕⊝ | Moderate‐quality evidence owing to imprecision | |
| 30 per 1000 | 40 per 1000 | |||||
| *The basis for the assumed risk (e.g. the median control group risk across studies) is provided in footnotes. The corresponding risk (and its 95% confidence interval) is based on the assumed risk in the comparison group and the relative effect of the intervention (and its 95% CI). | ||||||
| GRADE Working Group grades of evidence | ||||||
| 1Confidence interval includes values suggesting clinically significant benefit and values suggesting no effect. 2Confidence interval includes values suggesting clinically significant benefit and values suggesting harm. 3Confidence interval includes values suggesting clinically significant harm and values suggesting no effect. | ||||||
| Term | Definition |
| Adjuvant therapy | Assisting in the amelioration or cure of disease |
| Anticoagulation | The process of hindering the clotting of blood especially by treatment with an anticoagulant |
| Antithrombotic | Used against or tending to prevent thrombosis (clotting) |
| Bacteremia | The presence of bacteria in the blood |
| Central venous line | Synthetic tube that is inserted into a central (large) vein of a patient to provide temporary intravenous access for the administration of fluid, medication or nutrients |
| Coagulation | Clotting |
| Deep vein thrombosis (DVT) | A condition marked by the formation of a thrombus within a deep vein (as of the leg or pelvis) that may be asymptomatic or be accompanied by symptoms (such as swelling and pain) and that is potentially life‐threatening if dislodgment of the thrombus results in pulmonary embolism |
| Fibrin | A white insoluble fibrous protein formed from fibrinogen by the action of thrombin, especially in the clotting of blood |
| Fondaparinux | An anticoagulant medication |
| Hemostatic system | The system that shortens the clotting time of blood and stops bleeding |
| Heparin | An enzyme occurring especially in the liver and lungs that prolongs the clotting time of blood by preventing the formation of fibrin. Two forms of heparin that are used as anticoagulant medications are: unfractionated heparin (UFH) and low molecular weight heparins (LMWH) |
| Impedance plethysmography | A technique that measures the change in blood volume (venous blood volume as well as the pulsation of the arteries) for a specific body segment |
| Kappa statistics | A measure of degree of non‐random agreement between observers and/or measurements of a specific categorical variable |
| Metastasis | The spread of cancer cells from the initial or primary site of disease to another part of the body |
| Oncogene | A gene having the potential to cause a normal cell to become cancerous |
| Osteoporosis | A condition that especially affects older women and is characterized by a decrease in bone mass with decreased density and enlargement of bone spaces producing porosity and brittleness |
| Parenteral nutrition | The practice of feeding a patient intravenously, circumventing the gut |
| Pulmonary embolism (PE) | Embolism of a pulmonary artery or one of its branches that is produced by foreign matter and most often a blood clot originating in a vein of the leg or pelvis and that is marked by labored breathing, chest pain, fainting, rapid heart rate, cyanosis, shock and sometimes death |
| Stroma | The supporting framework of an organ typically consisting of connective tissue |
| Thrombin | A proteolytic enzyme formed from prothrombin that facilitates the clotting of blood by catalyzing conversion of fibrinogen to fibrin |
| Thrombocytopenia | Persistent decrease in the number of blood platelets that is often associated with hemorrhagic conditions |
| Thrombosis | The formation or presence of a blood clot within a blood vessel |
| Vitamin K antagonists | Anticoagulant medications that are used for anticoagulation. Warfarin is a vitamin K antagonist |
| Warfarin | An anticoagulant medication that is a vitamin K antagonist, which is used for anticoagulation |
| Ximelagatran | An anticoagulant medication |
| LMWH | Generic name | Prophylactic dose | Therapeutic dose |
| Lovenox | Enoxaparin | 40 mg once daily | 1 mg/kg twice daily |
| Fragmin | Dalteparin | 2500 to 5000 units once daily | 200 U/kg once daily or |
| Innohep, Logiparin | Tinzaparin, | 4500 units once daily | 90 U/kg twice daily |
| Fraxiparine | Nadroparin | 35 to 75 anti‐Xa international units/kg once daily | 175 anti‐Xa int. units/kg once daily |
| Certoparin | Sandoparin | 3000 anti‐Xa international units once daily | — |
| Outcome or subgroup title | No. of studies | No. of participants | Statistical method | Effect size |
| 1 Mortality at 12 months Show forest plot | 13 | 7013 | Risk Ratio (M‐H, Random, 95% CI) | 0.97 [0.92, 1.01] |
| 2 Mortality at 24 months Show forest plot | 7 | 1621 | Risk Ratio (M‐H, Random, 95% CI) | 0.95 [0.90, 1.00] |
| 3 Mortality over duration of study Show forest plot | 11 | 5254 | Hazard Ratio (Random, 95% CI) | 0.84 [0.74, 0.96] |
| 4 Symptomatic VTE Show forest plot | 13 | 6809 | Risk Ratio (M‐H, Random, 95% CI) | 0.56 [0.43, 0.74] |
| 5 Symptomatic DVT Show forest plot | 9 | 6209 | Risk Ratio (M‐H, Random, 95% CI) | 0.49 [0.28, 0.86] |
| 6 Symptomatic PE Show forest plot | 9 | 6245 | Risk Ratio (M‐H, Random, 95% CI) | 0.59 [0.37, 0.96] |
| 7 Major bleeding Show forest plot | 15 | 7305 | Risk Ratio (M‐H, Random, 95% CI) | 1.13 [0.63, 2.01] |
| 8 Minor bleeding Show forest plot | 13 | 6884 | Risk Ratio (M‐H, Random, 95% CI) | 1.32 [1.02, 1.71] |
| 9 Thrombocytopenia Show forest plot | 9 | 4890 | Risk Ratio (M‐H, Random, 95% CI) | 0.54 [0.26, 1.12] |