Mefloquina para la prevención del paludismo durante el viaje a zonas endémicas
Información
- DOI:
- https://doi.org/10.1002/14651858.CD006491.pub4Copiar DOI

- Base de datos:
-
- Cochrane Database of Systematic Reviews
- Versión publicada:
-
- 30 octubre 2017see what's new
- Tipo:
-
- Intervention
- Etapa:
-
- Review
- Grupo Editorial Cochrane:
-
Grupo Cochrane de Enfermedades infecciosas
- Clasificada:
-
- Actualizada
All studies incorporated from most recent search
All eligible published studies found in the last search (22 Jun, 2017) were includedEvaluada: 12 April 2019
- Actualizada
- Copyright:
-
- Copyright © 2017 The Authors. Cochrane Database of Systematic Reviews published by John Wiley & Sons, Ltd. on behalf of The Cochrane Collaboration.
- This is an open access article under the terms of the Creative Commons Attribution‐Non‐Commercial Licence, which permits use, distribution and reproduction in any medium, provided the original work is properly cited and is not used for commercial purposes.
Cifras del artículo
Altmetric:
Citado por:
Autores
Contributions of authors
Maya Tickell‐Painter (MTP) and David Sinclair (DS) performed title and abstract and full text screening of the search results. MTP and Nicola Mayaan assessed the methodological quality of trials and extracted and analysed data. MTP completed the first draft of the review. DS, Cheryl Pace and Rachel Saunders provided advice on content and methodology. All authors approved the final version for publication.
Sources of support
Internal sources
-
Liverpool School of Tropical Medicine, UK.
External sources
-
Department for International Development, UK.
Grant: 5242
Declarations of interest
NM was contracted by the Cochrane Infectious Diseases Group (CIDG) as a freelance consultant to work on this review and previously worked for Enhanced Reviews Ltd, a company that conducts systematic reviews mostly for the public sector. NM is currently employed by Cochrane Response, an evidence services unit operated by Cochrane.
CP has been involved in aspects of clinical trial management for trials of antimalarials (other than mefloquine) where the study drug has been supplied free of charge by the manufacturer.
David Sinclair was employed at Liverpool School of Tropical Medicine as an author and editor with the CIDG, funded through a grant from the UK Department for International Development.
RS was employed at Liverpool School of Tropical Medicine as an author with the CIDG, funded through a grant from the UK Department for International Development.
MTP was employed at Liverpool School of Tropical Medicine as an author with the CIDG, funded through a grant from the UK Department for International Development.
Acknowledgements
Dr Maya Tickell‐Painter, Dr Rachel Saunders, and Dr David Sinclair received support from the by the Effective Health Care Research Consortium. The Consortium and the editorial base of the Cochrane Infectious Diseases Group are funded by UK aid from the UK Government for the benefit of developing countries (Grant: 5242). The funding body had no role in study design, data collection and analysis, or preparation of the manuscript. The views expressed in this review do not necessarily reflect UK government policy.
Version history
| Published | Title | Stage | Authors | Version |
| 2017 Oct 30 | Mefloquine for preventing malaria during travel to endemic areas | Review | Maya Tickell‐Painter, Nicola Maayan, Rachel Saunders, Cheryl Pace, David Sinclair | |
| 2015 Oct 05 | Drugs for preventing malaria in travellers | Review | Frederique A Jacquerioz, Ashley M Croft | |
| 2009 Oct 07 | Drugs for preventing malaria in travellers | Review | Frederique A Jacquerioz, Ashley M Croft | |
| 2009 Jul 08 | Drugs for preventing malaria in travellers | Protocol | Frederique A Jacquerioz, Ashley M Croft | |
Differences between protocol and review
In the protocol we planned to use a modified version of the ACROBAT‐NRSI tool (now referred to as ROBINS‐I) (ACROBAT‐NSRI tool). In the full review we used the original version.
In the protocol we stated that we would include "clinical cases of malaria, diagnosed by PCR or microscopy". In the full review we included trials in which the methods of detection for malaria were unclear, or different (one RCT which tested for antibodies to a circumsporozoite protein four weeks after travel). This change occurred due to difficulties in establishing diagnoses of malaria in short‐term travellers. No cases of malaria occurred in any study arm in any of these additionally included studies.
In the full review we did not include comparisons with regimens that are currently not routinely used or single‐arm cohort studies. These are planned to be analysed in separate systematic reviews (Rodrigo 2016; Tickell‐Painter 2017).
Differences between 2015 review and this review update
We amended the review title from 'Drugs for preventing malaria in travellers' to 'Mefloquine for preventing malaria during travel to endemic areas.
We rewrote the protocol. Criteria for included studies, methods, and outcomes were revised. The was externally peer refereed by two editors.
The scope of the review changed to cover only efficacy and safety of mefloquine. The search was updated. The types of studies were changed to include non‐RCTs/cohort studies for analysis of safety. The control arm was changed to include placebo or no intervention, as well as the commonly used alternatives of atovaquone‐proguanil, doxycycline, and chloroquine. Types of participants were changed to include all adults and children, including pregnant women (now includes immune and partially‐ immune participants). We altered the inclusion of adverse outcomes; we included measures of adherence to the drug regime and adverse pregnancy outcomes. We modified the 'Risk of bias' assessment to include methods of assessment for non‐randomized trials and risk of bias in conduct and reporting of adverse events and adverse effects.
We did not include any analysis of deaths, suicides, or parasuicides attributable to mefloquine prophylaxis; these are addressed in a separate review (Tickell‐Painter 2017).
The author team changed from Jacquerioz FA and Croft AM to Tickell‐Painter M, Mayaan N, Saunders R, Pace C, and Sinclair D.
Keywords
MeSH
Medical Subject Headings (MeSH) Keywords
- Antimalarials [adverse effects, *therapeutic use];
- Atovaquone [adverse effects, therapeutic use];
- Chloroquine [adverse effects, therapeutic use];
- Doxycycline [adverse effects, therapeutic use];
- Drug Combinations;
- Drug Resistance;
- Drug Therapy, Combination [methods];
- Malaria, Falciparum [*prevention & control];
- Mefloquine [adverse effects, *therapeutic use];
- Primaquine [adverse effects, therapeutic use];
- Proguanil [adverse effects, therapeutic use];
- Randomized Controlled Trials as Topic;
- *Travel-Related Illness;
Medical Subject Headings Check Words
Adult; Child; Humans;
PICO
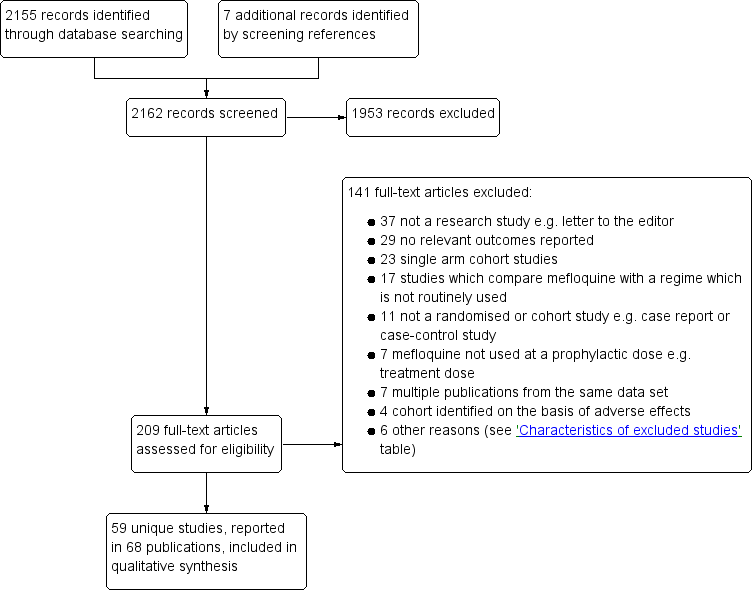
Study flow diagram.
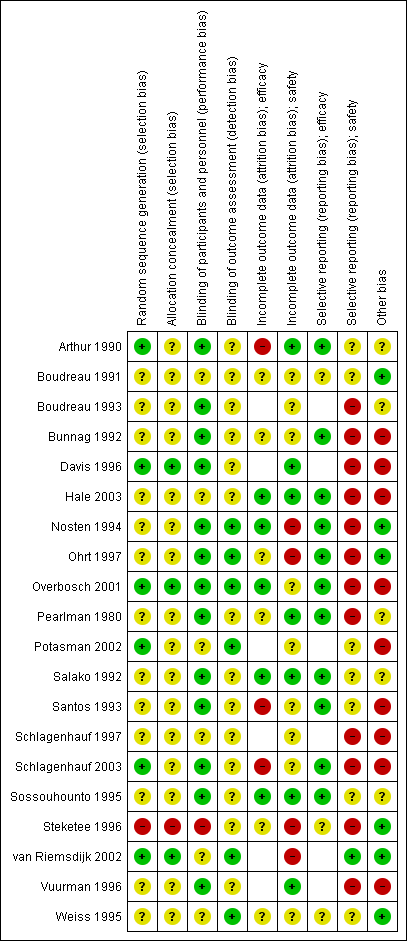
'Risk of bias' summary for RCTs: review authors' judgements about each 'Risk of bias' item for each included study.

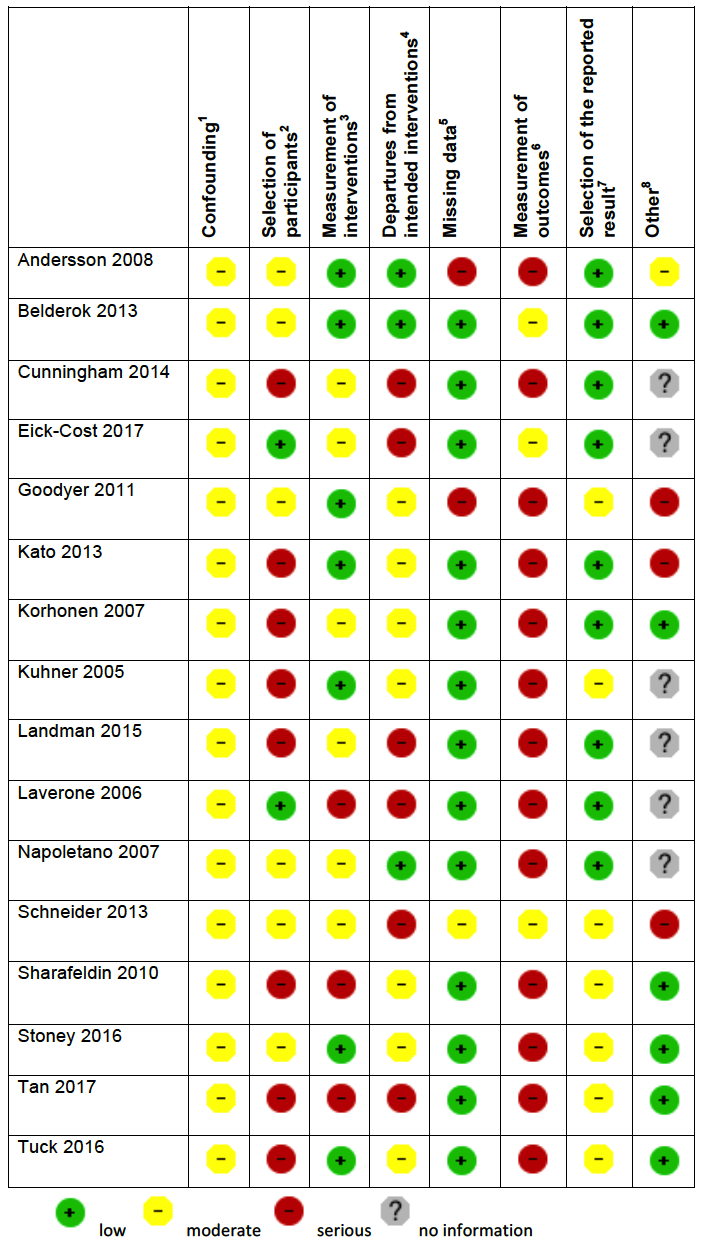
'Risk of bias' summary in cohort studies: mefloquine versus placebo/no treatment
1Assesses whether our pre‐defined confounders were measured and balanced across groups.
2Assesses the non‐response rate of prospective participants.
3Assesses the risk that participants labelled as taking mefloquine (or another antimalarial) actually took something else.
4Assesses the risk that participants whose adverse effects are attributed to mefloquine (or another antimalarial) actually took another drug as well.
5Assesses whether outcome data reasonably complete for most participants and whether intervention status reasonably complete for those in whom it was sought.
6Assesses whether the outcome measure was subjective, and whether participants and outcome assessors were blinded.
7Assesses whether it is clear that all information collected within the study has been reported.
8Assess the risk of bias due to influence by a corporate study sponsor.

'Risk of bias' summary in cohort studies: mefloquine versus doxycycline
1Assesses whether our pre‐defined confounders are measured and balanced across groups.
2Assesses the non‐response rate of prospective participants.
3Assesses the risk that participants labelled as taking mefloquine (or another antimalarial) actually took something else.
4Assesses the risk that participants whose adverse effects are attributed to mefloquine (or another antimalarial) actually took another drug as well.
5Assesses whether outcome data reasonably complete for most participants and whether intervention status reasonably complete for those in whom it was sought.
6Assesses whether the outcome measure was subjective, and whether participants and outcome assessors were blinded.
7Assesses whether it is clear that all information collected within the study has been reported.
8Assesses the risk of bias due to influence by a corporate study sponsor.
'Risk of bias' summary in cohort studies: mefloquine versus atovaquone‐proguanil
1Assesses whether our pre‐defined confounders are measured and balanced across groups.
2Assesses the non‐response rate of prospective participants.
3Assesses the risk that participants labelled as taking mefloquine (or another antimalarial) actually took something else.
4Assesses the risk that participants whose adverse effects are attributed to mefloquine (or another antimalarial) actually took another drug as well.
5Assesses whether outcome data reasonably complete for most participants and whether intervention status reasonably complete for those in whom it was sought.
6Assesses whether the outcome measure was subjective, and whether participants and outcome assessors were blinded.
7Assesses whether it is clear that all information collected within the study has been reported.
8Assesses the risk of bias due to influence by a corporate study sponsor.

'Risk of bias' summary in cohort studies: mefloquine versus chloroquine
1Assesses whether our pre‐defined confounders are measured and balanced across groups.
2Assesses the non‐response rate of prospective participants.
3Assesses the risk that participants labelled as taking mefloquine (or another antimalarial) actually took something else.
4Assesses the risk that participants whose adverse effects are attributed to mefloquine (or another antimalarial) actually took another drug as well.
5Assesses whether outcome data reasonably complete for most participants and whether intervention status reasonably complete for those in whom it was sought.
6Assesses whether the outcome measure was subjective, and whether participants and outcome assessors were blinded.
7Assesses whether it is clear that all information collected within the study has been reported.
8Assesses the risk of bias due to influence by a corporate study sponsor.
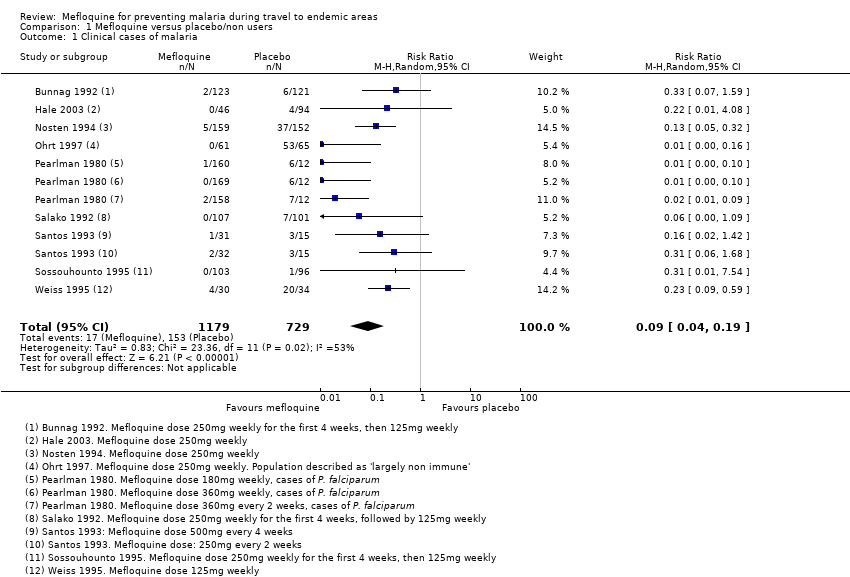
Comparison 1 Mefloquine versus placebo/non users, Outcome 1 Clinical cases of malaria.
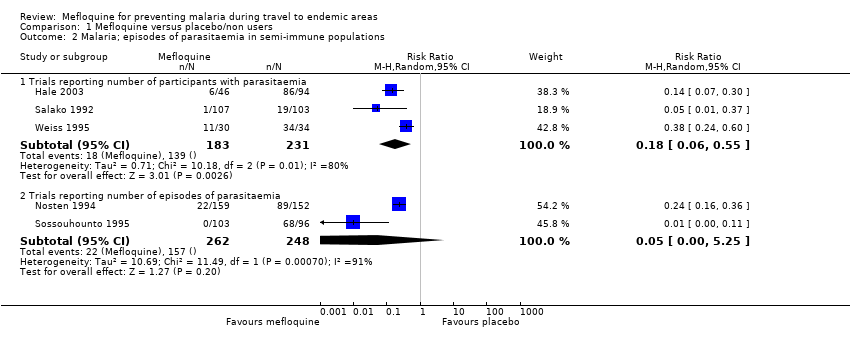
Comparison 1 Mefloquine versus placebo/non users, Outcome 2 Malaria; episodes of parasitaemia in semi‐immune populations.
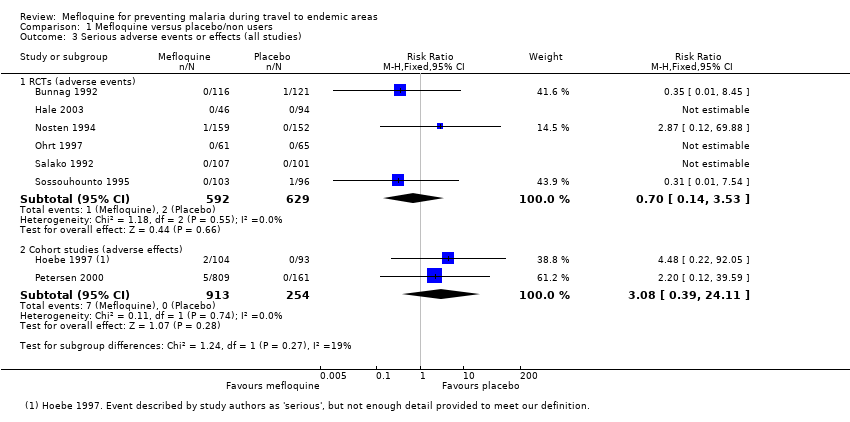
Comparison 1 Mefloquine versus placebo/non users, Outcome 3 Serious adverse events or effects (all studies).
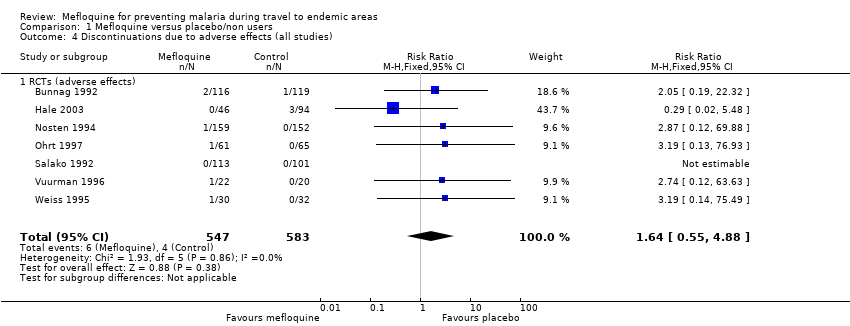
Comparison 1 Mefloquine versus placebo/non users, Outcome 4 Discontinuations due to adverse effects (all studies).
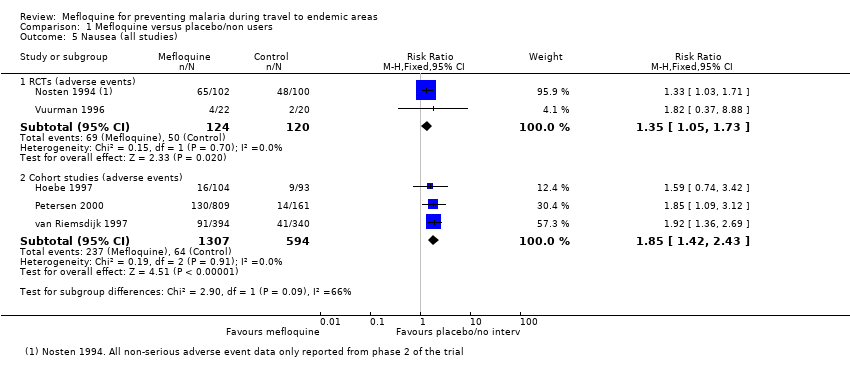
Comparison 1 Mefloquine versus placebo/non users, Outcome 5 Nausea (all studies).
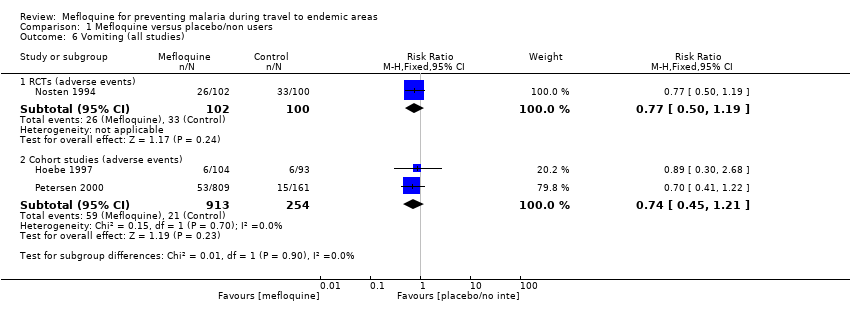
Comparison 1 Mefloquine versus placebo/non users, Outcome 6 Vomiting (all studies).
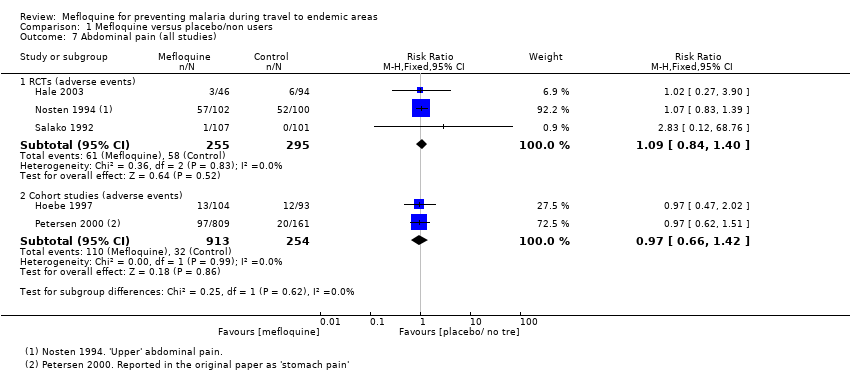
Comparison 1 Mefloquine versus placebo/non users, Outcome 7 Abdominal pain (all studies).

Comparison 1 Mefloquine versus placebo/non users, Outcome 8 Diarrhoea (all studies).
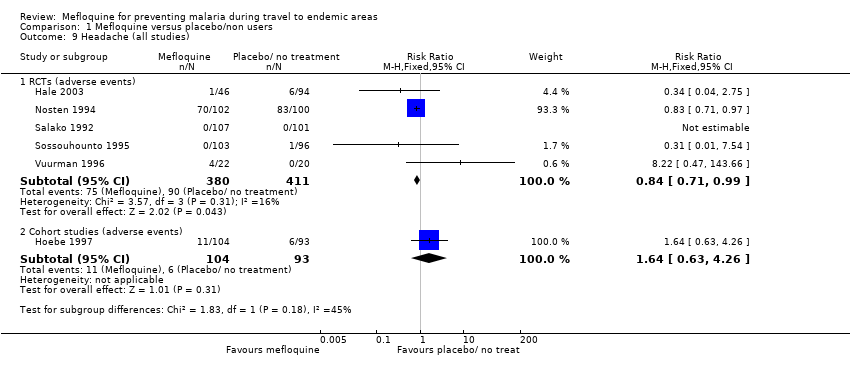
Comparison 1 Mefloquine versus placebo/non users, Outcome 9 Headache (all studies).
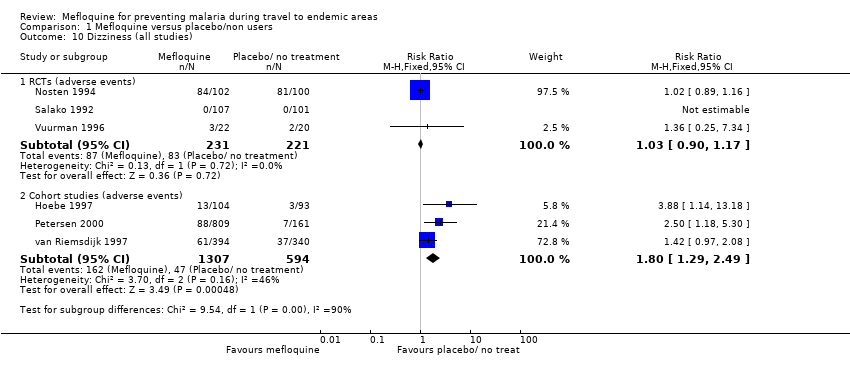
Comparison 1 Mefloquine versus placebo/non users, Outcome 10 Dizziness (all studies).

Comparison 1 Mefloquine versus placebo/non users, Outcome 11 Abnormal dreams (all studies).

Comparison 1 Mefloquine versus placebo/non users, Outcome 12 Insomnia (all studies).

Comparison 1 Mefloquine versus placebo/non users, Outcome 13 Anxiety (all studies).

Comparison 1 Mefloquine versus placebo/non users, Outcome 14 Depressed mood (all studies).
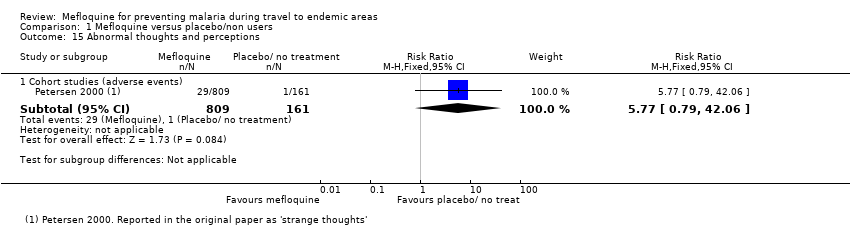
Comparison 1 Mefloquine versus placebo/non users, Outcome 15 Abnormal thoughts and perceptions.
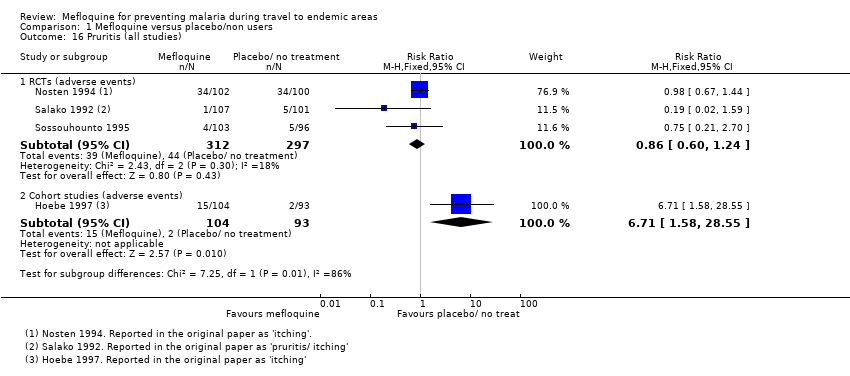
Comparison 1 Mefloquine versus placebo/non users, Outcome 16 Pruritis (all studies).
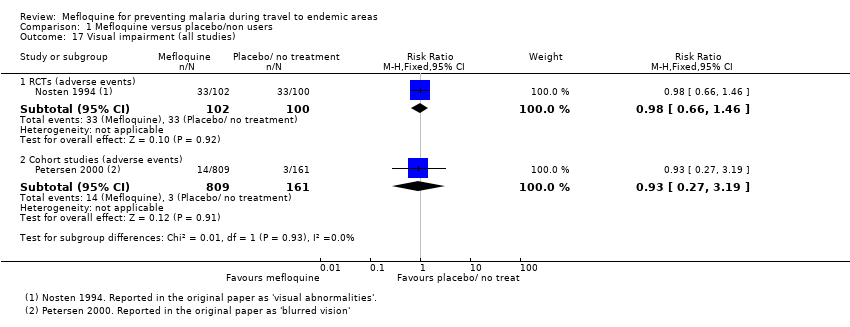
Comparison 1 Mefloquine versus placebo/non users, Outcome 17 Visual impairment (all studies).
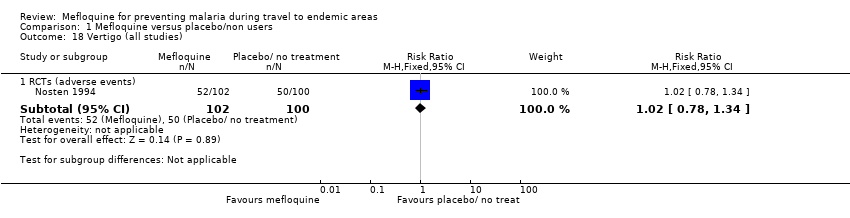
Comparison 1 Mefloquine versus placebo/non users, Outcome 18 Vertigo (all studies).
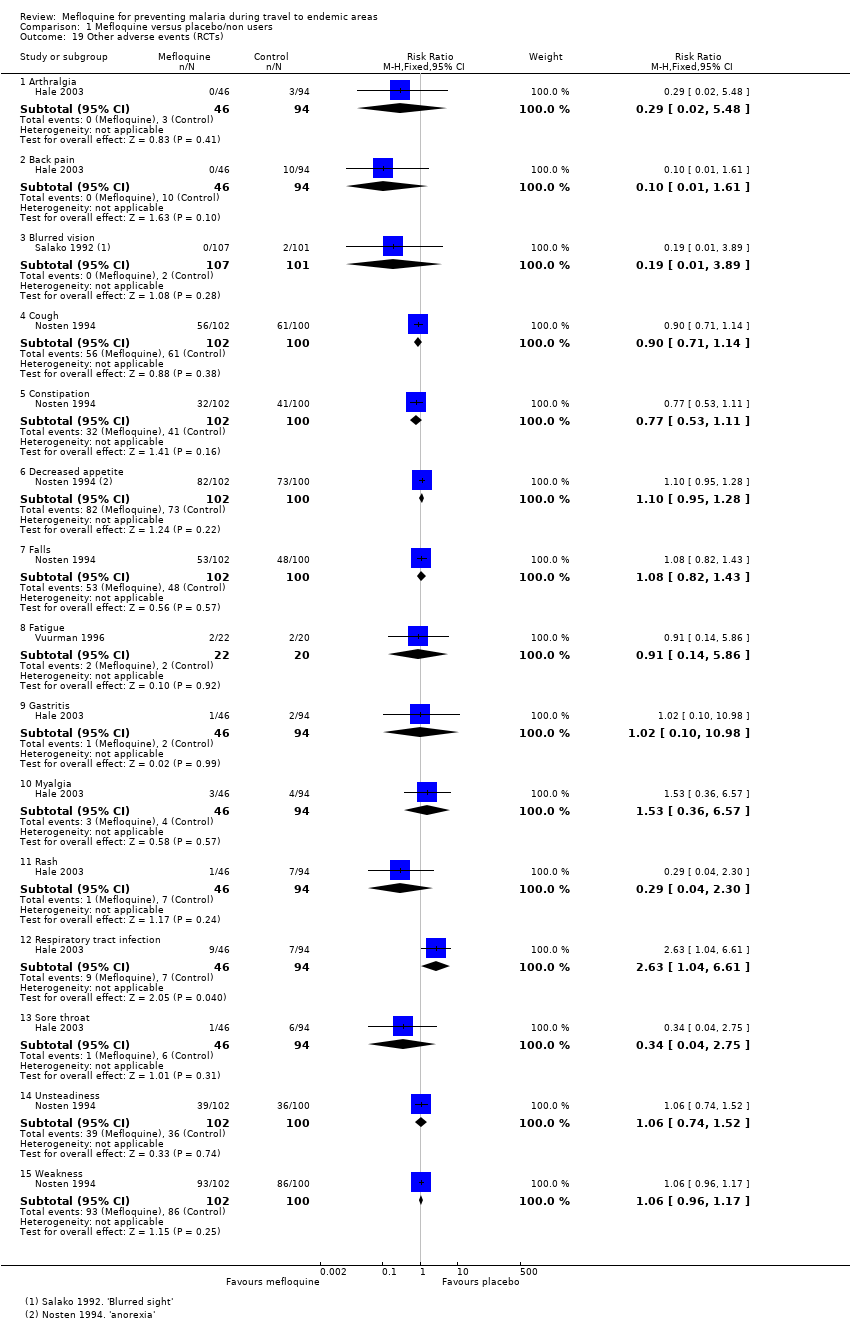
Comparison 1 Mefloquine versus placebo/non users, Outcome 19 Other adverse events (RCTs).
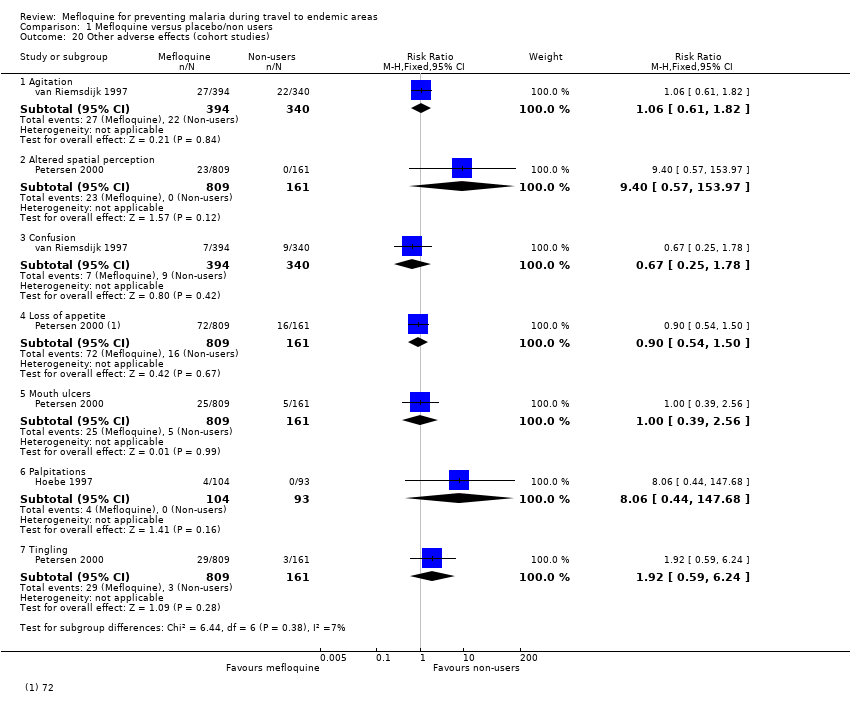
Comparison 1 Mefloquine versus placebo/non users, Outcome 20 Other adverse effects (cohort studies).

Comparison 2 Mefloquine versus doxycycline, Outcome 1 Clinical cases of malaria (RCTs).

Comparison 2 Mefloquine versus doxycycline, Outcome 2 Serious adverse events or effects (all studies).

Comparison 2 Mefloquine versus doxycycline, Outcome 3 Discontinuations due to adverse effects (all studies).

Comparison 2 Mefloquine versus doxycycline, Outcome 4 Nausea (all studies).

Comparison 2 Mefloquine versus doxycycline, Outcome 5 Vomiting (all studies).

Comparison 2 Mefloquine versus doxycycline, Outcome 6 Abdominal pain (all studies).
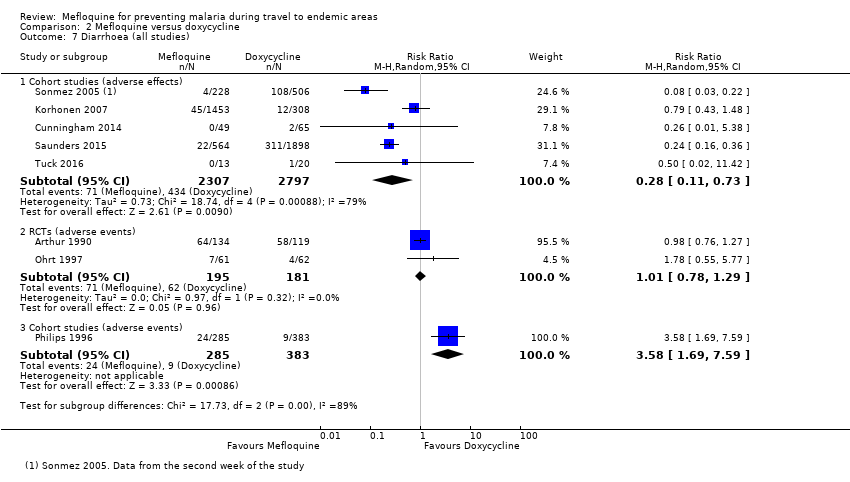
Comparison 2 Mefloquine versus doxycycline, Outcome 7 Diarrhoea (all studies).

Comparison 2 Mefloquine versus doxycycline, Outcome 8 Dyspepsia (all studies).

Comparison 2 Mefloquine versus doxycycline, Outcome 9 Headache (all studies).

Comparison 2 Mefloquine versus doxycycline, Outcome 10 Dizziness (all studies).
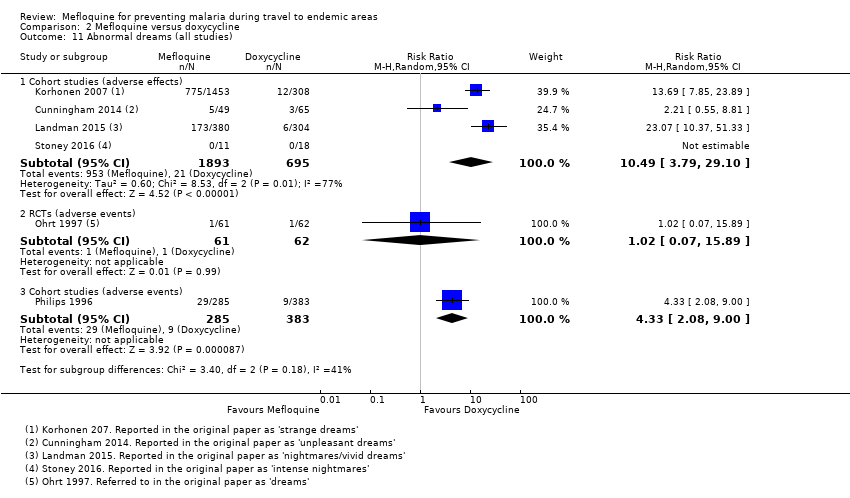
Comparison 2 Mefloquine versus doxycycline, Outcome 11 Abnormal dreams (all studies).

Comparison 2 Mefloquine versus doxycycline, Outcome 12 Insomnia (all studies).
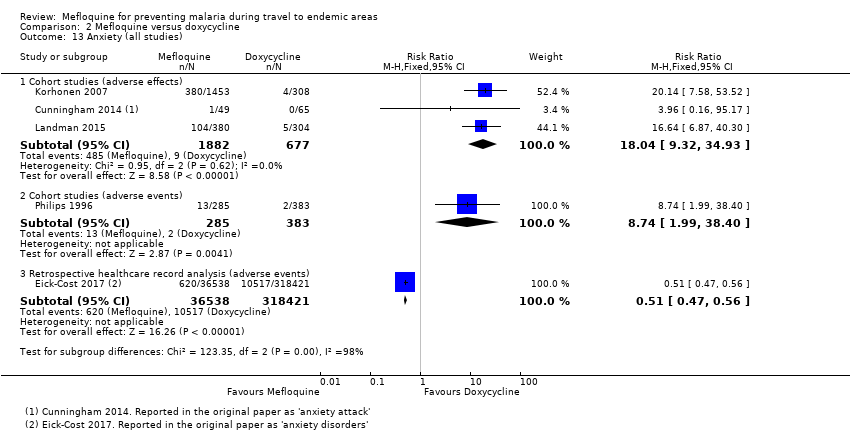
Comparison 2 Mefloquine versus doxycycline, Outcome 13 Anxiety (all studies).

Comparison 2 Mefloquine versus doxycycline, Outcome 14 Depressed mood (all studies).

Comparison 2 Mefloquine versus doxycycline, Outcome 15 Abnormal thoughts and perceptions.
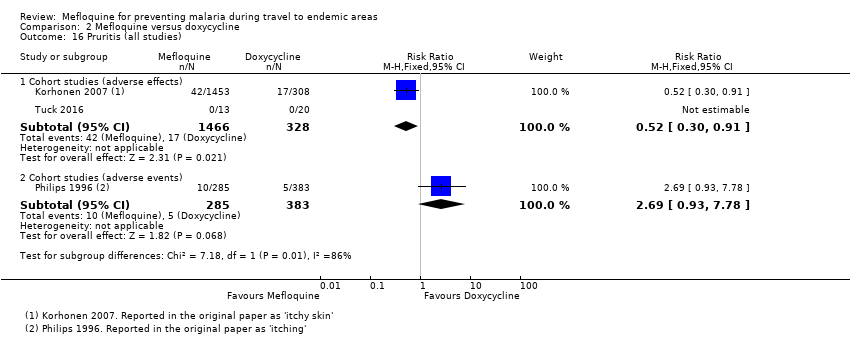
Comparison 2 Mefloquine versus doxycycline, Outcome 16 Pruritis (all studies).

Comparison 2 Mefloquine versus doxycycline, Outcome 17 Photosensitivity (all studies).
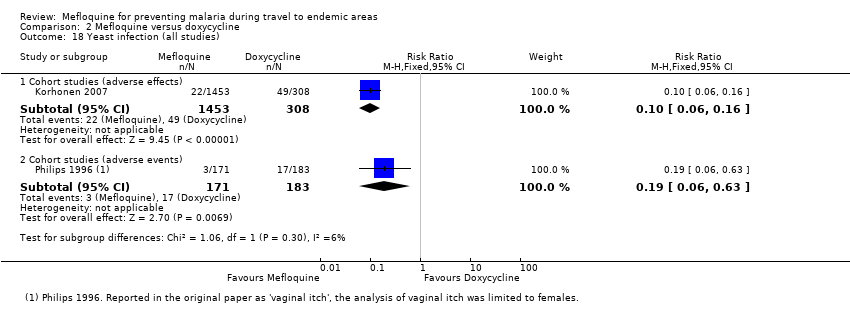
Comparison 2 Mefloquine versus doxycycline, Outcome 18 Yeast infection (all studies).

Comparison 2 Mefloquine versus doxycycline, Outcome 19 Visual impairment (all studies).

Comparison 2 Mefloquine versus doxycycline, Outcome 20 Other adverse effects (cohort studies).
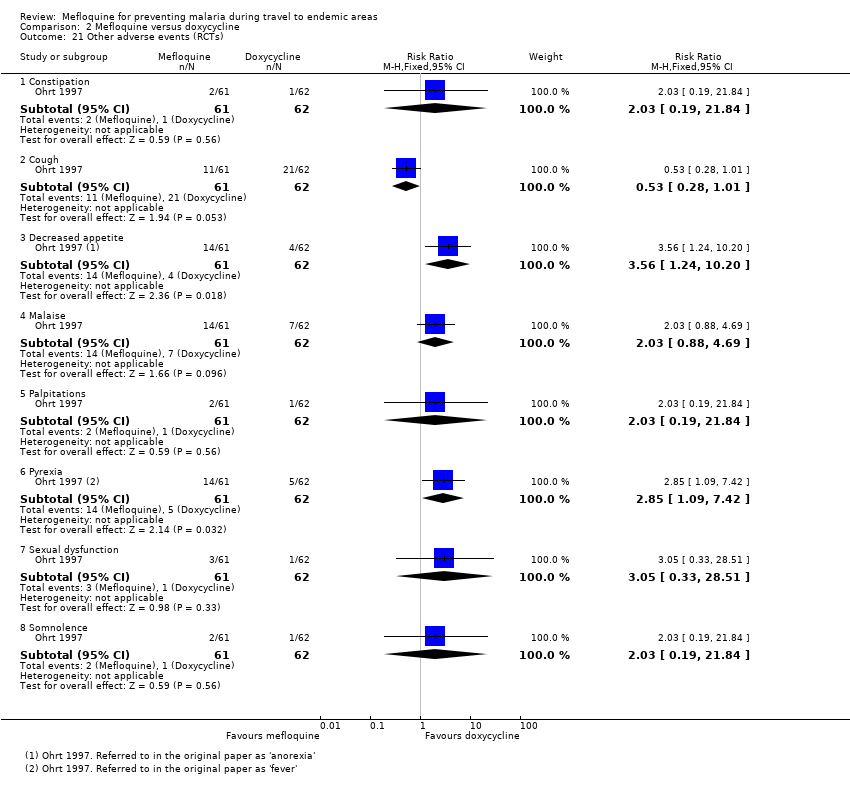
Comparison 2 Mefloquine versus doxycycline, Outcome 21 Other adverse events (RCTs).

Comparison 2 Mefloquine versus doxycycline, Outcome 22 Other adverse events (cohort studies).
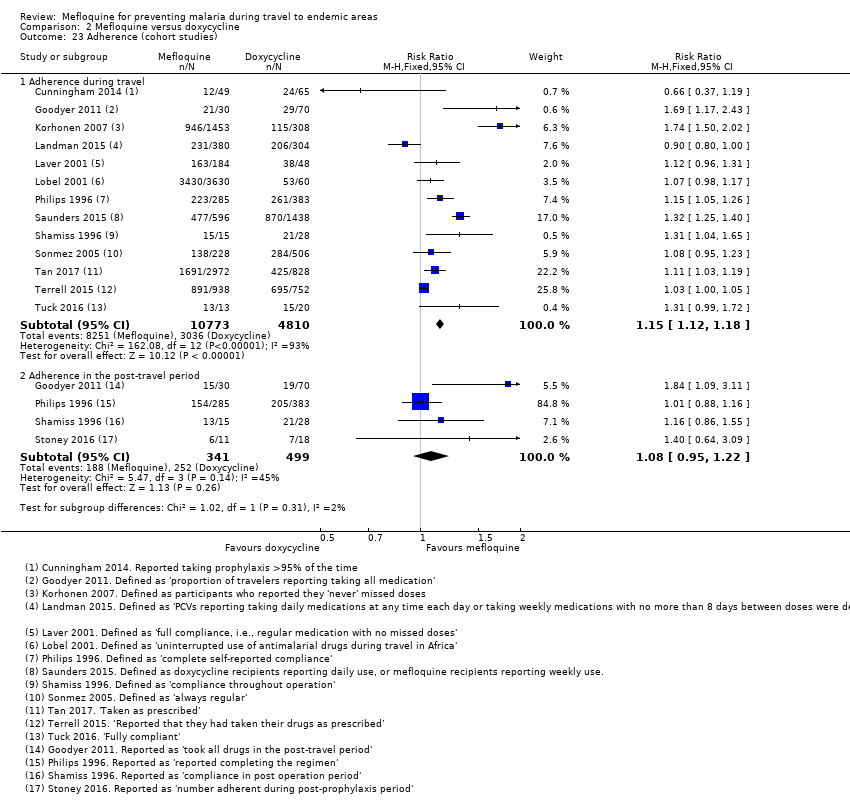
Comparison 2 Mefloquine versus doxycycline, Outcome 23 Adherence (cohort studies).

Comparison 3 Mefloquine versus atovaquone‐proguanil, Outcome 1 Clinical cases of malaria (RCTs).

Comparison 3 Mefloquine versus atovaquone‐proguanil, Outcome 2 Serious adverse events or effects (all studies).
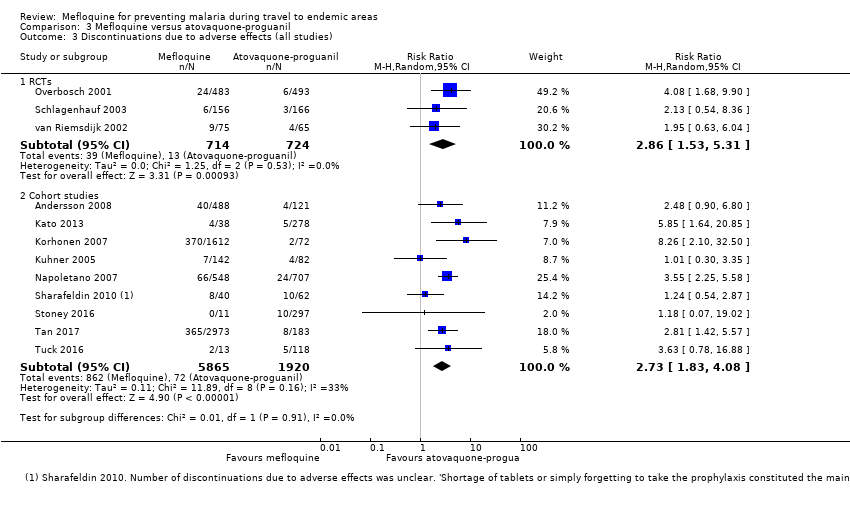
Comparison 3 Mefloquine versus atovaquone‐proguanil, Outcome 3 Discontinuations due to adverse effects (all studies).
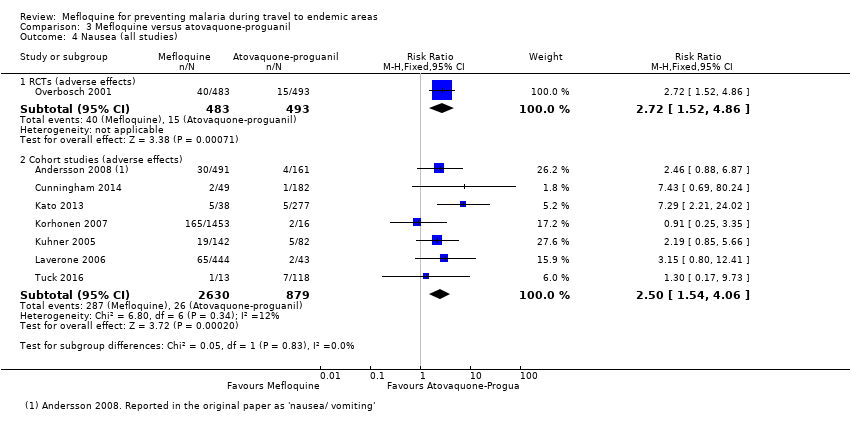
Comparison 3 Mefloquine versus atovaquone‐proguanil, Outcome 4 Nausea (all studies).

Comparison 3 Mefloquine versus atovaquone‐proguanil, Outcome 5 Vomiting (all studies).
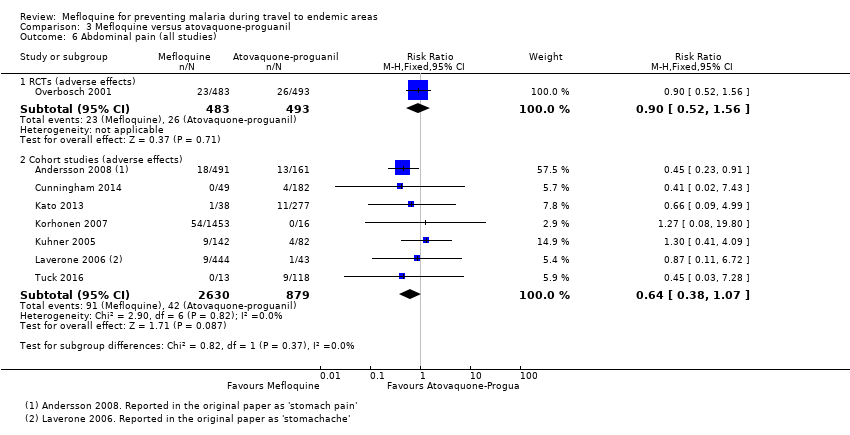
Comparison 3 Mefloquine versus atovaquone‐proguanil, Outcome 6 Abdominal pain (all studies).
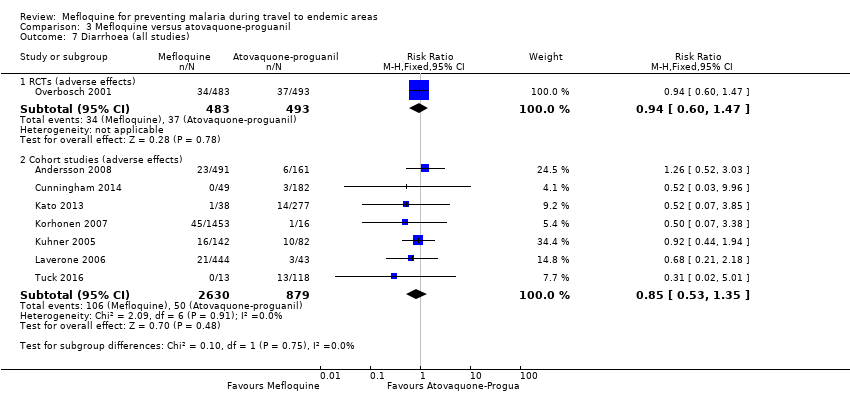
Comparison 3 Mefloquine versus atovaquone‐proguanil, Outcome 7 Diarrhoea (all studies).

Comparison 3 Mefloquine versus atovaquone‐proguanil, Outcome 8 Mouth ulcers (all studies).

Comparison 3 Mefloquine versus atovaquone‐proguanil, Outcome 9 Headache (all studies).
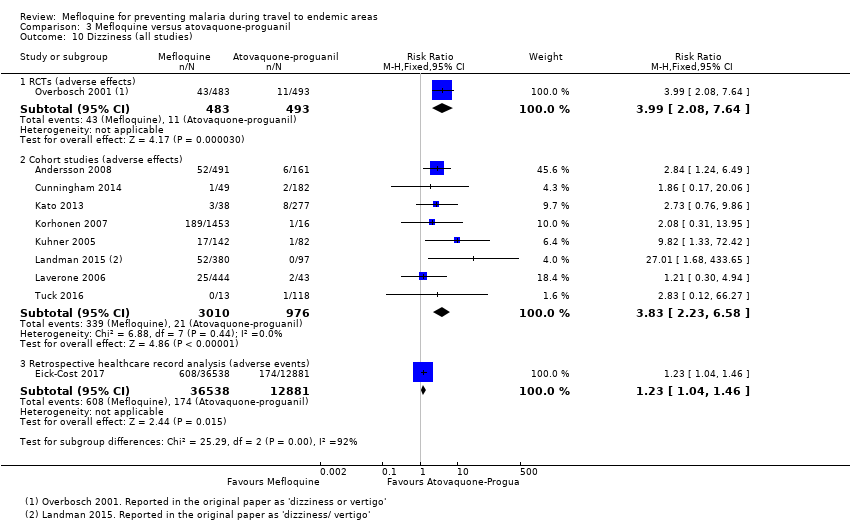
Comparison 3 Mefloquine versus atovaquone‐proguanil, Outcome 10 Dizziness (all studies).
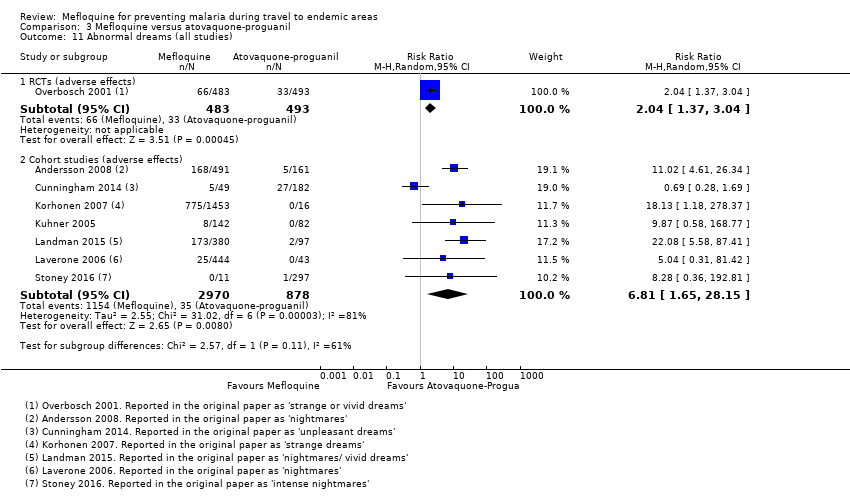
Comparison 3 Mefloquine versus atovaquone‐proguanil, Outcome 11 Abnormal dreams (all studies).

Comparison 3 Mefloquine versus atovaquone‐proguanil, Outcome 12 Insomnia (all studies).

Comparison 3 Mefloquine versus atovaquone‐proguanil, Outcome 13 Anxiety (all studies).
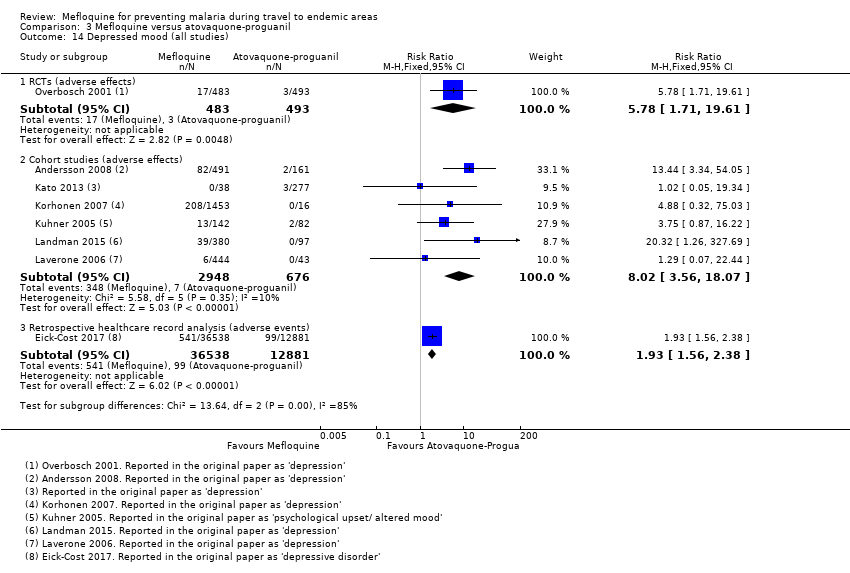
Comparison 3 Mefloquine versus atovaquone‐proguanil, Outcome 14 Depressed mood (all studies).

Comparison 3 Mefloquine versus atovaquone‐proguanil, Outcome 15 Abnormal thoughts and perceptions (all studies).
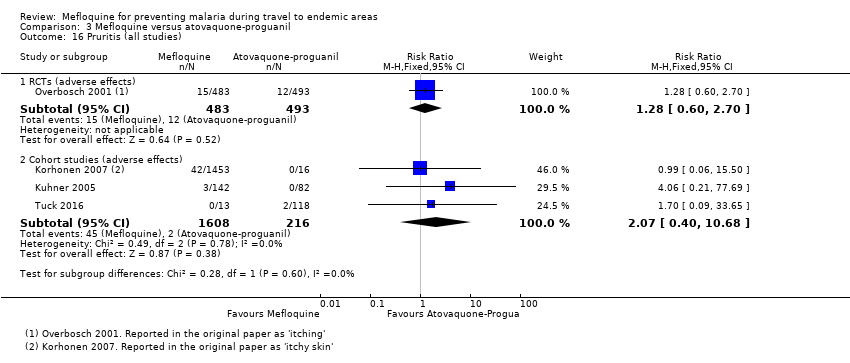
Comparison 3 Mefloquine versus atovaquone‐proguanil, Outcome 16 Pruritis (all studies).
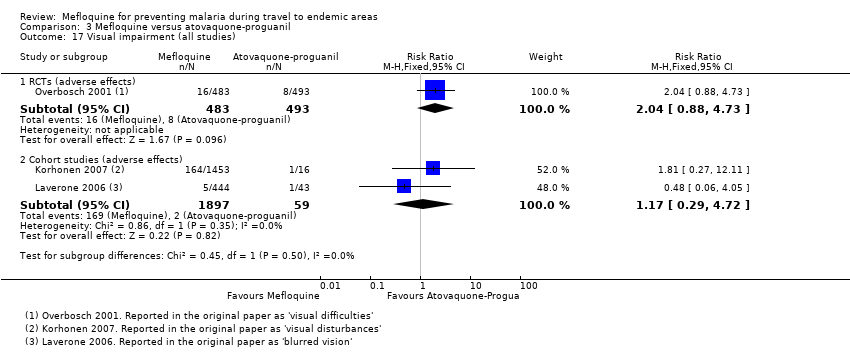
Comparison 3 Mefloquine versus atovaquone‐proguanil, Outcome 17 Visual impairment (all studies).
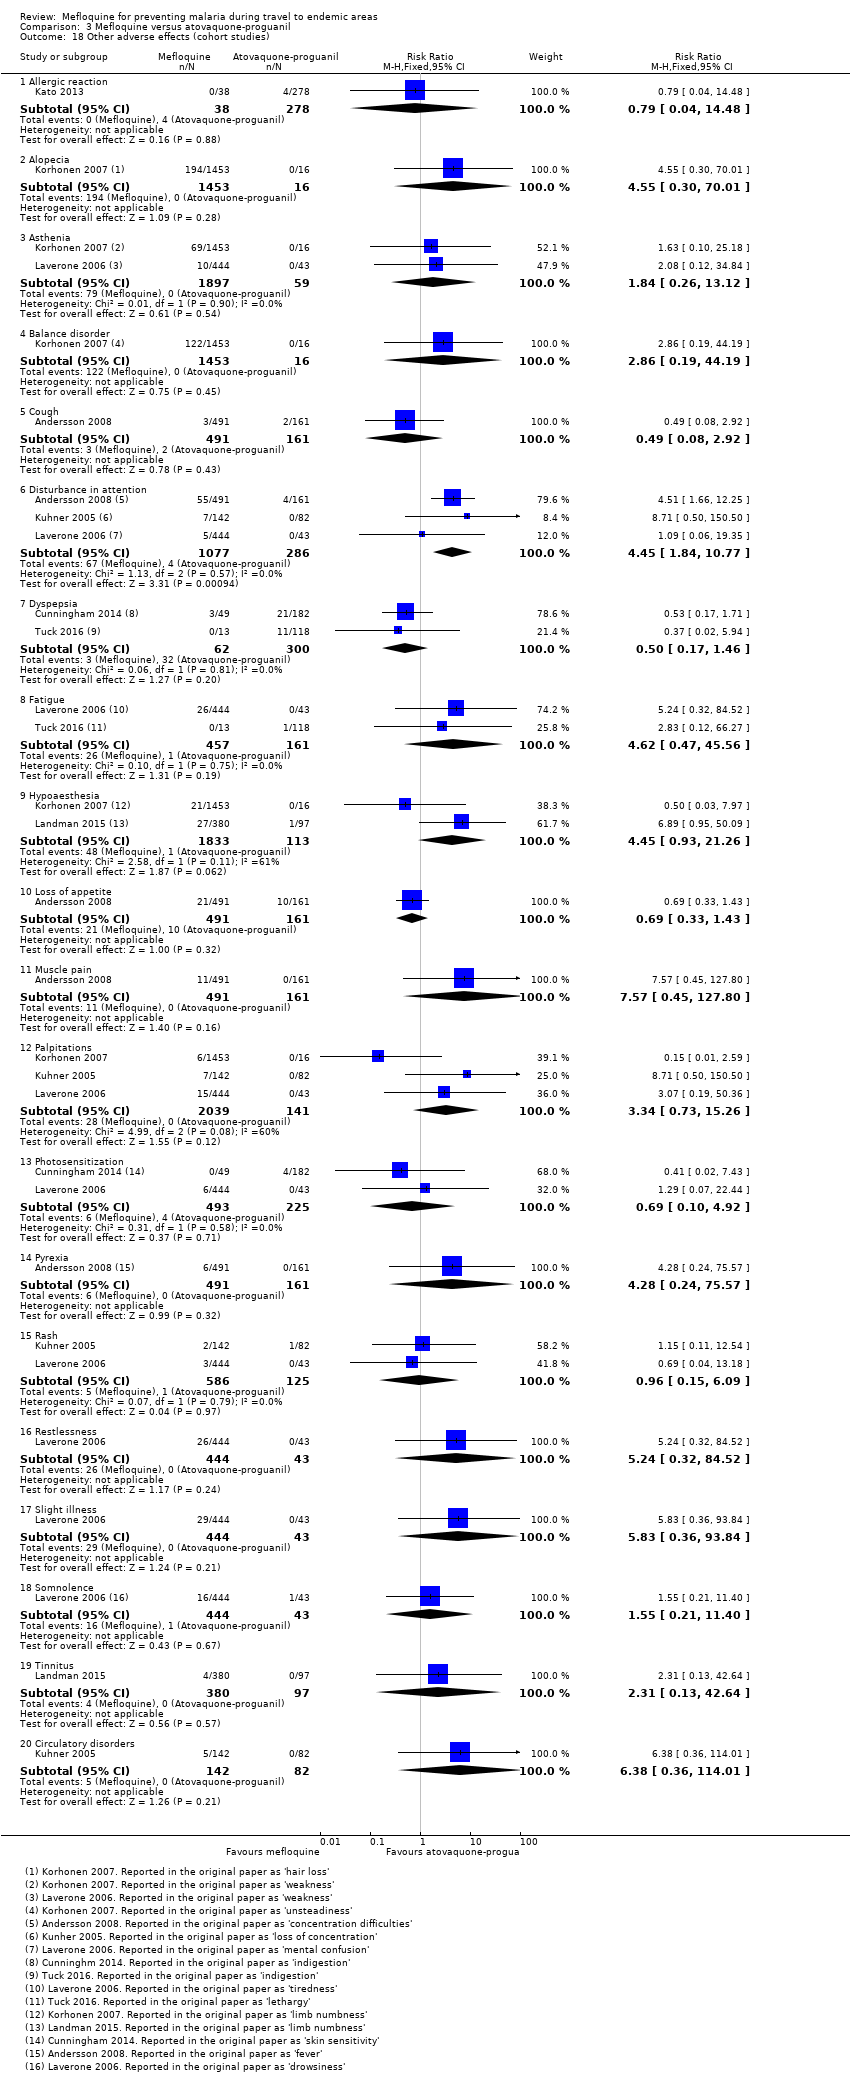
Comparison 3 Mefloquine versus atovaquone‐proguanil, Outcome 18 Other adverse effects (cohort studies).

Comparison 3 Mefloquine versus atovaquone‐proguanil, Outcome 19 Other adverse events (cohort studies).

Comparison 3 Mefloquine versus atovaquone‐proguanil, Outcome 20 Adherence (RCTs).

Comparison 3 Mefloquine versus atovaquone‐proguanil, Outcome 21 Adherence (cohort studies).

Comparison 4 Mefloquine versus chloroquine, Outcome 1 Clinical cases of malaria (RCTs).
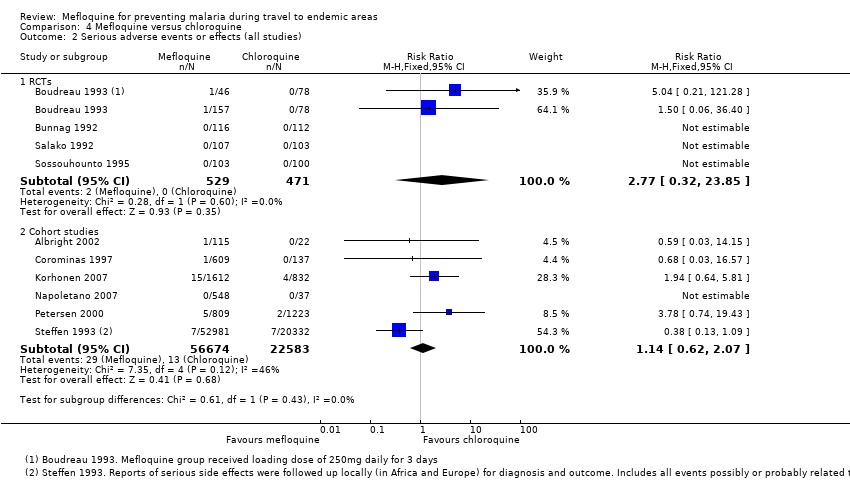
Comparison 4 Mefloquine versus chloroquine, Outcome 2 Serious adverse events or effects (all studies).
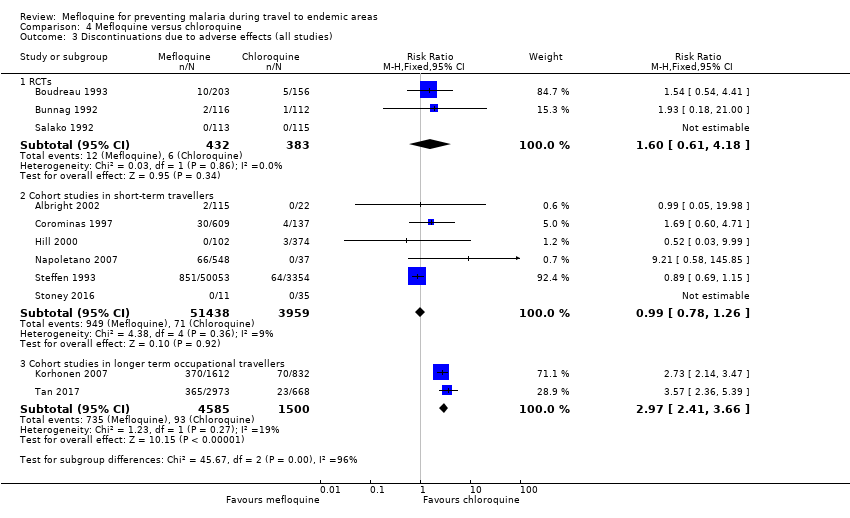
Comparison 4 Mefloquine versus chloroquine, Outcome 3 Discontinuations due to adverse effects (all studies).

Comparison 4 Mefloquine versus chloroquine, Outcome 4 Nausea (all studies).
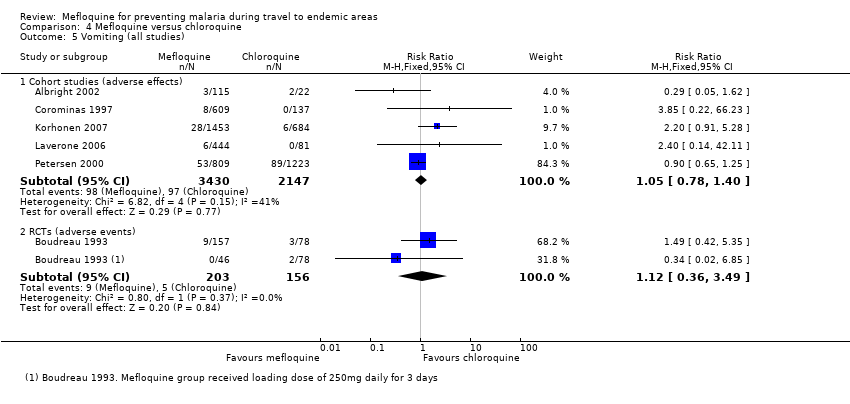
Comparison 4 Mefloquine versus chloroquine, Outcome 5 Vomiting (all studies).

Comparison 4 Mefloquine versus chloroquine, Outcome 6 Abdominal pain (all studies).

Comparison 4 Mefloquine versus chloroquine, Outcome 7 Diarrhoea (all studies).

Comparison 4 Mefloquine versus chloroquine, Outcome 8 Headache (all studies).

Comparison 4 Mefloquine versus chloroquine, Outcome 9 Dizziness (all studies).
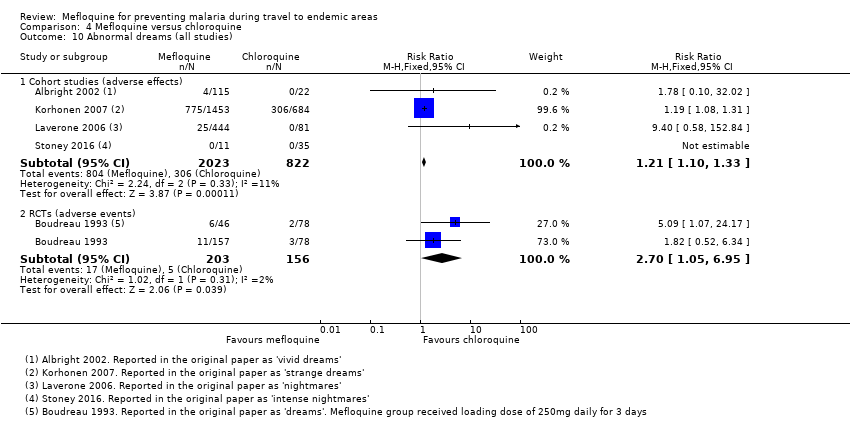
Comparison 4 Mefloquine versus chloroquine, Outcome 10 Abnormal dreams (all studies).

Comparison 4 Mefloquine versus chloroquine, Outcome 11 Insomnia (all studies).

Comparison 4 Mefloquine versus chloroquine, Outcome 12 Anxiety (all studies).

Comparison 4 Mefloquine versus chloroquine, Outcome 13 Depressed mood (all studies).

Comparison 4 Mefloquine versus chloroquine, Outcome 14 Abnormal thoughts and perceptions.
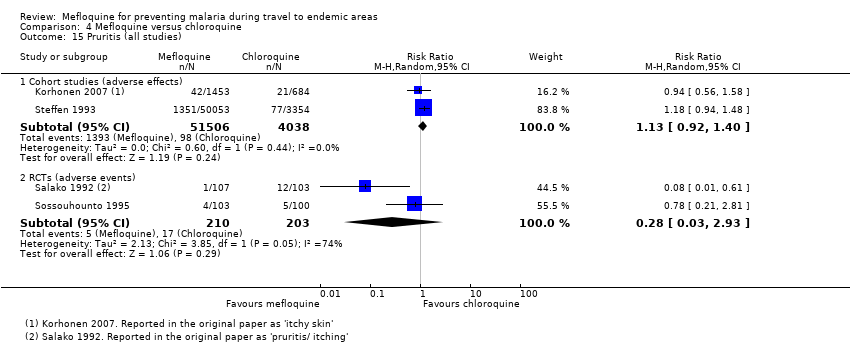
Comparison 4 Mefloquine versus chloroquine, Outcome 15 Pruritis (all studies).

Comparison 4 Mefloquine versus chloroquine, Outcome 16 Visual impairment (all studies).

Comparison 4 Mefloquine versus chloroquine, Outcome 17 Vertigo (all studies).

Comparison 4 Mefloquine versus chloroquine, Outcome 18 Cohort studies in travellers; prespecified adverse effects.

Comparison 4 Mefloquine versus chloroquine, Outcome 19 Other adverse effects (cohort studies).

Comparison 4 Mefloquine versus chloroquine, Outcome 20 Other adverse events (RCTs).

Comparison 4 Mefloquine versus chloroquine, Outcome 21 Pregnancy related outcomes (RCTs).

Comparison 4 Mefloquine versus chloroquine, Outcome 22 Adherence (cohort studies).

Comparison 5 Mefloquine versus currently used regimens; by study design, Outcome 1 Nausea; effects.

Comparison 5 Mefloquine versus currently used regimens; by study design, Outcome 2 Abdominal pain; effects.
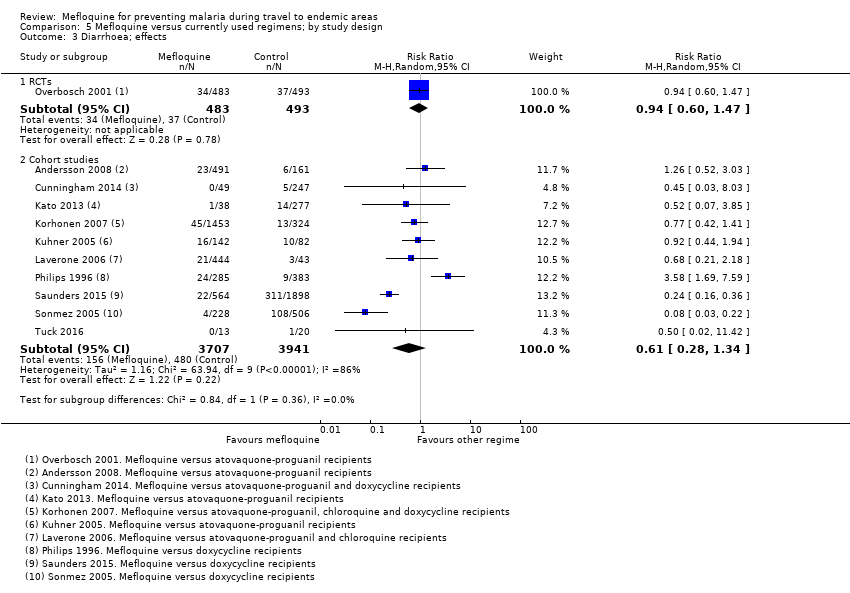
Comparison 5 Mefloquine versus currently used regimens; by study design, Outcome 3 Diarrhoea; effects.

Comparison 5 Mefloquine versus currently used regimens; by study design, Outcome 4 Headache; effects.

Comparison 5 Mefloquine versus currently used regimens; by study design, Outcome 5 Dizziness; effects.
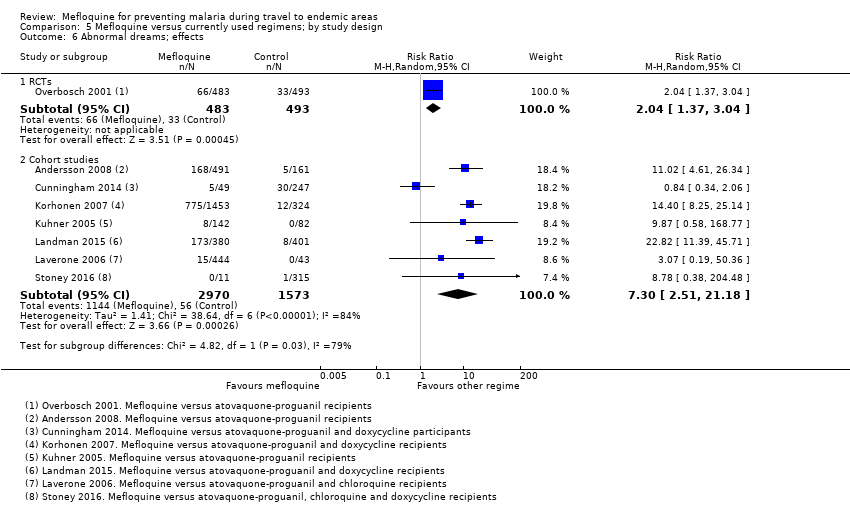
Comparison 5 Mefloquine versus currently used regimens; by study design, Outcome 6 Abnormal dreams; effects.
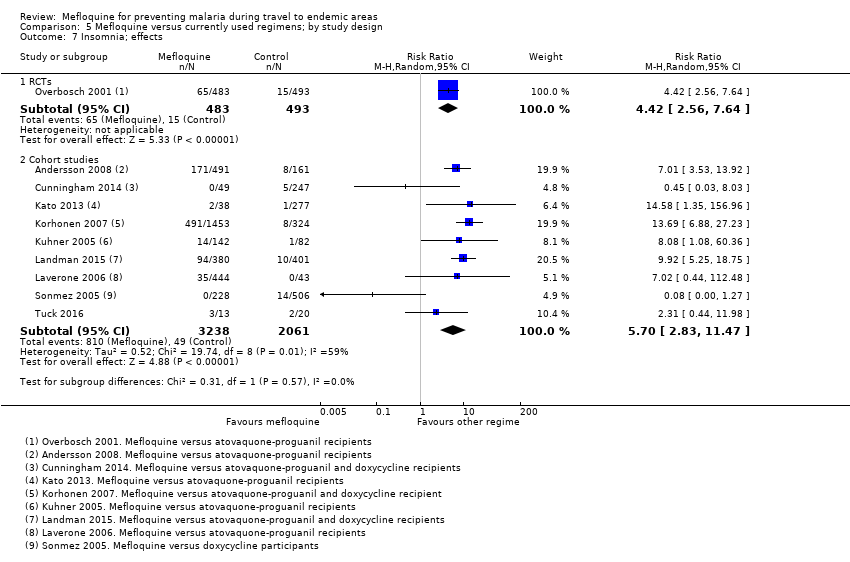
Comparison 5 Mefloquine versus currently used regimens; by study design, Outcome 7 Insomnia; effects.
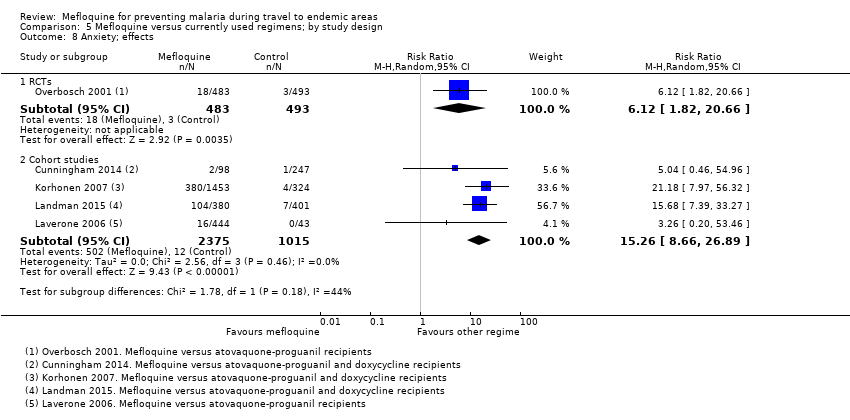
Comparison 5 Mefloquine versus currently used regimens; by study design, Outcome 8 Anxiety; effects.
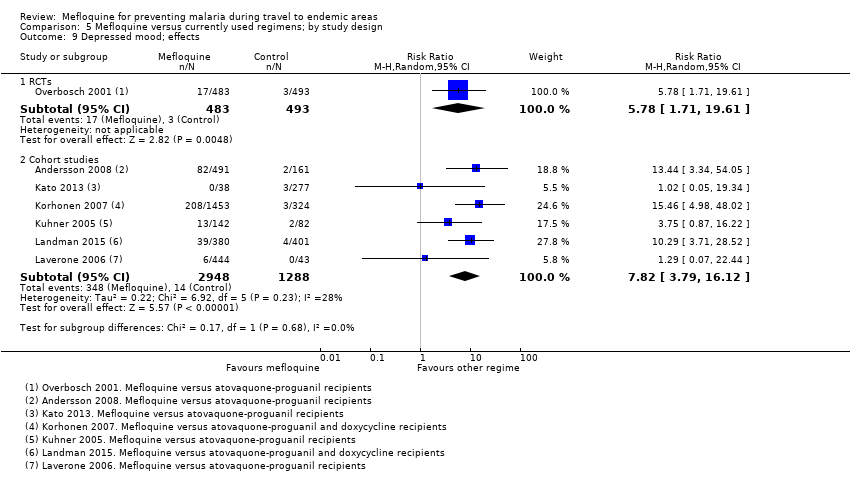
Comparison 5 Mefloquine versus currently used regimens; by study design, Outcome 9 Depressed mood; effects.

Comparison 5 Mefloquine versus currently used regimens; by study design, Outcome 10 Abnormal thoughts or perceptions; effects.
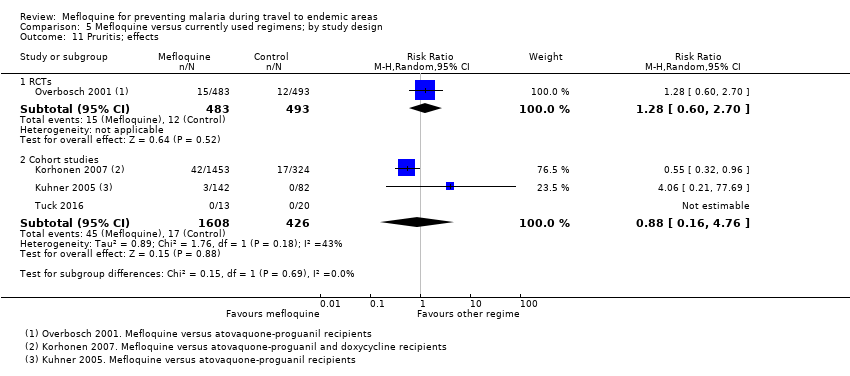
Comparison 5 Mefloquine versus currently used regimens; by study design, Outcome 11 Pruritis; effects.

Comparison 5 Mefloquine versus currently used regimens; by study design, Outcome 12 Visual impairment; effects.

Comparison 5 Mefloquine versus currently used regimens; by study design, Outcome 13 Adherence; during travel.
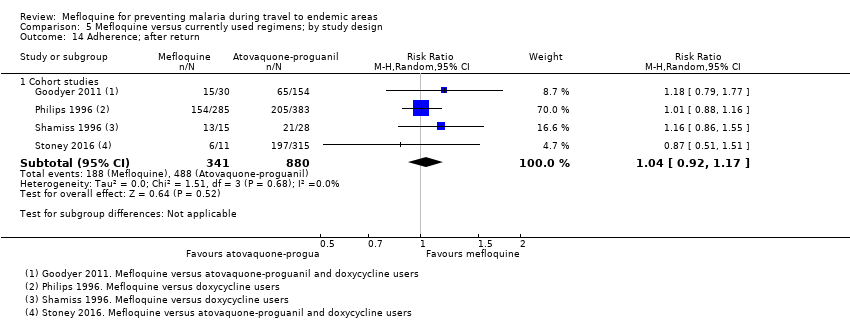
Comparison 5 Mefloquine versus currently used regimens; by study design, Outcome 14 Adherence; after return.
| Mefloquine compared with atovaquone‐proguanil for preventing malaria in travellers | ||||||
| Population: non‐immune adults and children travelling to or living in malaria‐endemic settings Intervention: mefloquine 250 mg weekly Comparison: atovaquone‐proguanil (250 mg atovaquone and 100 mg proguanil hydrochloride) daily Outcome data collection: physicians performed blinded assessment of whether reported symptoms could be related to the study drug | ||||||
| Outcomes | Anticipated absolute effects* | Relative effect | Studies contributing to effect estimate | Additional studies considered in GRADE assessment | Certainty of the evidence | |
| Atovoquone‐proguanil | Mefloquine | |||||
| Clinical malaria | — | — | — | 2 RCTs (1293) | — | ⊕⊕⊝⊝ |
| Serious adverse effects | 0 per 100 | 1 in 100 (0 to 12) | RR 1.40 (0.08 to 23.22) | 4 cohort studies (3693) | 1 RCT (976) | ⊕⊕⊝⊝ |
| Discontinuation of drug due to adverse effects | 2 per 100 | 6 per 100 (3 to 11) | RR 2.86 (1.53 to 5.31) | 3 RCTs (1438) | 7 cohort studies (4498) | ⊕⊕⊕⊕ |
| Abnormal dreams | 7 per 100 | 14 per 100 (10 to 21) | RR 2.04 (1.37 to 3.04) | 1 RCT (976) | 7 cohort studies (3848) | ⊕⊕⊕⊕ |
| Insomnia | 3 per 100 | 13 per 100 (8 to 23) | RR 4.42 (2.56 to 7.64) | 1 RCT (976) | 8 cohort studies (3986) | ⊕⊕⊕⊕ |
| Anxiety | 1 per 100 | 6 per 100 (2 to 21) | RR 6.12 (1.82 to 20.66) | 1 RCT (976) | 4 cohort studies (2664) | ⊕⊕⊕⊝ |
| Depressed mood | 1 per 100 | 6 per 100 (2 to 20) | RR 5.78 (1.71 to 19.61) | 1 RCT (976) | 6 cohort studies (3624) | ⊕⊕⊕⊝ |
| Abnormal thoughts or perceptions | 0 per 100 | 1 per 100 (0 to 4) | RR 1.50 (0.30 to 7.42) | 3 cohort studies (2433) | — | ⊕⊝⊝⊝ |
| Nausea | 3 per 100 | 8 per 100 (5 to 15) | RR 2.72 (1.52 to 4.86) | 1 RCT (976) | 7 cohort studies (3509) | ⊕⊕⊕⊕ |
| Vomiting | 1 per 100 | 1 per 100 (0 to 4) | RR 1.31 (0.49 to 3.50) | 1 RCT (976) | 3 cohort studies (2180) | ⊕⊕⊕⊝ |
| Abdominal pain | 5 per 100 | 5 per 100 (3 to 8) | RR 0.90 (0.52 to 1.56) | 1 RCT (976) | 7 cohort studies (3509) | ⊕⊕⊝⊝ |
| Diarrhoea | 8 per 100 | 8 per 100 (5 to 12) | RR 0.94 (0.60 to 1.47) | 1 RCT (976) | 7 cohort studies (3509) | ⊕⊕⊕⊝ |
| Headache | 4 per 100 | 7 per 100 (4 to 12) | RR 1.72 (0.99 to 2.99) | 1 RCT (976) | 8 cohort studies (4163) | ⊕⊕⊕⊝ |
| Dizziness | 2 per 100 | 8 per 100 (4 to 15) | RR 3.99 (2.08 to 7.64) | 1 RCT (976) | 8 cohort studies (3986) | ⊕⊕⊕⊕ |
| Pruritis | 2 per 100 | 3 per 100 (1 to 5) | RR 1.28 (0.60 to 2.70) | 1 RCT (976) | 3 cohort studies (1824) | ⊕⊕⊕⊝ |
| Visual impairment | 2 per 100 | 4 per 100 (2 to 9) | RR 2.04 (0.88 to 4.73) | 1 RCT (976) | 2 cohort studies (1956) | ⊕⊕⊕⊝ |
| Mouth ulcers | 2 per 100 | 3 per 100 (1 to 6) | RR 1.45 (0.70 to 3.00) | 1 RCT (976) | 2 cohort studies (783) | ⊕⊕⊕⊝ |
| *The assumed risk is the median control group risk across studies unless stated in footnotes. The corresponding risk (and its 95% confidence interval) is based on the assumed risk in the comparison group and the relative effect of the intervention (and its 95% CI). Where the control group risk was 0, we used a value of 0.5 to calculate the corresponding risk in the intervention group. Data from cohort studies were used when data from RCTs were unavailable. 'Summary of findings' tables are usually limited to seven outcomes. For adverse effects this problematic, as there are many, and to include some and not others risks selective reporting. We have therefore included all prespecified outcomes in the table. | ||||||
| GRADE Working Group grades of evidence | ||||||
| 1No serious risk of bias: the RCTs were generally at low risk of bias but two of three were sponsored by the manufacturer of one of the study drugs. All cohort studies had methodological problems which could introduce confounding or bias. However, as the GRADE approach automatically downgrades certainty by two levels for non‐randomized studies, we did not downgrade further. | ||||||
| Mefloquine compared with doxycycline for preventing malaria in travellers | ||||||
| Population: Non‐immune adults and children travelling to malaria‐endemic settings Intervention: Mefloquine 250 mg weekly Comparison: Doxycycline 100 mg daily Outcome data collection: Self‐reported symptoms experienced whilst taking prophylaxis (adverse events) | ||||||
| Outcomes | Anticipated absolute effects* (95% CI) | Relative effect | Studies contributing to effect estimate | Additional studies considered in GRADE assessment | Certainty of the evidence | |
| Doxycycline | Mefloquine | |||||
| Clinical malaria | 1 per 100 | 1 per 100 (0 to 5) | RR 1.35 | 4 RCTs (744) | — | ⊕⊕⊝⊝ low1,2,3,4 |
| Serious adverse effects | 6 per 10005 | 9 per 1000 (1 to 61) | RR 1.53 (0.23 to 10.24) | 3 cohort studies (3722) | 3 RCTs, 1 cohort study (682; 3772) | ⊕⊝⊝⊝ |
| Discontinuations due to adverse effects | 2 per 100 | 2 per 100 (1 to 6) | RR 1.08 (0.41 to 2.87) | 4 RCTs (763) | 10 cohort studies (10,165) | ⊕⊕⊝⊝ low1,3,7,8 |
| Abnormal dreams | 3 per 100 | 31 per 100 (11 to 87) | RR 10.49 (3.79 to 29.10) | 4 cohort studies (2588) | 1 RCT, 1 cohort study (123; 688) | ⊕⊝⊝⊝ very low2,6,9,10 |
| Insomnia | 3 per 100 | 12 per 100 (4 to 43) | RR 4.14 (1.19 to 14.44) | 4 cohort studies (3212) | 1 RCT, 2 cohort studies (123; 355,627) | ⊕⊝⊝⊝ very low6,9,10,11 |
| Anxiety | 1 per 100 | 18 per 100 (9 to 35) | RR 18.04 (9.32 to 34.93) | 3 cohort studies (2559) | 2 cohort studies (355,627) | ⊕⊝⊝⊝ very low6,9,10,11 |
| Depressed mood | 1 per 100 | 11 per 100 (5 to 25) | RR 11.43 (5.21 to 25.07) | 2 cohort studies (2445) | 3 cohort studies (430,006) | ⊕⊝⊝⊝ very low6,9,10,11 |
| Abnormal thoughts or perceptions | 0 per 100 | 3 per 100 (0 to 24) | RR 6.60 (0.92 to 47.20) | 2 cohort studies (2445) | 2 cohort studies (376,024) | ⊕⊝⊝⊝ very low6,9,10,11 |
| Nausea | 8 per 100 | 3 per 100 (2 to 4) | RR 0.37 (0.30 to 0.45) | 5 cohort studies (2683) | 1 RCT, 1 cohort study (123; 668) | ⊕⊝⊝⊝ very low3,6,10,11 |
| Vomiting | 5 per 100 | 1 per 100 (1 to 1) | RR 0.18 (0.12 to 0.27) | 4 cohort studies (5071) | 1 RCT (123) | ⊕⊝⊝⊝ very low3,6,10,11 |
| Abdominal pain | 15 per 100 | 5 per 100 (1 to 16) | RR 0.30 (0.09 to 1.07) | 3 cohort studies (2536) | 1 RCT, 1 cohort (123; 668) | ⊕⊝⊝⊝ very low6,7,9,11 |
| Diarrhoea | 5 per 100 | 1 per 100 (1 to 4) | RR 0.28 (0.11 to 0.73) | 5 cohort studies (5104) | 2 RCTs; 1 cohort study (376; 668) | ⊕⊝⊝⊝ very low3,6,10,11 |
| Dyspepsia | 14 per 100 | 4 per 100 (1 to 10) | RR 0.26 (0.09 to 0.74) | 5 cohort studies (5104) | — | ⊕⊝⊝⊝ low2,3,6,10 |
| Headache | 2 per 100 | 2 per 100 (1 to 6) | RR 1.21 (0.50 to 2.92) | 5 cohort studies (3320) | 1 RCT, 1 cohort study (123; 688) | ⊕⊝⊝⊝ very low3,6,7,11 |
| Dizziness | 1 per 100 | 3 per 100 (1 to 14) | RR 3.49 (0.88 to 13.75) | 5 cohort studies (2633) | 1 RCT, 2 cohort studies (123; 355,627) | ⊕⊝⊝⊝ very low3,6,7,11 |
| Visual impairment | 3 per 100 | 7 per 100 (4 to 12) | RR 2.37 (1.41 to 3.99) | 2 cohort studies (1875) | — | ⊕⊝⊝⊝ very low2,6,7,9 |
| Pruritis | 3 per 100 | 2 per 100 (1 to 3) | RR 0.52 (0.30 to 0.91) | 2 cohort studies (1794) | 1 cohort study (688) | ⊕⊝⊝⊝ very low6,9,10,11 |
| Photosensitivity | 19 per 100 | 2 per 100 (1 to 2) | RR 0.08 (0.05 to 0.11) | 2 cohort studies (1875) | 1 cohort study (688) | ⊕⊝⊝⊝ very low2,6,9,10 |
| Vaginal thrush | 16 per 100 | 2 per 100 (1 to 3) | RR 0.10 (0.06 to 0.16) | 1 cohort study (1761) | 1 cohort study (354) | ⊕⊝⊝⊝ very low2,6,9,10 |
| *The assumed risk is the median control group risk across cohort studies unless stated in footnotes. The corresponding risk (and its 95% confidence interval) is based on the assumed risk in the comparison group and the relative effect of the intervention (and its 95% CI). Where the control group risk was 0, we used a value of 0.5 to calculate the corresponding risk in the intervention group. Where no RCTs including short‐term travellers reported on our prespecified adverse outcomes, we included information from cohort studies as our primary analysis. 'Summary of findings' tables are usually limited to seven outcomes. For adverse effects this problematic, as there are many, and to include some and not others risks selective reporting. We have therefore included all prespecified outcomes in the table. | ||||||
| GRADE Working Group grades of evidence | ||||||
| 1No serious risk of bias: none of the RCTs adequately described methods of random sequence generation or allocation concealment, However, given that so few events occurred in these trials, it is unlikely to have introduced bias. | ||||||
| Bias | Authors' judgement | Support for judgement |
| Confounding | Low risk Moderate risk Serious risk Critical risk No information | We used the following criteria: Low risk: identified confounders were measured and were balanced across groups (age, sex, destination and duration of travel) Moderate risk: identified confounders were measured and not balanced across groups, or several confounders had not been measured or not reported across groups Serious risk: a critical confounder has been measured and is not balanced across groups |
| Selection of participants into the study | Low risk Moderate risk Serious risk Critical risk No information | We assessed whether selection into the study was unrelated to intervention or unrelated to outcome, and whether start of intervention and start of follow up coincided for most subjects. Non‐responder bias at the point of selection was considered here for cohort studies. We used the following cut offs for non‐response rate: low risk < 10%, moderate risk 10% to 20%, serious risk > 20%. |
| Measurement of interventions | Low risk Moderate risk Serious risk Critical risk No information | We used the following criteria: Low risk: the prescription was provided by a travel clinic which also performed the study, and discontinuations were recorded and reported, or all participants were issued with their medication e.g. soldiers or participants were asked to self‐report which medication they took whilst they were taking it. Moderate risk: the prescription was provided by a travel clinic which also performed the study but no information regarding switches and discontinuations was available or patients are asked to self‐report which prophylaxis they took shortly after they finished taking it. Serious risk: Participants were asked to self‐report which prophylaxis they took a long time after they finished taking it. |
| Departures from intended interventions | Low risk Moderate risk Serious risk Critical risk No information | We assessed whether switches between interventions of interest were available. We assessed whether discontinuations and switches between prophylactic regimens had been recorded and reported. |
| Missing data | Low risk Moderate risk Serious risk Critical risk No information | We assessed whether outcome data was reasonably complete for most participants. We recorded missing data for included participants e.g. loss to follow up rates and treatment withdrawals. |
| Measurement of outcomes | Low risk Moderate risk Serious risk Critical risk No information | We assessed whether the outcome measure was objective or subjective. We assessed whether participants or study personnel were blinded to the intervention received. We assessed whether the methods of outcome assessment were comparable across intervention groups. |
| Selection of the reported result | Low risk Moderate risk Serious risk Critical risk No information | We used the following criteria: Low risk: If the questionnaire was provided in full, or it was clear what was asked within it. Moderate risk: If it is unclear which questions are asked, or information was provided on aggregate. Serious risk: If data captured within the questionnaire was clearly missing. |
| Other | Low risk Moderate risk Serious risk Critical risk No information | We reported the study sponsor. We classified the analysis of studies sponsored by pharmaceutical companies as independent of the sponsor when it was clearly stated that the sponsor had no input to the trial analysis. |
| Adapted from Higgins 2011 and ACROBAT‐NSRI tool | ||
| Criterion | Assessment | Explanation |
| On conduct | ||
| Were harms pre‐defined using standardised or precise definitions? | Adequate Inadequate Unclear | We classified as 'adequate' if the study reported explicit definitions for adverse events and effects that allow for reproducible ascertainment e.g. what adverse events were being investigated and what constituted an “event”, what was defined as a serious or severe adverse event. |
| Was ascertainment technique adequately described? | Adequate Inadequate Unclear | We classified as 'adequate' if the study reported methods used to ascertain complications, including who ascertained, timing, and methods used. |
| Was monitoring active or passive? | Active Passive Unclear | We classified monitoring as 'active' when authors reviewed participants at set time points during treatment and enquired about symptoms. |
| Was data collection prospective or retrospective? | Prospective Retrospective Unclear | We classified as ‘prospective’ if data collection occurred during treatment, or ‘retrospective’ if data collection occurred following treatment. |
| For laboratory investigations or other tests | ||
| Was the number and timing of tests adequate? | Adequate Inadequate Unclear | We classified the number and timing of tests as 'adequate', when tests were taken at baseline and at least one time point during prophylaxis. |
| Adapted from Bukiwra 2014 | ||
| Study ID | Participants (immune status) | Number of randomised participants | Mefloquine dose | Drug comparisons of interest | Duration of exposure to malaria | Country of malaria exposure | Local drug resistance |
| Thai male adults (presumed semi‐immune) | 605 | 250 mg weekly for first 4 weeks, then 125 mg weekly | Placebo | 24 weeks (trial duration) | Thailand | Chloroquine, sulphadoxine‐pyrimethamine and quinine resistance | |
| Pregnant women from the Thai‐Burma border (presumed semi‐immune) | 339 | 250 mg weekly for first 4 weeks, then 125 mg weekly until delivery | Placebo | Various in endemic area (monitored until delivery) | Thai‐Burma border | Not mentioned | |
| Thai residents aged 10 to 60 years (semi‐immune) | 990 | 180 mg tablet weekly, 360 mg tablet weekly, 360 mg every 2 weeks with appropriate adjustments for children | Placebo | 26 weeks | Thailand | Chloroquine resistant Plasmodium falciparum | |
| Brazilian civilians and soldiers aged 12 to 55 years (semi‐immune) | 128 | 500 mg every 4 weeks, 250mg every 2 weeks | Placebo | 17 weeks | Brazil | P falciparum resistant to chloroquine and “high prevalence of multiresistant Plasmodium falciparum transmission” | |
| Ivory Coast adult males (semi‐immune) | 500 | 250 mg weekly for first 4 weeks, then 125 mg weekly | Placebo | 20 weeks | Ivory C oast | Not mentioned | |
| Indonesian soldiers ('largely' non‐immune) | 204 | 250 mg weekly | Placebo, doxycycline | 'approximately 13 weeks' | Indonesia | Sulfadoxine‐pyrimethamine and chloroquine resistance | |
| Kenyan children (semi‐immune) | 169 | 125 mg weekly | Placebo (multivitamin), doxycycline, primaquine | 11 weeks | Kenya | Not mentioned | |
| Nigerian adult males (semi‐immune) | 567 | 250 mg weekly for first 4 weeks, then 125 mg weekly | Placebo, chloroquine | 24 weeks (trial duration) | Nigeria | "...at the time of the trial, chloroquine resistance was not a problem" | |
| Ghanain adults (semi‐immune) | 530 | 250 mg weekly | Placebo | 12 weeks | Ghana | Not mentioned | |
| USA soldiers (non‐immune) | 270 | 250 mg weekly | Doxycycline | 8 weeks | Thailand | Local chloroquine resistance | |
| Thai adult males (semi‐immune) | 501 | 500 mg fortnightly | Chloroquine | 14 weeks (trial duration) | Cambodia | Local chloroquine resistance | |
| Pregnant Malawian residents (semi‐immune) | 4220 | 250 mg weekly | Chloroquine | Various in endemic area (monitored until delivery) | Malawi | P falciparum resistant to chloroquine, documented sensitivity of P falciparum to mefloquine |
| Study ID | Participants | Number enrolled | Method of adverse event monitoring | Exclusions for psychiatric adverse effects | Trial duration | Source of funding |
| RCTs | ||||||
| Thai male adults | 605 | Interview with study personnel | None | 24 weeks | Roche | |
| Australian adults who did not travel | 106 | Daily self‐reported diary | Past history of psychiatric conditions | 7 weeks | Roche | |
| Ghanain adults | 530 | Interview with study personnel | History of neuropsychiatric illness | 12 weeks | USA Army | |
| Pregnant women, Thai‐Burma border | 339 | Phase 1: weekly symptom questionnaire. Babies were assessed at birth and at 3, 6, 12, and 24 months. Phase 2: weekly symptom questionnaire. Babies were assessed at birth and at 2 and 9 months | None | Various | Government funding | |
| Indonesian soldiers | 204 | Two symptom questionnaires. Daily interview with study personnel | History of underlying illness | 13 weeks | Roche, Pfizer, USA Army | |
| Thai residents aged 10 to 60 years | 990 | Weekly sick call by study personnel | None | 26 weeks | Not mentioned | |
| Israeli adults who did not travel | 90 | Self‐reporting diary | History of depression | 48 hours | Mepha Ltd | |
| Nigerian adult males | 567 | Interview with study personnel | None | 24 weeks | Not mentioned | |
| Brazilian civilians and soldiers aged 12 to 55 | 128 | Interview w ith study personnel | None | 17 weeks | Roche | |
| Swissair trainee pilots who did not travel | 23 | Interview with study personnel | Psychosis or severe depression | 4 weeks | Roche | |
| Ivory C oast adult males | 500 | Access to the village health centre | None | 20 weeks | Not mentioned | |
| Dutch adult who did not travel | 42 | Interview with study personnel | H istory of any serious psychiatric disorder; evidence of drug or alcohol abuse | 30 days | Roche | |
| Kenyan children | 169 | Interview with study personnel | None | 4 months | USA Army | |
| Cohort studies | ||||||
| Participants | Number enrolled | Method of adverse event monitoring | Factors influencing drug allocation | Duration of travel | Source of funding | |
| Danish travellers | 300 | Telephone interview | Allocation based on guidelines and patient preference | Mean 3 weeks, range 1 to 9 weeks | Not mentioned | |
| Danish travellers | 4154 | Participant self‐reported questionnaire | Allocation based on guidelines and patient preference | Various, not specified | Not mentioned | |
| Swedish travellers | 491 | Participant self‐reported questionnaire | Allocation based on guidelines and patient preference | " Most", range 2 to 4 weeks | Not mentioned | |
| Danish travellers | 1501 | Participant self‐reported questionnaire | Allocation based on guidelines and patient preference | Mean = 23 days | Not mentioned | |
| USA soldiers | 397,442 | Restrospective analysis of hospital records | No information available | Minimum 1 month | Government funding | |
| Study ID | Description of how adverse outcomes were defined and recorded¹ | Description of ascertainment technique² | Active or passive monitoring? | Prospective or retrospective data collection? |
| Inadequate Comment: No definition of adverse events or effects was provided, it is unclear whether or how causality was assessed | Adequate | Active | Prospective | |
| Adequate | Adequate | Active | Prospective | |
| Inadequate Comment: ‘serious’ adverse events were not defined, and methods for determining causality not described | Adequate | Active | Prospective | |
| Inadequate Comment: It is unclear what questions were included within the questionnaire and whether and how causality was assessed. ‘Serious’ adverse effects not defined | Adequate | Active | Prospective | |
| Inadequate Comment: No definition of adverse events or effects provided, it was unclear whether or how causality was assessed | Adequate | Active | Prospective | |
| Inadequate Comment: No definition of adverse events or effects was provided, it was unclear whether or how causality was assessed | Inadequate Comment: Weekly sick call for all villagers | Passive | Prospective | |
| Inadequate Comment: No definition of adverse events or effects was provided, it was unclear whether or how causality was assessed | Adequate | Active | Prospective | |
| Inadequate Comment: No definition of adverse events or effects was provided, it was unclear whether or how causality was assessed | Adequate | Active | Prospective | |
| Inadequate Comment: No information given in the methods section on definition of adverse outcomes | Inadequate Comment: No description of ascertainment method | Active | Prospective | |
| Inadequate Comment: No definition of adverse events or effects was provided, it was unclear whether or how causality was assessed | Adequate | Active | Prospective | |
| Inadequate Comment: No definitions of adverse events or effects were provided, it was unclear whether or how causality was assessed | Unclear | Passive | Prospective | |
| Adequate | Unclear | Active | Prospective | |
| Inadequate Comment: No definitions of adverse events or effects were provided, it was unclear whether or how causality was assessed. | Adequate | Active | Prospective | |
| Cohort studies | ||||
| Adequate | Adequate | Active | Retrospective | |
| Adequate | Adequate | Active | Retrospective | |
| Adequate | Adequate | Active | Unclear 'Filled in after their return' | |
| Adequate | Adequate | Passive | Unclear Comment: information was collected during the flight home, when travellers should still have been taking their prophylactic regimen | |
| Adequate | Adequate | Active | Prospective | |
| Adequate | Adequate | Passive | Retrospective | |
| 1. Were harms pre‐defined using standardised or precise definitions? 2. Was ascertainment technique adequately described? | ||||
| Study ID | Study design | Mefloquine users | Drug comparators | |||
| Events/ participants | Description | Drug | Events/ participants | Description | ||
| Events (not attributed by study authors or participants to the drug regimen) | ||||||
| RCT | 0/116 | ‐ | Placebo | 1/121 | None provided | |
| RCT | 1/159 (women) | One death
Four congenital malformations:
| Placebo | 0/152 (women) | One congenital malformation:
| |
| RCT | 0/103 | ‐ | Placebo | 1/96 | One death (not described) | |
| RCT | 0/61 | ‐ | Placebo | 0/65 | ‐ | |
| Doxycycline | 1/62 | Acute hysteria¹ | ||||
| Cohort study | 8/3703 | 8 hospitalisations
| Doxycycline | 0/69 | ‐ | |
| Chloroquine | 0/119 | ‐ | ||||
| RCT | 10/483 | "...infectious illnesses in 7 subjects and breast cancer, anaphylaxis, or fractured femur in 1 subject each" | Atovaquone‐proguanil | 4/493 | "...infectious illnesses in 3 subjects and cerebral ischemia in 1 subject" | |
| Studies reporting no serious events or effects | ||||||
| RCT | 0/107 | "Adverse events were all mild and there were no deaths" | Placebo Chloroquine | 0/101 0/103 | ‐ ‐ | |
| RCT | 0/134 | "No serious side effects occurred with either drug regimen" | Doxycycline | 0/119 | ‐ | |
| RCT | 0/153 | "Although a large number of adverse events were reported, none were serious" | Doxycycline Atovaquone‐proguanil | 0/153 0/164 | ‐ ‐ | |
| Cohort study | 0/228 | "No drug induced side effects necessitating emergency care were observed" | Doxycycline | 0/506 | ‐ | |
| Cohort study | 0/491 | "No serious adverse events were recorded" | Atovaquone‐proguanil | 0/161 | ‐ | |
| Cohort study | 0/548 | Records hospitalisations, and reports that none occurred in either group of participants | Atovaquone‐proguanil Chloroquine | 0/707 0/37 | ‐ ‐ | |
| RCT | 0/103 | "All side effects were transient (and)... mild" | Chloroquine | 0/100 | ‐ | |
| 1 This trial described a potentially serious adverse event, but did not provide enough detail to meet our definition. | ||||||
| Study ID | Study design | Mefloquine users | Drug comparators | |||
| Events/ participants | Description | Drug | Events/ participants | Description | ||
| Effects (attributed by study authors or participants to the drug regimen) | ||||||
| Cohort study | 2/104 | Two "serious acute adverse reactions"¹
| No treatment | 0/93 | ‐ | |
| Cohort study | 5/809 | 5 hospitalisations:
| Chloroquine | 6/1223 | 2 hospitalisations:
| |
| No treatment | 0/161 | ‐ | ||||
| Cohort study | 15/1612 | 15 hospitalisations:
| Doxycycline | 9/708 | 9 hospitalisations:
| |
| Atovaquone‐proguanil | 0/72 | ‐ | ||||
| Chloroquine | 4/832 | 4 hospitalisations:
| ||||
| Cohortstudy | 4/285 | 3 hospitalisations with "either gastrointestinal or neurologic symptoms" and one seizure | Doxycycline | 1/383 | Severe oesophagitis | |
| RCT | 1/? | One "neuropsychiatric side effect"
| Chloroquine | 0/? | ‐ | |
| Cohort study | 1/115 | One "serious side effect"¹
| Chloroquine | 0/22 | ‐ | |
| Cohort study | 1/609 | One hospitalisation:
| Chloroquine | 0/137 | ‐ | |
| Cohort study | 7/52981 | 7 hospitalisations, including:
| Chloroquine | 7/20332 | 7 hospitalisations. 'Includes':
| |
| Studies reporting no serious events or effects | ||||||
| RCT | 0/46 | Nine serious adverse events in the trial (trial arm not specified) "none of which were considered by study physicians to be related to the study drug" | Placebo | 0/94 | ‐ | |
| RCT | 0/107 | "Adverse events were all mild and there were no deaths" | Placebo Chloroquine | 0/101 0/103 | ‐ ‐ | |
| RCT | 0/134 | "No serious side effects occurred with either drug regimen" | Doxycycline | 0/119 | ‐ | |
| RCT | 0/153 | "Although a large number of adverse events were reported, none were serious" | Doxycycline Atovaquone‐proguanil | 0/153 0/164 | ‐ ‐ | |
| Cohort study | 0/228 | "No drug induced side effects necessitating emergency care were observed" | Doxycycline | 0/506 | ‐ | |
| Cohort study | 0/491 | "No serious adverse events were recorded" | Atovaquone‐proguanil | 0/161 | ‐ | |
| Cohort study | 0/548 | Records hospitalisations, and reports that none occurred in either group of participants | Atovaquone‐proguanil Chloroquine | 0/707 0/37 | ‐ ‐ | |
| RCT | 0/103 | "All side effects were transient (and)... mild" | Chloroquine | 0/100 | ‐ | |
| ¹ This trial described a potentially serious adverse effect, but did not provide enough detail to meet our strict definition. | ||||||
| Study ID | Participants | Number enrolled | Method of adverse event monitoring | Significant exclusions for psychiatric adverse effects | Duration of travel | Source of funding |
| Randomized controlled trials | ||||||
| USA soldiers | 270 | Blood tests, stool samples. Interview with study personnel | None | 5 weeks | Not mentioned | |
| Indonesian soldiers | 204 | Interview with study personnel. Exit questionnaire | " History of underlying illness" | 13 weeks | Pfizer and Roche | |
| Non‐immune adult short‐term travellers | 674 | Participant self‐reported questionnaire | History of seizures or psychiatric disorders | 4 to 6 weeks | GlaxoSmithKline and Roche | |
| Kenyan children | 169 | Interview with study personnel | None | 4 months | Government funding | |
| Non‐randomized studies | ||||||
| Participants | Number enrolled | Method of adverse event monitoring | Factors influencing drug allocation | Duration of travel | Source of funding | |
| UK Foreign and Commonwealth Office staff | 327 | Participant self‐reported questionnaire | Allocation based on guidelines and participant preference | 0 to 36 months | Not mentioned | |
| USA s oldiers | 367,840 | Data from the Defense Medical Surveillance System, the Pharmacy Data Transaction Service and the Theater Medical Data Store | No information available | Various, not specified | Not mentioned | |
| UK adult short‐term travellers | 185 | Participant self‐reported questionnaire | Allocation based on guidelines and participant preference | < 28 days | GlaxoSmithKline | |
| Peace Corps volunteers | 2701 | Participant self‐reported questionnaire | Allocation based on guidelines and participan t preference | ≥ 6 months | Two staff employed by Peace Corps | |
| Peace Corps volunteers | 1184 | Participant self‐reported questionnaire | Allocation based on guidelines and participant preference | Various, not specified | Not mentioned | |
| Adult short‐term travellers | 660 | Participant self‐reported questionnaire | No information available | 93% < 4 weeks | " No financial interests to disclose" | |
| Adult short‐term travellers | 5626 | Participant self‐reported questionnaire | No information available | < 5 weeks | " No financial interests to disclose" | |
| UK adults enrolled in UK g eneral p ractice research database | 35,370 | Incident cases of depression, psychoses and panic attacks within the UK general practice research database | No information available | Various, not specified | Roche | |
| Italian short‐term travellers | 1906 | Telephone interview | Allocation based on guidelines and participant preference | Mean 2 weeks, range 0 to > 35 days | Not mentioned | |
| Australian short‐term travellers | 741 | Participant self‐reported questionnaire | Allocation based on guidelines and participant preference | Various, mean 3 weeks, maximum 3 months | Roche and Pfizer | |
| USA soldiers | 2351 | Participant self‐reported questionnaire | Primarily doxycycline, soldiers with contra‐indications received mefloquine | > 90% for 10 months or more | Not mentioned | |
| Israeli short‐term travellers | 158 | Participant self‐reported questionnaire | "... daily doxycycline or daily primaquine... was recommended" | 14 to 20 days | Not mentioned | |
| Israeli soldiers | 45 | Participant self‐reported questionnaire | Allocation based on guidelines and participant preference | "... an average of 4 hours stay in the field over a period of 2 months" | Not mentioned | |
| Dutch medical students | 180 | Participant self‐reported questionnaire | Allocation based on guidelines and participant preference | Mean 74 days (range 10 to 224 days) | No dedicated funding | |
| Turkish soldiers | 1400 | Participant self‐reported questionnaire | Prior to March 2002: doxycyline After July 2002: mefloquine | A pprox. 6 months | Not mentioned | |
| USA short‐term travellers | 370 | Participant self‐reported questionnaire | Allocation based on guidelines and participant preference | Median duration 13 days | Government funding | |
| Peace Corps volunteers | 8931 | Participant self‐reported questionnaire | No information available | Various, not specified | No dedicated funding | |
| UK soldiers | 2032 | Participant self‐reported questionnaire | Allocation based on guidelines and participant preference | Median duration 13 days | "... not funded by an external body" | |
| UK soldiers | 151 | Participant self‐reported questionnaire | Allocation based on guidelines and participant preference | Various, not specified | No dedicated funding | |
| Adult short‐term travellers | 3051 | Participant self‐reported questionnaire | No information available | A pprox. 6 weeks | Not mentioned | |
| Study ID | Harms predefined¹ | Description of ascertainment technique² | Active or passive monitoring?³ | Prospective or retrospective data collection? |
| RCTs | ||||
| Inadequate: No definitions provided for serious side effects | Unclear: it is not reported who conducted the interviews | Active | Prospective | |
| Inadequate Comment: No definitions of adverse events or effects were provided, it wa s unclear whether or how causality was assessed | Adequate | Active | Prospective | |
| Adequate | Adequate | Active | Prospective | |
| Inadequate " Each subject was visited daily at home by an assigned field worker, who asked about symptoms of malaria or drug side effects" | Adequate | Active | Prospective | |
| Cohort studies | ||||
| Inadequate Comment: questionnaire included a targeted list of side effects, including " other psychological problems" . What was included within this was not defined | Adequate | Passive | Unclear Comment: questionnaire was performed while participants were still taking chemoprophylaxis medication, although 75% were non‐compliant | |
| Adequate | Adequate | Passive | Prospective | |
| Inadequate " Also included on the questionnaire was a single free‐text question asking travellers to describe any side effects of antimalarial medication" | Adequate | Active | Retrospective | |
| Adequate | Adequate | Passive | Unclear Comment: n o information wa s provided regarding the timing of the questionnaire during treatment | |
| Adequate | Adequate | Passive | Unclear Comment: all participants were emailed the questionnaire at one time point, which occurred at varying points during the prophylactic regimen | |
| Inadequate "Travellers… were given a questionnaire that asked for... adverse health events attributed to those drugs" | Adequate | Passive | Unclear Comment: information was collected at the airport, when travellers should still have been taking the prophylactic regimen | |
| Adequate | Adequate | Passive | Retrospective | |
| Unclear Comment: adverse events were categorised on a scale of one to four, but it is unclear whether and how causality was assessed | Adequate | Active | Retrospective | |
| Inadequate Comment: it wa s unclear what constituted a serious or severe event and insufficient information on the questions that travellers were asked | Inadequate "... a mailed questionnaire approximately 2 weeks after their anticipated return home date’ ‘if a reply had not been received within 4 weeks an abbreviated questionnaire was sent out." Comment: no details provided regarding abbreviated questionnaire | Active | Retrospective | |
| Inadequate Comment: insufficient information of the questions that travellers were asked | Adequate | Passive | Retrospective | |
| Inadequate "... we directly contacted all travelers for complete follow‐up and assessment of compliance. Fifty travelers taking primaquine completed a questionnaire regarding side effects" | Inadequate Comment: see quote. Different methods of follow up for different forms of prophylaxis | Unclear | Unclear | |
| Inadequate Comment: insufficient information provided on the questions that travellers were asked | Inadequate " Questionnaires were distributed and collected by the flight surgeon to 45 aircrew…questionnaires were immediately evaluated and further data collection was done by telephone, if necessary" | Passive | Unclear Comment: it wa s unclear at which time point data collection occurred | |
| Inadequate Comment: n o information wa s provided on how information on adverse effects was sought | Inadequate Comment: n o mention of how adverse events were recorded in the questionnaire | Passive | Retrospective | |
| Inadequate Comment: insufficient information provided on the questions that travellers were asked | Adequate | Active | Prospective | |
| Inadequate Comment: insufficient information provided on the questions that travellers were asked | Inadequate Comment: n o information is reported on how adverse events were ascertained | Active | Prospective | |
| Adequate | Adequate | Active | Retrospective | |
| Inadequate " The questionnaire approved by the MODREC included the 19 commonest adverse effects described in the manufacturers’ product documentation" Comment: Adverse events listed in the questionnaire are not reported | Adequate | Passive | Unclear Comment: information obtained during transit through Nairobi back to the UK. It wa s unclear whether participants were still taking prophylaxis at this time point | |
| Inadequate Comment: insufficient information provided on the questions that travellers were asked | Adequate | Active | Unclear Comment: i t wa s not specified at which point during treatment the questionnaire was administered | |
| Inadequate Comment: insufficient information provided on the questions that travellers were asked | Adequate | Passive | Unclear Comment: information was collected during the flight home, when travellers should still have been taking their prophylactic regimen | |
| 1. Were harms pre‐defined using standardised or precise definitions? 2. Was ascertainment technique adequately described? 3. Monitoring classed as 'active' if it occurred at set time points during treatment. For full description of analysis methods, see Table 2. | ||||
| Study ID | Participants | Number enrolled | Method of adverse event monitoring | Significant exclusions for psychiatric adverse effects | Duration of travel | Source of funding |
| Randomized controlled trials | ||||||
| Travellers from Canada, Germany, Netherlands, South Africa, UK | 1013 | Interview with study personnel | "... history of alcoholism, seizures or psychiatric or severe neurological disorders" | Mean 2.5 weeks | GlaxoSmithKline | |
| Non‐immune adult short‐term travellers | 674 | Participant self‐reported questionnaire | " History of seizures or psychiatric disorders" | 4 to 6 weeks | GlaxoSmithKline and Roche | |
| Dutch short‐term travellers | 140 | Interview and testing with study personnel | "H istory of alcoholism, seizures, psychiatric disorders, severe neurological disorders" | Mean 19 days | Government funding | |
| Non‐randomis ed studies | ||||||
| Participants | Number enrolled | Method of adverse event monitoring | Factors influencing drug allocation | Duration of travel | Source of funding | |
| Swedish soldiers | 609 | Participant self‐reported questionnaire | Mainly mefloquine, soldiers with contra‐indications received atovaquone‐proguanil | 6 months | Not mentioned | |
| Dutch short‐term travellers | 945 | Participant self‐reported questionnaire (measured adherence) | Allocation based on guidelines and participant preference | 84% < 29 days | Government funding | |
| UK Foreign and Commonwealth Office staff | 327 | Participant self‐reported questionnaire | Allocation based on guidelines and p articipant preference | 0‐36 months | Not mentioned | |
| USA s oldiers | 367,840 | Data from the Defense Medical Surveillance System, the Pharmacy Data Transaction Service and the Theater Medical Data Store | No information available | Various, not specified | Not mentioned | |
| UK adult short‐term travellers | 185 | Participant self‐reported questionnaire | Allocation based on guidelines and p articipant preference | < 28 days | GlaxoSmithKline | |
| Japanese short‐term travellers | 316 | Participant self‐reported questionnaire | Allocation based on guidelines and participant preference | Mean 20.0 ± 9.6 days in the atovaquone‐proguanil group and 59.0 ± 15.9 days in the mefloquine group | Not mentioned | |
| Peace Corps volunteers | 2701 | Participant self‐reported questionnaire | Allocation based on guidelines and participant preference | ≥ 6 months | Two staff employed by Peace Corps | |
| German short‐term travellers | 495 | Participant self‐reported questionnaire | Allocation based on guidelines and participant preference | A tovaquone‐proguanil mean 2.6 weeks, mefloquine mean 7 weeks | Not mentioned | |
| Peace Corps volunteers | 1184 | Participant self‐reported questionnaire | Allocation based on guidelines and participant preference | Various, not specified | Not mentioned | |
| Italian short‐term travellers | 1176 | Participant self‐reported questionnaire | Allocation based on guidelines and participant preference | > 90% 0 to 30 days | Not mentioned | |
| Italian short‐term travellers | 1906 | Telephone interview | Allocation based on guidelines and participant preference | Mean 2 weeks, range 0 to > 35 days | Not mentioned | |
| UK adults enrolled in UK g eneral p ractice research database | Not available | Incident cases of a neuropsychiatric disorders during or after antimalarial drug use | No information available | Various, not specified | Roche | |
| Dutch medical students | 180 | Participant self‐reported questionnaire | Allocation based on guidelines and participant preference | Mean duration of stay 74 days (range 10 to 224 days) | " N o dedicated funding for this project" | |
| USA short‐term travellers | 370 | Participant self‐reported questionnaire | Allocation based on guidelines and participant preference | Median duration 13 days | Government funding | |
| Peace Corps volunteers | 8931 | Participant self‐reported questionnaire | No information available | Various, not specified | No dedicated funding | |
| UK soldiers | 151 | Participant self‐reported questionnaire | Allocation based on guidelines and participant preference | Various, not specified | No dedicated funding | |
| Study ID | Harms predefined¹ | Description of ascertainment technique² | Active or passive monitoring?³ | Prospective or retrospective data collection? |
| RCTs | ||||
| Adequate | Adequate | Active | Prospective | |
| Adequate | Adequate | Active | Prospective | |
| Adequate | Adequate | Active | Prospective | |
| Cohort studies | ||||
| Inadequate Comment: insufficient information provided on the questions which soldiers were asked | Inadequate Comment: different ascertainment technique used for one of the three groups, which is inadequately described | Active | Unclear Comment: d ata collection was prospective for 448/609 participants (LA04 and LA05), but retrospective for 161 participants (LA02) | |
| Inadequate Comment: questionnaire included a targeted list of side effects, including " other psychological problems" . What was included within this was not defined | Adequate | Passive | Unclear Comment: questionnaire was performed while participants were still taking chemoprophylaxis medication, although 75% were non‐compliant | |
| Adequate | Adequate | Passive | Prospective | |
| Inadequate " Also included on the questionnaire was a single free‐text question asking travelers to describe any side effects of antimalarial medication" | Adequate | Active | Retrospective | |
| Adequate | Adequate | Passive | Unclear Comment: the timing of this questionnaire has not been made clear | |
| Adequate | Adequate | Passive | Unclear Comment: n o information wa s provided regarding the timing of the questionnaire during treatment | |
| Inadequate Comment: insufficient information provided on the questions that participants were asked | Adequate | Active | Retrospective | |
| Adequate | Adequate | Passive | Unclear Comment: all participants were emailed the questionnaire at one time point, which occurred at varying points during the prophylactic regimen | |
| Adequate | Adequate | Passive | Retrospective | |
| Unclear Comment: adverse events were categorised on a scale of one to four, but it is unclear whether and how causality was assessed | Adequate | Active | Retrospective | |
| Adequate | Adequate | Passive | Retrospective | |
| Inadequate Comment: n o information is provided on how information on adverse effects was sought | Inadequate Comment: n o mention of how adverse events were recorded in the questionnaire. | Passive | Retrospective | |
| Inadequate Comment: insufficient information provided on the questions that travellers were asked | Inadequate Comment: n o information is reported on how adverse events were ascertained | Active | Prospective | |
| Adequate | Adequate | Active | Retrospective | |
| Inadequate Comment: insufficient information provided on the questions that travellers were asked | Adequate | Active | Unclear Comment: i t wa s not specified at which point during treatment the questionnaire was administered | |
| 1. Were harms pre‐defined using standardised or precise definitions? 2. Was ascertainment technique adequately described? 3. Monitoring classed as 'active' if it occurred at set time points during treatment. For full description of analysis methods, see Table 2. | ||||
| Study ID | Participants | Number enrolled | Method of adverse event monitoring | Significant exclusions for psychiatric side effects | Trial duration | Source of funding |
| RCT s | ||||||
| Thai gem miners | 501 | Interview with study personnel | None | 14 weeks | USA Army | |
| USA soldiers | 359 | Interview with study personnel and computerised questionnaire | "M edical history of psychiatric or neurological problems within the last 5 years" | 13 weeks | Not mentioned | |
| Thai adult mal es | 605 | Interview with study personnel | None | 24 weeks | Roche | |
| Nigerian adult males | 567 | Interview with study personnel | None | 24 weeks | Not mentioned | |
| Ivory C oast adult males | 500 | " Access to the village health centre. Clinical examination with study personnel" | None | 20 weeks | Not mentioned | |
| Pregnant Malawian women | 4220 | Interview with study personnel | None | Monitored from enrolment to delivery | Government funding | |
| Non‐randomised studies | ||||||
| Participants | Number enrolled | Method of adverse event monitoring | Factors influencing drug allocation | Duration of travel | Source of funding | |
| USA travelling children aged < 13 years | 177 | Interview with study personnel | Allocation based on guidelines and participant preference | Various, not specified | Not mentioned | |
| Spanish short‐term adult travellers | 1054 | Participant self‐reported questionnaire | Allocation based on guidelines and participant preference | Maximum 6 weeks | Not mentioned | |
| UK Foreign and Commonwealth Office staff | 327 | Participant self‐reported questionnaire | Allocation based on guidelines and participant preference | 0 to 36 months | Not mentioned | |
| USA short‐term travellers | 822 | Interview with study personnel | Allocation based on guidelines and participant preference | Median 19 days, up to 90 days | Not mentioned | |
| Peace Corps volunteers | 2701 | Participant self‐reported questionnaire | Allocation based on guidelines and participant preference | ≥ 6 months | Two staff employed by Peace Corps | |
| Adult short‐term travellers | 660 | Participant self‐reported questionnaire | No information available | 93% < 4 weeks | " No financial interests to disclose" | |
| Italian short‐term travellers | 1176 | Participant self‐reported questionnaire | Allocation based on guidelines and participant preference | > 90% 0 to 30 days | Not mentioned | |
| Adult short‐term travellers | 5626 | Participant self‐reported questionnaire | No information available | M ost < 5 weeks | " No financial interests to disclose" | |
| Italian short‐term travellers | 1906 | Telephone interview | Allocation based on guidelines and participant preference | Mean 2 weeks, range 0 to > 35 days | Not mentioned | |
| Danish travellers | 4154 | Participant self‐reported questionnaire | Allocation based on guidelines and participant preference | Various, 65% < 3 weeks | Not mentioned | |
| Swedish short‐term travellers | 491 | Participant self‐reported questionnaire | Allocation based on guidelines and participant preference | " Most" 2 to 4 weeks | Not mentioned | |
| Adult short‐term travellers | 145,003 | Participant self‐reported questionnaire | No information available | 98% stayed between 1 and 4 weeks | Roche | |
| USA short‐term travellers | 370 | Participant self‐reported questionnaire | Allocation based on guidelines and participant preference | Median duration 13 days | Government funding | |
| Peace Corps volunteers | 8931 | Participant self‐reported questionnaire | No information available | Various, not specified | No dedicated funding | |
| Adult short‐term travellers | 3051 | Participant self‐reported questionnaire | No information available | A pprox. 6 weeks | " not funded by an external body" | |
| Study ID | Harms predefined¹ | Description of ascertainment technique² | Active or passive monitoring?³ | Prospective or retrospective data collection? |
| RCTs | ||||
| Adequate | Adequate | Active | Prospective | |
| Adequate | Adequate | Active | Prospective | |
| Inadequate " Adverse events were defined clinically, and starting week 14, volunteers reporting adverse events were interviewed by members of the hospital team" | Adequate | Active | Prospective | |
| Inadequate " Particular attention was paid to complaints such as fever, chills, malaise, nausea and vomiting, rashes and other symptoms and signs that could be regarded as adverse events." Comment: no clear definition of adverse events wa s provided | Adequate | Active | Prospective | |
| Inadequate " Participants had access to a village health center, where they could notify personnel of any malaise or side effects" | Unclear " Clinical examinations and parasitologic tests were performed every 4 weeks" | Passive | Prospective | |
| Adequate | Adequate | Active | Prospective | |
| Cohort studies | ||||
| Adequate | Adequate | Passive | Retrospective | |
| Inadequate Comment: insufficient information wa s provided about the questions that travellers were asked | Adequate | Active | Retrospective | |
| Inadequate Comment: questionnaire included a targeted list of side effects, including " other psychological problems" . What was included within this was not defined | Adequate | Passive | Unclear Comment: questionnaire was performed while participants were still taking chemoprophylaxis medication, although 75% were non‐compliant | |
| Inadequate Comment: insufficient information wa s provided about the questions that travellers were asked | Adequate | Active | Retrospective | |
| Adequate | Adequate | Passive | Unclear Comment: No information wa s provided regarding the timing of the questionnaire during treatment | |
| Adequate | Adequate | Passive | Retrospective | |
| Inadequate "Travellers… were given a questionnaire that asked for... adverse health events attributed to those drugs" | Adequate | Passive | Unclear Comment: information was collected at the airport, when travellers should still have been taking the prophylactic regimen | |
| Unclear Comment: adverse events were categorised on a scale of one to four, but it is unclear whether and how causality was assessed | Adequate | Active | Retrospective | |
| Inadequate Comment: i t wa s unclear whether the questionnaire implied causality to the drug regimen | Adequate | Active | Retrospective | |
| Adequate | Adequate | Active | Retrospective | |
| Adequate | Adequate | Passive | Unclear Comment: information was collected during the flight home, when travellers should still have been taking the prophylactic regimen | |
| Inadequate Comment: insufficient information provided on the questions that travellers were asked | Inadequate Comment: n o information wa s reported on how adverse events were ascertained | Active | Prospective | |
| Adequate | Adequate | Active | Retrospective | |
| Inadequate Comment: insufficient information provided on the questions that travellers were asked | Adequate | Passive | Unclear Comment: information was collected during the flight home, when travellers should still have been taking the prophylactic regimen | |
| 1. Were harms pre‐defined using standardised or precise definitions? 2. Was ascertainment technique adequately described? 3. Monitoring classed as 'active' if it occurred at set time points during treatment. For full description of analysis methods, see Table 2. | ||||
| Mefloquine versus atovaquone‐proguanil and doxycycline | |||
| Outcome | Short‐ term travellers¹ | Longer‐ term travellers² | Test for subgroup |
| Relative effect (RR) | Relative effect (RR) | ||
| Serious adverse effects | RR 5.38 (0.60 to 47.84) 3 cohort studies (2657) | RR 0.93 (0.43 to 2.01) 3 cohort studies (3147) | P = 0.14 |
| Discontinuations due to adverse effects (RCTs) | RR 2.64 (1.51 to 4.62) 5 RCTs (2048) | ‐ | ‐ |
| Discontinuations due to adverse effects (cohort studies) | RR 1.81 (0.86 to 3.80) 7 cohort studies (2907) | RR 1.19 (0.45 to 3.17) 4 cohort studies (5711) | P = 0.50 |
| Nausea | RR 2.02 (0.87 to 4.68) 6 cohort studies (2469) | RR 0.96 (0.22 to 4.18) 3 cohort studies (2725) | P = 0.39 |
| Abdominal pain | RR 0.66 (0.22 to 1.98) 5 cohort studies (1801) | RR 0.30 (0.22 to 0.42) 3 cohort studies (2725) | P = 0.18 |
| Diarrhoea | RR 0.64 (0.15 to 2.71) 5 cohort studies (2428) | RR 0.57 (0.22 to 1.49) 4 cohort studies (5187) | P = 0.89 |
| Headache | RR 2.39 (0.69 to 8.22) 5 cohort studies (2086) | RR 2.09 (1.10 to 3.95) 4 cohort studies (3506) | P = 0.85 |
| Dizziness | RR 3.05 (1.15 to 8.12) 4 cohort studies (1067) | RR 3.84 (1.34 to 11.00) 4 cohort studies (3506) | P = 0.76 |
| Abnormal dreams | RR 6.25 (1.16 to 33.67) 3 cohort studies (1037) | RR 7.62 (2.06 to 28.18) 4 cohort studies (3506) | P = 0.86 |
| Insomnia | RR 3.09 (0.30 to 32.21) 4 cohort studies (1760) | RR 8.67 (4.73 to 15.89) 4 cohort studies (3506) | P = 0.40 |
| Anxiety | RR 3.26 (0.20 to 53.46) 1 cohort study (487) | RR 18.05 (9.75 to 33.42) 3 cohort studies (2854) | P = 0.24 |
| Depressed mood | RR 2.52 (0.76 to 8.29) 3 cohort studies (1026) | RR 12.59 (6.47 to 24.49) 3 cohort studies (3210) | P = 0.02 |
| Abnormal thoughts and behaviours | RR 1.29 (0.07 to 22.44) 1 cohort study (487) | RR 7.78 (1.12 to 54.06) 2 cohort studies (2558) | P = 0.31 |
| Adherence: during travel | RR 1.10 (1.03 to 1.18) 7 cohort studies (7241) | RR 1.20 (0.88 to 1.62) 4 cohort studies (4890) | P = 0.61 |
| Adherence: after return | RR 1.04 (0.92 to 1.17) 4 cohort studies (1221) | ‐ | ‐ |
| 1 Short‐ term travellers: Approximately 3 weeks (range 1 day to 3 months). References: Goodyer 2011; Kato 2013; Kuhner 2005; Napoletano 2007; Laver 2001; Laverone 2006; Lobel 2001; Philips 1996; Schwartz 1999; Shamiss 1996; Sonmez 2005; Stoney 2016; Terrell 2015 | |||
| Mefloquine versus atovaquone‐proguanil and doxycycline | |||
| Outcome | Military¹ | Non‐military² | Test for subgroup |
| Relative effect (RR) | Relative effect (RR) | ||
| Serious adverse effects | 0 events in 1386 participants | RR 1.21 (0.60 to 2.44) 4 cohort studies (4418) | ‐ |
| Discontinuations due to adverse effects (RCTs) | RR 2.08 (0.13 to 32.73) 2 RCTs (441) | RR 2.22 (1.17 to 4.21) 4 RCTs (1669) | P = 0.96 |
| Discontinuations due to adverse effects (cohorts) | RR 1.24 (0.32 to 4.88) 4 cohort studies (3408) | RR 1.89 (1.35 to 2.64) 8 cohort studies (8938) | P = 0.56 |
| Nausea | RR 1.39 (0.36 to 5.36) 4 cohort studies (1578) | RR 1.70 (0.60 to 4.81) 6 cohort studies (3767) | P = 0.26 |
| Abdominal pain | RR 0.43 (0.14 to 1.29) 4 cohort studies (1578) | RR 0.56 (0.23 to 1.35) 5 cohort studies (3099) | P = 0.72 |
| Diarrhoea | RR 0.30 (0.09 to 0.96) 4 cohort studies (3999) | RR 1.05 (0.54 to 2.06) 6 cohort studies (3767) | P = 0.07 |
| Headache | RR 1.19 (0.14 to 9.79) 2 cohort studies (1386) | RR 2.48 (1.40 to 4.40) 7 cohort studies (4206) | P = 0.51 |
| Dizziness | RR 2.95 (1.37 to 6.36) 3 cohort studies (844) | RR 3.58 (1.39 to 9.25) 6 cohort studies (3880) | P = 0.76 |
| Abnormal dreams | RR 11.02 (4.61 to 26.34) 1 cohort study (652) | RR 6.59 (1.74 to 25.00) 6 cohort studies (3891) | P = 0.53 |
| Insomnia | RR 2.34 (0.41 to 13.35) 3 cohort studies (1537) | RR 10.24 (6.26 to 16.76) 6 cohort studies (3880) | P = 0.11 |
| Anxiety | ‐ | RR 16.94 (9.36 to 30.64) 4 cohort studies (3390) | ‐ |
| Depressed mood | RR 13.44 (3.34 to 54.05) 1 cohort study (652) | RR 6.49 (2.66 to 15.85) 5 cohort studies (3584) | P = 0.39 |
| Abnormal thoughts and behaviours | ‐ | RR 5.11 (1.11 to 23.53) 3 cohort studies (3045) | ‐ |
| Adherence: during travel | RR 1.18 (1.00 to 1.40) 5 cohort studies (4652) | RR 1.16 (0.99 to 1.35) 8 cohort studies (10785) | P = 0.85 |
| Adherence: after return | RR 1.16 (0.86 to 1.55) 1 cohort study (43) | RR 1.02 (0.89 to 1.16) 3 cohort studies (1178) | P = 0.44 |
| 1 Military participants: References: RCTs: Arthur 1990; Ohrt 1997. Cohort studies: Andersson 2008, Saunders 2015; Shamiss 1996; Sonmez 2005; Terrell 2015; Tuck 2016 | |||
| Outcome or subgroup title | No. of studies | No. of participants | Statistical method | Effect size |
| 1 Clinical cases of malaria Show forest plot | 9 | 1908 | Risk Ratio (M‐H, Random, 95% CI) | 0.09 [0.04, 0.19] |
| 2 Malaria; episodes of parasitaemia in semi‐immune populations Show forest plot | 5 | Risk Ratio (M‐H, Random, 95% CI) | Subtotals only | |
| 2.1 Trials reporting number of participants with parasitaemia | 3 | 414 | Risk Ratio (M‐H, Random, 95% CI) | 0.18 [0.06, 0.55] |
| 2.2 Trials reporting number of episodes of parasitaemia | 2 | 510 | Risk Ratio (M‐H, Random, 95% CI) | 0.05 [0.00, 5.25] |
| 3 Serious adverse events or effects (all studies) Show forest plot | 8 | Risk Ratio (M‐H, Fixed, 95% CI) | Subtotals only | |
| 3.1 RCTs (adverse events) | 6 | 1221 | Risk Ratio (M‐H, Fixed, 95% CI) | 0.70 [0.14, 3.53] |
| 3.2 Cohort studies (adverse effects) | 2 | 1167 | Risk Ratio (M‐H, Fixed, 95% CI) | 3.08 [0.39, 24.11] |
| 4 Discontinuations due to adverse effects (all studies) Show forest plot | 7 | 1130 | Risk Ratio (M‐H, Fixed, 95% CI) | 1.64 [0.55, 4.88] |
| 4.1 RCTs (adverse effects) | 7 | 1130 | Risk Ratio (M‐H, Fixed, 95% CI) | 1.64 [0.55, 4.88] |
| 5 Nausea (all studies) Show forest plot | 5 | Risk Ratio (M‐H, Fixed, 95% CI) | Subtotals only | |
| 5.1 RCTs (adverse events) | 2 | 244 | Risk Ratio (M‐H, Fixed, 95% CI) | 1.35 [1.05, 1.73] |
| 5.2 Cohort studies (adverse events) | 3 | 1901 | Risk Ratio (M‐H, Fixed, 95% CI) | 1.85 [1.42, 2.43] |
| 6 Vomiting (all studies) Show forest plot | 3 | Risk Ratio (M‐H, Fixed, 95% CI) | Subtotals only | |
| 6.1 RCTs (adverse events) | 1 | 202 | Risk Ratio (M‐H, Fixed, 95% CI) | 0.77 [0.50, 1.19] |
| 6.2 Cohort studies (adverse events) | 2 | 1167 | Risk Ratio (M‐H, Fixed, 95% CI) | 0.74 [0.45, 1.21] |
| 7 Abdominal pain (all studies) Show forest plot | 5 | Risk Ratio (M‐H, Fixed, 95% CI) | Subtotals only | |
| 7.1 RCTs (adverse events) | 3 | 550 | Risk Ratio (M‐H, Fixed, 95% CI) | 1.09 [0.84, 1.40] |
| 7.2 Cohort studies (adverse events) | 2 | 1167 | Risk Ratio (M‐H, Fixed, 95% CI) | 0.97 [0.66, 1.42] |
| 8 Diarrhoea (all studies) Show forest plot | 7 | Risk Ratio (M‐H, Random, 95% CI) | Subtotals only | |
| 8.1 RCTs (adverse events) | 4 | 589 | Risk Ratio (M‐H, Random, 95% CI) | 0.72 [0.32, 1.62] |
| 8.2 Cohort studies (adverse events) | 3 | 1901 | Risk Ratio (M‐H, Random, 95% CI) | 1.25 [0.93, 1.68] |
| 9 Headache (all studies) Show forest plot | 6 | Risk Ratio (M‐H, Fixed, 95% CI) | Subtotals only | |
| 9.1 RCTs (adverse events) | 5 | 791 | Risk Ratio (M‐H, Fixed, 95% CI) | 0.84 [0.71, 0.99] |
| 9.2 Cohort studies (adverse events) | 1 | 197 | Risk Ratio (M‐H, Fixed, 95% CI) | 1.64 [0.63, 4.26] |
| 10 Dizziness (all studies) Show forest plot | 6 | Risk Ratio (M‐H, Fixed, 95% CI) | Subtotals only | |
| 10.1 RCTs (adverse events) | 3 | 452 | Risk Ratio (M‐H, Fixed, 95% CI) | 1.03 [0.90, 1.17] |
| 10.2 Cohort studies (adverse events) | 3 | 1901 | Risk Ratio (M‐H, Fixed, 95% CI) | 1.80 [1.29, 2.49] |
| 11 Abnormal dreams (all studies) Show forest plot | 2 | Risk Ratio (M‐H, Fixed, 95% CI) | Subtotals only | |
| 11.1 Cohort studies (adverse events) | 2 | 931 | Risk Ratio (M‐H, Fixed, 95% CI) | 2.35 [1.15, 4.80] |
| 12 Insomnia (all studies) Show forest plot | 2 | Risk Ratio (M‐H, Fixed, 95% CI) | Subtotals only | |
| 12.1 Cohort studies (adverse events) | 2 | 931 | Risk Ratio (M‐H, Fixed, 95% CI) | 1.46 [1.06, 2.02] |
| 13 Anxiety (all studies) Show forest plot | 2 | Risk Ratio (M‐H, Fixed, 95% CI) | Subtotals only | |
| 13.1 Cohort studies (adverse events) | 2 | 931 | Risk Ratio (M‐H, Fixed, 95% CI) | 1.21 [0.67, 2.21] |
| 14 Depressed mood (all studies) Show forest plot | 3 | Risk Ratio (M‐H, Random, 95% CI) | Subtotals only | |
| 14.1 Cohort studies (adverse events) | 3 | 1901 | Risk Ratio (M‐H, Random, 95% CI) | 2.43 [0.65, 9.07] |
| 15 Abnormal thoughts and perceptions Show forest plot | 1 | Risk Ratio (M‐H, Fixed, 95% CI) | Subtotals only | |
| 15.1 Cohort studies (adverse events) | 1 | 970 | Risk Ratio (M‐H, Fixed, 95% CI) | 5.77 [0.79, 42.06] |
| 16 Pruritis (all studies) Show forest plot | 4 | Risk Ratio (M‐H, Fixed, 95% CI) | Subtotals only | |
| 16.1 RCTs (adverse events) | 3 | 609 | Risk Ratio (M‐H, Fixed, 95% CI) | 0.86 [0.60, 1.24] |
| 16.2 Cohort studies (adverse events) | 1 | 197 | Risk Ratio (M‐H, Fixed, 95% CI) | 6.71 [1.58, 28.55] |
| 17 Visual impairment (all studies) Show forest plot | 2 | Risk Ratio (M‐H, Fixed, 95% CI) | Subtotals only | |
| 17.1 RCTs (adverse events) | 1 | 202 | Risk Ratio (M‐H, Fixed, 95% CI) | 0.98 [0.66, 1.46] |
| 17.2 Cohort studies (adverse events) | 1 | 970 | Risk Ratio (M‐H, Fixed, 95% CI) | 0.93 [0.27, 3.19] |
| 18 Vertigo (all studies) Show forest plot | 1 | Risk Ratio (M‐H, Fixed, 95% CI) | Subtotals only | |
| 18.1 RCTs (adverse events) | 1 | 202 | Risk Ratio (M‐H, Fixed, 95% CI) | 1.02 [0.78, 1.34] |
| 19 Other adverse events (RCTs) Show forest plot | 4 | Risk Ratio (M‐H, Fixed, 95% CI) | Subtotals only | |
| 19.1 Arthralgia | 1 | 140 | Risk Ratio (M‐H, Fixed, 95% CI) | 0.29 [0.02, 5.48] |
| 19.2 Back pain | 1 | 140 | Risk Ratio (M‐H, Fixed, 95% CI) | 0.10 [0.01, 1.61] |
| 19.3 Blurred vision | 1 | 208 | Risk Ratio (M‐H, Fixed, 95% CI) | 0.19 [0.01, 3.89] |
| 19.4 Cough | 1 | 202 | Risk Ratio (M‐H, Fixed, 95% CI) | 0.90 [0.71, 1.14] |
| 19.5 Constipation | 1 | 202 | Risk Ratio (M‐H, Fixed, 95% CI) | 0.77 [0.53, 1.11] |
| 19.6 Decreased appetite | 1 | 202 | Risk Ratio (M‐H, Fixed, 95% CI) | 1.10 [0.95, 1.28] |
| 19.7 Falls | 1 | 202 | Risk Ratio (M‐H, Fixed, 95% CI) | 1.08 [0.82, 1.43] |
| 19.8 Fatigue | 1 | 42 | Risk Ratio (M‐H, Fixed, 95% CI) | 0.91 [0.14, 5.86] |
| 19.9 Gastritis | 1 | 140 | Risk Ratio (M‐H, Fixed, 95% CI) | 1.02 [0.10, 10.98] |
| 19.10 Myalgia | 1 | 140 | Risk Ratio (M‐H, Fixed, 95% CI) | 1.53 [0.36, 6.57] |
| 19.11 Rash | 1 | 140 | Risk Ratio (M‐H, Fixed, 95% CI) | 0.29 [0.04, 2.30] |
| 19.12 Respiratory tract infection | 1 | 140 | Risk Ratio (M‐H, Fixed, 95% CI) | 2.63 [1.04, 6.61] |
| 19.13 Sore throat | 1 | 140 | Risk Ratio (M‐H, Fixed, 95% CI) | 0.34 [0.04, 2.75] |
| 19.14 Unsteadiness | 1 | 202 | Risk Ratio (M‐H, Fixed, 95% CI) | 1.06 [0.74, 1.52] |
| 19.15 Weakness | 1 | 202 | Risk Ratio (M‐H, Fixed, 95% CI) | 1.06 [0.96, 1.17] |
| 20 Other adverse effects (cohort studies) Show forest plot | 3 | Risk Ratio (M‐H, Fixed, 95% CI) | Subtotals only | |
| 20.1 Agitation | 1 | 734 | Risk Ratio (M‐H, Fixed, 95% CI) | 1.06 [0.61, 1.82] |
| 20.2 Altered spatial perception | 1 | 970 | Risk Ratio (M‐H, Fixed, 95% CI) | 9.4 [0.57, 153.97] |
| 20.3 Confusion | 1 | 734 | Risk Ratio (M‐H, Fixed, 95% CI) | 0.67 [0.25, 1.78] |
| 20.4 Loss of appetite | 1 | 970 | Risk Ratio (M‐H, Fixed, 95% CI) | 0.90 [0.54, 1.50] |
| 20.5 Mouth ulcers | 1 | 970 | Risk Ratio (M‐H, Fixed, 95% CI) | 1.00 [0.39, 2.56] |
| 20.6 Palpitations | 1 | 197 | Risk Ratio (M‐H, Fixed, 95% CI) | 8.06 [0.44, 147.68] |
| 20.7 Tingling | 1 | 970 | Risk Ratio (M‐H, Fixed, 95% CI) | 1.92 [0.59, 6.24] |
| Outcome or subgroup title | No. of studies | No. of participants | Statistical method | Effect size |
| 1 Clinical cases of malaria (RCTs) Show forest plot | 4 | 744 | Risk Ratio (M‐H, Fixed, 95% CI) | 1.35 [0.35, 5.19] |
| 2 Serious adverse events or effects (all studies) Show forest plot | 6 | Risk Ratio (M‐H, Random, 95% CI) | Subtotals only | |
| 2.1 RCTs (adverse events) | 3 | 682 | Risk Ratio (M‐H, Random, 95% CI) | 0.34 [0.01, 8.16] |
| 2.2 Cohort studies (adverse effects) | 3 | 3722 | Risk Ratio (M‐H, Random, 95% CI) | 1.53 [0.23, 10.24] |
| 3 Discontinuations due to adverse effects (all studies) Show forest plot | 14 | Risk Ratio (M‐H, Random, 95% CI) | Subtotals only | |
| 3.1 RCTs | 4 | 763 | Risk Ratio (M‐H, Random, 95% CI) | 1.08 [0.41, 2.87] |
| 3.2 Cohort studies | 10 | 10165 | Risk Ratio (M‐H, Random, 95% CI) | 0.92 [0.54, 1.55] |
| 4 Nausea (all studies) Show forest plot | 7 | Risk Ratio (M‐H, Fixed, 95% CI) | Subtotals only | |
| 4.1 Cohort studies (adverse effects) | 5 | 2683 | Risk Ratio (M‐H, Fixed, 95% CI) | 0.37 [0.30, 0.45] |
| 4.2 RCTs (adverse events) | 1 | 123 | Risk Ratio (M‐H, Fixed, 95% CI) | 2.71 [0.75, 9.74] |
| 4.3 Cohort studies (adverse events) | 1 | 668 | Risk Ratio (M‐H, Fixed, 95% CI) | 1.61 [1.06, 2.43] |
| 5 Vomiting (all studies) Show forest plot | 5 | Risk Ratio (M‐H, Fixed, 95% CI) | Subtotals only | |
| 5.1 Cohort studies (adverse effects) | 4 | 5071 | Risk Ratio (M‐H, Fixed, 95% CI) | 0.18 [0.12, 0.27] |
| 5.2 RCTs (adverse events) | 1 | 123 | Risk Ratio (M‐H, Fixed, 95% CI) | 2.03 [0.19, 21.84] |
| 6 Abdominal pain (all studies) Show forest plot | 6 | Risk Ratio (M‐H, Random, 95% CI) | Subtotals only | |
| 6.1 Cohort studies (adverse effects) | 4 | 2569 | Risk Ratio (M‐H, Random, 95% CI) | 0.30 [0.09, 1.07] |
| 6.2 RCTs (adverse events) | 1 | 123 | Risk Ratio (M‐H, Random, 95% CI) | 1.65 [0.74, 3.70] |
| 6.3 Cohort studies (adverse events) | 1 | 668 | Risk Ratio (M‐H, Random, 95% CI) | 1.34 [0.83, 2.18] |
| 7 Diarrhoea (all studies) Show forest plot | 8 | Risk Ratio (M‐H, Random, 95% CI) | Subtotals only | |
| 7.1 Cohort studies (adverse effects) | 5 | 5104 | Risk Ratio (M‐H, Random, 95% CI) | 0.28 [0.11, 0.73] |
| 7.2 RCTs (adverse events) | 2 | 376 | Risk Ratio (M‐H, Random, 95% CI) | 1.01 [0.78, 1.29] |
| 7.3 Cohort studies (adverse events) | 1 | 668 | Risk Ratio (M‐H, Random, 95% CI) | 3.58 [1.69, 7.59] |
| 8 Dyspepsia (all studies) Show forest plot | 5 | Risk Ratio (M‐H, Random, 95% CI) | Subtotals only | |
| 8.1 Cohort studies (adverse effects) | 5 | 5104 | Risk Ratio (M‐H, Random, 95% CI) | 0.26 [0.09, 0.74] |
| 9 Headache (all studies) Show forest plot | 7 | Risk Ratio (M‐H, Random, 95% CI) | Subtotals only | |
| 9.1 Cohort studies (adverse effects) | 5 | 3322 | Risk Ratio (M‐H, Random, 95% CI) | 1.21 [0.50, 2.92] |
| 9.2 RCTs (adverse events) | 1 | 123 | Risk Ratio (M‐H, Random, 95% CI) | 2.31 [1.25, 4.27] |
| 9.3 Cohort studies (adverse events) | 1 | 668 | Risk Ratio (M‐H, Random, 95% CI) | 2.45 [1.38, 4.34] |
| 10 Dizziness (all studies) Show forest plot | 8 | Risk Ratio (M‐H, Random, 95% CI) | Subtotals only | |
| 10.1 Cohort studies (adverse effects) | 5 | 2633 | Risk Ratio (M‐H, Random, 95% CI) | 3.49 [0.88, 13.75] |
| 10.2 RCTs (adverse events) | 1 | 123 | Risk Ratio (M‐H, Random, 95% CI) | 3.05 [1.30, 7.16] |
| 10.3 Cohort studies (adverse events) | 1 | 668 | Risk Ratio (M‐H, Random, 95% CI) | 2.40 [1.47, 3.90] |
| 10.4 Retrospective healthcare record analysis (adverse events) | 1 | 354959 | Risk Ratio (M‐H, Random, 95% CI) | 0.68 [0.62, 0.73] |
| 11 Abnormal dreams (all studies) Show forest plot | 6 | Risk Ratio (M‐H, Random, 95% CI) | Subtotals only | |
| 11.1 Cohort studies (adverse effects) | 4 | 2588 | Risk Ratio (M‐H, Random, 95% CI) | 10.49 [3.79, 29.10] |
| 11.2 RCTs (adverse events) | 1 | 123 | Risk Ratio (M‐H, Random, 95% CI) | 1.02 [0.07, 15.89] |
| 11.3 Cohort studies (adverse events) | 1 | 668 | Risk Ratio (M‐H, Random, 95% CI) | 4.33 [2.08, 9.00] |
| 12 Insomnia (all studies) Show forest plot | 7 | Risk Ratio (M‐H, Random, 95% CI) | Subtotals only | |
| 12.1 Cohort studies (adverse effects) | 4 | 3212 | Risk Ratio (M‐H, Random, 95% CI) | 4.14 [1.19, 14.44] |
| 12.2 RCTs (adverse events) | 1 | 123 | Risk Ratio (M‐H, Random, 95% CI) | 2.03 [0.65, 6.40] |
| 12.3 Cohort studies (adverse events) | 1 | 668 | Risk Ratio (M‐H, Random, 95% CI) | 4.54 [2.09, 9.83] |
| 12.4 Retrospective healthcare record analysis (adverse events) | 1 | 354959 | Risk Ratio (M‐H, Random, 95% CI) | 0.46 [0.43, 0.49] |
| 13 Anxiety (all studies) Show forest plot | 5 | Risk Ratio (M‐H, Fixed, 95% CI) | Subtotals only | |
| 13.1 Cohort studies (adverse effects) | 3 | 2559 | Risk Ratio (M‐H, Fixed, 95% CI) | 18.04 [9.32, 34.93] |
| 13.2 Cohort studies (adverse events) | 1 | 668 | Risk Ratio (M‐H, Fixed, 95% CI) | 8.74 [1.99, 38.40] |
| 13.3 Retrospective healthcare record analysis (adverse events) | 1 | 354959 | Risk Ratio (M‐H, Fixed, 95% CI) | 0.51 [0.47, 0.56] |
| 14 Depressed mood (all studies) Show forest plot | 5 | Risk Ratio (M‐H, Fixed, 95% CI) | Subtotals only | |
| 14.1 Cohort studies (adverse effects) | 2 | 2445 | Risk Ratio (M‐H, Fixed, 95% CI) | 11.43 [5.21, 25.07] |
| 14.2 Cohort studies (adverse events) | 1 | 668 | Risk Ratio (M‐H, Fixed, 95% CI) | 6.27 [1.82, 21.62] |
| 14.3 Retrospective healthcare record analysis (adverse events) | 2 | 376024 | Risk Ratio (M‐H, Fixed, 95% CI) | 0.55 [0.51, 0.60] |
| 15 Abnormal thoughts and perceptions Show forest plot | 4 | Risk Ratio (M‐H, Fixed, 95% CI) | Subtotals only | |
| 15.1 Cohort studies (adverse effects) | 2 | 2445 | Risk Ratio (M‐H, Fixed, 95% CI) | 6.60 [0.92, 47.20] |
| 15.2 Retrospective healthcare record analyses (adverse events) | 2 | 376024 | Risk Ratio (M‐H, Fixed, 95% CI) | 0.41 [0.26, 0.66] |
| 16 Pruritis (all studies) Show forest plot | 3 | Risk Ratio (M‐H, Fixed, 95% CI) | Subtotals only | |
| 16.1 Cohort studies (adverse effects) | 2 | 1794 | Risk Ratio (M‐H, Fixed, 95% CI) | 0.52 [0.30, 0.91] |
| 16.2 Cohort studies (adverse events) | 1 | 668 | Risk Ratio (M‐H, Fixed, 95% CI) | 2.69 [0.93, 7.78] |
| 17 Photosensitivity (all studies) Show forest plot | 3 | Risk Ratio (M‐H, Fixed, 95% CI) | Subtotals only | |
| 17.1 Cohort studies (adverse effects) | 2 | 1875 | Risk Ratio (M‐H, Fixed, 95% CI) | 0.08 [0.05, 0.11] |
| 17.2 Cohort studies (adverse events) | 1 | 668 | Risk Ratio (M‐H, Fixed, 95% CI) | 0.03 [0.00, 0.49] |
| 18 Yeast infection (all studies) Show forest plot | 2 | Risk Ratio (M‐H, Fixed, 95% CI) | Subtotals only | |
| 18.1 Cohort studies (adverse effects) | 1 | 1761 | Risk Ratio (M‐H, Fixed, 95% CI) | 0.10 [0.06, 0.16] |
| 18.2 Cohort studies (adverse events) | 1 | 354 | Risk Ratio (M‐H, Fixed, 95% CI) | 0.19 [0.06, 0.63] |
| 19 Visual impairment (all studies) Show forest plot | 2 | Risk Ratio (M‐H, Fixed, 95% CI) | Subtotals only | |
| 19.1 Cohort studies (adverse effects) | 2 | 1875 | Risk Ratio (M‐H, Fixed, 95% CI) | 2.37 [1.41, 3.99] |
| 20 Other adverse effects (cohort studies) Show forest plot | 6 | Risk Ratio (M‐H, Fixed, 95% CI) | Subtotals only | |
| 20.1 Alopecia | 2 | 1875 | Risk Ratio (M‐H, Fixed, 95% CI) | 3.44 [1.96, 6.03] |
| 20.2 Asthenia | 1 | 1761 | Risk Ratio (M‐H, Fixed, 95% CI) | 1.83 [0.89, 3.76] |
| 20.3 Balance disorder | 1 | 1761 | Risk Ratio (M‐H, Fixed, 95% CI) | 2.87 [1.48, 5.59] |
| 20.4 Decreased appetite | 1 | 734 | Risk Ratio (M‐H, Fixed, 95% CI) | 1.23 [0.42, 3.64] |
| 20.5 Fatigue | 2 | 74 | Risk Ratio (M‐H, Fixed, 95% CI) | 0.23 [0.03, 1.77] |
| 20.6 Hypoaesthesia | 2 | 2445 | Risk Ratio (M‐H, Fixed, 95% CI) | 11.48 [3.01, 43.70] |
| 20.7 Malaise | 1 | 734 | Risk Ratio (M‐H, Fixed, 95% CI) | 0.28 [0.11, 0.71] |
| 20.8 Mouth ulcers | 1 | 33 | Risk Ratio (M‐H, Fixed, 95% CI) | 0.5 [0.02, 11.42] |
| 20.9 Palpitations | 1 | 1761 | Risk Ratio (M‐H, Fixed, 95% CI) | 2.76 [0.16, 48.91] |
| 20.10 Tinnitus | 1 | 684 | Risk Ratio (M‐H, Fixed, 95% CI) | 7.20 [0.39, 133.30] |
| 21 Other adverse events (RCTs) Show forest plot | 1 | Risk Ratio (M‐H, Fixed, 95% CI) | Subtotals only | |
| 21.1 Constipation | 1 | 123 | Risk Ratio (M‐H, Fixed, 95% CI) | 2.03 [0.19, 21.84] |
| 21.2 Cough | 1 | 123 | Risk Ratio (M‐H, Fixed, 95% CI) | 0.53 [0.28, 1.01] |
| 21.3 Decreased appetite | 1 | 123 | Risk Ratio (M‐H, Fixed, 95% CI) | 3.56 [1.24, 10.20] |
| 21.4 Malaise | 1 | 123 | Risk Ratio (M‐H, Fixed, 95% CI) | 2.03 [0.88, 4.69] |
| 21.5 Palpitations | 1 | 123 | Risk Ratio (M‐H, Fixed, 95% CI) | 2.03 [0.19, 21.84] |
| 21.6 Pyrexia | 1 | 123 | Risk Ratio (M‐H, Fixed, 95% CI) | 2.85 [1.09, 7.42] |
| 21.7 Sexual dysfunction | 1 | 123 | Risk Ratio (M‐H, Fixed, 95% CI) | 3.05 [0.33, 28.51] |
| 21.8 Somnolence | 1 | 123 | Risk Ratio (M‐H, Fixed, 95% CI) | 2.03 [0.19, 21.84] |
| 22 Other adverse events (cohort studies) Show forest plot | 3 | Risk Ratio (M‐H, Fixed, 95% CI) | Subtotals only | |
| 22.1 Adjustment disorder | 1 | 354959 | Risk Ratio (M‐H, Fixed, 95% CI) | 0.43 [0.40, 0.45] |
| 22.2 Confusion | 1 | 354959 | Risk Ratio (M‐H, Fixed, 95% CI) | 2.18 [0.24, 19.49] |
| 22.3 Convulsions | 1 | 354959 | Risk Ratio (M‐H, Fixed, 95% CI) | 0.58 [0.45, 0.75] |
| 22.4 Hallucinations | 1 | 354959 | Risk Ratio (M‐H, Fixed, 95% CI) | 0.18 [0.08, 0.45] |
| 22.5 Paranoia | 1 | 354959 | Risk Ratio (M‐H, Fixed, 95% CI) | 0.40 [0.10, 1.63] |
| 22.6 Palpitations | 1 | 668 | Risk Ratio (M‐H, Fixed, 95% CI) | 13.44 [1.73, 104.38] |
| 22.7 Panic attacks | 1 | 21065 | Risk Ratio (M‐H, Fixed, 95% CI) | 4.16 [0.55, 31.49] |
| 22.8 PTSD | 1 | 354959 | Risk Ratio (M‐H, Fixed, 95% CI) | 0.58 [0.53, 0.64] |
| 22.9 Rash | 1 | 668 | Risk Ratio (M‐H, Fixed, 95% CI) | 1.21 [0.50, 2.94] |
| 22.10 Suicidal ideation | 1 | 354959 | Risk Ratio (M‐H, Fixed, 95% CI) | 0.38 [0.31, 0.47] |
| 22.11 Suicide | 2 | 376024 | Risk Ratio (M‐H, Fixed, 95% CI) | 1.21 [0.32, 4.56] |
| 22.12 Tinnitus | 1 | 354959 | Risk Ratio (M‐H, Fixed, 95% CI) | 0.65 [0.61, 0.71] |
| 23 Adherence (cohort studies) Show forest plot | 14 | Risk Ratio (M‐H, Fixed, 95% CI) | Subtotals only | |
| 23.1 Adherence during travel | 13 | 15583 | Risk Ratio (M‐H, Fixed, 95% CI) | 1.15 [1.12, 1.18] |
| 23.2 Adherence in the post‐travel period | 4 | 840 | Risk Ratio (M‐H, Fixed, 95% CI) | 1.08 [0.95, 1.22] |
| Outcome or subgroup title | No. of studies | No. of participants | Statistical method | Effect size |
| 1 Clinical cases of malaria (RCTs) Show forest plot | 2 | 1293 | Odds Ratio (M‐H, Fixed, 95% CI) | 0.0 [0.0, 0.0] |
| 2 Serious adverse events or effects (all studies) Show forest plot | 3 | 3591 | Risk Ratio (M‐H, Fixed, 95% CI) | 1.40 [0.08, 23.22] |
| 2.1 Cohort studies | 3 | 3591 | Risk Ratio (M‐H, Fixed, 95% CI) | 1.40 [0.08, 23.22] |
| 3 Discontinuations due to adverse effects (all studies) Show forest plot | 12 | Risk Ratio (M‐H, Random, 95% CI) | Subtotals only | |
| 3.1 RCTs | 3 | 1438 | Risk Ratio (M‐H, Random, 95% CI) | 2.86 [1.53, 5.31] |
| 3.2 Cohort studies | 9 | 7785 | Risk Ratio (M‐H, Random, 95% CI) | 2.73 [1.83, 4.08] |
| 4 Nausea (all studies) Show forest plot | 8 | Risk Ratio (M‐H, Fixed, 95% CI) | Subtotals only | |
| 4.1 RCTs (adverse effects) | 1 | 976 | Risk Ratio (M‐H, Fixed, 95% CI) | 2.72 [1.52, 4.86] |
| 4.2 Cohort studies (adverse effects) | 7 | 3509 | Risk Ratio (M‐H, Fixed, 95% CI) | 2.50 [1.54, 4.06] |
| 5 Vomiting (all studies) Show forest plot | 4 | Risk Ratio (M‐H, Random, 95% CI) | Subtotals only | |
| 5.1 RCTs (adverse effects) | 1 | 976 | Risk Ratio (M‐H, Random, 95% CI) | 1.31 [0.49, 3.50] |
| 5.2 Cohort studies (adverse effects) | 3 | 2180 | Risk Ratio (M‐H, Random, 95% CI) | 0.57 [0.08, 4.09] |
| 6 Abdominal pain (all studies) Show forest plot | 8 | Risk Ratio (M‐H, Fixed, 95% CI) | Subtotals only | |
| 6.1 RCTs (adverse effects) | 1 | 976 | Risk Ratio (M‐H, Fixed, 95% CI) | 0.90 [0.52, 1.56] |
| 6.2 Cohort studies (adverse effects) | 7 | 3509 | Risk Ratio (M‐H, Fixed, 95% CI) | 0.64 [0.38, 1.07] |
| 7 Diarrhoea (all studies) Show forest plot | 8 | Risk Ratio (M‐H, Fixed, 95% CI) | Subtotals only | |
| 7.1 RCTs (adverse effects) | 1 | 976 | Risk Ratio (M‐H, Fixed, 95% CI) | 0.94 [0.60, 1.47] |
| 7.2 Cohort studies (adverse effects) | 7 | 3509 | Risk Ratio (M‐H, Fixed, 95% CI) | 0.85 [0.53, 1.35] |
| 8 Mouth ulcers (all studies) Show forest plot | 3 | Risk Ratio (M‐H, Fixed, 95% CI) | Subtotals only | |
| 8.1 RCTs (adverse effects) | 1 | 976 | Risk Ratio (M‐H, Fixed, 95% CI) | 1.45 [0.70, 3.00] |
| 8.2 Cohort studies (adverse effects) | 2 | 783 | Risk Ratio (M‐H, Fixed, 95% CI) | 0.12 [0.04, 0.37] |
| 9 Headache (all studies) Show forest plot | 9 | Risk Ratio (M‐H, Fixed, 95% CI) | Subtotals only | |
| 9.1 RCTs (adverse effects) | 1 | 976 | Risk Ratio (M‐H, Fixed, 95% CI) | 1.72 [0.99, 2.99] |
| 9.2 Cohort studies (adverse effects) | 8 | 4163 | Risk Ratio (M‐H, Fixed, 95% CI) | 3.42 [1.71, 6.82] |
| 10 Dizziness (all studies) Show forest plot | 10 | Risk Ratio (M‐H, Fixed, 95% CI) | Subtotals only | |
| 10.1 RCTs (adverse effects) | 1 | 976 | Risk Ratio (M‐H, Fixed, 95% CI) | 3.99 [2.08, 7.64] |
| 10.2 Cohort studies (adverse effects) | 8 | 3986 | Risk Ratio (M‐H, Fixed, 95% CI) | 3.83 [2.23, 6.58] |
| 10.3 Retrospective healthcare record analysis (adverse events) | 1 | 49419 | Risk Ratio (M‐H, Fixed, 95% CI) | 1.23 [1.04, 1.46] |
| 11 Abnormal dreams (all studies) Show forest plot | 8 | Risk Ratio (M‐H, Random, 95% CI) | Subtotals only | |
| 11.1 RCTs (adverse effects) | 1 | 976 | Risk Ratio (M‐H, Random, 95% CI) | 2.04 [1.37, 3.04] |
| 11.2 Cohort studies (adverse effects) | 7 | 3848 | Risk Ratio (M‐H, Random, 95% CI) | 6.81 [1.65, 28.15] |
| 12 Insomnia (all studies) Show forest plot | 10 | Risk Ratio (M‐H, Fixed, 95% CI) | Subtotals only | |
| 12.1 RCTs (adverse effects) | 1 | 976 | Risk Ratio (M‐H, Fixed, 95% CI) | 4.42 [2.56, 7.64] |
| 12.2 Cohort studies (adverse effects) | 8 | 3986 | Risk Ratio (M‐H, Fixed, 95% CI) | 7.29 [4.37, 12.16] |
| 12.3 Retrospective healthcare record analysis (adverse events) | 1 | 49419 | Risk Ratio (M‐H, Fixed, 95% CI) | 1.24 [1.06, 1.44] |
| 13 Anxiety (all studies) Show forest plot | 6 | Risk Ratio (M‐H, Fixed, 95% CI) | Subtotals only | |
| 13.1 RCTs (adverse effects) | 1 | 976 | Risk Ratio (M‐H, Fixed, 95% CI) | 6.12 [1.82, 20.66] |
| 13.2 Cohort studies (adverse effects) | 4 | 2664 | Risk Ratio (M‐H, Fixed, 95% CI) | 10.10 [3.48, 29.32] |
| 13.3 Retrospective healthcare record analysis (adverse events) | 1 | 49419 | Risk Ratio (M‐H, Fixed, 95% CI) | 1.54 [1.28, 1.85] |
| 14 Depressed mood (all studies) Show forest plot | 8 | Risk Ratio (M‐H, Fixed, 95% CI) | Subtotals only | |
| 14.1 RCTs (adverse effects) | 1 | 976 | Risk Ratio (M‐H, Fixed, 95% CI) | 5.78 [1.71, 19.61] |
| 14.2 Cohort studies (adverse effects) | 6 | 3624 | Risk Ratio (M‐H, Fixed, 95% CI) | 8.02 [3.56, 18.07] |
| 14.3 Retrospective healthcare record analysis (adverse events) | 1 | 49419 | Risk Ratio (M‐H, Fixed, 95% CI) | 1.93 [1.56, 2.38] |
| 15 Abnormal thoughts and perceptions (all studies) Show forest plot | 4 | Risk Ratio (M‐H, Fixed, 95% CI) | Subtotals only | |
| 15.1 Cohort studies (adverse effects) | 3 | 2433 | Risk Ratio (M‐H, Fixed, 95% CI) | 1.50 [0.30, 7.42] |
| 15.2 Retrospective healthcare record analysis (adverse events) | 1 | 49419 | Risk Ratio (M‐H, Fixed, 95% CI) | 3.00 [0.69, 12.97] |
| 16 Pruritis (all studies) Show forest plot | 4 | Risk Ratio (M‐H, Fixed, 95% CI) | Subtotals only | |
| 16.1 RCTs (adverse effects) | 1 | 976 | Risk Ratio (M‐H, Fixed, 95% CI) | 1.28 [0.60, 2.70] |
| 16.2 Cohort studies (adverse effects) | 3 | 1824 | Risk Ratio (M‐H, Fixed, 95% CI) | 2.07 [0.40, 10.68] |
| 17 Visual impairment (all studies) Show forest plot | 3 | Risk Ratio (M‐H, Fixed, 95% CI) | Subtotals only | |
| 17.1 RCTs (adverse effects) | 1 | 976 | Risk Ratio (M‐H, Fixed, 95% CI) | 2.04 [0.88, 4.73] |
| 17.2 Cohort studies (adverse effects) | 2 | 1956 | Risk Ratio (M‐H, Fixed, 95% CI) | 1.17 [0.29, 4.72] |
| 18 Other adverse effects (cohort studies) Show forest plot | 8 | Risk Ratio (M‐H, Fixed, 95% CI) | Subtotals only | |
| 18.1 Allergic reaction | 1 | 316 | Risk Ratio (M‐H, Fixed, 95% CI) | 0.79 [0.04, 14.48] |
| 18.2 Alopecia | 1 | 1469 | Risk Ratio (M‐H, Fixed, 95% CI) | 4.55 [0.30, 70.01] |
| 18.3 Asthenia | 2 | 1956 | Risk Ratio (M‐H, Fixed, 95% CI) | 1.84 [0.26, 13.12] |
| 18.4 Balance disorder | 1 | 1469 | Risk Ratio (M‐H, Fixed, 95% CI) | 2.86 [0.19, 44.19] |
| 18.5 Cough | 1 | 652 | Risk Ratio (M‐H, Fixed, 95% CI) | 0.49 [0.08, 2.92] |
| 18.6 Disturbance in attention | 3 | 1363 | Risk Ratio (M‐H, Fixed, 95% CI) | 4.45 [1.84, 10.77] |
| 18.7 Dyspepsia | 2 | 362 | Risk Ratio (M‐H, Fixed, 95% CI) | 0.50 [0.17, 1.46] |
| 18.8 Fatigue | 2 | 618 | Risk Ratio (M‐H, Fixed, 95% CI) | 4.62 [0.47, 45.56] |
| 18.9 Hypoaesthesia | 2 | 1946 | Risk Ratio (M‐H, Fixed, 95% CI) | 4.45 [0.93, 21.26] |
| 18.10 Loss of appetite | 1 | 652 | Risk Ratio (M‐H, Fixed, 95% CI) | 0.69 [0.33, 1.43] |
| 18.11 Muscle pain | 1 | 652 | Risk Ratio (M‐H, Fixed, 95% CI) | 7.57 [0.45, 127.80] |
| 18.12 Palpitations | 3 | 2180 | Risk Ratio (M‐H, Fixed, 95% CI) | 3.34 [0.73, 15.26] |
| 18.13 Photosensitization | 2 | 718 | Risk Ratio (M‐H, Fixed, 95% CI) | 0.69 [0.10, 4.92] |
| 18.14 Pyrexia | 1 | 652 | Risk Ratio (M‐H, Fixed, 95% CI) | 4.28 [0.24, 75.57] |
| 18.15 Rash | 2 | 711 | Risk Ratio (M‐H, Fixed, 95% CI) | 0.96 [0.15, 6.09] |
| 18.16 Restlessness | 1 | 487 | Risk Ratio (M‐H, Fixed, 95% CI) | 5.24 [0.32, 84.52] |
| 18.17 Slight illness | 1 | 487 | Risk Ratio (M‐H, Fixed, 95% CI) | 5.83 [0.36, 93.84] |
| 18.18 Somnolence | 1 | 487 | Risk Ratio (M‐H, Fixed, 95% CI) | 1.55 [0.21, 11.40] |
| 18.19 Tinnitus | 1 | 477 | Risk Ratio (M‐H, Fixed, 95% CI) | 2.31 [0.13, 42.64] |
| 18.20 Circulatory disorders | 1 | 224 | Risk Ratio (M‐H, Fixed, 95% CI) | 6.38 [0.36, 114.01] |
| 19 Other adverse events (cohort studies) Show forest plot | 1 | Risk Ratio (M‐H, Fixed, 95% CI) | Subtotals only | |
| 19.1 Adjustment disorder | 1 | 49419 | Risk Ratio (M‐H, Fixed, 95% CI) | 1.76 [1.54, 2.02] |
| 19.2 Confusion | 1 | 49419 | Risk Ratio (M‐H, Fixed, 95% CI) | 1.06 [0.04, 25.96] |
| 19.3 Convulsions | 1 | 49419 | Risk Ratio (M‐H, Fixed, 95% CI) | 1.35 [0.79, 2.30] |
| 19.4 Hallucinations | 1 | 49419 | Risk Ratio (M‐H, Fixed, 95% CI) | 0.25 [0.08, 0.79] |
| 19.5 Paranoia | 1 | 49419 | Risk Ratio (M‐H, Fixed, 95% CI) | 1.76 [0.08, 36.72] |
| 19.6 PTSD | 1 | 49419 | Risk Ratio (M‐H, Fixed, 95% CI) | 2.51 [1.93, 3.26] |
| 19.7 Suicidal ideation | 1 | 49419 | Risk Ratio (M‐H, Fixed, 95% CI) | 1.69 [1.03, 2.77] |
| 19.8 Suicide | 1 | 49419 | Risk Ratio (M‐H, Fixed, 95% CI) | 0.71 [0.06, 7.78] |
| 19.9 Tinnitus | 1 | 49419 | Risk Ratio (M‐H, Fixed, 95% CI) | 1.42 [1.21, 1.68] |
| 20 Adherence (RCTs) Show forest plot | 2 | Risk Ratio (M‐H, Random, 95% CI) | Subtotals only | |
| 20.1 van Riemsdijk 2002 | 1 | 119 | Risk Ratio (M‐H, Random, 95% CI) | 0.95 [0.88, 1.02] |
| 20.2 Overbosch 2001; during travel | 1 | 966 | Risk Ratio (M‐H, Random, 95% CI) | 0.98 [0.95, 1.01] |
| 20.3 Overbosch 2001; post‐travel | 1 | 966 | Risk Ratio (M‐H, Random, 95% CI) | 0.80 [0.74, 0.85] |
| 21 Adherence (cohort studies) Show forest plot | 7 | Risk Ratio (M‐H, Random, 95% CI) | Subtotals only | |
| 21.1 During travel | 6 | 5577 | Risk Ratio (M‐H, Random, 95% CI) | 1.08 [0.86, 1.34] |
| 21.2 Post‐travel | 2 | 422 | Risk Ratio (M‐H, Random, 95% CI) | 0.89 [0.64, 1.23] |
| Outcome or subgroup title | No. of studies | No. of participants | Statistical method | Effect size |
| 1 Clinical cases of malaria (RCTs) Show forest plot | 4 | 877 | Risk Ratio (M‐H, Fixed, 95% CI) | 0.38 [0.28, 0.52] |
| 2 Serious adverse events or effects (all studies) Show forest plot | 10 | Risk Ratio (M‐H, Fixed, 95% CI) | Subtotals only | |
| 2.1 RCTs | 4 | 1000 | Risk Ratio (M‐H, Fixed, 95% CI) | 2.77 [0.32, 23.85] |
| 2.2 Cohort studies | 6 | 79257 | Risk Ratio (M‐H, Fixed, 95% CI) | 1.14 [0.62, 2.07] |
| 3 Discontinuations due to adverse effects (all studies) Show forest plot | 11 | Risk Ratio (M‐H, Fixed, 95% CI) | Subtotals only | |
| 3.1 RCTs | 3 | 815 | Risk Ratio (M‐H, Fixed, 95% CI) | 1.60 [0.61, 4.18] |
| 3.2 Cohort studies in short‐term travellers | 6 | 55397 | Risk Ratio (M‐H, Fixed, 95% CI) | 0.99 [0.78, 1.26] |
| 3.3 Cohort studies in longer term occupational travellers | 2 | 6085 | Risk Ratio (M‐H, Fixed, 95% CI) | 2.97 [2.41, 3.66] |
| 4 Nausea (all studies) Show forest plot | 7 | Risk Ratio (M‐H, Random, 95% CI) | Subtotals only | |
| 4.1 Cohort studies (adverse effects) | 6 | 58984 | Risk Ratio (M‐H, Random, 95% CI) | 1.23 [0.89, 1.68] |
| 4.2 RCTs (adverse events) | 1 | 359 | Risk Ratio (M‐H, Random, 95% CI) | 1.01 [0.57, 1.79] |
| 5 Vomiting (all studies) Show forest plot | 6 | Risk Ratio (M‐H, Fixed, 95% CI) | Subtotals only | |
| 5.1 Cohort studies (adverse effects) | 5 | 5577 | Risk Ratio (M‐H, Fixed, 95% CI) | 1.05 [0.78, 1.40] |
| 5.2 RCTs (adverse events) | 1 | 359 | Risk Ratio (M‐H, Fixed, 95% CI) | 1.12 [0.36, 3.49] |
| 6 Abdominal pain (all studies) Show forest plot | 6 | Risk Ratio (M‐H, Fixed, 95% CI) | Subtotals only | |
| 6.1 Cohort studies (adverse effects) | 4 | 5440 | Risk Ratio (M‐H, Fixed, 95% CI) | 0.99 [0.80, 1.22] |
| 6.2 RCTs (adverse events) | 2 | 569 | Risk Ratio (M‐H, Fixed, 95% CI) | 0.71 [0.37, 1.36] |
| 7 Diarrhoea (all studies) Show forest plot | 8 | Risk Ratio (M‐H, Fixed, 95% CI) | Subtotals only | |
| 7.1 Cohort studies (adverse effects) | 5 | 5577 | Risk Ratio (M‐H, Fixed, 95% CI) | 0.84 [0.74, 0.95] |
| 7.2 RCTs (adverse events) | 3 | 772 | Risk Ratio (M‐H, Fixed, 95% CI) | 0.83 [0.46, 1.50] |
| 8 Headache (all studies) Show forest plot | 9 | Risk Ratio (M‐H, Random, 95% CI) | Subtotals only | |
| 8.1 Cohort studies (adverse effects) | 6 | 56998 | Risk Ratio (M‐H, Random, 95% CI) | 0.84 [0.53, 1.34] |
| 8.2 RCTs (adverse events) | 3 | 772 | Risk Ratio (M‐H, Random, 95% CI) | 0.89 [0.61, 1.31] |
| 9 Dizziness (all studies) Show forest plot | 7 | Risk Ratio (M‐H, Fixed, 95% CI) | Subtotals only | |
| 9.1 Cohort studies (adverse effects) | 5 | 58847 | Risk Ratio (M‐H, Fixed, 95% CI) | 1.51 [1.34, 1.70] |
| 9.2 RCTs (adverse events) | 2 | 569 | Risk Ratio (M‐H, Fixed, 95% CI) | 0.72 [0.35, 1.46] |
| 10 Abnormal dreams (all studies) Show forest plot | 5 | Risk Ratio (M‐H, Fixed, 95% CI) | Subtotals only | |
| 10.1 Cohort studies (adverse effects) | 4 | 2845 | Risk Ratio (M‐H, Fixed, 95% CI) | 1.21 [1.10, 1.33] |
| 10.2 RCTs (adverse events) | 1 | 359 | Risk Ratio (M‐H, Fixed, 95% CI) | 2.70 [1.05, 6.95] |
| 11 Insomnia (all studies) Show forest plot | 6 | Risk Ratio (M‐H, Random, 95% CI) | Subtotals only | |
| 11.1 Cohort studies (adverse effects) | 5 | 56952 | Risk Ratio (M‐H, Random, 95% CI) | 1.81 [0.73, 4.51] |
| 11.2 RCTs (adverse events) | 1 | 359 | Risk Ratio (M‐H, Random, 95% CI) | 1.19 [0.76, 1.84] |
| 12 Anxiety (all studies) Show forest plot | 3 | Risk Ratio (M‐H, Fixed, 95% CI) | Subtotals only | |
| 12.1 Cohort studies (adverse effects) | 3 | 3408 | Risk Ratio (M‐H, Fixed, 95% CI) | 6.30 [4.37, 9.09] |
| 13 Depressed mood (all studies) Show forest plot | 5 | Risk Ratio (M‐H, Random, 95% CI) | Subtotals only | |
| 13.1 Cohort studies (adverse effects) | 5 | 58855 | Risk Ratio (M‐H, Random, 95% CI) | 3.14 [1.15, 8.57] |
| 14 Abnormal thoughts and perceptions Show forest plot | 4 | Risk Ratio (M‐H, Fixed, 95% CI) | Subtotals only | |
| 14.1 Cohort studies (adverse effects) | 4 | 4831 | Risk Ratio (M‐H, Fixed, 95% CI) | 5.49 [2.65, 11.35] |
| 15 Pruritis (all studies) Show forest plot | 4 | Risk Ratio (M‐H, Random, 95% CI) | Subtotals only | |
| 15.1 Cohort studies (adverse effects) | 2 | 55544 | Risk Ratio (M‐H, Random, 95% CI) | 1.13 [0.92, 1.40] |
| 15.2 RCTs (adverse events) | 2 | 413 | Risk Ratio (M‐H, Random, 95% CI) | 0.28 [0.03, 2.93] |
| 16 Visual impairment (all studies) Show forest plot | 6 | Risk Ratio (M‐H, Random, 95% CI) | Subtotals only | |
| 16.1 Cohort studies (adverse effects) | 5 | 58847 | Risk Ratio (M‐H, Random, 95% CI) | 1.10 [0.50, 2.44] |
| 16.2 RCTs (adverse events) | 1 | 210 | Risk Ratio (M‐H, Random, 95% CI) | 0.14 [0.01, 2.63] |
| 17 Vertigo (all studies) Show forest plot | 1 | Risk Ratio (M‐H, Fixed, 95% CI) | Subtotals only | |
| 17.1 Cohort studies (adverse effects) | 1 | 746 | Risk Ratio (M‐H, Fixed, 95% CI) | 1.13 [0.05, 23.43] |
| 18 Cohort studies in travellers; prespecified adverse effects Show forest plot | 6 | Risk Ratio (M‐H, Random, 95% CI) | Subtotals only | |
| 18.1 Vertigo | 1 | 746 | Risk Ratio (M‐H, Random, 95% CI) | 1.13 [0.05, 23.43] |
| 18.2 Nausea | 5 | 56847 | Risk Ratio (M‐H, Random, 95% CI) | 1.42 [0.94, 2.13] |
| 18.3 Vomiting | 4 | 3440 | Risk Ratio (M‐H, Random, 95% CI) | 0.89 [0.55, 1.42] |
| 18.4 Abdominal pain | 3 | 3303 | Risk Ratio (M‐H, Random, 95% CI) | 0.98 [0.74, 1.30] |
| 18.5 Diarrhoea | 4 | 3440 | Risk Ratio (M‐H, Random, 95% CI) | 1.22 [0.57, 2.64] |
| 18.6 Headache | 5 | 54861 | Risk Ratio (M‐H, Random, 95% CI) | 1.12 [0.48, 2.65] |
| 18.7 Dizziness | 4 | 56710 | Risk Ratio (M‐H, Random, 95% CI) | 1.52 [1.10, 2.10] |
| 18.8 Abnormal dreams | 3 | 708 | Risk Ratio (M‐H, Random, 95% CI) | 4.21 [0.57, 31.33] |
| 18.9 Insomnia | 4 | 54815 | Risk Ratio (M‐H, Random, 95% CI) | 1.56 [0.40, 6.10] |
| 18.10 Anxiety | 2 | 1271 | Risk Ratio (M‐H, Random, 95% CI) | 3.94 [0.53, 29.48] |
| 18.11 Depressed mood | 4 | 56710 | Risk Ratio (M‐H, Random, 95% CI) | 2.49 [0.75, 8.31] |
| 18.12 Abnormal thoughts or perceptions | 3 | 2694 | Risk Ratio (M‐H, Random, 95% CI) | 4.42 [1.58, 12.40] |
| 18.13 Pruritis | 1 | 53407 | Risk Ratio (M‐H, Random, 95% CI) | 1.18 [0.94, 1.48] |
| 18.14 Visual impairment | 4 | 56710 | Risk Ratio (M‐H, Random, 95% CI) | 0.66 [0.55, 0.79] |
| 19 Other adverse effects (cohort studies) Show forest plot | 5 | Risk Ratio (M‐H, Fixed, 95% CI) | Subtotals only | |
| 19.1 Altered spatial perception | 1 | 2032 | Risk Ratio (M‐H, Fixed, 95% CI) | 3.16 [1.55, 6.45] |
| 19.2 Alopecia | 1 | 2137 | Risk Ratio (M‐H, Fixed, 95% CI) | 1.69 [1.27, 2.25] |
| 19.3 Asthenia | 3 | 3408 | Risk Ratio (M‐H, Fixed, 95% CI) | 1.52 [0.97, 2.40] |
| 19.4 Balance disorder | 1 | 2137 | Risk Ratio (M‐H, Fixed, 95% CI) | 3.59 [2.15, 6.00] |
| 19.5 Confusion | 1 | 525 | Risk Ratio (M‐H, Fixed, 95% CI) | 2.03 [0.11, 36.31] |
| 19.6 Decreased appetite | 1 | 2032 | Risk Ratio (M‐H, Fixed, 95% CI) | 1.17 [0.87, 1.57] |
| 19.7 Fatigue | 1 | 525 | Risk Ratio (M‐H, Fixed, 95% CI) | 2.37 [0.57, 9.80] |
| 19.8 Hypoaesthesia | 1 | 2137 | Risk Ratio (M‐H, Fixed, 95% CI) | 20.26 [1.23, 333.93] |
| 19.9 Irritability | 1 | 746 | Risk Ratio (M‐H, Fixed, 95% CI) | 4.75 [0.28, 80.59] |
| 19.10 Mouth ulcers | 2 | 55439 | Risk Ratio (M‐H, Fixed, 95% CI) | 1.37 [1.01, 1.87] |
| 19.11 Paraesthesia | 2 | 2778 | Risk Ratio (M‐H, Fixed, 95% CI) | 2.22 [1.27, 3.89] |
| 19.12 Palpitations | 3 | 3408 | Risk Ratio (M‐H, Fixed, 95% CI) | 4.71 [0.91, 24.26] |
| 19.13 Photosensitization | 2 | 2662 | Risk Ratio (M‐H, Fixed, 95% CI) | 0.89 [0.52, 1.53] |
| 19.14 Restlessness | 1 | 525 | Risk Ratio (M‐H, Fixed, 95% CI) | 4.74 [0.65, 34.46] |
| 19.15 Slight illness | 1 | 525 | Risk Ratio (M‐H, Fixed, 95% CI) | 2.65 [0.64, 10.87] |
| 19.16 Somnolence | 1 | 525 | Risk Ratio (M‐H, Fixed, 95% CI) | 6.08 [0.37, 100.36] |
| 19.17 Yeast infection | 1 | 2137 | Risk Ratio (M‐H, Fixed, 95% CI) | 1.15 [0.53, 2.49] |
| 20 Other adverse events (RCTs) Show forest plot | 2 | Risk Ratio (M‐H, Fixed, 95% CI) | Subtotals only | |
| 20.1 Abdominal distension | 1 | 359 | Risk Ratio (M‐H, Fixed, 95% CI) | 3.13 [0.64, 15.27] |
| 20.2 Anger | 1 | 359 | Risk Ratio (M‐H, Fixed, 95% CI) | 0.33 [0.07, 1.55] |
| 20.3 Disturbance in attention | 1 | 359 | Risk Ratio (M‐H, Fixed, 95% CI) | 3.16 [0.61, 16.47] |
| 20.4 Irritability | 1 | 359 | Risk Ratio (M‐H, Fixed, 95% CI) | 1.08 [0.45, 2.64] |
| 20.5 Loss of appetite | 1 | 359 | Risk Ratio (M‐H, Fixed, 95% CI) | 1.06 [0.35, 3.25] |
| 20.6 Malaise | 1 | 203 | Risk Ratio (M‐H, Fixed, 95% CI) | 0.32 [0.01, 7.85] |
| 20.7 Mood altered | 1 | 359 | Risk Ratio (M‐H, Fixed, 95% CI) | 1.13 [0.29, 4.34] |
| 21 Pregnancy related outcomes (RCTs) Show forest plot | 1 | Risk Ratio (M‐H, Fixed, 95% CI) | Subtotals only | |
| 21.1 Spontaneous abortions | 1 | 2334 | Risk Ratio (M‐H, Fixed, 95% CI) | 0.80 [0.36, 1.79] |
| 21.2 Still births | 1 | 2334 | Risk Ratio (M‐H, Fixed, 95% CI) | 1.01 [0.67, 1.52] |
| 21.3 Congenital malformations | 1 | 2334 | Risk Ratio (M‐H, Fixed, 95% CI) | 0.0 [0.0, 0.0] |
| 22 Adherence (cohort studies) Show forest plot | 6 | Risk Ratio (M‐H, Random, 95% CI) | Subtotals only | |
| 22.1 Short‐term travellers | 3 | 852 | Risk Ratio (M‐H, Random, 95% CI) | 1.00 [0.90, 1.13] |
| 22.2 Short‐term travellers: after return | 1 | 46 | Risk Ratio (M‐H, Random, 95% CI) | 1.00 [0.54, 1.87] |
| 22.3 Longer‐term occupational travellers | 2 | 5777 | Risk Ratio (M‐H, Random, 95% CI) | 2.02 [1.80, 2.26] |
| Outcome or subgroup title | No. of studies | No. of participants | Statistical method | Effect size |
| 1 Nausea; effects Show forest plot | 12 | Risk Ratio (M‐H, Random, 95% CI) | Subtotals only | |
| 1.1 RCTs | 1 | 976 | Risk Ratio (M‐H, Random, 95% CI) | 2.72 [1.52, 4.86] |
| 1.2 Cohort studies | 11 | 5973 | Risk Ratio (M‐H, Random, 95% CI) | 1.72 [0.78, 3.77] |
| 2 Abdominal pain; effects Show forest plot | 10 | Risk Ratio (M‐H, Random, 95% CI) | Subtotals only | |
| 2.1 RCTs | 1 | 976 | Risk Ratio (M‐H, Random, 95% CI) | 0.90 [0.52, 1.56] |
| 2.2 Cohort studies | 9 | 4494 | Risk Ratio (M‐H, Random, 95% CI) | 0.49 [0.27, 0.87] |
| 3 Diarrhoea; effects Show forest plot | 11 | Risk Ratio (M‐H, Random, 95% CI) | Subtotals only | |
| 3.1 RCTs | 1 | 976 | Risk Ratio (M‐H, Random, 95% CI) | 0.94 [0.60, 1.47] |
| 3.2 Cohort studies | 10 | 7648 | Risk Ratio (M‐H, Random, 95% CI) | 0.61 [0.28, 1.34] |
| 4 Headache; effects Show forest plot | 10 | Risk Ratio (M‐H, Random, 95% CI) | Subtotals only | |
| 4.1 RCTs | 1 | 976 | Risk Ratio (M‐H, Random, 95% CI) | 1.72 [0.99, 2.99] |
| 4.2 Cohort studies | 9 | 5592 | Risk Ratio (M‐H, Random, 95% CI) | 2.19 [1.22, 3.93] |
| 5 Dizziness; effects Show forest plot | 10 | Risk Ratio (M‐H, Random, 95% CI) | Subtotals only | |
| 5.1 RCTs | 1 | 976 | Risk Ratio (M‐H, Random, 95% CI) | 3.99 [2.08, 7.64] |
| 5.2 Cohort studies | 9 | 4606 | Risk Ratio (M‐H, Random, 95% CI) | 3.17 [1.58, 6.35] |
| 6 Abnormal dreams; effects Show forest plot | 8 | Risk Ratio (M‐H, Random, 95% CI) | Subtotals only | |
| 6.1 RCTs | 1 | 976 | Risk Ratio (M‐H, Random, 95% CI) | 2.04 [1.37, 3.04] |
| 6.2 Cohort studies | 7 | 4543 | Risk Ratio (M‐H, Random, 95% CI) | 7.30 [2.51, 21.18] |
| 7 Insomnia; effects Show forest plot | 10 | Risk Ratio (M‐H, Random, 95% CI) | Subtotals only | |
| 7.1 RCTs | 1 | 976 | Risk Ratio (M‐H, Random, 95% CI) | 4.42 [2.56, 7.64] |
| 7.2 Cohort studies | 9 | 5299 | Risk Ratio (M‐H, Random, 95% CI) | 5.70 [2.83, 11.47] |
| 8 Anxiety; effects Show forest plot | 5 | Risk Ratio (M‐H, Random, 95% CI) | Subtotals only | |
| 8.1 RCTs | 1 | 976 | Risk Ratio (M‐H, Random, 95% CI) | 6.12 [1.82, 20.66] |
| 8.2 Cohort studies | 4 | 3390 | Risk Ratio (M‐H, Random, 95% CI) | 15.26 [8.66, 26.89] |
| 9 Depressed mood; effects Show forest plot | 7 | Risk Ratio (M‐H, Random, 95% CI) | Subtotals only | |
| 9.1 RCTs | 1 | 976 | Risk Ratio (M‐H, Random, 95% CI) | 5.78 [1.71, 19.61] |
| 9.2 Cohort studies | 6 | 4236 | Risk Ratio (M‐H, Random, 95% CI) | 7.82 [3.79, 16.12] |
| 10 Abnormal thoughts or perceptions; effects Show forest plot | 3 | Risk Ratio (M‐H, Random, 95% CI) | Subtotals only | |
| 10.1 Cohort studies | 3 | 3045 | Risk Ratio (M‐H, Random, 95% CI) | 4.20 [0.81, 21.87] |
| 11 Pruritis; effects Show forest plot | 4 | Risk Ratio (M‐H, Random, 95% CI) | Subtotals only | |
| 11.1 RCTs | 1 | 976 | Risk Ratio (M‐H, Random, 95% CI) | 1.28 [0.60, 2.70] |
| 11.2 Cohort studies | 3 | 2034 | Risk Ratio (M‐H, Random, 95% CI) | 0.88 [0.16, 4.76] |
| 12 Visual impairment; effects Show forest plot | 4 | Risk Ratio (M‐H, Random, 95% CI) | Subtotals only | |
| 12.1 RCTs | 1 | 976 | Risk Ratio (M‐H, Random, 95% CI) | 2.04 [0.88, 4.73] |
| 12.2 Cohort studies | 3 | 2560 | Risk Ratio (M‐H, Random, 95% CI) | 2.06 [1.05, 4.02] |
| 13 Adherence; during travel Show forest plot | 12 | Risk Ratio (M‐H, Random, 95% CI) | Subtotals only | |
| 13.1 RCTs | 1 | 119 | Risk Ratio (M‐H, Random, 95% CI) | 0.95 [0.88, 1.02] |
| 13.2 Cohort studies | 11 | 12131 | Risk Ratio (M‐H, Random, 95% CI) | 1.16 [1.03, 1.30] |
| 14 Adherence; after return Show forest plot | 4 | Risk Ratio (M‐H, Random, 95% CI) | Subtotals only | |
| 14.1 Cohort studies | 4 | 1221 | Risk Ratio (M‐H, Random, 95% CI) | 1.04 [0.92, 1.17] |