Scolaris Content Display Scolaris Content Display

Flow diagram of study selection for the updated review.
Figuras y tablas -
Figure 1

Flow diagram of study selection for the updated review.

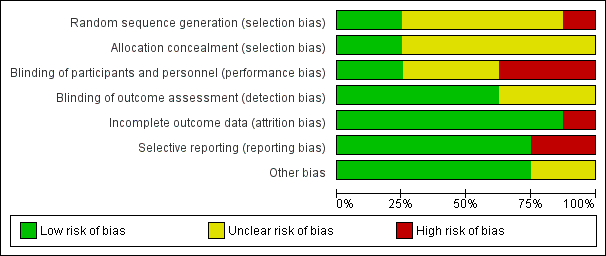
Risk of bias graph: review authors' judgements about each risk of bias item presented as percentages across all included studies.
Figuras y tablas -
Figure 2

Risk of bias graph: review authors' judgements about each risk of bias item presented as percentages across all included studies.

Risk of bias summary: review authors' judgements about each risk of bias item for each included study.
Figuras y tablas -
Figure 3

Risk of bias summary: review authors' judgements about each risk of bias item for each included study.

Comparison 1 Topical anaesthesia versus sub‐Tenon's anaesthesia, Outcome 1 Pain during surgery.
Figuras y tablas -
Analysis 1.1

Comparison 1 Topical anaesthesia versus sub‐Tenon's anaesthesia, Outcome 1 Pain during surgery.

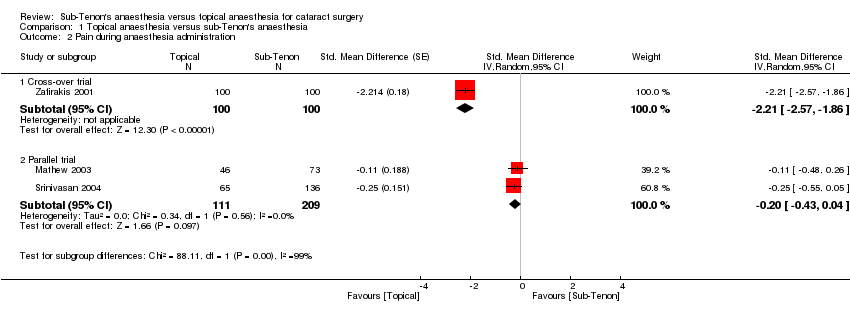
Comparison 1 Topical anaesthesia versus sub‐Tenon's anaesthesia, Outcome 2 Pain during anaesthesia administration.
Figuras y tablas -
Analysis 1.2

Comparison 1 Topical anaesthesia versus sub‐Tenon's anaesthesia, Outcome 2 Pain during anaesthesia administration.

Comparison 1 Topical anaesthesia versus sub‐Tenon's anaesthesia, Outcome 3 Pain at 30 minutes after surgery.
Figuras y tablas -
Analysis 1.3

Comparison 1 Topical anaesthesia versus sub‐Tenon's anaesthesia, Outcome 3 Pain at 30 minutes after surgery.

Summary of findings for the main comparison. Topical anaesthesia compared with sub‐Tenon's anaesthesia for cataract surgery

Topical anaesthesia compared with sub‐Tenon's anaesthesia for cataract surgery

Patient or population: patients with cataract surgery
Settings: surgery
Intervention: topical anaesthesia
Comparison: sub‐Tenon's anaesthesia

Outcomes

Illustrative comparative risks* (95% CI)

Relative effect
(95% CI)

Number of participants
(studies)

Quality of the evidence
(GRADE)

Comments

Assumed risk

Corresponding risk

Sub‐Tenon's anaesthesia

Topical anaesthesia

Intraoperative pain

Mean intraoperative pain in the intervention groups was
0.47 standard deviations higher
(0.29 to 0.66 higher)

501
(3 studiesa)

⊕⊕⊕⊕
High

Equivalent to 1.1 on a score from 0 to 10

Pain during administration of anaesthesia

Mean pain during administration of anaesthesia in the intervention groups was
0.20 standard deviations lower
(0.43 lower to 0.04 higher)

184
(2 studiesb)

⊕⊕⊝⊝
Lowc,d

Pain at 24 hours
Follow‐up: 1 day

Mean pain at 24 hours in the intervention groups was
0.47 standard deviations lower
(0.75 to 0.19 lower)

200
(1 study)

⊕⊕⊕⊝
Moderated

Equivalent to 0.2 on a score from 0 to 10

Surgeon's satisfaction
Scale from 0 to 10

Mean surgeon satisfaction in the intervention groups was
0.7 lower
(0.3 to 1.1 lower)

200
(1 study)

⊕⊕⊝⊝
Lowd,e

Participant satisfaction

Mean participant satisfaction in the intervention groups was
1.13 standard deviations lower
(0.3 to 1.96 lower)

26
(1 study)

⊕⊕⊕⊝
Moderated,f,g

*The basis for the assumed risk (e.g. median control group risk across studies) is provided in footnotes. The corresponding risk (and its 95% confidence interval) is based on the assumed risk in the comparison group and the relative effect of the intervention (and its 95% CI).
CI: Confidence interval.

GRADE Working Group grades of evidence.
High quality: Further research is very unlikely to change our confidence in the estimate of effect.
Moderate quality: Further research is likely to have an important impact on our confidence in the estimate of effect and may change the estimate.
Low quality: Further research is very likely to have an important impact on our confidence in the estimate of effect and is likely to change the estimate.
Very low quality: We are very uncertain about the estimate.

aWe retained only studies in which the outcome assessor was blinded to the anaesthetic technique.
bWe retained only parallel trials for this outcome.
cOne of the included studies was at high risk of bias for 3/7 items, at low risk for 2/7 items and at unclear risk for 2/7 items.
dWe downgraded the evidence on the basis of a small number of participants (arbitrarily fixed at ≤ 200) an/or a small number of available studies (≤ 2).
eOutcome assessor not blinded.
fWide confidence interval.
gSMD > 0.8.

Figuras y tablas -
Summary of findings for the main comparison. Topical anaesthesia compared with sub‐Tenon's anaesthesia for cataract surgery
Table 1. Complications

Study ID

Subconjunctival haemorrhage T vs ST

Chemosis T vs ST

Transient increase in intraocular pressure T vs ST

Posterior capsular tear T vs ST

Iris prolapsus T vs ST

Conversion to ST

Iritis T vs ST

Comments

Chittenden 1997

0

Complications not reported

Mathew 2003

0

Complications not reported

Rüschen 2005

1/14

Complications not reported

Sekundo 2004

0/50 vs 0/50

0/50 vs 0/50

5/50

1/50 vs 1/50

The topical anaesthesia group felt pain during cauterization of the episcleral vessels
and to a lesser extent throughout the second part of the operation

Srinivasan 2004

3/65 vs 2/136

0/65 vs 1/136

0

No participant required supplemental analgesia after surgery

Vielpeau 1999

25/25 vs 25/25a

0/25 vs 15/25

0/25 vs 0/25

0/25 vs 0/25

0

Zafirakis 2001

0/100 vs 22/100

0/100 vs 76/100

0

T: topical anaesthesia

ST: sub‐Tenon's anaesthesia

vs: versus

aAny amount

Figuras y tablas -
Table 1. Complications
Comparison 1. Topical anaesthesia versus sub‐Tenon's anaesthesia

Outcome or subgroup title

No. of studies

No. of participants

Statistical method

Effect size

1 Pain during surgery Show forest plot

6

705

Std. Mean Difference (Random, 95% CI)

0.64 [0.43, 0.84]

1.1 Low risk for outcome assessor blindness

3

501

Std. Mean Difference (Random, 95% CI)

0.47 [0.29, 0.66]

1.2 Unclear risk for outcome assessor blindness

3

204

Std. Mean Difference (Random, 95% CI)

0.90 [0.61, 1.20]

2 Pain during anaesthesia administration Show forest plot

3

Std. Mean Difference (Random, 95% CI)

Subtotals only

2.1 Cross‐over trial

1

200

Std. Mean Difference (Random, 95% CI)

‐2.21 [‐2.57, ‐1.86]

2.2 Parallel trial

2

320

Std. Mean Difference (Random, 95% CI)

‐0.20 [‐0.43, 0.04]

3 Pain at 30 minutes after surgery Show forest plot

2

Std. Mean Difference (Fixed, 95% CI)

Subtotals only

3.1 Cross‐over trial

1

200

Std. Mean Difference (Fixed, 95% CI)

0.96 [0.67, 1.26]

3.2 Parallel trial

1

201

Std. Mean Difference (Fixed, 95% CI)

0.54 [0.24, 0.84]

Figuras y tablas -
Comparison 1. Topical anaesthesia versus sub‐Tenon's anaesthesia