Tratamiento farmacológico intermitente para la esquizofrenia
Resumen
Antecedentes
Los antipsicóticos se consideran los pilares del tratamiento de la esquizofrenia y, en general, se consideran altamente efectivos, especialmente para controlar los síntomas positivos. Sin embargo, la exposición a largo plazo a los antipsicóticos se asocia con una variedad de efectos adversos que incluyen síntomas extrapiramidales (SEP), síndrome maligno neuroléptico (SMN), discinesia tardía y muerte. El tratamiento farmacológico intermitente se refiere al “uso de medicación sólo durante los períodos de recaída incipiente o de exacerbación de los síntomas en lugar de en forma continua”. El objetivo es reducir el riesgo de efectos adversos característicos de los antipsicóticos al “disminuir la exposición a largo plazo a la medicación en pacientes que reciben tratamiento de mantenimiento mientras se limita el riesgo de recaída”, con un objetivo adicional que incluye la mejoría del desempeño social que resulta de la reducción de los efectos secundarios inducidos por los antipsicóticos.
Objetivos
Examinar los efectos de diferentes tratamientos farmacológicos intermitentes en comparación con el tratamiento de mantenimiento en pacientes con esquizofrenia o trastornos relacionados.
Métodos de búsqueda
Se realizaron búsquedas en el Registro de Ensayos del Grupo Cochrane de Esquizofrenia (The Cochrane Schizophrenia Group Trials Register) (abril de 2012) que se complementaron al establecer contacto con los autores de los estudios relevantes, con búsquedas manuales de los artículos relevantes de los tratamientos farmacológicos intermitentes y la búsqueda manual en las listas de referencias.
Criterios de selección
Todos los ensayos controlados aleatorios (ECA) que compararon tratamientos farmacológicos intermitentes con el tratamiento de mantenimiento estándar en pacientes con esquizofrenia. Los resultados primarios de interés fueron la recaída y la hospitalización.
Obtención y análisis de los datos
Al menos dos autores de la revisión seleccionaron los ensayos, evualuaron su calidad y extrajeron los datos. Se calcularon los cocientes de riesgos (CR) y los intervalos de confianza (IC) del 95% de los datos dicotómicos homogéneos y se calculó el intervalo de confianza (IC) del 95% en relación con dichos datos. Para los datos finales continuos no asimétricos extraídos de las escalas validadas, se calculó la diferencia de medias (DM) entre los grupos con un IC del 95%. Cuando los datos mostraron heterogeneidad, se analizaron mediante un modelo de efectos aleatorios. Los datos asimétricos se presentan en tablas. Se evaluó la calidad general de los resultados clínicamente importantes utilizando el método GRADE.
Resultados principales
De 241 registros recuperados mediante la búsqueda, se incluyeron 17 ensayos realizados entre 1961 y 2011, con 2252 participantes y con un seguimiento de seis semanas a dos años. Los datos homogéneos demostraron que los casos de recaída fueron significativamente mayores en los pacientes que recibieron cualquier tratamiento farmacológico intermitente a largo plazo (n = 436; 7 ECA, CR 2,46; IC del 95%: 1,70 a 3,54; pruebas de calidad moderada). Sin embargo, se observó que el tratamiento intermitente fue más efectivo que el placebo, y se demostró que significativamente menos pacientes que recibieron tratamiento intermitente con antipsicóticos experimentaron la recaída completa a plazo medio (n = 290; 2 ECA, CR 0,37; IC del 95%: 0,24 a 0,58; pruebas de muy baja calidad). Las tasas de hospitalización fueron mayores en los pacientes que recibieron cualquier tratamiento farmacológico intermitente a largo plazo (n = 626; 5 ECA, CR 1,65; IC del 95%: 1,33 a 2,06; pruebas de calidad moderada). Los resultados mostraron poca diferencia en los casos de discinesia tardía en los grupos que recibieron cualquier tratamiento farmacológico intermitente versus tratamiento de mantenimiento, con resultados equívocos (que mostraron una heterogeneidad leve) a largo plazo (n = 165; 4 ECA, CR 1,15; IC del 95%: 0,58 a 2,30; pruebas de baja calidad).
Conclusiones de los autores
Los resultados de esta revisión apoyan las pruebas existentes de que el tratamiento antipsicótico intermitente no presenta la misma efectividad que el tratamiento antipsicótico continuo de mantenimiento en cuanto a la prevención de la recaída en los pacientes con esquizofrenia. Se necesita más investigación para evaluar cualquier efecto beneficioso o perjudicial potencial del tratamiento intermitente con respecto a los efectos adversos habitualmente asociados con el tratamiento de mantenimiento con antipsicóticos, así como cualquier relación costo‐efectividad de este tratamiento experimental.
Resumen en términos sencillos
Tratamiento farmacológico intermitente para la esquizofrenia
Los antipsicóticos son el tratamiento principal para la esquizofrenia y ayudan a los pacientes a afrontar los síntomas positivos que incluyen oír voces, ver cosas y tener creencias extrañas. Sin embargo, la exposición a largo plazo a estos fármacos se ha asociado con efectos secundarios graves como: aumento de peso; movimientos incontrolables de la cabeza, el cuerpo o las manos; temblores; rigidez muscular; dificultades para caminar y con el equilibrio; somnolencia o apatía; e incluso la muerte.Algunos pacientes interrumpen la medicación debido a que estos efectos secundarios limitan su calidad de vida. La falta de administración de medicación puede ser un factor contribuyente que da lugar a recaída y hospitalización. En este contexto, existen motivos para considerar la función de la administración intermitente de antipsicóticos en comparación con el uso continuo de los mismos.
El tratamiento farmacológico intermitente se refiere al uso de medicación sólo durante los períodos cercanos a la recaída de los síntomas en lugar de la administración continua de dichos fármacos. El tratamiento farmacológico intermitente incluye: la intervención basada en el pródromo (que evalúa el riesgo del estadio inicial de recaída); la intervención en momentos de crisis durante un episodio agudo o el deterioro de la salud mental; el aumento gradual de los períodos sin fármacos; y días sin fármacos. El objetivo es reducir la exposición a los fármacos y disminuir los efectos secundarios.
Esta revisión evalúa diferentes tratamientos farmacológicos intermitentes en comparación con el tratamiento de mantenimiento en pacientes con esquizofrenia o trastornos relacionados. Diecisiete estudios con 2252 participantes compararon tratamientos farmacológicos intermitentes con el mantenimiento estándar de la medicación. La recaída fue significativamente mayor en los pacientes que recibieron tratamiento farmacológico intermitente. La hospitalización fue mayor para los pacientes que recibieron tratamiento farmacológico intermitente.
Los resultados indican que el tratamiento intermitente no muestra la misma efectividad que el tratamiento continuo o de mantenimiento en cuanto a la prevención de la recaída. Aunque la información favorece el tratamiento continuo y de mantenimiento, no siempre ocurre así en situaciones reales, en las que los pacientes pueden interrumpir la medicación debido a efectos secundarios debilitantes que afectan la calidad de vida. Se necesita más investigación para evaluar cualquier efecto beneficioso o perjudicial potencial del tratamiento intermitente, en particular con respecto a los efectos secundarios comúnmente asociados con el tratamiento de mantenimiento con antipsicóticos. No se investigó el ahorro económico/de dinero, específicamente con respecto a la relación costo‐efectividad de los tratamientos intermitentes.
Hasta que haya más pruebas disponibles en cuanto a los efectos beneficiosos o perjudiciales potenciales del tratamiento intermitente, los gestores, los psiquiatras y los elaboradores de políticas deben considerarlo un tratamiento experimental.
Este resumen en términos sencillos fue redactado por Ben Gray, usuario de servicios y usuario experto de servicios, Rethink Mental Illness.
Authors' conclusions
Summary of findings
| ANY INTERMITTENT DRUG TECHNIQUE compared with MAINTENANCE THERAPY for schizophrenia | ||||||
| Patient or population: patients with schizophrenia | ||||||
| Outcomes | Illustrative comparative risks* (95% CI) | Relative effect | No of Participants | Quality of the evidence | Comments | |
| Assumed risk | Corresponding risk | |||||
| MAINTENANCE THERAPY | ANY INTERMITTENT DRUG TECHNIQUE | |||||
| Relapse: long term (+ 26 weeks) | Low1 | RR 2.46 | 436 | ⊕⊕⊕⊝ | ||
| 0 per 1000 | 0 per 1000 | |||||
| Moderate1 | ||||||
| 150 per 1000 | 369 per 1000 | |||||
| High1 | ||||||
| 300 per 1000 | 738 per 1000 | |||||
| Hospitalisation: long term (+ 26 weeks) | Low3 | RR 1.65 | 626 | ⊕⊕⊕⊝ | ||
| 50 per 1000 | 82 per 1000 | |||||
| Moderate3 | ||||||
| 300 per 1000 | 495 per 1000 | |||||
| High3 | ||||||
| 500 per 1000 | 825 per 1000 | |||||
| Global state: average score: long term (+ 26 weeks) | The mean global state: average score: long term (+ 26 weeks) in the control groups was | The mean global state: average score: long term (+26 weeks) in the intervention groups was | 133 | ⊕⊕⊝⊝ | ||
| Mental state: average score: long term (+ 26 weeks) | The mean mental state: average score: long term (+ 26 weeks) in the control groups was | The mean mental state: average score: long term (+26 weeks) in the intervention groups was | 77 | ⊕⊕⊝⊝ | ||
| Adverse effects: tardive dyskinesia: by long term (+26 weeks) | Low9 | RR 1.15 | 165 | ⊕⊕⊝⊝ | ||
| 0 per 1000 | 0 per 1000 | |||||
| Moderate9 | ||||||
| 200 per 1000 | 230 per 1000 | |||||
| High9 | ||||||
| 600 per 1000 | 690 per 1000 | |||||
| Economic outcomes: cost effectiveness | See comment | See comment | Not estimable | 0 | See comment | No study reported this outcome |
| Leaving the study early/ loss to follow‐up: by long term (+ 26 weeks) | Low10 | RR 1.63 | 996 | ⊕⊕⊝⊝ | ||
| 100 per 1000 | 163 per 1000 | |||||
| Moderate10 | ||||||
| 400 per 1000 | 652 per 1000 | |||||
| High10 | ||||||
| 700 per 1000 | 1000 per 1000 | |||||
| *The basis for the assumed risk (e.g. the median control group risk across studies) is provided in footnotes. The corresponding risk (and its 95% confidence interval) is based on the assumed risk in the comparison group and the relative effect of the intervention (and its 95% CI). | ||||||
| GRADE Working Group grades of evidence | ||||||
| 1 Assumed risk: calculated from the included studies ‐ presents 3 risks based on the control group risks ‐ 'moderate' risk equates with that of control group (14%). | ||||||
| INTERMITTENT (EARLY‐BASED) compared with MAINTENANCE THERAPY for schizophrenia | ||||||
| Patient or population: patients with schizophrenia | ||||||
| Outcomes | Illustrative comparative risks* (95% CI) | Relative effect | No of Participants | Quality of the evidence | Comments | |
| Assumed risk | Corresponding risk | |||||
| MAINTENANCE THERAPY | INTERMITTENT (EARLY‐BASED) | |||||
| Relapse: long term (+ 26 weeks) | Low1 | RR 2.33 | 155 | ⊕⊕⊝⊝ | ||
| 0 per 1000 | 0 per 1000 | |||||
| Moderate1 | ||||||
| 150 per 1000 | 349 per 1000 | |||||
| High1 | ||||||
| 300 per 1000 | 756 per 1000 | |||||
| Hospitalisation: long term (+ 26 weeks) | Low4 | RR 1.16 | 625 | ⊕⊕⊕⊝ | ||
| 100 per 1000 | 166 per 1000 | |||||
| Moderate4 | ||||||
| 300 per 1000 | 498 per 1000 | |||||
| High4 | ||||||
| 600 per 1000 | 996 per 1000 | |||||
| Global state: average score: long term (+ 26 weeks) | The mean global state: average score: long term (+ 26 weeks) in the control groups was | The mean global state: average score: long term (+26 weeks) in the intervention groups was | 82 | ⊕⊕⊝⊝ | ||
| Mental state: average score: long term (+ 26 weeks) | The mean mental state: average score: long term (+ 26 weeks) in the control groups was | The mean mental state: average score: long term (+26 weeks) in the intervention groups was | 26 | ⊕⊝⊝⊝ | ||
| Adverse effects: tardive dyskinesia: long term (+26 weeks) | 444 per 10009 | 249 per 1000 | RR 0.56 | 30 | ⊕⊕⊝⊝ | |
| Economic outcomes: cost effectiveness: long term (+ 26 weeks) | See comment | See comment | Not estimable | 0 | See comment | No study reported this outcome |
| Leaving the study early/loss to follow‐up: long term (+ 26 weeks) | Low | RR 1.67 | 562 | ⊕⊕⊝⊝ | ||
| 200 per 100010 | 334 per 1000 | |||||
| Moderate | ||||||
| 400 per 100010 | 668 per 1000 | |||||
| High | ||||||
| 600 per 100010 | 1000 per 1000 | |||||
| *The basis for the assumed risk (e.g. the median control group risk across studies) is provided in footnotes. The corresponding risk (and its 95% confidence interval) is based on the assumed risk in the comparison group and the relative effect of the intervention (and its 95% CI). | ||||||
| GRADE Working Group grades of evidence | ||||||
| 1 Assumed risk: calculated from the included studies ‐ presents 3 risks based on the control group risks ‐ 'moderate' risk equates with that of control group (16.7%). | ||||||
| INTERMITTENT (CRISIS INTERVENTION) compared with MAINTENANCE THERAPY for schizophrenia | ||||||
| Patient or population: patients with schizophrenia | ||||||
| Outcomes | Illustrative comparative risks* (95% CI) | Relative effect | No of Participants | Quality of the evidence | Comments | |
| Assumed risk | Corresponding risk | |||||
| MAINTENANCE THERAPY | INTERMITTENT (CRISIS INTERVENTION) | |||||
| Relapse: long term (+ 26 weeks) | See comment | See comment | Not estimable | 0 | See comment | No study reported provided useable data for this outcome by long term |
| Hospitalisation: long term (+ 26 weeks) | See comment | See comment | Not estimable | 0 | See comment | No study reported provided useable data for this outcome by long term |
| Global state: average score: long term (+ 26 weeks) | See comment | See comment | Not estimable | 0 | See comment | No study reported provided useable data for this outcome by long term |
| Mental state: average score: long term (+ 26 weeks) | See comment | See comment | Not estimable | 0 | See comment | No study reported provided useable data for this outcome by long term |
| Adverse effects: tardive dyskinesia: long term (+ 26 weeks) | See comment | See comment | Not estimable | 0 | See comment | No study reported provided useable data for this outcome by long term |
| Economic outcomes: cost effectiveness: long term (+ 26 weeks) | See comment | See comment | Not estimable | 0 | See comment | No study reported this outcome |
| Leaving the study early/ loss to follow‐up: long term (+ 26 weeks) | 426 per 10001 | 669 per 1000 | RR 1.57 | 237 | ⊕⊝⊝⊝ | |
| *The basis for the assumed risk (e.g. the median control group risk across studies) is provided in footnotes. The corresponding risk (and its 95% confidence interval) is based on the assumed risk in the comparison group and the relative effect of the intervention (and its 95% CI). | ||||||
| GRADE Working Group grades of evidence | ||||||
| 1 Mean baseline risk presented for single study. | ||||||
| INTERMITTENT (GRADUALLY INCREASED DRUG‐FREE PERIODS) compared with MAINTENANCE THERAPY for schizophrenia | ||||||
| Patient or population: patients with schizophrenia | ||||||
| Outcomes | Illustrative comparative risks* (95% CI) | Relative effect | No of Participants | Quality of the evidence | Comments | |
| Assumed risk | Corresponding risk | |||||
| MAINTENANCE THERAPY | INTERMITTENT (GRADUALLY INCREASED DRUG‐FREE PERIODS) | |||||
| Relapse: long term (+ 26 weeks) | Low1 | RR 2.76 | 219 | ⊕⊕⊝⊝ | ||
| 0 per 1000 | 0 per 1000 | |||||
| Moderate1 | ||||||
| 100 per 1000 | 276 per 1000 | |||||
| High1 | ||||||
| 300 per 1000 | 828 per 1000 | |||||
| Hospitalisation: long term (+ 26 weeks) | See comment | See comment | Not estimable | 0 | See comment | No study reported provided useable data for this outcome by long term |
| Global state: average score: long term (+26 weeks) | The mean global state: average score: long term (+26 weeks) in the control groups was | The mean global state: average score: long term (+ 26 weeks) in the intervention groups was | 51 | ⊕⊝⊝⊝ | ||
| Mental state: average score: long term (+ 26 weeks) | The mean mental state: average score: long term (+26 weeks) in the control groups was | The mean mental state: average score: long term (+ 26 weeks) in the intervention groups was | 51 | ⊕⊝⊝⊝ | ||
| Adverse effects: tardive dyskinesia: long term (+ 26 weeks) | See comment6 | See comment | Not estimable | 85 | ⊕⊝⊝⊝ | |
| Economic outcomes: cost effectiveness: long term (+ 26 weeks) | See comment | See comment | Not estimable | 0 | See comment | No study reported this outcome |
| Leaving the study early/ loss to follow‐up: long term (+ 26 weeks) | Low7 | RR 2.12 | 257 | ⊕⊝⊝⊝ | ||
| 0 per 1000 | 0 per 1000 | |||||
| Moderate7 | ||||||
| 200 per 1000 | 424 per 1000 | |||||
| High7 | ||||||
| 500 per 1000 | 1000 per 1000 | |||||
| *The basis for the assumed risk (e.g. the median control group risk across studies) is provided in footnotes. The corresponding risk (and its 95% confidence interval) is based on the assumed risk in the comparison group and the relative effect of the intervention (and its 95% CI). | ||||||
| GRADE Working Group grades of evidence | ||||||
| 1 Assumed risk: calculated from the included studies ‐ presents 3 risks based on the control group risks ‐ 'moderate' risk equates with that of control group (12.7%). | ||||||
| INTERMITTENT (DRUG HOLIDAY) compared with MAINTENANCE THERAPY for schizophrenia | ||||||
| Patient or population: patients with schizophrenia | ||||||
| Outcomes | Illustrative comparative risks* (95% CI) | Relative effect | No of Participants | Quality of the evidence | Comments | |
| Assumed risk | Corresponding risk | |||||
| MAINTENANCE THERAPY | INTERMITTENT (DRUG HOLIDAY) | |||||
| Relapse: long term (+ 26 weeks) | Low1 | RR 1.70 | 61 | ⊕⊝⊝⊝ | ||
| 0 per 1000 | 0 per 1000 | |||||
| Moderate1 | ||||||
| 150 per 1000 | 255 per 1000 | |||||
| High1 | ||||||
| 200 per 1000 | 340 per 1000 | |||||
| Hospitalisation: medium term (13‐25 weeks) | 222 per 10004 | 58 per 1000 | RR 0.26 | 35 | ⊕⊝⊝⊝ | |
| Global state: average score: long term (+ 26 weeks) | See comment | See comment | Not estimable | 0 | See comment | No study reported provided useable data for this outcome by long term |
| Mental state: average score: long term (+ 26 weeks) | See comment | See comment | Not estimable | 0 | See comment | No study reported provided useable data for this outcome by long term |
| Adverse effects: tardive dyskinesia: long term (+ 26 weeks) | Low6 | RR 1.64 | 50 | ⊕⊝⊝⊝ | ||
| 100 per 1000 | 164 per 1000 | |||||
| Moderate6 | ||||||
| 300 per 1000 | 492 per 1000 | |||||
| High6 | ||||||
| 600 per 1000 | 984 per 1000 | |||||
| Economic outcomes: cost effectiveness: long term (+ 26 weeks) | See comment | See comment | Not estimable | 0 | See comment | No study reported this outcome |
| Leaving the study early/ loss to follow‐up: long term (+ 26 weeks) | Low6 | RR 1.01 | 62 | ⊕⊝⊝⊝ | ||
| 100 per 1000 | 101 per 1000 | |||||
| Moderate6 | ||||||
| 300 per 1000 | 303 per 1000 | |||||
| High6 | ||||||
| 400 per 1000 | 404 per 1000 | |||||
| *The basis for the assumed risk (e.g. the median control group risk across studies) is provided in footnotes. The corresponding risk (and its 95% confidence interval) is based on the assumed risk in the comparison group and the relative effect of the intervention (and its 95% CI). | ||||||
| GRADE Working Group grades of evidence | ||||||
| 1 Assumed risk: calculated from the included studies ‐ presents 3 risks based on the control group risks ‐ 'moderate' risk equates with that of control group (12.1%). | ||||||
| ANY INTERMITTENT DRUG TECHNIQUE compared with PLACEBO for schizophrenia | ||||||
| Patient or population: patients with schizophrenia | ||||||
| Outcomes | Illustrative comparative risks* (95% CI) | Relative effect | No of Participants | Quality of the evidence | Comments | |
| Assumed risk | Corresponding risk | |||||
| PLACEBO | ANY INTERMITTENT DRUG TECHNIQUE | |||||
| Relapse: medium term (13‐25 weeks) | Low1 | RR 0.36 | 288 | ⊕⊝⊝⊝ | ||
| 200 per 1000 | 74 per 1000 | |||||
| Moderate1 | ||||||
| 400 per 1000 | 148 per 1000 | |||||
| High1 | ||||||
| 800 per 1000 | 296 per 1000 | |||||
| Hospitalisation: medium term (13‐25 weeks) | See comment | See comment | Not estimable | 0 | See comment | No study reported provided useable data for this outcome by long term |
| Global state: average score: medium term (13‐25 weeks) | See comment | See comment | Not estimable | 0 | See comment | No study reported provided useable data for this outcome by long term |
| Mental state: average score: medium term (13‐25 weeks) | See comment | See comment | Not estimable | 0 | See comment | No study reported provided useable data for this outcome by long term |
| Adverse effects: tardive dyskinesia: medium term (13‐25 weeks) | See comment | See comment | Not estimable | 0 | See comment | No study reported provided useable data for this outcome by long term |
| Economic outcomes: cost effectiveness: medium term (13‐25 weeks) | See comment | See comment | Not estimable | 0 | See comment | No study reported this outcome |
| Leaving the study early/ loss to follow‐up: medium term (13‐25 weeks) | Low4 | RR 1.97 | 90 | ⊕⊝⊝⊝ | ||
| 100 per 1000 | 197 per 1000 | |||||
| Moderate4 | ||||||
| 300 per 1000 | 591 per 1000 | |||||
| High4 | ||||||
| 600 per 1000 | 1000 per 1000 | |||||
| *The basis for the assumed risk (e.g. the median control group risk across studies) is provided in footnotes. The corresponding risk (and its 95% confidence interval) is based on the assumed risk in the comparison group and the relative effect of the intervention (and its 95% CI). | ||||||
| GRADE Working Group grades of evidence | ||||||
| 1 Assumed risk: calculated from the included studies ‐ presents 3 risks based on the control group risks ‐ 'moderate' risk equates with that of control group (46.2%). | ||||||
Background
Description of the condition
In 1896, Emil Kraepelin isolated the illness of schizophrenia under the name of 'dementia praecox', which was considered to lead to a 'deterioration of the personality' (Kraepelin 1896). It was eventually reframed into a substantially different concept by Swiss psychiatrist Paul Eugen Bleuler, who identified a demonstrable 'splitting of psychic functions' and re‐labelled the mental illness as schizophrenia (Bleuler 1908). It is widely accepted that schizophrenia encapsulates a range of clinical manifestations, which are typically categorised into positive and negative symptoms. Positive symptoms are based on active disturbance of cerebral function (including disorders of thought such as disorganised speech/behaviour; thought‐flow disturbances; delusions and auditory and visual hallucinations). Negative symptoms reflect a reduction or loss of normal function, including deficits of normal emotional responses or other thought processes (including avolition; depression; blunted affect or emotion and poverty of speech). Schizophrenia is a debilitating mental disorder, with a lifetime prevalence of about 1% (Jablensky 1992). Although schizophrenia can occur as a single episode of illness, up to 41% of those who develop schizophrenia suffer a chronic and often disabling illness with remission and relapses (Prudo 1987).
Before the discovery of antipsychotic medication, treatment for schizophrenia was found in numerous physical approaches aimed at promoting more specific benefits, including the inducement of insulin comas; electroconvulsive therapy (ECT) and prefrontal leucotomy (lobotomy) (Johnstone 1998); treatments that are now considered 'outdated' and have fallen into disuse. The discovery of chlorpromazine in 1952 paved the way for a pioneering approach for the treatment of schizophrenia, and the use of antipsychotic medication subsequently became one of the most comprehensively researched areas in psychiatry (Klein 1969). Antipsychotic medication (classified as first generation (typical) or second generation (atypical)) is now considered the mainstay of treatment for schizophrenia (Dencker 1980) and is generally regarded as highly effective, especially in controlling positive symptoms such as abnormal perceptions (hallucinations), disordered thinking and fixed false beliefs (delusions) (Kane 1998).
Antipsychotic maintenance treatment is the current predominant approach to treatment of schizophrenia, and has been recognised for its efficacy in treating symptoms in previous controlled trials (Davis 1976). A study by Baldessarini and colleagues showed antipsychotic maintenance treatment to be adequate for 50% of patients when administered with low doses of chlorpromazine (50 to 100 mg/day or equivalent) (Baldessarini 1988), and subsequent systematic reviews of randomised controlled trials have shown that relapse rates are lower with slightly higher doses of the same antipsychotic during maintenance treatment (200 to 500 mg) (Barbui 1996). Other studies have shown that antipsychotic maintenance (prophylaxis) treatment may reduce the risk of relapse (Schooler 1993), particularly with people who had recently recovered from an acute episode of schizophrenia (Leff 1971). However, long‐term antipsychotic exposure has been associated with a range of adverse effects, including extra‐pyramidal symptoms (EPS) (acute dystonia, akathisia, tardive dyskinesia, tardive dystonia and parkinsonism); neuroleptic malignant syndrome (NMS) (muscle rigidity, pyrexia, cognitive changes and autonomic disturbance) (Haddad 2008), and death (Ray 2009). Randomised trials have demonstrated that participants with schizophrenia who had been assigned continued antipsychotic treatment tended to discontinue treatment owing to inefficacy of the treatment or as a result of intolerable side effects (Lieberman 2005) (antipsychotic discontinuation has also proven adverse effects for those with schizophrenia, including anxiety, delirium, motor restlessness, insomnia, nausea and vomiting (Borison 1998;Haddad 2008)). Such adverse effects have been shown to impact negatively on the patient's quality of life and are a frequently cited reason for non‐compliance with antipsychotic medication, which could be a contributing factor towards relapse, hospitalisation and persistent psychotic symptoms (Morken 2008).
Against this backdrop, there is cause to consider the role of intermittently administering antipsychotic medication (intermittent drug techniques) versus maintained/continued use of antipsychotic medication (maintenance treatment), in order to ascertain the extent of any beneficial effects for those with schizophrenia.
Description of the intervention
Intermittent drug techniques (or 'intermittent treatment') refers to the 'use of medication only during periods of incipient relapse or symptom exacerbation rather than continuously' (Schooler 2004).The aim is to reduce the risk of typical adverse effects of antipsychotics (including tardive dyskinesia) by 'reducing long‐term medication exposure for patients who are receiving maintenance treatment while limiting the risk of relapse', with a further goal of improving social functioning resulting from the reduction of antipsychotic‐induced side effects (Schooler 2004).
How the intervention might work
People with chronic schizophrenia very frequently discontinue and re‐instigate their own antipsychotic medications, and few continue to take their medication for lengthy periods of time (Lieberman 2005); self‐imposed 'drug holidays' are common. It is clear that antipsychotics have proven effects in controlling positive symptoms, but are accompanied with the caveat of causing potential adverse effects; research has turned to assessing the ways in which various 'intermittent' strategies may maximise the benefits and minimise the negative effects of long‐term antipsychotic use; these strategies include dose reduction, antipsychotic cessation and intermittent drug techniques, such as drug holidays.
The focus of this review will be on the use of intermittent drug techniques, which include:
-
prodrome‐based intervention;
-
crisis intervention;
-
gradually increased drug‐free periods; and
-
drug holidays.
Intermittent treatment is a long‐term strategy that is used 'only when needed', relying on:
-
the presence of a prodromal period that would allow for intervention with medication in order to prevent relapse; and
-
an effective strategy for clinical monitoring in order to accurately identify prodromal symptoms in time for medication to be introduced (Schooler 2004).
Various methods of detecting early prodromal signs and symptoms have been developed (including the Early Signs Questionnaire, Herz 1980) in order to provide a higher standard of accurate judgement in determining when to introduce/reintroduce medication.
Why it is important to do this review
Co‐operation and adherence to medication is a further significant issue in the clinical management of schizophrenia. Early treatment discontinuation in patients with schizophrenia or schizophrenia‐like disorders is strikingly common, with estimates of its prevalence in antipsychotic drug trials ranging from 25% to 75% (Nose 2003). Discontinuation of a prescribed antipsychotic drug is associated with symptom exacerbation, relapse, and increased hospitalisation (Perkins 2002). A review that analysed 66 studies found a mean cumulative relapse rate of 53% in patients completely withdrawn from antipsychotic therapy compared to 16% for those maintained on a regimen of antipsychotic therapy over a mean follow‐up period of 9.7 months (Gilbert 1995). Evidence also points to the fact that experiencing a relapse of schizophrenia lowers a person's level of social functioning and quality of life (Curson 1985).
There are proven adverse effects associated with continued exposure to antipsychotic medication, but the extent to which maintenance treatment prevents relapse is unclear. The employment of non‐continuous antipsychotic treatment has been tested in practice, under the support of literature that implies that patients decompensating off medication are either more responsive to treatment and/or experience more benign decompensations than patients experiencing relapse on medication; either due to the barrier provided by continuous medication or any potential diminutive effects of medication owing to such prolonged, continued use (Carpenter 1983; Gardos 1976).
An intermittent approach depends on the accurate identification of times when medication should be administered, as well as the creation of an effective treatment structure to incorporate ongoing therapeutic patient monitoring and support. The approach further employs the assumption that those people with schizophrenia require antipsychotic medication on an 'only when needed' basis (during symptom exacerbation) and that the development of florid symptoms can be averted through the introduction of medication during the prodromal period (Schooler 2004). With an intermittent technique comes potential economic and practical advantages, and a key question is whether an 'intermittent' intervention would eliminate or merely ameliorate an impending psychotic episode. It is for these reasons that intermittent drug techniques merit a dedicated systematic review; as an approach to using antipsychotic medication, it is fundamental to assess its efficacy as a technique that seeks to maximise the benefits and minimise the problems associated with continued antipsychotic exposure.
Objectives
To review the effects of different intermittent drug techniques compared with maintenance treatment (as defined by the trial authors) in people with schizophrenia or related disorders.
Methods
Criteria for considering studies for this review
Types of studies
All relevant randomised controlled trials. Where a trial was described in such a way as to imply randomisation, we included such trials in a sensitivity analysis (see Sensitivity analysis). Had their inclusion not resulted in a substantive difference, they remained in the analyses. Had their inclusion resulted in statistically significant differences, we would not add the data from these lower quality studies to the results of the better trials, but would have presented such data within a subcategory. We excluded quasi‐randomised studies, such as those allocating by alternate days of the week.
Types of participants
We included people with schizophrenia and other types of schizophrenia‐like psychoses (schizophreniform and schizoaffective disorders diagnosed by any criteria), irrespective of gender, age or nationality. There is no clear evidence that the schizophrenia‐like psychoses are caused by fundamentally different disease processes or require different treatment approaches (Carpenter 1994).
Types of interventions
Any type of intermittent drug technique versus maintenance therapy:
a. Any intermittent drug technique
Including:
1. Prodrome‐based/early intervention
Defined as treatment given on the early signs of relapse.
2. Crisis intervention
Defined as treatment given only in case of full relapse and discontinued again after re‐stabilisation.
3. Gradually increased drug‐free period
Defined as increasing the cessation period of the treatment constantly.
4. Drug holiday
Defined as stopping medication for fixed periods, and then reintroducing it (repeating this more than once).
Compared with:
1. Maintenance therapy
As defined in each study.
2. Placebo
b. Any intermittent drug technique (specific named drug)
1. High dose (as defined by each study)
2. Low or moderate dose (as defined by each study)
Types of outcome measures
We grouped outcomes into the short term (up to 12 weeks), medium term (13 to 25 weeks) and long term (over 26 weeks).
Primary outcomes
1. Relapse (as defined in the individual studies)
2. Hospitalisation
Secondary outcomes
1. Death ‐ suicide and natural causes
2. Global state
2.1 Any clinically important change in global state (as defined by individual studies)
2.2 Average endpoint global state score
2.3 Average change in global state scores
3. Service outcomes
3.1 Time to hospitalisation
4. Mental state (with particular reference to the positive and negative symptoms of schizophrenia)
4.1 No clinically important change in general mental state
4.2 Average endpoint general mental state score
4.3 Average change in general mental state scores
4.4 No clinically important change in specific symptoms (positive symptoms of schizophrenia, negative symptoms of schizophrenia, depression, mania)
4.5 Average endpoint specific symptom score
4.6 Average change in specific symptom scores
5. General functioning
5.1 No clinically important change in general functioning
5.2 Average endpoint general functioning score
5.3 Average change in general functioning scores
5.4 No clinically important change in specific aspects of functioning, such as social or life skills
5.5 Average endpoint specific aspects of functioning, such as social or life skills
5.6 Average change in specific aspects of functioning, such as social or life skills
6. Behaviour
6.1 No clinically important change in general behaviour
6.2 Average endpoint general behaviour score
6.3 Average change in general behaviour scores
6.4 No clinically important change in specific aspects of behaviour
6.5 Average endpoint specific aspects of behaviour
6.6 Average change in specific aspects of behaviour
7. Adverse effects ‐ general and specific
7.1 Clinically important general adverse effects
7.2 Average endpoint general adverse effect score
7.3 Average change in general adverse effect scores
7.4 Clinically important specific adverse effects
7.5 Average endpoint specific adverse effects
7.6 Average change in specific adverse effects
8. Engagement with services
9. Satisfaction with treatment
9.1 Leaving the studies early
9.2 Recipient of care not satisfied with treatment
9.3 Recipient of care average satisfaction score
9.4 Recipient of care average change in satisfaction scores
9.5 Carer not satisfied with treatment
9.6 Carer average satisfaction score
9.7 Carer average change in satisfaction scores
10. Quality of life
10.1 No clinically important change in quality of life
10.2 Average endpoint quality of life score
10.3 Average change in quality of life scores
10.4 No clinically important change in specific aspects of quality of life
10.5 Average endpoint specific aspects of quality of life
10.6 Average change in specific aspects of quality of life
11. Cognitive functioning
11.1 No clinically important change in cognitive functioning
11.2 Average endpoint cognitive functioning score
11.3 Average change in cognitive functioning scores
11.4 No clinically important change in specific aspects of cognitive functioning
11.5 Average endpoint specific aspects of cognitive functioning
11.6 Average change in specific aspects of cognitive functioning
12. Economic outcomes
12.1 Direct costs (as defined by each study)
12.2 Indirect costs (as defined by each study)
12.3 Cost‐effectiveness (as defined by each study)
13. Leaving the study early/loss to follow‐up
14. 'Summary of findings' table
We used the GRADE approach to interpret findings (Schünemann 2008) and used GRADE profiler (GRADEPRO) to import data from RevMan 5 (Review Manager) to create 'Summary of findings' tables. These tables provide outcome‐specific information concerning the overall quality of evidence from each included study in the comparison, the magnitude of effect of the interventions examined, and the sum of available data on all outcomes we rated as important to patient‐care and decision making. We selected the following main outcomes for inclusion in the summary of findings table.
-
Relapse
-
Hospitalisation
-
Adverse effects
-
Mental state
-
Quality of life
-
Economic outcomes
-
Leaving the study early/loss to follow‐up
Search methods for identification of studies
Electronic searches
Cochrane Schizophrenia Group Trials Register
An initial search of the Cochrane Schizophrenia Group Trials Register was carried out in 2006 (see Appendix 1) This register is compiled by systematic searches of major databases, handsearches and conference proceedings (see Group Module).
We additionally made a later search of the Cochrane Schizophrenia Group Trials Register in April 2012, using the phrase:
[((intermit* or drug?holiday* or drug?free* or internal?med*) in title, abstract and index fields OR *targeted* in title or *targeted medication* in abstract or *drug administration methods* in indexing terms REFERENCE ) OR ((intermittent medication or drug‐free period) in interventions field in STUDY].
Searching other resources
1. Reference searching
We inspected references of all included studies for further relevant studies and sought additional relevant trials by searching reference lists of included and excluded trials.
2. Requests for additional data
We attempted to contact authors of relevant trials to inquire about other sources of relevant information.
Data collection and analysis
Since the protocol for this review was published the Cochrane Schizophrenia Group has updated its methodology for data collection and analysis. We have updated the relevant sections below to incorporate these new methods. See Appendix 2 for information relating to data collection and analysis specified in the protocol.
Selection of studies
Review author SS independently inspected citations, with help from Kajal Joshi (Acknowledgements) from the searches and identified relevant abstracts. A random 20% sample was independently re‐inspected by CEA to ensure reliability. Where disputes arose, the full report was acquired for more detailed scrutiny. Full reports of the abstracts meeting the review criteria were obtained and inspected by KJ and SS. Again, a random 20% of reports was re‐inspected by CEA in order to ensure reliable selection. Had it not been possible to resolve disagreement by discussion, we would have attempted to contact the authors of the study for clarification.
Data extraction and management
1. Extraction
Review author SS extracted data with help from Kajal Joshi (Acknowledgements) from all included studies. In addition, to ensure reliability, CEA independently extracted data from a random sample of these studies, comprising 10% of the total. Again, any disagreement was discussed, decisions documented and, if necessary, authors of studies were contacted for clarification. With remaining problems, CEA helped clarify issues and these final decisions were documented. Data presented only in graphs and figures were extracted whenever possible, but included only if two review authors independently had the same result. We attempted to contact authors through an open‐ended request in order to obtain missing information or for clarification whenever necessary. If studies were multi‐centre, where possible, we extracted data relevant to each component centre separately.
2. Management
2.1 Forms
We extracted data onto standard, simple forms.
2.2 Scale‐derived data
We included continuous data from rating scales only if:
a. the psychometric properties of the measuring instrument were described in a peer‐reviewed journal (Marshall 2000); and
b. the measuring instrument had not been written or modified by one of the trialists for that particular trial.
Ideally, the measuring instrument was either i. a self‐report or ii. completed by an independent rater or relative (not the therapist). We realise that this is not often reported clearly; in Description of studies we have noted if this was the case or not.
2.3 Endpoint versus change data
There are advantages of both endpoint and change data. Change data can remove a component of between‐person variability from the analysis. On the other hand, calculation of change needs two assessments (baseline and endpoint) which can be difficult in unstable and difficult to measure conditions such as schizophrenia. We decided primarily to use endpoint data, and only use change data if the former were not available. We combined endpoint and change data in the analysis as we used mean differences (MD) rather than standardised mean differences throughout (Higgins 2011).
2.4 Skewed data
Continuous data on clinical and social outcomes are often not normally distributed. To avoid the pitfall of applying parametric tests to non‐parametric data, we to applied the following standards to all data before inclusion: a) standard deviations (SDs) and means are reported in the paper or obtainable from the authors; b) when a scale started from the finite number zero, the SD, when multiplied by two, was less than the mean (as otherwise the mean is unlikely to be an appropriate measure of the centre of the distribution, (Altman 1996); c) if a scale started from a positive value (such as the Positive and Negative Syndrome Scale (PANSS) which can have values from 30 to 210), the calculation described above was modified to take the scale starting point into account. In these cases skew is present if 2 SD > (S‐S min), where S is the mean score and S min is the minimum score. Endpoint scores on scales often have a finite start and end point and these rules can be applied. We entered skewed endpoint data from studies of less than 200 participants as 'Other data' within the Data and analyses section rather than into a statistical analysis. Skewed endpoint data pose less of a problem when looking at mean if the sample size is large (over 200), we entered such data into statistical syntheses.
When continuous data are presented on a scale that includes a possibility of negative values (such as change data), it is difficult to tell whether data are skewed or not and we entered skewed change data into statistical analysis.
2.5 Common measure
To facilitate comparison between trials, we had intended to convert variables that can be reported in different metrics, such as days in hospital (mean days per year, per week or per month) to a common metric (e.g. mean days per month). However, no such variables were found.
2.6 Conversion of continuous to binary
Where possible, we made efforts to convert outcome measures to dichotomous data. This can be done by identifying cut‐off points on rating scales and dividing participants accordingly into 'clinically improved' or 'not clinically improved'. It is generally assumed that if there is a 50% reduction in a scale‐derived score such as the Brief Psychiatric Rating Scale (BPRS, Overall 1962) or the PANSS (Kay 1986), this could be considered as a clinically significant response (Leucht 2005a; Leucht 2005b). If data based on these thresholds were not available, we used the primary cut‐off presented by the original authors.
2.7 Direction of graphs
Where possible, we entered data in such a way that the area to the left of the line of no effect indicated a favourable outcome for intermittent drugs. If we had to enter data so the area to the left of the line indicated a favourable outcome for the control group, this was noted in the relevant graphs.
Assessment of risk of bias in included studies
Review authors KSW, NM and SS worked independently to assess risk of bias by using criteria described in the Cochrane Handbook for Systematic Reviews of Interventions (Higgins 2011) to assess trial quality. This set of criteria is based on evidence of associations between overestimate of effect and high risk of bias of the article such as sequence generation, allocation concealment, blinding, incomplete outcome data and selective reporting. If the raters disagreed, the final rating was made by consensus, with the involvement of another member of the review group. Where inadequate details of randomisation and other characteristics of trials were provided, authors of the studies were contacted in order to obtain further information. Non‐concurrence in quality assessment was reported, but if disputes arose as to which category a trial was to be allocated, again, resolution was made by discussion. The level of risk of bias was noted in both the text of the review and in the 'Summary of findings' tables (see below).
Measures of treatment effect
1. Binary data
For binary outcomes, we calculated a standard estimation of the risk ratio (RR) and its 95% confidence interval (CI). It has been shown that RR is more intuitive (Boissel 1999) than odds ratios and that odds ratios tend to be interpreted as RR by clinicians (Deeks 2000). The Number Needed to Treat/Harm (NNT/H) statistic with its confidence intervals is intuitively attractive to clinicians but is problematic both in its accurate calculation in meta‐analyses and interpretation (Hutton 2009). For binary data presented in the 'Summary of findings' tables, where possible, we calculated illustrative comparative risks.
2. Continuous data
For continuous outcomes, we estimated mean difference (MD) between groups. We preferred not to calculate effect size measures (standardised mean difference SMD). However, if scales of very considerable similarity were used, we presumed there was a small difference in measurement, and we calculated effect size and transformed the effect back to the units of one or more of the specific instruments.
Unit of analysis issues
1. Cluster trials
Studies increasingly employ cluster randomisation (such as randomisation by clinician or practice) but analysis and pooling of clustered data poses problems. Authors often fail to account for intra‐class correlation in clustered studies, leading to a unit of analysis error (Divine 1992) whereby P values are spuriously low, confidence intervals unduly narrow and statistical significance overestimated. This can cause Type I errors (Bland 1997; Gulliford 1999).
If clustering had not been accounted for in primary studies, we would have presented the data in a table, with a (*) symbol to indicate the presence of a probable unit of analysis error. In subsequent versions of this review we will seek to contact first authors of studies to obtain intra‐class correlation coefficients (ICCs) of their clustered data and to adjust for this using accepted methods (Gulliford 1999). Where clustering may be incorporated into the analysis of primary studies, we will also present these data as if from a non‐cluster randomised study, but adjusted for the clustering effect.
We have sought statistical advice and have been advised that the binary data as presented in a report should be divided by a design effect. This is calculated using the mean number of participants per cluster (m) and the ICC [Design effect = 1 + (m‐1)*ICC] (Donner 2002). If the ICC is not reported, it would be assumed to be 0.1 (Ukoumunne 1999).
If cluster studies had been appropriately analysed taking into account ICCs and relevant data documented in the report, we would have synthesised these with other studies using the generic inverse variance technique. However, no cluster trials were identified in this review.
2. Cross‐over trials
A major concern of cross‐over trials is the carry‐over effect. It occurs if an effect (e.g. pharmacological, physiological or psychological) of the treatment in the first phase is carried over to the second phase. As a consequence, on entry to the second phase, the participants can differ systematically from their initial state despite a wash‐out phase. For the same reason cross‐over trials are not appropriate if the condition of interest is unstable (Elbourne 2002). As both effects are very likely in schizophrenia, we would only have used data of the first phase of cross‐over studies. However, no cross‐over trials were identified.
3. Studies with multiple treatment groups
Where a study involves more than two treatment arms, if relevant, the additional treatment arms were presented in comparisons. If data were binary, these have simply been added and combined within the two‐by‐two table. If data were continuous, we combined the data following the formula in section 7.7.3.8 (Combining groups) of the Cochrane Handbook for Systematic Reviews of Interventions (Higgins 2011). Where the additional treatment arms were not relevant, we did not use these data.
Dealing with missing data
1. Overall loss of credibility
At some degree of loss of follow‐up, data must lose credibility (Xia 2009). We chose that, for any particular outcome, should more than 50% of data be unaccounted for, we would not reproduce these data or use them within analyses, (except for the outcome 'leaving the study early') ‐ this was the case for the Pietzcker 1993* study. If, however, more than 50% of those in one arm of a study were lost, but the total loss was less than 50%, we marked such data with (*) to indicate that such a result may well be prone to bias. This was the case in Carpenter 1990*; Herz 1991* and Olson 1962*
2. Binary
In the case where attrition for a binary outcome was between 0% and 50% and where these data were not clearly described, we presented data on a 'once‐randomised‐always‐analyse' basis (an intention‐to‐treat analysis). Those leaving the study early were all assumed to have the same rates of negative outcome as those who completed, with the exception of the outcome of death and adverse effects. For these outcomes the rate of those who stayed in the study ‐ in that particular arm of the trial ‐ were used for those who did not. We undertook a sensitivity analysis to test how prone the primary outcomes were to change when data only from people who completed the study to that point were compared to the intention‐to‐treat analysis using the above assumptions.
3. Continuous
3.1 Attrition
In the case where attrition for a continuous outcome was between 0% and 50%, and data only from people who completed the study to that point were reported, we reproduced these.
3.2 Standard deviations
If standard deviations (SDs) were not reported, we first would have tried to obtain the missing values from the authors. If not available, where there were missing measures of variance for continuous data, but an exact standard error (SE) and confidence intervals (CIs) available for group means, and either 'P' value or 't' value available for differences in mean, we would have calculated them according to the rules described in theCochrane Handbook for Systemic reviews of Interventions (Higgins 2011). If only the SE was reported, SDs would have been calculated by the formula SD = SE * square root (n). Chapters 7.7.3 and 16.1.3 of the Cochrane Handbook for Systemic reviews of Interventions (Higgins 2011) present detailed formulae for estimating SDs from P values, t or F values, CIs, ranges or other statistics. If these formulae did not apply, we would have calculated the SDs according to a validated imputation method which is based on the SDs of the other included studies (Furukawa 2006). Although some of these imputation strategies can introduce error, the alternative would be to exclude a given study’s outcome and thus to lose information. We nevertheless would have examined the validity of the imputations in a sensitivity analysis excluding imputed values, however, no imputations were made regarding SDs.
3.3 Last observation carried forward
We anticipated that in some studies the method of last observation carried forward (LOCF) would be employed within the study report. As with all methods of imputation to deal with missing data, LOCF introduces uncertainty about the reliability of the results (Leucht 2007). Therefore, where LOCF data have been used in the trial, if less than 50% of the data have been assumed, we presented and used these data and indicated that they were the product of LOCF assumptions.
Assessment of heterogeneity
1. Clinical heterogeneity
We considered all included studies initially, without seeing comparison data, to judge clinical heterogeneity. We simply inspected all studies for clearly outlying people or situations which we had not predicted would arise. When such situations or participant groups were noted, these were fully discussed.
2. Methodological heterogeneity
We considered all included studies initially, without seeing comparison data, to judge methodological heterogeneity. We simply inspected all studies for clearly outlying methods which we had not predicted would arise. When such methodological outliers arose, these were fully discussed.
3. Statistical
3.1 Visual inspection
We visually inspected graphs to investigate the possibility of statistical heterogeneity.
3.2 Employing the I2 statistic
Heterogeneity between studies was investigated by considering the I2 method alongside the Chi2 'P' value. The I2 provides an estimate of the percentage of inconsistency thought to be due to chance (Higgins 2003). The importance of the observed value of I2 depends on i. magnitude and direction of effects and ii. strength of evidence for heterogeneity (e.g. 'P' value from Chi2 test, or a confidence interval for I2). An I2 estimate greater than or equal to 50% accompanied by a statistically significant Chi2 statistic, was interpreted as evidence of substantial levels of heterogeneity (Section 9.5.2 ‐ Higgins 2011). When substantial levels of heterogeneity were found in the primary outcome, we explored reasons for heterogeneity (Subgroup analysis and investigation of heterogeneity).
Assessment of reporting biases
1. Protocol versus full study
Reporting biases arise when the dissemination of research findings is influenced by the nature and direction of results. These are described in section 10.1 of the Cochrane Handbook for Systematic Reviews of Interventions (Higgins 2011). We intended to locate protocols of included randomised trials. If the protocol had been available, outcomes in the protocol and in the published report would have been compared. If the protocol was not available, outcomes listed in the methods section of the trial report were compared with actually reported results. No protocols were available for any of the included studies.
2. Funnel plot
Reporting biases arise when the dissemination of research findings is influenced by the nature and direction of results (Egger 1997). These are again described in Section 10 of the Cochrane Handbook for Systematic Reviews of Interventions (Higgins 2011). We are aware that funnel plots may be useful in investigating reporting biases but are of limited power to detect small‐study effects. In other cases, where funnel plots were possible, we sought statistical advice in their interpretation.
Data synthesis
We understand that there is no closed argument for preference for use of fixed‐effect or random‐effects models. The random‐effects method incorporates an assumption that the different studies are estimating different, yet related, intervention effects. This often seems to be true to us and the random‐effects model takes into account differences between studies even if there is no statistically significant heterogeneity. There is, however, a disadvantage to the random‐effects model. It puts added weight onto small studies which often are the most biased ones. Depending on the direction of effect, these studies can either inflate or deflate the effect size. We therefore chose to use a fixed‐effect method for all analyses and used a random‐effects model where heterogeneity were found. For primary outcomes, we also synthesised data using a random‐effects model, and where the estimate of the effect was notably changed, this was noted in the conclusion.
Subgroup analysis and investigation of heterogeneity
Subgroup analyses
Data were sub‐grouped according to duration of follow‐up (short term, medium term or long term). The data for one study were compared in a single subgroup independently of the main comparison. The review authors believed that the inclusion of this data from a three‐armed intervention trial was required, as a direct comparison of the two intermittent drug techniques ('early‐based' and 'crisis‐based').
Investigation of heterogeneity
If inconsistency were high, this was reported. First, we investigated whether data had been entered correctly. Second, if data were correct, the graph was visually inspected and outlying studies were successively removed to see if homogeneity was restored. For this review, we decided that should this occur with data contributing to the summary finding of no more than around 10% of the total weighting, data would be presented. If not, data were pooled and issues were discussed. We know of no supporting research for this 10% cut‐off but are investigating use of prediction intervals as an alternative to this unsatisfactory state. When unanticipated clinical or methodological heterogeneity were obvious, we simply stated hypotheses regarding these for future reviews or versions of this review. We did not anticipate undertaking analyses relating to these.
Sensitivity analysis
1. Implication of randomisation
We included trials in a sensitivity analysis if they were described in some way as to imply randomisation. For the primary outcomes, we included these studies and if there was no substantive difference when the implied randomised studies were added to those with a better description of randomisation, then all data were employed from these studies. We undertook a sensitivity analysis excluding these studies from the primary outcomes to assess whether this affected the results.
2. Assumptions for lost binary data
Where assumptions had to be made regarding people lost to follow‐up (see Dealing with missing data), we compared the findings of the primary outcomes when we used our assumption compared with completer data only. If there was a substantial difference, we reported results and discussed them but continued to employ our assumption.
Where assumptions would have had to be made regarding missing SDs data (see Dealing with missing data), we would have compared the findings on primary outcomes when we used our assumption compared with completer data only. A sensitivity analysis would have been undertaken to test how prone results were to change when 'completer' data only were compared to the imputed data using the above assumption. However, no SD data were imputed.
3. Risk of bias
We analysed the effects of excluding trials that were judged to be at high risk of bias across one or more of the domains of randomisation (implied as randomised with no further details available) allocation concealment, blinding and outcome reporting for the meta‐analysis of the primary outcome. If the exclusion of trials at high risk of bias did not substantially alter the direction of effect or the precision of the effect estimates, then data from these trials were included in the analysis. However, all included studies were rated as 'high' on risk of bias on one or more of the domains, therefore, the effects of excluding each study would have resulted in no data to compare.
4. Imputed values
We had also intended to undertake a sensitivity analysis to assess the effects of including data from trials where we used imputed values for ICC in calculating the design effect in cluster randomised trials. If substantial differences were noted in the direction or precision of effect estimates in any of the sensitivity analyses listed above, we would not have pooled data from the excluded trials with the other trials contributing to the outcome, but instead presented them separately. However, no cluster randomised trials were identified.
5. Fixed and random effects
All data have been synthesised using a fixed‐effect model, however, we also synthesised data for the primary outcome using a random‐effects model to evaluate whether this altered the significance of the results.
6. Skewed data
Where scale derived data were both skewed and not skewed, all data were synthesised together and then the skewed data removed. This process was described and where clinically meaningful changes resulted, only the non‐skewed data were presented in the synthesis. Skewed data were presented in 'other' tables within the Data and analyses section.
Results
Description of studies
Please also see Characteristics of included studies; Characteristics of excluded studies.
Results of the search
The initial search of the Cochrane Schizophrenia Group Trials Register, carried out in 2006 (see Appendix 1), identified 174 studies. We additionally made a later search of the same Trials Register in April 2012 (using a modified search, based on the search strategy from the original review), which identified 56 references. An additional 11 potentially relevant references were identified from the reference lists of published trials and reviews (see Figure 1).

Study flow diagram.
Included studies
The review includes 17 studies published between 1962 and 2011. All studies were described as randomised; however, only four trials provided adequate descriptions of randomisation (Gaebel 2011; Herz 1991*Schooler 1997; Wunderink 2007), the remaining majority of included studies did not provide any further details beyond describing their trial as 'randomised' (for more details, see Characteristics of included studies and the accompanying 'Risk of bias' tables).
1. Setting
Of the 17 included studies within the meta‐analysis, six were large, multi‐centre trials involving two 18‐hospital collaborative studies (Caffey 1964; Prien 1973), two German multi‐centre studies (Gaebel 2011; Pietzcker 1993*), a study conducted at seven district mental health care centres and a University Department of Psychiatry (all in the Netherlands, Wunderink 2007), and one multi‐centre trial conducted in the US (Schooler 1997). Two studies were conducted in hostel wards in Scotland (UK) (McCreadie 1980; McCreadie 1982), four studies took place in psychiatric hospitals/institutes in the US (Carpenter 1987; Carpenter 1990*; Herz 1991*; Shenoy 1981), and one in Germany (Wiedemann 2001). One study took place in a London (UK) hospital (Jolley 1989/1990), and a further trial was conducted in a Centre for Addiction and Mental Health, Canada (Remington 2011). It is not clear exactly where the trial was conducted in Blackburn 1961 and Olson 1962*.
2. Length of trials
We included trials that varied in duration; from six weeks (Shenoy 1981), four months (Blackburn 1961; Caffey 1964; Prien 1973), six months (Olson 1962*; Remington 2011) nine and ten months (McCreadie 1980; McCreadie 1982), one year (Gaebel 2011), 18 months (Wiedemann 2001) to two years (Carpenter 1987; Carpenter 1990*; Herz 1991*; Jolley 1989/1990; Pietzcker 1993*; Schooler 1997; Wunderink 2007).
3. Participants
There were a total of n = 2252 participants in the 17 included studies that provided data for the meta‐analyses. Participants in seven of the included trials appear to have been inpatients (Blackburn 1961; Caffey 1964; McCreadie 1980; McCreadie 1982; Olson 1962*; Prien 1973; Wiedemann 2001), while in the remaining 10 studies, participants were outpatients (Carpenter 1987; Carpenter 1990*; Gaebel 2011; Herz 1991*; Jolley 1989/1990; Pietzcker 1993*; Remington 2011; Schooler 1997; Shenoy 1981; Wunderink 2007).
All participants had a diagnosis of schizophrenia using different operational diagnostic criteria; RDC criteria 1978 (Carpenter 1987; Carpenter 1990*), ICD‐9/10 (ICD‐10) (Gaebel 2011; Pietzcker 1993*; Wiedemann 2001), DSM‐III/IV (APA 1980; APA 1994) (Herz 1991*; Jolley 1989/1990; Remington 2011; Schooler 1997; Shenoy 1981; Wunderink 2007), 'definite schizophrenia' according to Feighner 1972 criteria (McCreadie 1980; McCreadie 1982) ‐ classification and diagnostic criteria were unclear in four studies (Blackburn 1961; Caffey 1964; Olson 1962*; Prien 1973).
In total, there were more male (n = 1555) than female (n = 540) participants randomised. Ten studies included both male and female participants (Carpenter 1987; Carpenter 1990*; Gaebel 2011; Herz 1991*; Jolley 1989/1990; Pietzcker 1993*; Remington 2011; Schooler 1997; Wiedemann 2001; Wunderink 2007), five studies included male participants only (Blackburn 1961; Caffey 1964; McCreadie 1980; McCreadie 1982; Prien 1973), and two studies did not specify the sex of participants (Olson 1962*; Shenoy 1981).
4. Trial Size
The overall sample size in all the included trials was generally small. The total number of participants in each trial ranged from n = 29 (McCreadie 1982) to n = 375 (Prien 1973). Only seven studies had a sample size of 100+ participants (Caffey 1964; Carpenter 1990*; Herz 1991*; Pietzcker 1993*; Prien 1973; Schooler 1997; Wunderink 2007).
5. Interventions
5.1 Any Intermittent drug technique versus maintenance therapy
Out of the included studies, each made use of different intermittent drug techniques and various antipsychotics, however, most dosages were classified as either low/moderate (apart from McCreadie 1980; McCreadie 1982, in which both trials employed high doses of pimozide). All trials included a maintenance group consisting of participants taking their usual dosage of medication as prescribed in the form of maintenance, continuous or long‐term therapy (these are discussed in Characteristics of included studies).
The majority of studies used a drug‐holiday approach versus maintenance treatment (Blackburn 1961; Caffey 1964; McCreadie 1980; McCreadie 1982; Olson 1962*; Prien 1973; Remington 2011; Shenoy 1981), followed by a prodrome‐based (early) intervention approach versus maintenance treatment (Carpenter 1987; Carpenter 1990*; Herz 1991*; Jolley 1989/1990; Schooler 1997) and gradually‐increased drug‐free periods versus maintenance treatment (Gaebel 2011; Wiedemann 2001; Wunderink 2007). One trial employed three treatment arms and compared both prodrome‐based (early) versus crisis‐based intermittent intervention versus maintenance treatment (Pietzcker 1993*); the results for this study were presented in the main results as well as in a subgroup analysis, to compare the effects of each intermittent intervention with each other. Types of antipsychotics and dosages varied between studies, and where some trials did not describe the specific drugs used nor the dosage, mean dosages of chlorpromazine or haloperidol equivalents were frequently employed; these details have been addressed in order to account for differences between studies.
5.1.1. Prodrome‐based/early interventions (defined as treatment given on the early signs of relapse).
Five trials were included comparing an intermittent prodrome‐based/early intervention to maintenance therapy. Two trials used the same approach of administering antipsychotic mediation on an 'as‐needed' basis to participants who were otherwise drug‐free, with moderate to high doses of antipsychotics given when prodromal symptoms occurred and discontinued when a stable state was achieved (mean daily dose 196 mg ± 163 mg chlorpromazine equivalents, Carpenter 1987; mean daily dose 4.4 mg ± 1.1 mg haloperidol/173 mg ± 69 mg chlorpromazine, Carpenter 1990*). Participants were treated within the context of a psychosocial intervention, which complemented the intermittent treatment strategy in Carpenter 1987 (involving assignment to a primary therapist) and complemented both treatment strategies in Carpenter 1990* (weekly individual therapy as well as an educational approach through involvement with family/significant others).
In Herz 1991*, participants received either placebo medication or their usual dose of maintenance antipsychotic medication, as well as weekly supportive group therapy sessions. When prodromal symptoms appeared, participants in the intermittent treatment group were given the active form of antipsychotic medication openly; dosage was at the discretion of the psychiatrist, depending on the severity of symptoms, but was usually twice the maintenance or baseline level (average cumulative antipsychotic drug dosage (mg chlorpromazine equivalents) over two years = 487.19 mg ± 370.68 mg). Once participants were clinically stabilised and considered in remission for two weeks, active medication was decreased again while placebo was simultaneously increased.
Participants in Jolley 1989/1990 either received fluphenazine in pre‐trial doses or equivalent doses of placebo injections. Upon the emergence of prodromal symptoms or relapse, participants were given 5 mg to10 mg haloperidol for up to four weeks, and continued for a further four weeks after remission of symptoms (average cumulative antipsychotic drug dosage (mg haloperidol equivalents) over two years = 298 mg ± 249 mg ‐ participants were withdrawn if relapse exceeded eight weeks).
An intermittent, 'targeted, early intervention' was employed in Schooler 1997, in which stabilised participants were given an injection of sesame oil (or "miglioil vehicle", placebo) every two weeks, and when participants showed prodromal signs of relapse, open‐label rescue medication was added. In addition, participants received either one of two psychosocial interventions; psychoeducation‐supportive family management (SFM) or applied family management (AFM), which included psychoeducational workshops for participants and their families over a period of 24 months.
Participants in Pietzcker 1993* were assigned to one of three treatment arms, including a prophylactic early intervention technique, in which antipsychotic therapy resumed as soon as prodromal symptoms appeared and were discontinued once stabilised (average cumulative antipsychotic drug dosage (mg chlorpromazine equivalents) over two years = 90 mg); the other treatment arms included maintenance treatment and a crisis‐based intervention, addressed below.
5.1.2. Crisis intervention (defined as treatment given only in case of full relapse and discontinued again after re‐stabilisation).
There was only one trial that employed a crisis‐based intermittent technique (Pietzcker 1993*), classified as a 'antipsychotic crisis intervention', in which antipsychotic treatment was employed only when relapse occurred and was discontinued once stabilisation was achieved (average cumulative antipsychotic drug dosage (mg chlorpromazine equivalents) over two years = 110 mg).
5.1.3. Gradually increased drug‐free periods (defined as increasing the cessation period of the treatment constantly).
The intermittent technique adopted in Gaebel 2011 involved stepwise removal of previously maintained antipsychotic treatment over a period of three months at the most, and was restarted at the occurrence of prodromal symptoms ‐ mean daily dose of 1 mg/day haloperidol‐equivalent (the mean dose covers an initial maintenance phase of about three to four weeks (mean daily dose 3 mg/day), a phase of about 10 weeks in which antipsychotics were tapered off (mean daily dose 1.7 mg/day), a phase of six months where antipsychotics were withdrawn completely (0 mg/day) and a two‐week phase in which drug treatment was restarted).
Similarly, Wiedemann 2001 employed a 'targeted' medication approach, involving gradual decrease of antipsychotics after three months using a step‐by‐step discontinuation technique of 50% of antipsychotics every two weeks (mean daily dosage 201 mg ± 134 mg chlorpromazine (CPZ) equivalent). Where prodromal signs occurred, antipsychotic treatment was reintroduced and when re‐stabilisation was attained, pharmacotherapy was tapered off once more. Participants in Wunderink 2007 received a 'guided discontinuation' treatment, in which dosage was gradually tapered and discontinued 'if feasible'. Tapering was guided by symptom severity levels and the preferences of the participant; if early warning signs of relapse emerged or positive symptoms recurred, clinicians were to restart or increase the dosage of anti‐psychotics (average cumulative antipsychotic drug dosage (mg haloperidol equivalents) over two years = 4.36 mg).
5.1.4. Drug holiday (defined as stopping medication for fixed periods, and then reintroducing it (repeating this more than once)).
Blackburn 1961 subdivided their intermittent experimental group into two further groups of n = 15, with participants receiving either placebo for the whole length of the study, or receiving placebo for the first eight weeks of the study then reinstating antipsychotic medication for the final eight weeks of the study (either prochlorperazine, perphenazine, chlorpromazine, promazine, trifluoperazine ‐ dosages not stated). Participants in Caffey 1964 received a reduced total dosage of either chlorpromazine or thioridazine (administered in standard 100 mg tablets) on an intermittent‐schedule; they received their usual daily dosage on Monday, Wednesday and Friday, resulting in a reduction of dosage to 3/7 of what it had been previously. In McCreadie 1980, participants received intermittent pimozide (mean dose 8 mg/oral, maximum 32 mg every four days/week) and in McCreadie 1982, participants also received intermittent pimozide once a week (mean dose 10 mg to 60 mg/oral, mean 40 mg/intramuscular (IM) weekly). Olson 1962* 'alternated' either phenothiazine or chlorpromazine and nothing between participants in the intermittent strategy group (dosages not specified).
Participants were assigned to one of four intermittent interventions in Prien 1973: (1) intermittent five‐day schedule A, where participants received their pre‐study dosage Monday through Friday and placebo on Saturday and Sunday; (2) intermittent five‐day schedule B, where participants received their pre‐study dosage Monday, Wednesday, Thursday, Friday and Sunday, and placebo on Tuesday and Saturday; (3) intermittent four‐day schedule A: participants received their pre‐study dosage Monday through Thursday and placebo on Friday through Sunday; or (4) intermittent four‐day schedule B: participants received their pre‐study dosage Monday, Wednesday, Friday and Sunday, and placebo on Tuesday, Thursday and Saturday. However, these strategies are analysed collectively as one 'intermittent technique', as individually study data for each group were not reported. All participants had received stable doses of antipsychotic medication during the six months preceding the study; 48% of participants were receiving chlorpromazine (mean daily dose 462 mg), 46% were receiving thioridazine (mean daily dose 362 mg), 27% were receiving trifluoperazine (mean daily dose 15 mg), and 4% were receiving perphenazine (mean daily dose 28 mg), 25% of participants were receiving more than one drug. The intermittent technique employed in Remington 2011 required participants to receive the same daily dose administered every other day (either risperidone or olanzapine; dosages not specified). Participants in Shenoy 1981 received a six‐week drug discontinuation technique, in which they were given a placebo injection and were returned to their routine active medication at the end of the study (dosages not specified).
5.2 Maintenance therapy
In each of the included studies, various antipsychotics were administered throughout maintenance therapy in comparison with the above mentioned intermittent strategies ‐ all dosages were classified as either low/moderate. The majority of studies measured antipsychotic usage through chlorpromazine equivalents. Carpenter 1987 involved minimum daily chlorpromazine equivalent doses of 300 mg, combined with brief visits with a pharmacotherapist on alternate weeks; the mean daily dose totaling 720 mg ± 732 mg chlorpromazine equivalents; Carpenter 1990* employed the same continuous dose technique, but with a mean daily dose of 433 mg ± 46 mg chlorpromazine equivalents; participants in Herz 1991* received their usual dose of antipsychotic medication with an average cumulative antipsychotic drug dosage over two years of 424.84 mg ± 333.05 mg chlorpromazine equivalents; in Pietzcker 1993*, the type and application of antipsychotic drugs used throughout the study was not restricted and participants received continuous administration of medication, with doses individually adjusted in accordance with the patient's clinical demands at a given time, minimal dosage of 100 mg chlorpromazine equivalents, with a mean over two years of 210 mg; and in Wiedemann 2001, the same antipsychotic dose level was maintained throughout the study period, with a mean daily dosage of 314 mg ± 150 mg chlorpromazine equivalents) and haloperidol equivalents. Carpenter 1990* also presented a mean daily dose of 11.8 mg ± 4.4 mg haloperidol equivalent; participants in Gaebel 2011 were maintained on a specified drug regimen with a mean daily dose of 3 mg/day haloperidol equivalent; and participants in Wunderink 2007 were continuously treated with low‐dose second‐generation antipsychotics, measured as a mean daily dose of 2.94 mg haloperidol equivalent.
Five trials employed the use of continuous fluphenazine decanoate (participants in Jolley 1989/1990 continued to receive fluphenazine decanoate in clinically optimal (pre‐trial) doses, but the average cumulative antipsychotic drug dosage was measured in haloperidol equivalents, which over two years equalled 1616 mg ± 598 mg; continued fluphenazine decanoate was employed in McCreadie 1980 , with a mean dose of 12.5 mg/IM (maximum 50 mg weekly); similarly, McCreadie 1982 continued participants on IM fluphenazine decanoate, with a mean dose of 2 mg to 25 mg; participants in Schooler 1997 were maintained on either a standard dose of fluphenazine decanoate of 12.5 mg to 50 mg every two weeks or a low‐dose of 2.5 mg to 10 mg every two weeks; and participants in Shenoy 1981 were 'continued on their regular medication' and received a mean dose of 39.3 mg fluphenazine decanoate).
Participants in Blackburn 1961 had received initial daily doses of either prochlorperazine (15 mg to 150 mg), perphenazine (12 mg to 24 mg), chlorpromazine (50 mg to 800 mg), promazine (200 mg to 44 mg), trifluoperazine (6 mg) ‐ when assigned to maintenance therapy, participants continued on their pre‐study regimen. The same procedure was followed in Prien 1973, where participants had received stable doses of antipsychotic medication during the six months preceding the study; 48% of participants were receiving chlorpromazine (mean daily dose 462 mg), 46% were receiving thioridazine (mean daily dose 362 mg), 27% were receiving trifluoperazine (mean daily dose 15 mg), and 4% were receiving perphenazine (mean daily dose 28 mg); 25% of participants were receiving more than one drug.
Participants in Caffey 1964 continued to receive either chlorpromazine or thioridazine daily, administered in standard 100 mg tablets ‐ participants on chlorpromazine had been receiving it for over two years at an average daily dose of 400 mg and participants on thioridazine had been receiving it for one year at an average daily dose of 350 mg.
Some trials did not describe the dosage or even the type of antipsychotic administered throughout maintenance treatment (participants were described in Olson 1962* as having received medication 'in standard form'; and in Remington 2011, the control group received "treatment as usual", receiving either risperidone, olanzapine or loxapine, without specifying the dosages).
5.3 Placebo
Three trials included a placebo group in addition to an intermittent and maintenance group. Particpants assigned to intermittent treatment in Blackburn 1961 were further subdivided into two groups to receive either a placebo drug or placebo‐placebo regimen (thiamine chloride). Those who received placebo‐placebo were kept on this regimen for the full length of the study. Results for the individual subdivided groups are presented only by medium term; at short term, the results are combined. In Caffey 1964, there were two corresponding placebo groups for both the intermittent and maintenance; in the former, participants received the same number of tablets they had prior to the study in placebo form on a daily basis, and participants in the latter received the same number of tablets prior to the study in placebo form on an intermittent basis (Monday, Wednesday and Friday only). The placebo group in Olson 1962* alternated monthly between the active drug (one half of the group received phenothiazine and one half received chlorpromazine) and placebo.
6. Outcomes: Scales providing useable data
Rating scales that provided useful data are described below.
6.1. Global state
6.1.1 Clinical Global Impression Scale (CGI, Guy 1970)
This scale is a three‐item observer rated scale that measures severity of illness (CGI‐S); global improvement or change (CGI‐C); and therapeutic response. The CGI‐S and CGI‐C are rated on a seven‐point scale from 1 = normal to 7 = extremely unwell; lower scores indicative of decreased severity and/or greater recovery, and the treatment response ratings take into account both therapeutic efficacy and treatment‐related adverse effects, and range from 0 = marker improvement and no side effects, to 4 = unchanged or worse with side effects outweighing therapeutic effects. Each component of the CGI is rated separately, and the instrument does not provide a global score. Gaebel 2011 and Remington 2011 both reported data using the CGI‐S component; a factor contributing towards the definition of relapse in Gaebel 2011 was a CGI‐S change score of six or more, as well as PANSS positive score of more than 10, and a decrease in GAF score of more than 20. Pietzcker 1993* also noted deterioration on the CGI‐S indicated by a score of > 7 as a determinant contributing towards their definition of relapse (see below).
6.1.2 Global Assessment Scale (GAS, Endicott 1976)
This single‐item rating scale assesses one's overall functioning whilst diagnosed with a mental disorder during a specific time period. The scale scores from 1 = extremely unwell to 100 = extremely well and is divided into 10 equal intervals and the lower the mean value the more constant the symptomology. Carpenter 1987; Herz 1991*; Shenoy 1981; Wiedemann 2001 each reported data using the GAS; Herz 1991* defined 'relapse' as a decrease of ≤ 30 using GAS; and the definition of 'relapse' in Pietzcker 1993* included three criteria: i) an increase of > 10 in the psychosis factor (HOST, THOT, ACTV) of the BPRS; ii) a decrease of > 20 in the GAS; iii) and deterioration on the CGI scale indicated by a score of > 7. Relapse predicted by prodromal symptoms.
6.2. Mental state
6.2.1 Brief Psychaitric Rating Scale (BPRS, Overall 1962)
This scale measures positive symptoms and quantifies factors such as thought disorder, activation, hostility. somatic, hallucinatory, and depressive states. The original scale had 16 items, but a revised 18‐item scale is more commonly used, with scores ranging from 0 ‐ 126. Each item is defined on a seven‐point scale from 0 = not present to 7 = extremely severe. Higher scores equate to severity of illness. In their study Remington 2011 defined relapse as a 20% increase in overall symptoms using the BPRS; however, Carpenter 1987 and Wiedemann 2001 were the only studies to report usable outcome data using this scale.
6.2.2 Positive and Negative Symptom Scale (PANSS, Kay 1987)
PANSS was developed from the BPRS and the Psychopathology Rating Scale. It is used to evaluate positive, negative and other symptom dimensions in schizophrenia. The scale has 30 items, each measured on a seven‐point scoring system varying from 1 = absent to 7 = extreme. Gaebel 2011 and Wunderink 2007 were the only studies that reported data measuring both positive and negative symptoms.
6.2.3 Scale for the Assessment of Negative Symptoms (SANS, Andreasen 1982)
The SANS measures the incidence and severity of negative symptoms using a 25‐item scale, using a six‐point scoring system, where 0 = better to 5 = worse, where a higher score equals a more severe experience of negative symptoms. Gaebel 2011 was the only study that reported data using this scale.
6.3. General functioning
6.3.1 Global Assessement of Functioning (GAF, APA 1994)
The GAF subjectively measures overall psychiatric disturbance over a specified time period on a continuum from psychological or psychiatric sickness to health. Psychological, social and occupational functioning is assessed using a rating scale of 0 ‐ 90, where 0 = severe symptoms and 90 = no present symptoms. Gaebel 2011 was the only study to report data from this scale.
6.3.2 Groningen Social Disabilities Schedule (GSDS, Wiersma 1990)
This scale measures social disabilities through a semi‐structured interview with observer ratings of functioning in eight social role domains: vocational functioning, community integration, peer relationships, relationship with family members, parental functioning, partner relationship, house‐keeping and self‐care. Disabilities are rated on a four‐point scale from no disability to serious disability. Total disability scores range from 0 ‐ 21 and are calculated combining seven domains, excluding parental functioning because of limited applicability. Wunderink 2007 was the only study to report data from this scale, however data were skewed.
6.3.3 Level of Functioning Scale (LOFS, Hawk 1975)
The LOFS was designed to assess work functioning (occupational and overall level of function), social functioning (quality and quantity of social relationships, fullness of life, ability to meet basic needs) and hospitalisation. Scores from each area of functioning range from 0 = worst outcome, to 36 = best outcome, which is calculated by adding the nine outcome item scores.
6.4 Problem Appraisal Scale (PAS, Spitzer 1971)
The PAS in a one‐page form, designed for use in emergency room or outpatient settings where extensive and detailed mental status examinations are generally not done. This scale provides scaled judgements of 38 areas of psychiatric disturbance (broken down into physical function; intellectual development; social relations; social performance; and other signs and symptoms). These dimensions are rated on a five‐point scale, with 1 = none and 5 = severe over a time period of the last two weeks. Herz 1991* was the only study to report data using this scale.
6.3.5 Social Adjustment Scale (SAS, Weissman 1976)
The SAS contains 42 questions that measure either instrumental or expressive role performance in six major areas of functioning: work as a worker, housewife or student; social and leisure activities; relationships with extended families; marital role as a spouse, a parent and a member of the family unit. Each question is rated on a five‐point scale, with a higher score indicating impairment. Wiedemann 2001 was the only study to report data using this scale.
6.4. Adverse effects
6.4.1 Abnormal Involuntary Movement Scale (AIMS, Guy 1976)
This scale measures the examination of involuntary movements (tardive dyskinesia) consisting of 12 items scored from 0 = none to 4 = severe, quantifying the severity of tardive dyskinesia. This trial used in short‐term trials may also help to assess parkinsonian symptoms such as tremor. Only Gaebel 2011 and Remington 2011 reported usable data with this scale ‐ however the data from each of these studies are skewed.
6.4.2 Extrapyramidal Side Effects Scale (EPS, Simpson 1970)
This is an observer‐rated scale designed for assessing parkinsonian and related extrapyramidal side effects. The scale has 10 items ‐ including gait, arm dropping, shoulder shaking, elbow rigidity, wrist rigidity, leg pendulousness, head dropping, glabella tap, tremor and salivation ‐ each measured on a five‐point scoring system from 0 = absent to 4 = severe). Gaebel 2011 and Jolley 1989/1990 both reported data from this scale.
6.4.3 Hillside Akathisia Scale (HAS, Fleischhacker 1989)
The HAS was used to measure akathisia; the subjective subscale has two subjective and three objective items for which anchored rating points are provided. The subjective items take into account a patient's sensation of restlessness and urge to move, and the objective items assess physical signs of akathisia present in the head, trunk, hands, arms, feet and legs. There are a total of five items, which are measured on a five‐point scoring system from 0 = absent to 4 = present and not controllable. Gaebel 2011 was the only trial to report data using this scale.
6.4.4 Liverpool University Neuroleptic Side Effect Rating Scale (LUNSERS, Day 1995; Lambert 2003)
LUNSERS is a self‐rating scale to measure antipsychotic side effects with 41 items. These side effects are rated on a five‐point scale, from 0 = absent, to 4 = very much. Wunderink 2007 was the only trial to report data using this scale.
6.4.5 Udvalg for Kliniske Undersogelser Side Effects Rating Scale (UKU, UKU 1987)
The UKU is a clinician‐rated scale developed to provide comprehensive side‐effect ratings of psychopharmacological medications. There are 48 items to the scale, and each are defined by means of a four‐point scale, starting from 0 = not or doubtfully present, ranging to 3 = severe. Gaebel 2011 was the only trial to report data using this scale, however, these data are skewed.
6.5. Quality of life
6.5.1 Lancashire Quality of Life Profile (LQLP, Oliver 1991)
This 27‐item scale presents both objective quality of life indicators and subjective quality of life estimates; the subjective elements focus on five specific domains, including work and education, leisure and participation, religion, finances, living situation, legal and safety, family relations, social relations, and health. Participants rate their satisfaction with these factors on a seven‐point scale (1 = 'can't be worse', to 7 = 'can't be better'), the higher the score indicating a better quality of life. This scale has been subject to thorough examination to assess its validity, but is nevertheless widely used in Europe as a measurement to assess quality of life (van Nieuwenhuizen 2001). Gaebel 2011 was the only trial to report data using this scale.
6.5.2 Quality of Life Scale (QLS, Heinrichs 1984)
The QLS is a 21‐item clinician‐administered scale rated from a semi‐structured interview to assess symptoms and functioning. Each item is rated on a seven‐point scale and requires judgement by a clinician/interviewer on all but two cases. Each item is composed of three parts; (1) brief descriptive statement to focus the interviewer on the judgement to be made, (2) a set of suggestive probes, (3) the seven‐point scale with descriptive anchors for every other point ‐ with a low score 0 = severe impairment, and 6 = normal/unimpaired functioning.
6.5.3 World Health Organization Quality of Life Scale (WHOQoL‐Bref, O'Carroll 2000)
The WHOQoL‐Bref is a 26‐item self‐report comprising satisfaction with health, psychological functioning, social relationships and environmental opportunities. Each item is scored on a five‐point scale from 1 = poor to 5 = worse. Wunderink 2007 was the only trial that reported data using this scale.
Excluded studies
Eight studies were excluded altogether; Caffey 1975; Hymowitz 1980 and Uchida 2008 were each excluded because they were not randomised. Engelhart 2002; Levine 1980; Newton 1989 and Strauss 1990 were excluded because the trials delivered no usable data; and Docherty 2003 was excluded as there was no intermittent treatment group by which to draw comparison with continuous antipsychotic maintenance treatment.
Ongoing studies
There is one known ongoing study (UMIN Clinical Trials Registry (UMIN‐CTR) unique trial number: UMIN000006011, Uchida 2013); as of January 2012, participants were in the process of recruitment, with a target date for completion of late 2013.
Awaiting assessment
There are no studies awaiting assessment at the time of writing this review.
Risk of bias in included studies
For a graphical overview please see Figure 2 and Figure 3.

'Risk of bias' graph: review authors' judgements about each risk of bias item presented as percentages across all included studies.

Methodological quality summary: review authors' judgements about each methodological quality item for each included study.
Allocation
All 17 included trials were described as randomised; the methods used to describe allocation and concealment, however, were poorly described. Only four trials provided an adequate description of 'randomisation' (Gaebel 2011; Herz 1991*; Schooler 1997; Wunderink 2007), with six studies poorly describing the allocation methods used (Carpenter 1987; Carpenter 1990*; Olson 1962*; Pietzcker 1993*; Remington 2011; Wiedemann 2001) and the final seven provided no further description beyond stating that 'participants were randomised' or 'randomly assigned' (Blackburn 1961; Caffey 1964; Jolley 1989/1990; McCreadie 1980; McCreadie 1982; Prien 1973; Shenoy 1981). One study was rated as having a high risk of bias (Jolley 1989/1990) because it was stated that the participating clinicians were requested to refer patients whom they thought might benefit from the brief intermittent treatment approach.
Blinding
Overall, the description of blinding was poor throughout the records of the included studies; only five trials gave adequate description of methods used for blinding (Caffey 1964; McCreadie 1980; McCreadie 1982; Olson 1962*; Remington 2011). Three trials were rated as having a high risk of bias because, even though a double‐blind method was expressed, treatment was open to some participants depending on their point of entry into the study ('lateral entry' participants in Gaebel 2011) and when participants required active antipsychotic medication as an intervention (Herz 1991*; Schooler 1997). Four studies did not employ blinding methods (Carpenter 1987; Pietzcker 1993*; Wiedemann 2001; Wunderink 2007) and one study was described as single (assessor) blind (Carpenter 1990*). The remaining studies were rated as an unclear risk of bias, as there was little/no detail as to blinding (Carpenter 1990*; Jolley 1989/1990; Prien 1973; Shenoy 1981).
Incomplete outcome data
For this review, high loss to follow‐up was defined in trials where the number of participants lost exceeded 50% overall. Only one included study satisfied this criteria; Pietzcker 1993* had a high loss to follow‐up, with only 44% completing the study. Therefore, only the outcome of 'leaving the study early' was included in the data and analysis, as per our protocol, which stated that should more than 50% of data go unaccounted for, we would not reproduce these data or use them within analyses.
Several studies had a moderate level of participants lost to follow‐up (ranging between 34% to 48%), including McCreadie 1982; Olson 1962* and Schooler 1997. As did Carpenter 1987; Carpenter 1990*; Herz 1991* and Wiedemann 2001 studies, which presented completer‐only data in their results. In Gaebel 2011, attrition was moderate, yet contentious, as the included participants were 're‐randomised' following a previous trial by the same authors (one year of maintenance therapy comparing risperidone versus haloperidol); however, out of those randomised, n = 44 were treated and included in an intention‐to‐treat analysis.
Studies with low levels of attrition included Blackburn 1961; Jolley 1989/1990; McCreadie 1980;Remington 2011; Shenoy 1981; Wunderink 2007; each of these trials provided specific reasons why participants may have left the studies early. Caffey 1964 had a low attrition rate, and completer only data were used in their analysis, which included the participants in each group of the study that did not relapse, however, not all of the 'completer only' data were represented, making the results more susceptible to bias and therefore we rated this study as a 'high risk'. Follow‐up data were not made clear in Prien 1973.
Overall, poor reporting at each stage of the included studies made it difficult to ascertain the true numbers of participants who left the study early ‐ use of a flow chart would have been an appropriate measure to accurately reflect these numbers. Two studies did not make clear the number of participants lost to follow‐up (Caffey 1964; Prien 1973), and most studies either (i) did not indicate whether they reported completer analyses; (ii) did not specify whether completer or intention‐to‐treat analyses were employed; or (iii) presented highly skewed data.
Selective reporting
The majority of studies were rated as having a high risk of bias, as not all outcomes were reported, in particular, data from rating scales went unreported from the time intervals specified in the study protocols. Only one study reported all specified outcomes and was therefore rated as a low risk of bias (Wunderink 2007). Two studies were rated as an 'unclear' risk; Carpenter 1987 reported scale data but only by two years, where it was specified that criterion instruments would be completed at six‐month intervals; and Gaebel 2011, as mentioned above, was ambivalent; it was stated that participants from 13 German psychiatric hospitals were included, however, participants from only eight hospitals were mentioned, with no reasons for this reported.
Other potential sources of bias
1. Funding:
The majority of studies reported sources of funding, and included support grants from NIMH (Carpenter 1987; Carpenter 1990*; Herz 1991*); Department of Health and Social Services (Jolley 1989/1990); Netherlands Organisation for Health Research and Development (Wunderink 2007); the German Ministry of Research and Technology (Wiedemann 2001); Dumfries and Galloway Health Board (McCreadie 1982); the German Federal Ministry for Education and Research BMBF (Gaebel 2011); and a National Alliance for Research on Schizophrenia and Depression (NARSAD) Independent Award (Remington 2011). No studies described direct funding from pharmaceutical companies, but several trials acknowledged study drugs donated by Sandoz and Smith, Kline & French (Caffey 1964); Janssen Cilag and Wyeth‐Pharma (Gaebel 2011); Janssen Pharamceutical and ER Squibb Limited (Jolley 1989/1990; McCreadie 1980; McCreadie 1982); and Eli Lilly Nederland B.V. (Wunderink 2007).
2. Rating scales:
The majority of studies did not describe whether raters of measurement scales were independent (Herz 1991*; Olson 1962*; Pietzcker 1993*; Prien 1973; Remington 2011; Schooler 1997; Wiedemann 2001; Wunderink 2007), and in two studies raters were not independent (Gaebel 2011; Shenoy 1981). Only seven studies gave details on how ratings scales were administered and the extent to which raters were independent (Blackburn 1961; Caffey 1964; Carpenter 1987; Carpenter 1990*; Jolley 1989/1990; McCreadie 1980; McCreadie 1982).
Effects of interventions
See: Summary of findings for the main comparison ANY INTERMITTENT DRUG TECHNIQUE compared with MAINTENANCE THERAPY for schizophrenia; Summary of findings 2 INTERMITTENT (EARLY‐BASED) compared with MAINTENANCE THERAPY for schizophrenia; Summary of findings 3 INTERMITTENT (CRISIS INTERVENTION) compared with MAINTENANCE THERAPY for schizophrenia; Summary of findings 4 INTERMITTENT (GRADUALLY INCREASED DRUG‐FREE PERIODS) compared with MAINTENANCE THERAPY for schizophrenia; Summary of findings 5 INTERMITTENT (DRUG HOLIDAY) compared with MAINTENANCE THERAPY for schizophrenia; Summary of findings 6 ANY INTERMITTENT DRUG TECHNIQUE compared with PLACEBO for schizophrenia
Comparison 1. ANY INTERMITTENT DRUG TECHNIQUE versus MAINTENANCE THERAPY
All 17 included studies were included in this comparison, which included any type of intermittent drug therapy, with a total n = 2252. Twelve of the included studies reported data for the primary outcome of relapse (n = 1327) and six reported data for the second primary outcome of hospitalisation (n = 661). All the remaining studies reported for outcomes of either death, global state, general functioning, service outcomes, adverse effects, quality of life and leaving the study early, with the primary objective of evaluating the effects of intermittent drug techniques on these outcomes ‐ participants had to be clinically stabilised to some extent to participate in the study.
1.1 Relapse
Data demonstrate that there was a significantly greater risk of relapse for participants receiving intermittent drug therapy; results were homogenous, clinically and statistically significant in favour of maintenance therapy at each short term (n = 396, 4 RCTs, risk ratio (RR) 1.68, 95% confidence interval (CI) 1.00 to 2.81), medium term (n = 774, 5 RCTs, RR 2.41, 95% CI 1.50 to 3.86) and long term (n = 436, 7 RCTs, RR 2.46, 95% CI 1.70 to 3.54, Analysis 1.1).
1.2 Hospitalisation
At medium term, there was little difference between groups receiving intermittent therapy or maintenance therapy (n = 136, 2 RCTs, RR 1.03, 95% CI 0.07 to 14.98), however, results displayed significant heterogeneity (Chi² = 3.19, P = 0.07, I² = 69%) and were displayed using a random‐effects model. At long term, results were homogenous and statistically significant in favour of maintenance therapy, with a greater risk of hospitalisation for people receiving intermittent therapy (n = 626, 5 RCTs, RR 1.65, 95% CI 1.33 to 2.06, Analysis 1.2).
1.3 Death
People on maintenance treatment were less likely to die in the long term than those on intermittent treatment (1/77 versus 4/78), however the data were from only two trials, and did not rule out the effects of chance (n = 155, 2 RCTs, RR 0.34, 95% CI 0.05 to 2.08, Analysis 1.3).
1.4 Global state
1.4.1. Average score (CGI‐S, high = worse)
Symptom severity was measured using the CGI‐S scale and did not significantly differ between intermittent treatment and maintenance treatment at medium term (n = 35, 1 RCT) or long term (n = 27, 1 RCT, Analysis 1.4); substantial heterogeneity was present (Chi² = 2.38, P = 0.12, I² = 58%) and therefore displayed using a random‐effects model.
1.4.2. Average score (GAS, low = worse)
Symptomology was assessed using the GAS, and significantly favoured maintenance therapy in the short term (n = 31, 1 RCT, mean difference (MD) ‐3.61, 95% CI ‐5.67 to ‐1.55), but displayed little difference at both medium (n = 126, 2 RCTs, MD ‐0.45, 95% CI ‐4.55 to 3.66) and long term (n = 133, 3 RCTs, MD 1.32, 95% CI ‐2.75 to 5.39, Analysis 1.5); again, substantial heterogeneity was present (Chi² = 5.37, P = 0.07, I² = 62.7%).
1.4.3. Prodromal episodes
By long term, people receiving intermittent treatment were at a significantly greater risk of experiencing prodromal episodes, with significant favour for maintenance therapy (n = 155, 2 RCTs, RR 3.19, 95% CI 1.87 to 5.44, Analysis 1.6).
1.4.4. Significant improvement
One study also measured 'significant improvement', which was significantly demonstrated in people receiving maintenance therapy at both short term (n = 60, 1 RCT, RR 0.40, 95% CI 0.18 to 0.89) and medium term (n = 60, 1 RCT, RR 0.32, 95% CI 0.15 to 0.68, Analysis 1.7).
1.5 Mental state
1.5.1. Average score (BPRS, high = worse)
Mental state did not significantly differ between Intermittent and maintenance treatment over the medium term (n = 51, 1 RCT) or long term (n = 77, 2 RCTs) in trials that measured this outcome with the BPRS (Analysis 1.8).
1.5.2. Negative symptom score (PANSS negative symptom subscale, high = worse)
Negative symptoms were assessed in one RCT using the PANSS negative symptom subscale; there was no significant difference between intermittent and maintenance treatment groups by medium term (n = 128, 1 RCT) or long term (n = 128, 1 RCT, Analysis 1.9).
1.5.3. Negative symptom score (PANSS negative symptom subscale, high = worse, skew)
There were also skewed data reported using the PANSS negative symptom subscale, and these are reported separately (Analysis 1.10).
1.5.4. Negative symptom score (SANS negative symptom subscale, high = worse, skew)
This was also the case for assessing negative symptoms using SANS; these data are skewed and should be interpreted with caution (Analysis 1.11).
1.5.5. Positive symptom score (PANSS positive symptom subscale, high = worse)
Positive symptoms were measured using the PANSS positive symptom subscale, the results of which significantly favoured intermittent treatment by medium term (n = 128, 1 RCT, MD ‐0.80, 95% CI ‐1.58 to ‐0.02) but demonstrated no significant difference at long term (n = 155, 2 RCTs, MD 0.40, 95% CI ‐0.79 to 1.59, Analysis 1.12).
1.6 General functioning
1.6.1. Average endpoint (LOFS, low = worse)
Overall functioning was measured using the LOFS by one RCT, however there was no significant difference between intermittent or maintenance therapy (Analysis 1.13).
1.6.2. Social functioning score (GAF, low = worse)
Psychiatric disturbance was measured by one study using the GAF, which demonstrated significant favour of maintenance therapy by long term (n = 27, 1 RCT, MD ‐9.00, 95% CI ‐15.92 to ‐2.08, Analysis 1.14).
1.6.3. Social functioning score (GSDS, high = worse, skew)
The GSDS measured levels of social disabilities ‐ note that these data are skewed and are presented in an additional table (Analysis 1.15).
1.6.4. Social functioning score (PAS, high = worse)
Psychiatric disturbance was measured using the PAS, but results were no different at both medium term (n = 75, 1 RCT) and long term (n = 56, 1 RCT, Analysis 1.16).
1.6.5. Social functioning score (SAS, high = worse)
Finally, social adjustment was measured in one RCT using the SAS, which again demonstrated no significant difference between interventions at both medium term (n = 51, 1 RCT) and long term (n = 51, 1 RCT, Analysis 1.17).
1.7 Adverse effects
1.7.1. Akathisia (HAS, high = worse, skew)
The HAS was employed to measure akathisia. These results should be interpreted carefully, however, as only one study reported data using this scale, and the data displayed are skewed, with high standard deviations (Analysis 1.18).
1.7.2. Extrapyrimidal side effects
Only one trial reported data for specific extrapyramidal side effects, which demonstrated a slightly higher (non‐significant) instance of hypomimia (lack of facial expression) for maintenance therapy at medium term (n = 43, 1 RCT, RR 0.26, 95% CI 0.06 to 1.09) and long term (n = 43, 1 RCT, RR 0.17, 95% CI 0.02 to 1.33); no difference was found for rigidity between groups at medium term (n = 43, 1 RCT) and long term (n = 43, 1 RCT); no significant difference between groups for instance of tremor at medium term (n = 43, 1 RCT) and long term (n = 43, 1 RCT); no significant difference between groups for instance of akathisia at medium term (n = 43, 1 RCT), but with a significant difference favouring intermittent therapy at long term (n = 43, 1 RCT, RR 0.19, 95% CI 0.05 to 0.76); no significant difference between groups for instance of gait abnormality for maintenance therapy at medium term (n = 43, 1 RCT) and long term (n = 43, 1 RCT); no significant difference between groups for instance of parkinsonism at medium term (n = 43, 1 RCT), but with a significant difference favouring intermittent therapy at long term (n = 43, 1 RCT, RR 0.13, 95% CI 0.02 to 0.96); and a significantly higher risk of global non‐liveliness with maintenance therapy at both medium term (n = 43, 1 RCT, RR 0.24, 95% CI 0.08 to 0.73) and long term (n = 43, 1 RCT, RR 0.09, 95% CI 0.01 to 0.61, Analysis 1.19).
1.7.3. Extrapyrimidal symptoms (EPS, high = worse, skew)
Parkinsonian and related extrapyramidal side effects were also measured using the EPS scale, which presented skewed data and are best viewed by inspection of the 'other data' table (Analysis 1.20).
1.7.4. Need for additional medication
There was no significant difference in the number of people requiring additional medication (n = 346, 2 RCTs, Analysis 1.21).
1.7.5. Side effects (LUNSERS, high = worse, skew)
Side effects measured using LUNSERS presented skewed data and should be interpreted carefully (Analysis 1.22).
1.7.6. Side effects (UKU, high = worse, skew)
Side effects measured using UKU presented skewed data and should be interpreted carefully (Analysis 1.23) .
1.7.7. Tardive dyskinesia
By medium term, there was no significant difference when measuring prevalence of tardive dyskinesia at medium term (n = 43, 1 RCT) or by long term (n = 165, 4 RCTs, Analysis 1.24).
1.7.8. Tardive dyskinesia (AIMS, high = worse, skew)
Intermittent treatment groups generally scored lower on the AIMS at both medium and long term ‐ these results, however, are skewed and should be interpreted with caution (Analysis 1.25).
1.8 Quality of life
1.8.1. Average score (LQLP, low = worse)
There was no significant difference between groups when assessing quality of life scores at medium term, using LQLP (n = 27, 1 RCT) with lower scores in the intermittent treatment group in the one RCT that reported data (Analysis 1.26).
1.8.2. Average score (GLS, low = worse)
Data reported from one RCT using the QLS demonstrated no significant difference between groups by long term (n = 26, 1 RCT, Analysis 1.27).
1.8.3. Average score (WHOQoL‐Bref, low = worse)
Using the WHOQoL‐Bref, there was no difference between groups at both medium term (n = 128, 1 RCT) and long term (n = 128, 1 RCT, Analysis 1.28).
1.9 Leaving the study early/loss to follow‐up
There was no significant difference between groups when assessing people leaving the study early for any reason by short term (n = 31, 1 RCT), with equivocal results at medium term (n = 155, 3 RCTs, RR 1.40, 95% CI 0.25 to 7.82); there was a trend favouring maintenance therapy over intermittent therapy by long term (n = 996, 10 RCTs, RR 1.63, 95% CI 1.23 to 2.15, Analysis 1.29). There was moderate heterogeneity between these results, however, and they are presented using a random‐effects model (Chi² = 31.25, P = 0.003, I² = 58%).
Comparison 2: INTERMITTENT (EARLY‐BASED) versus MAINTENANCE THERAPY
Five studies compared intermittent (early‐based) therapy with maintenance therapy (Carpenter 1987; Carpenter 1990*; Herz 1991*; Jolley 1989/1990; Schooler 1997, n = 626).
2.1 Relapse
Data from two RCTs showed that people receiving intermittent (early‐based) treatment were more likely to relapse, with significant favour of maintenance therapy at long term (n = 155, 2 RCTs, RR 2.33, 95% CI 1.32 to 4.12, Analysis 2.1).
2.2 Hospitalisation
At medium term, no significant difference between groups for rates of hospitalisation (n = 101, 1 RCT) but at long term, results displayed statistical significance in favour of maintenance treatment (n = 625, 5 RCTs, RR 1.66, 95% CI 1.33 to 2.08, Analysis 2.2).
2.3 Death
Only two studies reported the outcome of death, with people receiving maintenance therapy at greater risk in the long term (n = 155, 2 RCTs, RR 0.34, 95% CI 0.05 to 2.08, Analysis 2.3).
2.4 Global state
2.4.1. Average score (GAS, low = worse)
Medium‐term data for global state using the GAS showed an equivocal effect between intermittent (early) treatment and maintenance therapy at medium term (n = 75, 1 RCT, MD ‐0.15, 95% CI ‐4.78 to 4.48) and long term (n = 82, 2 RCTs, MD 0.99, 95% CI ‐4.24 to 6.22, Analysis 2.4).
2.4.2. Prodromal episodes
Instances of prodromal episodes were also significantly more prevalent in intermittent (early) treatment, with statistically significant favour of maintenance treatment by long term (n = 155, 2 RCTs, RR 3.19, 95% CI 1.87 to 5.44, Analysis 2.5).
2.5 Mental state
2.5.1 Average score (BPRS, high = worse)
One study reported data using the BPRS, which demonstrated an equivocal effect by long term (n = 26, 1 RCT, MD 0.10, 95% CI ‐0.33 to 0.53, Analysis 2.6).
2.6 General functioning
2.6.1. Average endpoint (LOFS, low = worse)
In the one RCT that assessed level of functioning using the LOFS, results were equivocal by long term (n = 26, 1 RCT, MD 2.60, 95% CI ‐2.63 to 7.83, Analysis 2.7).
2.6.2. Social (PAS, high = worse)
There was no difference between groups in the one study that assessed functioning using the PAS, at medium (n = 75, 1 RCT) and long term (n = 56, 1 RCT, Analysis 2.8).
2.7 Adverse effects
2.7.1. Extrapyramidal side effects
Only one trial reported data for specific extrapyramidal side effects, which demonstrated no significant difference between groups for instance of hypomimia for maintenance therapy at medium term (n = 43, 1 RCT) and long term (n = 43, 1 RCT); no significant difference was found between groups instance of rigidity at medium term (n = 43, 1 RCT) and long term (n = 43, 1 RCT); no significant difference was found between groups for instance of tremor for maintenance therapy at medium term (n = 43, 1 RCT) and long term (n = 43, 1 RCT); no significant difference was found between groups for instance of akathisia at medium term (n = 43, 1 RCT), but with a significant outcome favouring intermittent (early) therapy at long term (n = 43, 1 RCT, RR 0.19, 95% CI 0.05 to 0.76); no significant difference was found between groups for instance of gait abnormality at medium term (n = 43, 1 RCT) and long term (n = 43, 1 RCT); no significant difference was found for instance of parkinsonism at medium term (n = 43, 1 RCT), but with a significant outcome favouring intermittent (early) therapy at long term (n = 43, 1 RCT, RR 0.13, 95% CI 0.02 to 0.96); and a significantly higher risk of global non‐liveliness with maintenance therapy at both medium term (n = 43, 1 RCT, RR 0.24, 95% CI 0.08 to 0.73) and long term (n = 43, 1 RCT, RR 0.09, 95% CI 0.01 to 0.61, Analysis 2.9).
2.7.2. Extrapyramidal symptoms (EPS, high = worse, skew)
Parkinsonian and related extrapyramidal side effects were also measured using the EPS scale, which presented skewed data and are these are best viewed by inspection of the 'other' data table (Analysis 2.10).
2.7.3. Need for additional medication
In the one RCT that compared intermittent (early) treatment with maintenance therapy, there was no difference in the amount of people who required additional medication (n = 313, 1 RCT, Analysis 2.11).
2.7.4. Tardive dyskinesia
By medium term, there was no significant difference between groups when measuring prevalence of tardive dyskinesia at medium term (n = 43, 1 RCT) or by long term (n = 30, 1 RCT, Analysis 2.12).
2.8 Quality of life
2.8.1. Average score (QLS, low = worse)
Data reported from one RCT using the QLS demonstrated no significant difference by long term (n = 26, 1 RCT, Analysis 2.13).
2.9 Leaving the study early/loss to follow‐up
There was a trend favouring maintenance therapy over intermittent therapy by long term (n = 562, 5 RCTs, RR 1.67, 95% CI 1.17 to 2.37, Analysis 2.14). There was moderate heterogeneity between these results, however, and they are presented using a random‐effects model (Chi² = 9.45, P = 0.05, I² = 58%).
Comparison 3: INTERMITTENT (CRISIS INTERVENTION) versus MAINTENANCE THERAPY
Only one study reported data for this comparison.Pietzcker 1993* had three treatment arms, and so this comparison assesses the outcomes of participants in that study receiving intermittent (crisis) and maintenance therapy (n = 237). As loss to follow‐up was at 56%, only data for the outcome of leaving the study early are presented.
3.1 Leaving the study early/loss to follow‐up
By long term, there was a significantly greater number of participants receiving intermittent (crisis) therapy that left the study early or were lost to follow‐up (n = 237, 1 RCT, RR 1.57, 95% CI 1.23 to 2.00, Analysis 3.1).
Comparison 4: INTERMITTENT (GRADUALLY INCREASED DRUG‐FREE PERIODS) versus MAINTENANCE THERAPY
Three studies provided data for this comparison (Gaebel 2011; Wiedemann 2001; Wunderink 2007, n = 260).
4.1 Relapse
Data from three RCTs showed that people receiving intermittent (gradually increased drug‐free) treatment were more likely to relapse, with no significant difference at short (n = 128, 1 RCT) and medium term (n = 128, 1 RCT), but with significant favour of maintenance therapy at long term (n = 219, 3 RCTs, RR 2.76, 95% CI 1.63 to 4.67, Analysis 4.1). Heterogenity was present with long‐term data, but this was only slight (Chi² = 2.89, P = 0.24, I² = 31%), and results remain in data and analysis using a fixed‐effect model.
4.2 Global state
4.2.1. Average score (CGI‐S, high = worse)
Symptom severity was measured by one RCT using the CGI‐S scale, which demonstrated no significant difference between groups by long term (n = 27, 1 RCT, Analysis 4.2).
4.2.2. Average score (GAS, low = worse)
Results were equivocal when using the GAS at medium term (n = 51, 1 RCT, MD ‐1.54, 95% CI ‐10.42 to 7.34) and long term (n = 51, 1 RCT, MD 1.83, 95% CI ‐4.66 to 8.32, Analysis 4.3).
4.3 Mental state
4.3.1. Average score (BPRS, high = worse)
Using the BPRS, there was little difference in levels of psychiatric symptoms between people receiving intermittent or maintenance therapy, with no significant difference between groups at medium term (n = 51, 1 RCT) or long term (n = 51, RCT, MD 0.20, Analysis 4.4).
4.3.2. Negative symptoms score (PANSS negative symptom subscale, high = worse)
Negative symptom scores using PANSS tended to be slightly higher with maintenance therapy, but with no significant difference between groups at both medium (n = 128, 1 RCT) and long term (n = 128, 1 RCT, Analysis 4.5)
4.3.3. Negative symptoms score (PANSS negative symptom subscale, high = worse, skew)
Skewed data using PANSS in one RCT are presented in a separate table (Analysis 4.6).
4.3.4. Negative symptom score (SANS, high = worse, skew)
Data assessing negative symptoms using SANS were also skewed (Analysis 4.7).
4.3.5. Positive symptoms score (PANSS positive symptoms subscale, high = worse)
Positive symptoms were assessed using the PANSS positive symptom subscale; the one RCT that presented data at medium term demonstrated significant favour for intermittent treatment (n = 128, 1 RCT, MD ‐0.80, 95% CI ‐1.58 to ‐0.02), but an equivocal effect by long term (n = 155, 2 RCTs, MD 0.40, 95% CI ‐0.79 to 1.59, Analysis 4.8).
4.4 General functioning
4.4.1. Social functioning score (GAF, low = worse)
Social functioning scores using the GAF significantly favoured maintenance treatment at long term in the one RCT that reported data (n = 27, 1 RCT, MD ‐9.00, 95% CI ‐15.92 to ‐2.08, Analysis 4.9).
4.4.2. Social functioning score (GSDS, high = worse, skew)
Data presented were skewed with the GSDS (Analysis 4.10) and need interpreting with caution.
4.4.3. Social functioning score (SAS, high = worse)
Results were equivocal at both medium term (n = 51, 1 RCT, MD 0.06, 95% CI ‐0.10 to 0.22) and long term (n = 51, 1 RCT, MD 0.05, 95% CI ‐0.08 to 0.18, Analysis 4.11) when using the SAS.
4.5 Adverse effects
4.5.1. Akathisia (HAS, high = worse, skew)
All data from scales used to assess adverse effects/events are skewed and are presented in separate tables (Analysis 4.12).
4.5.2. Extrapyramidal symptoms (EPS, high = worse, skew)
There was little difference in EPS scores to measure extrapyramidal symptoms (Analysis 4.13), with skewed data presented separately.
4.5.3. Side effects (LUNSERS, high = worse, skew)
Side effects scores were skewed when using LUNSERS in the one RCT that used the scale and are reported separately (Analysis 4.14).
4.5.4. Side effects (UKU, high = worse, skew)
Results for side effects using the UKU by long term were also skewed (Analysis 4.15).
4.5.5. Tardive dyskinesia
The only binary outcome represents zero instances of tardive dyskinesia in either intermittent or maintenance groups throughout the period of the one study that reported such data (Analysis 4.16).
4.5.6. Tardive dyskinesia (AIMS, high = worse, skew)
AIMS scores to measure tardive dyskinesia were skewed and are presented separately (Analysis 4.17).
4.6 Quality of life
4.6.1. Average score (LQLP, low = worse)
Quality of life scores were equivocal when using the LQLP by long term (n = 27, 1 RCT, MD ‐0.50, 95% CI ‐1.38 to 0.38, Analysis 4.18).
4.6.2. Average score (WHOQoL‐Bref, low = worse)
Again, results were equivocal using the WHOQoL‐Bref at both medium term (n = 128, 1 RCT, MD ‐0.70, 95% CI ‐4.27 to 2.87) and long term (n = 128, 1 RCT, MD ‐0.90, 95% CI ‐5.39 to 3.59, Analysis 4.19).
4.7 Leaving the study early/loss to follow‐up
There was no difference between groups for numbers leaving the study early for any reason by long term (n = 257, 3 RCTs, Analysis 4.20); these results displayed substantial heterogeneity (Chi² = 6.33, P = 0.04, I² = 68%) and are presented using a random‐effects model of analysis.
Comparison 5: INTERMITTENT (DRUG HOLIDAY) versus MAINTENANCE THERAPY
Seven studies provided data for this comparison (Blackburn 1961; Caffey 1964; McCreadie 1980; McCreadie 1982; Olson 1962*; Remington 2011; Shenoy 1981, n = 627).
5.1 Relapse
Data demonstrate that there was a significantly greater risk of relapse for participants receiving intermittent drug therapy; results were homogenous, statistically significant in favour of maintenance therapy at medium term (n = 272, 3 RCTs, RR 2.15, 95% CI 1.25 to 3.68), however, results were equivocal by short term (n = 268, 3 RCTs, RR 1.59, 95% CI 0.94 to 2.70) and long term (n = 62, 2 RCTs, RR 1.70, 95% CI 0.54 to 5.38, Analysis 5.1).
5.2 Hospitalisation
There was no significant difference in numbers of hospitalisation between groups (n = 35, 1 RCT, Analysis 5.2).
5.3 Global state
5.3.1. Average score (CGI‐S, high = worse)
At medium term, CGI scores were not significantly different between groups (n = 35, 1 RCT, Analysis 5.3).
5.3.2. Average score (GAS, low = worse)
In one RCT, results from the GAS significantly favoured maintenance therapy at short term (n = 31, 1 RCT, MD ‐3.61, 95% CI ‐5.67 to ‐1.55, Analysis 5.4).
5.3.3. Significant improvement
In the one trial that measured 'significant improvement', there was a significantly higher instance of improvement with maintenance therapy at short term (n = 60, 1 RCT, RR 0.40, 95% CI 0.18 to 0.89) and medium term (n = 60, 1 RCT, RR 0.32, 95% CI 0.15 to 0.68, Analysis 5.5).
5.4 Adverse effects
5.4.1. Need for additional medication
There was no significant difference between groups for instances of people requiring additional medication (n = 33, 1 RCT, Analysis 5.6).
5.4.2. Tardive dyskinesia
There was no significant difference between groups when assessing numbers of people who experienced tardive dyskinesia by long term (n = 50, 2 RCTs, Analysis 5.7).
5.4.3. Tardive dyskinesia (AIMS, high = worse, skew)
Tardive dyskinesia scores using the AIMS scale were skewed and are presented separately (Analysis 5.8).
5.5 Leaving the study early/loss to follow‐up
Overall, there was no significant difference in lost to follow‐up numbers between groups (n = 248, 6 RCTs, Analysis 5.9), however results demonstrated considerable heterogeneity (Chi² = 16.09, P = 0.007, I² = 69%) and are presented using a random‐effects model.
Comparison 6: ANY INTERMITTENT DRUG TECHNIQUE versus PLACEBO
Three studies reported data for this comparison (Blackburn 1961; Caffey 1964; Olson 1962*, n = 498).
6.1 Relapse
Compared with placebo, there was significant favour for intermittent treatment at short term (n = 260, 1 RCT, RR 0.22, 95% CI 0.10 to 0.45) and medium term (n = 290, 2 RCTs, RR 0.37, 95% CI 0.24 to 0.58, Analysis 6.1), however, heterogeneity is present for the medium term results (Chi² = 2.59, P = 0.11, I² = 61%), and so caution should be employed in interpreting this data.
6.2 Global state
6.2.1. Significant improvement
There was no significant difference in the amount of people considered 'significantly improved' by medium term (n = 30, 1 RCT, Analysis 6.2).
6.3 Leaving the study early/loss to follow‐up
People allocated to placebo were significantly more likely to remain in the study compared with the intermittent drug techniques used in two RCTS (n = 90, 2 RCTs, RR 1.97, 95% CI 1.28 to 3.01, Analysis 6.3).
Comparison 7: ANY INTERMITTENT DRUG TECHNIQUE (SPECIFIC DRUG) versus MAINTENANCE THERAPY (SPECIFIC DRUG)
We compared the differences between the various antipsychotics used in intermittent treatment compared with maintenance therapy at short term, medium and long term for our two primary outcomes of relapse and hospitalisation. Twelve studies provided data for the outcome of relapse (Blackburn 1961; Caffey 1964; Gaebel 2011; Herz 1991*; Jolley 1989/1990; McCreadie 1980; McCreadie 1982; Prien 1973; Remington 2011; Shenoy 1981; Wiedemann 2001; Wunderink 2007, n = 1327); however, some studies did not provide adequate information regarding the types of antipsychotics used, instead converting dosages into milligrams of chlorpromazine (Carpenter 1987; Carpenter 1990*; Herz 1991*; Wiedemann 2001) or haloperidol (Gaebel 2011; Jolley 1989/1990; Wunderink 2007) equivalents. Dosages were unclear in Remington 2011.
7.1 Relapse
Results demonstrated homogeneity, with favour of maintenance therapy with each specific drug comparison; some results were statistically significant, however, and demonstrate a higher risk of relapse for people receiving intermittent drugs in the following comparisons: various intermittent typical antipsychotics (moderate dose) versus maintained typical antipsychotics (moderate dose) at medium term (n = 551, 2 RCTs, RR 3.75, 95% CI 1.42 to 9.94); intermittent chlorpromazine equivalents (low dose) versus maintained chlorpromazine equivalents (low dose) by long term (n = 148, 2 RCTs, RR 2.62, 95% CI 1.30 to 5.28) and intermittent haloperidol equivalents (low dose) versus maintained haloperidol equivalents (low dose) by long term (n = 226, 3 RCTs, RR 2.53, 95% CI 1.60 to 4.01, Analysis 7.1).
7.2 Hospitalisation
Data demonstrated statistical significance in favour of maintenance therapy when comparing intermittent fluphenazine decanoate (low dose) versus maintained fluphenazine decanoate (low + moderate dose) by long term (n = 313, 1 RCTs, RR 1.81, 95% CI 1.33 to 2.48), with overall statistically significant favour for maintenance therapy between all groups (n = 661, 6 RCTs, RR 1.58, 95% CI 1.28 to 1.97, Analysis 7.2).
SENSITIVITY ANALYSIS: ANY INTERMITTENT DRUG TECHNIQUE versus MAINTENANCE THERAPY
When included studies that implied randomisation or provided no further details regarding randomisation techniques were removed from the meta‐analysis, this did not substantially alter the direction of effect or the precision of the effect estimates, with a significantly greater risk of relapse still demonstrated for people receiving any intermittent therapy by long term (n = 273, 3 RCTs, RR 2.19, 95% CI 1.41 to 3.42), and greater risk of hospitalisation for the same group by long term (n = 414, 2 RCTs, RR 1.76, 95% CI 1.31 to 2.36); therefore, where risk of bias for randomisation was 'unclear', all data have been employed from all studies. All of the included studies were judged to be at a high risk of bias across one or more of the domains of randomisation, allocation concealment, blinding and outcome reporting, which makes it difficult to draw meaningful conclusions from a sensitivity analyses, as we would need substantial power to show real differences with confidence.
When testing how prone the primary outcomes were to change when data only from people who complete the study to that point were compared to the intention to treat analysis, there was little difference in results ‐ often showing results with greater significance. When comparing any intermittent drug technique to maintenance therapy, data still showed significantly greater relapses in the intermittent group at short term (n = 358, 3 RCTs, RR 2.12, 95% CI 1.12 to 3.98), medium term (n = 767, 5 RCTs, RR 2.94, 95% CI 1.71 to 5.05) and long term (n = 430, 7 RCTs, RR 2.51, 95% CI 1.72 to 3.67). Neither was there any significant difference in numbers of people hospitalised at long term (n = 620, 5 RCTs), with data still showing significant favour for maintenance therapy.
Discussion
Summary of main results
1. Specific
The review includes studies that span over five decades. Over this period, the landscape of psychiatry has changed, as have the types of participants involved in the studies; the methods by which trials are carried out; treatment administered and even the level of quality by which results are reported (Thornley 1998). All studies were included in the meta‐analysis, however, and have been detailed in Characteristics of included studies for closer inspection. There were no differences in primary outcomes when a random‐effects or fixed‐effect model was used; results that displayed moderate heterogeneity were analysed using a random‐effects model.
Comparison 1. ANY INTERMITTENT DRUG TECHNIQUE versus MAINTENANCE THERAPY
This comparison encapsulates the various forms of intermittent antipsychotic treatment (which, for the purposes of this review, include intermittent treatment based on: prodrome/early‐based intervention; crisis‐based intervention; drug holidays; and gradually increased drug‐free periods) and antipsychotic treatment (only a select few of included studies have provided adequate detail regarding types of antipsychotics and dosages administered). Therefore, one must remain mindful that these intermittent treatments, although uniformly meta‐analysed within data and results, have employed differing: methods of administration; types of antipsychotics used; and methods by which trial authors determine when people receiving intermittent therapy (if receiving a form of early‐based intermittent treatment that relies on recognition of prodromal symptoms, for example) are to re‐start their treatment, if at all. With this in mind, the significance of the results for relapse at short, medium and long term indicates that any intermittent treatment (regardless of its administration), falls short to the stability of continuous maintenance therapy.
Only two studies reported death, with a higher (non‐significant) rate in people receiving maintenance therapy. In Herz 1991*, the deaths recorded were due to 'natural causes', with no further information given (n = 2 receiving maintenance therapy), and a 'possible suicide' (n = 1 receiving intermittent therapy) who drowned after ingesting large amounts of alcohol. It is unclear to what extent, if any, these deaths could be said to be attributable to either intermittent or maintenance treatments. This is also the case with the deaths recorded by Jolley 1989/1990, in which n = 2 participants receiving maintenance treatment died; one death was a suggested suicide, and the other reported as 'attributable to an acute physical illness'.
Many scales were employed to measure adverse effects; however, all presented skewed data and were not included within a meta‐analysis due to high standard deviations. Specific adverse effects were measured in only one randomised controlled trial (RCT) (Jolley 1989/1990), and demonstrated significant favour for intermittent treatment when assessing extra‐pyramidal symptoms (EPS) side effects including: akathisia; parkinsonism; and non‐liveliness.
Most continuous outcomes demonstrated no significant difference between intervention groups; were considerably skewed; or used different scales to measure the same outcome, making a meaningful interpretation of these results difficult.
Comparison 2: INTERMITTENT (EARLY‐BASED) versus MAINTENANCE THERAPY
More people receiving intermittent treatment, given on the early/prodromal signs of relapse, were significantly more likely to experience full relapse compared to people receiving maintenance therapy. There was also a higher instance of hospitalisation with people receiving the early intermittent treatment; results were homogenous and demonstrated statistical significance by long term. These results from five RCTs, with a relatively large sample size (n = 620), demonstrate that maintenance therapy is more effective than early intermittent techniques at lowering the number of people hospitalised.
Results were equivocal when assessing general functioning; no two studies used the same scale to assess general functioning, and any real‐life significance of these scale measurements have not been considered by trial authors.
We found that less specific adverse effects were experienced in people receiving intermittent treatment when given on the early/prodromal signs of relapse, demonstrating significant favour for intermittent treatment when assessing EPS symptoms including: akathisia; parkinsonism; and non‐liveliness. Only one RCT with a small sample size (n = 43) reported data for this outcome. Data for extrapyramidal symptom scores using the EPS were highly skewed, making it difficult to draw any meaningful conclusions.
More people tended to leave the studies early when they were receiving intermittent treatment, with a significant favour of maintenance therapy; however, considerable heterogeneity (I² = 58%) was evident in the analysis. Upon visual inspection, removal of Carpenter 1987 restored homogeneity; this RCT documented people who dropped out as: n = 9 in the maintenance group (one refused assignment to regimen; seven discontinued treatment; one was non‐compliant); and n = 7 in the intermittent group (two were hospitalised; two were dropped while hospitalised; three dropped out during clinical stability while medication‐free). Taking this into account, it is difficult to ascertain whether those who 'discontinued' the intermittent treatment did so for treatment‐related reasons or due to other circumstances.
Comparison 3: INTERMITTENT (CRISIS INTERVENTION) versus MAINTENANCE THERAPY
Only one study provided data for this comparison, and unfortunately, since attrition was over 50%, only data for the outcome of leaving the study early were included in the data and analysis. Maintenance therapy was significantly favoured, with a higher instance of people leaving the study early when given intermittent treatment. Numbers leaving the study early were adequately documented; a high number of participants in the intermittent treatment groups dropped‐out due to difficulties of withdrawing antipsychotics, indicating that people who left the study early had negative outcomes. This finding would need to be confirmed through further research, using high‐quality, randomised methods.
Comparison 4: INTERMITTENT (GRADUALLY INCREASED DRUG‐FREE PERIODS) versus MAINTENANCE THERAPY
Corresponding with the findings from Comparison 1 and 2, intermittent treatment, when employed via gradually increasing drug‐free periods, had a higher instance of relapse, with a significant outcome by long term.
Due to the small amount of studies (three RCTs) and relatively small sample sizes (maximum of n = 128) providing data for this mental state outcomes, results are difficult to interpret meaningfully. Data for most continuous outcomes were either considerably skewed, or demonstrated no significant difference between the groups.
General functioning scores tend to favour maintenance treatment, using the SAS, and significantly when using the GAF ‐ this judgement is based on a single study with only 27 participants. Furthermore, scores measuring social disabilities using the GSDS were considerably skewed.This makes the present results difficult to interpret ‐ dichotomous data are a preferred method of reporting outcomes, particularly for adverse effects, in order to reflect the real‐life significance of the outcome.
More people left the study early when receiving intermittent treatment via gradually increasing drug‐free periods. Considerable heterogeneity associated with leaving the study early could be attributable to the different methods by which drug‐free periods were gradually increased. Each of the three RCTs providing outcome data gradually decreased antipsychotic treatment in the intermittent group, however one trial sought complete removal over a period of three months at the most (Gaebel 2011), the second sought gradual decrease of the active drug after three months (Wiedemann 2001), and the third trial was open‐label, dosages were gradually tapered‐off guided by symptom severity levels and the preference of the participant, discontinued only 'if feasible' (Wunderink 2007). These factors could well influence whether or not a person left the study early due to inaccurate identification of times when medication should be administered or a lack of effective treatment structure, for example.
Comparison 5: INTERMITTENT (DRUG HOLIDAY) versus MAINTENANCE THERAPY
People who received intermittent drug treatment via drug holiday were significantly more likely to experience relapse in the short and medium term than people who received maintenance therapy, again confirming the results for the above comparisons that intermittent treatment is not as effective as continuous.
Only one RCT reported data for hospitalisation, in which intermittent therapy is favoured over maintenance; this contradicts results in the other comparisons, which was acknowledged by the trial authors, who stated their findings to be 'at odds' with the existing number of previous studies evaluating intermittent therapy. Further research is needed to clarify this issue.
There was no significant difference found when comparing instances of adverse effects between the two comparison groups, and numbers of people leaving the studies early were equivocal; reasons included: administrative (Blackburn 1961); refusal of medication (McCreadie 1980); exacerbation of positive symptoms, suicidal ideas and attempts, family requests to withdraw, tardive dyskinesia, complaints of tiredness (McCreadie 1982); 'behavioural' or 'inadvertent' attrition (Olson 1962*); withdrawal of consent (Remington 2011); and failure to attend appointments (Shenoy 1981).
Comparison 6: ANY INTERMITTENT DRUG TECHNIQUE versus PLACEBO
It is understandable that placebo‐controlled trials in this area are uncommon and it could be argued that in certain circumstances are unethical. We identified three trials undertaken in the 1960s that made this comparison; each trial was poorly reported, and failed to describe randomisation methods.
The two trials reporting data for relapse (Blackburn 1961; Caffey 1964) both employed a drug holiday intermittent technique, in which antipsychotics were withdrawn and reintroduced on a regular or longer‐term basis. Intermittent treatment was significantly favoured, with more people receiving placebo classified as relapsed. This finding goes some way to demonstrate that intermittent techniques are at least more effective than no treatment/placebo, the extent to which this result is applicable, however, could well be dependable on the type of intermittent therapy implemented.
Significantly more people receiving intermittent therapy left the study early when compared with placebo. Further, reasons for leaving were not made clear, described only as 'behavioural' or 'inadvertent' attrition, or 'lost for administrative reasons'. Whether this makes people leaving intermittent treatment likely to experience a negative outcome is difficult to establish. Differences between the study methods, however, may well have influenced favour for placebo ‐ the two comparison groups in Blackburn 1961 examined the effects of placebo substituted for the first half of the study (eight weeks) then active medication reintroduced for the final half of the trial, versus placebo substituted for the full trial length; whereas Olson 1962* compared active drugs alternated monthly (intermittent) versus active drugs alternated monthly with placebo. Placebo effect may well have been evident in Blackburn 1961, which made use of placebo in each treatment arm; this may have resulted in the much higher rate of attrition in the study that employed placebo in only one group.
Comparison 7: ANY INTERMITTENT DRUG TECHNIQUE (SPECIFIC DRUG) versus MAINTENANCE THERAPY (SPECIFIC DRUG)
Not all studies described the type of antipsychotic medication administered or the dosages used, therefore, this comparison measured outcome data only from those trials where adequate details regarding the type of medication were given. There was significant favour for maintenance therapy when comparing:
-
intermittent low/moderate dose typical antipsychotics versus maintained low/moderate dose typical antipsychotics at medium term;
-
intermittent low dose chlorpromazine/haloperidol equivalents versus maintained low dose chlorpromazine/haloperidol equivalents at long term.
Only chlorpromazine or haloperidol equivalents were reported in some trials, which make it difficult to ascertain efficacy of specific drugs, if at all, when given intermittently.
Meta‐analysis overall demonstrated significant favour of maintenance therapy for preventing hospitalisation, with significance found particularly when comparing intermittent low dose fluphenazine decanoate with maintained low/moderate dose fluphenazine decanoate.
2. General
Futhermore, because 'relapse' was defined differently in each individual study, there was not a single, fixed assessment of measurement. Out of the 17 studies included in this update, 15 reported our two primary outcomes of interest. The majority of the included studies had a low level of participants; only seven studies had a sample size of 100+ participants.
2.1 Heterogeneity
Some results are difficult to interpret due to high levels of heterogeneity; sources of heterogeneity have been explored and addressed in the above discussion, however, where results for the I2 are statistically significant (when testing for homogeneity), caution should be employed when adding trial data together.
2.2 Funnel plots
It is clear from Figure 4 that five small studies are scattered on the side of the plot, which suggests the possibility of publication bias. This is due to inequality of the scattered studies on both sides of the plot, as the left‐hand side represents studies that are having or approaching either no effect or a negative effect. Therefore, it can be said that there is evidence of asymmetry.

Funnel plot of comparison: 1 ANY INTERMITTENT DRUG TECHNIQUE versus MAINTENANCE THERAPY, outcome: 1.1 Relapse.
In Figure 5, three studies (two on the right and one on the left) have no effect since their standard errors (SE) range between 1 and 1.5. The funnel plot shows that the majority of large studies are scattered around the top of the plot along a lower SE of less than one. It can be concluded that the funnel plot is, to a large extent, symmetrical, raising the possibility of some potentially moderate bias. In other words, there may be some negative results that have not been published.
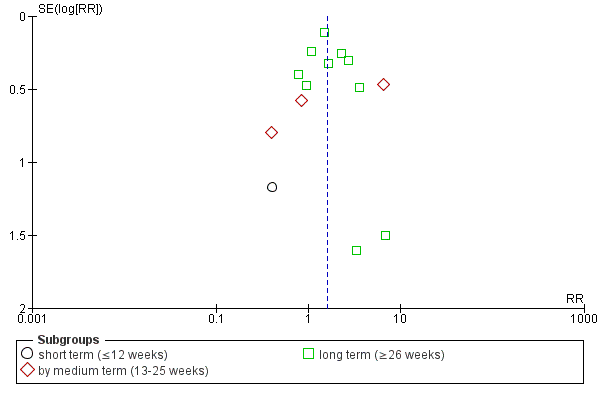
Funnel plot of comparison: 1 ANY INTERMITTENT DRUG TECHNIQUE versus MAINTENANCE THERAPY, outcome: 1.29 Leaving the study early/loss to follow‐up.
Overall completeness and applicability of evidence
1. Completeness
Twelve of the 17 included studies reported our primary outcome interest of relapse; however, only six trials reported our second primary outcome of interest of hospitalisation. No study reported economic outcomes, which would be of interest to managers and policy makers in measuring potential cost‐effectiveness and efficiency of the intervention, nor was satisfaction with treatment addressed. Furthermore, it was disappointing that only two studies reported death and only four reported tardive dyskinesia as outcome measures; two outcomes that could offer greater insight into an intervention that aims to reduce the risk of typical adverse effects of continuous antipsychotic treatment. Patient‐oriented outcomes were addressed in few small‐scale included studies; with only three studies reporting data for quality of life; four studies reporting mental state scores; and five studies reporting scores for general and social functioning. Numerous scales were employed (in some instances by single studies), which made it difficult to make any meaningful interpretation of results, as trial authors did not address the real‐life significance of scale measurements, and combining all similar scale data in meta‐analysis could overestimate authority of potentially weak data.
The available evidence is relevant to the review question, however, intermittent antipsychotic techniques were not always referred to explicitly, as some studies did not specify their treatment as intermittent, but 'targeted intervention', 'guided discontinuation' or 'dose reduction and family treatment'. This made the trial search problematic and the intervention question more indirect, as many other studies were identified via handsearching. Consequently, we worked mainly with published reports, which may have the result of missing other potentially relevant RCTs from the current review. When presented with problematic or incomplete data, we made efforts to contact relevant trial authors to clarify these issues.
Poor reporting exacerbated the problem of scarce data; three trials were excluded due to unusable data, and the majority of included studies did not report all outcomes as per protocol. This was particularly the case with scale data, where scale measurements were taken at designated time intervals, but no data were ultimately reported.
2. Applicability
Settings were not uniform between studies, with six large multi‐centre trials carried out in Germany, the Netherlands and the US; two studies carried out hostel wards in Scotland (UK); four trials undertaken in psychiatric hospitals/institutes in the US, one in Germany and one in London (UK); with a further trial conducted in a Centre for Addiction and Mental Health, Canada, setting and location were not made clear in two other included studies. As studies included both inpatients and outpatients from various countries, the international applicability of the present available evidence needs considering in relation to the methods of psychiatric treatment employed and the types of antipsychotic medication available or recommended in individual countries. Participants in seven of the total included studies were inpatients, and in the remaining 10 studies participants were outpatients. Of the inpatient studies, all were undertaken between 1961 and 1982 with the exception of a study undertaken in 2001. With this is mind, one must take into account the applicability of the evidence when considering results from studies that included inpatients, particularly because more psychiatric treatments are increasingly obliged to take place in outpatient or community settings. There was a disproportionate amount of male participants compared to female participants in the included studies (n = 1555 males and n = 540 females), and two included studies did not specify gender in their reports. Ages of participants were described in each study, with a range from all studies of 18‐60; means were provided in most of the reports. Furthermore, ethnicity/racial origin was not described in the majority of studies, with only six trials providing appropriate details.
Quality of the evidence
Overall, most quality criteria were poorly reported in the trials included in this review; large, well‐designed and clearly reported trials are possible in this area (as has been demonstrated in the recent TREC trials ‐ TREC‐Rio‐I; TREC‐Vellore‐I). Better reporting of the methods used to ensure trials of high quality as outlined in the CONSORT statement (Moher 2001) could have resulted in this review being more transparent. Future trialists in this area need to ensure that attention is given to the adequate reporting of quality criteria. Some data reported by the included studies were skewed, and without access to individual patient data, it is difficult to present these results in a meaningful way, or likewise to comment upon them with a degree of certainty.
Potential biases in the review process
The review protocol and process of study selection were strictly adhered to throughout the entire review process, and the process for searching for studies was thorough and data were extracted independently; however, this was made difficult due to numerical inconsistencies in parts of the reported data. Review authors adhered to the guidance from the Cochrane Handbook for Systematic Reviews of Interventions (Higgins 2011) and the Methodological Expectations for Cochrane Intervention Reviews (MECIR).
The first study search was narrow, and failed to identify several studies that suited inclusion criteria. With the intention of correctly identifying all relevant published studies, another trial search was conducted (see Appendix 1 for previous search term methods). Authors of included studies were contacted to obtain details of ongoing or unpublished studies, but there remains a possibility that other unpublished trials of the intervention exist which the review authors do not currently have access to. As a consequence, publication bias may have been perpetuated as we worked predominantly with published reports. Furthermore, it became clear that not all of the studies employing an intermittent technique of administering antipsychotics labelled it as such, referring instead to 'targeted intervention' or 'guided discontinuation'; it may therefore be that trials exist relying on essential elements of the intervention, but are not packaged and delivered in identical models.
Agreements and disagreements with other studies or reviews
The findings from this review supports the existing evidence that intermittent antipsychotic treatment is not as effective as continuous, maintained antipsychotic therapy in preventing relapse in people with schizophrenia. The findings of this review largely agree with current clinical guidelines (NICE 2010). These guidelines state that low‐dose prescribing and use of intermittent dosing strategies may well minimise side effects in the long‐term use of antipsychotic medication; however, the risk of symptom‐worsening and relapse is stated to outweigh any benefits (NICE 2010). Instead, it is suggested that patients who refuse maintenance therapy or where another contraindication to such therapy exists (e.g. side‐effect sensitivity), then targeted, intermittent dosage maintenance strategies may be considered, baring in mind the 'reasonable targets' for intervention, including presence of persistent symptoms, poor adherence to treatment regimen, lack of insight and substance use (Marder 2003). WHO guidance makes no mention of intermittent or targeted approaches (WHO 2009).

Study flow diagram.
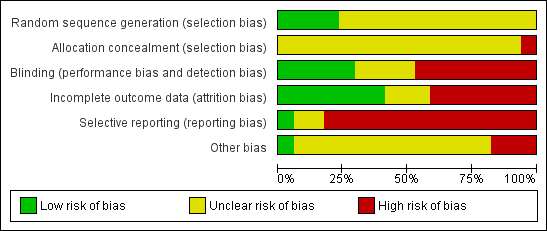
'Risk of bias' graph: review authors' judgements about each risk of bias item presented as percentages across all included studies.

Methodological quality summary: review authors' judgements about each methodological quality item for each included study.
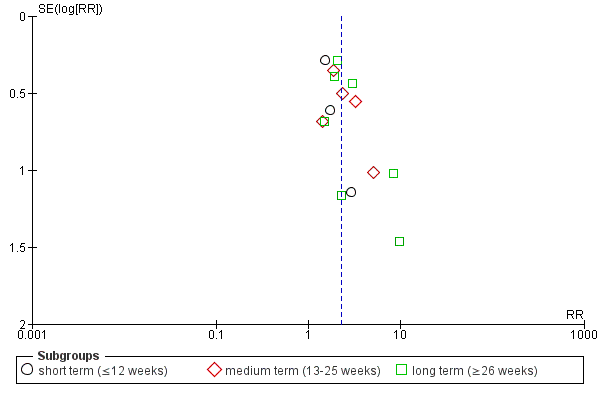
Funnel plot of comparison: 1 ANY INTERMITTENT DRUG TECHNIQUE versus MAINTENANCE THERAPY, outcome: 1.1 Relapse.

Funnel plot of comparison: 1 ANY INTERMITTENT DRUG TECHNIQUE versus MAINTENANCE THERAPY, outcome: 1.29 Leaving the study early/loss to follow‐up.
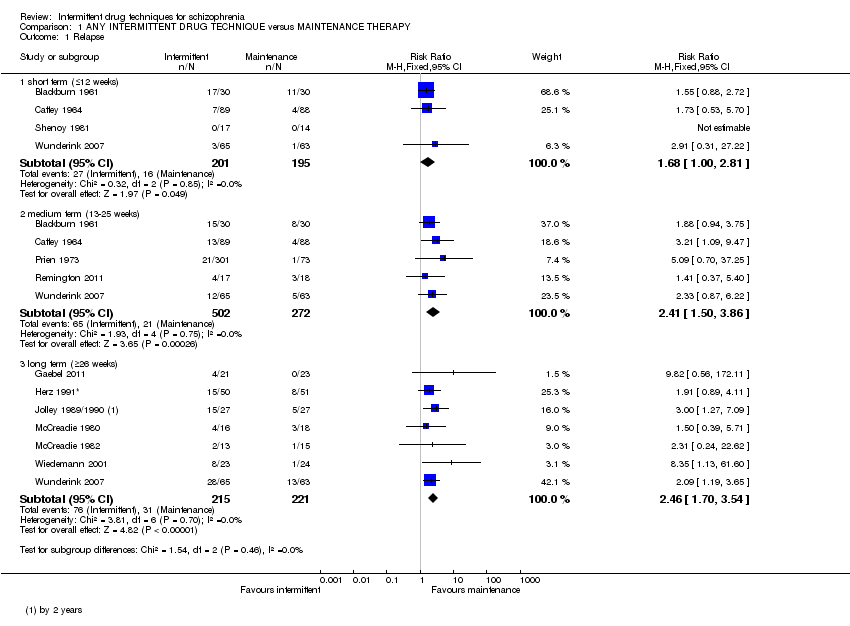
Comparison 1 ANY INTERMITTENT DRUG TECHNIQUE versus MAINTENANCE THERAPY, Outcome 1 Relapse.
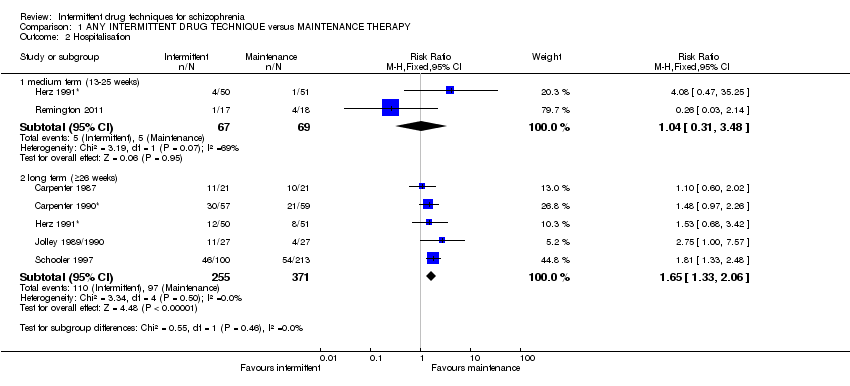
Comparison 1 ANY INTERMITTENT DRUG TECHNIQUE versus MAINTENANCE THERAPY, Outcome 2 Hospitalisation.
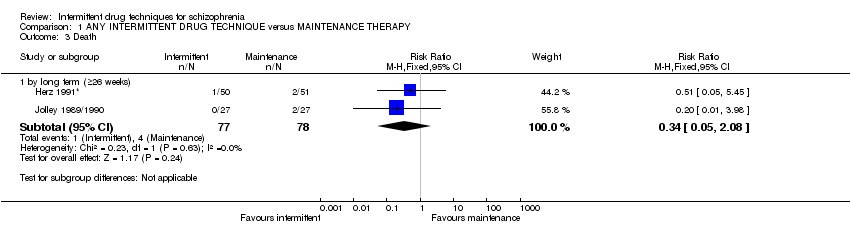
Comparison 1 ANY INTERMITTENT DRUG TECHNIQUE versus MAINTENANCE THERAPY, Outcome 3 Death.

Comparison 1 ANY INTERMITTENT DRUG TECHNIQUE versus MAINTENANCE THERAPY, Outcome 4 Global state: 1. Average score (CGI‐S, high = worse).

Comparison 1 ANY INTERMITTENT DRUG TECHNIQUE versus MAINTENANCE THERAPY, Outcome 5 Global state: 2. Average score (GAS, low = worse).
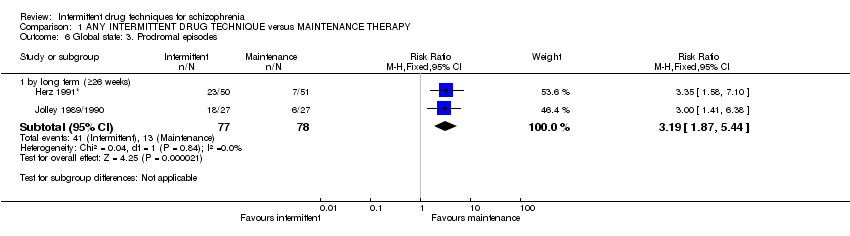
Comparison 1 ANY INTERMITTENT DRUG TECHNIQUE versus MAINTENANCE THERAPY, Outcome 6 Global state: 3. Prodromal episodes.
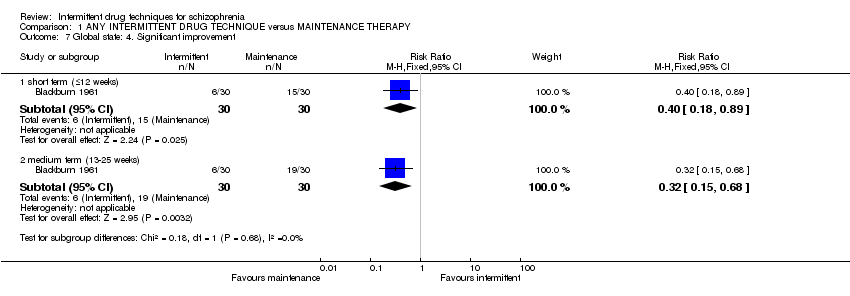
Comparison 1 ANY INTERMITTENT DRUG TECHNIQUE versus MAINTENANCE THERAPY, Outcome 7 Global state: 4. Significant improvement.

Comparison 1 ANY INTERMITTENT DRUG TECHNIQUE versus MAINTENANCE THERAPY, Outcome 8 Mental state: 1. Average score (BPRS, high = worse).

Comparison 1 ANY INTERMITTENT DRUG TECHNIQUE versus MAINTENANCE THERAPY, Outcome 9 Mental state: 2. Negative symptom score (PANSS negative symptom subscale, high = worse).
| Study | Intervention | Mean | SD | N |
| by long term (≥26 weeks) | ||||
| Gaebel 2011 | Intermittent | 13.4 | 9.1 | 8 |
| Gaebel 2011 | Maintenance | 9.1 | 2.8 | 19 |
Comparison 1 ANY INTERMITTENT DRUG TECHNIQUE versus MAINTENANCE THERAPY, Outcome 10 Mental state: 3. Negative symptom score (PANSS negative symptom subscale, high = worse, skew).
| Study | Intervention | Mean | SD | N |
| by long term (≥26 weeks) | ||||
| Gaebel 2011 | Intermittent | 17.6 | 18.0 | 8 |
| Gaebel 2011 | Maintenance | 5.7 | 9.7 | 19 |
Comparison 1 ANY INTERMITTENT DRUG TECHNIQUE versus MAINTENANCE THERAPY, Outcome 11 Mental state: 4. Negative symptom score (SANS, high = worse, skew).

Comparison 1 ANY INTERMITTENT DRUG TECHNIQUE versus MAINTENANCE THERAPY, Outcome 12 Mental state: 5. Positive symptom score (PANSS positive symptom subscale, high = worse).
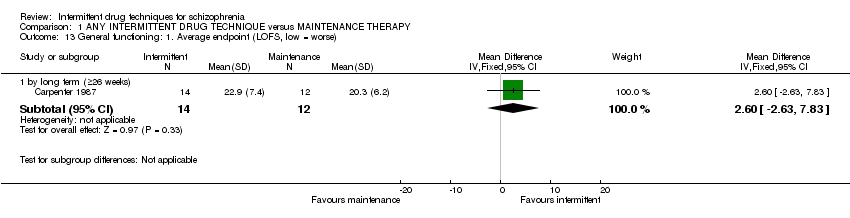
Comparison 1 ANY INTERMITTENT DRUG TECHNIQUE versus MAINTENANCE THERAPY, Outcome 13 General functioning: 1. Average endpoint (LOFS, low = worse).
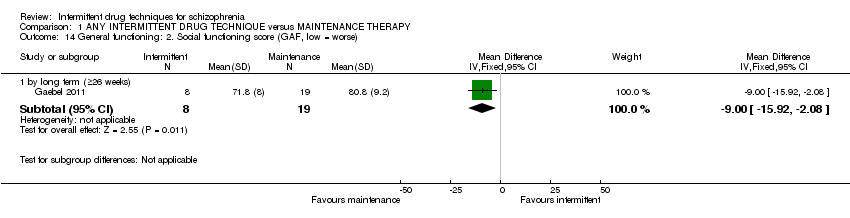
Comparison 1 ANY INTERMITTENT DRUG TECHNIQUE versus MAINTENANCE THERAPY, Outcome 14 General functioning: 2. Social functioning score (GAF, low = worse).
| Study | Intervention | Mean | SD | N |
| by long term (≥26 weeks) | ||||
| Wunderink 2007 | Intermittent | 5.8 | 4.5 | 65 |
| Wunderink 2007 | Maintenance | 6.4 | 4.2 | 63 |
Comparison 1 ANY INTERMITTENT DRUG TECHNIQUE versus MAINTENANCE THERAPY, Outcome 15 General functioning: 3. Social functioning score (GSDS, high = worse, skew).

Comparison 1 ANY INTERMITTENT DRUG TECHNIQUE versus MAINTENANCE THERAPY, Outcome 16 General functioning: 4. Social functioning score (PAS, high = worse).

Comparison 1 ANY INTERMITTENT DRUG TECHNIQUE versus MAINTENANCE THERAPY, Outcome 17 General functioning: 5. Social functioning score (SAS, high = worse).
| Study | Intervention | Mean | SD | N |
| by long term (≥26 weeks) | ||||
| Gaebel 2011 | Intermittent | 0.0 | 0.0 | 8 |
| Gaebel 2011 | Maintenance | 0.1 | 0.5 | 19 |
Comparison 1 ANY INTERMITTENT DRUG TECHNIQUE versus MAINTENANCE THERAPY, Outcome 18 Adverse effects: 1. Akathisia (HAS, high = worse, skew).
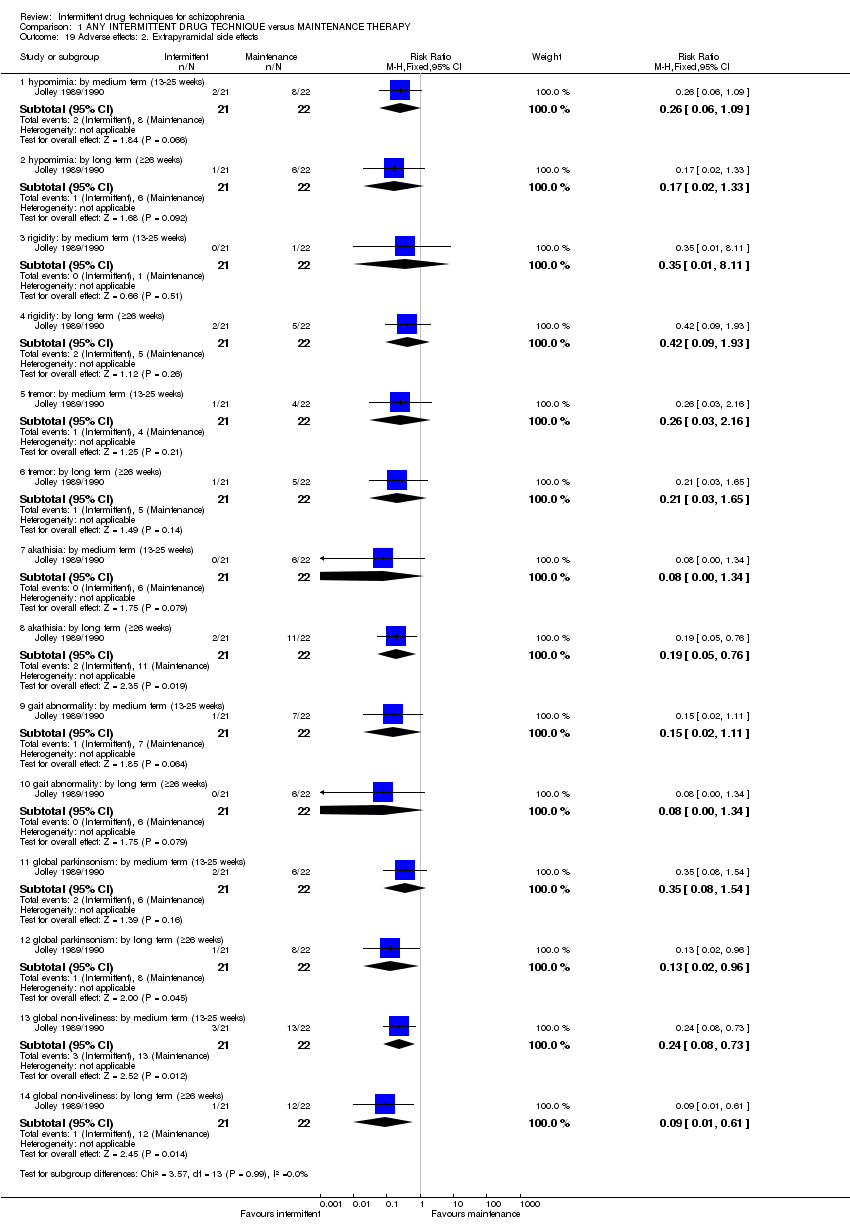
Comparison 1 ANY INTERMITTENT DRUG TECHNIQUE versus MAINTENANCE THERAPY, Outcome 19 Adverse effects: 2. Extrapyramidal side effects.
| Study | Intervention | Mean | SD | N |
| by medium term (13‐25 weeks) | ||||
| Jolley 1989/1990 | Intermittent | 0.5 | 1.4 | 21 |
| Jolley 1989/1990 | Maintenance | 2.8 | 2.7 | 22 |
| by long term (≥26 weeks) | ||||
| Gaebel 2011 | Intermittent | 0.0 | 0.0 | 8 |
| Gaebel 2011 | Maintenance | 0.2 | 0.7 | 19 |
| Jolley 1989/1990 | Intermittent | 0.4 | 1.2 | 21 |
| Jolley 1989/1990 | Maintenance | 3.2 | 3.0 | 22 |
Comparison 1 ANY INTERMITTENT DRUG TECHNIQUE versus MAINTENANCE THERAPY, Outcome 20 Adverse effects: 3. Extrapyramidal symptoms (EPS, high = worse, skew).

Comparison 1 ANY INTERMITTENT DRUG TECHNIQUE versus MAINTENANCE THERAPY, Outcome 21 Adverse effects: 4. Need for additional medication.
| Study | Intervention | Mean | SD | N |
| by medium term (13‐25 weeks) | ||||
| Wunderink 2007 | Intermittent | 18.7 | 15.3 | 65 |
| Wunderink 2007 | Maintenance | 20.3 | 13.8 | 63 |
| by long term (≥26 weeks) | ||||
| Wunderink 2007 | Intermittent | 24.5 | 36.6 | 65 |
| Wunderink 2007 | Maintenance | 22.2 | 19.0 | 63 |
Comparison 1 ANY INTERMITTENT DRUG TECHNIQUE versus MAINTENANCE THERAPY, Outcome 22 Adverse effects: 5. Side effects (LUNSERS, high = worse, skew).
| Study | Intervention | Mean | SD | N |
| by long term (≥26 weeks) | ||||
| Gaebel 2011 | Intermittent | 0.4 | 1.1 | 8 |
| Gaebel 2011 | Maintenance | 0.2 | 0.4 | 19 |
Comparison 1 ANY INTERMITTENT DRUG TECHNIQUE versus MAINTENANCE THERAPY, Outcome 23 Adverse effects: 6. Side effects (UKU, high = worse, skew).

Comparison 1 ANY INTERMITTENT DRUG TECHNIQUE versus MAINTENANCE THERAPY, Outcome 24 Adverse effects: 7. Tardive dyskinesia.
| Study | Intervention | Mean | SD | N |
| by medium term (13‐25 weeks) | ||||
| Remington 2011 | Intermittent | 0.0 | 0.0 | 17 |
| Remington 2011 | Maintenance | 0.33 | 0.78 | 18 |
| by long term (≥26 weeks) | ||||
| Gaebel 2011 | Intermittent | 0.0 | 0.0 | 8 |
| Gaebel 2011 | Maintenance | 0.1 | 0.5 | 19 |
Comparison 1 ANY INTERMITTENT DRUG TECHNIQUE versus MAINTENANCE THERAPY, Outcome 25 Adverse effects: 8. Tardive dyskinesia (AIMS, high = worse, skew).

Comparison 1 ANY INTERMITTENT DRUG TECHNIQUE versus MAINTENANCE THERAPY, Outcome 26 Quality of life: 1. Average score (LQLP, low = worse).
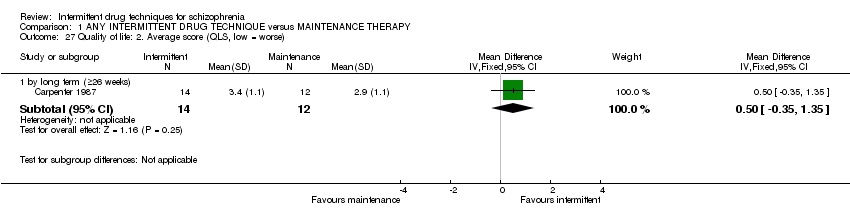
Comparison 1 ANY INTERMITTENT DRUG TECHNIQUE versus MAINTENANCE THERAPY, Outcome 27 Quality of life: 2. Average score (QLS, low = worse).

Comparison 1 ANY INTERMITTENT DRUG TECHNIQUE versus MAINTENANCE THERAPY, Outcome 28 Quality of life: 3. Average score (WHOQoL‐Bref, low = worse).
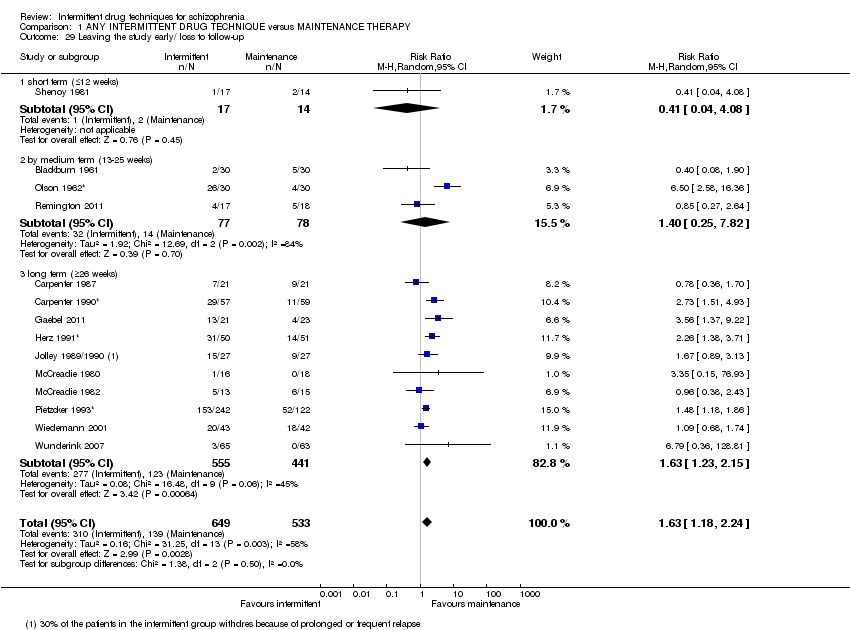
Comparison 1 ANY INTERMITTENT DRUG TECHNIQUE versus MAINTENANCE THERAPY, Outcome 29 Leaving the study early/ loss to follow‐up.

Comparison 2 INTERMITTENT (EARLY‐BASED) versus MAINTENANCE THERAPY, Outcome 1 Relapse.

Comparison 2 INTERMITTENT (EARLY‐BASED) versus MAINTENANCE THERAPY, Outcome 2 Hospitalisation.

Comparison 2 INTERMITTENT (EARLY‐BASED) versus MAINTENANCE THERAPY, Outcome 3 Death.
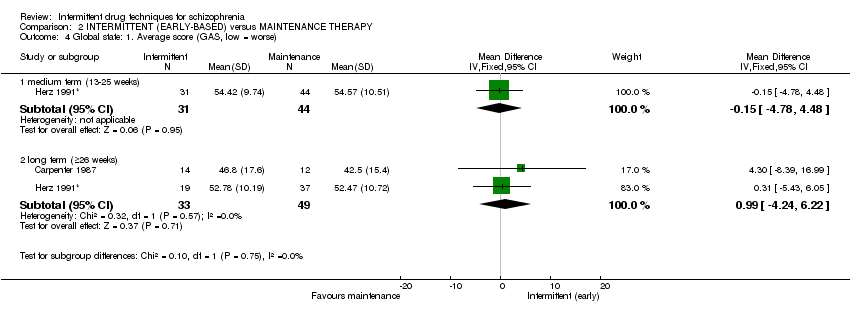
Comparison 2 INTERMITTENT (EARLY‐BASED) versus MAINTENANCE THERAPY, Outcome 4 Global state: 1. Average score (GAS, low = worse).

Comparison 2 INTERMITTENT (EARLY‐BASED) versus MAINTENANCE THERAPY, Outcome 5 Global state: 2. Prodromal episodes.
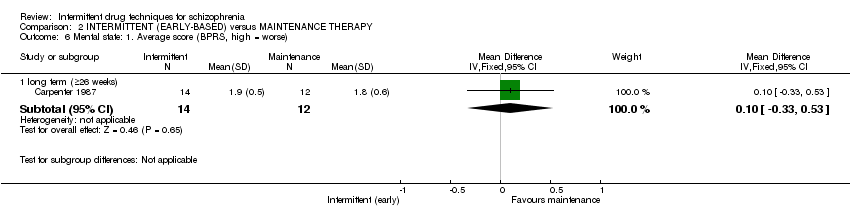
Comparison 2 INTERMITTENT (EARLY‐BASED) versus MAINTENANCE THERAPY, Outcome 6 Mental state: 1. Average score (BPRS, high = worse).

Comparison 2 INTERMITTENT (EARLY‐BASED) versus MAINTENANCE THERAPY, Outcome 7 General functioning: 1. Average endpoint (LOFS, low = worse).

Comparison 2 INTERMITTENT (EARLY‐BASED) versus MAINTENANCE THERAPY, Outcome 8 General functioning: 2. Social (PAS, high = worse).

Comparison 2 INTERMITTENT (EARLY‐BASED) versus MAINTENANCE THERAPY, Outcome 9 Adverse effects: 1. Extrapyramidal side effects.
| Study | Intervention | Mean | SD | N |
| by medium term (13‐25 weeks) | ||||
| Jolley 1989/1990 | Intermittent | 0.5 | 1.4 | 21 |
| Jolley 1989/1990 | Maintenance | 2.8 | 2.7 | 22 |
| by long term (≥26 weeks) | ||||
| Jolley 1989/1990 | Intermittent | 0.4 | 1.2 | 21 |
| Jolley 1989/1990 | Maintenance | 3.2 | 3.0 | 22 |
Comparison 2 INTERMITTENT (EARLY‐BASED) versus MAINTENANCE THERAPY, Outcome 10 Adverse effects: 2. Extrapyramidal symptoms (EPS, high = worse, skew).

Comparison 2 INTERMITTENT (EARLY‐BASED) versus MAINTENANCE THERAPY, Outcome 11 Adverse effects: 3. Need for additional medication.

Comparison 2 INTERMITTENT (EARLY‐BASED) versus MAINTENANCE THERAPY, Outcome 12 Adverse effects: 4. Tardive dyskinesia.

Comparison 2 INTERMITTENT (EARLY‐BASED) versus MAINTENANCE THERAPY, Outcome 13 Quality of life: 1. Average score (QLS, low = worse).

Comparison 2 INTERMITTENT (EARLY‐BASED) versus MAINTENANCE THERAPY, Outcome 14 Leaving the study early/ loss to follow‐up.

Comparison 3 INTERMITTENT (CRISIS INTERVENTION) versus MAINTENANCE THERAPY, Outcome 1 Leaving the study early/ loss to follow‐up.
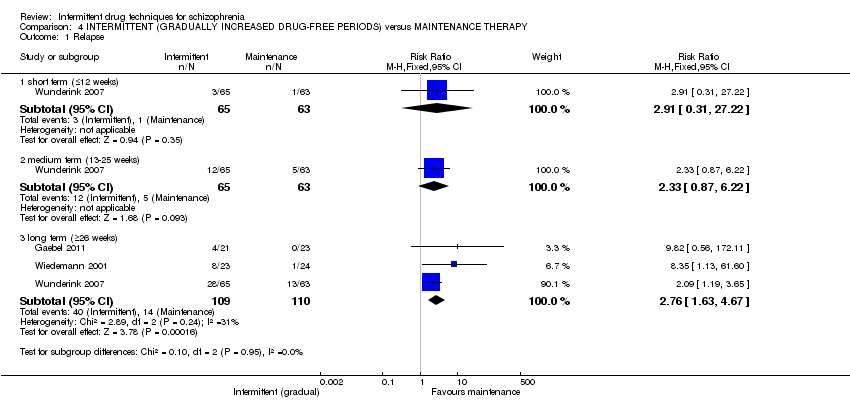
Comparison 4 INTERMITTENT (GRADUALLY INCREASED DRUG‐FREE PERIODS) versus MAINTENANCE THERAPY, Outcome 1 Relapse.

Comparison 4 INTERMITTENT (GRADUALLY INCREASED DRUG‐FREE PERIODS) versus MAINTENANCE THERAPY, Outcome 2 Global state: 1. Average score (CGI‐S, high = worse).

Comparison 4 INTERMITTENT (GRADUALLY INCREASED DRUG‐FREE PERIODS) versus MAINTENANCE THERAPY, Outcome 3 Global state: 2. Average score (GAS, low = worse).
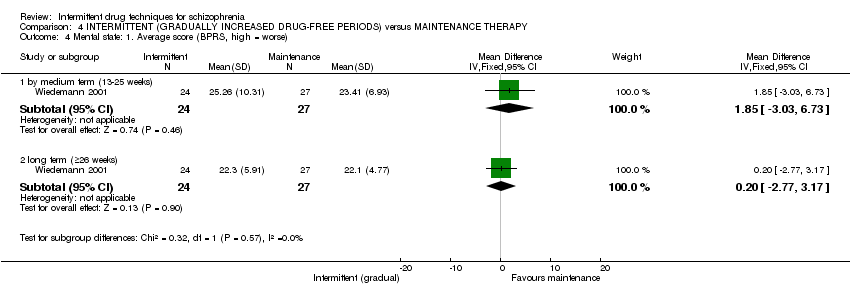
Comparison 4 INTERMITTENT (GRADUALLY INCREASED DRUG‐FREE PERIODS) versus MAINTENANCE THERAPY, Outcome 4 Mental state: 1. Average score (BPRS, high = worse).
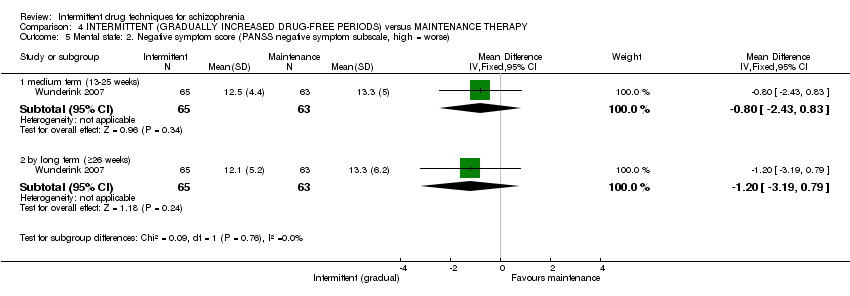
Comparison 4 INTERMITTENT (GRADUALLY INCREASED DRUG‐FREE PERIODS) versus MAINTENANCE THERAPY, Outcome 5 Mental state: 2. Negative symptom score (PANSS negative symptom subscale, high = worse).
| Study | Intervention | Mean | SD | N |
| by long term (≥26 weeks) | ||||
| Gaebel 2011 | Intermittent | 13.4 | 9.1 | 8 |
| Gaebel 2011 | Maintenance | 9.1 | 2.8 | 19 |
Comparison 4 INTERMITTENT (GRADUALLY INCREASED DRUG‐FREE PERIODS) versus MAINTENANCE THERAPY, Outcome 6 Mental state: 3. Negative symptom score (PANSS negative symptom subscale, high = worse, skew).
| Study | Intervention | Mean | SD | N |
| by long term (≥26 weeks) | ||||
| Gaebel 2011 | Intermittent | 17.6 | 18.0 | 8 |
| Gaebel 2011 | Maintenance | 5.7 | 9.7 | 19 |
Comparison 4 INTERMITTENT (GRADUALLY INCREASED DRUG‐FREE PERIODS) versus MAINTENANCE THERAPY, Outcome 7 Mental state: 4. Negative symptom score (SANS, high = worse, skew).

Comparison 4 INTERMITTENT (GRADUALLY INCREASED DRUG‐FREE PERIODS) versus MAINTENANCE THERAPY, Outcome 8 Mental state: 5. Positive symptom score (PANSS positive symptom subscale, high = worse).

Comparison 4 INTERMITTENT (GRADUALLY INCREASED DRUG‐FREE PERIODS) versus MAINTENANCE THERAPY, Outcome 9 General functioning: 1. Social functioning score (GAF, low = worse).
| Study | Intervention | Mean | SD | N |
| by long term (≥26 weeks) | ||||
| Wunderink 2007 | Intermittent | 5.8 | 4.5 | 65 |
| Wunderink 2007 | Maintenance | 6.4 | 4.2 | 63 |
Comparison 4 INTERMITTENT (GRADUALLY INCREASED DRUG‐FREE PERIODS) versus MAINTENANCE THERAPY, Outcome 10 General functioning: 2. Social functioning score (GSDS, high = worse, skew).

Comparison 4 INTERMITTENT (GRADUALLY INCREASED DRUG‐FREE PERIODS) versus MAINTENANCE THERAPY, Outcome 11 General functioning: 3. Social functioning score (SAS, high = worse).
| Study | Intervention | Mean | SD | N |
| by long term (≥26 weeks) | ||||
| Gaebel 2011 | Intermittent | 0.0 | 0.0 | 8 |
| Gaebel 2011 | Maintenance | 0.1 | 0.5 | 19 |
Comparison 4 INTERMITTENT (GRADUALLY INCREASED DRUG‐FREE PERIODS) versus MAINTENANCE THERAPY, Outcome 12 Adverse effects: 1. Akathisia (HAS, high = worse, skew).
| Study | Intervention | Mean | SD | N |
| by long term (≥26 weeks) | ||||
| Gaebel 2011 | Intermittent | 0.0 | 0.0 | 8 |
| Gaebel 2011 | Maintenance | 0.2 | 0.7 | 19 |
Comparison 4 INTERMITTENT (GRADUALLY INCREASED DRUG‐FREE PERIODS) versus MAINTENANCE THERAPY, Outcome 13 Adverse effects: 2. Extrapyramidal symptoms (EPS, high = worse, skew).
| Study | Intervention | Mean | SD | N |
| by medium term (13‐25 weeks) | ||||
| Wunderink 2007 | Intermittent | 18.7 | 15.3 | 65 |
| Wunderink 2007 | Maintenance | 20.3 | 13.8 | 63 |
| by long term (≥26 weeks) | ||||
| Wunderink 2007 | Intermittent | 24.5 | 36.6 | 65 |
| Wunderink 2007 | Maintenance | 22.2 | 19.0 | 63 |
Comparison 4 INTERMITTENT (GRADUALLY INCREASED DRUG‐FREE PERIODS) versus MAINTENANCE THERAPY, Outcome 14 Adverse effects: 3. Side effects (LUNSERS, high = worse, skew).
| Study | Intervention | Mean | SD | N |
| by long term (≥26 weeks) | ||||
| Gaebel 2011 | Intermittent | 0.4 | 1.1 | 8 |
| Gaebel 2011 | Maintenance | 0.2 | 0.4 | 19 |
Comparison 4 INTERMITTENT (GRADUALLY INCREASED DRUG‐FREE PERIODS) versus MAINTENANCE THERAPY, Outcome 15 Adverse effects: 4. Side effects (UKU, high = worse, skew).

Comparison 4 INTERMITTENT (GRADUALLY INCREASED DRUG‐FREE PERIODS) versus MAINTENANCE THERAPY, Outcome 16 Adverse effects: 5. Tardive dyskinesia.
| Study | Intervention | Mean | SD | N |
| by long term (≥26 weeks) | ||||
| Gaebel 2011 | Intermittent | 0.0 | 0.0 | 8 |
| Gaebel 2011 | Maintenance | 0.1 | 0.5 | 19 |
Comparison 4 INTERMITTENT (GRADUALLY INCREASED DRUG‐FREE PERIODS) versus MAINTENANCE THERAPY, Outcome 17 Adverse effects: 6. Tardive dyskinesia (AIMS, high = worse, skew).

Comparison 4 INTERMITTENT (GRADUALLY INCREASED DRUG‐FREE PERIODS) versus MAINTENANCE THERAPY, Outcome 18 Quality of life: 1. Average score (LQLP, low = worse).

Comparison 4 INTERMITTENT (GRADUALLY INCREASED DRUG‐FREE PERIODS) versus MAINTENANCE THERAPY, Outcome 19 Quality of life: 2. Average score (WHOQoL‐Bref, low = worse).
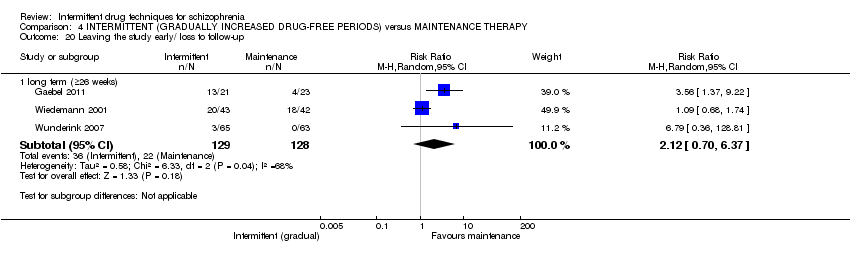
Comparison 4 INTERMITTENT (GRADUALLY INCREASED DRUG‐FREE PERIODS) versus MAINTENANCE THERAPY, Outcome 20 Leaving the study early/ loss to follow‐up.

Comparison 5 INTERMITTENT (DRUG HOLIDAY) versus MAINTENANCE THERAPY, Outcome 1 Relapse.
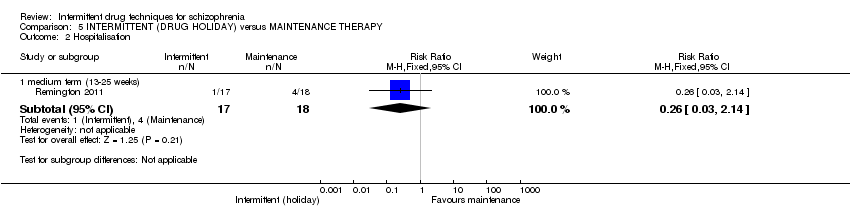
Comparison 5 INTERMITTENT (DRUG HOLIDAY) versus MAINTENANCE THERAPY, Outcome 2 Hospitalisation.

Comparison 5 INTERMITTENT (DRUG HOLIDAY) versus MAINTENANCE THERAPY, Outcome 3 Global state: 1. Average score (CGI‐S, high = worse).
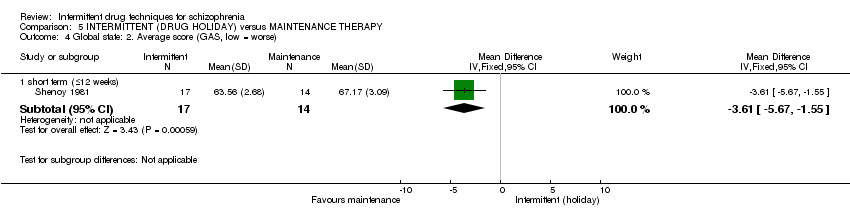
Comparison 5 INTERMITTENT (DRUG HOLIDAY) versus MAINTENANCE THERAPY, Outcome 4 Global state: 2. Average score (GAS, low = worse).

Comparison 5 INTERMITTENT (DRUG HOLIDAY) versus MAINTENANCE THERAPY, Outcome 5 Global state: 3. Significant improvement.

Comparison 5 INTERMITTENT (DRUG HOLIDAY) versus MAINTENANCE THERAPY, Outcome 6 Adverse effects: 1. Need for additional medication.

Comparison 5 INTERMITTENT (DRUG HOLIDAY) versus MAINTENANCE THERAPY, Outcome 7 Adverse effects: 2. Tardive dyskinesia.
| Study | Intervention | Mean | SD | N |
| by medium term (13‐25 weeks) | ||||
| Remington 2011 | Intermittent | 0.00 | 0.00 | 17 |
| Remington 2011 | Maintenance | 0.33 | 0.78 | 18 |
Comparison 5 INTERMITTENT (DRUG HOLIDAY) versus MAINTENANCE THERAPY, Outcome 8 Adverse effects: 3. Tardive dyskinesia (AIMS, high = worse, skew).
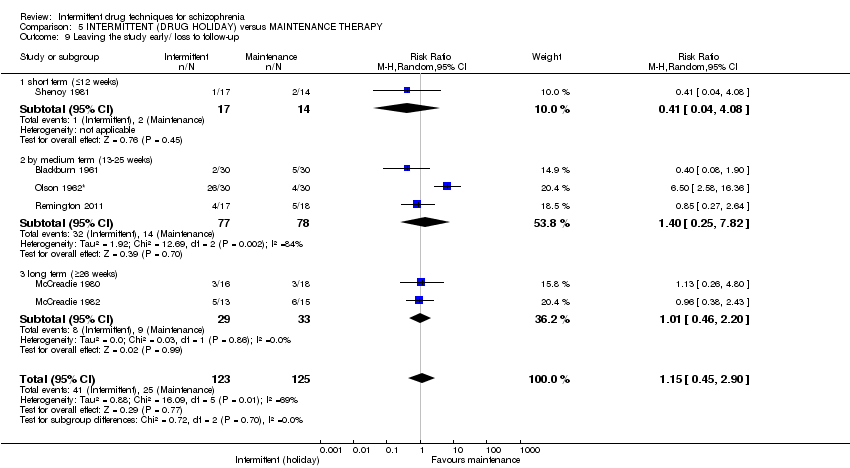
Comparison 5 INTERMITTENT (DRUG HOLIDAY) versus MAINTENANCE THERAPY, Outcome 9 Leaving the study early/ loss to follow‐up.

Comparison 6 ANY INTERMITTENT DRUG TECHNIQUE versus PLACEBO, Outcome 1 Relapse.
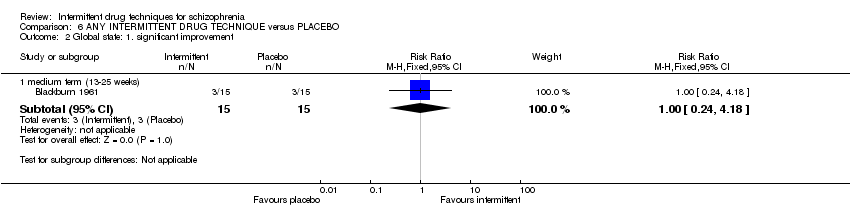
Comparison 6 ANY INTERMITTENT DRUG TECHNIQUE versus PLACEBO, Outcome 2 Global state: 1. significant improvement.
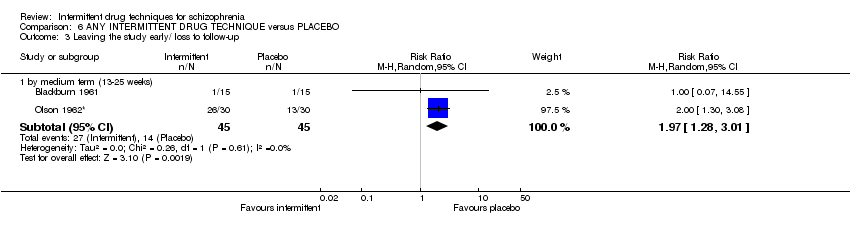
Comparison 6 ANY INTERMITTENT DRUG TECHNIQUE versus PLACEBO, Outcome 3 Leaving the study early/ loss to follow‐up.

Comparison 7 ANY INTERMITTENT DRUG TECHNIQUE (SPECIFIC DRUG) versus MAINTENANCE THERAPY (SPECIFIC DRUG), Outcome 1 Relapse.

Comparison 7 ANY INTERMITTENT DRUG TECHNIQUE (SPECIFIC DRUG) versus MAINTENANCE THERAPY (SPECIFIC DRUG), Outcome 2 Hospitalisation.
| Methods | Allocation: randomised, fully described in terms of methods of randomisation and allocation concealment. Blinding: double/single blind, with methods of maintenance of blinding fully described. |
| Participants | Diagnosis: schizophrenia (DSM‐IV/ICD‐10/ RDC). |
| Interventions | 1. Any intermittent drug technique (n = 150): a. Prodrome‐based/early intervention (defined as treatment given on the early signs of relapse). b. Crisis intervention (defined as treatment given only in case of full relapse and discontinued again after re‐stabilisation). c. Gradually increased drug‐free period (defined as increasing the cessation period of the treatment constantly). d. Drug holiday (defined as stopping medication for fixed periods, and then reintroducing it ‐ repeating this more than once). Secifiying types of typical or atypical antipsychotics: i. High dose (as defined by each study). ii. Low or moderate dose (as defined by each study). versus 2. Maintenance therapy, as defined in each study (n = 150): Secifiying types of typical or atypical antipsychotics: i. High dose (as defined by each study). ii. Low or moderate dose (as defined by each study). |
| Outcomes | Relapse (operationally defined using either PANSS, CGI or BPRS). Hospitaliation (as defined in each study). Global state: CGI (Clinical Global Impression) or GAS (Global Assessment Scale) ‐ preferably dichotomous outcomes/dichotomised scale data). Mental state: BPRS or PANSS (preferably dichotomous outcomes/dichotomised scale data). General functioning: GAF (Global Assessment of Functioning Scale ‐ preferably dichotomous outcomes/dichotomised scale data). Quality of life: QLS (Quality of Life Scale ‐ preferably dichotomous outcomes/dichotomised scale data). Adverse effects: including specific adverse effects, extrapyramidal symptoms, tardive dyskinesia. Economic outcomes: including any cost effectiveness of treatment. Death. Leaving the study early: specific reasons including ‐ any reason; loss to follow‐up; treatment‐related; non‐treatment related; death; adverse effects. |
| Notes | Any outcomes measured using scale‐derived data should be interpreted in such a way as to make clear the real‐life relevance of changes in scale score. |
| BPRS ‐ Brief Psychiatric Rating Scale | |
| Major | Minor |
| 1. There have been additions to Types of interventions: the protocol to the current review did not specify a comparison with specific named drugs (atypical or typical) nor dosages, which is certainly a comparison of interest for people receiving treatment as well as clinicians administering medication and was subsequently addressed in the final text. | 1. The data collection and analysis section has been updated to reflect changes in methodology that have occurred whilst writing this review, namely inclusion of 'Risk of bias' tables and 'Summary of findings' tables. 2. Types of outcome measures have been modified/clarified from the original protocol ‐ this decision was not influenced by the results. Economic outcomes of direct and indirect costs have been qualified as 'defined by each study', to take into account that what may constitute a direct and indirect cost can differ between trial authors. A further sub‐category of 'cost‐effectiveness' has been added, again a factor that would be 'defined by each study'. 3. Further, the protocol specified a global state outcome of 'no clinically important change in global state (as defined by individual studies)'; this has been changed to 'any clinically important change in global state (as defined by individual studies)'. The direction of the graphs have been modified to represent an unfavourable outcome for intermittent treatment when results are presented to the left of the line of no effect. |
| ANY INTERMITTENT DRUG TECHNIQUE compared with MAINTENANCE THERAPY for schizophrenia | ||||||
| Patient or population: patients with schizophrenia | ||||||
| Outcomes | Illustrative comparative risks* (95% CI) | Relative effect | No of Participants | Quality of the evidence | Comments | |
| Assumed risk | Corresponding risk | |||||
| MAINTENANCE THERAPY | ANY INTERMITTENT DRUG TECHNIQUE | |||||
| Relapse: long term (+ 26 weeks) | Low1 | RR 2.46 | 436 | ⊕⊕⊕⊝ | ||
| 0 per 1000 | 0 per 1000 | |||||
| Moderate1 | ||||||
| 150 per 1000 | 369 per 1000 | |||||
| High1 | ||||||
| 300 per 1000 | 738 per 1000 | |||||
| Hospitalisation: long term (+ 26 weeks) | Low3 | RR 1.65 | 626 | ⊕⊕⊕⊝ | ||
| 50 per 1000 | 82 per 1000 | |||||
| Moderate3 | ||||||
| 300 per 1000 | 495 per 1000 | |||||
| High3 | ||||||
| 500 per 1000 | 825 per 1000 | |||||
| Global state: average score: long term (+ 26 weeks) | The mean global state: average score: long term (+ 26 weeks) in the control groups was | The mean global state: average score: long term (+26 weeks) in the intervention groups was | 133 | ⊕⊕⊝⊝ | ||
| Mental state: average score: long term (+ 26 weeks) | The mean mental state: average score: long term (+ 26 weeks) in the control groups was | The mean mental state: average score: long term (+26 weeks) in the intervention groups was | 77 | ⊕⊕⊝⊝ | ||
| Adverse effects: tardive dyskinesia: by long term (+26 weeks) | Low9 | RR 1.15 | 165 | ⊕⊕⊝⊝ | ||
| 0 per 1000 | 0 per 1000 | |||||
| Moderate9 | ||||||
| 200 per 1000 | 230 per 1000 | |||||
| High9 | ||||||
| 600 per 1000 | 690 per 1000 | |||||
| Economic outcomes: cost effectiveness | See comment | See comment | Not estimable | 0 | See comment | No study reported this outcome |
| Leaving the study early/ loss to follow‐up: by long term (+ 26 weeks) | Low10 | RR 1.63 | 996 | ⊕⊕⊝⊝ | ||
| 100 per 1000 | 163 per 1000 | |||||
| Moderate10 | ||||||
| 400 per 1000 | 652 per 1000 | |||||
| High10 | ||||||
| 700 per 1000 | 1000 per 1000 | |||||
| *The basis for the assumed risk (e.g. the median control group risk across studies) is provided in footnotes. The corresponding risk (and its 95% confidence interval) is based on the assumed risk in the comparison group and the relative effect of the intervention (and its 95% CI). | ||||||
| GRADE Working Group grades of evidence | ||||||
| 1 Assumed risk: calculated from the included studies ‐ presents 3 risks based on the control group risks ‐ 'moderate' risk equates with that of control group (14%). | ||||||
| INTERMITTENT (EARLY‐BASED) compared with MAINTENANCE THERAPY for schizophrenia | ||||||
| Patient or population: patients with schizophrenia | ||||||
| Outcomes | Illustrative comparative risks* (95% CI) | Relative effect | No of Participants | Quality of the evidence | Comments | |
| Assumed risk | Corresponding risk | |||||
| MAINTENANCE THERAPY | INTERMITTENT (EARLY‐BASED) | |||||
| Relapse: long term (+ 26 weeks) | Low1 | RR 2.33 | 155 | ⊕⊕⊝⊝ | ||
| 0 per 1000 | 0 per 1000 | |||||
| Moderate1 | ||||||
| 150 per 1000 | 349 per 1000 | |||||
| High1 | ||||||
| 300 per 1000 | 756 per 1000 | |||||
| Hospitalisation: long term (+ 26 weeks) | Low4 | RR 1.16 | 625 | ⊕⊕⊕⊝ | ||
| 100 per 1000 | 166 per 1000 | |||||
| Moderate4 | ||||||
| 300 per 1000 | 498 per 1000 | |||||
| High4 | ||||||
| 600 per 1000 | 996 per 1000 | |||||
| Global state: average score: long term (+ 26 weeks) | The mean global state: average score: long term (+ 26 weeks) in the control groups was | The mean global state: average score: long term (+26 weeks) in the intervention groups was | 82 | ⊕⊕⊝⊝ | ||
| Mental state: average score: long term (+ 26 weeks) | The mean mental state: average score: long term (+ 26 weeks) in the control groups was | The mean mental state: average score: long term (+26 weeks) in the intervention groups was | 26 | ⊕⊝⊝⊝ | ||
| Adverse effects: tardive dyskinesia: long term (+26 weeks) | 444 per 10009 | 249 per 1000 | RR 0.56 | 30 | ⊕⊕⊝⊝ | |
| Economic outcomes: cost effectiveness: long term (+ 26 weeks) | See comment | See comment | Not estimable | 0 | See comment | No study reported this outcome |
| Leaving the study early/loss to follow‐up: long term (+ 26 weeks) | Low | RR 1.67 | 562 | ⊕⊕⊝⊝ | ||
| 200 per 100010 | 334 per 1000 | |||||
| Moderate | ||||||
| 400 per 100010 | 668 per 1000 | |||||
| High | ||||||
| 600 per 100010 | 1000 per 1000 | |||||
| *The basis for the assumed risk (e.g. the median control group risk across studies) is provided in footnotes. The corresponding risk (and its 95% confidence interval) is based on the assumed risk in the comparison group and the relative effect of the intervention (and its 95% CI). | ||||||
| GRADE Working Group grades of evidence | ||||||
| 1 Assumed risk: calculated from the included studies ‐ presents 3 risks based on the control group risks ‐ 'moderate' risk equates with that of control group (16.7%). | ||||||
| INTERMITTENT (CRISIS INTERVENTION) compared with MAINTENANCE THERAPY for schizophrenia | ||||||
| Patient or population: patients with schizophrenia | ||||||
| Outcomes | Illustrative comparative risks* (95% CI) | Relative effect | No of Participants | Quality of the evidence | Comments | |
| Assumed risk | Corresponding risk | |||||
| MAINTENANCE THERAPY | INTERMITTENT (CRISIS INTERVENTION) | |||||
| Relapse: long term (+ 26 weeks) | See comment | See comment | Not estimable | 0 | See comment | No study reported provided useable data for this outcome by long term |
| Hospitalisation: long term (+ 26 weeks) | See comment | See comment | Not estimable | 0 | See comment | No study reported provided useable data for this outcome by long term |
| Global state: average score: long term (+ 26 weeks) | See comment | See comment | Not estimable | 0 | See comment | No study reported provided useable data for this outcome by long term |
| Mental state: average score: long term (+ 26 weeks) | See comment | See comment | Not estimable | 0 | See comment | No study reported provided useable data for this outcome by long term |
| Adverse effects: tardive dyskinesia: long term (+ 26 weeks) | See comment | See comment | Not estimable | 0 | See comment | No study reported provided useable data for this outcome by long term |
| Economic outcomes: cost effectiveness: long term (+ 26 weeks) | See comment | See comment | Not estimable | 0 | See comment | No study reported this outcome |
| Leaving the study early/ loss to follow‐up: long term (+ 26 weeks) | 426 per 10001 | 669 per 1000 | RR 1.57 | 237 | ⊕⊝⊝⊝ | |
| *The basis for the assumed risk (e.g. the median control group risk across studies) is provided in footnotes. The corresponding risk (and its 95% confidence interval) is based on the assumed risk in the comparison group and the relative effect of the intervention (and its 95% CI). | ||||||
| GRADE Working Group grades of evidence | ||||||
| 1 Mean baseline risk presented for single study. | ||||||
| INTERMITTENT (GRADUALLY INCREASED DRUG‐FREE PERIODS) compared with MAINTENANCE THERAPY for schizophrenia | ||||||
| Patient or population: patients with schizophrenia | ||||||
| Outcomes | Illustrative comparative risks* (95% CI) | Relative effect | No of Participants | Quality of the evidence | Comments | |
| Assumed risk | Corresponding risk | |||||
| MAINTENANCE THERAPY | INTERMITTENT (GRADUALLY INCREASED DRUG‐FREE PERIODS) | |||||
| Relapse: long term (+ 26 weeks) | Low1 | RR 2.76 | 219 | ⊕⊕⊝⊝ | ||
| 0 per 1000 | 0 per 1000 | |||||
| Moderate1 | ||||||
| 100 per 1000 | 276 per 1000 | |||||
| High1 | ||||||
| 300 per 1000 | 828 per 1000 | |||||
| Hospitalisation: long term (+ 26 weeks) | See comment | See comment | Not estimable | 0 | See comment | No study reported provided useable data for this outcome by long term |
| Global state: average score: long term (+26 weeks) | The mean global state: average score: long term (+26 weeks) in the control groups was | The mean global state: average score: long term (+ 26 weeks) in the intervention groups was | 51 | ⊕⊝⊝⊝ | ||
| Mental state: average score: long term (+ 26 weeks) | The mean mental state: average score: long term (+26 weeks) in the control groups was | The mean mental state: average score: long term (+ 26 weeks) in the intervention groups was | 51 | ⊕⊝⊝⊝ | ||
| Adverse effects: tardive dyskinesia: long term (+ 26 weeks) | See comment6 | See comment | Not estimable | 85 | ⊕⊝⊝⊝ | |
| Economic outcomes: cost effectiveness: long term (+ 26 weeks) | See comment | See comment | Not estimable | 0 | See comment | No study reported this outcome |
| Leaving the study early/ loss to follow‐up: long term (+ 26 weeks) | Low7 | RR 2.12 | 257 | ⊕⊝⊝⊝ | ||
| 0 per 1000 | 0 per 1000 | |||||
| Moderate7 | ||||||
| 200 per 1000 | 424 per 1000 | |||||
| High7 | ||||||
| 500 per 1000 | 1000 per 1000 | |||||
| *The basis for the assumed risk (e.g. the median control group risk across studies) is provided in footnotes. The corresponding risk (and its 95% confidence interval) is based on the assumed risk in the comparison group and the relative effect of the intervention (and its 95% CI). | ||||||
| GRADE Working Group grades of evidence | ||||||
| 1 Assumed risk: calculated from the included studies ‐ presents 3 risks based on the control group risks ‐ 'moderate' risk equates with that of control group (12.7%). | ||||||
| INTERMITTENT (DRUG HOLIDAY) compared with MAINTENANCE THERAPY for schizophrenia | ||||||
| Patient or population: patients with schizophrenia | ||||||
| Outcomes | Illustrative comparative risks* (95% CI) | Relative effect | No of Participants | Quality of the evidence | Comments | |
| Assumed risk | Corresponding risk | |||||
| MAINTENANCE THERAPY | INTERMITTENT (DRUG HOLIDAY) | |||||
| Relapse: long term (+ 26 weeks) | Low1 | RR 1.70 | 61 | ⊕⊝⊝⊝ | ||
| 0 per 1000 | 0 per 1000 | |||||
| Moderate1 | ||||||
| 150 per 1000 | 255 per 1000 | |||||
| High1 | ||||||
| 200 per 1000 | 340 per 1000 | |||||
| Hospitalisation: medium term (13‐25 weeks) | 222 per 10004 | 58 per 1000 | RR 0.26 | 35 | ⊕⊝⊝⊝ | |
| Global state: average score: long term (+ 26 weeks) | See comment | See comment | Not estimable | 0 | See comment | No study reported provided useable data for this outcome by long term |
| Mental state: average score: long term (+ 26 weeks) | See comment | See comment | Not estimable | 0 | See comment | No study reported provided useable data for this outcome by long term |
| Adverse effects: tardive dyskinesia: long term (+ 26 weeks) | Low6 | RR 1.64 | 50 | ⊕⊝⊝⊝ | ||
| 100 per 1000 | 164 per 1000 | |||||
| Moderate6 | ||||||
| 300 per 1000 | 492 per 1000 | |||||
| High6 | ||||||
| 600 per 1000 | 984 per 1000 | |||||
| Economic outcomes: cost effectiveness: long term (+ 26 weeks) | See comment | See comment | Not estimable | 0 | See comment | No study reported this outcome |
| Leaving the study early/ loss to follow‐up: long term (+ 26 weeks) | Low6 | RR 1.01 | 62 | ⊕⊝⊝⊝ | ||
| 100 per 1000 | 101 per 1000 | |||||
| Moderate6 | ||||||
| 300 per 1000 | 303 per 1000 | |||||
| High6 | ||||||
| 400 per 1000 | 404 per 1000 | |||||
| *The basis for the assumed risk (e.g. the median control group risk across studies) is provided in footnotes. The corresponding risk (and its 95% confidence interval) is based on the assumed risk in the comparison group and the relative effect of the intervention (and its 95% CI). | ||||||
| GRADE Working Group grades of evidence | ||||||
| 1 Assumed risk: calculated from the included studies ‐ presents 3 risks based on the control group risks ‐ 'moderate' risk equates with that of control group (12.1%). | ||||||
| ANY INTERMITTENT DRUG TECHNIQUE compared with PLACEBO for schizophrenia | ||||||
| Patient or population: patients with schizophrenia | ||||||
| Outcomes | Illustrative comparative risks* (95% CI) | Relative effect | No of Participants | Quality of the evidence | Comments | |
| Assumed risk | Corresponding risk | |||||
| PLACEBO | ANY INTERMITTENT DRUG TECHNIQUE | |||||
| Relapse: medium term (13‐25 weeks) | Low1 | RR 0.36 | 288 | ⊕⊝⊝⊝ | ||
| 200 per 1000 | 74 per 1000 | |||||
| Moderate1 | ||||||
| 400 per 1000 | 148 per 1000 | |||||
| High1 | ||||||
| 800 per 1000 | 296 per 1000 | |||||
| Hospitalisation: medium term (13‐25 weeks) | See comment | See comment | Not estimable | 0 | See comment | No study reported provided useable data for this outcome by long term |
| Global state: average score: medium term (13‐25 weeks) | See comment | See comment | Not estimable | 0 | See comment | No study reported provided useable data for this outcome by long term |
| Mental state: average score: medium term (13‐25 weeks) | See comment | See comment | Not estimable | 0 | See comment | No study reported provided useable data for this outcome by long term |
| Adverse effects: tardive dyskinesia: medium term (13‐25 weeks) | See comment | See comment | Not estimable | 0 | See comment | No study reported provided useable data for this outcome by long term |
| Economic outcomes: cost effectiveness: medium term (13‐25 weeks) | See comment | See comment | Not estimable | 0 | See comment | No study reported this outcome |
| Leaving the study early/ loss to follow‐up: medium term (13‐25 weeks) | Low4 | RR 1.97 | 90 | ⊕⊝⊝⊝ | ||
| 100 per 1000 | 197 per 1000 | |||||
| Moderate4 | ||||||
| 300 per 1000 | 591 per 1000 | |||||
| High4 | ||||||
| 600 per 1000 | 1000 per 1000 | |||||
| *The basis for the assumed risk (e.g. the median control group risk across studies) is provided in footnotes. The corresponding risk (and its 95% confidence interval) is based on the assumed risk in the comparison group and the relative effect of the intervention (and its 95% CI). | ||||||
| GRADE Working Group grades of evidence | ||||||
| 1 Assumed risk: calculated from the included studies ‐ presents 3 risks based on the control group risks ‐ 'moderate' risk equates with that of control group (46.2%). | ||||||
| Outcome or subgroup title | No. of studies | No. of participants | Statistical method | Effect size |
| 1 Relapse Show forest plot | 12 | Risk Ratio (M‐H, Fixed, 95% CI) | Subtotals only | |
| 1.1 short term (≤12 weeks) | 4 | 396 | Risk Ratio (M‐H, Fixed, 95% CI) | 1.68 [1.00, 2.81] |
| 1.2 medium term (13‐25 weeks) | 5 | 774 | Risk Ratio (M‐H, Fixed, 95% CI) | 2.41 [1.50, 3.86] |
| 1.3 long term (≥26 weeks) | 7 | 436 | Risk Ratio (M‐H, Fixed, 95% CI) | 2.46 [1.70, 3.54] |
| 2 Hospitalisation Show forest plot | 6 | Risk Ratio (M‐H, Fixed, 95% CI) | Subtotals only | |
| 2.1 medium term (13‐25 weeks) | 2 | 136 | Risk Ratio (M‐H, Fixed, 95% CI) | 1.04 [0.31, 3.48] |
| 2.2 long term (≥26 weeks) | 5 | 626 | Risk Ratio (M‐H, Fixed, 95% CI) | 1.65 [1.33, 2.06] |
| 3 Death Show forest plot | 2 | Risk Ratio (M‐H, Fixed, 95% CI) | Subtotals only | |
| 3.1 by long term (≥26 weeks) | 2 | 155 | Risk Ratio (M‐H, Fixed, 95% CI) | 0.34 [0.05, 2.08] |
| 4 Global state: 1. Average score (CGI‐S, high = worse) Show forest plot | 2 | 62 | Mean Difference (IV, Random, 95% CI) | ‐0.05 [‐0.76, 0.65] |
| 4.1 medium term (13‐25 weeks) | 1 | 35 | Mean Difference (IV, Random, 95% CI) | ‐0.42 [‐1.08, 0.24] |
| 4.2 by long term (≥26 weeks) | 1 | 27 | Mean Difference (IV, Random, 95% CI) | 0.30 [‐0.33, 0.93] |
| 5 Global state: 2. Average score (GAS, low = worse) Show forest plot | 4 | Mean Difference (IV, Fixed, 95% CI) | Subtotals only | |
| 5.1 short term (≤12 weeks) | 1 | 31 | Mean Difference (IV, Fixed, 95% CI) | ‐3.61 [‐5.67, ‐1.55] |
| 5.2 medium term (13‐25 weeks) | 2 | 126 | Mean Difference (IV, Fixed, 95% CI) | ‐0.45 [‐4.55, 3.66] |
| 5.3 long term (≥26 weeks) | 3 | 133 | Mean Difference (IV, Fixed, 95% CI) | 1.32 [‐2.75, 5.39] |
| 6 Global state: 3. Prodromal episodes Show forest plot | 2 | Risk Ratio (M‐H, Fixed, 95% CI) | Subtotals only | |
| 6.1 by long term (≥26 weeks) | 2 | 155 | Risk Ratio (M‐H, Fixed, 95% CI) | 3.19 [1.87, 5.44] |
| 7 Global state: 4. Significant improvement Show forest plot | 1 | Risk Ratio (M‐H, Fixed, 95% CI) | Subtotals only | |
| 7.1 short term (≤12 weeks) | 1 | 60 | Risk Ratio (M‐H, Fixed, 95% CI) | 0.4 [0.18, 0.89] |
| 7.2 medium term (13‐25 weeks) | 1 | 60 | Risk Ratio (M‐H, Fixed, 95% CI) | 0.32 [0.15, 0.68] |
| 8 Mental state: 1. Average score (BPRS, high = worse) Show forest plot | 2 | Mean Difference (IV, Fixed, 95% CI) | Subtotals only | |
| 8.1 by medium term (13‐25 weeks) | 1 | 51 | Mean Difference (IV, Fixed, 95% CI) | 1.85 [‐3.03, 6.73] |
| 8.2 long term (≥26 weeks) | 2 | 77 | Mean Difference (IV, Fixed, 95% CI) | 0.10 [‐0.32, 0.53] |
| 9 Mental state: 2. Negative symptom score (PANSS negative symptom subscale, high = worse) Show forest plot | 1 | Mean Difference (IV, Fixed, 95% CI) | Subtotals only | |
| 9.1 medium term (13‐25 weeks) | 1 | 128 | Mean Difference (IV, Fixed, 95% CI) | ‐0.80 [‐2.43, 0.83] |
| 9.2 by long term (≥26 weeks) | 1 | 128 | Mean Difference (IV, Fixed, 95% CI) | ‐1.20 [‐3.19, 0.79] |
| 10 Mental state: 3. Negative symptom score (PANSS negative symptom subscale, high = worse, skew) Show forest plot | Other data | No numeric data | ||
| 10.1 by long term (≥26 weeks) | Other data | No numeric data | ||
| 11 Mental state: 4. Negative symptom score (SANS, high = worse, skew) Show forest plot | Other data | No numeric data | ||
| 11.1 by long term (≥26 weeks) | Other data | No numeric data | ||
| 12 Mental state: 5. Positive symptom score (PANSS positive symptom subscale, high = worse) Show forest plot | 2 | Mean Difference (IV, Fixed, 95% CI) | Subtotals only | |
| 12.1 medium term (13‐25 weeks) | 1 | 128 | Mean Difference (IV, Fixed, 95% CI) | ‐0.80 [‐1.58, ‐0.02] |
| 12.2 by long term (≥26 weeks) | 2 | 155 | Mean Difference (IV, Fixed, 95% CI) | 0.40 [‐0.79, 1.59] |
| 13 General functioning: 1. Average endpoint (LOFS, low = worse) Show forest plot | 1 | Mean Difference (IV, Fixed, 95% CI) | Subtotals only | |
| 13.1 by long term (≥26 weeks) | 1 | 26 | Mean Difference (IV, Fixed, 95% CI) | 2.60 [‐2.63, 7.83] |
| 14 General functioning: 2. Social functioning score (GAF, low = worse) Show forest plot | 1 | Mean Difference (IV, Fixed, 95% CI) | Subtotals only | |
| 14.1 by long term (≥26 weeks) | 1 | 27 | Mean Difference (IV, Fixed, 95% CI) | ‐9.0 [‐15.92, ‐2.08] |
| 15 General functioning: 3. Social functioning score (GSDS, high = worse, skew) Show forest plot | Other data | No numeric data | ||
| 15.1 by long term (≥26 weeks) | Other data | No numeric data | ||
| 16 General functioning: 4. Social functioning score (PAS, high = worse) Show forest plot | 1 | Mean Difference (IV, Fixed, 95% CI) | Subtotals only | |
| 16.1 by medium term (13‐25 weeks) | 1 | 75 | Mean Difference (IV, Fixed, 95% CI) | 0.45 [‐0.81, 1.71] |
| 16.2 by long term (≥26 weeks) | 1 | 56 | Mean Difference (IV, Fixed, 95% CI) | 0.44 [‐1.08, 1.96] |
| 17 General functioning: 5. Social functioning score (SAS, high = worse) Show forest plot | 1 | Mean Difference (IV, Fixed, 95% CI) | Subtotals only | |
| 17.1 by medium term (13‐25 weeks) | 1 | 51 | Mean Difference (IV, Fixed, 95% CI) | 0.06 [‐0.10, 0.22] |
| 17.2 by long term (≥26 weeks) | 1 | 51 | Mean Difference (IV, Fixed, 95% CI) | 0.05 [‐0.08, 0.18] |
| 18 Adverse effects: 1. Akathisia (HAS, high = worse, skew) Show forest plot | Other data | No numeric data | ||
| 18.1 by long term (≥26 weeks) | Other data | No numeric data | ||
| 19 Adverse effects: 2. Extrapyramidal side effects Show forest plot | 1 | Risk Ratio (M‐H, Fixed, 95% CI) | Subtotals only | |
| 19.1 hypomimia: by medium term (13‐25 weeks) | 1 | 43 | Risk Ratio (M‐H, Fixed, 95% CI) | 0.26 [0.06, 1.09] |
| 19.2 hypomimia: by long term (≥26 weeks) | 1 | 43 | Risk Ratio (M‐H, Fixed, 95% CI) | 0.17 [0.02, 1.33] |
| 19.3 rigidity: by medium term (13‐25 weeks) | 1 | 43 | Risk Ratio (M‐H, Fixed, 95% CI) | 0.35 [0.01, 8.11] |
| 19.4 rigidity: by long term (≥26 weeks) | 1 | 43 | Risk Ratio (M‐H, Fixed, 95% CI) | 0.42 [0.09, 1.93] |
| 19.5 tremor: by medium term (13‐25 weeks) | 1 | 43 | Risk Ratio (M‐H, Fixed, 95% CI) | 0.26 [0.03, 2.16] |
| 19.6 tremor: by long term (≥26 weeks) | 1 | 43 | Risk Ratio (M‐H, Fixed, 95% CI) | 0.21 [0.03, 1.65] |
| 19.7 akathisia: by medium term (13‐25 weeks) | 1 | 43 | Risk Ratio (M‐H, Fixed, 95% CI) | 0.08 [0.00, 1.34] |
| 19.8 akathisia: by long term (≥26 weeks) | 1 | 43 | Risk Ratio (M‐H, Fixed, 95% CI) | 0.19 [0.05, 0.76] |
| 19.9 gait abnormality: by medium term (13‐25 weeks) | 1 | 43 | Risk Ratio (M‐H, Fixed, 95% CI) | 0.15 [0.02, 1.11] |
| 19.10 gait abnormality: by long term (≥26 weeks) | 1 | 43 | Risk Ratio (M‐H, Fixed, 95% CI) | 0.08 [0.00, 1.34] |
| 19.11 global parkinsonism: by medium term (13‐25 weeks) | 1 | 43 | Risk Ratio (M‐H, Fixed, 95% CI) | 0.35 [0.08, 1.54] |
| 19.12 global parkinsonism: by long term (≥26 weeks) | 1 | 43 | Risk Ratio (M‐H, Fixed, 95% CI) | 0.13 [0.02, 0.96] |
| 19.13 global non‐liveliness: by medium term (13‐25 weeks) | 1 | 43 | Risk Ratio (M‐H, Fixed, 95% CI) | 0.24 [0.08, 0.73] |
| 19.14 global non‐liveliness: by long term (≥26 weeks) | 1 | 43 | Risk Ratio (M‐H, Fixed, 95% CI) | 0.09 [0.01, 0.61] |
| 20 Adverse effects: 3. Extrapyramidal symptoms (EPS, high = worse, skew) Show forest plot | Other data | No numeric data | ||
| 20.1 by medium term (13‐25 weeks) | Other data | No numeric data | ||
| 20.2 by long term (≥26 weeks) | Other data | No numeric data | ||
| 21 Adverse effects: 4. Need for additional medication Show forest plot | 2 | Risk Ratio (M‐H, Random, 95% CI) | Subtotals only | |
| 21.1 by long term (≥26 weeks) | 2 | 346 | Risk Ratio (M‐H, Random, 95% CI) | 0.70 [0.20, 2.48] |
| 22 Adverse effects: 5. Side effects (LUNSERS, high = worse, skew) Show forest plot | Other data | No numeric data | ||
| 22.1 by medium term (13‐25 weeks) | Other data | No numeric data | ||
| 22.2 by long term (≥26 weeks) | Other data | No numeric data | ||
| 23 Adverse effects: 6. Side effects (UKU, high = worse, skew) Show forest plot | Other data | No numeric data | ||
| 23.1 by long term (≥26 weeks) | Other data | No numeric data | ||
| 24 Adverse effects: 7. Tardive dyskinesia Show forest plot | 4 | Risk Ratio (M‐H, Random, 95% CI) | Subtotals only | |
| 24.1 by medium term (13‐25 weeks) | 1 | 43 | Risk Ratio (M‐H, Random, 95% CI) | 0.81 [0.37, 1.79] |
| 24.2 by long term (≥26 weeks) | 4 | 165 | Risk Ratio (M‐H, Random, 95% CI) | 1.15 [0.58, 2.30] |
| 25 Adverse effects: 8. Tardive dyskinesia (AIMS, high = worse, skew) Show forest plot | Other data | No numeric data | ||
| 25.1 by medium term (13‐25 weeks) | Other data | No numeric data | ||
| 25.2 by long term (≥26 weeks) | Other data | No numeric data | ||
| 26 Quality of life: 1. Average score (LQLP, low = worse) Show forest plot | 1 | Mean Difference (IV, Fixed, 95% CI) | Subtotals only | |
| 26.1 by long term (≥26 weeks) | 1 | 27 | Mean Difference (IV, Fixed, 95% CI) | ‐0.5 [‐1.38, 0.38] |
| 27 Quality of life: 2. Average score (QLS, low = worse) Show forest plot | 1 | Mean Difference (IV, Fixed, 95% CI) | Subtotals only | |
| 27.1 by long term (≥26 weeks) | 1 | 26 | Mean Difference (IV, Fixed, 95% CI) | 0.5 [‐0.35, 1.35] |
| 28 Quality of life: 3. Average score (WHOQoL‐Bref, low = worse) Show forest plot | 1 | Mean Difference (IV, Fixed, 95% CI) | Subtotals only | |
| 28.1 by medium term (13‐25 weeks) | 1 | 128 | Mean Difference (IV, Fixed, 95% CI) | ‐0.70 [‐4.27, 2.87] |
| 28.2 by long term (≥26 weeks) | 1 | 128 | Mean Difference (IV, Fixed, 95% CI) | ‐0.90 [‐5.39, 3.59] |
| 29 Leaving the study early/ loss to follow‐up Show forest plot | 14 | 1182 | Risk Ratio (M‐H, Random, 95% CI) | 1.63 [1.18, 2.24] |
| 29.1 short term (≤12 weeks) | 1 | 31 | Risk Ratio (M‐H, Random, 95% CI) | 0.41 [0.04, 4.08] |
| 29.2 by medium term (13‐25 weeks) | 3 | 155 | Risk Ratio (M‐H, Random, 95% CI) | 1.40 [0.25, 7.82] |
| 29.3 long term (≥26 weeks) | 10 | 996 | Risk Ratio (M‐H, Random, 95% CI) | 1.63 [1.23, 2.15] |
| Outcome or subgroup title | No. of studies | No. of participants | Statistical method | Effect size |
| 1 Relapse Show forest plot | 2 | Risk Ratio (M‐H, Fixed, 95% CI) | Subtotals only | |
| 1.1 long term (≥26 weeks) | 2 | 155 | Risk Ratio (M‐H, Fixed, 95% CI) | 2.33 [1.32, 4.12] |
| 2 Hospitalisation Show forest plot | 5 | Risk Ratio (M‐H, Fixed, 95% CI) | Subtotals only | |
| 2.1 by medium term (13‐25 weeks) | 1 | 101 | Risk Ratio (M‐H, Fixed, 95% CI) | 4.08 [0.47, 35.25] |
| 2.2 long term (≥26 weeks) | 5 | 625 | Risk Ratio (M‐H, Fixed, 95% CI) | 1.66 [1.33, 2.08] |
| 3 Death Show forest plot | 2 | Risk Ratio (M‐H, Fixed, 95% CI) | Subtotals only | |
| 3.1 by long term (≥26 weeks) | 2 | 155 | Risk Ratio (M‐H, Fixed, 95% CI) | 0.34 [0.05, 2.08] |
| 4 Global state: 1. Average score (GAS, low = worse) Show forest plot | 2 | Mean Difference (IV, Fixed, 95% CI) | Subtotals only | |
| 4.1 medium term (13‐25 weeks) | 1 | 75 | Mean Difference (IV, Fixed, 95% CI) | ‐0.15 [‐4.78, 4.48] |
| 4.2 long term (≥26 weeks) | 2 | 82 | Mean Difference (IV, Fixed, 95% CI) | 0.99 [‐4.24, 6.22] |
| 5 Global state: 2. Prodromal episodes Show forest plot | 2 | Risk Ratio (M‐H, Fixed, 95% CI) | Subtotals only | |
| 5.1 by long term (≥26 weeks) | 2 | 155 | Risk Ratio (M‐H, Fixed, 95% CI) | 3.19 [1.87, 5.44] |
| 6 Mental state: 1. Average score (BPRS, high = worse) Show forest plot | 1 | Mean Difference (IV, Fixed, 95% CI) | Subtotals only | |
| 6.1 long term (≥26 weeks) | 1 | 26 | Mean Difference (IV, Fixed, 95% CI) | 0.10 [‐0.33, 0.53] |
| 7 General functioning: 1. Average endpoint (LOFS, low = worse) Show forest plot | 1 | Mean Difference (IV, Fixed, 95% CI) | Subtotals only | |
| 7.1 by long term (≥26 weeks) | 1 | 26 | Mean Difference (IV, Fixed, 95% CI) | 2.60 [‐2.63, 7.83] |
| 8 General functioning: 2. Social (PAS, high = worse) Show forest plot | 1 | Mean Difference (IV, Fixed, 95% CI) | Subtotals only | |
| 8.1 by medium term (13‐25 weeks) | 1 | 75 | Mean Difference (IV, Fixed, 95% CI) | 0.45 [‐0.81, 1.71] |
| 8.2 by long term (≥26 weeks) | 1 | 56 | Mean Difference (IV, Fixed, 95% CI) | 0.44 [‐1.08, 1.96] |
| 9 Adverse effects: 1. Extrapyramidal side effects Show forest plot | 1 | Risk Ratio (M‐H, Fixed, 95% CI) | Subtotals only | |
| 9.1 hypomimia: by medium term (13‐25 weeks) | 1 | 43 | Risk Ratio (M‐H, Fixed, 95% CI) | 0.26 [0.06, 1.09] |
| 9.2 hypomimia: by long term (≥26 weeks) | 1 | 43 | Risk Ratio (M‐H, Fixed, 95% CI) | 0.17 [0.02, 1.33] |
| 9.3 rigidity: by medium term (13‐25 weeks) | 1 | 43 | Risk Ratio (M‐H, Fixed, 95% CI) | 0.35 [0.01, 8.11] |
| 9.4 rigidity: by long term (≥26 weeks) | 1 | 43 | Risk Ratio (M‐H, Fixed, 95% CI) | 0.42 [0.09, 1.93] |
| 9.5 tremor: by medium term (13‐25 weeks) | 1 | 43 | Risk Ratio (M‐H, Fixed, 95% CI) | 0.26 [0.03, 2.16] |
| 9.6 tremor: by long term (≥26 weeks) | 1 | 43 | Risk Ratio (M‐H, Fixed, 95% CI) | 0.21 [0.03, 1.65] |
| 9.7 akathisia: by medium term (13‐25 weeks) | 1 | 43 | Risk Ratio (M‐H, Fixed, 95% CI) | 0.08 [0.00, 1.34] |
| 9.8 akathisia: by long term (≥26 weeks) | 1 | 43 | Risk Ratio (M‐H, Fixed, 95% CI) | 0.19 [0.05, 0.76] |
| 9.9 gait abnormality: by medium term (13‐25 weeks) | 1 | 43 | Risk Ratio (M‐H, Fixed, 95% CI) | 0.15 [0.02, 1.11] |
| 9.10 gait abnormality: by long term (≥26 weeks) | 1 | 43 | Risk Ratio (M‐H, Fixed, 95% CI) | 0.08 [0.00, 1.34] |
| 9.11 global parkinsonism: by medium term (13‐25 weeks) | 1 | 43 | Risk Ratio (M‐H, Fixed, 95% CI) | 0.35 [0.08, 1.54] |
| 9.12 global parkinsonism: by long term (≥26 weeks) | 1 | 43 | Risk Ratio (M‐H, Fixed, 95% CI) | 0.13 [0.02, 0.96] |
| 9.13 global non‐liveliness: by medium term (13‐25 weeks) | 1 | 43 | Risk Ratio (M‐H, Fixed, 95% CI) | 0.24 [0.08, 0.73] |
| 9.14 global non‐liveliness: by long term (≥26 weeks) | 1 | 43 | Risk Ratio (M‐H, Fixed, 95% CI) | 0.09 [0.01, 0.61] |
| 10 Adverse effects: 2. Extrapyramidal symptoms (EPS, high = worse, skew) Show forest plot | Other data | No numeric data | ||
| 10.1 by medium term (13‐25 weeks) | Other data | No numeric data | ||
| 10.2 by long term (≥26 weeks) | Other data | No numeric data | ||
| 11 Adverse effects: 3. Need for additional medication Show forest plot | 1 | Risk Ratio (M‐H, Fixed, 95% CI) | Subtotals only | |
| 11.1 by long term (≥26 weeks) | 1 | 313 | Risk Ratio (M‐H, Fixed, 95% CI) | 1.01 [0.87, 1.17] |
| 12 Adverse effects: 4. Tardive dyskinesia Show forest plot | 1 | Risk Ratio (M‐H, Fixed, 95% CI) | Subtotals only | |
| 12.1 by medium term (13‐25 weeks) | 1 | 43 | Risk Ratio (M‐H, Fixed, 95% CI) | 0.81 [0.37, 1.79] |
| 12.2 by long term (≥26 weeks) | 1 | 30 | Risk Ratio (M‐H, Fixed, 95% CI) | 0.56 [0.19, 1.70] |
| 13 Quality of life: 1. Average score (QLS, low = worse) Show forest plot | 1 | Mean Difference (IV, Fixed, 95% CI) | Subtotals only | |
| 13.1 by long term (≥26 weeks) | 1 | 26 | Mean Difference (IV, Fixed, 95% CI) | 0.5 [‐0.35, 1.35] |
| 14 Leaving the study early/ loss to follow‐up Show forest plot | 5 | Risk Ratio (M‐H, Random, 95% CI) | Subtotals only | |
| 14.1 long term (≥26 weeks) | 5 | 562 | Risk Ratio (M‐H, Random, 95% CI) | 1.67 [1.17, 2.37] |
| Outcome or subgroup title | No. of studies | No. of participants | Statistical method | Effect size |
| 1 Leaving the study early/ loss to follow‐up Show forest plot | 1 | Risk Ratio (M‐H, Fixed, 95% CI) | Subtotals only | |
| 1.1 long term (≥26 weeks) | 1 | 237 | Risk Ratio (M‐H, Fixed, 95% CI) | 1.57 [1.23, 2.00] |
| Outcome or subgroup title | No. of studies | No. of participants | Statistical method | Effect size |
| 1 Relapse Show forest plot | 3 | Risk Ratio (M‐H, Fixed, 95% CI) | Subtotals only | |
| 1.1 short term (≤12 weeks) | 1 | 128 | Risk Ratio (M‐H, Fixed, 95% CI) | 2.91 [0.31, 27.22] |
| 1.2 medium term (13‐25 weeks) | 1 | 128 | Risk Ratio (M‐H, Fixed, 95% CI) | 2.33 [0.87, 6.22] |
| 1.3 long term (≥26 weeks) | 3 | 219 | Risk Ratio (M‐H, Fixed, 95% CI) | 2.76 [1.63, 4.67] |
| 2 Global state: 1. Average score (CGI‐S, high = worse) Show forest plot | 1 | Mean Difference (IV, Random, 95% CI) | Subtotals only | |
| 2.1 by long term (≥26 weeks) | 1 | 27 | Mean Difference (IV, Random, 95% CI) | 0.30 [‐0.33, 0.93] |
| 3 Global state: 2. Average score (GAS, low = worse) Show forest plot | 1 | Mean Difference (IV, Fixed, 95% CI) | Subtotals only | |
| 3.1 medium term (13‐25 weeks) | 1 | 51 | Mean Difference (IV, Fixed, 95% CI) | ‐1.54 [‐10.42, 7.34] |
| 3.2 long term (≥26 weeks) | 1 | 51 | Mean Difference (IV, Fixed, 95% CI) | 1.83 [‐4.66, 8.32] |
| 4 Mental state: 1. Average score (BPRS, high = worse) Show forest plot | 1 | Mean Difference (IV, Fixed, 95% CI) | Subtotals only | |
| 4.1 by medium term (13‐25 weeks) | 1 | 51 | Mean Difference (IV, Fixed, 95% CI) | 1.85 [‐3.03, 6.73] |
| 4.2 long term (≥26 weeks) | 1 | 51 | Mean Difference (IV, Fixed, 95% CI) | 0.20 [‐2.77, 3.17] |
| 5 Mental state: 2. Negative symptom score (PANSS negative symptom subscale, high = worse) Show forest plot | 1 | Mean Difference (IV, Fixed, 95% CI) | Subtotals only | |
| 5.1 medium term (13‐25 weeks) | 1 | 128 | Mean Difference (IV, Fixed, 95% CI) | ‐0.80 [‐2.43, 0.83] |
| 5.2 by long term (≥26 weeks) | 1 | 128 | Mean Difference (IV, Fixed, 95% CI) | ‐1.20 [‐3.19, 0.79] |
| 6 Mental state: 3. Negative symptom score (PANSS negative symptom subscale, high = worse, skew) Show forest plot | Other data | No numeric data | ||
| 6.1 by long term (≥26 weeks) | Other data | No numeric data | ||
| 7 Mental state: 4. Negative symptom score (SANS, high = worse, skew) Show forest plot | Other data | No numeric data | ||
| 7.1 by long term (≥26 weeks) | Other data | No numeric data | ||
| 8 Mental state: 5. Positive symptom score (PANSS positive symptom subscale, high = worse) Show forest plot | 2 | Mean Difference (IV, Fixed, 95% CI) | Subtotals only | |
| 8.1 medium term (13‐25 weeks) | 1 | 128 | Mean Difference (IV, Fixed, 95% CI) | ‐0.80 [‐1.58, ‐0.02] |
| 8.2 by long term (≥26 weeks) | 2 | 155 | Mean Difference (IV, Fixed, 95% CI) | 0.40 [‐0.79, 1.59] |
| 9 General functioning: 1. Social functioning score (GAF, low = worse) Show forest plot | 1 | Mean Difference (IV, Fixed, 95% CI) | Subtotals only | |
| 9.1 by long term (≥26 weeks) | 1 | 27 | Mean Difference (IV, Fixed, 95% CI) | ‐9.0 [‐15.92, ‐2.08] |
| 10 General functioning: 2. Social functioning score (GSDS, high = worse, skew) Show forest plot | Other data | No numeric data | ||
| 10.1 by long term (≥26 weeks) | Other data | No numeric data | ||
| 11 General functioning: 3. Social functioning score (SAS, high = worse) Show forest plot | 1 | Mean Difference (IV, Fixed, 95% CI) | Subtotals only | |
| 11.1 by medium term (13‐25 weeks) | 1 | 51 | Mean Difference (IV, Fixed, 95% CI) | 0.06 [‐0.10, 0.22] |
| 11.2 by long term (≥26 weeks) | 1 | 51 | Mean Difference (IV, Fixed, 95% CI) | 0.05 [‐0.08, 0.18] |
| 12 Adverse effects: 1. Akathisia (HAS, high = worse, skew) Show forest plot | Other data | No numeric data | ||
| 12.1 by long term (≥26 weeks) | Other data | No numeric data | ||
| 13 Adverse effects: 2. Extrapyramidal symptoms (EPS, high = worse, skew) Show forest plot | Other data | No numeric data | ||
| 13.2 by long term (≥26 weeks) | Other data | No numeric data | ||
| 14 Adverse effects: 3. Side effects (LUNSERS, high = worse, skew) Show forest plot | Other data | No numeric data | ||
| 14.1 by medium term (13‐25 weeks) | Other data | No numeric data | ||
| 14.2 by long term (≥26 weeks) | Other data | No numeric data | ||
| 15 Adverse effects: 4. Side effects (UKU, high = worse, skew) Show forest plot | Other data | No numeric data | ||
| 15.1 by long term (≥26 weeks) | Other data | No numeric data | ||
| 16 Adverse effects: 5. Tardive dyskinesia Show forest plot | 1 | Risk Ratio (M‐H, Fixed, 95% CI) | Subtotals only | |
| 16.1 by long term (≥26 weeks) | 1 | 85 | Risk Ratio (M‐H, Fixed, 95% CI) | 0.0 [0.0, 0.0] |
| 17 Adverse effects: 6. Tardive dyskinesia (AIMS, high = worse, skew) Show forest plot | Other data | No numeric data | ||
| 17.2 by long term (≥26 weeks) | Other data | No numeric data | ||
| 18 Quality of life: 1. Average score (LQLP, low = worse) Show forest plot | 1 | Mean Difference (IV, Fixed, 95% CI) | Subtotals only | |
| 18.1 by long term (≥26 weeks) | 1 | 27 | Mean Difference (IV, Fixed, 95% CI) | ‐0.5 [‐1.38, 0.38] |
| 19 Quality of life: 2. Average score (WHOQoL‐Bref, low = worse) Show forest plot | 1 | Mean Difference (IV, Fixed, 95% CI) | Subtotals only | |
| 19.1 by medium term (13‐25 weeks) | 1 | 128 | Mean Difference (IV, Fixed, 95% CI) | ‐0.70 [‐4.27, 2.87] |
| 19.2 by long term (≥26 weeks) | 1 | 128 | Mean Difference (IV, Fixed, 95% CI) | ‐0.90 [‐5.39, 3.59] |
| 20 Leaving the study early/ loss to follow‐up Show forest plot | 3 | Risk Ratio (M‐H, Random, 95% CI) | Subtotals only | |
| 20.1 long term (≥26 weeks) | 3 | 257 | Risk Ratio (M‐H, Random, 95% CI) | 2.12 [0.70, 6.37] |
| Outcome or subgroup title | No. of studies | No. of participants | Statistical method | Effect size |
| 1 Relapse Show forest plot | 6 | Risk Ratio (M‐H, Fixed, 95% CI) | Subtotals only | |
| 1.1 short term (≤12 weeks) | 3 | 268 | Risk Ratio (M‐H, Fixed, 95% CI) | 1.59 [0.94, 2.70] |
| 1.2 medium term (13‐25 weeks) | 3 | 272 | Risk Ratio (M‐H, Fixed, 95% CI) | 2.15 [1.25, 3.68] |
| 1.3 long term (≥26 weeks) | 2 | 62 | Risk Ratio (M‐H, Fixed, 95% CI) | 1.70 [0.54, 5.38] |
| 2 Hospitalisation Show forest plot | 1 | Risk Ratio (M‐H, Fixed, 95% CI) | Subtotals only | |
| 2.1 medium term (13‐25 weeks) | 1 | 35 | Risk Ratio (M‐H, Fixed, 95% CI) | 0.26 [0.03, 2.14] |
| 3 Global state: 1. Average score (CGI‐S, high = worse) Show forest plot | 1 | Mean Difference (IV, Fixed, 95% CI) | Subtotals only | |
| 3.1 medium term (13‐25 weeks) | 1 | 35 | Mean Difference (IV, Fixed, 95% CI) | ‐0.42 [‐1.08, 0.24] |
| 4 Global state: 2. Average score (GAS, low = worse) Show forest plot | 1 | Mean Difference (IV, Fixed, 95% CI) | Subtotals only | |
| 4.1 short term (≤12 weeks) | 1 | 31 | Mean Difference (IV, Fixed, 95% CI) | ‐3.61 [‐5.67, ‐1.55] |
| 5 Global state: 3. Significant improvement Show forest plot | 1 | Risk Ratio (M‐H, Fixed, 95% CI) | Subtotals only | |
| 5.1 short term (≤12 weeks) | 1 | 60 | Risk Ratio (M‐H, Fixed, 95% CI) | 0.4 [0.18, 0.89] |
| 5.2 medium term (13‐25 weeks) | 1 | 60 | Risk Ratio (M‐H, Fixed, 95% CI) | 0.32 [0.15, 0.68] |
| 6 Adverse effects: 1. Need for additional medication Show forest plot | 1 | Risk Ratio (M‐H, Fixed, 95% CI) | Subtotals only | |
| 6.1 by long term (≥26 weeks) | 1 | 33 | Risk Ratio (M‐H, Fixed, 95% CI) | 0.15 [0.02, 1.07] |
| 7 Adverse effects: 2. Tardive dyskinesia Show forest plot | 2 | Risk Ratio (M‐H, Fixed, 95% CI) | Subtotals only | |
| 7.1 by long term (≥26 weeks) | 2 | 50 | Risk Ratio (M‐H, Fixed, 95% CI) | 1.64 [0.82, 3.30] |
| 8 Adverse effects: 3. Tardive dyskinesia (AIMS, high = worse, skew) Show forest plot | Other data | No numeric data | ||
| 8.1 by medium term (13‐25 weeks) | Other data | No numeric data | ||
| 9 Leaving the study early/ loss to follow‐up Show forest plot | 6 | 248 | Risk Ratio (M‐H, Random, 95% CI) | 1.15 [0.45, 2.90] |
| 9.1 short term (≤12 weeks) | 1 | 31 | Risk Ratio (M‐H, Random, 95% CI) | 0.41 [0.04, 4.08] |
| 9.2 by medium term (13‐25 weeks) | 3 | 155 | Risk Ratio (M‐H, Random, 95% CI) | 1.40 [0.25, 7.82] |
| 9.3 long term (≥26 weeks) | 2 | 62 | Risk Ratio (M‐H, Random, 95% CI) | 1.01 [0.46, 2.20] |
| Outcome or subgroup title | No. of studies | No. of participants | Statistical method | Effect size |
| 1 Relapse Show forest plot | 2 | Risk Ratio (M‐H, Fixed, 95% CI) | Subtotals only | |
| 1.1 short term (≤12 weeks) | 1 | 260 | Risk Ratio (M‐H, Fixed, 95% CI) | 0.22 [0.10, 0.45] |
| 1.2 medium term (13‐25 weeks) | 2 | 290 | Risk Ratio (M‐H, Fixed, 95% CI) | 0.37 [0.24, 0.58] |
| 2 Global state: 1. significant improvement Show forest plot | 1 | Risk Ratio (M‐H, Fixed, 95% CI) | Subtotals only | |
| 2.1 medium term (13‐25 weeks) | 1 | 30 | Risk Ratio (M‐H, Fixed, 95% CI) | 1.0 [0.24, 4.18] |
| 3 Leaving the study early/ loss to follow‐up Show forest plot | 2 | Risk Ratio (M‐H, Random, 95% CI) | Subtotals only | |
| 3.1 by medium term (13‐25 weeks) | 2 | 90 | Risk Ratio (M‐H, Random, 95% CI) | 1.97 [1.28, 3.01] |
| Outcome or subgroup title | No. of studies | No. of participants | Statistical method | Effect size |
| 1 Relapse Show forest plot | 12 | Risk Ratio (M‐H, Fixed, 95% CI) | Subtotals only | |
| 1.1 intermittent fluphenazine decanoate (low dose) vs maintained fluphenazine decanoate (moderate dose) ‐ short term (≤12 weeks) | 1 | 31 | Risk Ratio (M‐H, Fixed, 95% CI) | 0.0 [0.0, 0.0] |
| 1.2 intermittent haloperidol equivalents (low dose) vs maintained haloperidol equivalents (low dose) ‐ short term (≤12 weeks) | 1 | 128 | Risk Ratio (M‐H, Fixed, 95% CI) | 2.91 [0.31, 27.22] |
| 1.3 various intermittent typical antipsychotics (moderate dose) vs maintained typical antipsychotics (moderate dose) ‐ short term (≤12 weeks) | 1 | 177 | Risk Ratio (M‐H, Fixed, 95% CI) | 1.73 [0.53, 5.70] |
| 1.4 intermittent haloperidol equivalents (low dose) vs maintained haloperidol equivalents (low dose) ‐ medium term (13‐25 weeks) | 1 | 128 | Risk Ratio (M‐H, Fixed, 95% CI) | 2.33 [0.87, 6.22] |
| 1.5 various intermittent atypical antipsychotics (dosage unclear) vs maintained atypical/typical antipsychotics (dosage unclear) ‐ medium term (13‐25 weeks) | 1 | 35 | Risk Ratio (M‐H, Fixed, 95% CI) | 1.41 [0.37, 5.40] |
| 1.6 various intermittent typical antipsychotics (low dose) vs maintained typical antipsychotics (low dose) ‐ medium term (13‐25 weeks) | 1 | 60 | Risk Ratio (M‐H, Fixed, 95% CI) | 1.88 [0.94, 3.75] |
| 1.7 various intermittent typical antipsychotics (moderate dose) vs maintained typical antipsychotics (moderate dose) ‐ medium term (13‐25 weeks) | 2 | 551 | Risk Ratio (M‐H, Fixed, 95% CI) | 3.75 [1.42, 9.94] |
| 1.8 intermittent chlorpromazine equivalents (low dose) vs maintained chlorpromazine equivalents (low dose) ‐ long term (≥26 weeks) | 2 | 148 | Risk Ratio (M‐H, Fixed, 95% CI) | 2.62 [1.30, 5.28] |
| 1.9 intermittent clozapine (low dose) vs maintained clozapine (low dose) long term (≥26 weeks) | 1 | 25 | Risk Ratio (M‐H, Fixed, 95% CI) | 15.30 [0.92, 255.51] |
| 1.10 intermittent haloperidol equivalents (low dose) vs maintained haloperidol equivalents (low dose) ‐ long term (≥26 weeks) | 3 | 226 | Risk Ratio (M‐H, Fixed, 95% CI) | 2.53 [1.60, 4.01] |
| 1.11 intermittent pimozide (high dose) vs fluphenazine decanoate (low dose) ‐ long term (≥26 weeks) | 2 | 62 | Risk Ratio (M‐H, Fixed, 95% CI) | 1.70 [0.54, 5.38] |
| 1.12 various intermittent typical antipsychotics (low dose) vs maintained typical antipsychotics ‐ long term (≥26 weeks) | 1 | 26 | Risk Ratio (M‐H, Fixed, 95% CI) | 2.93 [0.38, 22.75] |
| 2 Hospitalisation Show forest plot | 6 | 661 | Risk Ratio (M‐H, Fixed, 95% CI) | 1.58 [1.28, 1.97] |
| 2.1 various intermittent atypical antipsychotics (dosage unclear) vs maintained atypical/typical antipsychotics (dosage unclear) ‐ medium term (13‐25 weeks) | 1 | 35 | Risk Ratio (M‐H, Fixed, 95% CI) | 0.26 [0.03, 2.14] |
| 2.2 intermittent chlorpromazine equivalents (low dose) vs maintained chlorpromazine equivalents (low dose) ‐ long term (≥26 weeks) | 1 | 101 | Risk Ratio (M‐H, Fixed, 95% CI) | 1.53 [0.68, 3.42] |
| 2.3 intermittent chlorpromazine equivalents (low dose) vs maintained chlorpromazine equivalents (moderate dose) ‐ long term (≥26 weeks) | 1 | 116 | Risk Ratio (M‐H, Fixed, 95% CI) | 1.48 [0.97, 2.26] |
| 2.4 intermittent chlorpromazine equivalents (low dose) vs maintained chlorpromazine equivalents (high dose) ‐ long term (≥26 weeks) | 1 | 42 | Risk Ratio (M‐H, Fixed, 95% CI) | 1.1 [0.60, 2.02] |
| 2.5 intermittent fluphenazine decanoate (low dose) v maintained fluphenazine decanoate (low+moderate dose) ‐ long term (≥26 weeks) | 1 | 313 | Risk Ratio (M‐H, Fixed, 95% CI) | 1.81 [1.33, 2.48] |
| 2.6 intermittent haloperidol equivalents (low dose) vs maintained haloperidol equivalents (low dose) ‐ long term (≥26 weeks) | 1 | 54 | Risk Ratio (M‐H, Fixed, 95% CI) | 2.75 [1.00, 7.57] |