Pylorus‐preserving pancreaticoduodenectomy (pp Whipple) versus pancreaticoduodenectomy (classic Whipple) for surgical treatment of periampullary and pancreatic carcinoma
Abstract
Background
Pancreatic cancer is the fourth leading cause of cancer death for men and the fifth for women. The standard treatment for resectable tumours consists of a classic Whipple (CW) operation or a pylorus‐preserving pancreaticoduodenectomy (PPW). It is unclear which of these procedures is more favourable in terms of survival, mortality, complications and quality of life.
Objectives
The objective of this systematic review is to compare the effectiveness of CW and PPW techniques for surgical treatment of cancer of the pancreatic head and the periampullary region.
Search methods
We conducted searches on 28 March 2006, 11 January 2011 and 9 January 2014 to identify all randomised controlled trials (RCTs), while applying no language restrictions. We searched the following electronic databases: the Cochrane Central Register of Controlled Trials (CENTRAL), the Cochrane Database of Systematic Reviews (CDSR) and the Database of Abstracts of Reviews of Effects (DARE) from The Cochrane Library (2013, Issue 4); MEDLINE (1946 to January 2014); and EMBASE (1980 to January 2014). We also searched abstracts from Digestive Disease Week and United European Gastroenterology Week (1995 to 2010). We identified no additional studies upon updating the systematic review in 2014.
Selection criteria
We considered RCTs comparing CW versus PPW to be eligible if they included study participants with periampullary or pancreatic carcinoma.
Data collection and analysis
Two review authors independently extracted data from the included studies. We used a random‐effects model for pooling data. We compared binary outcomes using odds ratios (ORs), pooled continuous outcomes using mean differences (MDs) and used hazard ratios (HRs) for meta‐analysis of survival. Two review authors independently evaluated the methodological quality and risk of bias of included studies according to the standards of The Cochrane Collaboration.
Main results
We included six RCTs with a total of 465 participants. Our critical appraisal revealed vast heterogeneity with respect to methodological quality and outcome parameters. In‐hospital mortality (OR 0.49, 95% confidence interval (CI) 0.17 to 1.40; P value 0.18), overall survival (HR 0.84, 95% CI 0.61 to 1.16; P value 0.29) and morbidity showed no significant differences. However, we noted that operating time (MD ‐68.26 minutes, 95% CI ‐105.70 to ‐30.83; P value 0.0004) and intraoperative blood loss (MD ‐0.76 mL, 95% CI ‐0.96 to ‐0.56; P value < 0.00001) were significantly reduced in the PPW group. All significant results are associated with low quality of evidence as determined on the basis of GRADE (Grades of Recommendation, Assessment, Development and Evaluation) criteria.
Authors' conclusions
No evidence suggests relevant differences in mortality, morbidity and survival between the two operations. Given obvious clinical and methodological heterogeneity, future research must be undertaken to perform high‐quality randomised controlled trials of complex surgical interventions on the basis of well‐defined outcome parameters.
PICO
Plain language summary
Comparison of the stomach‐preserving 'Whipple' operation with the classic 'Whipple' operation for patients with cancer of the pancreas or the periampullary region (the point at which the ducts from the liver and pancreas enter the small intestine)
Pancreatic cancer is a leading cause of cancer death. Two surgical procedures can lead to a cure: the classic Whipple operation, in which part of the pancreas, the gallbladder, the duodenum, the pylorus (outlet of the stomach) and the distal (lower) part of the stomach are removed, and the so‐called pylorus‐preserving pancreaticoduodenectomy, or pylorus‐preserving Whipple operation, in which the stomach and the pylorus are not removed.
It is unclear whether the pylorus‐preserving Whipple results in a higher rate of recurrence of the tumour because it is less extensive and so may be less radical, but it is also unknown whether quality of life is decreased after removal of the lower portion of the stomach. Another uncertainty is whether the two methods are associated with different rates or types of complications.
We included in this review six randomised controlled trials with a total of 496 participants. We could identify no differences in terms of complications, long‐term survival or death due to complications after the operation, but operating time and blood loss seem to be less in the group treated with the pylorus‐preserving Whipple operation. Our conclusion is that, at present, no difference is evident between the two surgical procedures for the treatment of pancreatic or periampullary cancer.
Authors' conclusions
Summary of findings
| Survival after surgical treatment for periampullary or pancreatic carcinoma | ||||||
| Patient or population: patients with surgical treatment of periampullary or pancreatic carcinoma | ||||||
| Outcomes | Illustrative comparative risks* (95% CI) | Relative effect | Number of participants | Quality of the evidence | Comments | |
| Assumed risk | Corresponding risk | |||||
| Control | Survival | |||||
| Overall survival | Medium‐risk population | HR 0.84 | 0 | ⊕⊕⊝⊝ | ||
| *The basis for the assumed risk (e.g. median control group risk across studies) is provided in footnotes. The corresponding risk (and its 95% confidence interval) is based on the assumed risk in the comparison group and the relative effect of the intervention (and its 95% CI). | ||||||
| GRADE Working Group grades of evidence. | ||||||
| aInadequate information about sequence generation and allocation concealment. No intention‐to‐treat analysis. | ||||||
| Mortality after surgical treatment for periampullary or pancreatic carcinoma | ||||||
| Patient or population: patients with surgical treatment for periampullary and pancreatic carcinoma | ||||||
| Outcomes | Illustrative comparative risks* (95% CI) | Relative effect | Number of participants | Quality of the evidence | Comments | |
| Assumed risk | Corresponding risk | |||||
| Control | Mortality | |||||
| Postoperative mortality | Study population | OR 0.49 | 417 | ⊕⊕⊝⊝ | ||
| 52 per 1000 | 26 per 1000 | |||||
| Medium‐risk population | ||||||
| 44 per 1000 | 22 per 1000 | |||||
| *The basis for the assumed risk (e.g. median control group risk across studies) is provided in footnotes. The corresponding risk (and its 95% confidence interval) is based on the assumed risk in the comparison group and the relative effect of the intervention (and its 95% CI). | ||||||
| GRADE Working Group grades of evidence. | ||||||
| aConfidence intervals are wide because of small number of events. No sample size calculation was reported for trials except for Seiler and Tran. | ||||||
| Intraoperative blood loss in surgical treatment of patients with periampullary or pancreatic carcinoma | ||||||
| Patient or population: patients with surgical treatment for periampullary or pancreatic carcinoma | ||||||
| Outcomes | Illustrative comparative risks* (95% CI) | Relative effect | Number of participants | Quality of the evidence | Comments | |
| Assumed risk | Corresponding risk | |||||
| Control | Intraoperative blood loss | |||||
| Intraoperative blood loss (litres) | Mean intraoperative blood loss (litres) in the intervention groups was | 33 | ⊕⊕⊝⊝ | |||
| *The basis for the assumed risk (e.g. median control group risk across studies) is provided in footnotes. The corresponding risk (and its 95% confidence interval) is based on the assumed risk in the comparison group and the relative effect of the intervention (and its 95% CI). | ||||||
| GRADE Working Group grades of evidence. | ||||||
| aSmall number of participants. | ||||||
| Operating time in surgical treatment for periampullary or pancreatic carcinoma | ||||||
| Patient or population: patients with surgical treatment for periampullary and pancreatic carcinoma | ||||||
| Outcomes | Illustrative comparative risks* (95% CI) | Relative effect | Number of participants | Quality of the evidence | Comments | |
| Assumed risk | Corresponding risk | |||||
| Control | Operating time | |||||
| Operating time (minutes) | Mean operating time (minutes) in the intervention groups was | 125 | ⊕⊕⊝⊝ | |||
| *The basis for the assumed risk (e.g. median control group risk across studies) is provided in footnotes. The corresponding risk (and its 95% confidence interval) is based on the assumed risk in the comparison group and the relative effect of the intervention (and its 95% CI). | ||||||
| GRADE Working Group grades of evidence. | ||||||
| aSerious limitations in the study design in the trials of Bloechle, Lin and Wenger are a potential source of bias. All are characterised by small sample sizes, lack of blinding and incomplete outcome reporting. | ||||||
Background
Description of the condition
Pancreatic cancer is the fourth leading cause of cancer death for men and the fifth leading cause of cancer death for women, accounting for 4.8% of cancer deaths in men and 5.5% in women (Edwards 2002; Jemal 2005). In large series, the aggressive nature of these tumours and the high local recurrence rate, together with early metastatic spread, have resulted in disappointing five‐year survival rates of between 11% and 21% after resection (Sperti 1996; Yeo 1995).
Description of the intervention
The current standard therapy for pancreatic tumours situated in the head of the pancreas is resection (Buchler 2003; Lillemoe 2000). Great improvement in pancreatic surgery has led to mortality rates of less than 5% at high‐volume centres (Buchler 2003; Trede 1990; Yeo 1997). Moreover, mortality and morbidity rates after resection reached similar levels to those following the palliative bypass operation (Gouma 1999; Koslowsky 2001; Lillemoe 1996). Nevertheless, operative morbidity remains high, occasionally approaching 30% to 40% (Bassi 2001; Gouma 2000; Richter 2003), from causes including intra‐abdominal abscess, sepsis, pancreatic fistula and delayed gastric emptying (DGE).
Two surgical techniques are usually performed in the treatment of pancreatic head cancer: the classic Whipple (CW) operation developed by Kausch (Kausch 1912) and later perfected by Whipple (Whipple 1935), and the pylorus‐preserving Whipple (PPW) operation inaugurated by Watson (Watson 1944) and popularised by Traverso and Longmire (Traverso 1980).
How the intervention might work
The CW operation consists of an en bloc (as one unit) removal of the pancreatic head, the duodenum, the common bile duct, the gall bladder and the distal portion of the stomach, together with adjacent lymph nodes (Trede 1993). This operation can lead to special complications such as early and late dumping (rapid emptying of the stomach), postoperative weight loss (Seiler 2000) and postoperative reflux (Williamson 1993).
Why it is important to do this review
The PPW operation preserves the stomach and the pylorus, the latter of which is needed for the physiologically timed transport of chyme (partially digested food passing into the intestine). The extent of this resection is obviously less than that of the CW operation; it is therefore expected that operation time will decrease and blood loss will be less. In addition, some authors report improved postoperative weight gain (Seiler 2000), higher quality of life (Wenger 1999) and better access to the biliary anastomosis for postoperative endoscopy in patients with recurrent biliary obstruction. It is unclear whether the lesser extent of the resection is justified if regarded from the oncological side, and whether DGE occurs more often in the PPW procedure than in the CW operation.
Objectives
The objective of this systematic review is to compare the effectiveness of CW and PPW techniques for surgical treatment of cancer of the pancreatic head and the periampullary region.
Methods
Criteria for considering studies for this review
Types of studies
Randomised controlled trials (RCTs) irrespective of publication status or language.
Types of participants
Patients undergoing an elective PPW or CW operation for periampullary or pancreatic carcinoma.
Types of interventions
-
Pylorus‐preserving pancreaticoduodenectomy.
-
Classic Whipple operation.
Types of outcome measures
Primary outcomes
Postoperative pancreatic‐associated morbidity (disease‐specific), such as leakage from the pancreatic anastomosis/pancreatic fistula, DGE and biliary leakage.
Secondary outcomes
-
Survival.
-
Postoperative mortality.
-
Blood loss.
-
Required blood replacement.
-
Operation time.
-
General morbidity, including postoperative gastrointestinal bleeding, wound infection, pulmonary insufficiency, necessity for reoperation.
-
Duration of hospital stay.
-
Quality of life.
-
Status of resection margins (R0/R1* resection).
*R0 means that the tumour is resected without residual microscopic remnants. In an R1 resection, a microscopic remnant of the tumour is present, and in an R2 resection, macroscopic tumour parts can be seen.
Search methods for identification of studies
Electronic searches
We conducted searches on 28 March 2006, 11 January 2011 and 9 January 2014 to identify all published and unpublished RCTs, while applying no language restrictions.
We identified relevant trials by searching the following electronic databases: the Cochrane Central Register of Controlled Trials (CENTRAL), the Cochrane Database of Systematic Reviews (CDSR) and the Database of Abstracts of Reviews of Effectiveness (DARE) from The Cochrane Library (2013, Issue 4); MEDLINE (1946 to January 2014); and EMBASE (1980 to January 2014). We also handsearched abstracts from the 1995 to 2010 American Digestive Disease Week (DDW), published in Gastroenterology, and the United European Gastroenterology Week (UEGW), published in Gut.
We constructed the search strategy for this review by using a combination of medical subject headings (MeSH) and text words related to the use of pancreaticoduodenectomy or pylorus‐preserving pancreaticoduodenectomy in the surgical treatment of pancreatic cancer. To identify RCTs, we combined the following search with the Cochrane highly sensitive search strategy phases one, two and three, as contained in the Cochrane Handbook for Systematic Reviews of Interventions (Higgins 2005) (please see Appendix 1).
Searching other resources
We contacted members of the Cochrane Upper Gastrointestinal and Pancreatic Diseases Group and experts in the field and asked them to provide details of outstanding clinical trials and any relevant unpublished materials.
Data collection and analysis
Selection of studies
Two review authors independently scanned the abstracts of all trials identified by the search to determine eligibility. Each contributor independently evaluated whether trials fulfilled the inclusion criteria. We then selected full articles for further assessment if the abstract suggested that the study was relevant. If these criteria were unclear from the abstract, we retrieved and reviewed the full article for clarification. We excluded papers not meeting our inclusion criteria; these studies are listed along with reasons for their omission in the Characteristics of excluded studies table. Disagreement was resolved by discussion with a third review author.
Data extraction and management
We extracted data from published and unpublished reports using standardised forms. A list of the data items that we extracted can be found in Appendix 2.
Assessment of risk of bias in included studies
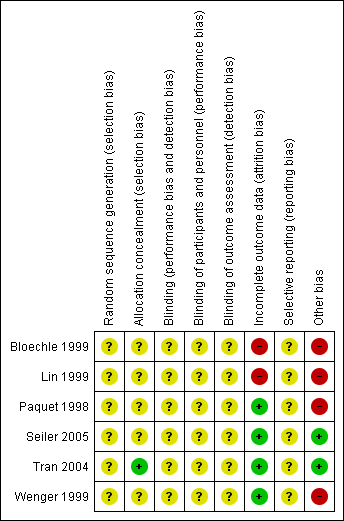
We assessed the methodological quality of the studies. Methodological quality is defined as confidence that the study design and its report will restrict bias in the comparison of interventions (Moher 1998). We assessed methodological quality according to empirical evidence (Jadad 1996; Kjaergard 2001; Moher 1998; Schulz 1995) by examining how the allocation sequence was generated, how allocation concealment was provided and what risks of other bias were present (Figure 1 and Figure 2).

Risk of bias graph: review authors' judgements about each risk of bias item presented as percentages across all included studies.

Risk of bias summary: review authors' judgements about each risk of bias item for each included study.
Measures of treatment effect
We measured the hazard ratio (HR) and determined the 95% confidence interval (CI) for survival. For dichotomous outcomes, we calculated the odds ratio (OR) along with 95% CI. For continuous outcomes, we calculated mean difference (MD) or standardised mean difference (SMD) with 95% CI.
Unit of analysis issues
The unit of analysis was each participant recruited into the trials.
Dealing with missing data
We performed the analysis on an intention‐to‐treat basis when possible. Otherwise, we adopted the per‐protocol analysis as presented in the original trials.
Assessment of heterogeneity
Using the random‐effects model (DerSimonian 1986), we calculated pooled estimates of effect and investigated the results for statistical heterogeneity (using the I2 statistic). If an extreme level of heterogeneity was identified, we interpreted summary effect measures with caution. However, we investigated the causes of heterogeneity as far as collected data would allow.
Assessment of reporting biases
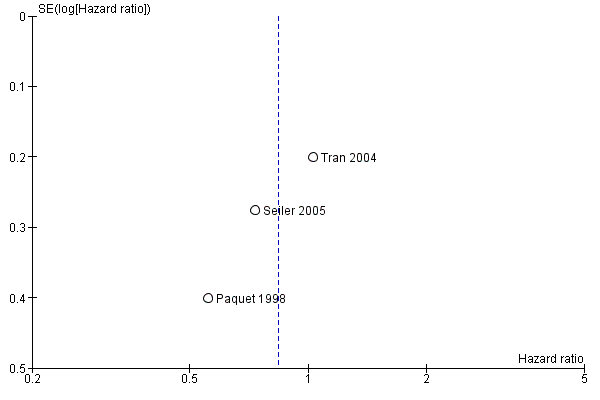
We used funnel plots to explore publication bias (Egger 1997a) and used asymmetry in a funnel plot of trial size against treatment effect to assess bias. We created funnel plots for overall survival, mortality and the most representative cause of postoperative morbidity, which is occurrence of a pancreatic fistula. We planned a test for asymmetry if at least 10 trials were included. Otherwise we used funnel plots for inspection and visual detection of potential publication bias only.
Data synthesis
Additional statistical guidance was provided by the editorial base and the review authors' host institutions. We ensured data accuracy by performing double data entry. We combined data from different trials reporting the same or similar comparisons. We summarised dichotomous data using odds ratios (ORs), presented continuous data as weighted mean differences (WMDs) and summarised survival or time‐to‐event data using hazard ratios (HRs). We calculated pooled HRs according to the methods described by Parmar et al (Parmar 1998).
Subgroup analysis and investigation of heterogeneity
We performed subgroup analyses for survival in participants with periampullary cancer or pancreatic head cancer and in both groups together, as well as for those with DGE and pancreatic fistula, with regard to different definitions.
Sensitivity analysis
We performed sensitivity analysis in cases of differing definitions of outcome measures, analysing trials separately that defined outcome measures identically.
Results
Description of studies
Results of the search
We retrieved 1235 abstracts through the 2006 search, an additional 129 abstracts from the 2011 search and a further 558 abstracts from the most recent search update in 2014. We checked these abstracts for eligibility. The 2006 search produced six randomised controlled trials (RCTs), including data from seven publications, for inclusion, although none were identified in the 2011 or 2014 search. Six hundred nineteen abstracts from Digestive Disease Week and United European Gastroenterology Week (1995 to 2010) were handsearched, but no additional trials were found.
Included studies
Six RCTs (Bloechle 1999; Lin 1999; Paquet 1998; Seiler 2005; Tran 2004; Wenger 1999) were eligible (see Characteristics of included studies). Because the study by Lin et al, published in 2005, is an update of the study performed in 1999, the only analysed data from the older trial involved red blood cell transfusion, because this information was not reported in the later trial (Lin 1999). After this and the per‐protocol analysis of six trials were accounted for, the quantitative data from 496 analysed patients comparing PPW (245 participants) and CW (251 participants) procedures were found suitable for the systematic review.
Besides obvious variation in sample sizes (range from 33 (Lin 1999) to 170 (Wenger 1999)), evaluation of study population baseline characteristics revealed adequate consistency: All analysed participants were included because of resectable pancreatic or periampullary cancer. Moreover, four studies (Paquet 1998; Seiler 2005; Tran 2004; Wenger 1999) provided data on resection margin status after PPW or CW, respectively: All studies showed a balanced interstudy and intrastudy distribution of R0 resections—resections without microscopical tumour remnants (mean R0 resection was 91% (standard deviation (SD) = 12.4) in the PPW group and 90.4% (SD = 11.2) in the CW group). In addition, we observed a similar distribution of positive lymph node status in three studies (mean positive lymph node status was 54.3% (SD = 6.7) in the PPW group and 60.4% (SD = 10.1) in the CW group) (Seiler 2005; Tran 2004; Wenger 1999).
Regarding perioperative management, we observed non‐standardised administration of somatostatin with regard to dosage, route, frequency and duration. Two of the seven RCTs reported the use of octreotide (100 to 200 micrograms) (Seiler 2005; Tran 2004). No information about the application of erythromycin was available. In the trial by Tran et al (Tran 2004), 10 participants in the CW group and nine in the PPW group received postoperative radiochemotherapy, whereas no participants received adjuvant treatment in one trial by Lin et al (Lin 1999). No reports about adjuvant treatment were available for the other trials.
Excluded studies
From the systematic literature search, we retrieved 2541 abstracts. During this process of study selection, we excluded 2518 (1212 + 129 + 558 + 619) screened abstracts. Of the remaining 23 (23 + 0) screened full articles, 16 (16 + 0) did not fulfil the inclusion criteria. Most of the excluded articles did not cover surgical aspects of the comparison of PPW and CW, nor did they provide quantitative data on the prespecified outcome parameters. A study flow diagram is presented in Figure 3. See Characteristics of excluded studies for details.
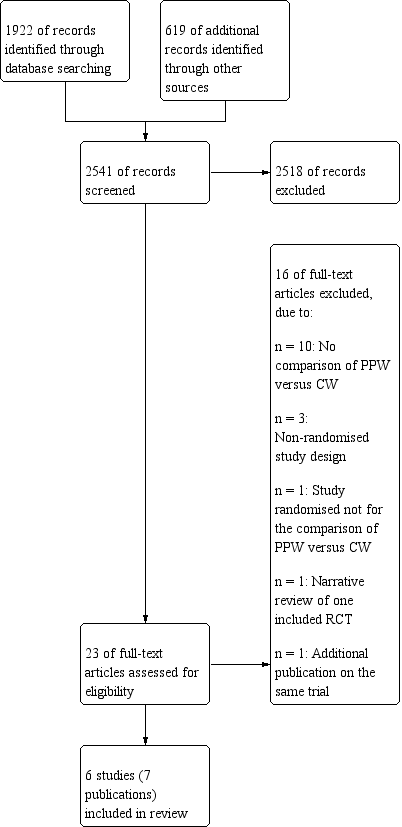
Study flow diagram.
Risk of bias in included studies
Our methodological appraisal of the individual studies revealed vast heterogeneity in study design. Only in the two largest trials (130 (Seiler 2005) and 170 (Tran 2004) participants, respectively) was the underlying sample size calculation described. Tran et al stated that at least 65 participants had to be included in each group to show 30% less blood loss and a 20% decrease in operation time in the PPW group, with α = 0.05 and β = 0.05. The study authors regarded this number as sufficient to demonstrate a reduction in hospital stay as well. The power calculation in the trial conducted by Seiler et al indicated that 58 participants needed to be enrolled for each procedure to detect a 25% difference in morbidity, with α = 0.05 and β = 0.2. The number of participants included was not justified in the other five trials.
Statistical analysis was performed in one trial (Tran 2004) according to the intention‐to‐treat principle; the other trials were analysed per‐protocol.
Publication bias was assessed by creating funnel plots for overall survival, mortality and pancreatic fistula, the last of which is the most common cause of postoperative morbidity. As fewer than 10 trials were included in all analyses (overall survival N = 3; mortality N = 5; pancreatic fistula N = 5), we inspected funnel plots for potential publication bias only. As a result, we did not observe asymmetry in any plot (Figure 4, Figure 5 and Figure 6).

Funnel plot of comparison: 1 Survival, outcome: 1.1 Overall.

Funnel plot of comparison: 2 Mortality, outcome: 2.1 Postoperative mortality.

Funnel plot of comparison: 3 Pancreatic fistula, outcome: 3.1 Pancreatic fistula.
Summary of findings tables for mortality, intraoperative blood loss and operating time, created on the basis of GRADE (Grades of Recommendation, Assessment, Development and Evaluation) criteria (GRADE 2008), showed low quality of evidence for all of these results (summary of findings Table 2, summary of findings Table 3 and summary of findings Table 4).
Allocation
No description of the sequence generation process was given in any of the trials. Tran et al (Tran 2004) described appropriate allocation concealment. Information about allocation concealment is missing for the other trials.
Blinding
None of the trials reported blinded outcome assessment.
Incomplete outcome data
We evaluated follow‐up quality by assessing the follow‐up sequence and the duration of follow‐up. Median follow‐up together with a range was reported in three trials (Bloechle 1999; Seiler 2005; Tran 2004) and varied from 18 months (Bloechle 1999) to 63.1 months (Seiler 2005). Two trials provided no information on follow‐up (Lin 1999; Paquet 1998). Withdrawals or losses to follow‐up were not reported in the trials.
Selective reporting
The trials by Seiler et al and Tran et al (Seiler 2005; Tran 2004) provided the most comprehensive definitions for analysed outcomes. Five trials did not specify adequately the criteria for the stated endpoints.
Effects of interventions
See: Summary of findings for the main comparison Survival after surgical treatment for periampullary or pancreatic carcinoma; Summary of findings 2 Mortality after surgical treatment for periampullary or pancreatic carcinoma; Summary of findings 3 Intraoperative blood loss in surgical treatment of patients with periampullary or pancreatic carcinoma; Summary of findings 4 Operating time in surgical treatment for periampullary or pancreatic carcinoma
Survival
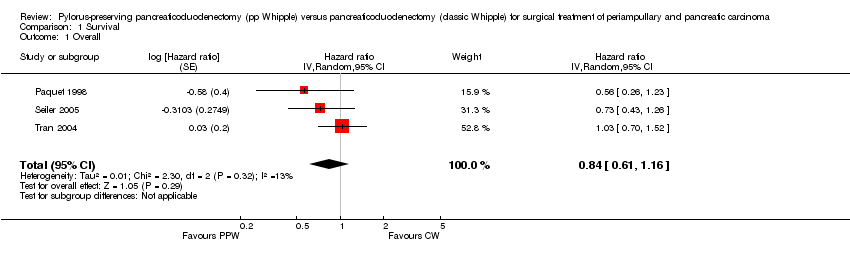
Four studies (Lin 1999; Paquet 1998; Seiler 2005; Tran 2004) provided survival data suitable for the meta‐analysis: Long‐term results (60 months (Paquet 1998; Lin 1999; Tran 2004) and 36 months (Seiler 2005) actuarial Kaplan‐Meier analysis) from a total of 317 participants (152 PPW, 165 CW) were evaluated by comparing hazard ratios (HRs) and corresponding 95% confidence intervals (CIs) using the random‐effects model. We calculated HRs from survival rates at different time points as they were given in the Kaplan‐Meier curves according to the method described by Parmar et al (Parmar 1998). Three trials presented Kaplan‐Meier curves for periampullary and pancreatic head carcinoma together (Paquet 1998; Seiler 2005; Tran 2004). This analysis is based on the data provided for 284 participants (138 PPW, 146 CW). No significant differences could be observed in the pooled results (HR 0.84, 95% CI 0.61 to 1.16; P value 0.29) (Analysis 1.1).
Three trials with 203 participants (98 PPW, 105 CW) presented Kaplan‐Meier curves for those with pancreatic head carcinoma (Lin 1999; Seiler 2005; Tran 2004). Pooled results revealed no significant differences in survival (HR 0.73, 95% CI 0.43 to 1.22; P value 0.23) (Analysis 1.2).
Two trials with 74 participants (37 PPW; 37 CW) presented Kaplan‐Meier curves for periampullary carcinoma (Seiler 2005; Tran 2004), but the pooled HR showed no significant difference in survival for both groups (HR 0.83, 95% CI 0.39 to 1.76; P value 0.63) (Analysis 1.3).
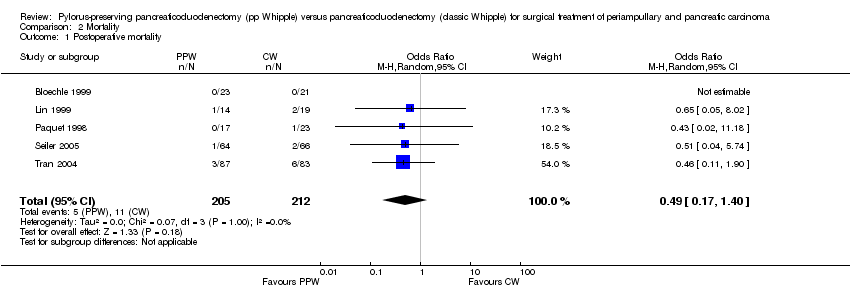
Mortality
Mortality showed similar ranges in the PPW group (0% (Bloechle 1999) to 7.1% (Lin 1999)) and the CW group (0% (Bloechle 1999; Lin 1999) to 7% (Tran 2004)), respectively. The overall effect estimate of 205 (PPW) versus 212 (CW) participants revealed no significant differences in mortality (OR 0.49, 95% CI 0.17 to 1.40; P value 0.18; I2 = 0% data heterogeneity) (Analysis 2.1).
Parameters of morbidity
Data on pancreas‐associated morbidity were inconclusive owing to broad ranges for rates of occurrence for pancreatic fistula, delayed gastric emptying and biliary leakage. For more specific differentiation of the presumed underlying heterogeneity, we performed a meta‐analysis of these parameters.
Pancreatic fistula
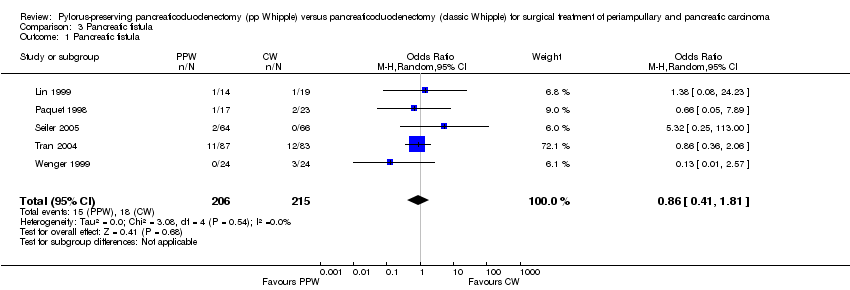
The fistula rate showed no differences between groups: 15 of 206 participants undergoing a PPW (7.2%) versus 18 of 215 participants in the CW group (8.4%) (OR 0.86, 95% CI 0.41 to 1.81; P value 0.68; I2 = 0%). Tran et al defined a pancreatic fistula as drainage of more than 50 mL of amylase‐rich fluid per day through surgically placed drains on or after postoperative day 10, or as pancreatic anastomotic disruption demonstrated radiographically (Tran 2004). Seiler et al defined it as secretion of 30 mL or more of amylase‐rich drainage fluid (more than 5000 units/L) per day for at least 10 days (Seiler 2005). No definition was given in the other trials (Lin 1999; Paquet 1998; Wenger 1999) (Analysis 3.1). Although the I2 statistic showed no heterogeneity, the pooled results must be regarded with caution owing to the various definitions reported. Butturini et al showed that the incidence of pancreatic fistula varied from 10% to 28.5% within the same group of participants when different common definitions were applied (Butturini 2006).
Delayed gastric emptying (DGE)
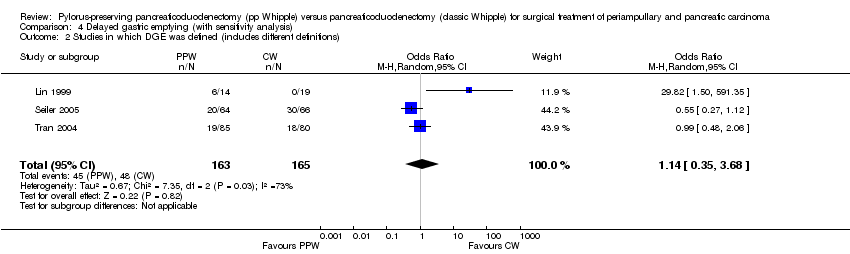
Five studies (Bloechle 1999; Lin 1999; Paquet 1998; Seiler 2005; Tran 2004) provided data from 412 participants (203 PPW, 209 CW) on the occurrence of DGE. Lin et al (2005) and Tran et al used the same definition for DGE (gastric stasis requiring nasogastric intubation for 10 or more days), whereas Seiler et al defined it in a different way (persistent drainage via the nasogastric tube of more than 500 mL/d for at least five days after surgery, or recurrent vomiting in combination with oedema of the gastrojejunostomy or duodenojejunostomy and proximal dilatation on contrast radiography). No definition was given in the other trials. Owing to considerable statistical heterogeneity of 75.6% in the I2 statistic, we performed a sensitivity analysis that included studies only according to their definition of DGE, because it is well known that the rate of DGE varies with the underlying definition (Butturini 2006), but we could not explain the heterogeneity.
The conclusions were similar if only studies with the same definition of DGE were included (OR 4.02, 95% CI 0.14 to 119.16; P value 0.42; I2 = 80%) (Analysis 4.3), or if all studies that provided a definition for DGE were included (OR 1.14, 95% CI 0.35 to 3.68; P value 0.82; I2 = 72.8%) (Analysis 4.2). In the first case, the data for 198 participants were analysed (PPW 99, CW 99), and in the second case, the data for 238 participants were analysed (163 PPW, 165 CW).
Another factor that could account for the observed heterogeneity might be the different applications of drugs. Participants in the trials that showed no difference between treatment groups or that favoured PPW received octreotide (Seiler 2005; Tran 2004), whereas no participants in the trial by Lin et al were treated with octreotide. No statement about the application of drugs was provided for the two trials that favoured the CW group (Bloechle 1999; Paquet 1998). Owing to these restrictions, the following pooled results have to be regarded with care. Three studies (Bloechle 1999; Lin 1999; Paquet 1998) favoured CW, and one favoured PPW (Seiler 2005); one study (Tran 2004) reported equal rates for DGE. Pooling of these individual results revealed 59 participants of 203 (29.0%) with DGE in the PPW group compared with 51 of 209 (24.4%) in the CW group (OR 2.35, 95% CI 0.72 to 7.61; P value 0.16; I2 = 75.6%) (Analysis 4.1).
Biliary leakage
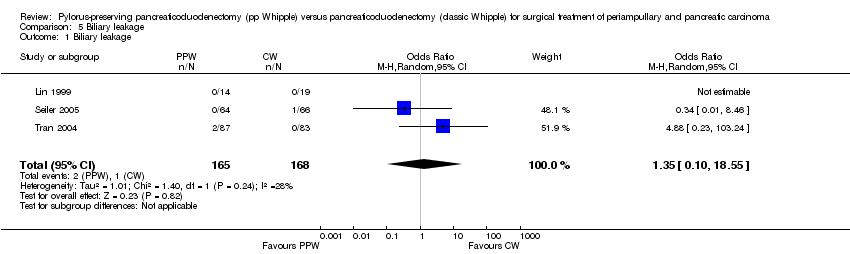
The summarised effect size of three RCTs (Lin 1999; Seiler 2005; Tran 2004) comparing biliary leakage after PPW and CW showed no differences: two of 165 (1.2%) in the PPW group versus one of 168 (0.5%) in the CW group (OR 1.35, 95% CI 0.10 to 18.55; P value 0.82; I2 = 28.3%) (Analysis 5.1).
Perioperative parameters
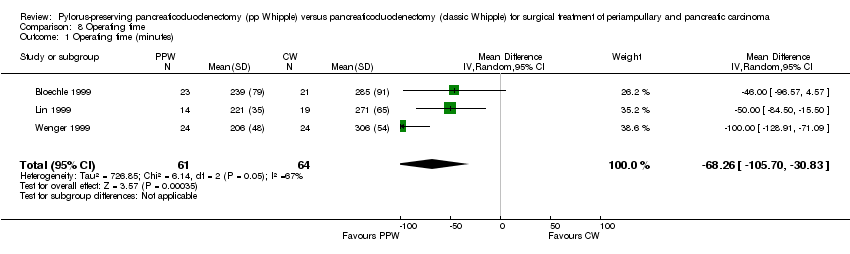
A meta‐analysis of perioperative parameters such as blood loss, red blood cell transfusion, operating time and duration of hospital stay for three RCTs (Bloechle 1999; Lin 1999; Wenger 1999) demonstrated a significant reduction in operating time (minutes) for the PPW operation (MD ‐68.26, 95% CI ‐105.7 to ‐30.83; P value 0.0004; I2 = 67.5% data heterogeneity). This analysis is based on data from 125 participants (61 PPW, 64 CW) (Analysis 8.1).
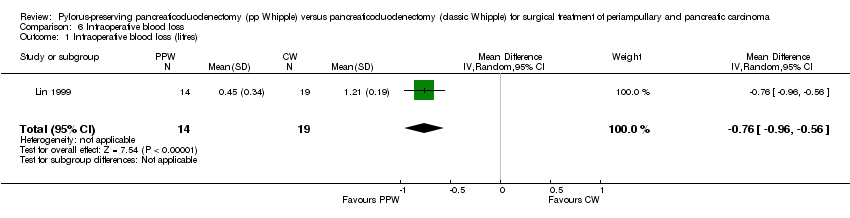
The amount of intraoperative blood loss was analysed in 33 participants (14 PPW, 19 CW) in only one trial (Lin 1999). Blood loss was significantly reduced in the PPW group (MD ‐0.76, 95% CI ‐0.96 to ‐0.56; P value less than 0.00001) (Analysis 6.1).
In contrast, the summarised effect estimate of blood replacement (units) indicates similar application of blood products intraoperatively (MD ‐0.65, 95% CI ‐1.92 to 0.61; P value 0.31; I2 = 0% data heterogeneity) (Analysis 7.1). This result is based on data from 79 participants in two studies (PPW 40, CW 39) (Lin 1999; Wenger 1999).
Postoperative bleeding
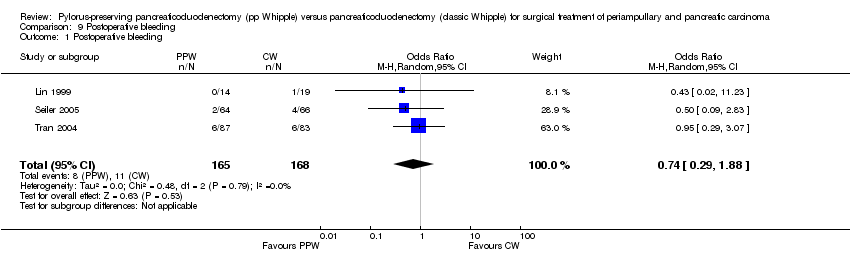
Three studies (Lin 1999; Seiler 2005; Tran 2004) evaluated postoperative bleeding. Eight of 165 participants (4.8%) in the PPW groups and 11 of 168 participants (6.5%) in the CW groups were identified; this finding was not statistically significant (OR 0.74, 95% CI 0.29 to 1.88; P value 0.53; I2 = 0%) (Analysis 9.1).
Wound infection
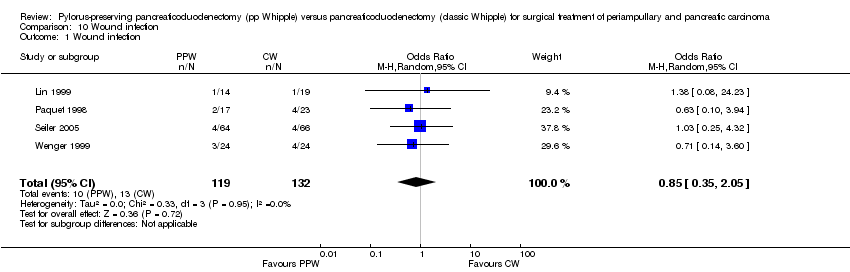
Wound infection yielded similar results and occurred in 10 of 119 participants in the PPW groups (8.4%) and in 13 of 132 participants in the CW groups (9.8%) (OR 0.85, 95% CI 0.35 to 2.05; P value 0.72; I2 = 0%) (Analysis 10.1). Four trials reported incidences of wound infection but without definition (Lin 1999; Paquet 1998; Seiler 2005; Wenger 1999).
Pulmonary complications
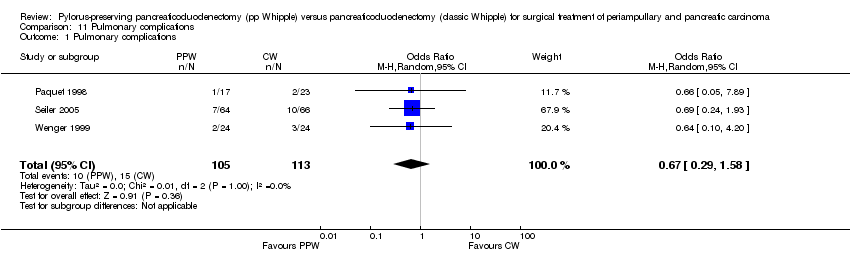
Three trials reported pulmonary complications. Data for 218 participants were analysed (105 PPW, 113 CW). Wenger et al and Paquet et al (Paquet 1998; Wenger 1999) specified it as pneumonia, and Seiler et al referred to it as 'pulmonary morbidity' (Seiler 2000). No significant differences between PPW and CW groups could be identified (OR 0.67, 95% CI 0.29 to 1.58; P value 0.36) (Analysis 11.1).
Necessity for reoperation
Seiler et al and Tran et al reported this outcome (Seiler 2005; Tran 2004). In total, 15 of 151 participants in the PPW groups (9.9%) and 17 of 149 participants in the CW groups (11.4%) required reoperation. This result did not show statistical significance (OR 0.82, 95% CI 0.38 to 1.75; P value 0.6) (Analysis 12.1).
Duration of hospital stay
The duration of hospital stay (days) showed similar results in both groups (MD ‐1.80, 95% CI ‐8.94 to 5.34; P value 0.62), with only one article providing adequate data for pooling (Wenger 1999). Results of this analysis are based on data from 48 participants (24 PPW, 24 CW) (Analysis 13.1).
Quality of life (QoL)
Owing to the use of different QoL questionnaires, it was impossible to pool these data quantitatively. Thus we present a qualitative overview of QoL results by operative procedure.
Three RCTs reported outcomes for QoL (Bloechle 1999; Seiler 2005; Wenger 1999). Bloechle et al and Wenger et al used the European Organization for Research and Treatment of Cancer (EORTC)‐QLQ‐30 questionnaire in their RCTs, but only Wenger et al used the recommended pancreas‐specific module QLQ‐PAN 26 (Fitzsimmons 1998). The data from each RCT show no difference in QoL by procedure or a better QoL score after the PPW operation.
In the trial by Wenger et al, QoL was assessed preoperatively and after 2, 4, 6, 24, 36, 48 and 60 weeks. Participants in the PPW group scored significantly better on loss of appetite, nausea and vomiting, diarrhoea and weight gain. No significant difference in overall QoL was noted.
Bloechle et al did not specify the assessment time points but, like Wenger, reported a significantly better score for participants in the PPW group on loss of appetite and weight gain but no difference in overall QoL, diarrhoea, nausea and vomiting.
Seiler et al assessed QoL preoperatively using the Sickness Impact Profile and again after 6, 12, 18 and 24 months. This group found no differences in postoperative weight gain or overall QoL but did report that ability to work after six months was better for participants in the PPW group than for those in the CW group.
Discussion
Summary of main results
Preservation of the pylorus in patients undergoing duodenopancreatectomy for cancer has been a controversial issue for the past decade. Numerous studies have been performed, including several randomised controlled trials (RCTs), but the cumulative knowledge gained from these needed to be captured in a quantitative summary of the results to establish whether or not pylorus‐preserving pancreaticoduodenectomy (PPW) is a better technique than the classic Whipple (CW) operation.
From a curative perspective, no evidence of superiority of one procedure over the other could be found in this systematic review and meta‐analysis. Pooled long‐term results of four RCTs showed no differences in terms of overall survival (hazard ratio (HR) 0.84; P value 0.29).
Differences in mortality and morbidity between the two techniques are not statistically significant. As for surgical and clinically relevant parameters of morbidity, we found in particular no significant differences for the occurrence of pancreatic fistula (odds ratio (OR) 0.86; P value 0.68), biliary leakage (OR 1.35; P = 0.82) or postoperative bleeding (OR 0.74; P = 0.53). A trend suggests that PPW may reduce mortality, but these results were not statistically significant. Lack of statistical significance could be due to inclusion of insufficient numbers in randomised trials. Even if a difference in mortality rates between types of operations was reported, it would be unlikely that the difference would be huge.
The significant reduction in operating time for the PPW (mean difference (MD) ‐68.26; P value 0.0004) is an advantage of the PPW in terms of cost, but the benefits of this reduced operation time for postoperative morbidity (e.g. pulmonary and cardiac complications) are unclear.
Results of the analysis of duration of hospital stay (Wenger 1999) should be interpreted with caution because the distribution of this outcome is known to be skewed, and because the sample size is small. It is also unclear whether the study authors included in their calculations participants who died during their hospital stay, as no data on mortality are presented in this article.
Overall completeness and applicability of evidence
Our findings are in line with those of a recently published study from Bassi et al (Bassi 2005a), in which survival data were correlated with type of surgery by multi‐variate analysis. These results indicated that neither the type of surgery (PPW vs CW: HR 0.8; P value 0.078) nor the occurrence of postoperative complications significantly affected the hazard of death once tumour staging was taken into account (grade, nodal status and maximum tumour size). As shown by Neoptolemos et al (Neoptolemos 2001), it was not resection margin status R0/R1 but rather tumour grade and lymph node status that were by far the most powerful prognostic factors of survival.
In terms of delayed gastric emptying (DGE), previous reports of non‐randomised cohort studies (Mosca 1997; Roder 1992) stating higher rates after the PPW procedure could not be confirmed by the results of prior RCTs and our meta‐analysis. Three of the seven included studies (Bloechle 1999; Lin 1999; Paquet 1998) showing higher rates of DGE in the PPW group were the smallest. Given a non‐significant difference for the occurrence of DGE when all included studies are considered (29.0% PPW vs 24.4% CW; OR 2.35; P value 0.16), this result indicates that underpowered studies potentially overestimate the benefits of CW for the outcome of DGE.
If PPW and CW are equally effective regarding survival, mortality and morbidity, QoL could become the crucial factor in comparisons between the two procedures. Although three of the seven trials report QoL as an outcome, no conclusion can be reached because different questionnaires administered at different time points were used, and only sparse information about assessment of QoL is available in the study by Bloechle et al (Bloechle 1999).
Quality of the evidence
Given obvious sources of potential bias in the included trials, such as small sample sizes, varying or missing definitions of outcome parameters and inexplicit methods of randomisation and allocation concealment, our results should be interpreted with caution. We observed no clear differences between PPW and CW techniques. However, to demonstrate potential superiority of one or the other technique, much larger and rigorously designed studies than are currently available would be needed. This highlights the urgent need for the development of standardised RCTs for complex interventions. Moreover, these trials should rely on evidence‐based consensus definitions of surgical interventions and their outcome parameters.
Potential biases in the review process
Systematic reviews currently provide the best method of summarising existing evidence, but the quality of such reviews depends on the quality of the primary studies (Egger 1997b; Mulrow 1994). Thus, the reviewed studies are partially marred by bias and clinical heterogeneity, and this may distort results.
Our Cochrane highly sensitive search strategy was approved by an expert in the field (GA), but it may still be biased. In an attempt to identify all relevant studies, we contacted experts in pancreatic surgery and in clinical research to identify ongoing trials. However, these efforts revealed no additional studies.
The fact that the randomisation process was carried out differently in the reviewed studies can be considered as a source of bias, because adequate randomisation and allocation concealment generate balanced groups for known, unknown and unmeasured confounders. Three of the seven included studies (Paquet 1998; Seiler 2005; Tran 2004) provided adequate descriptions of the randomisation process, whereas the other four studies failed to describe the method of allocation satisfactorily.
Moreover, maintenance of allocation concealment and blinding of the outcome assessor were specified in only two trials (Seiler 2005; Tran 2004).
In addition, median follow‐up and follow‐up sequences varied significantly between individual studies (median follow‐up 18 months (Bloechle 1999) to 144 months (Paquet 1998)). This insufficient reporting on inconsistent follow‐up sequences is a possible indicator of performance bias.
Furthermore, we found varying or even missing definitions of surrogate parameters such as pancreatic fistula and DGE. The trials by Seiler et al and Tran et al provided the most comprehensive definitions (Seiler 2005; Tran 2004). The other trials did not specify the criteria of their endpoints at all. The heterogeneous definition of outcome parameters may have caused detection bias.
Internationally accepted scaled definitions for surgical outcome parameters in pancreatic cancer surgery are lacking. Efforts such as the consensus conference of the International Study Group for Definition of Postoperative Pancreatic Fistula or Definition of Post‐Pancreatectomy Haemorrhage should be encouraged, to decrease interobserver variability (Bassi 2005b; Wente 2007).
Regarding the use of antibiotics, somatostatin, drains, nasogastric tubes, etc., we observed a non‐standardised therapeutic concept or even non‐reporting with respect to dosage, route, frequency and duration of administration. Thus, the considerable variation in perioperative management is a further indicator of interstudy heterogeneity, and this may influence the external validity of the summarised results.
Another possible source of bias lies in the statistical analysis. Only one trial (Tran 2004) used an intention‐to‐treat approach, whereas the six remaining trials applied per‐protocol analysis. This distorted analysis of participants lost to follow‐up or missing information on excluded participants (attrition bias) makes it difficult to decide whether the remaining study population is representative (external validity). Moreover, statistical analysis of obviously underpowered trials (four trials (Bloechle 1999; Lin 1999; Paquet 1998; Wenger 1999) represent only 40% of the total number of participants) reduces the explanatory power of these results. A power calculation was reported for only two trials (Seiler 2005; Tran 2004), and some of the results may not reach statistical significance owing to the lack of an appropriate number of participants.
In this context, we should point out that we did not investigate the influence of neoadjuvant and adjuvant treatment because relevant data were not reported in an interpretable way in the reviewed studies. Our results may therefore be biased, because adjuvant treatment (e.g. chemotherapy, chemoradiation) represents a possible confounder with an impact on survival, mortality and morbidity.
In spite of the sources of clinical and methodological heterogeneity already mentioned, we still observed adequately balanced groups when we compared interstudy baseline population characteristics: All analysed participants were included because of suspected pancreatic or periampullary carcinoma. Our systematic review also revealed a balanced distribution of R0/R1 resections (mean R0 resection: 91.1% (PPW), 90.4% (CW)) and lymph node status (mean positive lymph node status: 54.4% (PPW), 60.3% (CW)). The calculated average level of statistical heterogeneity of all 15 meta‐analytical approaches indicated moderate heterogeneity of 11.3% (I2 statistic). Nevertheless, given obvious sources of clinical and methodological heterogeneity, we decided to compute the statistics of our meta‐analysis using the random‐effects model, which allows for variation in the treatment effects of individual studies, while providing a more conservative pooled effect estimate (DerSimonian 1986).
Given the obvious sources of bias, the results of our systematic review and meta‐analyses have to be interpreted with caution. Small sample size, missing definitions of outcome parameters and inexplicit randomisation and allocation concealment are some of the most relevant factors that can produce misleading results.
Seven trials providing high‐level evidence addressing identical surgical problems produced many examples of clinically relevant heterogeneity. This calls for future efforts to overcome current hurdles to achieving standardised RCTs for complex interventions. Moreover, evidence‐based consensus is mandatory to establish refined definitions for surgical interventions and their putative outcome parameters. This systematic review and meta‐analysis of the PPW versus the CW procedure could serve as an ideal basis for the pursuit of such endeavours.
Agreements and disagreements with other studies or reviews
This study agrees with the conclusions of the authors of all included trials (Bloechle 1999; Lin 1999; Paquet 1998; Seiler 2005; Tran 2004; Wenger 1999). It also agrees with the findings of a systematic review and meta‐analysis of randomised trials on this topic (Other published versions of this review).

Risk of bias graph: review authors' judgements about each risk of bias item presented as percentages across all included studies.
Risk of bias summary: review authors' judgements about each risk of bias item for each included study.

Study flow diagram.
Funnel plot of comparison: 1 Survival, outcome: 1.1 Overall.

Funnel plot of comparison: 2 Mortality, outcome: 2.1 Postoperative mortality.

Funnel plot of comparison: 3 Pancreatic fistula, outcome: 3.1 Pancreatic fistula.
Comparison 1 Survival, Outcome 1 Overall.

Comparison 1 Survival, Outcome 2 Pancreatic head carcinoma.

Comparison 1 Survival, Outcome 3 Periampullary cancer.
Comparison 2 Mortality, Outcome 1 Postoperative mortality.
Comparison 3 Pancreatic fistula, Outcome 1 Pancreatic fistula.

Comparison 4 Delayed gastric emptying (with sensitivity analysis), Outcome 1 All studies.
Comparison 4 Delayed gastric emptying (with sensitivity analysis), Outcome 2 Studies in which DGE was defined (includes different definitions).

Comparison 4 Delayed gastric emptying (with sensitivity analysis), Outcome 3 Studies with the same definitions of DGE.
Comparison 5 Biliary leakage, Outcome 1 Biliary leakage.
Comparison 6 Intraoperative blood loss, Outcome 1 Intraoperative blood loss (litres).

Comparison 7 Red blood cell transfusion, Outcome 1 Red blood cell transfusion.
Comparison 8 Operating time, Outcome 1 Operating time (minutes).
Comparison 9 Postoperative bleeding, Outcome 1 Postoperative bleeding.
Comparison 10 Wound infection, Outcome 1 Wound infection.
Comparison 11 Pulmonary complications, Outcome 1 Pulmonary complications.

Comparison 12 Necessity for reoperation, Outcome 1 Necessity for reoperation.

Comparison 13 Hospital stay, Outcome 1 Hospital stay (days).
| Survival after surgical treatment for periampullary or pancreatic carcinoma | ||||||
| Patient or population: patients with surgical treatment of periampullary or pancreatic carcinoma | ||||||
| Outcomes | Illustrative comparative risks* (95% CI) | Relative effect | Number of participants | Quality of the evidence | Comments | |
| Assumed risk | Corresponding risk | |||||
| Control | Survival | |||||
| Overall survival | Medium‐risk population | HR 0.84 | 0 | ⊕⊕⊝⊝ | ||
| *The basis for the assumed risk (e.g. median control group risk across studies) is provided in footnotes. The corresponding risk (and its 95% confidence interval) is based on the assumed risk in the comparison group and the relative effect of the intervention (and its 95% CI). | ||||||
| GRADE Working Group grades of evidence. | ||||||
| aInadequate information about sequence generation and allocation concealment. No intention‐to‐treat analysis. | ||||||
| Mortality after surgical treatment for periampullary or pancreatic carcinoma | ||||||
| Patient or population: patients with surgical treatment for periampullary and pancreatic carcinoma | ||||||
| Outcomes | Illustrative comparative risks* (95% CI) | Relative effect | Number of participants | Quality of the evidence | Comments | |
| Assumed risk | Corresponding risk | |||||
| Control | Mortality | |||||
| Postoperative mortality | Study population | OR 0.49 | 417 | ⊕⊕⊝⊝ | ||
| 52 per 1000 | 26 per 1000 | |||||
| Medium‐risk population | ||||||
| 44 per 1000 | 22 per 1000 | |||||
| *The basis for the assumed risk (e.g. median control group risk across studies) is provided in footnotes. The corresponding risk (and its 95% confidence interval) is based on the assumed risk in the comparison group and the relative effect of the intervention (and its 95% CI). | ||||||
| GRADE Working Group grades of evidence. | ||||||
| aConfidence intervals are wide because of small number of events. No sample size calculation was reported for trials except for Seiler and Tran. | ||||||
| Intraoperative blood loss in surgical treatment of patients with periampullary or pancreatic carcinoma | ||||||
| Patient or population: patients with surgical treatment for periampullary or pancreatic carcinoma | ||||||
| Outcomes | Illustrative comparative risks* (95% CI) | Relative effect | Number of participants | Quality of the evidence | Comments | |
| Assumed risk | Corresponding risk | |||||
| Control | Intraoperative blood loss | |||||
| Intraoperative blood loss (litres) | Mean intraoperative blood loss (litres) in the intervention groups was | 33 | ⊕⊕⊝⊝ | |||
| *The basis for the assumed risk (e.g. median control group risk across studies) is provided in footnotes. The corresponding risk (and its 95% confidence interval) is based on the assumed risk in the comparison group and the relative effect of the intervention (and its 95% CI). | ||||||
| GRADE Working Group grades of evidence. | ||||||
| aSmall number of participants. | ||||||
| Operating time in surgical treatment for periampullary or pancreatic carcinoma | ||||||
| Patient or population: patients with surgical treatment for periampullary and pancreatic carcinoma | ||||||
| Outcomes | Illustrative comparative risks* (95% CI) | Relative effect | Number of participants | Quality of the evidence | Comments | |
| Assumed risk | Corresponding risk | |||||
| Control | Operating time | |||||
| Operating time (minutes) | Mean operating time (minutes) in the intervention groups was | 125 | ⊕⊕⊝⊝ | |||
| *The basis for the assumed risk (e.g. median control group risk across studies) is provided in footnotes. The corresponding risk (and its 95% confidence interval) is based on the assumed risk in the comparison group and the relative effect of the intervention (and its 95% CI). | ||||||
| GRADE Working Group grades of evidence. | ||||||
| aSerious limitations in the study design in the trials of Bloechle, Lin and Wenger are a potential source of bias. All are characterised by small sample sizes, lack of blinding and incomplete outcome reporting. | ||||||
| Outcome or subgroup title | No. of studies | No. of participants | Statistical method | Effect size |
| 1 Overall Show forest plot | 3 | Hazard ratio (Random, 95% CI) | 0.84 [0.61, 1.16] | |
| 2 Pancreatic head carcinoma Show forest plot | 3 | Hazard ratio (Random, 95% CI) | 0.73 [0.43, 1.22] | |
| 3 Periampullary cancer Show forest plot | 2 | Hazard ratio (Random, 95% CI) | 0.83 [0.39, 1.76] | |
| Outcome or subgroup title | No. of studies | No. of participants | Statistical method | Effect size |
| 1 Postoperative mortality Show forest plot | 5 | 417 | Odds Ratio (M‐H, Random, 95% CI) | 0.49 [0.17, 1.40] |
| Outcome or subgroup title | No. of studies | No. of participants | Statistical method | Effect size |
| 1 Pancreatic fistula Show forest plot | 5 | 421 | Odds Ratio (M‐H, Random, 95% CI) | 0.86 [0.41, 1.81] |
| Outcome or subgroup title | No. of studies | No. of participants | Statistical method | Effect size |
| 1 All studies Show forest plot | 5 | 412 | Odds Ratio (M‐H, Random, 95% CI) | 2.35 [0.72, 7.61] |
| 2 Studies in which DGE was defined (includes different definitions) Show forest plot | 3 | 328 | Odds Ratio (M‐H, Random, 95% CI) | 1.14 [0.35, 3.68] |
| 3 Studies with the same definitions of DGE Show forest plot | 2 | 198 | Odds Ratio (M‐H, Random, 95% CI) | 4.02 [0.14, 119.16] |
| Outcome or subgroup title | No. of studies | No. of participants | Statistical method | Effect size |
| 1 Biliary leakage Show forest plot | 3 | 333 | Odds Ratio (M‐H, Random, 95% CI) | 1.35 [0.10, 18.55] |
| Outcome or subgroup title | No. of studies | No. of participants | Statistical method | Effect size |
| 1 Intraoperative blood loss (litres) Show forest plot | 1 | 33 | Mean Difference (IV, Random, 95% CI) | ‐0.76 [‐0.96, ‐0.56] |
| Outcome or subgroup title | No. of studies | No. of participants | Statistical method | Effect size |
| 1 Red blood cell transfusion Show forest plot | 2 | 79 | Mean Difference (IV, Random, 95% CI) | ‐0.65 [‐1.92, 0.61] |
| Outcome or subgroup title | No. of studies | No. of participants | Statistical method | Effect size |
| 1 Operating time (minutes) Show forest plot | 3 | 125 | Mean Difference (IV, Random, 95% CI) | ‐68.26 [‐105.70, ‐30.83] |
| Outcome or subgroup title | No. of studies | No. of participants | Statistical method | Effect size |
| 1 Postoperative bleeding Show forest plot | 3 | 333 | Odds Ratio (M‐H, Random, 95% CI) | 0.74 [0.29, 1.88] |
| Outcome or subgroup title | No. of studies | No. of participants | Statistical method | Effect size |
| 1 Wound infection Show forest plot | 4 | 251 | Odds Ratio (M‐H, Random, 95% CI) | 0.85 [0.35, 2.05] |
| Outcome or subgroup title | No. of studies | No. of participants | Statistical method | Effect size |
| 1 Pulmonary complications Show forest plot | 3 | 218 | Odds Ratio (M‐H, Random, 95% CI) | 0.67 [0.29, 1.58] |
| Outcome or subgroup title | No. of studies | No. of participants | Statistical method | Effect size |
| 1 Necessity for reoperation Show forest plot | 2 | 300 | Odds Ratio (M‐H, Random, 95% CI) | 0.82 [0.38, 1.75] |
| Outcome or subgroup title | No. of studies | No. of participants | Statistical method | Effect size |
| 1 Hospital stay (days) Show forest plot | 1 | 48 | Mean Difference (IV, Random, 95% CI) | ‐1.80 [‐8.94, 5.34] |