Intervenciones en el domicilio para prevenir la exposición doméstica al plomo en niños
Referencias
Referencias de los estudios incluidos en esta revisión
Referencias de los estudios excluidos de esta revisión
Referencias adicionales
Referencias de otras versiones publicadas de esta revisión
Characteristics of studies
Characteristics of included studies [ordered by study ID]
Ir a:
| Study characteristics | ||
| Methods | Study design: RCT Study location/setting: Boston, USA. Urban area Recruitment: children were screened for lead from May 1993 to April 1995 Follow‐up: 6 months from baseline Intention‐to‐treat: available‐case analysis Power calculation: performed to determine number of participants (required number not recruited) | |
| Participants | Eligibility criteria
Participation rate: 63/402 (16%) enrolled, of whom 41 were randomised (22 intervention, 19 control); 22 other participants at high risk were automatically assigned to the intervention and therefore were not considered in this Cochrane Review Reason for non‐participation: 163 unreachable; 64 unable to communicate due to language barriers; 112 refused to participate (demographic characteristics similar between participants and non‐participants) Analysis: 24/41 (59%) for BLLs, 22/41 (54%) for household dust Number of dropouts/withdrawals: 17 BLLs, 19 household dust lead levels Reasons for dropout/withdrawal: children were excluded because no 6‐month follow‐up blood samples were taken, their homes received non‐study environmental interventions or they received chelation therapy (no specific numbers per reason were reported for the randomised children that dropped out) Intervention baseline characteristics (available for n = 11)
Control baseline characteristics (available for n = 13)
| |
| Interventions | Intervention (low technology lead hazard reduction)
Control
| |
| Outcomes |
| |
| Notes | Funding: this research was supported by a co‐operative agreement (Grant H64/CCH108235‐03) with the CDC, Atlanta, GA Conflicts of interest: none declared Other comments
| |
| Risk of bias | ||
| Bias | Authors' judgement | Support for judgement |
| Random sequence generation (selection bias) | Low risk | Quote from correspondence with author: "an open list of random numbers." |
| Allocation concealment (selection bias) | High risk | Quote from correspondence with author: "open list." |
| Blinding of participants and personnel (performance bias): objective outcomes | Low risk | Quote from correspondence with author: "the subjects and the investigators interacting with the subjects knew which group they were assigned to." Comment: we rated this domain at low risk of bias because BLLs and household dust lead measures are unlikely to be influenced by participants' knowledge about treatment allocation. |
| Blinding of outcome assessment (detection bias) | Low risk | Quote from correspondence with author: "lab analysers were blinded." |
| Incomplete outcome data (attrition bias) | High risk | Comment: high attrition rate (41%) and high differential attrition. Attrition rate was 18% points higher in the intervention group than in the control group. |
| Incomplete outcome data (attrition bias) | High risk | Comment: high attrition rate (46%) and high differential attrition. Attrition rate was 27% points higher in the intervention group than in the control group. |
| Selective reporting (reporting bias) | Unclear risk | Comment: insufficient information. |
| Other bias | Low risk | Comment: study appeared free from other sources of bias. |
| Study characteristics | ||
| Methods | Study design: RCT Study location/setting: Australia. Mining community Recruitment: October 1994 to August 1996 Follow‐up: 12 months from baseline Intention‐to‐treat: available‐case analysis Power calculation: performed to determine number of participants (required number not recruited) | |
| Participants | Eligibility criteria
Participation rate: 103/365 (28%). 365 were eligible for remediation, 117 enrolled in remediation programme and 103 were eligible for randomisation (all children with a BLL ≥ 30.0 μg/dL were offered immediate home remediation, and therefore were not part of the randomisation). Of the 103 children, 90 were matched by age and BLL range and were randomised (45 intervention, 45 control) Reason for non‐participation: 13 were unable to be adequately matched Analysis: 88/90 (98%) blood levels analysed Number of dropouts/withdrawals: 2 Reasons for withdrawal: no blood samples for either participant Baseline data available for all children randomised
Baseline characteristics not reported separately for intervention and control group | |
| Interventions | Intervention (home remediation work)
Control
| |
| Outcomes |
(Internal floor dust quintile only used to examine dose‐response effects) | |
| Notes | Funding: Australian Government Department of Health and Ageing Conflicts of interest: none declared Other comments
| |
| Risk of bias | ||
| Bias | Authors' judgement | Support for judgement |
| Random sequence generation (selection bias) | Low risk | Quote from correspondence with author: "children were matched in pairs and then a coin tossed to see which would be the 'case' and have their home re‐mediated first." |
| Allocation concealment (selection bias) | Unclear risk | Comment: insufficient information. |
| Blinding of participants and personnel (performance bias): objective outcomes | Low risk | Comment: no information provided on blinding. However, we rated this domain at low risk of bias because BLLs and household dust lead measures are unlikely to be influenced by participants' knowledge about treatment allocation. |
| Blinding of outcome assessment (detection bias) | Low risk | Quote from correspondence with author: "lab analysers were blinded." |
| Incomplete outcome data (attrition bias) | Low risk | Comment: attrition rate was low (2%). |
| Selective reporting (reporting bias) | Low risk | Comment: study protocol NA, but the published reports included all expected outcomes, including those that were prespecified and confirmed by investigator. |
| Other bias | Low risk | Comment: study appeared free from other sources of bias. |
| Study characteristics | ||
| Methods | Study design: RCT (embedded in the HOME cohort study) Study location/setting: Cincinnati, Ohio, USA; urban, suburban and rural areas Recruitment: pregnant women attending 1 of 9 antenatal care clinics affiliated with 3 hospitals between 1 March 2003 and 31 January 2006 Follow‐up: at 1, 2, 3, 4, 5 and 8 years of age Analysis: intention‐to‐treat and per‐protocol Power calculation: 80% power to detect a 3.4‐point difference in IQ with 180 children per group and 3.4 µg/dL difference in blood lead concentration between the intervention and control groups | |
| Participants | Eligibility criteria for mothers
Participation rate: 355 pregnant women randomised (174 intervention group, 181 control group) Reason for non‐participation: not interested, dropped out in run‐in period, landlords refused Analysis: 320/355 (90.1% analysed) Number of dropouts/withdrawals: 35/355 (9.9%) Reasons for dropout/withdrawals: not reported Intervention baseline characteristics
Control baseline characteristics
| |
| Interventions | Intervention
Control
| |
| Outcomes |
| |
| Notes | Funding: supported by grants from the National Institutes of Environmental Health Sciences, the US Environmental Protection Agency, and the US HUD Conflicts of interest: Dr Lanphear reported serving as an expert witness in childhood lead poisoning cases for which he has not received any compensation. Dr Braun reported being financially compensated for conducting a re‐analysis of a child lead exposure study for the plaintiffs in a public nuisance childhood lead poisoning case. No other disclosures were reported. | |
| Risk of bias | ||
| Bias | Authors' judgement | Support for judgement |
| Random sequence generation (selection bias) | Low risk | Quote from report: "Using random number generation, we assigned the remaining 355 women (75.8%) in blocks of 10" (p. 935). |
| Allocation concealment (selection bias) | Low risk | Quote from report: "sealed the assignment codes in radio‐opaque envelopes until the research assistants confirmed each participant's eligibility" (p. 935). |
| Blinding of participants and personnel (performance bias): objective outcomes | Low risk | Comment: according to the protocol (supplement 1), the trial was a nested, randomised, single‐blinded trial. We could not find any additional information on blinding in the protocol. We rated this domain at low risk of bias for objective outcomes because BLLs and household dust lead measures are unlikely to be influenced by participants' knowledge about treatment allocation. |
| Blinding of participants and personnel (performance bias): subjective outcomes | Unclear risk | Comment: according to the protocol (supplement 1), the trial was a nested, randomised, single‐blind trial. We could not find any additional information on blinding in the protocol. We rated this domain as unclear risk for subjective outcomes, because neurobehavioural outcomes could be influenced by lack of blinding. |
| Blinding of outcome assessment (detection bias) | Unclear risk | Comment: no information if outcome assessors were blinded. According to the protocol (supplement 1), the trial was a nested, randomised, single‐blind trial. We could not find any additional information on blinding in the protocol, so we rated the risk of detection bias unclear for subjective and objective outcomes. |
| Incomplete outcome data (attrition bias) | Low risk | Comment: low attrition rate (9.9%) and low differential attrition (for BLL and neurobehavioural outcomes). Attrition rate was 10.3% in the intervention group and 9.4% in the control group (0.9 percentage points difference). |
| Incomplete outcome data (attrition bias) | Low risk | Comment: low attrition rate (9.9%) and low differential attrition. Attrition rate was 10.3% in the intervention group and 9.4% in the control group (0.9 percentage points difference). |
| Selective reporting (reporting bias) | Low risk | Comment: trial protocol was registered in ClinicalTrial.gov and provided as supplement 1. |
| Other bias | Low risk | Comment: study appeared free from other sources of bias. |
| Study characteristics | ||
| Methods | Study design: RCT Study location/setting: Rhode Island, USA. Urban area Recruitment: all children who were identified through routine blood lead testing as having venous BLLs of 15.0–19.0 µg/dL, and reported to Rhode Island Department of Health between July 1999 and June 2002, were referred to the study Follow‐up: 12 months from baseline Intention‐to‐treat analysis: available‐case analysis Power calculation: performed to determine number of participants (required number recruited) | |
| Participants | Eligibility criteria
Participation rate: 175/241 (73%) consented to participate and were randomised (92 intervention, 83 control) Reason for non‐participation: 66 refused due to work and school responsibilities (no breakdown in figures per reason reported) Analysis: 145/175 (83%) analysed BLL, 153/175 floor dust lead levels Number of dropouts/withdrawals: 30 BLL, 22 floor dust lead levels Reasons for dropout/withdrawal: 9 children moved away, 2 were lost to follow‐up, 9 parents refused participation of their child during the study, 2 refused first and all subsequent visits. No reason for dropout/withdrawal was reported for 8 children Intervention baseline characteristics (available for n = 90)
Control baseline characteristics (n = 83)
Sex of children not reported | |
| Interventions | Intervention
Control
| |
| Outcomes |
(Questionnaires on lead exposures) | |
| Notes | Funding: sponsored in part by CDC (grant TS 275 14/14) and Maternal and Child Health Bureau (grant 5T76 MC 00001; formerly MCJ201) Conflicts of interest: none declared | |
| Risk of bias | ||
| Bias | Authors' judgement | Support for judgement |
| Random sequence generation (selection bias) | Low risk | Quote from report: "[r]andom numbers table was used to assign cases to either the intervention or the comparison group, sequentially" (p. 148). |
| Allocation concealment (selection bias) | Low risk | Quote from report: "group assignments were sealed into envelopes and unknown to either study personnel or the families until after parental consent was obtained" (p. 148). |
| Blinding of participants and personnel (performance bias): objective outcomes | Low risk | Quote from report: "the nurses who provided follow up to comparison group children were blinded and nurses that provided care to intervention group were not blinded" (p. 148). Comment: we rated this domain at low risk of bias because BLLs and household dust lead measures are unlikely to be influenced by participants' knowledge about treatment allocation. |
| Blinding of outcome assessment (detection bias) | Low risk | Quote from report: "venous blood samples were collected by children's pediatric health care providers" (p. 148). |
| Incomplete outcome data (attrition bias) | Low risk | Comment: the overall attrition rate (17%) was acceptable. The attrition rates in intervention (18%) and control group (15%) were similar. |
| Incomplete outcome data (attrition bias) | Low risk | Comment: the overall attrition rate was acceptable (13%). The attrition rates in intervention (12%) and control group (13%) were similar. |
| Selective reporting (reporting bias) | Low risk | Comment: study protocol NA but it was clear that the published reports included all expected outcomes, including those that were prespecified and confirmed by the investigator. |
| Other bias | Low risk | Comment: study appeared free from other sources of bias. |
| Study characteristics | ||
| Methods | Study design: RCT Study location/setting: Philadelphia, USA. Urban area Recruitment: children were recruited from urban outpatient practices located in low‐income neighbourhoods of Philadelphia Follow‐up: 24 months from baseline Intention‐to‐treat analysis: available‐case analysis Power calculation: performed to determine number of participants (required number recruited) | |
| Participants | Eligibility criteria
Participation rate: 314/314 (100%) newborn children enrolled and randomised (154 intervention, 160 control); 310/310 (100%) households enrolled Reasons for non‐participation: NA Analysis: 279/314 (89%) BLLs analysed at 12 months of age; 110/306 (36%) household dust analysed at 12 months. No information on number of children for whom BLLs were analysed at 24 months Number of dropout/withdrawal: 35 (BLLs), 196 (household dust lead) Reasons for dropout/withdrawal: for 35 children, no venous specimen was taken (or reasons specified); for 196, no household dust lead level was measured because of problems finding participants who changed address or telephone numbers, non‐compliance with study visits, lack of approval by family members (no breakdown in specific numbers per reasons reported) Intervention baseline characteristics (n = 154): 53.2% boys, 46.8% girls Control baseline characteristics (n = 160): 51.2% boys, 48.8% girls Mean age and mean BLL only reported for both groups combined: mean age: 11 months and mean BLL: 2.7 µg/dL | |
| Interventions | Intervention
Control
| |
| Outcomes |
(Parental Knowledge Assessment) | |
| Notes | Funding: HUD Lead Technical Studies Grant Conflicts of interest: none declared Other comments: a matched comparison group was included in results of the paper, receiving community standard for prevention of elevated BLLs. This group was not part of the randomisation process and, therefore, was not integrated in this Cochrane Review | |
| Risk of bias | ||
| Bias | Authors' judgement | Support for judgement |
| Random sequence generation (selection bias) | Low risk | Quote from correspondence with author: "randomised blocks using computer‐generated random numbers." |
| Allocation concealment (selection bias) | Unclear risk | Quote from correspondence with author: "study coordinator selected next card in the random sequence to randomise that family." |
| Blinding of participants and personnel (performance bias): objective outcomes | Low risk | Quote from correspondence with author: "once the randomization occurred they were told of their assignment. The outreach workers who performed the randomization were made aware of the assignment category, as well." Comment: we rated this domain at low risk of bias because BLLs and household dust lead measures are unlikely to be influenced by participants' knowledge about treatment allocation. |
| Blinding of outcome assessment (detection bias) | Unclear risk | Quote from correspondence with author: "the samples were sent to two different analytic labs during the course of the 3‐year study period, and their job is to analyze BLLs. They were blinded to status". "The outreach workers collecting the dust wipe samples knew the household assignment" – this might have had an influence on household dust levels (comment). |
| Incomplete outcome data (attrition bias) | Low risk | Comment: attrition rate for BLL was acceptable (11%). No information on dropout rates in either study arm. |
| Incomplete outcome data (attrition bias) | High risk | Comment: for the outcome, household dust, attrition rate was very high (64%). No information on dropout rates in either study arm. |
| Selective reporting (reporting bias) | Low risk | Comment: study protocol NA, but the published reports included all expected outcomes, including those that were prespecified and confirmed by the investigator. |
| Other bias | Low risk | Comment: study appeared free from other sources of bias. |
| Study characteristics | ||
| Methods | Study design: quasi‐RCT (even/odd clinic number assignment) Study location/setting: Baltimore, USA. Recruited from a lead poisoning clinic Recruitment: children were recruited in July–October 1981 as they appeared for regular blood lead monitoring in a lead poisoning clinic Follow‐up: 12 months from baseline Intention‐to‐treat: unclear Power calculation: performed to determine number of participants (unclear if required number recruited) | |
| Participants | Eligibility criteria
Participation rate: 78/78 (100%) children enrolled and randomised (22 intervention, 56 control) Reasons for non‐participation: NA Analysis: 49/78 (63%) analysed Number of dropouts/withdrawals: 29 Reasons for dropout/withdrawal: children moved, spent considerable time with relatives in another household, not home for visits (no specific numbers per reason reported) Intervention baseline characteristics (available for n = 14)
Control baseline characteristics (available for n = 35)
| |
| Interventions | Intervention
Control
| |
| Outcomes |
| |
| Notes | Funding: supported from HUD Grant Conflicts of interest: none declared | |
| Risk of bias | ||
| Bias | Authors' judgement | Support for judgement |
| Random sequence generation (selection bias) | High risk | Quote from report: [allocation method alternate based on] "even or odd clinic number." |
| Allocation concealment (selection bias) | High risk | Comment: not used. |
| Blinding of participants and personnel (performance bias): objective outcomes | Low risk | Quote from correspondence with author: "personnel was not blinded. Participants were not aware of the existence of another study group." Comment: we rated this domain at low risk of bias because BLLs are unlikely to be influenced by participants' knowledge about treatment allocation. |
| Blinding of outcome assessment (detection bias) | Low risk | Comment: blinding of outcome assessors (laboratory). |
| Incomplete outcome data (attrition bias) | Unclear risk | Comment: attrition rate was quite high (37%), but there was no difference in attrition rates between study arms (37% in both groups). |
| Selective reporting (reporting bias) | Unclear risk | Comment: insufficient information. |
| Other bias | Low risk | Comment: study appeared free from other sources of bias. |
| Study characteristics | ||
| Methods | Study design: cluster‐RCT, by neighbourhood Study location/setting: Baltimore, USA. Urban neighbourhoods Recruitment: children from 2 neighbourhoods were recruited beginning in 1988 Follow‐up: 1 year Intention‐to‐treat analysis: no, due to exclusion of those not adhering to the study protocol (n = 226) Power calculation: performed to determine number of participants (required number recruited) | |
| Participants | Eligibility criteria for neighbourhoods
Eligibility criteria for children
Participation rate: NA as community recruitment; 408 children (212 intervention, 196 control) in 263 houses randomised Reasons for non‐participation: NA Analysis: 182/408 (121/263 households) (45%) analysed Number of dropouts/withdrawals: 226 Reasons for dropouts/withdrawals: children did not complete the study protocol (no specific reasons reported) Intervention baseline characteristics (n = 212): mean BLL 11.0 µg/dL Control baseline characteristics (n = 196): mean BLL 10.9 µg/dL No information on sex or age of included children | |
| Interventions | Intervention
Control
| |
| Outcomes |
| |
| Notes | Funding: US Environmental Protection Agency Conflicts of interest: none declared Other comments:
| |
| Risk of bias | ||
| Bias | Authors' judgement | Support for judgement |
| Random sequence generation (selection bias) | Low risk | Quote from correspondence with author: "coin toss." |
| Allocation concealment (selection bias) | Unclear risk | Comment: insufficient information. |
| Blinding of participants and personnel (performance bias): objective outcomes | Low risk | Comment: no information provided on blinding. We rated this domain at low risk of bias because BLLs and household dust lead measures are unlikely to be influenced by participants' knowledge about treatment allocation. |
| Blinding of outcome assessment (detection bias) | Low risk | Quote from correspondence with author: "Specimen collectors and laboratory personnel were blinded to group allocation and analyses were done by the State laboratory which had no interest in the outcome of the study." |
| Incomplete outcome data (attrition bias) | High risk | Comment: attrition rate was very high (55%). Attrition was similar in both groups (intervention group 53%, control group 58%). |
| Selective reporting (reporting bias) | Unclear risk | Comment: insufficient information. |
| Other bias | Unclear risk | Comment: risk of bias due to cluster randomisation. Used neighbourhood clusters, and it was unclear how analysis was performed as data were NA – unclear if there is unit of analysis bias. We assessed risk of recruitment bias and bias risk due to baseline imbalance as low, since baseline characteristics were comparable and randomisation was achieved by coin toss. |
| Study characteristics | ||
| Methods | Study design: cluster‐RCT, by household (in blocks of 6 stratified by area and BLL) Study location/setting: British Columbia, Canada. Higher lead risk area (active smelter) Recruitment: blood screen in 1992 Follow‐up: 10 months from baseline Intention‐to‐treat: available‐case analysis Power calculation: performed to determine number of participants (required number recruited) | |
| Participants | Eligibility criteria
Participation rate: 122/176 (69%) eligible households enrolled and randomised (122 children; 61 intervention, 61 control) Reasons for non‐participation: 54 households were not interested in participating Analysis: 111/122 (99%) analysed Number of dropouts/withdrawals: 11 Reasons for dropouts/withdrawals: moved house or did not provide a final blood sample (no specific numbers per reasons reported) Intervention baseline characteristics (available for n = 55)
Control baseline characteristics (available for n = 56)
| |
| Interventions | Intervention
Control
| |
| Outcomes |
| |
| Notes | Funding: grants to the Trail Community Lead Task Force by: BC Ministry of Health, BC, Ministry of Environment, Lands and Parks, Cominco Limited and City of Trail Conflicts of interest: none declared Other comments: potential for unit of analysis error | |
| Risk of bias | ||
| Bias | Authors' judgement | Support for judgement |
| Random sequence generation (selection bias) | Low risk | Quote from correspondence with author: "drew concealed slips of paper numbered one to six without replacement" and assigned blocks and then "coin toss" determined that "odds would be treatment blocks." |
| Allocation concealment (selection bias) | Low risk | Quote from correspondence with author: "done in central office." |
| Blinding of participants and personnel (performance bias): objective outcomes | Low risk | Quote from correspondence with author: "participants and personnel were not blinded as to treatment allocation." Comment: we rated this domain at low risk of bias because BLLs and household dust lead measures are unlikely to be influenced by participants' knowledge about treatment allocation. |
| Blinding of outcome assessment (detection bias) | Low risk | Quote from correspondence with author: "blood specimen collector and lab personnel did not know of group assignments", "lab personnel analysing the carpet dust samples were not aware of group assignment." |
| Incomplete outcome data (attrition bias) | Low risk | Comment: low attrition rate (1%). |
| Incomplete outcome data (attrition bias) | Low risk | Comment: low attrition rate (1%). |
| Selective reporting (reporting bias) | Low risk | Comment: study protocol NA, but the published reports included all expected outcomes, including those that were pre‐specified and confirmed by the investigator. |
| Other bias | High risk | Comment: risk of bias for cluster‐randomised studies. Used clusters of 6 households but used individuals as unit for analysis and, therefore, introduced a unit of analysis error. We assessed risk of recruitment bias and bias risk due to baseline imbalance as low, since baseline characteristics were comparable and randomisation was achieved by coin toss. |
| Study characteristics | ||
| Methods | Study design: RCT Study location/setting: Minneapolis, USA. Urban area Recruitment: recruited by door knocking and community information Follow‐up: 3 years from baseline Intention‐to‐treat: unclear Power calculation: performed to determine number of participants (unclear if required number recruited) | |
| Participants | Eligibility criteria: pregnant women and mothers of young infants from the Phillips Neighbourhood (economically disadvantaged, ethnically diverse neighbourhood) Participation rate: NA as community recruitment Reasons for non‐participation: NA Analysis: 607 children (299 intervention, 308 control) randomised, 378 (62%) analysed Number of dropouts/withdrawals: 229 Reasons for dropouts/withdrawal: no reasons stated No information of baseline data was available for all randomised children
| |
| Interventions | Intervention
Control
| |
| Outcomes | BLL (capillary until 12 months, venous > 12 months) 3 years from baseline | |
| Notes | Funding: supported by Grant MCJ 270801 from the Maternal and Child Health Bureau and Grant U67/CCU510771 from the CDC Conflicts of interest: authors declared they had no competing financial interests Other comments
| |
| Risk of bias | ||
| Bias | Authors' judgement | Support for judgement |
| Random sequence generation (selection bias) | Low risk | Quote from correspondence with author: "Random number generator." |
| Allocation concealment (selection bias) | Low risk | Quote from correspondence with author: "Central office." |
| Blinding of participants and personnel (performance bias): objective outcomes | Low risk | Quote from correspondence with author: "no blinding of participants or personnel." Comment: we rated this domain at low risk of bias because BLLs are unlikely to be influenced by participants' knowledge about treatment allocation. |
| Blinding of outcome assessment (detection bias) | Low risk | Quote from correspondence with author: outcome assessors "laboratory" blinded. |
| Incomplete outcome data (attrition bias) | High risk | Comment: attrition was quite high (38%), no information on attrition rates in both groups were given, so we rated it at high risk of bias. |
| Selective reporting (reporting bias) | High risk | Comment: results on household dust lead outcomes were not reported although they were measured. No information from the author on these outcomes could be obtained. |
| Other bias | Low risk | Comment: study appeared free from other sources of bias. |
| Study characteristics | ||
| Methods | Study design: RCT Study location/setting: Rochester, NY, USA. Community‐based trial in urban area Recruitment: baseline data collected between August 1993 and November 1993; follow‐up samples collected between April 1994 and June 1994 Follow‐up: 7 months from baseline Intention‐to‐treat available‐case analysis Power calculation: not performed to determine number of participants | |
| Participants | Eligibility criteria: families with children who participated in the Lead‐in Dust study (a cross‐sectional study to assess relationship of lead‐contaminated house dust and urban children's BLLs) Participation rate: 104/205 (50%) enrolled (no significant difference in those refused) and randomised (57 intervention, 47 control) Reasons for non‐participation: 101 not interested in participating Analysis: BLL 96/104 (91%), non‐carpet floor dust lead level 70/104 (67%), carpet floor dust lead level 60/104 (57%) Number of dropouts/withdrawals: 8 (BLL), 34 (non‐carpet floor lead dust level), 44 (carpet floor lead dust level) Reasons for dropout/withdrawal: 2 refused second blood tests, 3 had moved outside of the area, 2 had no time and 1 was lost to follow‐up; for others of whom floor dust lead levels were NA and no reasons were specified Intervention baseline characteristics (n = 57)
Control baseline characteristics (n = 47)
No information on sex of participants | |
| Interventions | Intervention
Control
| |
| Outcomes |
| |
| Notes | Funding: grant NYLPR002‐94 from the US HUD, the National Center for Lead‐Safe Housing, and Institutional National Research Service Award 2T‐32 PE‐12002 from the Bureau of Health Professions, Health Resources and Services Administration, US Public Health Service, Department of Health and Human Services Conflicts of interest: none declared | |
| Risk of bias | ||
| Bias | Authors' judgement | Support for judgement |
| Random sequence generation (selection bias) | Low risk | Quote from correspondence with author: "computer random number generator." |
| Allocation concealment (selection bias) | Low risk | Quote from correspondence with author: "sealed opaque envelopes." |
| Blinding of participants and personnel (performance bias): objective outcomes | Low risk | Quote from correspondence with author: "personnel and participants were blinded." |
| Blinding of outcome assessment (detection bias) | Low risk | Quote from correspondence with author: "yes, blood lead specimen collectors and analysers were blinded to group allocation." |
| Incomplete outcome data (attrition bias) | Low risk | Comment: attrition rate for BLL was low (9%). |
| Incomplete outcome data (attrition bias) | Low risk | Comment: attrition rate was acceptable (33%) and similar between groups (intervention group 32%, control group 36%). |
| Selective reporting (reporting bias) | Low risk | Comment: study protocol is available and all the study's prespecified outcomes were reported in the prespecified way. |
| Other bias | Low risk | Comment: study appeared free from other sources of bias. |
| Study characteristics | ||
| Methods | Study design: RCT (also non‐study control to rule out Hawthorne effect) Study location/setting: Rochester, NY, USA. Urban area Recruitment: identified by birth data from hospitals, inner‐city clinics and the Department of Social Services and Health – families were called to determine eligibility via interviews Follow‐up: 42 months from baseline Intention‐to‐treat: available‐case analysis Power calculation: performed to determine number of participants (required number recruited) | |
| Participants | Eligibility criteria
Participation rate: 275/429 (64%) enrolled and randomised (140 intervention, 135 control) Reasons for non‐participation: not interested in participating Analysis: 245/275 (89%) analysed at 24 months and 189/275 (69%) analysed at 48 months Number of dropouts/withdrawals: 30 at 24 months, 86 at 48 months Reasons for dropout/withdrawal: lost to follow‐up Intervention baseline data (n = 140)
Control baseline data (n = 135)
No information on sex of participants | |
| Interventions | Intervention
Control
| |
| Outcomes |
| |
| Notes | Funding: CDC Grant (U67/CCU210773) and an Institutional National Research Service Award (#2T‐32 PE‐12002) from the Bureau of Health Professions, Human Resources and Services Administration, Public Health Service, Department of Health and Human Services Conflicts of interest: none declared | |
| Risk of bias | ||
| Bias | Authors' judgement | Support for judgement |
| Random sequence generation (selection bias) | Low risk | Quote from correspondence with author: "random number generator." |
| Allocation concealment (selection bias) | Low risk | Quote from correspondence with author: "sealed opaque envelopes." |
| Blinding of participants and personnel (performance bias): objective outcomes | Low risk | Quote from correspondence with author: "personnel and participants were blinded." |
| Blinding of outcome assessment (detection bias) | Low risk | Quote from correspondence with author: "yes, blood lead specimen collectors and analysers were blinded to group allocation", "environmental technicians and interviewers blind to group assignment." |
| Incomplete outcome data (attrition bias) | Low risk | Comment: attrition rate at 12 months was 11%, at 24 months it was 31% – both acceptable. Attrition rate between groups was similar. |
| Incomplete outcome data (attrition bias) | Low risk | Comment: attrition rate at 12 months was 11%, at 24 months it was 31% – both acceptable. Attrition rate between groups was similar. |
| Selective reporting (reporting bias) | Low risk | Comment: study protocol is available and all the study's prespecified outcomes were reported in the prespecified way. |
| Other bias | Low risk | Comment: study appeared free of other sources of bias. |
| Study characteristics | ||
| Methods | Study design: RCT Study location/setting: medium‐sized, mid‐western city in the USA Recruitment: low‐income families recruited from Women, Infants, and Children (n = 29), Head Start (n = 49) and the local Health Department (n = 6) Follow‐up: 6 months from baseline Intention‐to‐treat: no Power calculation: not reported | |
| Participants | Eligibility criteria for children
Participation rate: 332 children assessed for eligibility, 84 randomised Reason for non‐participation: 26 refused to participate, 2 consented to participate but never completed initial interview, 203 disconnected/never contacted Analysis: 77/84 (92.7% analysed) Number of dropouts/withdrawals: 7/84 (7.3% dropout) Reasons for dropout/withdrawal: 5 lost contact/not compliant, 1 did not want to participate, 1 unable to contact after relocating Baseline characteristics of interventions and active control group (available for n = 84)
No information on sex of children | |
| Interventions | Intervention 1
Intervention 2
Intervention 3
Control
Passive control group (n = 29)
| |
| Outcomes |
| |
| Notes | Funding: provided by grants from the University of Notre Dame's Rodney Ganey Community‐Based Research mini‐grant, the New York Community Trust's Fahs‐Beck Fund for Research and Experimentation, South Bend Housing and Urban Development lead hazard control grant, and private donations from Greentree Environmental, LLC, and Riccar, Inc. Conflicts of interest: not reported | |
| Risk of bias | ||
| Bias | Authors' judgement | Support for judgement |
| Random sequence generation (selection bias) | Low risk | Quote from report: "Sealed envelopes contained the name of each of the four intervention groups, which were shuffled to ensure random order." (p. 381). |
| Allocation concealment (selection bias) | Low risk | Comment: interviewers selected 1 of the sealed envelopes prior to the initial interview but opened it afterwards in front of the participants. |
| Blinding of participants and personnel (performance bias): objective outcomes | Low risk | Comment: not blinded according to personal communication with the author. We rated this domain at low risk of bias because BLLs are unlikely to be influenced by participants' knowledge about treatment. |
| Blinding of outcome assessment (detection bias) | Unclear risk | Comment: not stated. |
| Incomplete outcome data (attrition bias) | Low risk | Comment: attrition rate 14.7% and low differential attrition. |
| Selective reporting (reporting bias) | Unclear risk | Comment: study protocol NA. |
| Other bias | Low risk | Comment: study appeared free from other sources of bias. |
| Study characteristics | ||
| Methods | Study design: RCT Study location/setting: Jersey City, NY, USA Recruitment: families that responded to posters and door hangers or were referred to the study by the municipal lead poisoning prevention programme, local healthcare providers, or recommendation. Follow‐up: 12 months from baseline Intention‐to‐treat: unclear Power calculation: performed to determine number of participants (required number not recruited) | |
| Participants | Eligibility criteria
Participation rate: 113/147(77%) enrolled and randomised (56 intervention, 57 control) Reasons for non‐participation: 7 could not be recontacted or refused to allow a baseline blood lead sample to be drawn, 27 were not interested in participating. Analysis: 99/113 (87%) analysed for BLLs, 95/113 (84%) analysed for floor wipes, 76/113 (67%) analysed for sill wipes, 49/113 (43%) analysed for vacuum cleaning Number of dropouts/withdrawals: 14 BLL, 18–64 household dust lead levels Reasons for dropout/withdrawal: because of frequent moves and changing circumstances of the enrolled families, it was not possible to draw final blood samples from 14 children. No explanation for missing data on household dust lead levels stated Intervention baseline characteristics (available for n = 46)
Control baseline characteristics (available for n = 53)
No information on sex of children | |
| Interventions | Intervention
Control
| |
| Outcomes |
| |
| Notes | Funding: work was supported by Co‐operative Agreement CR820235 from the Environmental Protection Agency, by an Interagency Agreement from the National Institute for Child Health and Human Development, National Institutes of Health, to US Environmental Protection Agency, by Grant 18152 from the Robert Wood Johnson Foundation, and by Grant ES‐05022 from the National Institute of Environmental Health Sciences. Conflicts of interest: none declared | |
| Risk of bias | ||
| Bias | Authors' judgement | Support for judgement |
| Random sequence generation (selection bias) | Low risk | Quote from correspondence with author: "permutated blocks of varying length." |
| Allocation concealment (selection bias) | Low risk | Quote from correspondence with author: "sealed envelopes." |
| Blinding of participants and personnel (performance bias): objective outcomes | Low risk | Quote from correspondence with author: "it was not possible to blind participants or field personnel to the assignments since one group had cleaning teams come to their homes and the other group did not." Comment: we rated this domain at low risk of bias because BLLs and household dust lead measures are unlikely to be influenced by participants' knowledge about treatment allocation. |
| Blinding of outcome assessment (detection bias) | Low risk | Comment: outcome assessors were blinded. |
| Incomplete outcome data (attrition bias) | Low risk | Comment: low attrition rate (12%). |
| Incomplete outcome data (attrition bias) | Unclear risk | Comment: for the outcome household dust, attrition rate was higher and reasons for missing data were NA. |
| Selective reporting (reporting bias) | Unclear risk | Comment: insufficient information. |
| Other bias | Low risk | Comment: study appeared free from other sources of bias. |
| Study characteristics | ||
| Methods | Study design: RCT Study location/setting: not reported (author's affiliation is Shanghai) Recruitment: children's blood was tested for lead and children with confirmed BLL ≥ 10 μg/dL were included. Recruitment NA. Follow‐up: 3 months Intention‐to‐treat: not necessary, all 200 participants randomised remained in study Power calculation: not reported | |
| Participants | Eligibility criteria: children with confirmed BLL ≥ 10 μg/dL Participation rate: 100% Reason for non‐participation: not reported Analysis: 200/200 Number of dropouts/withdrawals: 0/200 Reasons for dropout/withdrawal: no dropouts Intervention baseline characteristics (available for n = 107)
Control baseline characteristics (available for n = 93)
| |
| Interventions | Intervention
Control
| |
| Outcomes |
| |
| Notes | Funding: Johnson & Johnson Research Foundation, USA Conflicts of interest: not reported | |
| Risk of bias | ||
| Bias | Authors' judgement | Support for judgement |
| Random sequence generation (selection bias) | Unclear risk | Quote from the translated report: "All children were randomly divided into experimental group and control group according to their natural classes or groups in the kindergarten" (p. 893). |
| Allocation concealment (selection bias) | Unclear risk | Comment: not stated. |
| Blinding of participants and personnel (performance bias): objective outcomes | Low risk | Comment: not stated. We rated this domain at low risk of bias for objective outcomes because BLLs are unlikely to be influenced by participants' knowledge about treatment. |
| Blinding of outcome assessment (detection bias) | Low risk | Quote from the translated report: "…the laboratory testers did not know the grouping situation" (p. 893). |
| Incomplete outcome data (attrition bias) | Low risk | Comment: no dropouts. |
| Selective reporting (reporting bias) | Unclear risk | Comment: study protocol NA. |
| Other bias | Low risk | Comment: study appeared free from other sources of bias. |
| Study characteristics | ||
| Methods | Study design: RCT Study location: Missouri, USA. Former lead mining areas with large amounts of lead mining waste Recruitment: screenings in health department lead clinics; women, infants and children's clinics; daycare centres; door‐to‐door screening; and health fairs Follow‐up: 9 months Intention‐to‐treat: only cases with all quarterly measurements were included in analysis Power calculation: performed to determine number of participants (unclear if required number recruited) | |
| Participants | Eligibility criteria
Participation rate: 101/134 (75%) randomised (34 intervention 1, 35 intervention 2, 32 control) Reasons for non‐participation: no reasons for non‐participation provided Analysis: BLL 39/101 (39%), household lead dust 34/101 (34%) analysed Number of dropouts/withdrawals: 62 BLL, 67 household lead dust level Reasons for dropout/withdrawal: no reasons for dropouts provided Intervention 1 baseline characteristics (n = 34)
Intervention 2 baseline characteristics (n = 35)
Control baseline characteristics (n = 32)
| |
| Interventions | Intervention 1
Intervention 2
Control
| |
| Outcomes |
| |
| Notes | Funding: not stated Conflict of interests: none declared | |
| Risk of bias | ||
| Bias | Authors' judgement | Support for judgement |
| Random sequence generation (selection bias) | Unclear risk | Comment: method of randomisation unknown. |
| Allocation concealment (selection bias) | Unclear risk | Comment: unknown. |
| Blinding of participants and personnel (performance bias): objective outcomes | Low risk | Quote from correspondence with author: "no blinding of participants or researchers occurred." Comment: we rated this domain at low risk of bias because BLLs and household dust lead measures are unlikely to be influenced by participants' knowledge about treatment allocation. |
| Blinding of outcome assessment (detection bias) | Low risk | Comment: outcome analysers (laboratory) blinded. |
| Incomplete outcome data (attrition bias) | High risk | Comment: high attrition rate (61%). Reasons for missing data NA. |
| Incomplete outcome data (attrition bias) | High risk | Comment: high attrition rate (66%). Reasons for missing data NA. |
| Selective reporting (reporting bias) | Unclear risk | Comment: insufficient information. |
| Other bias | Low risk | Comment: study appeared free from other sources of bias. |
| Study characteristics | ||
| Methods | Study design: RCT Study location/setting: Florida, USA Recruitment: carers selected from clients enrolled in Broward County MediPass (Medicaid) who selected Children's Diagnostic and Treatment Center as their healthcare provider Follow‐up: 4 months from baseline Intention‐to‐treat: unclear Power calculation: not performed to determine number of participants | |
| Participants | Eligibility criteria
Participation rate: 63/63 (100%) children randomised (32 intervention, 31 control) Reasons for non‐participation: NA Analysis: 50/63 (79%) analysed Number of dropouts/withdrawals: 13 Reasons for dropout/withdrawal: reasons not specified Intervention baseline characteristics (available for n = 28)
Control baseline characteristics (available for n = 22)
Sex of children not reported | |
| Interventions | Intervention
Control
| |
| Outcomes |
| |
| Notes | Funding: not stated Conflicts of Interest: none declared | |
| Risk of bias | ||
| Bias | Authors' judgement | Support for judgement |
| Random sequence generation (selection bias) | Low risk | Quote from correspondence with author: "random list of numbers." |
| Allocation concealment (selection bias) | Low risk | Quote from correspondence with author: "assigned by central office." |
| Blinding of participants and personnel (performance bias): objective outcomes | Low risk | Quote from correspondence with author: "Personnel was not blinded. Participants were unaware of the existence of the comparison group." Comment: we rated this domain at low risk of bias because BLLs are unlikely to be influenced by participants' knowledge about treatment allocation. |
| Blinding of outcome assessment (detection bias) | Low risk | Comment: blinding of outcome assessors (laboratory). |
| Incomplete outcome data (attrition bias) | High risk | Comment: attrition rate (21%) was acceptable. However, attrition rate was much higher in control group (30%) than in intervention group (12%). Reasons for dropouts not specified. |
| Selective reporting (reporting bias) | Low risk | Comment: study protocol NA but the published reports included all expected outcomes, including those that were prespecified and confirmed by the investigator. |
| Other bias | Low risk | Comment: study appeared free from other sources of bias. |
| Study characteristics | ||
| Methods | Study design: RCT Study location/setting: Boston, USA. Urban neighbourhoods with a high incidence of childhood lead poisoning and high soil lead levels Recruitment: screening efforts between January and June 1989 Follow‐up: 11 months from baseline Intention‐to‐treat: available‐case analysis Power calculation: performed to determine number of participants (required number recruited) | |
| Participants | Eligibility criteria
Participation rate: 152/236 (64%) children randomised (54 intervention, 51 control group 1, 47 control group 2) Reasons for non‐participation: children who had venous BLLs > 1.16 µmol/L were excluded because they met the former definition of lead poisoning and were likely to undergo medical and environmental interventions that could obscure changes associated with the study interventions (not specified whether all 84 children had high BLLs or if other reasons account for non‐participation) Analysis: 149/152 (98%) analysed Number of dropouts/withdrawals: 3 Reasons for dropouts/withdrawals: no specific reasons for dropouts stated Intervention baseline characteristics (available for n = 52)
Control group 1 baseline characteristics (n = 51)
Control group 2 baseline characteristics (n = 47)
| |
| Interventions | Phase I only
Control 1
Control 2
| |
| Outcomes |
| |
| Notes | Funding: grant X001822‐01‐06 from Environmental Protection Agency, Washington, DC Conflicts of interest: none declared Other comments: phase I and phase II of Boston Lead‐In‐Soil trial performed but phase II excluded as no controls | |
| Risk of bias | ||
| Bias | Authors' judgement | Support for judgement |
| Random sequence generation (selection bias) | Low risk | Quote from correspondence with author: "computer‐based random number generator." |
| Allocation concealment (selection bias) | High risk | Comment: allocation performed by 1 staff member but not actively concealed from other investigators enrolling participants. |
| Blinding of participants and personnel (performance bias): objective outcomes | Low risk | Quote from correspondence with author: "impossible for participants or personnel to be blinded to treatment allocation." Comment: we rated this domain at low risk of bias because BLLs and household dust lead measures are unlikely to be influenced by participants' knowledge about treatment allocation. |
| Blinding of outcome assessment (detection bias) | Low risk | Comment: outcome assessors (laboratory analysers) were blinded. |
| Incomplete outcome data (attrition bias) | Low risk | Comment: attrition rate was low (2%). |
| Incomplete outcome data (attrition bias) | Low risk | Comment: attrition rate was low (2%). |
| Selective reporting (reporting bias) | Unclear risk | Comment: insufficient information. |
| Other bias | Low risk | Comment: study appeared free from other sources of bias. |
BLL: blood lead level; CDC: Centers for Disease Prevention and Control (USA); HEPA: high efficiency particulate air; HOME: Health Outcomes and Measures of the Environment; HUD: Department of Housing and Urban Development; IQ: intelligence quotient; MEG: maintenance education group; n: number of participants; NA: not available; RCT: randomised controlled trial; SD: standard deviation; SEG: standard education group.
Characteristics of excluded studies [ordered by study ID]
Ir a:
| Study | Reason for exclusion |
| Focused on ways to increase retention of families so they stay in lead prevention programmes, not on the effectiveness/safety of lead prevention. | |
| Commentary of a study. | |
| Only before‐after intervention assessment. | |
| Outcome was parents' self‐efficacy and precaution adoption (not relevant for this review). Outcomes relevant for this Cochrane Review not measured in this study. | |
| Observational study. | |
| Outcome (blood lead levels) only measured in mothers, not children. Outcomes relevant for this Cochrane Review not measured in this study. | |
| Retrospective data collection on 2 groups not randomly assigned | |
| Historical control group with no randomisation used. | |
| Only before‐after intervention assessment. | |
| Observational study. | |
| Qualitative study with semi‐structured interviews. | |
| Only before‐after intervention assessment. | |
| Systematic review. | |
| Conference abstract arguing the link between lead poisoning and asthma. | |
| Observational study. | |
| Outcome measured using hair lead levels. Outcomes relevant for this Cochrane Review not measured in this study. | |
| Observational study. | |
| Non‐randomised study. | |
| Observational study. | |
| Cohort study. | |
| Control and Intervention groups from 2 different study bases. | |
| Before‐after design without comparison group. | |
| Historical control group with no randomisation used. | |
| Retrospective observational study. | |
| Retrospective control with no randomisation used. | |
| Analysis of database records and qualitative research. | |
| Compared contamination modes, not prevention of lead exposure. | |
| Cross‐sectional study. | |
| Before‐after design without comparison group. | |
| Systematic review. Former version of this Cochrane Review | |
| No intervention of interest reported (iron fortification). |
Data and analyses
| Outcome or subgroup title | No. of studies | No. of participants | Statistical method | Effect size |
| 1.1 Blood lead level (continuous) Show forest plot | 5 | 815 | Mean Difference (IV, Random, 95% CI) | ‐0.03 [‐0.13, 0.07] |
| Analysis 1.1  Comparison 1: Education interventions compared to no intervention or standard education, Outcome 1: Blood lead level (continuous) | ||||
| 1.2 Blood lead level ≥ 10.0 µg/dL (dichotomous) Show forest plot | 4 | 520 | Risk Ratio (M‐H, Random, 95% CI) | 1.02 [0.79, 1.30] |
| Analysis 1.2  Comparison 1: Education interventions compared to no intervention or standard education, Outcome 2: Blood lead level ≥ 10.0 µg/dL (dichotomous) | ||||
| 1.3 Blood lead level ≥ 15.0 µg/dL (dichotomous) Show forest plot | 4 | 520 | Risk Ratio (M‐H, Random, 95% CI) | 0.60 [0.33, 1.09] |
| Analysis 1.3  Comparison 1: Education interventions compared to no intervention or standard education, Outcome 3: Blood lead level ≥ 15.0 µg/dL (dichotomous) | ||||
| 1.4 Floor dust – hard floor Show forest plot | 2 | 318 | Mean Difference (IV, Random, 95% CI) | ‐0.07 [‐0.37, 0.24] |
| Analysis 1.4  Comparison 1: Education interventions compared to no intervention or standard education, Outcome 4: Floor dust – hard floor | ||||
| Outcome or subgroup title | No. of studies | No. of participants | Statistical method | Effect size |
| 2.1 Blood lead level (continuous) Show forest plot | 4 | 565 | Mean Difference (IV, Random, 95% CI) | ‐0.02 [‐0.09, 0.06] |
| Analysis 2.1  Comparison 2: Environmental interventions (dust control) compared to no intervention or another intervention not aimed to influence domestic lead exposure, Outcome 1: Blood lead level (continuous) | ||||
| 2.2 Blood lead level ≥ 10.0 µg/dL (dichotomous) Show forest plot | 2 | 210 | Risk Ratio (M‐H, Random, 95% CI) | 0.93 [0.73, 1.18] |
| Analysis 2.2  Comparison 2: Environmental interventions (dust control) compared to no intervention or another intervention not aimed to influence domestic lead exposure, Outcome 2: Blood lead level ≥ 10.0 µg/dL (dichotomous) | ||||
| 2.3 Blood lead level ≥ 15.0 µg/dL (dichotomous) Show forest plot | 2 | 210 | Risk Ratio (M‐H, Random, 95% CI) | 0.86 [0.35, 2.07] |
| Analysis 2.3  Comparison 2: Environmental interventions (dust control) compared to no intervention or another intervention not aimed to influence domestic lead exposure, Outcome 3: Blood lead level ≥ 15.0 µg/dL (dichotomous) | ||||
| 2.4 Blood lead level ≥ 10.0 µg/dL (dichotomous): intraclass correlation coefficient (ICC) 0.01 Show forest plot | 2 | 204 | Risk Ratio (M‐H, Random, 95% CI) | 0.93 [0.73, 1.18] |
| Analysis 2.4  Comparison 2: Environmental interventions (dust control) compared to no intervention or another intervention not aimed to influence domestic lead exposure, Outcome 4: Blood lead level ≥ 10.0 µg/dL (dichotomous): intraclass correlation coefficient (ICC) 0.01 | ||||
| 2.5 Blood lead level ≥ 10.0 µg/dL (dichotomous): ICC 0.1 Show forest plot | 2 | 173 | Risk Ratio (M‐H, Random, 95% CI) | 0.95 [0.72, 1.24] |
| Analysis 2.5  Comparison 2: Environmental interventions (dust control) compared to no intervention or another intervention not aimed to influence domestic lead exposure, Outcome 5: Blood lead level ≥ 10.0 µg/dL (dichotomous): ICC 0.1 | ||||
| 2.6 Blood lead level ≥ 10.0 µg/dL (dichotomous): ICC 0.2 Show forest plot | 2 | 155 | Risk Ratio (M‐H, Random, 95% CI) | 0.97 [0.72, 1.29] |
| Analysis 2.6  Comparison 2: Environmental interventions (dust control) compared to no intervention or another intervention not aimed to influence domestic lead exposure, Outcome 6: Blood lead level ≥ 10.0 µg/dL (dichotomous): ICC 0.2 | ||||
| 2.7 Blood lead level ≥ 15.0 µg/dL (dichotomous): ICC 0.01 Show forest plot | 2 | 204 | Risk Ratio (M‐H, Random, 95% CI) | 0.82 [0.37, 1.81] |
| Analysis 2.7  Comparison 2: Environmental interventions (dust control) compared to no intervention or another intervention not aimed to influence domestic lead exposure, Outcome 7: Blood lead level ≥ 15.0 µg/dL (dichotomous): ICC 0.01 | ||||
| 2.8 Blood lead level ≥ 15.0 µg/dL (dichotomous): ICC 0.1 Show forest plot | 2 | 173 | Risk Ratio (M‐H, Random, 95% CI) | 0.83 [0.34, 2.03] |
| Analysis 2.8  Comparison 2: Environmental interventions (dust control) compared to no intervention or another intervention not aimed to influence domestic lead exposure, Outcome 8: Blood lead level ≥ 15.0 µg/dL (dichotomous): ICC 0.1 | ||||
| 2.9 Blood lead level ≥ 15.0 µg/dL (dichotomous): ICC 0.2 Show forest plot | 2 | 155 | Risk Ratio (M‐H, Random, 95% CI) | 0.75 [0.34, 1.66] |
| Analysis 2.9  Comparison 2: Environmental interventions (dust control) compared to no intervention or another intervention not aimed to influence domestic lead exposure, Outcome 9: Blood lead level ≥ 15.0 µg/dL (dichotomous): ICC 0.2 | ||||
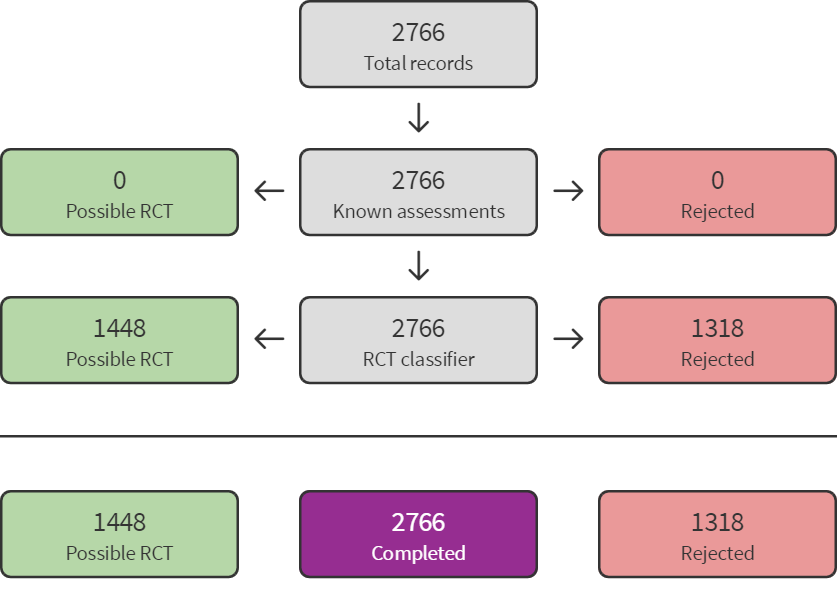
Screen4Me summary diagram. RCT: randomised controlled trial.
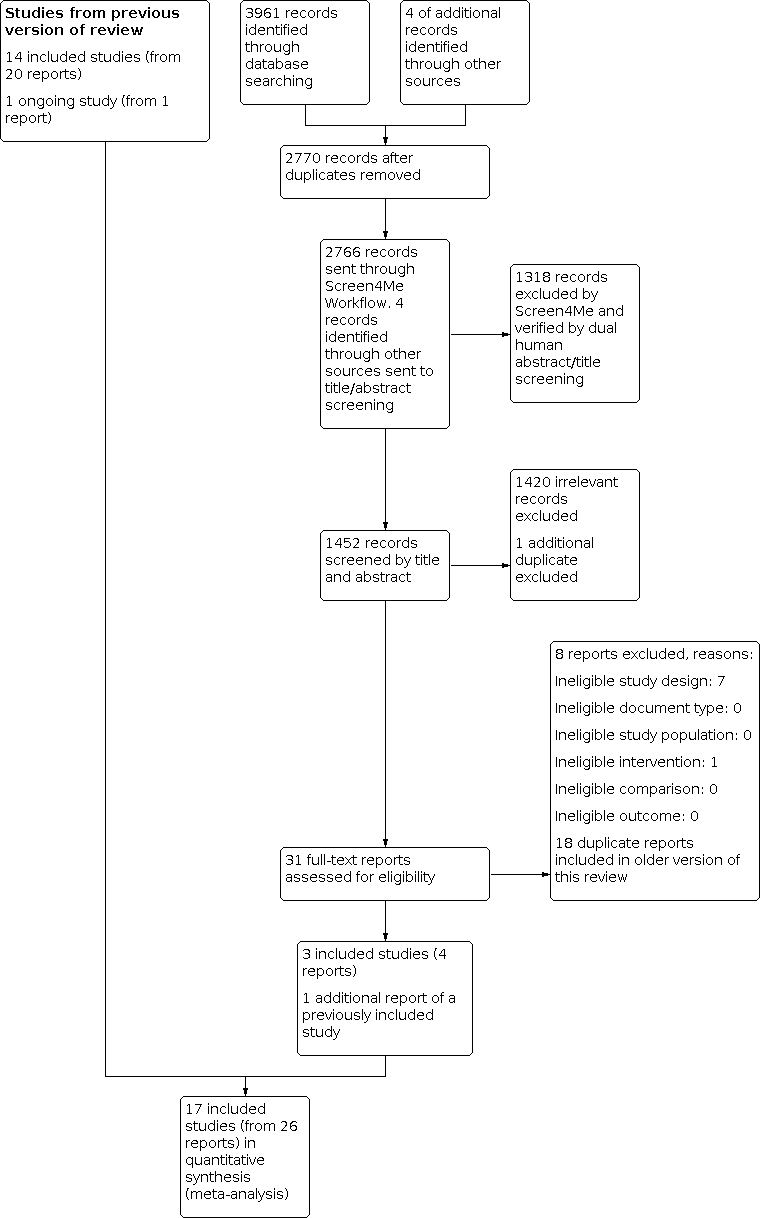
Study flow diagram.

Risk of bias graph: review authors' judgements about each risk of bias item presented as percentages across all included studies.

Risk of bias summary: review authors' judgements about each risk of bias item for each included study.

Comparison 1: Education interventions compared to no intervention or standard education, Outcome 1: Blood lead level (continuous)

Comparison 1: Education interventions compared to no intervention or standard education, Outcome 2: Blood lead level ≥ 10.0 µg/dL (dichotomous)

Comparison 1: Education interventions compared to no intervention or standard education, Outcome 3: Blood lead level ≥ 15.0 µg/dL (dichotomous)

Comparison 1: Education interventions compared to no intervention or standard education, Outcome 4: Floor dust – hard floor

Comparison 2: Environmental interventions (dust control) compared to no intervention or another intervention not aimed to influence domestic lead exposure, Outcome 1: Blood lead level (continuous)

Comparison 2: Environmental interventions (dust control) compared to no intervention or another intervention not aimed to influence domestic lead exposure, Outcome 2: Blood lead level ≥ 10.0 µg/dL (dichotomous)

Comparison 2: Environmental interventions (dust control) compared to no intervention or another intervention not aimed to influence domestic lead exposure, Outcome 3: Blood lead level ≥ 15.0 µg/dL (dichotomous)

Comparison 2: Environmental interventions (dust control) compared to no intervention or another intervention not aimed to influence domestic lead exposure, Outcome 4: Blood lead level ≥ 10.0 µg/dL (dichotomous): intraclass correlation coefficient (ICC) 0.01

Comparison 2: Environmental interventions (dust control) compared to no intervention or another intervention not aimed to influence domestic lead exposure, Outcome 5: Blood lead level ≥ 10.0 µg/dL (dichotomous): ICC 0.1

Comparison 2: Environmental interventions (dust control) compared to no intervention or another intervention not aimed to influence domestic lead exposure, Outcome 6: Blood lead level ≥ 10.0 µg/dL (dichotomous): ICC 0.2

Comparison 2: Environmental interventions (dust control) compared to no intervention or another intervention not aimed to influence domestic lead exposure, Outcome 7: Blood lead level ≥ 15.0 µg/dL (dichotomous): ICC 0.01

Comparison 2: Environmental interventions (dust control) compared to no intervention or another intervention not aimed to influence domestic lead exposure, Outcome 8: Blood lead level ≥ 15.0 µg/dL (dichotomous): ICC 0.1

Comparison 2: Environmental interventions (dust control) compared to no intervention or another intervention not aimed to influence domestic lead exposure, Outcome 9: Blood lead level ≥ 15.0 µg/dL (dichotomous): ICC 0.2
| Education interventions versus no intervention for preventing domestic lead exposure in children | ||||||
| Patient or population: children (aged 0–2 years) | ||||||
| Outcomes | Illustrative comparative risks* (95% CI) | Relative effect | Number of participants (studies) | Certainty of the evidence | Comments | |
|---|---|---|---|---|---|---|
| Assumed risk | Corresponding risk | |||||
| No intervention | Educational interventions | |||||
| Cognitive and neurobehavioural outcomes | None of the included studies assessed effects on cognitive or neurobehavioural outcomes | — | — | — | — | |
| Adverse events | None of the included studies assessed adverse event outcomes | — | — | — | — | |
| Blood lead levels (continuous) Scale: 0–30 Follow‐up: 3–18 months | The mean blood lead level (continuous, log transformed) ranged across control groups from 1.24 to 2.51a,b | The mean blood lead level (continuous, log transformed) in the intervention groups was 0.03 lower (0.13 lower to 0.07 higher) a | — | 815 | ⊕⊕⊕⊝ | Included studies: Lanphear 1996a; Lanphear 1999; Wasserman 2002; Jordan 2003; Brown 2006 |
| Household dust: hard floor dust lead levels (continuous) Scale: 0–40 Follow‐up: 6 months | The mean floor dust level – hard floor – ranged across control groups from 1.65 to 2.28a,b | The mean floor dust level – hard floor – in the intervention groups was 0.07 lower (0.37 lower to 0.24 higher) b | — | 318 | ⊕⊕⊕⊝ | Included studies: Lanphear 1996a; Lanphear 1999 |
| *The basis for the assumed risk (e.g. the median control group risk across studies) is provided in footnotes. The corresponding risk (and its 95% CI) is based on the assumed risk in the comparison group and the relative effect of the intervention (and its 95% CI). CI: confidence interval; RR: risk ratio. | ||||||
| GRADE Working Group grades of evidence | ||||||
| aPost‐treatment value. | ||||||
| Environmental interventions versus no intervention for preventing domestic lead exposure in children | ||||||
| Patient or population: children (aged 0–6 years) | ||||||
| Outcomes | Illustrative comparative risks* (95% CI) | Relative effect (95% CI) | Number of participants (studies) | Certainty of the evidence | Comments | |
|---|---|---|---|---|---|---|
| Assumed risk | Corresponding risk | |||||
| No intervention | Environmental interventions | |||||
| Dust control interventions | ||||||
| Cognitive and neurobehavioural outcomes Scale Wechsler IQ: BRIEF: Follow‐up: 3–8 years | Children in the intervention group had numerically better cognitive and neurobehavioural outcomes, but differences were small and 95% CI included beneficial and non‐beneficial effects. Difference of mean scores after 8 years of selected scales:
For detailed results of subscales and additional scales reported see Effects of interventions. | — | 224–302 (1 study) | ⊕⊕⊝⊝ | Included study: Braun 2018 | |
| Adverse events Follow‐up: 3–8 years | 1 study reported that after 8 years they did not observe any adverse events in the intervention group. In the control group, 1 child had an injury because of a stair gateway installed and another child had elevated blood lead concentrations (28 µg/dL). | — | 355 (1 study) | ⊕⊝⊝⊝ | ||
| Blood lead levels (continuous) Scale: 0–30 Follow‐up: 6–24 months | The mean blood lead level (continuous, log transformed) ranged across control groups from 0.53to 2.9e | The mean blood lead level (continuous, log transformed) in the intervention groups was 0.02 lower (0.09 lower to 0.06 higher) e | — | 565 (4 studies) | ⊕⊕⊕⊝ | Included studies: Hilts 1995; Rhoads 1999; Boreland 2009; Braun 2018 |
| Household dust: floor dust lead levels | None of the included studies assessed floor dust lead levels. | — | — | — | — | |
| Soil abatement interventions | ||||||
| Cognitive and neurobehavioural outcomes | None of the included studies assessed cognitive and neurobehavioural outcomes. | — | — | — | — | |
| Adverse events | None of the included studies assessed adverse events. | — | — | — | — | |
| Blood lead levels (continuous) Scale: 0–30 Follow‐up: 11–24 months | 2 studies performed soil abatement interventions (Weitzman 1993; Farrell 1998). Farrell 1998 reported results as a "total effect" showing no statistical significance, and no data were available for our analyses. Weitzman 1993 reported a statistically significant effect in favour of the intervention. The difference in mean change scores between the intervention group and control group A (loose interior dust abatement and paint removal) was –1.5 µg/dL (SD 4.9), and between the intervention group and control group B (loose interior paint removal only) was –1.9 µg/dL (SD 5.0). No measure of variance was available for post‐treatment means or mean change scores, so further analysis was not possible in this review. | — | 378 (2 studies) | ⊕⊝⊝⊝ Very lowf,g | Included studies Weitzman 1993; Farrell 1998 | |
| Household dust: floor dust lead levels | None of the included studies reported floor dust lead levels. | — | — | — | — | |
| *The basis for the assumed risk (for example, the median control group risk across studies) is provided in footnotes. The corresponding risk (and its 95% CI) is based on the assumed risk in the comparison group and the relative effect of the intervention (and its 95% CI). CI: confidence interval; IQ: intelligence quotient; MD: mean difference; n: number of study participants with a measurement; SD: standard deviation. | ||||||
| GRADE Working Group grades of evidence | ||||||
| aDowngraded one level because of imprecision: total population size was fewer than 400 and the 95% confidence interval included both a benefit and no benefit of the intervention. | ||||||
| Combination interventions versus no intervention for preventing domestic lead exposure in children | ||||||
| Patient or population: children (aged 0–4 years) | ||||||
| Outcomes | Illustrative comparative risks* (95% CI) | Relative effect (95% CI) | Number of participants (studies) | Certainty of the evidence | Comments | |
|---|---|---|---|---|---|---|
| Assumed risk | Corresponding risk | |||||
| Standard education | Combination interventions | |||||
| Cognitive and neurobehavioural outcomes | None of the included studies assessed cognitive and neurobehavioural outcomes. | — | — | — | — | |
| Adverse events | None of the included studies assessed adverse events. | — | — | — | — | |
| Blood lead levels (continuous) Scale: 0–30 Follow‐up: 6–24 months | The 4 studies that used a combination of interventions compared to standard education showed inconclusive results. While Charney 1983 reported a significant effect favouring treatment with arithmetic means for post‐treatment blood lead levels of 31.7 µg/dL (SD 2.6) in the intervention group and 37.8 µg/dL (SD 7.9) in the control group, Aschengrau 1998, Campbell 2011, and Sterling 2004 showed little to no difference between combination interventions and standard education on blood lead levels. | — | 426 (4 studies) | ⊕⊝⊝⊝ Very lowa,b | Included studies Charney 1983; Aschengrau 1998; Sterling 2004; Campbell 2011 | |
| Household dust: floor dust lead levels Follow‐up: 6–12 months | Aschengrau 1998 found no evidence for an effect on floor dust lead levels, with median changes for floor dust lead level being –0.002 mg/m² (–0.2 µg/feet², SD 0.8 µg/feet²) in the intervention group and 0.001 mg/m² (0.0 µg/feet², SD 0.2 µg/feet²) in the control group. A second study also found no evidence for an effect on floor dust lead levels (Campbell 2011). | — | 336 (2 studies) | ⊕⊝⊝⊝ Very lowa,b | ||
| *The basis for the assumed risk (for example, the median control group risk across studies) is provided in footnotes. The corresponding risk (and its 95% CI) is based on the assumed risk in the comparison group and the relative effect of the intervention (and its 95% CI). CI: confidence interval; MD: mean difference; SD: standard deviation. | ||||||
| GRADE Working Group grades of evidence | ||||||
| aDowngraded one level because of imprecision; inconclusive and contradicting results of studies. | ||||||
| Study ID | Mean blood lead level at baseline (µg/dL) | Age at baseline (months) |
|---|---|---|
| 15.0–19.0 | 24–36 | |
| 15.0–19.0 | 42 | |
| 0.7 | 0 | |
| 15.0–19.0 | 12–24 | |
| 2.6–2.7 | 8–14 | |
| 38 | 43–45 | |
| 10.0–14.0 | 6–72 | |
| 10.0–14.0 | 24–36 | |
| < 10.0 | < 12 | |
| 6.6–6.8 | 12–24 | |
| 2.8–2.9 | 6.7 | |
| 5.28 | 47 | |
| 10.0–14.0 | 12–24 | |
| 15.0–19.0 | 49 | |
| 10.0–14.0 | 34–43 | |
| 2.6–4.5 | 22–24 | |
| 10.0–14.0 | 4–36 |
| Study ID | Education | Dust control | Soil abatement | Combination |
|---|---|---|---|---|
| — | — | — | Yes | |
| — | Yes | — | — | |
| — | Yes | — | — | |
| Yes | — | — | — | |
| — | — | — | Yes | |
| — | — | — | Yes | |
| — | — | Yes | — | |
| — | Yes | — | — | |
| Yes | — | — | — | |
| Yes | — | — | — | |
| Yes | — | — | — | |
| — | Yes | — | — | |
| — | Yes | — | — | |
| Yes | — | — | — | |
| — | — | — | Yes | |
| Yes | — | — | — | |
| — | — | Yes | — |
| Study ID | Neurobehavioural and cognitive outcomes | Adverse events | Blood lead (continuous) | Blood lead (dichotomous) | Household dust lead levels: floors | Household dust lead levels: windows | Cost | Other |
|---|---|---|---|---|---|---|---|---|
| — | — | Yes | — | Yes | Yes | — | — | |
| — | — | Yes | — | — | — | Yes | — | |
| Yes | Yes | Yes | — | Yes | Yes | — | ||
| — | — | Yes | Yes | Yes | — | Yes | Parent‐Child Interaction scale | |
| — | — | Yes | — | Yes | Yes | — | Chicago Parents Knowledge Test | |
| — | — | Yes | Yes | — | — | — | — | |
| — | — | — | — | — | — | Yes | Total effect (blood lead levels) | |
| — | — | Yes | Yes | Yes | — | Yes | — | |
| — | — | Yes | — | — | — | — | — | |
| — | — | Yes | Yes | Yes | Yes | — | — | |
| — | — | Yes | Yes | Yes | Yes | — | — | |
| — | — | Yes | — | — | — | — | Lead exposure risk, brochure effectiveness, cleaning home repair behaviour, lead knowledge | |
| — | — | Yes | Yes | Yes | Yes | — | Maternal knowledge lead poisoning | |
| — | — | Yes | — | — | — | — | ||
| — | — | — | Yes | — | — | Yes | — | |
| — | — | Yes | Yes | — | — | Yes | Chicago Parents Knowledge Test | |
| — | — | Yes | — | — | — | — | — |
| Outcome or subgroup title | No. of studies | No. of participants | Statistical method | Effect size |
| 1.1 Blood lead level (continuous) Show forest plot | 5 | 815 | Mean Difference (IV, Random, 95% CI) | ‐0.03 [‐0.13, 0.07] |
| 1.2 Blood lead level ≥ 10.0 µg/dL (dichotomous) Show forest plot | 4 | 520 | Risk Ratio (M‐H, Random, 95% CI) | 1.02 [0.79, 1.30] |
| 1.3 Blood lead level ≥ 15.0 µg/dL (dichotomous) Show forest plot | 4 | 520 | Risk Ratio (M‐H, Random, 95% CI) | 0.60 [0.33, 1.09] |
| 1.4 Floor dust – hard floor Show forest plot | 2 | 318 | Mean Difference (IV, Random, 95% CI) | ‐0.07 [‐0.37, 0.24] |
| Outcome or subgroup title | No. of studies | No. of participants | Statistical method | Effect size |
| 2.1 Blood lead level (continuous) Show forest plot | 4 | 565 | Mean Difference (IV, Random, 95% CI) | ‐0.02 [‐0.09, 0.06] |
| 2.2 Blood lead level ≥ 10.0 µg/dL (dichotomous) Show forest plot | 2 | 210 | Risk Ratio (M‐H, Random, 95% CI) | 0.93 [0.73, 1.18] |
| 2.3 Blood lead level ≥ 15.0 µg/dL (dichotomous) Show forest plot | 2 | 210 | Risk Ratio (M‐H, Random, 95% CI) | 0.86 [0.35, 2.07] |
| 2.4 Blood lead level ≥ 10.0 µg/dL (dichotomous): intraclass correlation coefficient (ICC) 0.01 Show forest plot | 2 | 204 | Risk Ratio (M‐H, Random, 95% CI) | 0.93 [0.73, 1.18] |
| 2.5 Blood lead level ≥ 10.0 µg/dL (dichotomous): ICC 0.1 Show forest plot | 2 | 173 | Risk Ratio (M‐H, Random, 95% CI) | 0.95 [0.72, 1.24] |
| 2.6 Blood lead level ≥ 10.0 µg/dL (dichotomous): ICC 0.2 Show forest plot | 2 | 155 | Risk Ratio (M‐H, Random, 95% CI) | 0.97 [0.72, 1.29] |
| 2.7 Blood lead level ≥ 15.0 µg/dL (dichotomous): ICC 0.01 Show forest plot | 2 | 204 | Risk Ratio (M‐H, Random, 95% CI) | 0.82 [0.37, 1.81] |
| 2.8 Blood lead level ≥ 15.0 µg/dL (dichotomous): ICC 0.1 Show forest plot | 2 | 173 | Risk Ratio (M‐H, Random, 95% CI) | 0.83 [0.34, 2.03] |
| 2.9 Blood lead level ≥ 15.0 µg/dL (dichotomous): ICC 0.2 Show forest plot | 2 | 155 | Risk Ratio (M‐H, Random, 95% CI) | 0.75 [0.34, 1.66] |