Ingesta alta versus baja de aminoácidos en la nutrición parenteral para recién nacidos
Resumen
Antecedentes
Los lactantes enfermos y prematuros con frecuencia no son capaces de alimentarse por vía enteral y requieren líquidos y nutrición parenterales. Los posibles efectos beneficiosos de la ingesta parenteral alta de aminoácidos (AA) en la mejoría del equilibrio de nitrógeno, el crecimiento y la salud del lactante pueden ser más importantes que la capacidad del lactante de utilizar la ingesta parenteral alta de AA, especialmente en los días posteriores al nacimiento.
Objetivos
El objetivo primario es determinar si la ingesta parenteral alta versus baja de AA se asocia con una mejoría en el crecimiento y una supervivencia sin discapacidad en los recién nacidos que reciben nutrición parenteral.
Los objetivos secundarios incluyen determinar si:
• una ingesta al comienzo o inicial alta versus baja de aminoácidos se asocia con una mejoría en el crecimiento y una supervivencia sin discapacidad sin efectos secundarios;
• una ingesta alta versus baja de aminoácidos al momento de la ingesta máxima se asocia con una mejoría en el crecimiento y una supervivencia sin discapacidad, sin efectos secundarios; y
• un aumento en la ingesta de aminoácidos debe reemplazar la ingesta calórica no proteica (glucosa y lípidos), debe agregarse a la ingesta calórica no proteica o debe administrarse simultáneamente con la ingesta calórica no proteica.
Se realizaron análisis de subgrupos para buscar cualquier diferencia en los efectos de una ingesta alta versus baja de aminoácidos según la edad gestacional, el peso al nacer, la edad al comienzo y la condición del lactante, o aumentos concomitantes en la ingesta de líquidos.
Métodos de búsqueda
Se utilizó la estrategia de búsqueda estándar del Grupo Cochrane de Neonatología (Cochrane Neonatal Review Group) para buscar en el Registro Cochrane Central de Ensayos Controlados (Cochrane Central Register of Controlled Trials) (2 junio 2017), MEDLINE (1966 hasta 2 junio 2017), Embase (1980 hasta 2 junio 2017) y en Cumulative Index to Nursing and Allied Health Literature (CINAHL) (1982 hasta 2 junio 2017). También se realizaron búsquedas en bases de datos de ensayos clínicos, actas de congresos y citas de artículos.
Criterios de selección
Ensayos controlados aleatorios de ingesta alta versus baja de AA como nutrición parenteral en los recién nacidos. Se realizaron comparaciones de ingesta alta al comienzo, al momento de la ingesta máxima, y al comienzo y al momento de la ingesta máxima.
Obtención y análisis de los datos
Dos autores de la revisión, de forma independiente, seleccionaron los ensayos, evaluaron la calidad de los ensayos y extrajeron los datos de los estudios incluidos. Se realizaron análisis de efectos fijos y los efectos del tratamiento se expresaron como diferencia de medias (DM), cociente de riesgos (CR) y diferencia de riesgos (DR) con intervalos de confianza (IC) del 95%, y la calidad de la evidencia se evaluó mediante el enfoque GRADE.
Resultados principales
Treinta y dos estudios fueron elegibles para la inclusión. Seis fueron estudios de tolerancia bioquímica a corto plazo, uno se realizó con lactantes con > 35 semanas de gestación, uno con recién nacidos quirúrgicos a término y tres no proporcionaron datos utilizables. Los 21 estudios restantes informaron resultados clínicos sobre lactantes muy prematuros o con bajo peso al nacer que se incluyeron en el metanálisis de esta revisión.
La ingesta alta de AA no tuvo efectos sobre la mortalidad antes del alta hospitalaria (CR típico 0,90; IC del 95%: 0,69 a 1,17; participantes = 1407; estudios = 14; I2 = 0%; calidad de la evidencia: baja). La evidencia no fue suficiente para mostrar un efecto sobre el desarrollo neurológico e indicar que no hubo efectos beneficiosos informados (calidad de la evidencia: muy baja). La ingesta alta de AA se asoció con una reducción de retraso del crecimiento posnatal (< 10mo percentilo) al momento del alta (CR típico 0,74; IC del 95%: 0,56 a 0,97; participantes = 203; estudios = 3; I2 = 22%; DR típica ‐0,15; IC del 95%: ‐0,27 a ‐0,02; número necesario a tratar para lograr un resultado beneficioso adicional [NNTB] 7; IC del 95%: 4 a 50; calidad de la evidencia: muy baja). Los análisis de subgrupos encontraron una reducción en los retraso del crecimiento posnatal en los lactantes que comenzaron con una ingesta alta de aminoácidos (> 2 a ≤ 3 g/kg/día); que ocurrió con un aumento en los aminoácidos y en la ingesta calórica no proteica; que comenzó en la ingesta con < de 24 horas de vida; y que ocurrió con la infusión temprana de lípidos.
La ingesta alta de AA se asoció con una reducción en los días necesarios para recuperar el peso al nacer (DM ‐1,14; IC del 95%: ‐1,73 a ‐0,56; participantes = 950; estudios = 13; I2 = 77%). Los datos muestran efectos variables sobre los parámetros de crecimiento y ningún efecto consistente en las puntuaciones z antropométricas en cualquier punto temporal, así como un aumento en el crecimiento del perímetro cefálico al momento del alta (DM 0,09 cm/semanas; IC del 95%: 0,06 a 0,13; participantes = 315; estudios = 4; I2 = 90%; calidad de la evidencia: muy baja).
La ingesta alta de AA no se asoció con efectos sobre los días hasta la alimentación enteral completa, la sepsis de aparición tardía, la enterocolitis necrosante, la enfermedad pulmonar crónica, cualquier hemorragia intraventricular o hemorragia intraventricular grave o la leucomalacia periventricular. Los datos muestran una reducción en la retinopatía del prematuro (CR típico 0,44; IC del 95%: 0,21 a 0,93; participantes = 269; estudios = 4; I2 = 31%; calidad de la evidencia: muy baja) pero ninguna diferencia en la retinopatía grave del prematuro.
La ingesta alta de AA se asoció con un aumento en el equilibrio proteico positivo y en el equilibrio de nitrógeno. Se informaron las posibles intolerancias bioquímicas, que incluyeron el riesgo de nitrógeno ureico en sangre anormal (CR típico 2,77; IC del 95%: 2,13 a 3,61; participantes = 688; estudios = 7; I2 = 6%; DR típica 0,26; IC del 95%: 0,20 a 0,32; número necesario a tratar para un resultado perjudicial adicional (NNTH) fue 4; IC del 95%: 3 a 5; calidad de la evidencia: alta). Una ingesta alta de aminoácidos en la nutrición parenteral se asoció con una reducción en la hiperglucemia (> 8,3 mmol/l) (CR típico 0,69; IC del 95%: 0,49 a 0,96; participantes = 505; estudios = 5; I2 = 68%), aunque la incidencia de hiperglucemia tratada con insulina no fue diferente.
Conclusiones de los autores
La evidencia de baja calidad indica que la alta ingesta de AA en la nutrición parenteral no afecta la mortalidad. Evidencia de muy baja calidad indica que la ingesta alta de AA reduce la incidencia de retraso del crecimiento posnatal. No hubo evidencia suficiente para mostrar un efecto sobre el desarrollo neurológico. Evidencia de muy baja calidad indica que la ingesta alta de AA reduce la retinopatía del prematuro, pero no la retinopatía grave del prematuro. La ingesta alta de AA se asoció con posibles efectos bioquímicos adversos debido a la carga excesiva de aminoácidos, incluida la azoemia. Se requieren ensayos con poder estadístico suficiente en lactantes muy prematuros para determinar la ingesta óptima de AA y los efectos del equilibrio calórico en la nutrición parenteral sobre el cerebro y sobre el desarrollo neurológico.
PICOs
Resumen en términos sencillos
Ingesta alta versus baja de aminoácidos en la nutrición parenteral para recién nacidos
Pregunta de la revisión
¿En los recién nacidos, la administración de nutrición intravenosa con un alto contenido de aminoácidos (proteínas) durante los primeros días después del nacimiento da lugar a un mejor crecimiento y una supervivencia sin discapacidad?
Antecedentes
Los recién nacidos enfermos y prematuros tienen riesgo de desnutrición y retraso del crecimiento debido a la imposibilidad de recibir proteínas a una dosis equivalente a la que recibían cuando estaban en el útero. Aunque la administración de una dosis alta de aminoácidos en la nutrición parenteral a través de una vena proporciona beneficios potenciales, los posibles efectos secundarios del exceso de proteína debido a la inmadurez del hígado y los riñones del lactante, que son los responsables de utilizar la proteína y de eliminar los desechos proteicos del cuerpo, todavía es un tema de preocupación.
Características de los estudios
La revisión incluyó 21 estudios que informaron resultados clínicos en lactantes muy prematuros o con bajo peso al nacer. El informe de todos los resultados fue incompleto. Las búsquedas de estudios se realizaron en junio de 2017.
Resultados clave
La ingesta alta de aminoácidos no afectó la supervivencia en los lactantes prematuros o con bajo peso al nacer. No hubo suficiente información disponible para determinar si tuvo un efecto sobre el desarrollo neurológico. La ingesta alta de aminoácidos se asoció con tasas inferiores de retraso del crecimiento, aumento en el crecimiento de la cabeza y menos trastornos oculares del prematuro (los trastornos oculares no fueron graves). La ingesta alta de aminoácidos también se asoció con un aumento en los niveles de productos de desecho proteico (urea) y una menor incidencia de niveles altos de glucosa en sangre.
Conclusiones
La ingesta alta de aminoácidos no afectó la supervivencia, pero redujo la incidencia de retraso del crecimiento hasta el momento del alta hospitalaria. La ingesta alta de aminoácidos puede producir otros efectos, que incluyen un aumento del crecimiento de la cabeza y una reducción de los trastornos oculares (retinopatía del prematuro), aunque estos efectos no están claros. La evidencia indica que la ingesta alta de aminoácidos puede no ser tolerada por todos los lactantes. Se necesitan más estudios de investigación para determinar la ingesta óptima de aminoácidos en la nutrición parenteral y el equilibrio nutricional de lactantes prematuros.
Calidad de la evidencia
Evidencia de baja calidad indica que la ingesta alta de AA en la nutrición parenteral no afecta la mortalidad. Evidencia de muy baja calidad indica que la ingesta alta de AA reduce la incidencia de retraso del crecimiento posnatal, y que la ingesta alta de AA reduce la retinopatía del prematuro, pero no la retinopatía grave. La evidencia no fue suficiente para indicar si la ingesta alta de AA tuvo un efecto sobre el desarrollo neurológico.
Authors' conclusions
Summary of findings
| Higher versus lower amino acid intake in parenteral nutrition for newborn infants | ||||||
| Patient or population: preterm infants | ||||||
| Outcomes | Illustrative comparative risks* (95% CI) | Relative effect | No. of participants | Quality of the evidence | Comments | |
| Assumed risk | Corresponding risk | |||||
| Control | Higher vs lower amino acid intake in parenteral nutrition | |||||
| Mortality to hospital discharge | Study population | RR 0.9 | 1407 | ⊕⊕⊝⊝ | No significant differences found in subgroup analyses according to amino acid intake at commencement, at maximal intake, or at commencement and maximal intake; according to management of caloric balance (non‐protein caloric intake); in very preterm or very low birth weight infants; according to age of commencement; or according to timing of lipid intake Quality of evidence downgraded owing to imprecision and potential for publication or reporting bias | |
| 131 per 1000 | 118 per 1000 | |||||
| Moderate | ||||||
| 127 per 1000 | 114 per 1000 | |||||
| Neurodevelopmental disability | Study population | RR 1.04 | 201 | ⊕⊝⊝⊝ | Limited neurodevelopmental data. No significant differences found for any secondary outcome including cerebral palsy, developmental delay, blindness, deafness, Bayley Scales of Infant Development scores, or autism Quality of evidence downgraded owing to risk of bias, inconsistency, imprecision, and potential for publication or reporting bias | |
| 118 per 1000 | 122 per 1000 | |||||
| Moderate | ||||||
| 108 per 1000 | 112 per 1000 | |||||
| Postnatal growth failure at discharge (weight < 10th centile) | Study population | RR 0.74 | 203 | ⊕⊝⊝⊝ | Subgroup analyses found significant reduction in postnatal growth failure at discharge for infants commenced on high amino acid intake (> 2 to ≤ 3 g/kg/d) that increased amino acid and non‐protein caloric intake; commenced intake at < 24 hours' age; and provided early lipid infusion. Quality of evidence downgraded owing to risk of bias, imprecision, and potential for publication or reporting bias | |
| 554 per 1000 | 410 per 1000 | |||||
| Moderate | ||||||
| 684 per 1000 | 506 per 1000 | |||||
| Weight gain to discharge (g/kg/d) | Mean weight gain to discharge (g/kg/d) in intervention groups was | 291 | ⊕⊝⊝⊝ | No significant subgroup effects found according to intake; timing of commencement; management of caloric balance; or timing of lipid intake Reduction in weight gain to 1 month age attributable to the effect of a single study (Balasubramanian 2013) that did not provide a lipid infusion Quality of evidence downgraded owing to risk of bias, imprecision, and potential for publication or reporting bias | ||
| Head circumference growth to discharge (cm/week) | Mean head circumference growth to discharge (cm/week) in intervention groups was | 315 | ⊕⊝⊝⊝ | Subgroup analyses found a significant increase in head circumference growth to discharge for infants on high amino acid intake (> 2 to ≤ 3 g/kg/d) at commencement; and for infants on high (> 3 to ≤ 4 g/kg/d) amino acid intake at maximal intake. All studies provided isocaloric non‐protein energy intake and early lipid infusion in both groups. Quality of evidence downgraded owing to risk of bias, inconsistency, imprecision, and potential for publication or reporting bias | ||
| Retinopathy of prematurity | Study population | RR 0.44 | 269 | ⊕⊝⊝⊝ | Subgroup analyses found reduction in retinopathy of prematurity in studies that commenced high (> 2 to ≤ 3 g/kg/d) amino acid intake; that increased amino acid and non‐protein caloric intake; in very preterm or very low birth weight infants; that commenced intake at < 24 hours' age; and provided early lipid infusion. Quality of evidence downgraded owing to risk of bias, imprecision, and potential for publication or reporting bias | |
| 144 per 1000 | 63 per 1000 | |||||
| Moderate | ||||||
| 179 per 1000 | 79 per 1000 | |||||
| Abnormal blood urea nitrogen (various criteria) | Study population | RR 2.77 | 688 | ⊕⊕⊕⊕ | Various criteria for abnormal blood urea nitrogen reported ranging from 10.0 mmol/L up to 21.4 mmol/L Significant subgroup effect with increasing level of amino acid intake | |
| 147 per 1000 | 406 per 1000 | |||||
| Moderate | ||||||
| 53 per 1000 | 147 per 1000 | |||||
| *The basis for the assumed risk (e.g. the median control group risk across studies) is provided in footnotes. The corresponding risk (and its 95% confidence interval) is based on the assumed risk in the comparison group and the relative effect of the intervention (and its 95% CI). | ||||||
| GRADE Working Group grades of evidence. | ||||||
| aWide confidence intervals do not preclude a significant effect. | ||||||
Background
Description of the condition
Nutrition is important for survival, growth, and development. Sick newborn and preterm infants frequently are not able to be fed enterally, necessitating parenteral fluid and nutrition. Despite advances in neonatal care, postnatal growth failure continues to be a ubiquitous problem among preterm neonates. In a 1995 to 1996 cohort of very low birth weight (VLBW) infants in the National Institute of Health and Child Development Research Network, 22% of the cohort was small for gestational age (SGA) at birth; however by 36 weeks' postmenstrual age (PMA), 97% of the cohort was below the 10th percentile in weight (Lemons 2001). Although inadequate nutritional support increases risks of postnatal growth failure and neurodevelopmental impairment among preterm infants (Lucas 1998), aggressive nutritional support might place them at higher risk of protein intolerance, development of metabolic syndrome with insulin resistance, and cardiovascular disease in later childhood and adulthood (Ehrenkranz 2006; Embleton 2001; Ong 2007).
Description of the intervention
Parenteral nutrition is widely used to prevent growth failure and malnutrition when nutritional support is provided to sick neonates who are unable to tolerate enteral intake owing to prematurity or the nature of their illness (AAP 2009; EPSGHAN 2005; Fusch 2009). An idealised optimal nutritional goal for neonates is one that duplicates normal in utero foetal growth rates (AAP 1998). Maximal weight‐specific protein gain occurs before 32 weeks' gestation (Micheli 1993), and the foetus uses amino acids as a major energy source (Gresham 1971; Lemons 1976). Postnatally, nutrition is generally introduced gradually over the first week of life because of concerns about nutrient intolerance by extreme preterm infants or very ill neonates. Lipids and glucose are frequently used at rates that exceed in utero delivery rates, but amounts of amino acid are lower than those provided at in utero delivery rates. Increasing amino acid intake during parenteral nutrition provided shortly after birth has the potential to increase protein accretion rates and growth in newborn infants. Amino acid intake may be increased during parenteral nutrition by providing increased start or initial intake of amino acids, increased rate of grading of amino acids, increased final intake of amino acids, or a combination of these strategies. Amino acid intake, particularly in the early transitional phase of a preterm infant's life, is limited by the range of fluid load and protein intake that an adapting or sick infant can deal with, as well as by the stability of the parenteral nutrition formulation (EPSGHAN 2005).
How the intervention might work
A concern associated with high amino acid intake in parenteral nutrition involves protein intolerance as reflected by higher ammonia and blood urea levels. These higher levels may reflect effective use of amino acids rather than protein intolerance (Thureen 1999). In contrast, low initial amino acids have been associated with postnatal malnutrition and have produced measurable growth failure at hospital discharge (Ehrenkranz 1999; Lucas 1994; Ziegler 1991). Low early protein intake is also associated with poor long‐term developmental outcomes (Lucas 1998).
Prevention of a negative nitrogen balance is achieved in preterm infants by providing amino acids at a rate of 1 to 1.5 g/kg/d (Kashyap 1994a; Rivera 1993; Thureen 2003; van Lingen 1992). Achieving a body composition that more closely resembles foetal body composition may require a higher amino acid intake. In the extremely low birth weight infant, achieving intrauterine protein accretion rates may require up to 3.85 g/kg/d of protein (Ziegler 1994). Evidence suggests that preterm infants may have a higher protein turnover rate relative to term infants (Hay 1996). Animal studies such as Lemons 1976 and human studies such as Gresham 1971 have shown that amino acids are a significant source of energy during intrauterine life. In addition to protein intake, energy is required for protein anabolism (Kashyap 1994). Intake of 25 to 40 kcal of non‐protein energy per gram of protein allows optimal protein accretion (Cauderay 1988). When energy availability from a non‐protein nitrogen source is limited, protein anabolism is decreased and protein is used for energy. When energy is limited and protein is used as an energy source, optimal protein synthesis cannot occur (Kashyap 1994). On the other hand, increasing non‐protein nitrogen calories without increasing protein intake is also not helpful. Preterm and term infants showed an increase in protein synthesis of a similar magnitude with parenteral nutrition, whereas increasing intravenous glucose administration did not decrease proteolysis despite a threefold increase in insulin concentration (Denne 1996).
Potential benefits of higher protein intake also include greater growth of lean tissue and bone mass, thereby preventing postnatal growth failure and leading to improved glucose tolerance, synthesis of hormones and enzymes, and maintenance of oncotic pressure (Fomon 1993). In an animal study, higher protein intake was shown to accelerate maturation of the renal tubules (Jakobsson 1990; Thureen 2003). Deficiency of protein in infants leads to growth failure causing oedema and decreased resistance to infection (Nayak 1989).
Risks of higher protein intake include increased concentrations of amino acids (especially tyrosine and phenylalanine), metabolic acidosis, hyperammonaemia, and elevated blood urea nitrogen (Micheli 1993; Senterre 1983). This risk is more pronounced with increasing prematurity. High protein intake could lead to cholestasis, and the phosphate content of amino acid solutions may increase the neonate's tendency toward hypocalcaemia (Andronikou 1983). Renal hypertrophy and increased circulating insulin‐like growth factor‐1 have been reported secondary to high protein intake (Murray 1993). High protein intake in early life may increase risks of long‐term obesity and development of diabetes (Raiha 2001; Rolland 1995; Scaglioni 2000). Therefore, it is important for researchers and care providers to consider the consequences of early nutrition.
Why it is important to do this review
Despite significant advances in neonatal care, postnatal growth failure is an event of major concern. Potential benefits of higher amino acid intake during parenteral nutrition of improved nitrogen balance, growth, and infant health may be outweighed by the infant's ability to utilise high intakes of parenteral amino acid, especially in the days after birth, resulting in high concentrations of amino acids, ammonia, and urea, and an exacerbation of metabolic acidosis. It is important to determine the optimal amount of amino acid intake via parenteral nutrition for the growth and health of newborn infants.
Objectives
The primary objective is to determine whether higher versus lower intake of amino acid is associated with improved growth and disability‐free survival in newborn infants receiving parenteral nutrition.
Secondary objectives include determining whether:
-
higher versus lower starting or initial intake of amino acids is associated with improved growth and disability‐free survival without side effects;
-
higher versus lower intake of amino acids at maximal intake is associated with improved growth and disability‐free survival without side effects; and
-
increased amino acid intake should replace non‐protein energy intake (glucose and lipid), should be added to non‐protein energy intake, or should be provided simultaneously with non‐protein energy intake.
We conducted subgroup analyses to look for differences in the effects of higher versus lower intake of amino acids according to gestational age, birth weight, age at commencement, and condition of the infant, or concomitant increases in fluid intake.
Methods
Criteria for considering studies for this review
Types of studies
Randomised, quasi‐randomised, and cluster‐randomised trials were eligible.
Types of participants
We included trials enrolling neonates (postnatal age ≤ 28 days) admitted to the intensive care unit while receiving parenteral nutrition (PN). We excluded trials enrolling neonates with genetic or metabolic disease affecting protein metabolism.
Types of interventions
We performed separate primary comparisons of studies according to the method of increase in intake of amino acid.
-
Higher versus lower amino acid intake at commencement of parenteral nutrition.
-
Higher versus lower amino acid intake at maximal intake of parenteral nutrition.
-
Higher versus lower amino acid intake at commencement and maximal intake of parenteral nutrition.
Amino acid intake at commencement and maximal intake refer to the dose of parenteral amino acid at these points.
Definitions of amino acid intake at commencement of parenteral nutrition include the following.
-
Very low amino acid intake (≤ 1 g/kg/d).
-
Low amino acid intake (> 1 to ≤ 2 g/kg/d).
-
High amino acid intake (> 2 to ≤ 3 g/kg/d).
-
Very high amino acid intake (> 3 g/kg/d).
Definitions of amino acid intake at maximal infusion of parenteral nutrition include the following.
-
Very low amino acid intake (≤ 2 g/kg/d).
-
Low amino acid intake (> 2 to ≤ 3 g/kg/d).
-
High amino acid intake (> 3 to ≤ 4 g/kg/d).
-
Very high amino acid intake (> 4 g/kg/d).
Amino acid intake refers only to parenteral intake.
Types of outcome measures
Primary outcomes
-
Mortality before hospital discharge
-
Neurodevelopmental disability at ≥ 18 months' postnatal age (defined as neurological abnormality including cerebral palsy on clinical examination, developmental delay more than two standard deviations below the population mean on a standardised test of development, blindness (visual acuity < 6/60), or deafness (any hearing impairment requiring amplification) at any time after term corrected)
-
Postnatal growth failure (weight < 10th percentile near term corrected age or at discharge)
Secondary outcomes
Growth of infant
-
Days to regain birth weight
-
Maximal weight loss
-
Gram
-
Per cent
-
-
Weight gain
-
Up to age 1 month (g/kg/d)
-
At latest time measured (g/kg/d) (definition = from 1 month to time of discharge)
-
To follow‐up beyond 12 months (kg/y)
-
-
Linear growth
-
Up to age 1 month (cm/week)
-
At latest time measured (cm/week)
-
To follow‐up beyond 12 months (cm/y)
-
-
Head circumference
-
Up to age 1 month (cm/week)
-
At latest time measured (cm/week)
-
To follow‐up beyond 12 months (cm/y)
-
Change in standardised growth
-
Change in weight z‐score
-
Up to age 1 month
-
At latest time measured
-
To follow‐up beyond 12 months
-
-
Change in length z‐score
-
Up to age 1 month
-
At latest time measured
-
To follow‐up beyond 12 months
-
-
Change in head circumference z‐score
-
Up to age 1 month
-
At latest time measured
-
To follow‐up beyond 12 months
-
Other secondary outcomes
-
Days to full enteral feeds
-
Late‐onset sepsis (positive bacterial culture in cerebrospinal fluid (CSF), sterile urine, or blood at > 48 hours)
-
Necrotising enterocolitis (Bell's stage > 1)
-
Chronic lung disease (respiratory support or oxygen requirement at or beyond 36 weeks' postmenstrual age)
-
Intraventricular haemorrhage (any or severe ‐ grade III or IV) (Papile 1978)
-
Periventricular leukomalacia (cystic)
-
Term magnetic resonance imaging (MRI) brain abnormalities graded as normal, mild, moderate, or severe (e.g. Inder 2003)
-
Retinopathy of prematurity (any or severe ‐ grade 3 or 4) (International Committee 2005)
-
Individual components of neurodevelopment at least 18 months' postnatal age
-
Cerebral palsy on clinical examination
-
Developmental delay more than two standard deviations below population mean on a standardised test of development
-
Blindness (visual acuity < 6/60)
-
Deafness (any hearing impairment requiring amplification) at any time after term corrected
-
Biochemical abnormalities occurring during the first week of life
-
Negative nitrogen balance
-
Incidence of abnormal serum ammonia > 122 μmol/L, as reported by Usmani 1993, and blood urea nitrogen (BUN) levels > 14.3 mmol/L [mg/dL × 0.357], as reported by Ridout 2005 [Conversion BUN = blood urea divided by 2.14] [post hoc analysis: upper 95% confidence interval (CI) for plasma ammonia in healthy term infants at birth: 63 μmol/L, and for preterm infants at 7 days: 69 μmol/L]
-
Incidence of hyperglycaemia, plasma glucose > 8.3 mmol/L [mg/dL × 0.0555], as reported by Hays 2006, or any hyperglycaemia treated with insulin therapy
-
Incidence of hypoglycaemia < 2.6 mmol/L (Duvanel 1999; Lucas 1988)
-
Incidence of low serum albumin, preterm < 18 g/L [g/dL × 10], as reported by Reading 1990 and Zlotkin 1987), and > 37 weeks < 25 g/L, as reported by Zlotkin 1987
-
Incidence of metabolic acidosis where pH < 7.25, as reported by Koch 1968, or base excess (BE) > ‐5, or both
-
Incidence of cholestasis, serum level of direct bilirubin > 20% of total serum bilirubin, or serum level of direct bilirubin > 34 mmol/L [mg/dL × 17.10], as reported by AAP 2004
Search methods for identification of studies
Electronic searches
We used the criteria and standard methods of Cochrane and the Cochrane Neonatal Review Group (see the Cochrane Neonatal Group search strategy for specialized register).
We conducted a comprehensive search including the Cochrane Central Register of Controlled Trials (CENTRAL; 2016, Issue 9) in the Cochrane Library; MEDLINE via PubMed (1966 to September 2016); Embase (1980 to September 2016); and the Cumulative Index to Nursing and Allied Health Literature (CINAHL) (1982 to September 2016). We documented search strategies in Appendix 1 and Appendix 2 and did not apply language restrictions. We documented in Appendix 3 the search as updated on 2 June 2017.
Searching other resources
We identified abstracts and conference and symposia proceedings from the Society of Pediatric Research and the American Academy of Pediatrics; the Perinatal Society of Australia and New Zealand (PSANZ); the European Society for Paediatric Gastroenterology, Hepatology and Nutrition; and the North American Society for Pediatric Gastroenterology, Hepatology and Nutrition. We (DO and SB) independently reviewed cross‐references for additional relevant titles and abstracts of articles up to 50 years old. We contacted experts to ask about other studies relevant to the topic.
We identified completed and ongoing trials in trial registries at the following websites: www.clinicaltrials.gov; www.controlled‐trials.com; anzctr.org.au; and who.int/ictrp.
Data collection and analysis
We used the standardised review method of the Cochrane Neonatal Review Group (CNRG) in conducting this systematic review (http://neonatal.cochrane.org/en/index.html). We entered and cross‐checked data using RevMan 5 software (RevMan 2014).
Selection of studies
Two review authors (DO and SB) independently assessed eligibility for inclusion in this review. When we were uncertain about inclusion of the study, we retrieved the full text. We resolved differences by consensus.
Data extraction and management
We extracted data independently (DO, LJ, and TS) using RevMan 5 software (RevMan 2014). We resolved differences by consensus. We sought data from one unpublished trial by trying to contact the trial author but without success (Kashyap 2007).
Assessment of risk of bias in included studies
We assessed risk of bias (DO and SB) for each study using the criteria outlined in the Cochrane Handbook for Systematic Reviews of Interventions (Higgins 2011).
-
Random sequence generation: selection bias (biased allocation to interventions) due to inadequate generation of a randomised sequence.
-
Allocation concealment: selection bias (biased allocation to interventions) due to inadequate concealment of allocations before assignment.
-
Blinding of participants and personnel: performance bias due to knowledge of allocated interventions by participants and personnel during the study.
-
Blinding of outcome assessment: detection bias due to knowledge of allocated interventions by outcome assessors.
-
Incomplete outcome data: attrition bias due to quantity, nature, or handling of incomplete outcome data.
-
Selective reporting:reporting bias due to selective outcome reporting.
-
Other bias: bias due to problems not covered elsewhere in the table.
See Appendix 4 for a detailed description of risk of bias for each domain.
Quality of evidence
We assessed the quality of evidence for the main comparison at the outcome level using the Grading of Recommendations Assessment, Development and Evaluation (GRADE) approach (Guyatt 2011a). This methodological approach considers evidence from randomised controlled trials as high quality that may be downgraded based on consideration of any of five areas: design (risk of bias), consistency across studies, directness of evidence, precision of estimates, and presence of publication bias (Guyatt 2011a).
The GRADE approach yields an assessment of the quality of a body of evidence according to one of four grades (Schünemann 2013).
-
High: We are very confident that the true effect lies close to that of the estimate of the effect.
-
Moderate: We are moderately confident in the effect estimate: The true effect is likely to be close to the estimate of the effect, but there is a possibility that it is substantially different.
-
Low: Our confidence in the effect estimate is limited: The true effect may be substantially different from the estimate of the effect.
-
Very low: We have very little confidence in the effect estimate: The true effect is likely to be substantially different from the estimate of effect.
Review authors (DO and LJ) independently assessed the quality of evidence obtained for outcomes identified as critical or important for clinical decision‐making. These outcomes included mortality to hospital discharge, neurodevelopmental disability, postnatal growth failure at discharge, weight gain (g/kg/d) to discharge, head circumference growth (cm/week) to discharge, and retinopathy of prematurity. Biochemical effects including abnormal blood urea nitrogen and hyperglycaemia were considered retrospectively.
In cases for which we considered risk of bias as arising from inadequate concealment of allocation, randomised assignment, complete follow‐up, or blinded outcome assessment, to reduce our confidence in effect estimates, we downgraded the quality of evidence accordingly (Guyatt 2011b). We evaluated consistency by determining similarity of point estimates, extent of overlap of confidence intervals, and statistical criteria including measurement of heterogeneity (I2). We downgraded the quality of evidence when we noted large and unexplained inconsistency across study results (i.e. when some studies suggest important benefit and others report no effect or harm without a clinical explanation) (Guyatt 2011d). We assessed precision from the width of the 95% confidence interval (CI) and by calculating the optimal information size (OIS). If the total number of participants included in the pooled effect estimate was less than the number of participants generated by a conventional sample size calculation for a single adequately powered trial, we considered rating down for imprecision (Guyatt 2011c). When trials were conducted in populations other than the target population, we downgraded the quality of evidence because of indirectness (Guyatt 2011e).
We entered data (i.e. pooled estimates of effects and corresponding 95% CIs) and explicit judgements for each of the assessed aspects into the Guideline Development Tool, the software used to create ‘Summary of findings’ tables (GRADEpro 2008). We explained all judgements involving assessment of study characteristics described above in footnotes or comments within the summary of findings Table for the main comparison.
Measures of treatment effect
We carried out statistical analysis using standard methods of the Cochrane Neonatal Review Group.
Dichotomous data
We reported dichotomous data using risk ratio (RR) and risk difference (RD), each with the 95% confidence interval (CI). If we noted a statistically significant reduction in RD, we calculated the number needed to treat for an additional beneficial outcome (NNTB) or the number needed to treat for an additional harmful outcome (NNTH) and associated 95% CIs.
Continuous data
We reported continuous data by using mean difference (MD) with 95% CI.
Conversion of non‐parametric data
For studies that reported non‐parametric data, we calculated means and standard deviations using medians and interquartile ranges. When sample sizes are large and the distribution of the outcome is similar to the normal distribution, the width of the interquartile range will be approximately 1.35 standard deviations (Hozo 2005).
Unit of analysis issues
The unit of randomisation was the intended unit of analysis, and we expected this to be individual infants. Cluster‐randomised controlled trials were eligible for inclusion.
Cluster‐randomised trials
We planned to include cluster‐randomised trials in the analyses along with individually randomised trials. We intended to analyse them in keeping with methods described in the Cochrane Handbook for Systematic Reviews of Interventions (Higgins 2011), using an estimate of the intracluster correlation coefficient (ICC) derived from the trial (if possible) or from another source. If ICCs from other sources were used, we intended to report this and conduct sensitivity analyses to investigate effects of variations in the ICC. If we identified both cluster‐randomised trials and individually randomised trials, we planned to synthesise the relevant information. We considered it reasonable to combine results from both if we noted little heterogeneity between study designs, and if we considered interaction between effect of the intervention and choice of the randomisation unit to be unlikely.
Dealing with missing data
We obtained missing data from trial authors when possible. When missing data were not obtained, we examined the effect of excluding trials with substantial (e.g. > 10% losses) missing data by performing a sensitivity analysis.
Assessment of heterogeneity
We used RevMan 5 software (RevMan 2014) to assess the heterogeneity of treatment effects between trials. We used the following.
-
Chi2 test, to assess whether observed variability in effect sizes between studies is greater than would be expected by chance. As this test has low power when the number of studies included in the meta‐analysis is small, we set the probability at the 10% level of significance.
-
I2 statistic, to ensure that pooling of data was valid. We graded the degree of heterogeneity as follows: < 25% none, 25% to 49% low, 50% to 74% moderate, and 75%+ high.
We assessed the source of heterogeneity by performing sensitivity and subgroup analyses to look for evidence of bias or methodological differences between trials when evidence suggested apparent or statistical heterogeneity.
Assessment of reporting biases
We assessed reporting bias by comparing stated primary and secondary outcomes and reported outcomes. When study protocols were available, we compared these against study publications to determine the likelihood of reporting bias. We investigated reporting biases (such as publication bias) by using funnel plots. We assessed funnel plot asymmetry visually. We did not use formal tests to assess funnel plot asymmetry. We planned to perform exploratory analyses to investigate when asymmetry was detected by visual assessment.
Data synthesis
We performed statistical analyses according to recommendations of the CNRG (http://neonatal.cochrane.org/en/index.html). We analysed all randomised infants on an intention‐to‐treat (ITT) basis. We analysed treatment effects in individual trials. We used a fixed‐effect model in the first instance to combine data. For any meta‐analyses for categorical outcomes, we calculated typical estimates of RR and RD, each with the 95% CI; for continuous outcomes, we calculated the mean difference (MD) if outcomes were measured in the same way between trials, and standardised mean difference (SMD) to combine trials that measured the same outcome while using different scales. We planned to analyse and interpret individual trials separately when we judged meta‐analysis to be inappropriate.
Subgroup analysis and investigation of heterogeneity
We performed subgroup analyses of trial results (restricted to primary comparisons) according to the following.
-
Management of caloric balance (protein, carbohydrate, and lipid) within trials.
-
-
Increase in amino acids to provide isocaloric nutrition compared with lower amino acid intake.
-
Increase in amino acids and provision of isocaloric non‐protein nutrition compared with lower amino acid intake.
-
Increase in amino acids and non‐protein caloric intake together compared with lower amino acid intake.
-
-
Type of infant at commencement.
-
-
Studies enrolling relatively healthy infants or infants not selected on the basis of 'health status'.
-
Studies enrolling 'sick' infants (e.g. infants with moderate‐severe respiratory distress, receiving cardiovascular support, possible sepsis, acidosis).
-
Studies enrolling 'surgical' or postoperative infants or infants post cardiopulmonary bypass.
-
-
Gestational age.
-
-
Studies enrolling term infants (≥ 37 weeks).
-
Studies enrolling preterm infants (< 37 weeks' gestational age).
-
Studies enrolling extremely preterm infants (< 28 weeks' gestation).
-
-
Birth weight.
-
-
Studies enrolling low birth weight infants (< 2500 grams).
-
Studies enrolling very low birth weight infants (< 1500 grams).
-
Studies enrolling extremely low birth weight infants (< 1000 grams).
-
-
Age at commencement.
-
-
Total parenteral nutrition (TPN) at < 24 hours' age.
-
TPN at ≥ 24 to < 48 hours' age.
-
TPN at ≥ 48 to < 72 hours' age.
-
TPN at ≥ 72 hours' age.
-
-
According to lipid intake (not prespecified).
-
-
Early lipid infusion.
-
Delayed lipid infusion ≥ 5 days.
-
No lipid infusion.
-
-
Concomitant increases in fluid intake.
-
-
Trials increasing amino acid intake with constant fluid intake in both groups.
-
Trials increasing amino acid intake by increasing fluid intake in the higher amino acid group.
-
Sensitivity analysis
We explored methodological heterogeneity by performing sensitivity analyses when sufficient data were available. We performed sensitivity analyses by excluding trials of lower quality based on lack of any of the following: allocation concealment, adequate randomisation, blinding of treatment, less than 10% loss to follow‐up.
Results
Description of studies
Results of the search
The CENTRAL search strategy yielded 140 records, and the MEDLINE and Embase search strategy 221 records. An updated search conducted in June 2017 identified an additional included study (Uthaya 2016), additional publications of included studies (Morgan 2014; Vlaardingerbroek 2013), and an additional excluded study (Bellagamba 2016). In total, we assessed 56 full reports for eligibility, resulting in 32 included studies, 23 excluded studies, and one ongoing study (Bloomfield 2015) (see PRISMA diagram in Figure 1).
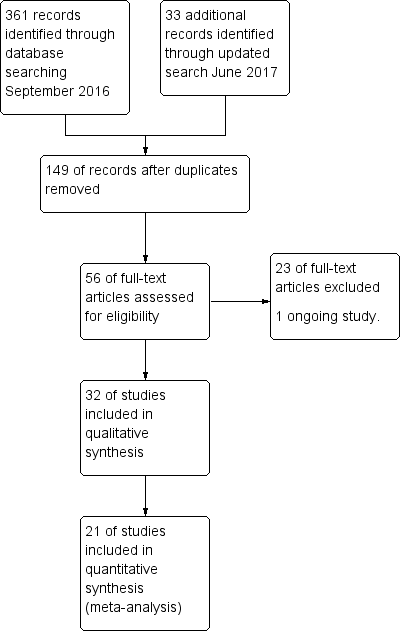
Study flow diagram.
Included studies
We assessed 32 studies that compared higher versus lower amino acid intake in parenteral nutrition (PN) as eligible for inclusion. We have reported the specifics of inclusion and exclusion criteria under Characteristics of included studies and in Table 1.
| Trial | Infants | Higher AA group | Lower AA group | Lipid | Enteral feed |
| Anderson 1979 | Infants at < 37 weeks, AGA | 2.5 g/kg/d day 1 to 5 | 0 g/kg/d day 1 to 5 | No lipid. Isocaloric | No enteral feeds |
| Balasubramanian 2013 | Birth weight 900 to 1250 grams | 3 g/kg day 1 graded to 4 g/kg day 2 | 1 g/kg day 1 graded to 4 g/kg day 4 | No lipid | Similar early enteral feeds |
| Black 1981 | Infants with respiratory distress | Graded up to 2.8 g/kg/d from day 3 to 4 | 0 g/kg/d from day 3 to 4 | Lipid in amino acid group | Similar delayed enteral feeds |
| Blanco 2008 | Birth weight < 1000 grams | 2.0 g/kg day 1 graded to 4.0 g/kg day 3 | 0.5 g/kg day 2 graded to 3.0 g/kg day 7 | Similar lipid from day 1 | Enteral feeds unclear |
| Bulbul 2012 | Infants at < 32 weeks' gestation | 3 g/kg from day 1 | 1 g/kg day 1 graded to 3 g/kg day 3 | Lipid 3 g/kg day 1 vs 1 g/kg day 1 increasing to 3 g/kg day 3 | Similar early enteral feeds |
| Burattini 2013 | Birth weight 500 to 1249 grams | 2.5 g/kg day 1 graded to 4.0 g/kg day 4 | 1.5 g/kg day 1 graded to 2.5 g/kg day 3 | Similar lipid from day 5 | Similar early enteral feeds |
| Can 2012 | Infants at 27 to 33 weeks' gestation | 3.0 g/kg day 1 graded to 4.0 g/kg day 2 | 1.5 g/kg day 1 graded to 4.0 g/kg day 3 | Higher early lipid from day 1 (2 g/kg day 1 and 3 g/kg day 2 vs 1 g/kg day 1 graded to 3 g/kg day 3) | Similar early enteral feeds |
| Can 2013 | Infants at < 32 weeks' gestation | 3.0 g/kg day 1 graded to 4.0 g/kg day 2 | 1.5 g/kg day 1 graded to 4.0 g/kg day 3 | Higher early lipid from day 1 (2 g/kg day 1 and 3 g/kg day 2 vs 1 g/kg day 1 graded to 3 g/kg day 3) | Similar early enteral feeds |
| Clark 2007 | Infants at 23 to < 30 weeks' gestation | 1.5 g/kg day 2 graded to 3.5 g/kg day 3 | 1.0 g/kg day 2 graded to 2.5 g/kg day 4 | Similar early lipid from day 1 | Similar early enteral feeds |
| Hata 2002 | Surgical term infants | 3.45 g/kg/d | 2.59 g/kg/d vs 1.72 g/kg/d | No lipid | No enteral feeds |
| Heimler 2010 | Infants at < 34 weeks' gestation | 1.5 g/kg day 1 graded to 2.5 g/kg day 3 | 0 g/kg day 1 to 3 graded to 2.5 g/kg day 7 | Similar lipid from day 4 | No enteral feeds to day 4 |
| Ibrahim 2004 | Birth weight 501 to 1250 grams and at 24 to 32 weeks' gestation | 3.5 g/kg day 1 to 7 | 0 g/kg day 1 to 2, 2.0 g/kg day 3 graded to 3.5 g/kg day 7 | Higher early lipid from day 1 | No enteral feeds to day 7 |
| Kashyap 2007 | Birth weight < 1250 grams | 18% protein:NPE day 1 graded to 4.0 g/kg/d | 12.5% protein:NPE graded to 3.0 g/kg/d | Early lipid from day 1 | Similar early enteral feeds |
| Liu 2014 | Birth weight 1000 to 2000 grams | 3.0 g/kg day 1 graded to 4.0 g/kg/d | 2.0 g/kg day 1 graded to 3.7 g/kg/d 1.0 g/kg day 1 graded to 3.5 g/kg/d | Similar early lipid from day 2 | Similar early enteral feeds from day 3 |
| Makay 2007 | Infants at ≥ 35 weeks' gestation | 1.0 g/kg day 1 graded to 3.0 g/kg day 5 | 0 g/kg day 1 graded to 3.0 g/kg day 7 | Higher lipid from day 2 | No enteral feeds |
| Morgan 2014 | Infants at < 29 weeks’ gestation and birth weight < 1200 grams | 1.8 g/kg day 1 to 2; 2.9 g/kg day 3 to 4 increased to 3.9 g/kg day 5 | 1.8 g/kg day 1 to 2; AA 2.4 g/kg day 3 to 4 increased to 2.8 g/kg day 5 | Similar early lipid from day 1; higher lipid from day 5 Similar glucose day 1 to 2; higher glucose from day 3 | Similar early enteral feeds |
| Murdoch 1995 | Birth weight < 2000 grams | 1.0 g/kg day 1 and 1.4 g/kg day 2 | 0 g/kg day 1 to 2 | Higher lipid (no lipid control group) | No enteral feeds |
| Pappoe 2009 | Birth weight 600 to 1200 grams | 2.0 g/kg day 1 graded to 3.5 g/kg day 3 | 1.0 g/kg day 1 graded to 3.5 g/kg day 6 | Higher lipid from day 1 | Similar early enteral feeds |
| Pildes 1973 | Infants < 1500 grams at 24 to 48 hours' age | Unclear intake (solution 3.4 g/100 mL) | 0 g/kg/d | No lipid | Similar enteral feeds |
| Rivera 1993 | Preterm infants with respiratory distress < 24 hours old on mechanical ventilation | 1.5 g/kg day 1 to 3 | 0 g/kg/d | No lipid | No enteral feeds |
| Scattolin 2013 | Birth weight < 1250 grams | 2.0 g/kg day 1 graded to 4.0 g/kg day 4 | 1.5 g/kg day 1 graded to 3.0 g/kg day 4 | Lipid intake not reported | Similar early enteral feeds |
| Tan 2008 | Infants at < 33 weeks' gestation | 1.0 g/kg day 1 graded to 4.0 g/kg day 7 | 1.0 g/kg day 1 graded to 3.0 g/kg day 7 | Higher lipid from day 1 | Similar early enteral feeds |
| Tang 2009 | Birth weight 1000 to 2000 grams | 2.4 g/kg day 1 graded to 3.6 g/kg day 2 | 1.0 g/kg day 1 graded to 3.0 g/kg day 6 vs 0 g/kg day 1 graded to 3.0 g/kg day 9 | Similar lipid from day 3 | Enteral feeds unclear |
| te Braake 2005 | Birth weight ≤ 1500 grams | 2.4 g/kg day 1 to 4 | 0 g/kg day 1 to 2 graded to 2.4 g/kg day 3 to 4 | Similar early lipid from day 2 | Similar early enteral feeds |
| Thureen 2003 | Birth weight ≤ 1300 grams | 2.56 g/kg day 1 to 2 | 0.85 g/kg day 1 to 2 | Similar early lipid from day 1 | No early enteral feeds |
| Uthaya 2016 | Infants at < 31 weeks' gestation | 3.6 g/kg/d from day 1 | 1.7 g/kg/d day 1, 2.1 g/kg/d day 2, maximum 2.7 g/kg/d day 3 | Similar early lipid from day 1 | Similar early enteral feeds |
| Vaidya 1995 | Birth weight < 1250 grams | 0.5 g/kg day 3 graded to 3.0 g/kg day 7 | 0 g/kg/d | Higher lipid from day 5 (control no lipid) | Early enteral feed |
| van Goudoever 1995 | Birth weight < 2000 grams | 1.15 g/kg day 1 | 0 g/kg/d | No lipid | No enteral feeds |
| van Lingen 1992 | Preterm infants | Average 1.9 g/kg/d | 0 g/kg/d | Similar early lipid from day 2 | No enteral feeds |
| Vlaardingerbroek 2013 | Birth weight < 1500 grams | 3.6 g/kg day 2 to 6 | 2.4 g/kg day 2 to 6 | Similar early lipid from day 1 | No enteral feeds |
| Weiler 2006 | Infants at 24 to 32 weeks' gestation | 1.0 g/kg day 1 graded to 3.0 g/kg/d | 0 g/kg day 1, 1.0 g/kg day 2 graded to 3.0 g/kg/d | Similar lipid from day 3 | Factorial trial minimal enteral feeds from 3 days |
| Wilson 1997 | Birth weight < 1200 grams or 1200 to 1499 grams on mechanical ventilation | 0.5 g/kg day 1 graded to 3.5 g/kg day 7 | 0 g/kg day 1 to 2 graded to 2.5 g/kg day 7 | Higher early lipid intake from day 1 | Higher early enteral intake |
| Xie 2014 | Infants at < 34 weeks' gestation | 1.5 g/kg day 1 graded to 3.5 g/kg/d: graded by 1.0 g/kg/d | 1.5 g/kg day 1 graded to 3.5 g/kg/d: graded by 0.5 g/kg/d | Similar lipid from day 1 | Enteral feeds unclear |
Participants
Three studies enrolled preterm or low birth weight infants: Anderson 1979 enrolled preterm infants not expected to receive enteral feeds for five days; van Goudoever 1995 infants at birth weight < 2000 grams; and Xie 2014 infants at < 34 weeks' gestation with birth weight 1000 to 1800 grams.
Most of the remaining trials enrolled very low birth weight or very preterm infants (n = 26): Balasubramanian 2013 enrolled infants with birth weight 900 to 1250 grams; Blanco 2008 birth weight < 1000 grams; Bulbul 2012 at < 32 weeks' gestation; Burattini 2013 birth weight 500 to 1249 grams; Can 2012 at 27 to 33 weeks' gestation; Can 2013 at < 32 weeks' gestation; Clark 2007 at 23 to < 30 weeks' gestation; Heimler 2010 at < 34 weeks' gestation; Ibrahim 2004 birth weight 501 to 1250 grams and at 24 to 32 weeks' gestation; Kashyap 2007 birth weight < 1250 grams; Liu 2015 birth weight 1000 to 2000 grams; Morgan 2014 at < 29 weeks’ gestation and birth weight < 1200 grams; Murdock 1995 birth weight < 2000 grams; Pappoe 2009 birth weight 600 to 1200 grams; Pildes 1973 birth weight < 1500 grams; Rivera 1993 preterm infants with respiratory distress at mean gestation 28.5 weeks; Scattolin 2013 birth weight < 1250 grams; Tan 2008 at < 33 weeks' gestation; Tang 2009 birth weight 1000 to 2000 grams; te Braake 2005 birth weight ≤ 1500 grams; Thureen 2003 birth weight ≤ 1300 grams; Uthaya 2016 at < 31 weeks' gestation; Vaidya 1995 birth weight < 1250 grams; van Lingen 1992 at mean gestation higher group 30.7 weeks and lower group 31.0 weeks; Vlaardingerbroek 2013 birth weight < 1500 grams; and Weiler 2006 at 24 to 32 weeks' gestation.
Two studies enrolled term or near term infants: Makay 2007 enrolled infants at ≥ 35 weeks' gestation whose clinical condition precluded oral feeding for three days; and Hata 2002 enrolled surgical term infants receiving fat‐free parenteral nutrition for 10 days.
Black 1981 enrolled infants admitted for respiratory distress but did not report gestation or birth weight.
Interventions
Higher versus lower amino acid intake at commencement of PN
Anderson 1979 compared 2.5 g/kg day 1 to 5 versus 0 g/kg day 1 to 5. Investigators provided no lipid and no enteral feeds.
Balasubramanian 2013 compared 3 g/kg day 1 advanced to 4 g/kg day 2 versus 1 g/kg day 1 advanced to 4 g/kg day 4. Investigators provided no lipid and gave similar early enteral feeds to both groups.
Bulbul 2012 compared 3 g/kg day 1 versus 1 g/kg day 1 advanced to 3 g/kg day 3. Lipid intake was 3 g/kg day 1 versus 1 g/kg day 1 increased to 3 g/kg day 3. Investigators provided similar early enteral feeds to both groups.
Can 2012 compared 3.0 g/kg day 1 advanced to 4.0 g/kg day 2 versus 1.5 g/kg day 1 advanced to 4.0 g/kg day 3. Both groups had early lipid and the higher AA group also received higher early lipid from day 1. Investigators provided similar early enteral feeds to both groups.
Can 2013 compared 3.0 g/kg day 1 advanced to 4.0 g/kg day 2 versus 1.5 g/kg day 1 advanced to 4.0 g/kg day 3. Both groups had early lipid and the higher AA group also received higher early lipid from day 1. Investigators provided similar early enteral feeds to both groups.
Heimler 2010 compared 1.5 g/kg day 1 advanced to 2.5 g/kg day 3 versus 0 g/kg days 1 to 3 advanced to 2.5 g/kg day 7. Both groups had similar lipid from day 4 and received no enteral feeds to day 4.
Ibrahim 2004 compared 3.5 g/kg day 1 to 7 versus 0 g/kg day 1 to 2 and 2.0 g/kg day 3 advanced to 3.5 g/kg day 7. Infants in the higher AA group received higher early lipid from day 1 and received no enteral feeds to day 7.
Liu 2015 compared 3.0 g/kg day 1 advanced to 4.0 g/kg/d versus 2.0 g/kg day 1 advanced to 3.7 g/kg/d versus 1.0 g/kg day 1 advanced to 3.5 g/kg/d. Both groups received similar early lipid from day 2 and similar early enteral feeds from day 3.
Makay 2007 compared 1.0 g/kg day 1 advanced to 3.0 g/kg day 5 versus 0 g/kg day 1 advanced to 3.0 g/kg day 7. The higher AA group received higher lipid from day 2 and received no enteral feeds to day 7.
Murdock 1995 compared 1.0 g/kg day 1 and 1.4 g/kg day 2 versus 0 g/kg day 1 to 2. The higher AA group also received lipid, and the lower AA group received no lipid. Investigators provided no enteral feeds during the study period.
Pappoe 2009 compared 2.0 g/kg day 1 advanced to 3.5 g/kg day 3 versus 1.0 g/kg day 1 advanced to 3.5 g/kg day 6. The higher AA group received lipid from day 1. Both groups received similar early enteral feeds.
Rivera 1993 compared 1.5 g/kg day 1 to 3 versus 0 g/kg/d. Investigators provided no lipids and no enteral feeds to either group.
Thureen 2003 compared 2.56 g/kg day 1 to 2 versus 0.85 g/kg day 1 to 2. Both groups received similar early lipid from day 1 and received no early enteral feeds.
van Goudoever 1995 compared 1.15 g/kg from day 1 onwards versus no AA intake. Investigators provided no lipid and no enteral feeds.
van Lingen 1992 compared an average 1.9 g/kg/d versus no AA intake. Both groups received similar early lipid from day 2 and received no enteral feeds.
Vlaardingerbroek 2013 compared 3.6 g/kg day 2 to 6 versus 2.4 g/kg day 2 to 6. Both groups received similar early lipid from day 2 and received no enteral feeds.
Weiler 2006 compared 1.0 g/kg day 1 advanced to 3.0 g/kg/d versus 0 g/kg day 1, 1.0 g/kg day 2 advanced to 3.0 g/kg/d. Both groups received similar lipid from day 3 and in a factorial designed trial received minimal enteral feeds from 3 days.
Higher versus lower amino acid intake at maximal intake of PN
Morgan 2014 compared 1.8 g/kg day 1 to 2, then 2.9 g/kg day 3 to 4 increased to 3.9 g/kg day 5 versus 1.8 g/kg day 1 to 2, then 2.4 g/kg day 3 to 4 increased to 2.8 g/kg day 5. The higher amino acid group received similar early lipid from day 1 but higher lipid from day 5. The higher amino acid group received similar glucose days 1 to 2 but higher glucose from day 3. Both groups received similar early enteral feeds.
Tan 2008 compared 1.0 g/kg day 1 advanced to 4.0 g/kg day 7 versus 1.0 g/kg day 1 advanced to 3.0 g/kg day 7. The higher AA group received higher lipid from day 1. Both groups received similar early enteral feeds.
Higher versus lower amino acid intake at commencement and maximal intake of PN
Black 1981 compared grading up to 2.5 g/kg/d from day 3 to 4 versus 0 g/kg/d from day 3 to 4. Investigators provided higher lipid to the higher amino acid group and similar delayed enteral feeds to both groups.
Blanco 2008 compared 2.0 g/kg day 1 advanced to 4.0 g/kg day 3 versus 0.5 g/kg day 2 advanced to 3.0 g/kg day 7. Both groups received similar lipid intake from day 1. The enteral feed regimen was unclear.
Burattini 2013 compared 2.5 g/kg day 1 advanced to 4.0 g/kg day 4 versus 1.5 g/kg day 1 advanced to 2.5 g/kg day 3. Both groups received similar lipid from day 5 and similar early enteral feeds.
Clark 2007 compared 1.5 g/kg day 2 advanced to 3.5 g/kg day 3 versus 1.0 g/kg day 2 advanced to 2.5 g/kg day 4. Both groups received similar early lipid from day 1 and similar early enteral feeds.
Liu 2015 compared 3.0 g/kg day 1 advanced to 4.0 g/kg/d versus 2.0 g/kg day 1 advanced to 3.7 g/kg/d versus 1.0 g/kg day 1 advanced to 3.5 g/kg/d. Both groups received similar early lipid from day 2 and similar early enteral feeds from day 3.
Pildes 1973 compared use of an amino acid solution at 3.4 g/100 mL versus 0 g/kg/d. Investigators provided no lipid to either group and similar enteral feeds to both groups and did not report actual amino acid intakes.
Scattolin 2013 compared 2.0 g/kg day 1 advanced to 4.0 g/kg day 4 versus 1.5 g/kg day 1 advanced to 3.0 g/kg day 4. Investigators did not report lipid intake, so it is likely lipid was not given. Investigators provided similar early enteral feeds to both groups.
Tang 2009 compared three groups receiving 2.4 g/kg day 1 advanced to 3.6 g/kg day 2 versus 1.0 g/kg day 1 advanced to 3.0 g/kg day 6 versus 0 g/kg day 1 advanced to 3.0 g/kg day 9. All groups received similar early lipid from day 3. The enteral feed regimen is unclear.
te Braake 2005 compared 2.4 g/kg day 1 to 4 versus 0 g/kg day 1 to 2 advanced to 2.4 g/kg day 3 to 4. Both groups received similar early lipid from day 2 and similar early enteral feeds.
Uthaya 2016 compared 3.6 g/kg/d from day 1 versus 1.7 g/kg/d from day 1, 2.1 g/kg/d from day 2, and a maximum of 2.7 g/kg/d from day 3. Both groups received similar early lipid from day 1 and similar early enteral feeds.
Vaidya 1995 compared 0.5 g/kg day 3 advanced to 3.0 g/kg day 7 versus no AA intake. The higher AA group received lipid from day 5. Both groups received similar early enteral feeds.
Faster rate of grading of amino acid intake
Xie 2014 compared 1.5 g/kg day 1 graded by 1.0 g/kg/d to 3.5 g/kg/d versus 1.5 g/kg day 1 graded by 0.5 g/kg/d to 3.5 g/kg/d. Both groups received similar early lipid from day 1. The enteral feed regimen is unclear.
Term surgical infants
Hata 2002 compared three groups of surgical infants receiving 3.45 g/kg/d versus 2.59 g/kg/d versus 1.72 g/kg/d. Investigators provided no lipid and no enteral feeds.
Management of caloric balance
Trials that increased amino acids and provided isocaloric non‐protein caloric intake include the following: Anderson 1979; Balasubramanian 2013; Blanco 2008; Burattini 2013; Clark 2007; Hata 2002; Heimler 2010; Kashyap 2007; Liu 2015; Pildes 1973; Rivera 1993; Scattolin 2013; Tang 2009; te Braake 2005; Thureen 2003; Uthaya 2016; van Goudoever 1995; van Lingen 1992; Vlaardingerbroek 2013; Weiler 2006; Xie 2014.
Trials that increased amino acids and non‐protein caloric intake include the following: Black 1981; Bulbul 2012; Can 2012; Can 2013; Ibrahim 2004; Makay 2007; Morgan 2014; Murdock 1995; Pappoe 2009; Tan 2008; Vaidya 1995.
Management of lipid infusion
Trials that provided early lipid infusion include the following: Black 1981; Blanco 2008; Bulbul 2012; Can 2012; Can 2013; Clark 2007; Heimler 2010; Ibrahim 2004; Kashyap 2007; Liu 2015; Makay 2007; Morgan 2014; Murdock 1995; Pappoe 2009; Tan 2008; Tang 2009; te Braake 2005; Thureen 2003; Uthaya 2016; van Lingen 1992; Vlaardingerbroek 2013; Weiler 2006; Xie 2014.
Trials that provided delayed lipid infusion ≥ 5 days include the following: Burattini 2013; Vaidya 1995.
Trials that provided no lipid infusion include the following: Anderson 1979; Balasubramanian 2013; Hata 2002; Pildes 1973; Rivera 1993; Scattolin 2013; van Goudoever 1995.
Outcomes
See Characteristics of included studies for details of outcome reporting for each study. Of the 33 included studies, six were short‐term biochemical studies (Anderson 1979; Murdock 1995; Rivera 1993; Thureen 2003; van Goudoever 1995; van Lingen 1992), one was a trial that enrolled term surgical infants (Hata 2002), and another included infants at > 35 weeks (Makay 2007) ‐ all without substantial clinical reporting. Anderson 1979 reported mean weight loss, mean nitrogen balance, and mean BUN values, but we were not able to use the data in this review. Murdock 1995 reported biochemical tolerance during the first 48 hours, but we were not able to use the data in this review. Pildes 1973 reported mortality, biochemical data, days to regain birth weight, weight gain to 21 days, and time to reach discharge weight but did not report denominators, so we were unable to use the data in this review. Hata 2002 reported cholestasis but no other clinical outcomes. Kashyap 2007 has not yet published data. Of the 21 studies reporting clinical effects that could be included in this review, outcome reporting was variable across studies both for outcomes reported and for timing of reporting. Outcomes reported by more than 50% of studies (≥ 10 of 21) included mortality (14 studies), days to regain birth weight (12 studies), late‐onset sepsis (15 studies), necrotising enterocolitis (14 studies), chronic lung disease (10 studies), and severe intraventricular haemorrhage (11 studies).
We have reported several additional analyses in the primary comparison "Higher versus lower amino acid intake in parenteral nutrition" including weight, length, and head circumference; weight, length, and head circumference z‐scores; patent ductus arteriosus; development quotient scores; nitrogen and protein balance; maximal blood urea nitrogen; hyperkalaemia, and discontinued PN due to biochemical intolerance. As these outcomes were not prespecified, we did not include them in subsequent comparisons and in subgroup analyses.
Primary outcomes
Fifteen studies reported mortality. Balasubramanian 2013 reported losses due to death or discharge against advice together, so we could not use these data. Studies failing to report mortality included Anderson 1979,Black 1981,Bulbul 2012,Heimler 2010,Liu 2015,Makay 2007,Pildes 1973,Rivera 1993,Tang 2009,Weiler 2006, and Xie 2014. Only three studies reported developmental outcomes. Blanco 2008 evaluated infants at 0, 3, 6, 12, and 18 months' corrected gestational age and at 24 months' chronological age by examination and Bayley Scales of Infant Development (BSID II). te Braake 2005 assessed neurological status and Bayley SCID II at two years and reported postnatal growth failure at six weeks and two years of age (< 10th centile). Investigators reported the Bayley Mental Development Index (MDI) only for infants without disability. Vlaardingerbroek 2013 reported death or major disability at two years' corrected age using clinical examination and Bayley III (Bayley Scales of Infant and Toddler Development–Third Edition). Only three studies reported postnatal growth failure (Can 2012; Pappoe 2009; te Braake 2005).
Secondary outcomes
Only a minority of studies reported prespecified clinical outcomes. Investigators reported growth outcomes incompletely and variably and did not frequently report change in growth parameter or growth parameter z‐score. In addition, reporting of timing was variable.
Several studies assessed the safety and tolerance of parenteral nutrition provided for short periods. Anderson 1979 reported biochemical tolerance during the first five days, but we were not able to use the data in this review. Black 1981 reported effects up to day 7 on cholestasis parameters, although we did not report these data in this review as the reporting period is insufficient. Murdock 1995 reported biochemical tolerance during the first 48 hours, but were not able to use the data in this review. Pildes 1973 reported biochemical data but did not report denominators, so we were unable to use the data in this review. Rivera 1993 reported nitrogen and protein balances and provided no clinical data. Thureen 2003 reported short‐term protein balance and provided no clinical data. van Goudoever 1995 reported nitrogen balances and amino acid profiles but no clinical data. van Lingen 1992 reported nitrogen balances and provided no clinical data. Several other studies provided protein/nitrogen balances as well as other clinical outcomes (Heimler 2010; Ibrahim 2004; Xie 2014). No study reported negative nitrogen balance.
Excluded studies
We assessed 23 studies as studies to be excluded (see Characteristics of excluded studies for reasons for exclusion).
Risk of bias in included studies
We assessed only five studies as high quality with low risk of bias from allocation concealment, randomisation, blinding of treatment, and less than 10% loss to follow‐up for all reported outcomes (Bulbul 2012; Can 2012; Can 2013; Clark 2007; Morgan 2014). We assessed Blanco 2008 as having low risk of bias for mortality outcomes and biochemical outcomes, and Uthaya 2016 at low risk of bias for reporting mortality, sepsis, and necrotising enterocolitis; we determined that both were at high risk of attrition bias for other outcomes. We were not able to assess Kashyap 2007 for risk of bias. All other studies had methodological concerns as documented below. See risk of bias graph (Figure 2) and risk of bias summary (Figure 3).
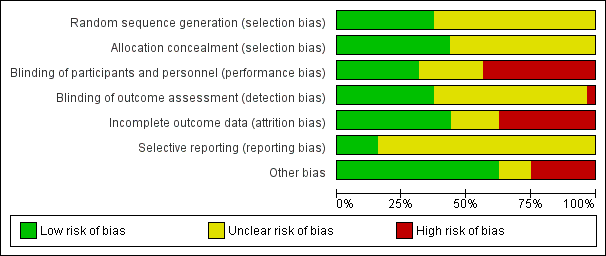
Risk of bias graph: review authors' judgements about each risk of bias item presented as percentages across all included studies.
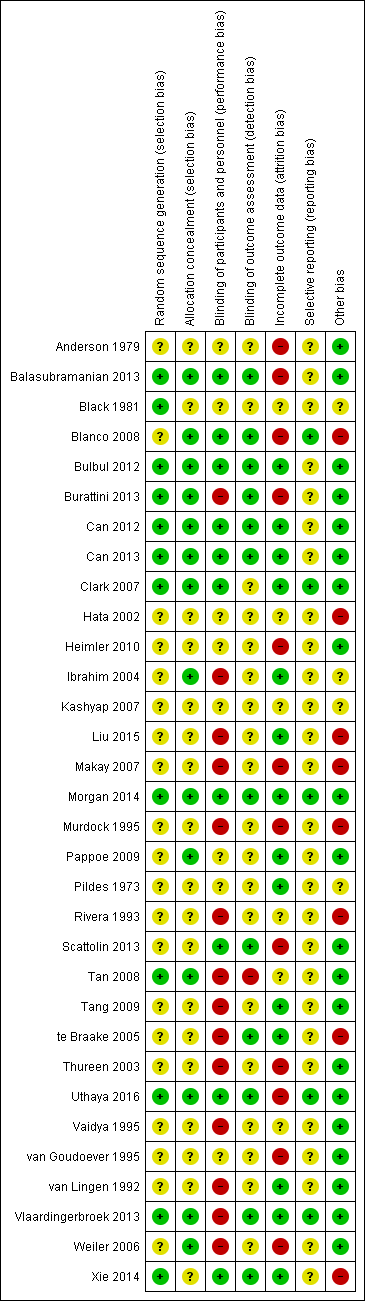
Risk of bias summary: review authors' judgements about each risk of bias item for each included study.
Allocation
We assessed random sequence generation as low risk for 12 studies (Balasubramanian 2013; Black 1981; Bulbul 2012; Burattini 2013; Can 2012; Can 2013; Clark 2007; Morgan 2014; Tan 2008; Uthaya 2016; Vlaardingerbroek 2013; Xie 2014). We assessed allocation concealment as low risk for 14 studies (Balasubramanian 2013; Black 1981; Blanco 2008; Bulbul 2012; Burattini 2013; Can 2012; Can 2013; Clark 2007; Ibrahim 2004; Morgan 2014; Tan 2008; Uthaya 2016; Vlaardingerbroek 2013; Weiler 2006) and selection bias as unclear in 19 studies (Anderson 1979; Blanco 2008; Hata 2002; Heimler 2010; Ibrahim 2004; Liu 2015; Makay 2007; Murdock 1995; Pappoe 2009; Pildes 1973; Rivera 1993; Scattolin 2013; Tang 2009; te Braake 2005; Thureen 2003; Vaidya 1995; van Goudoever 1995; van Lingen 1992; Weiler 2006).
Blinding
We assessed nine studies as having low risk of performance and detection bias in terms of reporting of blinding of participants, personnel, and outcome assessment (Balasubramanian 2013; Blanco 2008; Bulbul 2012; Can 2012; Can 2013; Morgan 2014; Scattolin 2013; Uthaya 2016; Xie 2014). Twelve studies reported the method of blinding of outcome assessment (Balasubramanian 2013; Blanco 2008; Bulbul 2012; Burattini 2013; Can 2012; Can 2013; Morgan 2014; Scattolin 2013; te Braake 2005; Uthaya 2016; Vlaardingerbroek 2013; Xie 2014). We assessed 18 studies as high risk (Burattini 2013; Hata 2002; Heimler 2010; Ibrahim 2004; Liu 2015; Makay 2007; Murdock 1995; Pappoe 2009; Rivera 1993; Tan 2008; Tang 2009; te Braake 2005; Thureen 2003; Vaidya 1995; van Goudoever 1995; van Lingen 1992; Vlaardingerbroek 2013; Weiler 2006).
Incomplete outcome data
We assessed 15 studies as having low risk of attrition bias, reporting < 10% loss to follow‐up (Bulbul 2012; Can 2012; Can 2013; Clark 2007; Ibrahim 2004; Liu 2015; Morgan 2014; Pappoe 2009; Tang 2009; te Braake 2005; Uthaya 2016; Vaidya 1995; van Lingen 1992; Vlaardingerbroek 2013; Xie 2014). Studies reporting > 10% post‐randomisation losses include Anderson 1979 (35%); Balasubramanian 2013 (18%); Blanco 2008 (2% for mortality and biochemical outcomes; 47% for other clinical and long‐term outcomes); Burattini 2013 (13%); Heimler 2010 (15%); Makay 2007 (25%); Murdock 1995 (34%); Scattolin 2013 (15%); Thureen 2003 (21%); Uthaya 2016 (none for mortality, sepsis, and NEC, but 11% for other outcomes); van Goudoever 1995 (17%); and Weiler 2006 (21%). Reporting of losses was unclear for two studies (Hata 2002; Tan 2008). In addition, Black 1981 excluded 2 of 21 infants owing to other reasons for cholestasis ‐ the primary outcome of this study.
Selective reporting
Most studies documented primary outcomes and standard reporting definitions of clinical outcomes included in the review. However, few studies had available trial protocols or trial registrations, so we assessed most trials as having unclear risk of selective reporting bias. We assessed five studies as having low risk of selective reporting bias (Blanco 2008; Clark 2007; Morgan 2014; Uthaya 2016; Vlaardingerbroek 2013).
Other potential sources of bias
Eight studies showed imbalance between groups in baseline characteristics (Blanco 2008; Hata 2002; Liu 2015; Makay 2007; Murdock 1995; Rivera 1993; te Braake 2005; Xie 2014). Ibrahim 2004 had a reporting concern, in that denominators for each group appear to have been transposed in Table 3. Two studies reported insufficient baseline characteristics (Black 1981; Pildes 1973).
Effects of interventions
Higher versus lower amino acid intake in parenteral nutrition
Primary outcomes
Mortality to discharge (Analysis 1.1; Figure 4): Data show no difference in mortality to discharge (typical RR 0.90, 95% CI 0.69 to 1.17; participants = 1407; studies = 14; I2 = 0%; quality of evidence: low). We downgraded quality of evidence owing to imprecision and potential for publication or reporting bias.
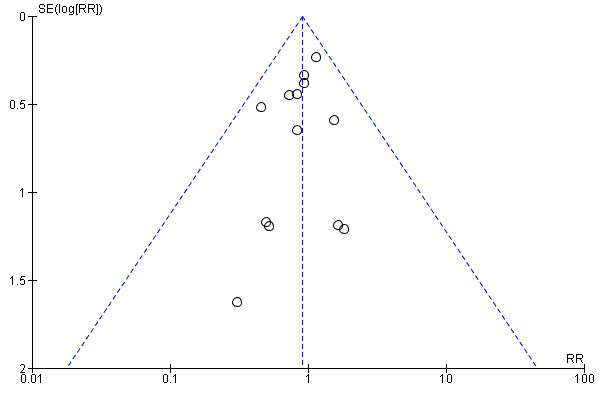
Funnel plot of comparison: 1 Higher versus lower amino acid intake in parenteral nutrition, outcome: 1.1 Mortality to hospital discharge.
Neurodevelopmental disability at 2 years age (Analysis 1.2): Data show no difference in neurodevelopmental disability (typical RR 1.04, 95% CI 0.48 to 2.23; participants = 201; studies = 2; I2 = 82% [high]; quality of evidence: very low). Neither study reported a significant difference (te Braake 2005; Vlaardingerbroek 2013). We downgraded quality of evidence owing to risk of bias, inconsistency, imprecision, and potential for publication or reporting bias.
Postnatal growth failure at discharge (weight < 10th percentile) (Analysis 1.3): Data show a reduction in postnatal growth failure (weight < 10th percentile) at discharge (typical RR 0.74, 95% CI 0.56 to 0.97; participants = 203; studies = 3; I2 = 22%; RD ‐0.15, 95% CI ‐0.27 to ‐0.02; NNTB 7, 95% CI 4 to 50; quality of evidence: very low). We downgraded quality of evidence owing to risk of bias, imprecision, and potential for publication or reporting bias.
Postnatal growth failure at discharge (weight 2 SD below mean) (Analysis 1.4) (not a prespecified outcome): A single study reported no difference in growth failure (weight 2 standard deviations (SDs) below mean) up at discharge (RR 0.96, 95% CI 0.66 to 1.40; participants = 114) (Burattini 2013).
Postnatal growth failure post discharge (Analysis 1.5) (not a prespecified outcome): A single study reported no difference in growth failure at two years (RR 0.66, 95% CI 0.33 to 1.32; participants = 111) (te Braake 2005).
Secondary outcomes
Days to regain birth weight (Analysis 1.6): Data show a significant reduction in days to regain birth weight (MD ‐1.14, 95% CI ‐1.73 to ‐0.56; participants = 950; studies = 13; I2 = 77%; heterogeneity: high).
Maximal weight loss in grams (Analysis 1.7): Data show a reduction in maximal weight loss in grams (MD ‐22.71 g, 95% CI ‐33.68 to ‐11.74; participants = 235; studies = 3; I2 = 81%; heterogeneity: high).
Weight loss per cent (Analysis 1.8): Data show no difference in weight loss per cent (MD ‐0.33%, 95% CI ‐1.61 to 0.96; participants = 288; studies = 4; I2 = 38%; heterogeneity: low). The two meta‐analyses of weight loss outcomes comprise different studies.
Weight gain to 1 month age (Analysis 1.9): Data show a reduction in weight gain to one month of age (MD ‐1.50 g/kg/d, 95% CI ‐2.56 to ‐0.44; participants = 373; studies = 4; I2 = 87%; heterogeneity: high).
Weight gain to discharge (Analysis 1.9): Data show no difference in weight gain up to discharge (MD 0.76 g/kg/d, 95% CI ‐0.02 to 1.54; participants = 291; studies = 4; I2 = 0%; quality of evidence: very low). We downgraded quality of evidence owing to risk of bias, imprecision, and potential for publication or reporting bias.
Linear growth to 1 month (Analysis 1.10): Data show a reduction in linear growth to one month (MD ‐0.16 cm/week, 95% CI ‐0.26 to ‐0.06; participants = 245; studies = 2; I2 = 86%; heterogeneity: high).
Head circumference growth to one month (Analysis 1.11): Data show no difference in head circumference growth to one month (MD 0.01 cm/week, 95% CI ‐0.04 to 0.06; participants = 476; studies = 4; I2 = 92%; heterogeneity: high).
Head circumference growth to discharge (Analysis 1.11): Data show an increase in head circumference growth to discharge (MD 0.09 cm/week, 95% CI 0.06 to 0.13; participants = 315; studies = 4; I2 = 90%; heterogeneity: high; quality of evidence: very low). We downgraded quality of evidence owing to risk of bias, inconsistency, imprecision, and potential for publication or reporting bias.
Weight change z‐score to 1 month (Analysis 1.12): A single study reported no difference in weight change z‐score to one month (MD ‐0.20, 95% CI ‐0.62 to 0.22; participants = 96) (Vlaardingerbroek 2013).
Weight change z‐score to discharge (Analysis 1.12): Data show no difference in weight change in z‐score to discharge (MD 0.01, 95% CI ‐0.33 to 0.36; participants = 207; studies = 2; I2 = 48%; heterogeneity: low).
Weight change z‐score post discharge (Analysis 1.12): Data show no difference in weight change in z‐score post discharge (MD 0.13, 95% CI ‐0.26 to 0.52; participants = 201; studies = 2; I2 = 47%; heterogeneity: low).
Length change z‐score: This was not reported.
Head circumference change in z‐score to 1 month (Analysis 1.13): Data show an increase in head circumference change in z‐score to one month (MD 0.27, 95% CI 0.08 to 0.46; participants = 231; studies = 2; I2 = 66%).
Head circumference change in z‐score to discharge (Analysis 1.13): Data show no difference in head circumference change in z‐score to discharge (MD 0.18, 95% CI ‐0.15 to 0.50; participants = 207; studies = 2; I2 = 63%; heterogeneity: moderate).
Head circumference change in z‐score post discharge (Analysis 1.13): Data show no difference in head circumference change in z‐score post discharge ((MD 0.25, 95% CI ‐0.14 to 0.64; participants = 201; studies = 2; I2 = 50%).
Weight at one month (Analysis 1.14) (not a prespecified outcome): Data show no difference in weight at one month (MD ‐18.45 g/kg/d, 95% CI ‐68.42 to 31.52; participants = 430; studies = 4; I2 = 78%; heterogeneity: high).
Weight at discharge (Analysis 1.14) (not a prespecified outcome): Data show an increase in weight at discharge (MD 81.07 g/kg/d, 95% CI 36.59 to 125.56; participants = 874; studies = 10; I2 = 0%).
Weight post discharge (Analysis 1.14) (not a prespecified outcome): Data show no difference in weight post discharge (MD ‐11.07 g, 95% CI ‐493.31 to 471.18; participants = 211; studies = 2; I2 = 0%).
Length at one month (Analysis 1.15) (not a prespecified outcome): Data show no difference in length at one month (MD ‐0.41 cm, 95% CI ‐1.03 to 0.20; participants = 295; studies = 3; I2 = 76%; heterogeneity: high).
Length at discharge (Analysis 1.15) (not a prespecified outcome): Data show an increase in length at discharge (MD 0.57 cm, 95% CI 0.17 to 0.98; participants = 553; studies = 6; I2 = 47%; heterogeneity: low).
Length post discharge (Analysis 1.15) (not a prespecified outcome): A single study reported no difference in length post discharge (MD ‐0.10 cm, 95% CI ‐1.81 to 1.61; participants = 100) (Burattini 2013).
Head circumference at one month (Analysis 1.16) (not a prespecified outcome): Data show no difference in head circumference to one month (MD 0.19 cm, 95% CI ‐0.13 to 0.51; participants = 430; studies = 4; I2 = 81%; heterogeneity: high).
Head circumference at discharge (Analysis 1.16) (not a prespecified outcome): Data show no difference in head circumference at discharge (MD 0.08, 95% CI ‐0.14 to 0.29; participants = 834; studies = 9; I2 = 59%; heterogeneity: moderate).
Head circumference post discharge (Analysis 1.16) (not a prespecified outcome): Data show no difference in head circumference post discharge (MD ‐0.04, 95% CI ‐0.52 to 0.44; participants = 211; studies = 2; I2 = 3%).
Weight z‐score at one month (Analysis 1.17) (not a prespecified outcome): A single study reported no difference in weight z‐score at one month (MD 0.14, 95% CI ‐0.11 to 0.39; participants = 135) (Morgan 2014).
Weight z‐score at discharge (Analysis 1.17) (not a prespecified outcome): Data show no difference in weight z‐score at discharge (MD 0.16, 95% CI ‐0.02 to 0.33; participants = 352; studies = 3; I2 = 0%).
Length z‐score at discharge (Analysis 1.18) (not a prespecified outcome): Data show no difference in length z‐score at discharge (MD 0.12, 95% CI ‐0.14 to 0.38; participants = 228; studies = 2; I2 = 0%).
Head circumference z‐score at one month (Analysis 1.19) (not a prespecified outcome): A single study reported an increase in head circumference z‐score to one month (MD 0.30, 95% CI 0.01 to 0.59; participants = 135) (Morgan 2014).
Head circumference z‐score at discharge (Analysis 1.19) (not a prespecified outcome): Data show no difference in head circumference z‐score at discharge (MD 0.04, 95% CI ‐0.18 to 0.26; participants = 354; studies = 3; I2 = 57%; heterogeneity: moderate).
Head circumference z‐score at post discharge (Analysis 1.19) (not a prespecified outcome): A single study reported no difference in head circumference z‐score at post discharge (MD ‐0.01, 95% CI ‐0.50 to 0.48; participants = 100) (Burattini 2013).
Days to full enteral feeds (Analysis 1.20): Data show no difference in days to full enteral feeds (MD ‐0.19, 95% CI ‐1.07 to 0.70; participants = 778; studies = 11; I2 = 46%; heterogeneity: low).
Late‐onset sepsis (Analysis 1.21): Data show no difference in late‐onset sepsis (typical RR 0.96, 95% CI 0.79 to 1.18; participants = 1255; studies = 15; I2 = 0%).
Necrotising enterocolitis (Analysis 1.22): Data show no difference in necrotising enterocolitis (typical RR 1.00, 95% CI 0.68 to 1.47; participants = 1301; studies = 14; I2 = 0%).
Chronic lung disease (Analysis 1.23): Data show no difference in chronic lung disease (typical RR 1.04, 95% CI 0.89 to 1.23; participants = 819; studies = 10; I2 = 22%).
Patent ductus arteriosus (Analysis 1.24) (not a prespecified outcome): Data show no difference in patent ductus arteriosus (typical RR 0.83, 95% CI 0.67 to 1.02; participants = 607; studies = 7; I2 = 13%).
Intraventricular haemorrhage (Analysis 1.25): Data show no difference in intraventricular haemorrhage (typical RR 1.12, 95% CI 0.74 to 1.69; participants = 341; studies = 3; I2 = 0%).
Severe intraventricular haemorrhage (Analysis 1.26): Data show no difference in severe intraventricular haemorrhage (typical RR 1.16, 95% CI 0.74 to 1.82; participants = 904; studies = 11; I2 = 0%).
Periventricular leukomalacia (Analysis 1.27): Data show no difference in periventricular leukomalacia (typical RR 0.55, 95% CI 0.24 to 1.25; participants = 720; studies = 7; I2 = 13%).
MRI brain abnormality at term: No data were reported.
Retinopathy of prematurity (Analysis 1.28): Data show a reduction in retinopathy of prematurity (typical RR 0.44, 95% CI 0.21 to 0.93; participants = 269; studies = 4; I2 = 31%; heterogeneity: low).
Severe retinopathy of prematurity (Analysis 1.29): Data show no difference in severe retinopathy of prematurity (typical RR 0.96, 95% CI 0.56 to 1.63; participants = 672; studies = 8; I2 = 34%; heterogeneity: low; quality of evidence: very low). We downgraded quality of evidence owing to risk of bias, imprecision, and potential for publication or reporting bias.
Cerebral palsy (Analysis 1.30): Data show no difference in cerebral palsy (typical RR 4.00, 95% CI 0.89 to 17.97; participants = 122; studies = 2; I2 = 0%).
Developmental delay (Analysis 1.31): Data show no difference in developmental delay (typical RR 1.35, 95% CI 0.52 to 3.53; participants = 301; studies = 3; I2 = 0%).
Blindness (Analysis 1.32): Data show no difference in blindness (typical RR 2.00, 95% CI 0.20 to 19.91; participants = 122; studies = 2; I2 = 0%).
Deafness (Analysis 1.33): A single study reported no severe hearing impairment at two years in either group (Vlaardingerbroek 2013).
Bayley Mental Development Index (MDI) at ≥ 18 months (Analysis 1.34): Data show no difference in Bayley MDI at ≥ 18 months (MD ‐4.18, 95% CI ‐8.53 to 0.17; participants = 105; studies = 2; I2 = 0%).
Bayley Psychomotor Development Index (PDI) at ≥ 18 months (Analysis 1.36): A single study reported no difference in Bayley PDI ≥ 18 months (MD 3.00, 95% CI ‐6.41 to 12.41; participants = 32) (Blanco 2008).
Bayley III score ≥ 18 months (Analysis 1.35): A single study reported no difference in Bayley III score ≥ 18 months (MD 3.00, 95% CI ‐2.52 to 8.52; participants = 100) (Burattini 2013).
Autism (Analysis 1.37) (not a prespecified outcome): A single study reported no difference in autism (RR 1.00, 95% CI 0.07 to 14.64; participants = 32) (Blanco 2008).
Nitrogen balance (Analysis 1.38): Data show an increase in nitrogen balance (MD 505.20 mg/kg/d, 95% CI 492.01 to 518.39; participants = 153; studies = 6; I2 = 99%; heterogeneity: high). Studies are ordered by initial amino acid intake. We noted significant subgroup differences (P < 0.00001).
Protein balance (Analysis 1.39) (not a prespecified outcome): Data show an increase in protein balance (MD 1.57 g/kg/d, 95% CI 1.47 to 1.66; participants = 52; studies = 3; I2 = 93%; heterogeneity: high). Studies are ordered by initial amino acid intake. We noted significant subgroup differences (P < 0.00001).
Abnormal serum ammonia (Analysis 1.40): A single study reported no difference in ammonia > 69 μmol/L (RR 13.42, 95% CI 0.79 to 228.24; participants = 61) and ammonia > 122 μmol/L (RR 3.10, 95% CI 0.13 to 73.16; participants = 61) (Blanco 2008). Data show no difference in ammonia > 100 μmol/L (typical RR 9.29, 95% CI 0.52 to 165.45; participants = 105; studies = 2; I2 = 0%). All infants with high ammonia were included in the higher amino acid group.
Abnormal blood urea nitrogen (Analysis 1.41): Criteria for abnormal blood urea nitrogen differed between studies. Data show a significant increase in abnormal blood urea nitrogen level (various criteria) (RD 0.26, 95% CI 0.20 to 0.32; participants = 688; studies = 7; I2 = 90%; heterogeneity: high; RD 0.26, 95% CI 0.20 to 0.32; NNTH 4; 95% CI 3 to 5).
Maximal blood urea nitrogen (Analysis 1.42) (not a prespecified outcome): Data show an increase in maximal blood urea nitrogen (MD 4.48, 95% CI 3.43 to 5.53; participants = 159; studies = 2; I2 = 96%; heterogeneity: high; quality of evidence: high).
Hyperglycaemia (plasma glucose > 8.3 mmol/L) (Analysis 1.43): Data show a reduction in hyperglycaemia (typical RR 0.69, 95% CI 0.49 to 0.96; participants = 505; studies = 5; I2 = 68%; heterogeneity: moderate).
Hyperglycaemia treated with insulin (Analysis 1.44): Data show no difference in hyperglycaemia treated with insulin (typical RR 1.24, 95% CI 0.93 to 1.66; participants = 534; studies = 5; I2 = 67%; heterogeneity: moderate).
Hypoglycaemia (Analysis 1.45): Data show no difference in hypoglycaemia (typical RR 1.17, 95% CI 0.84 to 1.63; participants = 376; studies = 3; I2 = 0%).
Hypoalbuminaemia: This was not reported.
Metabolic acidosis (Analysis 1.46): Data show no difference in metabolic acidosis (typical RR 2.05, 95% CI 0.94 to 4.47; participants = 305; studies = 4; I2 = 22%).
Cholestasis (Analysis 1.47): Data show no difference in cholestasis (typical RR 1.26, 95% CI 0.86 to 1.84; participants = 616; studies = 5; I2 = 8%).
Hyperkalaemia (Analysis 1.48) (not a prespecified outcome): A single study reported no difference in hyperkalaemia (RR 0.62, 95% CI 0.16 to 2.37; participants = 61) (Blanco 2008).
Discontinued PN due to biochemical intolerance (Analysis 1.49) (not a prespecified outcome): A single study reported no difference in discontinued PN due to biochemical intolerance (RR 13.42, 95% CI 0.79 to 228.24; participants = 61) (Blanco 2008). All six infants who discontinued PN were in the higher amino acid group.
Subgroup analyses
No data were available for review authors to determine the effect of higher versus lower amino acid intake in parenteral nutrition subgrouped by studies enrolling 'sick' infants (e.g. infants with moderate‐severe respiratory distress, receiving cardiovascular support, with possible sepsis, acidosis); and studies enrolling 'surgical' or postoperative infants or infants post cardiopulmonary bypass. The following analyses substantially relate to preterm and low birth weight infants.
Higher versus lower amino acid intake at commencement of parenteral nutrition, subgrouped by commencement intake
Fifteen studies compared higher versus lower amino acid intake at commencement of parenteral nutrition (Anderson 1979; Balasubramanian 2013; Bulbul 2012; Can 2012; Can 2013; Heimler 2010; Ibrahim 2004; Makay 2007; Murdock 1995; Pappoe 2009; Thureen 2003; van Goudoever 1995; van Lingen 1992; Vlaardingerbroek 2013; Weiler 2006).
Primary outcomes
Mortality to discharge (Analysis 2.1): Data show no difference in mortality (typical RR 0.78, 95% CI 0.45 to 1.36; participants = 433; studies = 6) and no subgroup differences by commencement intake; testing for subgroup differences: P = 0.79, I2 = 0%.
Neurodevelopmental disability at 2 years (Analysis 2.2): Data show no difference in neurodevelopmental disability at two years (typical RR 1.04, 95% CI 0.48 to 2.23; participants = 201; studies = 2); testing for subgroup differences was significant: P = 0.02, I2 = 81.2%. Neither study reported a significant difference (high AA intake > 2 to ≤ 3 g/kg/d ‐ te Braake 2005; very high AA intake > 3 g/kg/d ‐ Vlaardingerbroek 2013).
Postnatal growth failure at discharge (Analysis 2.3): Data show a reduction in postnatal growth failure at discharge (typical RR 0.74, 95% CI 0.56 to 0.97; participants = 203; studies = 3) and no subgroup differences by commencement intake; testing for subgroup differences: P = 0.21, I2 = 37.6%. For subgroups, a single study commencing low amino acid intake (> 1 to ≤ 2 g/kg/d) among infants reported no difference in growth failure at discharge (RR 0.95, 95% CI 0.62 to 1.46; participants = 42) (Pappoe 2009). Infants commenced on high amino acid intake (2 to ≤ 3 g/kg/d) showed a reduction in postnatal growth failure at discharge (typical RR 0.67, 95% CI 0.48 to 0.94; participants = 161; studies = 2).
Postnatal growth failure post discharge (Analysis 2.4): A single study commencing high amino acid intake (> 2 to ≤ 3 g/kg/d) reported no difference in postnatal growth failure at two years (RR 0.66, 95% CI 0.33 to 1.32; participants = 111) (te Braake 2005).
Secondary outcomes
Days to regain birth weight (Analysis 2.5): Data show no difference in days to regain birth weight (MD 0.43, 95% CI ‐0.51 to 1.37; participants = 303; studies = 6) and no subgroup difference by commencement intake; testing for subgroup differences: P = 0.06, I2 = 64.2%.
Maximal weight loss in grams (Analysis 2.6): A single study commencing with high amino acid intake (> 2 to ≤ 3 g/kg/d) reported no difference in maximal weight loss in grams (MD 22.60, 95% CI ‐7.25 to 52.45; participants = 50) (Can 2012).
Maximal weight loss per cent (Analysis 2.7): Data show no difference in maximal weight loss per cent (MD ‐2.73, 95% CI ‐5.71 to 0.25; participants = 59; studies = 2; I2 = 40%). Both studies commenced with low amino acid intake (> 1 to ≤ 2 g/kg/d).
Weight gain to one month (Analysis 2.8): Data show reduced weight gain to one month (MD ‐3.17 g/kg/d, 95% CI ‐4.49 to ‐1.84; participants = 219; studies = 2) with significant subgroup differences; testing for subgroup differences: P = 0.01, I2 = 83.3%. For subgroups, Balasubramanian 2013 commencing 3 g/kg/d versus 1 g/kg/d amino acid on day 1 reported reduced weight gain to one month of age (MD ‐4.48, 95% CI ‐6.17 to ‐2.79; participants = 123). Vlaardingerbroek 2013 commencing with 3.6 g/kg/d versus 2.4 g/kg/d at day 2 to 6 reported no difference in weight gain to one month (MD ‐1.10, 95% CI ‐3.22 to 1.02; participants = 96).
Weight gain to discharge (Analysis 2.9): Data show no difference in weight gain to discharge (MD 1.05, 95% CI ‐0.55 to 2.66; participants = 140; studies = 2) and no subgroup difference by commencement intake; testing for subgroup differences: P = 0.34; I2 = 0%.
Linear growth to one month (Analysis 2.10): A single study commencing 3 g/kg/d versus 1 g/kg/d amino acid on day 1 reported a reduction in linear growth to one month (MD ‐0.27, 95% CI ‐0.40 to ‐0.14; participants = 123) (Balasubramanian 2013).
Head circumference growth to one month (Analysis 2.11): Data show reduced head circumference growth to one month (MD ‐0.12, 95% CI ‐0.21 to ‐0.04; participants = 219; studies = 2) with significant subgroup differences: P < 0.0001; I2 = 94.9%. For subgroups, Balasubramanian 2013 commencing 3 g/kg/d versus 1 g/kg/d amino acid on day 1 reported reduced head circumference growth to one month of age (MD ‐0.38, 95% CI ‐0.51 to ‐0.24; participants = 123). Vlaardingerbroek 2013 commencing 3.6 g/kg/d versus 2.4 g/kg/d on day 2 to 6 reported no difference in head circumference growth to one month (MD 0.02, 95% CI ‐0.09 to 0.13; participants = 96).
Head circumference growth to discharge (Analysis 2.12): A single study commencing 3.6 g/kg/d versus 2.4 g/kg/d on day 2 to 6 reported no difference in head circumference growth to discharge (MD 0.03, 95% CI ‐0.03 to 0.09; participants = 96) (Vlaardingerbroek 2013).
Weight gain change z‐score up to one month (Analysis 2.13): A single study commencing 3.6 g/kg/d versus 2.4 g/kg/d on day 2 to 6 reported no difference in weight gain change z‐score up to one month (MD ‐0.20, 95% CI ‐0.62 to 0.22; participants = 96) (Vlaardingerbroek 2013).
Weight gain change z‐score to discharge (Analysis 2.14): Data show no difference in weight gain change z‐score up to discharge (MD 0.01, 95% CI ‐0.33 to 0.36; participants = 207; studies = 2) and no subgroup difference by commencement intake; testing for subgroup differences: P = 0.17; I2 = 48%.
Weight gain change z‐score post discharge (Analysis 2.15): Data show no difference in weight gain change z‐score post discharge (MD 0.13, 95% CI ‐0.26 to 0.52; participants = 201; studies = 2) and no subgroup difference by commencement intake; testing for subgroup differences: P = 0.17, I2 = 47.1%.
Head circumference change z‐score up to one month (Analysis 2.16): A single study commencing 3.6 g/kg/d versus 2.4 g/kg/d on day 2 to 6 reported no difference in head circumference change z‐score up to one month (MD 0.00, 95% CI ‐0.36 to 0.36; participants = 96) (Vlaardingerbroek 2013).
Head circumference change z‐score to discharge (Analysis 2.17): Data show no difference in head circumference change z‐score up to discharge (MD 0.18, 95% CI ‐0.15 to 0.50; participants = 207; studies = 2) and no subgroup difference by commencement intake; testing for subgroup differences: P = 0.10, I2 = 62.7%. Neither study reported a significant effect on head circumference change z‐score to discharge.
Head circumference change z‐score post discharge (Analysis 2.18): Data show no difference in head circumference change z‐score up to discharge (MD 0.25, 95% CI ‐0.14 to 0.64; participants = 201; studies = 2) and no subgroup difference by commencement intake; testing for subgroup differences: P = 0.16, I2 = 50.1%.
Days to full enteral feeds (Analysis 2.19): Data show no difference by commencement intake in days to full enteral feeds (MD ‐0.22, 95% CI ‐1.60 to 1.17; participants = 196; studies = 4); testing for subgroup differences: P = 0.88, I2 = 0%.
Late‐onset sepsis (Analysis 2.20): Data show no difference in late‐onset sepsis (typical RR 0.94, 95% CI 0.65 to 1.38; participants = 319; studies = 5) and no subgroup difference by commencement intake; testing for subgroup differences: P = 0.93, I2 = 0%.
Necrotising enterocolitis (Analysis 2.21): Data show no difference in necrotising enterocolitis (RR 0.96, 95% CI 0.45 to 2.03; participants = 340; studies = 5) and no subgroup difference by commencement intake; testing for subgroup differences: P = 0.18, I2 = 44%.
Chronic lung disease (Analysis 2.22): Data show no difference in chronic lung disease (RR 1.32, 95% CI 0.86 to 2.02; participants = 202; studies = 4) and no subgroup difference by commencement intake; testing for subgroup differences: P = 0.90, I2 = 0%.
Patent ductus arteriosus (Analysis 2.23): Data show no difference in patent ductus arteriosus (RR 0.73, 95% CI 0.50 to 1.07; participants = 244; studies = 4) and no subgroup difference by commencement intake; testing for subgroup differences: P = 0.11, I2 = 54.9%. Meta‐analysis of two studies on high amino acid intake (> 2 to ≤ 3 g/kg/d) found a reduction in patent ductus arteriosus (RR 0.42, 95% CI 0.20 to 0.89; participants = 173; studies = 2) (Balasubramanian 2013; Can 2012), whereas the other studies reported no difference from low amino acid intake (2 g/kg/d) ‐ Pappoe 2009 (RR 1.05, 95% CI 0.63 to 1.74; participants = 42) ‐ or very high amino acid intake (3.5 g/kg/d) ‐ Ibrahim 2004 (RR 1.07, 95% CI 0.50 to 2.28; participants = 29).
Intraventricular haemorrhage (Analysis 2.24): A single study reported no difference in intraventricular haemorrhage (RR 1.26, 95% CI 0.41 to 3.91; participants = 123) (Balasubramanian 2013).
Severe intraventricular haemorrhage (Analysis 2.25): Data show no difference in severe intraventricular haemorrhage (RR 1.44, 95% CI 0.66 to 3.17; participants = 261; studies = 5) and no subgroup difference by commencement intake; testing for subgroup differences: P = 0.59, I2 = 0%.
Periventricular leukomalacia (Analysis 2.26): Data show only one infant with periventricular leukomalacia in the lower amino acid group (two studies, 146 infants).
Retinopathy of prematurity (Analysis 2.27): Data show a reduction in retinopathy of prematurity (RR 0.44, 95% CI 0.21 to 0.93; participants = 269; studies = 4) and no subgroup difference by commencement intake; testing for subgroup differences: P = 0.76, I2 = 0%. Meta‐analysis of studies commencing with high amino acid intake (> 2 to ≤ 3 g/kg/d) found a reduction in retinopathy of prematurity (RR 0.36, 95% CI 0.14 to 0.95; participants = 198; studies = 2). A single trial commencing at low amino acid intake (> 1 to ≤ 2 g/kg/d) reported no difference in retinopathy of prematurity (RR 0.55, 95% CI 0.10 to 2.96; participants = 42) (Pappoe 2009). A single trial commencing at very high amino acid intake (3.5 g/kg/d) also reported no difference (RR 0.71, 95% CI 0.14 to 3.66; participants = 29) (Ibrahim 2004).
Severe retinopathy of prematurity (Analysis 2.28): Data show no difference in severe retinopathy of prematurity (RR 0.47, 95% CI 0.20 to 1.11; participants = 265; studies = 4) and no subgroup difference by commencement intake; testing for subgroup differences: P = 0.17, I2 = 43%. Meta‐analysis of high amino acid intake (3 g/kg/d vs 1.5 g/kg/d) at commencement found a reduction in severe retinopathy of prematurity (RR 0.23, 95% CI 0.06 to 0.85; participants = 125; studies = 2). Pappoe 2009 reported no difference from low amino acid intake (2 g/kg/d vs 1 g/kg/d) (RR 0.55, 95% CI 0.10 to 2.96; participants = 42), and Vlaardingerbroek 2013 reported no difference from very high amino acid intake (3.6 g/kg/d vs 2.4 g/kg/d) (RR 5.00, 95% CI 0.25 to 101.53; participants = 98).
Cerebral palsy (Analysis 2.29): A single study commencing 3.6 g/kg/d versus 2.4 g/kg/d on day 2 to 6 reported no difference in cerebral palsy (RR 5.00, 95% CI 0.61 to 41.11; participants = 90) (Vlaardingerbroek 2013).
Developmental delay (Analysis 2.30): Data show no difference in developmental delay at ≥ 18 months (RR 1.04, 95% CI 0.35 to 3.11; participants = 201; studies = 2); and no subgroup difference by commencement intake; testing for subgroup differences: P = 0.53, I2 = 0%.
Blindness (Analysis 2.31): No infant was reported as being blind in a single study (Vlaardingerbroek 2013).
Deafness (Analysis 2.32): No infant was reported as being deaf in a single study (Vlaardingerbroek 2013).
Abnormal serum ammonium (Analysis 2.33): A single study commencing on 3 g/kg/d amino acid intake reported that none of 42 infants had a serum ammonia > 100 μmol/L (Bulbul 2012).
Abnormal blood urea nitrogen (Analysis 2.34): Data show an increase in abnormal blood urea nitrogen (RR 2.11, 95% CI 1.44 to 3.08; participants = 138; studies = 2) and no subgroup difference by commencement intake; testing for subgroup differences: P = 0.88, I2 = 0%. Individual studies reported no difference in BUN > 14.3 mmol/L among infants commenced on 2 g/kg/d ‐ Pappoe 2009 (RR 2.48, 95% CI 0.28 to 21.93; participants = 42) ‐ and an increase in BUN > 10 mmol/L among infants commencing on 3.6 g/kg/d ‐ Vlaardingerbroek 2013 (RR 2.09, 95% CI 1.43 to 3.04; participants = 96).
Hyperglycaemia (Analysis 2.35): A single study of infants receiving very high amino acid intake (> 3 g/kg/d) reported no difference in hyperglycaemia (RR 1.47, 95% CI 0.85 to 2.53; participants = 42) (Pappoe 2009).
Hyperglycaemia treated with insulin (Analysis 2.36): Data show an increase in hyperglycaemia treated with insulin of borderline significance (RR 1.84, 95% CI 0.97 to 3.49; participants = 138; studies = 2) and a subgroup difference of borderline significance by commencement intake; testing for subgroup differences: P = 0.07, I2 = 70%. A single study reported an increase in infants commencing on low amino acid intake at 2 g/kg/d versus 1 g/kg/d (RR 4.96, 95% CI 1.26 to 19.47; participants = 42) (Pappoe 2009). Another single study reported no difference among infants commencing on very high amino acid intake (3.6 g/kg/d vs 2.4 g/kg/d) (RR 1.15, 95% CI 0.54 to 2.45; participants = 96) (Vlaardingerbroek 2013).
Hypoglycaemia (Analysis 2.37): A single study reported no difference in hypoglycaemia among infants commencing on high amino acid intake at 3 g/kg/d (RR 1.68, 95% CI 0.83 to 3.41; participants = 123) (Balasubramanian 2013).
Metabolic acidosis (Analysis 2.38): No infant was reported as having metabolic acidosis in a single study commencing on low amino acid intake at 1.15 g/kg/d (van Goudoever 1995).
Higher versus lower amino acid intake at maximal intake of parenteral nutrition, subgrouped by maximal intake
Two studies compared high amino acid intake (> 3 to ≤ 4 g/kg/d) versus low amino acid intake (> 2 to ≤ 3 g/kg/d) at maximal intake of PN (Morgan 2014; Tan 2008). Tests for subgroup differences are not applicable.
Primary outcomes
Mortality (Analysis 3.1): Data show no difference in mortality (RR 0.94, 95% CI 0.57 to 1.55; participants = 292; studies = 2).
Neurodevelopmental disability and postnatal growth failure: Trials provided no data.
Secondary outcomes
Head circumference growth to one month (Analysis 3.2): Morgan 2014 reported an increase in head circumference growth to one month (MD 0.13 cm/week, 95% CI 0.05 to 0.20; participants = 135).
Head circumference change z‐score to one month (Analysis 3.3): Morgan 2014 reported an increase in head circumference change z‐score to one month (MD 0.37, 95% CI 0.15 to 0.59; participants = 135).
Days to regain birth weight (Analysis 3.4): Tan 2008 reported a reduction in days to regain birth weight (MD ‐3.60 days, 95% CI ‐5.88 to ‐1.32; participants = 114).
Days to full enteral feeds (Analysis 3.5): Tan 2008 reported an increase in days to full enteral feeds (MD 4.00 days, 95% CI 1.01 to 6.99; participants = 114).
Late‐onset sepsis (Analysis 3.6): Morgan 2014 reported no difference in late‐onset sepsis (RR 0.94, 95% CI 0.63 to 1.41; participants = 127).
Necrotising enterocolitis (Analysis 3.7): Data show no difference in necrotising enterocolitis (typical RR 0.76, 95% CI 0.37 to 1.59; participants = 241; studies = 2).
Chronic lung disease (Analysis 3.8): Data show no difference in chronic lung disease (typical RR 1.10, 95% CI 0.92 to 1.31; participants = 241; studies = 2).
Patent ductus arteriosus (Analysis 3.9): Morgan 2014 reported no difference in patent ductus arteriosus (RR 1.02, 95% CI 0.66 to 1.56; participants = 127).
Severe intraventricular haemorrhage (Analysis 3.10): Data show no difference in severe intraventricular haemorrhage (typical RR 1.16, 95% CI 0.51 to 2.63; studies = 2).
Periventricular leukomalacia (Analysis 3.11): Morgan 2014 reported no difference in periventricular leukomalacia (RR 2.03, 95% CI 0.39 to 10.70; participants = 127).
Severe retinopathy of prematurity (Analysis 3.12): Morgan 2014 reported no difference in severe retinopathy of prematurity (RR 2.71, 95% CI 0.75 to 9.75; participants = 127).
Hyperglycaemia treated with insulin (Analysis 3.13): Tan 2008 reported an increase in hyperglycaemia treated with insulin (RR 1.69, 95% CI 1.12 to 2.53; participants = 114).
Cholestasis (Analysis 3.14): Data show no difference in cholestasis (typical RR 1.21, 95% CI 0.76 to 1.94; participants = 241; studies = 2).
Higher versus lower amino acid intake at commencement and maximal intake of parenteral nutrition, subgrouped by commencement intake
Nine studies compared higher versus lower amino acid intake at commencement and maximal intake of PN (Black 1981; Blanco 2008; Burattini 2013; Clark 2007; Liu 2015; Scattolin 2013; Tang 2009; Uthaya 2016; Vaidya 1995).
Primary outcomes
Mortality to discharge (Analysis 4.1): Data show no difference in mortality (typical RR 0.97, 95% CI 0.66 to 1.42; participants = 567; studies = 5) and no subgroup difference by commencement intake; testing for subgroup differences: P = 0.32, I2 = 13.8%.
Neurodevelopmental disability and postnatal growth failure: Trials provided no data.
Secondary outcomes
Days to regain birth weight (Analysis 4.2): Data show a reduction in days to regain birth weight (MD ‐1.86, 95% CI ‐2.79 to ‐0.93; participants = 496; studies = 5) and no subgroup difference by commencement intake; testing for subgroup differences: P = 0.80, I2 = 0%.
Maximal weight loss in grams (Analysis 4.3): Studies commencing on high amino acid intake (> 2 to ≤ 3 g/kg/d) reported a reduction in maximal weight loss in grams (MD ‐29.79, 95% CI ‐41.58 to ‐17.99; participants = 185; studies = 2).
Maximal weight loss per cent (Analysis 4.4): Data show no difference in maximal weight loss per cent (MD 0.22, 95% CI ‐1.20 to 1.64; participants = 229; studies = 2) and no subgroup difference by commencement intake; testing for subgroup differences: P = 0.73, I2 = 0%.
Weight gain to 1 month (Analysis 4.5): Studies commencing on low amino acid intake (> 1 to ≤ 2 g/kg/d) reported no difference in weight gain to one month (MD 1.48 g/kg/d, 95% CI ‐0.29 to 3.25; participants = 154; studies = 2).
Weight gain to discharge (Analysis 4.6): Burattini 2013 commencing on high amino acid intake (> 2 to ≤ 3 g/kg/d) reported no difference in weight gain to discharge (MD 0.60 g/kg/d, 95% CI ‐0.34 to 1.54; participants = 114).
Linear growth to one month (Analysis 4.7): Clark 2007 commencing on low amino acid intake (> 1 to ≤ 2 g/kg/d) reported no difference in linear growth to one month (MD 0.00 cm/week, 95% CI ‐0.15 to 0.15; participants = 122).
Head circumference to one month (Analysis 4.8): Clark 2007 commencing on low amino acid intake (> 1 to ≤ 2 g/kg/d) reported no difference in head circumference growth to one month (MD 0.00 cm/week, 95% CI ‐0.12 to 0.12; participants = 122).
Head circumference change to discharge (Analysis 4.9): Studies commencing on high amino acid intake (> 2 to ≤ 3 g/kg/d) reported an increase in head circumference change to discharge (MD 0.11 cm/week, 95% CI 0.07 to 0.15; participants = 182; studies = 2).
Days to full enteral feeds (Analysis 4.10): Data show a reduction in days to full enteral feeds with a significant subgroup effect by commencement intake (MD ‐1.08, 95% CI ‐2.42 to 0.25; participants = 431; studies = 5) and no significant subgroup difference by commencement intake; testing for subgroup differences: P = 0.01, I2 = 76.9%. For subgroups, studies commencing with low amino acid intake (> 1 to ≤ 2 g/kg/d) reported no difference in days to full enteral feeds (MD 2.47, 95% CI ‐1.73 to 6.68; participants = 147; studies = 2). Studies commencing on high amino acid intake (> 2 to ≤ 3 g/kg/d) reported a reduction in days to full enteral feeds (MD ‐3.32, 95% CI ‐5.39 to ‐1.25; participants = 158; studies = 2). Uthaya 2016 commenced on very high amino acid intake (> 3 g/kg/d) and reported no difference in days to full enteral feeds (MD 0.09, 95% CI ‐1.83 to 2.01; participants = 126).
Late onset sepsis (Analysis 4.11): Data show no difference in late‐onset sepsis (typical RR 0.96, 95% CI 0.72 to 1.29; participants = 772; studies = 8) and no subgroup difference by commencement intake; testing for subgroup differences: P = 0.70, I2 = 0%.
Necrotising enterocolitis (Analysis 4.12): Data show no difference in necrotising enterocolitis (typical RR 1.14, 95% CI 0.63 to 2.07; participants = 683; studies = 6) and no subgroup difference by commencement intake; testing for subgroup differences: P = 0.43, I2 = 0%.
Chronic lung disease (Analysis 4.13): Data show no difference in chronic lung disease (typical RR 0.81, 95% CI 0.55 to 1.19; participants = 376; studies = 4) and no subgroup difference by commencement intake; testing for subgroup differences: P = 0.13, I2 = 58%.
Patent ductus arteriosus (Analysis 4.14): Data show no differences in patent ductus arteriosus (typical RR 0.81, 95% CI 0.60 to 1.10; participants = 236; studies = 2) and no subgroup difference by commencement intake; testing for subgroup differences: P = 0.22, I2 = 32%.
Intraventricular haemorrhage (Analysis 4.15): Data show no differences in intraventricular haemorrhage (typical RR 1.09, 95% CI 0.70 to 1.70; participants = 218; studies = 2) and no subgroup difference by commencement intake; testing for subgroup differences: P = 0.79, I2 = 0%.
Severe intraventricular haemorrhage (Analysis 4.16): Data show no differences in severe intraventricular haemorrhage (typical RR 0.96, 95% CI 0.46 to 2.02; participants = 402; studies = 4) and no subgroup difference by commencement intake; testing for subgroup differences: P = 0.58, I2 = 0%.
Periventricular leukomalacia (Analysis 4.17): Data show a reduction in periventricular leukomalacia (typical RR 0.32, 95% CI 0.10 to 1.00; participants = 447; studies = 4) and no significant subgroup difference of borderline significance by commencement intake; testing for subgroup differences: P = 0.09, I2 = 66.1%. For subgroups, data show a reduction in periventricular leukomalacia for infants commenced on low amino acid intake (1.5 to 2 g/kg/d) (typical RR 0.14, 95% CI 0.03 to 0.79; participants = 237; studies = 2) and no reduction in infants commenced on high amino acid intake (2.4 to 2.5 g/kg/d) (typical RR 1.37, 95% CI 0.20 to 9.33; participants = 210; studies = 2).
Severe retinopathy of prematurity (Analysis 4.18): Data show no difference in severe retinopathy of prematurity in infants commencing on low amino acid intake (2 g/kg/d) (typical RR 1.24, 95% CI 0.49 to 3.09; participants = 166; studies = 2). Burattini 2013 commencing with high amino acid intake (2.5 g/kg/d) reported no cases of severe retinopathy of prematurity (114 infants).
Cerebral palsy (Analysis 4.19): A single study reported no difference in cerebral palsy (RR 3.00, 95% CI 0.35 to 25.87; participants = 32) (Blanco 2008).
Developmental delay (Analysis 4.20): A single study reported no difference in developmental delay (RR 3.25, 95% CI 0.35 to 30.19; participants = 100) (Burattini 2013).
Blindness (Analysis 4.21): A single study reported no difference in blindness (RR 2.00, 95% CI 0.20 to 19.91; participants = 32) (Blanco 2008).
Abnormal serum ammonia (Analysis 4.22): A single study reported an abnormal serum ammonia > 122 μmol/L in one infant commencing on low amino acid intake (2 g/kg/d) (Blanco 2008).
Abnormal blood urea nitrogen (Analysis 4.23): Data show an increase in abnormal blood urea nitrogen (various criteria) (typical RR 3.19, 95% CI 2.24 to 4.53; participants = 550; studies = 5) and no subgroup difference by commencement intake; testing for subgroup differences: P = 0.25, I2 = 27.2% (Vaidya 1995). For subgroups, a single study commencing with very low amino acid intake (≤ 1 g/kg/d) reported an increase in abnormal blood urea nitrogen (RR 10.74, 95% CI 1.45 to 79.59; participants = 85). For studies commencing low amino acid intake (> 1 to ≤ 2 g/kg/d), data show an increase in abnormal blood urea nitrogen (typical RR 12.29, 95% CI 1.66 to 90.79; participants = 183; studies = 2). A single study commencing on high amino acid intake (> 2 to ≤ 3 g/kg/d) reported an increase in abnormal blood urea nitrogen (RR 2.44, 95% CI 1.47 to 4.05; participants = 114) (Burattini 2013). Another single study commencing on very high amino acid intake (> 3 g/kg/d) reported an increase in abnormal blood urea nitrogen (RR 2.73, 95% CI 1.64 to 4.54; participants = 168) (Uthaya 2016).
Hyperglycaemia (Analysis 4.24): Data show a reduction in hyperglycaemia (typical RR 0.54, 95% CI 0.36 to 0.82; participants = 463; studies = 4) and no subgroup difference by commencement intake; testing for subgroup differences: P = 0.55, I2 = 0%. For subgroups, a single study commencing infants on very low amino acid intake (0.5 g/kg/d) reported no difference in hyperglycaemia (RR 1.95, 95% CI 0.18 to 20.74; participants = 85) (Vaidya 1995). Data show a reduction in hyperglycaemia in studies commencing infants on high amino acid intake (2.4 to 2.5 g/kg/d) (typical RR 0.51, 95% CI 0.30 to 0.87; participants = 210; studies = 2) and no difference in hyperglycaemia in studies commencing infants on very high amino acid intake (> 3 g/kg/d) (RR 0.53, 95% CI 0.26 to 1.06; participants = 168).
Hyperglycaemia treated with insulin (Analysis 4.25): Data show no difference in hyperglycaemia treated with insulin (typical RR 0.62, 95% CI 0.35 to 1.08; participants = 282; studies = 2) and no subgroup difference by commencement intake; testing for subgroup differences: P = 0.59, I2 = 0%.
Hypoglycaemia (Analysis 4.26): Data show no difference in hypoglycaemia (typical RR 1.03, 95% CI 0.70 to 1.50; participants = 253; studies = 2) and no subgroup difference by commencement intake; testing for subgroup differences: P = 0.76, I2 = 0%.
Metabolic acidosis (Analysis 4.27): Data show no difference in metabolic acidosis (typical RR 2.05, 95% CI 0.94 to 4.47; participants = 253; studies = 2) and no subgroup difference by commencement intake; testing for subgroup differences: P = 0.27, I2 = 17.4%.
Cholestasis (Analysis 4.28): Data show no difference in cholestasis (typical RR 1.34, 95% CI 0.71 to 2.50; participants = 375; studies = 3) and no subgroup difference by commencement intake; testing for subgroup differences: P = 0.13, I2 = 50.4%.
Higher versus lower amino acid intake at commencement and maximal intake of parenteral nutrition subgrouped by maximal intake
Nine studies compared higher versus lower amino acid intake at commencement and maximal intake of PN (Black 1981; Blanco 2008; Burattini 2013; Clark 2007; Liu 2015; Scattolin 2013; Tang 2009; Uthaya 2016; Vaidya 1995) .
Primary outcomes
Mortality to discharge (Analysis 5.1): Data show no difference in mortality (typical RR 0.97, 95% CI 0.66 to 1.42; participants = 567; studies = 5) and no subgroup difference according to maximal intake; testing for subgroup differences: P = 0.40, I2 = 0%.
Neurodevelopmental disability or postnatal growth failure: Trials provided no data.
Secondary outcomes
Days to regain birth weight (Analysis 5.2): Data show a reduction in days to regain birth weight (MD ‐1.86, 95% CI ‐2.79 to ‐0.93; participants = 496; studies = 5) and no subgroup difference according to maximal intake; testing for subgroup differences: P = 0.67, I2 = 0%. For subgroups, Vaidya 1995 compared low maximal amino acid intake (3 g/kg/d) versus no amino acid intake and reported no difference in days to regain birth weight (MD ‐1.00, 95% CI ‐5.03 to 3.03; participants = 85). Studies of infants receiving high maximal amino acid intake (> 3 to ≤ 4 g/kg/d) reported a reduction in days to regain birth weight (MD ‐1.91, 95% CI ‐2.87 to ‐0.95; participants = 411; studies = 4).
Maximal weight loss in gram (Analysis 5.3): Studies of high maximal amino acid intake (> 3 to ≤ 4 g/kg/d) reported a reduction in maximal weight loss in grams (MD ‐29.79, 95% CI ‐41.58 to ‐17.99; participants = 185; studies = 2).
Maximal weight loss per cent (Analysis 5.4): Studies of infants receiving high amino acid intake (> 3 to ≤ 4 g/kg/d) reported no difference in maximal weight loss per cent (MD 0.22, 95% CI ‐1.20 to 1.64; participants = 229; studies = 2).
Weight gain to one month (Analysis 5.5): Studies of infants receiving high amino acid intake (> 3 to ≤ 4 g/kg/d) reported no difference in weight gain to one month (MD 1.48 g/kg/d, 95% CI ‐0.29 to 3.25; participants = 154; studies = 2).
Weight gain to discharge (Analysis 5.6): A single study reported no difference in weight gain to discharge (MD 0.60 g/kg/d, 95% CI ‐0.34 to 1.54; participants = 114) (Burattini 2013).
Linear growth to one month (Analysis 5.7): A single study reported no difference in weight gain to discharge (MD 0.00 cm/week, 95% CI ‐0.15 to 0.15; participants = 122) (Clark 2007).
Head circumference growth to one month (Analysis 5.8): A single study reported no difference in weight gain to discharge (MD 0.00, 95% CI ‐0.12 to 0.12; participants = 122) (Clark 2007).
Head circumference growth to discharge (Analysis 5.9): Studies of high maximal amino acid intake (> 3 to ≤ 4 g/kg/d) reported an increase in head circumference growth to discharge (MD 0.11, 95% CI 0.07 to 0.15; participants = 182; studies = 2).
Days to full enteral feeds (Analysis 5.10): Studies of high maximal amino acid intake (> 3 to ≤ 4 g/kg/d) reported a reduction in days to full enteral feeds (MD ‐1.08, 95% CI ‐2.42 to 0.25; participants = 431; studies = 5).
Late‐onset sepsis (Analysis 5.11): Data show no difference in late‐onset sepsis (typical RR 0.96, 95% CI 0.72 to 1.29; participants = 772; studies = 8) and no subgroup difference according to maximal intake; testing for subgroup differences: P = 0.55, I2 = 0%.
Necrostising enterocolitis (Analysis 5.12): Studies of high maximal amino acid intake (> 3 to ≤ 4 g/kg/d) reported no difference in necrotising enterocolitis (typical RR 1.14, 95% CI 0.63 to 2.07; participants = 683; studies = 6).
Chronic lung disease (Analysis 5.13): Studies of high maximal amino acid intake (> 3 to ≤ 4 g/kg/d) reported no difference in chronic lung disease (typical RR 0.81, 95% CI 0.55 to 1.19; participants = 376; studies = 4).
Patent ductus arteriosus (Analysis 5.14): Studies of high maximal amino acid intake (> 3 to ≤ 4 g/kg/d) reported no difference in patent ductus arteriosus (typical RR 0.81, 95% CI 0.60 to 1.10; participants = 236; studies = 2).
Intraventricular haemorrhage (Analysis 5.15): Studies of high maximal amino acid intake (> 3 to ≤ 4 g/kg/d) reported no difference in intraventricular haemorrhage (typical RR 1.09, 95% CI 0.70 to 1.70; participants = 218; studies = 2).
Severe intraventricular haemorrhage (Analysis 5.16): Studies of high maximal amino acid intake (> 3 to ≤ 4 g/kg/d) reported no difference in severe intraventricular haemorrhage (typical RR 0.96, 95% CI 0.46 to 2.02; participants = 402; studies = 4).
Periventricular leukomalacia (Analysis 5.17): Studies of high maximal amino acid intake (> 3 to ≤ 4 g/kg/d) reported a reduction in periventricular leukomalacia (typical RR 0.32, 95% CI 0.10 to 1.00; RD ‐0.04, 95% CI ‐0.07, ‐0.00; P = 0.05; participants = 447; studies = 4).
Severe retinopathy of prematurity (Analysis 5.18): Studies of high maximal amino acid intake (> 3 to ≤ 4 g/kg/d) reported no difference in severe retinopathy of prematurity (typical RR 1.24, 95% CI 0.49 to 3.09; participants = 280; studies = 3).
Cerebral palsy (Analysis 5.19): In infants receiving high maximal amino acid intake (4 g/kg/d), Blanco 2008 reported no difference in cerebral palsy (RR 3.00, 95% CI 0.35 to 25.87; participants = 32).
Developmental delay (Analysis 5.20): In infants receiving high maximal amino acid intake (4 g/kg/d), Burattini 2013 reported no difference in developmental delay (RR 3.25, 95% CI 0.35 to 30.19; participants = 100).
Blindness (Analysis 5.21): In infants receiving high maximal amino acid intake (4 g/kg/d), Blanco 2008 reported no difference in blindness (RR 2.00, 95% CI 0.20 to 19.91; participants = 32).
Abnormal serum ammonia (Analysis 5.22): Blanco 2008 reported an abnormal serum ammonia > 122 μmol/L in one infant receiving high maximal amino acid intake (4 g/kg/d).
Abnormal blood urea nitrogen (Analysis 5.23): Data show an increase in abnormal blood urea nitrogen (various criteria) (typical RR 3.19, 95% CI 2.24 to 4.53; participants = 550; studies = 5) and no subgroup difference according to maximal intake; testing for subgroup differences: P = 0.21, I2 = 36.2%. For subgroups, a single study of low maximal amino acid intake (3.0 g/kg/d) reported an increase in abnormal blood urea nitrogen (criteria not reported) (RR 10.74, 95% CI 1.45 to 79.59; participants = 85) (Vaidya 1995). Studies of high maximal amino acid intake (3.5 to 4 g/kg/d) reported an increase in abnormal blood urea nitrogen (typical RR 2.93, 95% CI 2.05 to 4.18; participants = 465; studies = 4).
Hyperglycaemia (Analysis 5.24): Data show a reduction in hyperglycaemia (typical RR 0.54, 95% CI 0.36 to 0.82; participants = 463; studies = 4) and no subgroup difference according to maximal intake; testing for subgroup differences: P = 0.28, I2 = 15.8%. For subgroups, a single study of low maximal amino acid intake (3.0 g/kg/d) reported no difference in hyperglycaemia (85 infants, RR 1.95, 95% CI 0.18, 20.74) (Vaidya 1995). Studies of infants on high maximal amino acid intake (> 3 to ≤ 4 g/kg/d) reported a reduction in hyperglycaemia (typical RR 0.51, 95% CI 0.34 to 0.79; participants = 378; studies = 3).
Hyperglycaemia treated with insulin (Analysis 5.25): Data show no difference in hyperglycaemia treated with insulin (typical RR 0.62, 95% CI 0.35 to 1.08; participants = 282; studies = 2) and no subgroup difference according to maximal intake; testing for subgroup differences: P = 0.59, I2 = 0%.
Hypoglycaemia (Analysis 5.26): Data show no difference in hypoglycaemia (typical RR 1.03, 95% CI 0.70 to 1.50; participants = 253; studies = 2) and no subgroup difference according to maximal intake; testing for subgroup differences: P = 0.76, I2 = 0%.
Metabolic acidosis (Analysis 5.27): Data show no difference in metabolic acidosis (typical RR 2.05, 95% CI 0.94 to 4.47; participants = 253; studies = 2) and no subgroup difference according to maximal intake; testing for subgroup differences: P = 0.27, I2 = 17.4%.
Cholestasis (Analysis 5.28): Data show no difference in cholestasis (typical RR 1.34, 95% CI 0.71 to 2.50; participants = 375; studies = 3) and no subgroup difference according to maximal intake; testing for subgroup differences: P = 0.11, I2 = 66.6%.
Higher versus lower amino acid intake in parenteral nutrition, subgrouped according to management of caloric balance
Studies included in this review had two principle strategies for management of caloric balance.
-
To increase amino acids and provide isocaloric non‐protein intake (Anderson 1979; Balasubramanian 2013; Blanco 2008; Burattini 2013; Clark 2007; Hata 2002; Heimler 2010; Kashyap 2007; Liu 2015; Pildes 1973; Rivera 1993; Scattolin 2013; Tang 2009; te Braake 2005; Thureen 2003; Uthaya 2016; van Goudoever 1995; van Lingen 1992; Vlaardingerbroek 2013; Xie 2014; Weiler 2006).
-
To increase amino acids and non‐protein caloric intake (Black 1981; Bulbul 2012; Can 2012; Can 2013; Ibrahim 2004; Makay 2007; Morgan 2014; Murdock 1995; Pappoe 2009; Tan 2008; Vaidya 1995). All studies that provided additional non‐protein energy intake provided additional parenteral lipid intake.
Primary outcomes
Mortality to discharge (Analysis 6.1): Data show no difference in mortality (typical RR 0.90, 95% CI 0.69 to 1.17; participants = 1407; studies = 14) and no significant subgroup difference according to management of caloric balance; testing for subgroup differences: P = 0.39, I2 = 0%.
Neurodevelopmental disability (Analysis 6.2): Studies that increased amino acids and provided isocaloric non‐protein intake reported no difference in neurodevelopmental disability (typical RR 1.04, 95% CI 0.48 to 2.23; participants = 201; studies = 2).
Postnatal growth failure at discharge (Analysis 6.3): Data show a reduction in postnatal growth failure at discharge (typical RR 0.74, 95% CI 0.56 to 0.97; participants = 203; studies = 3) and no significant subgroup difference according to management of caloric balance; testing for subgroup differences: P = 0.93, I2 = 0%. Studies that increase amino acids and non‐protein caloric intake reported a reduction in postnatal growth failure at discharge (typical RR 0.73, 95% CI 0.55 to 0.98; participants = 92; studies = 2).
Secondary outcomes
Days to regain birth weight (Analysis 6.4): Data show a reduction in days to regain birth weight overall (MD ‐1.14, 95% CI ‐1.73 to ‐0.56; participants = 950; studies = 13) with no significant subgroup difference according to management of caloric balance; testing for subgroup differences: P = 0.68, I2 = 0%. Studies that increased amino acids and provided isocaloric non‐protein intake reported a reduction in days to regain birth weight (MD ‐1.06, 95% CI ‐1.77 to ‐0.34; participants = 615; studies = 8). Studies that increased amino acids and non‐protein caloric intake reported a reduction in days to regain birth weight (MD ‐1.32, 95% CI ‐2.33 to ‐0.31; participants = 335; studies = 5).
Maximal weight loss grams (Analysis 6.5): Data show a significant reduction in maximal weight loss overall (MD ‐22.71, 95% CI ‐33.68 to ‐11.74; participants = 235; studies = 3) and a significant subgroup difference according to management of caloric balance; testing for subgroup differences: P = 0.001, I2 = 90.2%. Studies that increased amino acids and provided isocaloric non‐protein intake reported a reduction in maximal weight loss (MD ‐29.79, 95% CI ‐41.58 to ‐17.99; participants = 185; studies = 2). A single study that increased amino acids and non‐protein calorie intake reported no differences (50 infants; MD 22.60 g, 95% CI ‐7.25 to 52.45) (Can 2012).
Maximal weight loss per cent (Analysis 6.6): Data show no difference in maximal weight loss per cent overall (MD ‐0.33, 95% CI ‐1.61 to 0.96; participants = 288; studies = 4) and a significant subgroup difference according to management of caloric balance; testing for subgroup differences: P = 0.03, I2 = 78.7%. Studies that increased amino acids and provided isocaloric non‐protein intake reported no difference in maximal weight loss per cent (MD 0.25, 95% CI ‐1.13 to 1.64; participants = 246; studies = 3). A single study that increased amino acids and non‐protein caloric intake reported a reduction in maximal weight loss per cent (MD ‐3.80, 95% CI ‐7.20 to ‐0.40; participants = 42) (Pappoe 2009).
Weight gain to one month (Analysis 6.7): Studies that increased amino acids and provided isocaloric non‐protein intake reported a reduction in weight gain (g/kg/d) to one month (MD ‐1.50, 95% CI ‐2.56 to ‐0.44; participants = 373; studies = 4).
Weight gain to discharge (Analysis 6.8): Data show no difference overall in weight gain (g/kg/d) to discharge (MD 0.76, 95% CI ‐0.02 to 1.54; participants = 291; studies = 4) and no significant subgroup difference according to management of caloric balance; testing for subgroup differences: P = 0.72, I2 = 0%.
Linear growth to one month (Analysis 6.9): A single study that increased amino acids and provided isocaloric non‐protein intake reported a reduction in linear growth to one month (MD ‐0.00 cm/week, 95% CI ‐0.15, ‐0.15; participants = 122) (Clark 2007).
Linear growth to discharge (Analysis 6.10): Another single study that increased amino acids and provided isocaloric non‐protein intake reported a reduction in linear growth to discharge (MD ‐0.27 cm/week, 95% CI ‐0.40, ‐0.14; participants = 123) (Balasubramanian 2013).
Head circumference growth to one month (Analysis 6.11): Data show no difference overall in head circumference growth up to one month (MD 0.01 cm/week, 95% CI ‐0.05 to 0.07; participants = 380; studies = 3) and a significant subgroup difference according to management of caloric balance; testing for subgroup differences: P < 0.00001, I2 = 95%. Studies that increased amino acids and provided isocaloric non‐protein intake reported a decrease in head growth to one month (MD ‐0.16, 95% CI ‐0.25 to ‐0.07; participants = 245; studies = 2). A single study that increased amino acids and non‐protein caloric intake reported an increase in head circumference growth to one month (MD 0.13 cm/week, 95% CI 0.05, 0.20; participants 135) (Morgan 2014).
Head circumference growth to discharge (Analysis 6.12): Studies that increased amino acids and provided isocaloric non‐protein intake reported an increase in head growth to discharge (MD 0.09, 95% CI 0.06 to 0.13; participants = 315; studies = 4).
Weight change z‐score to discharge (Analysis 6.13): Studies that increased amino acids and provided isocaloric non‐protein intake reported no difference in weight change z‐score to discharge (MD 0.01, 95% CI ‐0.33 to 0.36; participants = 207; studies = 2).
Head circumference change z‐score to one month (Analysis 6.14): Data show an increase in head circumference change z‐score to one month (MD 0.27, 95% CI 0.08 to 0.46; participants = 231; studies = 2) and subgroup differences according to management of caloric balance that was borderline significant; testing for subgroup differences: P = 0.09, I2 = 66%. For subgroups, a single study that increased amino acids and provided isocaloric non‐protein intake reported no difference in head circumference change z‐score to one month (RR 0.00, 95% CI ‐0.36 to 0.36; participants = 96) (Vlaardingerbroek 2013). Another single study that increased amino acids and non‐protein intake reported an increase in head circumference change z‐score to one month (RR 0.37, 95% CI 0.15, 0.59; participants = 135) (Morgan 2014).
Head circumference change z‐score to discharge (Analysis 6.15): Studies that increased amino acids and provided isocaloric non‐protein intake found no difference in head circumference change z‐score to discharge (MD 0.18, 95% CI ‐0.15 to 0.50; participants = 207; studies = 2).
Days to full enteral feeds (Analysis 6.16): Data show no difference in days to full enteral feeds (MD ‐0.19, 95% CI ‐1.07 to 0.70; participants = 778; studies = 11) and no significant subgroup difference according to management of caloric balance; testing for subgroup differences: P = 0.11, I2 = 60.9%. Studies that increased amino acids and provided isocaloric non‐protein intake reported no difference in days to full enteral feeds (MD ‐0.90, 95% CI ‐2.14 to 0.35; participants = 495; studies = 7). Studies that increased amino acids and non‐protein caloric intake reported no difference in days to full enteral feeds (MD 0.56, 95% CI ‐0.71 to 1.83; participants = 283; studies = 4).
Late‐onset sepsis (Analysis 6.17): Data show no difference in late‐onset sepsis (typical RR 0.96, 95% CI 0.79 to 1.18; participants = 1255; studies = 15) and no significant subgroup difference according to management of caloric balance; testing for subgroup differences: P = 0.66, I2 = 0%.
Necrotising enterocolitis (Analysis 6.18): Data show no difference in necrotising enterocolitis (typical RR 1.00, 95% CI 0.68 to 1.47; participants = 1301; studies = 14) and no significant subgroup difference according to management of caloric balance; testing for subgroup differences: P = 0.44, I2 = 0%.
Chronic lung disease (Analysis 6.19): Data show no difference in chronic lung disease (typical RR 1.04, 95% CI 0.89 to 1.23; participants = 819; studies = 10) and no significant subgroup difference according to management of caloric balance; testing for subgroup differences: P = 0.43, I2 = 0%.
Intraventricular haemorrhage (Analysis 6.20): Data show no difference in intraventricular haemorrhage (typical RR 1.08, 95% CI 0.73 to 1.59; participants = 370; studies = 4) and no significant subgroup difference according to management of caloric balance; testing for subgroup differences: P = 0.66, I2 = 0%.
Severe intraventricular haemorrhage (Analysis 6.21): Data show no difference in severe intraventricular haemorrhage (typical RR 1.16, 95% CI 0.74 to 1.82; participants = 904; studies = 11) and no significant subgroup difference according to management of caloric balance; testing for subgroup differences: P = 0.44, I2 = %.
Periventricular leukomalacia (Analysis 6.22): Data show no difference in periventricular leukomalacia (typical RR 0.55, 95% CI 0.24 to 1.25; participants = 720; studies = 7) and no significant subgroup difference according to management of caloric balance; testing for subgroup differences: P = 0.12, I2 = 58%. For subgroups, data show a reduction in periventricular leukomalacia in studies that increased amino acids and provided isocaloric non‐protein intake of borderline significance (typical RR 0.32, 95% CI 0.10 to 1.00; participants = 543; studies = 5).
Retinopathy of prematurity (Analysis 6.23): Data show a reduction in retinopathy of prematurity (typical RR 0.44, 95% CI 0.21 to 0.93; participants = 269; studies = 4) and no significant subgroup difference according to management of caloric balance; testing for subgroup differences: P = 0.11, I2 = 61%. The single study that increased amino acids and provided isocaloric non‐protein intake reported no difference in retinopathy of prematurity (123 infants; RR 1.58, 95% CI 0.27 to 9.10). Studies that increased amino acids and non‐protein caloric intake reported a reduction in retinopathy of prematurity (typical RR 0.32, 95% CI 0.13 to 0.77; participants = 146; studies = 3).
Severe retinopathy of prematurity (Analysis 6.24): Data show no difference in severe retinopathy of prematurity (typical RR 0.96, 95% CI 0.56 to 1.63; participants = 672; studies = 8) and no significant subgroup difference according to management of caloric balance; testing for subgroup differences: P = 0.20, I2 = 38%.
Cerebral palsy (Analysis 6.25): Data show no difference in cerebral palsy (typical RR 4.00, 95% CI 0.89 to 17.97; participants = 122; studies = 2) for studies that increased amino acids and provided isocaloric non‐protein intake
Developmental delay at ≥ 18 months (Analysis 6.26): Studies that increased amino acids and provided isocaloric non‐protein intake reported no difference in developmental delay at ≥ 18 months (typical RR 1.35, 95% CI 0.52 to 3.53; participants = 301; studies = 3).
Blindness (Analysis 6.27): Data show no difference in blindness (typical RR 2.00, 95% CI 0.20 to 19.91; participants = 122; studies = 2) for studies that increased amino acids and provided isocaloric non‐protein intake.
Deafness (Analysis 6.28): A single study that increased amino acids and provided isocaloric non‐protein intake reported that no infants were deaf (Vlaardingerbroek 2013).
Abnormal serum ammonia (Analysis 6.29): A single study that increased amino acids and provided isocaloric non‐protein intake reported an abnormal serum ammonia > 122 μmol/L in one infant on higher amino acid intake (Blanco 2008).
Abnormal blood urea nitrogen (Analysis 6.30): Data show an increase in abnormal blood urea nitrogen overall (typical RR 2.77, 95% CI 2.13 to 3.61; participants = 688; studies = 7) with no significant subgroup differences according to management of caloric balance; testing for subgroup differences: P = 0.22, I2 = 33.3%. Data show a significant increase in abnormal blood urea nitrogen in studies that increased amino acids and provided isocaloric non‐protein intake (typical RR 2.60, 95% CI 2.00 to 3.40; participants = 561; studies = 5) and in studies that increased both amino acids and non‐protein calorie intake (typical RR 6.45, 95% CI 1.55 to 26.84; participants = 127; studies = 2).
Hyperglycaemia (Analysis 6.31): Data show no difference in hyperglycaemia overall (typical RR 0.51, 95% CI 0.34 to 0.79; participants = 378; studies = 3) and a significant subgroup difference according to management of caloric balance; testing for subgroup differences: P = 0.002, I2 = 89.3%. For subgroups, studies that increased amino acids and provided isocaloric non‐protein intake reported a reduction in hyperglycaemia (typical RR 0.51, 95% CI 0.34 to 0.79; participants = 378; studies = 3). Studies that increased amino acids and non‐protein calorie nutrition reported no difference (typical RR 1.51, 95% CI 0.88 to 2.62; participants = 127; studies = 2).
Hyperglycaemia treated with insulin (Analysis 6.32): Data show an increase in hyperglycaemia treated with insulin overall (typical RR 1.24, 95% CI 0.93 to 1.66; participants = 534; studies = 5) and a significant subgroup difference according to management of caloric balance; tests for subgroup differences: P = 0.001, I2 = 90.1%. For subgroups, studies that increased amino acids and provided isocaloric non‐protein intake reported no difference in hyperglycaemia treated with insulin (typical RR 0.76, 95% CI 0.49 to 1.19; participants = 378; studies = 3). Studies that increased amino acids and non‐protein calorie nutrition reported an increase (typical RR 2.00, 95% CI 1.35 to 2.98; participants = 156; studies = 2).
Hypoglycaemia (Analysis 6.33): Data show no significant effect overall in hypoglycaemia (typical RR 1.17, 95% CI 0.84 to 1.63; participants = 376; studies = 3) and no significant subgroup difference according to management of caloric balance; testing for subgroup differences: P = 0.94, I2 = 0%.
Metabolic acidosis (Analysis 6.34): Data show no significant effect overall in metabolic acidosis (typical RR 2.05, 95% CI 0.94 to 4.47; participants = 305; studies = 4) and no significant subgroup difference according to management of caloric balance; testing for subgroup differences: P = 0.27, I2 = 17.4%.
Cholestasis (Analysis 6.35): Data show no difference in cholestasis (typical RR 1.26, 95% CI 0.86 to 1.84; participants = 616; studies = 5) and no significant subgroup difference according to management of caloric balance; testing for subgroup differences: P = 0.33, I2 = 0%.
Higher versus lower amino acid intake in parenteral nutrition, very preterm or low birth weight infants
This analysis is restricted to studies that enrolled infants ≤ 1500 grams and/or at ≤ 32 weeks' gestation (Balasubramanian 2013; Blanco 2008; Bulbul 2012; Burattini 2013; Can 2012; Can 2013; Clark 2007; Ibrahim 2004; Morgan 2014; Pappoe 2009; Pildes 1973; Scattolin 2013; Tan 2008; te Braake 2005; Thureen 2003; Uthaya 2016; Vaidya 1995; Vlaardingerbroek 2013; Weiler 2006). Variable enrolment criteria and reporting of gestational and birth weight strata prevents further subgroup analysis.
Primary outcomes
Mortality to discharge (Analysis 7.1): Data show no difference in mortality (typical RR 0.90, 95% CI 0.69 to 1.17; participants = 1407; studies = 14).
Neurodevelopmental disability at two years (Analysis 7.2): Data show no difference in neurodevelopmental disability at two years (typical RR 1.04, 95% CI 0.48 to 2.23; participants = 201; studies = 2).
Postnatal growth failure (Analysis 7.3): Data show a reduction in postnatal growth failure at discharge (typical RR 0.74, 95% CI 0.56 to 0.97; participants = 203; studies = 3). A single study reported no difference in growth failure at two years (RR 0.66, 95% CI 0.33 to 1.32; participants = 111) (te Braake 2005).
Secondary outcomes
Days to regain birth weight (Analysis 7.4): Data show a significant reduction in days to regain birth weight (MD ‐0.78, 95% CI ‐1.46 to ‐0.11; participants = 800; studies = 10).
Maximal weight loss in grams (Analysis 7.5): Data show a reduction in maximal weight loss in grams (MD ‐20.37, 95% CI ‐32.68 to ‐8.05; participants = 139; studies = 2).
Maximal weight loss per cent (Analysis 7.6): Data show no difference in maximal weight loss per cent (MD ‐0.38, 95% CI ‐1.69 to 0.93; participants = 271; studies = 3).
Weight gain (Analysis 7.7): Data show a reduction in weight gain to one month (MD ‐1.50, 95% CI ‐2.56 to ‐0.44; participants = 373; studies = 4) and no difference in weight gain to discharge (MD 0.72, 95% CI ‐0.09 to 1.52; participants = 254; studies = 3).
Linear growth (Analysis 7.8): Data show a reduction in linear growth to one month (MD ‐0.16, 95% CI ‐0.26 to ‐0.06; participants = 245; studies = 2).
Head circumference growth (Analysis 7.9): Data show no difference in head circumference growth to one month (MD 0.01, 95% CI ‐0.04 to 0.06; participants = 476; studies = 4) and an increase in head circumference growth to discharge (MD 0.08, 95% CI 0.05 to 0.12; participants = 182; studies = 2).
Weight change in z‐score (Analysis 7.10): A single study reported no difference in weight change in z‐score to one month (MD ‐0.20, 95% CI ‐0.62 to 0.22; participants = 96) (Vlaardingerbroek 2013). Data show no difference in weight change in z‐score to discharge (MD 0.01, 95% CI ‐0.33 to 0.36; participants = 207; studies = 2) and no difference in weight change in z‐score post discharge (MD 0.13, 95% CI ‐0.26 to 0.52; participants = 201; studies = 2).
Head circumference change in z‐score (Analysis 7.11): Data show an increase in head circumference change in z‐score to one month (MD 0.27, 95% CI 0.08 to 0.46; participants = 231; studies = 2). Meta‐analysis revealed no difference in head circumference change in z‐score to discharge (MD 0.18, 95% CI ‐0.15 to 0.50; participants = 207; studies = 2) and no difference in head circumference change in z‐score post discharge (MD 0.25, 95% CI ‐0.14 to 0.64; participants = 201; studies = 2).
Days to full enteral feeds (Analysis 7.12): Data show no difference in days to full enteral feeds (MD ‐0.19, 95% CI ‐1.07 to 0.70; participants = 778; studies = 11).
Late‐onset sepsis (Analysis 7.13): Data show no difference in late‐onset sepsis (typical RR 0.96, 95% CI 0.79 to 1.18; participants = 1255; studies = 15).
Necrotising enterocolitis (Analysis 7.14): Data show no difference in necrotising enterocolitis (typical RR 1.00, 95% CI 0.68 to 1.47; participants = 1301; studies = 14).
Chronic lung disease (Analysis 7.15): Data show no difference in chronic lung disease (typical RR 1.04, 95% CI 0.89 to 1.23; participants = 819; studies = 10).
Intraventricular haemorrhage (Analysis 7.16): Data show no difference in intraventricular haemorrhage (typical RR 1.12, 95% CI 0.74 to 1.69; participants = 341; studies = 3).
Severe intraventricular haemorrhage (Analysis 7.17): Data show no difference in severe intraventricular haemorrhage (typical RR 1.16, 95% CI 0.74 to 1.82; participants = 904; studies = 11).
Periventricular leukomalacia (Analysis 7.18): Data show no difference in periventricular leukomalacia (typical RR 0.48, 95% CI 0.20 to 1.17; participants = 624; studies = 6).
Retinopathy of prematurity (Analysis 7.19): Data show a reduction in retinopathy of prematurity (typical RR 0.44, 95% CI 0.21 to 0.93; participants = 269; studies = 4).
Severe retinopathy of prematurity (Analysis 7.20): Data show no difference in severe retinopathy of prematurity (typical RR 0.96, 95% CI 0.56 to 1.63; participants = 672; studies = 8).
Cerebral palsy (Analysis 7.21): Data show no difference in cerebral palsy (typical RR 4.00, 95% CI 0.89 to 17.97; participants = 122; studies = 2).
Developmental delay (Analysis 7.22): Data show no difference in developmental delay (typical RR 1.35, 95% CI 0.52 to 3.53; participants = 301; studies = 3).
Blindness (Analysis 7.23): Data show no difference in blindness (typical RR 2.00, 95% CI 0.20 to 19.91; participants = 122; studies = 2).
Deafness (Analysis 7.24): A single study reported no difference in infants with deafness in either group (Vlaardingerbroek 2013).
Abnormal serum ammonia (Analysis 7.25): A single study reported no difference in abnormal serum ammonia >122 μmol/L (RR 3.10, 95% CI 0.13 to 73.16; participants = 61) (Blanco 2008).
Abnormal blood urea nitrogen (Analysis 7.26): Data show an increase in abnormal blood urea nitrogen (typical RR 2.77, 95% CI 2.13 to 3.61; participants = 688; studies = 7).
Hyperglycaemia (Analysis 7.27): Data show a reduction in hyperglycaemia (typical RR 0.66, 95% CI 0.45 to 0.96; participants = 409; studies = 4).
Hyperglycaemia treated with insulin (Analysis 7.28): Data show no difference in hyperglycaemia treated with insulin (typical RR 1.24, 95% CI 0.93 to 1.66; participants = 534; studies = 5).
Hypoglycaemia (Analysis 7.29): Data show no difference in hypoglycaemia (typical RR 1.17, 95% CI 0.84 to 1.63; participants = 376; studies = 3).
Metabolic acidosis (Analysis 7.30): Data show no difference in metabolic acidosis (typical RR 2.05, 95% CI 0.94 to 4.47; participants = 253; studies = 2).
Cholestasis (Analysis 7.31): Data show no difference in cholestasis (typical RR 1.26, 95% CI 0.86 to 1.84; participants = 616; studies = 5).
Higher versus lower amino acid intake in parenteral nutrition, subgrouped according to age at commencement
Studies included in this review commenced parenteral amino acid intake at the following time points.
-
< 24 hours (Anderson 1979; Balasubramanian 2013; Blanco 2008; Bulbul 2012; Burattini 2013; Can 2012; Can 2013; Ibrahim 2004; Makay 2007; Morgan 2014; Murdock 1995; Pappoe 2009; Rivera 1993; Scattolin 2013; Tan 2008; Tang 2009; te Braake 2005; Thureen 2003; van Goudoever 1995; Uthaya 2016; Weiler 2006; Xie 2014).
-
≥ 24 hours to < 48 hours (Clark 2007; Pildes 1973; Vlaardingerbroek 2013).
-
≥ 48 hours to < 72 hours (Black 1981; Vaidya 1995).
-
≥ 72 hours (Hata 2002).
Primary outcomes
Mortality to discharge (Analysis 8.1): Data show no difference in mortality (typical RR 0.90, 95% CI 0.69 to 1.17; participants = 1407; studies = 14) and no significant subgroup difference according to age at commencement of amino acid; testing for subgroup differences: P = 0.45, I2 = 0%.
Neurodevelopmental disability (Analysis 8.2): Studies that commenced amino acids at < 24 hours' age reported no difference in neurodevelopmental disability (typical RR 1.04, 95% CI 0.48 to 2.23; participants = 201; studies = 2).
Postnatal growth failure at discharge (Analysis 8.3): Studies that commenced amino acids at < 24 hours' age reported a significant reduction in postnatal growth failure at discharge (typical RR 0.74, 95% CI 0.56 to 0.97; participants = 203; studies = 3).
Secondary outcomes
Days to regain birth weight (Analysis 8.4): Data show a reduction in days to regain birth weight overall (MD ‐1.14, 95% CI ‐1.73 to ‐0.56; participants = 950; studies = 13) and no significant subgroup difference according to age at commencement of amino acid; testing for subgroup differences: P = 0.94, I2 = 0%. Data show a reduction in days to regain birth weight in studies that commenced higher amino acid intakes at < 24 hours (MD ‐1.15, 95% CI ‐1.74 to ‐0.56; participants = 865; studies = 12). A single study that commenced higher amino acid intakes at ≥ 24 to 48 hours age reported no difference (MD ‐1.00, 95% CI ‐5.03 to 3.03; participants = 85) (Vaidya 1995).
Weight loss in grams (Analysis 8.5): Data show a reduction in weight loss in grams in studies that commenced higher amino acids at < 24 hours (MD ‐22.71, 95% CI ‐33.68 to ‐11.74; participants = 235; studies = 3).
Weight loss per cent (Analysis 8.6): Data show no difference in weight loss per cent in studies that commenced higher amino acids at < 24 hours (MD ‐0.33, 95% CI ‐1.61 to 0.96; participants = 288; studies = 4).
Weight gain to one month (Analysis 8.7): A single study that commenced higher amino acid intakes at ≥ 24 to 48 hours age reported no difference in weight gain to one month (MD 1.50, 95% CI ‐0.27 to 3.27; participants = 122) (Clark 2007).
Weight gain to discharge (Analysis 8.8): Data show no difference in weight gain (g/kg/d) to discharge overall (MD ‐0.16, 95% CI ‐0.87 to 0.54; participants = 446; studies = 6) and no significant subgroup difference according to age at commencement of amino acid; testing for subgroup differences: P = 0.08, I2 = 67.8%.
Linear growth to one month (Analysis 8.9): Data show a reduction in linear growth to one month overall (MD ‐0.16, 95% CI ‐0.26 to ‐0.06; participants = 245; studies = 2) with significant subgroup differences according to age at commencement of amino acid; testing for subgroup differences: P = 0.007, I2 = 86.2%. A single study that commenced amino acids at < 24 hours reported a reduction in linear growth to one month (MD ‐0.27, 95% CI ‐0.40 to ‐0.14; participants = 123) (Balasubramanian 2013). Another single study that commenced amino acids at ≥ 24 to 48 hours' age reported no difference in linear growth to one month (MD 0.00, 95% CI ‐0.15 to 0.15; participants = 122) (Clark 2007).
Head circumference growth to one month (Analysis 8.10): Data show no difference in head circumference growth to one month (MD 0.01, 95% CI ‐0.04 to 0.06; participants = 476; studies = 4) and no significant subgroup difference according to age at commencement of amino acid; testing for subgroup differences: P = 1.00, I2 = 0. Studies that commenced amino acids at < 24 hours reported no difference in head circumference growth to one month (MD 0.01, 95% CI ‐0.06 to 0.08; participants = 258; studies = 2). Studies that commenced amino acids at ≥ 24 to 48 hours reported no difference in head circumference growth to one month (MD 0.01, 95% CI ‐0.07 to 0.09; participants = 218; studies = 2).
Head circumference growth to discharge (Analysis 8.11): Data show an increase in head circumference growth to discharge (MD 0.09, 95% CI 0.06 to 0.13; participants = 315; studies = 4) and a significant subgroup difference according to age at commencement of amino acid; testing for subgroup differences: P = 0.007, I2 = 86.2. Studies that commenced amino acids at < 24 hours reported an increase in head circumference growth to discharge (MD 0.12, 95% CI 0.08 to 0.17; participants = 219; studies = 3). A single study that commenced amino acids at ≥ 24 to 48 hours' age reported no difference (MD 0.03, 95% CI ‐0.03 to 0.09; participants = 96) (Vlaardingerbroek 2013).
Weight gain change in z‐score (Analysis 8.12): Data show no difference in weight gain change in z‐score to discharge (MD 0.01, 95% CI ‐0.33 to 0.36; participants = 207; studies = 2) and no significant subgroup difference according to age at commencement of amino acid; testing for subgroup differences: P = 0.17, I2 = 48.1%.
Head circumference change in z‐score to one month (Analysis 8.13): Data show an increase in head circumference change in z‐score up to one month of age (MD 0.27, 95% CI 0.08 to 0.46; participants = 231; studies = 2) and no significant subgroup difference according to age at commencement of amino acid; testing for subgroup differences: P = 0.09, I2 = 66%. A single study that commenced amino acids at < 24 hours' age reported an increase in head circumference change z‐score up to one month (MD 0.37, 95% CI 0.15 to 0.59; participants = 135) (Morgan 2014). Another single study that commenced amino acids at ≥ 24 to 48 hours reported no difference (MD 0.00, 95% CI ‐0.36 to 0.36; participants = 96) (Vlaardingerbroek 2013).
Head circumference change in z‐score to discharge (Analysis 8.14): Data show no difference in head circumference change in z‐score to discharge (MD 0.18, 95% CI ‐0.15 to 0.50; participants = 207; studies = 2) and no significant subgroup difference according to age at commencement of amino acid; testing for subgroup differences: P = 0.10, I2 = 62.7%.
Days to full enteral feeds (Analysis 8.15): All studies commenced amino acids at < 24 hours. Data show no difference in days to full enteral feeds (MD ‐0.19, 95% CI ‐1.07 to 0.70; participants = 778; studies = 11).
Late‐onset sepsis (Analysis 8.16): Data who no difference in late‐onset sepsis (typical RR 0.96, 95% CI 0.79 to 1.18; participants = 1255; studies = 15) and no significant subgroup difference according to age at commencement of amino acid; testing for subgroup differences: P = 0.72, I2 = 0%.
Necrotising enterocolitis (Analysis 8.17): Data show no difference in necrotising enterocolitis (typical RR 1.00, 95% CI 0.68 to 1.47; participants = 1301; studies = 14) and no significant subgroup difference according to age at commencement of amino acid; testing for subgroup differences: P = 0.85, I2 = 0%.
Chronic lung disease (Analysis 8.18): Data show no difference in chronic lung disease (typical RR 1.04, 95% CI 0.89 to 1.23; participants = 819; studies = 10) and no significant subgroup difference according to age at commencement of amino acid; testing for subgroup differences: P = 0.23, I2 = 29.5%.
Intraventricular haemorrhage (Analysis 8.19): Data show no difference in intraventricular haemorrhage (typical RR 1.12, 95% CI 0.74 to 1.69; participants = 341; studies = 3) and no significant subgroup difference according to age at commencement of amino acid; testing for subgroup differences: P = 0.72, I2 = 0%.
Severe intraventricular haemorrhage (Analysis 8.20): Data show no difference in severe intraventricular haemorrhage (typical RR 1.16, 95% CI 0.74 to 1.82; participants = 904; studies = 11) and no significant subgroup difference according to age at commencement of amino acid; testing for subgroup differences: P = 0.97, I2 = 0%.
Periventricular leukomalacia (Analysis 8.21): Data show no difference in periventricular leukomalacia (typical RR 0.55, 95% CI 0.24 to 1.25; participants = 720; studies = 7) and no significant subgroup difference according to age at commencement of amino acid; testing for subgroup differences: P = 0.20, I2 = 40.3%.
Retinopathy of prematurity (Analysis 8.22): All four studies reporting retinopathy of prematurity commenced amino acids at < 24 hours. Data show a reduction in retinopathy of prematurity (typical RR 0.44, 95% CI 0.21 to 0.93; participants = 269; studies = 4).
Severe retinopathy of prematurity (Analysis 8.23): Data show no difference in severe retinopathy of prematurity (typical RR 0.96, 95% CI 0.56 to 1.63; participants = 672; studies = 8) and no significant subgroup difference according to age at commencement of amino acid; testing for subgroup differences: P = 0.26, I2 = 20%.
Cerebral palsy (Analysis 8.24): Studies that commenced amino acids at < 24 hours reported no difference in cerebral palsy (typical RR 4.00, 95% CI 0.89 to 17.97; participants = 122; studies = 2).
Developmental delay at ≥ 18 months (Analysis 8.25): Studies that commenced amino acids at < 24 hours reported no difference in developmental delay at ≥ 18 months (typical RR 1.35, 95% CI 0.52 to 3.53; participants = 301; studies = 3).
Blindness (Analysis 8.26): Studies that commenced amino acids at < 24 hours reported no difference in blindness (typical RR 2.00, 95% CI 0.20 to 19.91; participants = 122; studies = 2).
Deafness (Analysis 8.27): A single study that commenced amino acids at ≥ 24 to < 48 hours reported no infants with deafness in either group (Vlaardingerbroek 2013).
Abnormal serum ammonia (Analysis 8.28): A single study that commenced amino acids at < 24 hours reported an abnormal serum ammonia > 122 μmol/L in one infant on higher amino acid intake (Blanco 2008).
Abnormal blood urea nitrogen (Analysis 8.29): Data show an increase in abnormal blood urea nitrogen overall (typical RR 2.77, 95% CI 2.13 to 3.61; participants = 688; studies = 7) and no significant subgroup difference according to age at commencement of amino acid; testing for subgroup differences: P = 0.23, I2 = 31.4%. Data show increases in abnormal blood urea nitrogen in studies commencing amino acid at < 24 hours (typical RR 2.85, 95% CI 2.00 to 4.06; participants = 385; studies = 4); studies commencing amino acid at ≥ 24 to 48 hours (typical RR 2.20, 95% CI 1.50 to 3.23; participants = 218; studies = 2); and one study commencing amino acid at ≥ 48 to 72 hours (RR 10.74, 95% CI 1.45 to 79.59; participants = 85) (Vaidya 1995).
Hyperglycaemia (Analysis 8.30): Data show a reduction in hyperglycaemia overall (typical RR 0.69, 95% CI 0.49 to 0.96; participants = 505; studies = 5) and no significant subgroup difference according to age at commencement of amino acid; testing for subgroup differences: P = 0.38, I2 = 0%.
Hyperglycaemia treated with insulin (Analysis 8.31): Data show no difference in hyperglycaemia treated with insulin (typical RR 1.24, 95% CI 0.93 to 1.66; participants = 534; studies = 5) and no significant subgroup difference according to age at commencement of amino acid; testing for subgroup differences: P = 0.82, I2 = 0%. Subgroup analysis of studies that commenced amino acids at < 24 hours revealed no difference in hyperglycaemia treated with insulin (typical RR 1.26, 95% CI 0.92 to 1.72; participants = 438; studies = 4). A single study that commenced amino acids at ≥ 24 to < 48 hours reported no difference (RR 1.15, 95% CI 0.54 to 2.45; participants = 96) (Vlaardingerbroek 2013).
Hypoglycaemia (Analysis 8.32): Data show no difference in hypoglycaemia overall (typical RR 1.17, 95% CI 0.84 to 1.63; participants = 376; studies = 3) and no significant subgroup difference according to age at commencement of amino acid; testing for subgroup differences: P = 0.94, I2 = 0%.
Metabolic acidosis (Analysis 8.33): Data show no difference in metabolic acidosis overall (typical RR 2.05, 95% CI 0.94 to 4.47; participants = 305; studies = 4) and no significant subgroup difference according to age at commencement of amino acid; testing for subgroup differences: P = 0.27, I2 = 17.4%.
Cholestasis (Analysis 8.34): Data show no difference in cholestasis overall (typical RR 1.26, 95% CI 0.86 to 1.84; participants = 616; studies = 5) and no significant subgroup difference according to age at commencement of amino acid; testing for subgroup differences: P = 0.22, I2 = 34.5%.
Higher versus lower amino acid intake in parenteral nutrition, subgrouped according to lipid intake
We did not prespecify this subgroup analysis. Studies included in this review used differing strategies for lipid infusion, so we had to perform a subgroup analysis to determine an effect of lipid intake.
-
Early lipid infusion (Black 1981; Blanco 2008; Bulbul 2012; Can 2012; Can 2013; Clark 2007; Heimler 2010; Ibrahim 2004; Liu 2015; Makay 2007; Morgan 2014; Murdock 1995; Pappoe 2009; Tan 2008; Tang 2009; te Braake 2005; Thureen 2003; Uthaya 2016; Vaidya 1995; van Goudoever 1995; van Lingen 1992; Vlaardingerbroek 2013; Weiler 2006; Xie 2014).
-
Delayed lipid infusion ≥ 5 days (Burattini 2013; Vaidya 1995).
-
No lipid infusion (Anderson 1979; Balasubramanian 2013; Hata 2002; Pildes 1973; Rivera 1993; van Goudoever 1995).
Primary outcomes
Mortality to discharge (Analysis 9.1): Data show no difference in mortality (typical RR 0.90, 95% CI 0.69 to 1.17; participants = 1407; studies = 14) and no significant subgroup difference according to age at commencement of lipid; testing for subgroup differences: P = 0.79, I2 = 0%.
Neurodevelopmental disability (Analysis 9.2): Studies that provided early lipid intake reported no difference in neurodevelopmental disability (typical RR 1.04, 95% CI 0.48 to 2.23; participants = 201; studies = 2).
Postnatal growth failure at discharge (Analysis 9.3): All studies reporting postnatal growth failure commenced early lipid. Data show a significant reduction in postnatal growth failure at discharge (typical RR 0.74, 95% CI 0.56 to 0.97; participants = 203; studies = 3).
Secondary outcomes
Days to regain birth weight (Analysis 9.4): Data show a reduction in days to regain birth weight overall (MD ‐1.14, 95% CI ‐1.73 to ‐0.56; participants = 950; studies = 13) and no significant subgroup difference according to age at commencement of lipid; testing for subgroup differences: P < 0.00001, I2 = 92%. Studies commencing early lipid infusion reported a reduction in days to regain birth weight (MD ‐2.02, 95% CI ‐2.73 to ‐1.31; participants = 513; studies = 9). Studies with delayed lipid infusion ≥ 5 days reported no difference in days to regain birth weight (MD ‐0.57, 95% CI ‐2.04 to 0.91; participants = 199; studies = 2). Studies with no lipid reported an increase in days to regain birth weight (MD 2.04, 95% CI 0.58 to 3.50; participants = 238; studies = 2).
Maximal weight loss grams (Analysis 9.5): All studies reporting maximal weight loss in grams commenced early lipid infusion. Data show a decrease in maximal weight loss (MD ‐22.71, 95% CI ‐33.68 to ‐11.74; participants = 235; studies = 3).
Maximal weight loss per cent (Analysis 9.6): Data show no difference in maximal weight loss per cent overall (MD ‐0.33, 95% CI ‐1.61 to 0.96; participants = 288; studies = 4) and no significant subgroup difference according to age at commencement of lipid; testing for subgroup differences: P = 0.20, I2 = 37%.
Weight gain to one month (Analysis 9.7): Data show a reduction in weight gain to one month overall (MD ‐1.50, 95% CI ‐2.56 to ‐0.44; participants = 373; studies = 4) with a significant subgroup difference according to age at commencement of lipid; testing for subgroup differences: P < 0.00001, I2 = 94.9%. Studies commencing early lipid infusion reported no difference in weight gain to one month (MD 0.42, 95% CI ‐0.94 to 1.78; participants = 250; studies = 3). A single study with no lipid reported a reduction in weight gain to one month (MD ‐4.48, 95% CI ‐6.17 to ‐2.79; participants = 123) (Balasubramanian 2013).
Weight gain to discharge (Analysis 9.8): Data show no difference in weight gain to discharge overall (MD 0.76, 95% CI ‐0.02 to 1.54; participants = 291; studies = 4) and no significant subgroup difference according to age at commencement of lipid; testing for subgroup differences: P = 0.55, I2 = 0%.
Linear growth to one month (Analysis 9.9): Data show a reduction in linear growth to one month overall (MD ‐0.16, 95% CI ‐0.26 to ‐0.06; participants = 245; studies = 2) with a significant subgroup difference according to age at commencement of lipid; testing for subgroup differences: P = 0.007, I2 = 86.2%. A single study commencing early lipid infusion reported no difference in linear growth to one month (MD 0.00, 95% CI ‐0.15 to 0.15; participants = 122) (Clark 2007). A single study of no lipid reported a reduction in linear growth to one month (MD ‐0.27, 95% CI ‐0.40 to ‐0.14; participants = 123) (Balasubramanian 2013).
Head circumference growth to one month (Analysis 9.10): Data show no difference in head circumference growth to one month overall (MD 0.01, 95% CI ‐0.04 to 0.06; participants = 476; studies = 4) with a significant subgroup difference according to age at commencement of lipid; testing for subgroup differences: P < 0.00001, I2 = 97%. Studies commencing early lipid infusion reported an increase in head circumference growth to one month (MD 0.07, 95% CI 0.02 to 0.13; participants = 353; studies = 3). A single study of no lipid reported a reduction in head circumference growth to one month (MD ‐0.38, 95% CI ‐0.51 to ‐0.24; participants = 123) (Balasubramanian 2013).
Head circumference growth to discharge (Analysis 9.11): All studies reporting head circumference growth to discharge commenced early lipid infusion. Studies that commenced early lipid infusion reported an increase in head circumference growth to discharge (MD 0.09, 95% CI 0.06 to 0.13; participants = 315; studies = 4).
Only studies that commenced early lipid infusion reported change in z scores.
Weight change z‐score to one month (Analysis 9.12): A single study that commenced early lipid infusion reported no difference in weight change z‐score to one month (MD ‐0.20, 95% CI ‐0.62 to 0.22; participants = 96) (Vlaardingerbroek 2013).
Weight change z‐score to discharge (Analysis 9.13): Studies that commenced early lipid infusion reported no difference in weight change z‐score to discharge (MD 0.01, 95% CI ‐0.33 to 0.36; participants = 207; studies = 2).
Weight change z‐score post discharge (Analysis 9.14): Studies that commenced early lipid infusion reported no difference in weight change z‐score post discharge (MD 0.13, 95% CI ‐0.26 to 0.52; participants = 201; studies = 2).
Head circumference change z‐score to one month (Analysis 9.15): Studies that commenced early lipid infusion reported an increase in head circumference change z‐score to one month (MD 0.27, 95% CI 0.08 to 0.46; participants = 231; studies = 2).
Head circumference change z‐score to discharge (Analysis 9.16): Studies that commenced early lipid infusion reported no difference in head circumference change z‐score to discharge (MD 0.18, 95% CI ‐0.15 to 0.50; participants = 207; studies = 2).
Head circumference change z‐score post discharge (Analysis 9.17): Studies that commenced early lipid infusion reported no difference in head circumference change z‐score post discharge (MD 0.25, 95% CI ‐0.14 to 0.64; participants = 201; studies = 2).
Days to full enteral feeds (Analysis 9.18): Studies reported no differences overall (MD ‐0.19, 95% CI ‐1.07 to 0.70; participants = 778; studies = 11) and no significant subgroup difference in days to full enteral feeds; testing for subgroup differences: P = 0.44; I2 = 0%.
Late‐onset sepsis (Analysis 9.19): Data show no differences overall (typical RR 0.96, 95% CI 0.79 to 1.18; participants = 1255; studies = 15), no differences for subgroups, and no significant subgroup difference in late‐onset sepsis; testing for subgroup differences: P = 0.90, I2 = 0%.
Necrotising enterocolitis (Analysis 9.20): Data show no differences overall, no differences for subgroups, and no significant subgroup difference in necrotising enterocolitis (typical RR 1.00, 95% CI 0.68 to 1.47; participants = 1301; studies = 14); testing for subgroup differences: P = 0.72, I2 = 0%.
Chronic lung disease (Analysis 9.21): Data show no differences in chronic lung disease (typical RR 1.04, 95% CI 0.89 to 1.23; participants = 819; studies = 10) and no significant subgroup difference according to age at commencement of lipid; testing for subgroup differences: P = 0.07, I2 = 63.1%.
Patent ductus arteriosus (Analysis 9.22): Data show a reduction in patent ductus arteriosus (typical RR 0.78, 95% CI 0.61 to 0.99; participants = 480; studies = 6) and no significant subgroup difference according to age at commencement of lipid; testing for subgroup differences: P = 0.26, I2 = 25.5%.
Intraventricular haemorrhage (Analysis 9.23): Data show no differences in intraventricular haemorrhage (typical RR 1.12, 95% CI 0.74 to 1.69; participants = 341; studies = 3) and no significant subgroup difference according to age at commencement of lipid; testing for subgroup differences: P = 0.81, I2 = 0%.
Severe intraventricular haemorrhage (Analysis 9.24): Data show no differences in severe intraventricular haemorrhage (typical RR 1.16, 95% CI 0.74 to 1.82; participants = 904; studies = 11) and no significant subgroup difference according to age at commencement of lipid; testing for subgroup differences: P = 0.54, I2 = 0%.
Periventricular leukomalacia (Analysis 9.25): Data show no difference in periventricular leukomalacia (typical RR 0.55, 95% CI 0.24 to 1.25; participants = 720; studies = 7) and no significant subgroup difference according to age at commencement of lipid; testing for subgroup differences: P = 0.48, I2 = 0%.
Retinopathy of prematurity (Analysis 9.26): Data show a reduction in retinopathy of prematurity (typical RR 0.44, 95% CI 0.21 to 0.93; participants = 269; studies = 4) and no significant subgroup difference according to age at commencement of lipid; testing for subgroup differences: P = 0.11, I2 = 60.6%. Subgroup analysis showed a reduction for studies commencing early lipid infusion (typical RR 0.32, 95% CI 0.13 to 0.77; participants = 146; studies = 3). A single study of infants who did not receive lipid infusion reported no difference (RR 1.58, 95% CI 0.27 to 9.10; participants = 123) (Balasubramanian 2013).
Severe retinopathy of prematurity (Analysis 9.27): Data show no difference in severe retinopathy of prematurity (typical RR 0.96, 95% CI 0.56 to 1.63; participants = 672; studies = 8) and no significant subgroup difference according to age at commencement of lipid; testing for subgroup differences: P = 0.58, I2 = 0%.
Cerebral palsy (Analysis 9.28): Studies that commenced early lipid infusion reported no difference in cerebral palsy (typical RR 4.00, 95% CI 0.89 to 17.97; participants = 122; studies = 2).
Developmental delay at ≥ 18 months (Analysis 9.29): Data show no difference overall in developmental delay at ≥ 18 months (typical RR 1.35, 95% CI 0.52 to 3.53; participants = 301; studies = 3) and no significant subgroup difference according to age at commencement of lipid; testing for subgroup differences: P = 0.37, I2 = 0%.
Blindness (Analysis 9.30): Studies that commenced early lipid infusion reported no difference in blindness (typical RR 2.00, 95% CI 0.20 to 19.91; participants = 122; studies = 2).
Deafness (Analysis 9.31): A single study that commenced early lipid infusion reported no infant with deafness in either group (Vlaardingerbroek 2013).
Abnormal serum ammonia (Analysis 9.32): A single study that commenced early lipid infusion reported an abnormal serum ammonia > 122 μmol/L in one infant on higher amino acid intake (Blanco 2008).
Abnormal blood urea nitrogen (Analysis 9.33): Data show an increase in abnormal blood urea nitrogen overall (typical RR 2.77, 95% CI 2.13 to 3.61; participants = 688; studies = 7) with no significant subgroup difference according to age at commencement of lipid; testing for subgroup differences: P = 0.68, I2 = 0%. Data show an increase in abnormal blood urea nitrogen in studies commencing early lipid infusion (typical RR 2.66, 95% CI 1.95 to 3.64; participants = 489; studies = 5). Studies that commenced lipid at ≥ 5 days reported a significant increase in abnormal blood urea nitrogen (typical RR 3.01, 95% CI 1.83 to 4.95; participants = 199; studies = 2).
Hyperglycaemia (Analysis 9.34): Data show a reduction in hyperglycaemia overall (typical RR 0.69, 95% CI 0.49 to 0.96; participants = 505; studies = 5) and no significant subgroup difference according to age at commencement of lipid; testing for subgroup differences: P = 0.08, I2 = 68.1%. Studies that commenced early lipid infusion reported no difference in hyperglycaemia (typical RR 0.84, 95% CI 0.57 to 1.22; participants = 306; studies = 3). Studies that delayed lipid infusion ≥ 5 days reported a reduction in hyperglycaemia (typical RR 0.39, 95% CI 0.18 to 0.83; participants = 199; studies = 2).
Hyperglycaemia treated with insulin (Analysis 9.35): Data show no difference in hyperglycaemia treated with insulin (typical RR 1.24, 95% CI 0.93 to 1.66; participants = 534; studies = 5) and no significant subgroup difference according to age at commencement of lipid; testing for subgroup differences: P = 0.25, I2 = 24%. Studies that commenced early lipid infusion reported no difference in hyperglycaemia treated with insulin (typical RR 1.29, 95% CI 0.96 to 1.73; participants = 420; studies = 4). A single study that delayed lipid infusion ≥ 5 days reported no difference in hyperglycaemia treated with insulin (RR 0.35, 95% CI 0.04 to 3.22; participants = 114) (Burattini 2013).
Hypoglycaemia (Analysis 9.36): Data show no difference in hypoglycaemia overall (typical RR 1.17, 95% CI 0.84 to 1.63; participants = 376; studies = 3) and no significant subgroup difference according to age at commencement of lipid; testing for subgroup differences: P = 0.45, I2 = 0%.
Metabolic acidosis (Analysis 9.37): Data show no difference in metabolic acidosis (typical RR 2.05, 95% CI 0.94 to 4.47; participants = 305; studies = 4) and no significant subgroup difference according to age at commencement of lipid; testing for subgroup differences: P = 0.27, I2 = 17.4%.
Cholestasis (Analysis 9.38): Data show no difference in cholestasis overall (typical RR 1.26, 95% CI 0.86 to 1.84; participants = 616; studies = 5) and no significant subgroup difference according to age at commencement of lipid; testing for subgroup differences: P = 0.11, I2 = 63.7%. No study reported cholestasis in the absence of parenteral lipid administration.
Higher versus lower amino acid intake in parenteral nutrition: sensitivity analysis (allocation concealment, adequate randomisation, blinding of treatment, less than 10% loss to follow‐up)
Primary outcomes
Mortality to discharge (Analysis 10.1): High‐quality studies reported no difference in mortality (typical RR 0.74, 95% CI 0.42 to 1.29; participants = 568; studies = 5).
Neurodevelopmental disability (Analysis 10.2): Both studies reporting neurodevelopmental disability had methodological concerns.
Postnatal growth failure at discharge (Analysis 10.3): A single study at low risk of bias reported a reduction in postnatal growth failure at discharge (RR 0.59, 95% CI 0.39 to 0.88; participants = 50) (Can 2012).
Postnatal growth failure post discharge (Analysis 10.4): A single study reporting postnatal growth failure post discharge did not report the method of sequence generation and had imbalances between groups (te Braake 2005).
Secondary outcomes
Days to regain birth weight (Analysis 10.5): High‐quality studies reported no difference in days to regain birth weight (MD ‐0.49, 95% CI ‐1.87 to 0.89; participants = 94; studies = 2).
Maximal weight loss grams (Analysis 10.6): A single study at low risk of bias reported no difference in maximal weight loss in grams (MD 22.60, 95% CI ‐7.25 to 52.45; participants = 50) (Can 2012).
Maximal weight loss in per cent (Analysis 10.7): No high‐quality studies reported maximal weight loss in per cent.
Weight gain to one month (Analysis 10.8): A single study at low risk of bias reported no difference in weight gain to one month (MD 1.50, 95% CI ‐0.27 to 3.27; participants = 122) (Clark 2007).
Weight gain to discharge (Analysis 10.9): No high‐quality studies reported weight gain to discharge.
Linear growth to one month (Analysis 10.10): A single study at low risk of bias reported no difference in linear growth to one month (MD 0.00, 95% CI ‐0.15 to 0.15; participants = 122) (Clark 2007).
Head circumference growth to one month (Analysis 10.11): High‐quality studies reported an increase in head circumference growth at one month (MD 0.09, 95% CI 0.02 to 0.15; participants = 257; studies = 2).
Head circumference growth to discharge (Analysis 10.12): No study at low risk of bias reported head circumference growth to discharge.
Weight change in z‐score (Analysis 10.13; Analysis 10.14; Analysis 10.15): No high‐quality studies reported weight change in z‐score at any time point.
Head circumference change z‐score (Analysis 10.16): A single study reported an increase in head circumference change z‐score at one month (MD 0.37, 95% CI 0.15 to 0.59; participants = 135) (Morgan 2014). No study at low risk of bias reported head circumference change z‐score at any other time point (Analysis 10.17; Analysis 10.18).
Days to full enteral feeds (Analysis 10.19): High‐quality studies reported no difference in days to full enteral feeds (MD ‐0.20, 95% CI ‐1.60 to 1.20; participants = 169; studies = 3).
Late‐onset sepsis (Analysis 10.20): High‐quality studies reported no difference in late‐onset sepsis (typical RR 1.03, 95% CI 0.72 to 1.46; participants = 293; studies = 3).
Necrotising enterocolitis (Analysis 10.21): Studies at low risk of bias reported no difference in necrotising enterocolitis (typical RR 0.89, 95% CI 0.50 to 1.60; participants = 511; studies = 5).
Chronic lung disease (Analysis 10.22): Studies at low risk of bias reported no difference in chronic lung disease (typical RR 1.02, 95% CI 0.79 to 1.31; participants = 177; studies = 2).
Intraventricular haemorrhage (Analysis 10.23): A single study at low risk of bias reported no difference in intraventricular haemorrhage (RR 1.05, 95% CI 0.64 to 1.73; participants = 122) (Clark 2007).
Severe intraventricular haemorrhage (Analysis 10.24): Studies at low risk of bias reported no difference in severe intraventricular haemorrhage (typical RR 1.42, 95% CI 0.66 to 3.03; participants = 343; studies = 4).
Periventricular leukomalacia (Analysis 10.25): Studies at low risk of bias reported no difference in periventricular leukomalacia (typical RR 0.61, 95% CI 0.21 to 1.81; participants = 299; studies = 3).
Retinopathy of prematurity (Analysis 10.26): A single study at low risk of bias reported a reduction in retinopathy of prematurity (RR 0.16, 95% CI 0.04 to 0.67; participants = 75) (Can 2012).
Severe retinopathy of prematurity (Analysis 10.27): Studies at low risk of bias reported no difference in severe retinopathy of prematurity (typical RR 0.77, 95% CI 0.36 to 1.66; participants = 252; studies = 3).
Neurodevelopment (Analysis 10.28; Analysis 10.29; Analysis 10.30; Analysis 10.31): No study at low risk of bias reported neurodevelopmental outcomes (cerebral palsy, developmental delay, blindness or deafness).
Abnormal serum ammonia (Analysis 10.32): A single study at low risk of bias for biochemical outcomes reported an abnormal serum ammonia > 122 μmol/L in one infant on higher amino acid intake (Blanco 2008).
Abnormal blood urea nitrogen (Analysis 10.33): Studies at low risk of bias reported an increase in abnormal blood urea nitrogen (typical RR 12.29, 95% CI 1.66 to 90.79; participants = 183; studies = 2).
Hyperglycaemia (Analysis 10.34): No studies at low risk of bias reported hyperglycaemia.
Hyperglycaemia treated with insulin (Analysis 10.35): No studies at low risk of bias reported hyperglycaemia treated with insulin.
Hypoglycaemia (Analysis 10.36): No studies at low risk of bias reported hypoglycaemia.
Metabolic acidosis (Analysis 10.37): No studies at low risk of bias reported metabolic acidosis.
Cholestasis (Analysis 10.38): Studies at low risk of bias reported no difference in cholestasis (typical RR 1.21, 95% CI 0.67 to 2.17; participants = 249; studies = 2).
Discussion
Summary of main results
Primary outcomes
Higher amino acid intake in parenteral nutrition did not affect mortality (GRADE level of evidence: low ‐ see grading of evidence summary (summary of findings Table for the main comparison. We downgraded the quality of evidence owing to imprecision and potential for publication or reporting bias. We found no significant mortality differences in subgroup analyses according to amino acid intake at commencement, at maximal intake, or at commencement and maximal intake; according to management of caloric balance (non‐protein caloric intake); in very preterm or very low birth weight infants; according to age of commencement; or according to timing of lipid intake. We found insufficient evidence to determine an effect on neurodevelopment and found no reported benefit (GRADE level of evidence: very low). We downgraded the quality of evidence owing to risk of bias, inconsistency, imprecision, and potential for publication or reporting bias.
We found that higher amino acid intake in parenteral nutrition was associated with a reduction in postnatal growth failure at discharge (number needed to treat for an additional beneficial outcome (NNTB) 7, 95% confidence interval (CI) 4 to 50) (GRADE level of evidence: very low). We downgraded the quality of evidence owing to risk of bias, imprecision, and potential for publication or reporting bias. Subgroup analyses revealed a significant reduction in postnatal growth failure at discharge for infants commenced on high amino acid intake (> 2 to ≤ 3 g/kg/d); with increased amino acid and non‐protein caloric intake; commenced on intake at < 24 hours' age; and given an early lipid infusion.
Secondary outcomes
Growth outcomes
Higher amino acid intake in parenteral nutrition was associated with a reduction in days to regain birth weight. Subgroup analysis showed that the reduction in days to regain birth weight was consistent for studies that commenced on high amino acid intake (> 2 to ≤ 3 g/kg/d); that reported high maximal amino acid intake (> 3 to ≤ 4 g/kg/d); that provided isocaloric non‐protein intake; that reported increased non‐protein intake with higher amino acid intake; that commenced amino acids early (at < 24 hours' age); and that provided an early lipid infusion.
Growth effects were variable at other time points. Higher amino acid intake in parenteral nutrition reduced maximal weight loss in studies reporting effects in grams but not in studies reporting per cent. Analyses of weight loss in grams and per cent incorporated different studies. Results showed a reduction in weight gain up to one month but no significant difference to discharge (GRADE level of evidence: very low). For weight gain to one month, studies that commenced higher amino acid with an early lipid infusion reported no difference. A single study that provided no lipid infusion reported reduced weight and length gain to one month in infants who received higher amino acids (Balasubramanian 2013). In contrast, analyses revealed no difference in head circumference growth at one month but an increase in head circumference growth to discharge among infants receiving higher amino acid intake (GRADE level of evidence: very low). Subgroup analyses showed a significant increase in head circumference growth to discharge for infants on high amino acid intake (> 2 to ≤ 3 g/kg/d) at commencement; and for infants on high amino acid intake (> 3 to ≤ 4 g/kg/d) at maximal intake. Effects on anthropometric z‐scores were not consistent at any time point.
Clinical outcomes
Analysis revealed no effect from higher amino acid intake in parenteral nutrition on days to full enteral feeds, late‐onset sepsis, necrotising enterocolitis, chronic lung disease, intraventricular haemorrhage, severe intraventricular haemorrhage, or periventricular leukomalacia. Higher amino acid intake in parenteral nutrition was associated with a reduction in retinopathy of prematurity (NNTB 12.5, 95% CI 6.7 to 100) (GRADE level of evidence: very low). Heterogeneity between studies was high. Subgroup analyses that found a significant reduction in retinopathy of prematurity included studies commencing high amino acid intake (> 2 to ≤ 3 g/kg/d); that increased both amino acids and non‐protein energy intake; commencing amino acid intake early; and commencing early lipid infusion. However, analyses revealed no difference in severe retinopathy of prematurity.
Although we found no significant difference overall in periventricular leukomalacia, we did find a reduction in periventricular leukomalacia when performing subgroup analyses of studies that commenced low amino acid intake (> 1 to ≤ 2 g/kg/d); that reported high maximal amino acid intake (> 3 to ≤ 4 g/kg/d); and that increased amino acids and provided isocaloric non‐protein intake.
Biochemical outcomes
Higher amino acid intake in parenteral nutrition was associated with an increase in protein and nitrogen balance, which increased with increasing amino acid intake. Trials reported potential biochemical intolerances. All nine infants with a serum ammonia > 69 μmol/L and the only infant with ammonia > 122 μmol/L were included in the higher amino acid group. Data show a substantially increased risk of abnormal blood urea nitrogen (typical risk ratio (RR) 2.77, 95% CI 2.13 to 3.61; participants = 688; studies = 7; I2 = 6%; risk difference (RD) 0.26, 95% CI 0.20 to 0.32; number needed to treat for an additional harmful outcome (NNTH) 4, 95% CI 3 to 5) (GRADE level of evidence: high). Studies had variable reporting levels for abnormal blood urea levels. However, when analysis is restricted to studies reporting blood urea levels above those reported in foetuses (Ridout 2005: > 14.3 mmol/L), the effect remains significant.
Higher amino acid intake in parenteral nutrition was associated with a reduction in hyperglycaemia (> 8.3 mmol/L), although the incidence of hyperglycaemia treated with insulin was not significantly different. Subgroup analyses found reduced hyperglycaemia in studies that commenced high amino acid intake (> 2 to ≤ 3 g/kg/d); that had high amino acid intake (> 3 to ≤ 4 g/kg/d) at maximal intake; that increased amino acids whilst providing isocaloric non‐protein intake; and that delayed lipid infusion for five days or longer. Although the data show no difference in hyperglycaemia treated with insulin overall, subgroup analyses revealed increases in studies that commenced on low amino acid intake (> 1 to ≤ 2 g/kg/d); that reported high amino acid intake (> 3 to ≤ 4 g/kg/d) at maximal intake; that increased amino acids and non‐protein energy intake; that included very preterm or very low birth weight infants; that commenced amino acids early; and that commenced lipid early.
Data show no differences in the incidence of hypoglycaemia or metabolic acidosis or cholestasis.
Overall completeness and applicability of evidence
We report substantial limitations to the overall completeness and applicability of evidence. Of the 31 included studies, six were short‐term biochemical studies (Anderson 1979; Murdock 1995; Rivera 1993; Thureen 2003; van Goudoever 1995; van Lingen 1992), one was a trial that enrolled term surgical infants (Hata 2002), and another included infants at > 35 weeks (Makay 2007) ‐ all without substantial clinical reporting. We could not included in meta‐analysis data from another study (Pildes 1973). One study has not yet published data (Kashyap 2007). The 21 remaining trials assessed various aspects of parenteral nutrition including higher amino acid intake at commencement (nine studies), higher maximal amino acid intake (two studies), higher amino acid intake at commencement and maximal intake (10 studies), and a higher rate of grading (one study).
Of the 21 studies reporting clinical effects included in this review, outcome reporting was variable both for outcomes reported and for timing of reporting. Outcomes reported by more than 50% of studies (≥ 10 of 21) included mortality (14 studies), days to regain birth weight (13 studies), late‐onset sepsis (15 studies), necrotising enterocolitis (14 studies), chronic lung disease (10 studies), and severe intraventricular haemorrhage (11 studies).
A minority of studies reported extremely preterm (< 28 weeks' gestation) or extremely low birth weight infants (< 1000 grams) separately, so we did not undertake subgroup analysis. However, most trials enrolled very low birth weight or very preterm infants (n = 26) and included extremely preterm or extremely low birth weight infants. Concerns related to biochemical tolerance are particularly applicable to these infants.
Studies had differing non‐protein nutritional practices and variously provided isocaloric non‐protein caloric intake to both higher and lower amino acid groups (Anderson 1979; Balasubramanian 2013; Blanco 2008; Burattini 2013; Clark 2007; Hata 2002; Heimler 2010; Kashyap 2007; Liu 2015; Pildes 1973; Rivera 1993; Scattolin 2013; Tang 2009; te Braake 2005; Thureen 2003; van Goudoever 1995; van Lingen 1992; Vlaardingerbroek 2013; Uthaya 2016; Weiler 2006; Xie 2014) or increasing non‐protein caloric intake through a concomitant increase in lipid infusion (Black 1981; Bulbul 2012; Can 2012; Can 2013; Ibrahim 2004; Makay 2007; Murdock 1995; Pappoe 2009; Tan 2008; Vaidya 1995). A single study increased both glucose and lipid intake (Morgan 2014).
Studies also reported variable enteral nutritional practices including commencing early enteral feeds in both groups (Bulbul 2012; Burattini 2013; Can 2012; Can 2013; Clark 2007; Kashyap 2007; Liu 2015; Morgan 2014; Pildes 1973; Scattolin 2013; Tan 2008; te Braake 2005; Uthaya 2016; Vaidya 1995; Weiler 2006) and providing no enteral feeds (Anderson 1979; Hata 2002; Makay 2007; Murdock 1995; Rivera 1993; Thureen 2003; van Goudoever 1995; van Lingen 1992; Vlaardingerbroek 2013) or delayed enteral feeds (Heimler 2010; Ibrahim 2004); three studies did not describe enteral feeding practices (Blanco 2008; Tang 2009; Xie 2014). This review excluded studies that described different enteral feeding regimens between the two groups so does not assess studies that compared effects of higher parenteral and enteral amino acid/protein intake versus lower parenteral and enteral intake.
This review did not assess amino acid profiles, as they are also a reflection of the specific amino acid solution given. Biochemical safety in terms of hyper‐aminoacidaemia cannot be assumed from this review, and the safety of specific preparations must be assessed.
This review did not perform a subgroup analysis according to specific amino acid solution used. It is possible that clinical and biochemical effects may vary with the specific amino acid solution used.
Quality of the evidence
Review authors expressed substantial concern regarding publication or reporting bias for most outcomes, given that most outcomes were underreported. One potentially eligible study has not published outcomes to date (Kashyap 2007). We assessed only five studies as high quality with low risk of bias from allocation concealment, randomisation, blinding of treatment, and less than 10% loss to follow‐up (Bulbul 2012; Can 2012; Can 2013; Clark 2007; Morgan 2014). Blanco 2008 also met these criteria for mortality and biochemical outcome reporting but not for other clinical and developmental outcomes. Uthaya 2016 was at low risk of bias for reporting mortality, sepsis, and necrotising enterocolitis but was at high risk of attrition bias for other outcomes. All other studies had methodological concerns, which included not reporting method of sequence generation and being at high risk for performance and detection bias and for attrition bias.
Sensitivity analysis restricted to studies at low risk of bias supported the findings of no effect on mortality. No studies at low risk of bias reported neurodevelopmental disability. A single study at low risk of bias reported reduction in postnatal growth failure at discharge (Can 2012). Meta‐analysis of two studies at low risk of bias revealed no difference in days to regain birth weight (Bulbul 2012; Can 2012). A single study at low risk of bias reported no difference in maximal weight loss in grams (Can 2012). Meta‐analysis of two studies at low risk of bias revealed an increase in head circumference growth at one month (Clark 2007; Morgan 2014), and Morgan 2014 reported an increase in head circumference change z‐score at one month. No study at low risk of bias reported head circumference growth to discharge.
Meta‐analysis of studies at low risk of bias showed no difference in days to full enteral feeds; late‐onset sepsis and necrotising enterocolitis; or chronic lung disease. A single study at low risk of bias reported no difference in intraventricular haemorrhage (Clark 2007). Meta‐analysis of studies at low risk of bias revealed no difference in severe intraventricular haemorrhage nor in periventricular leukomalacia. A single study at low risk of bias reported a reduction in retinopathy of prematurity (Can 2012). Meta‐analysis of studies at low risk of bias showed no difference in severe retinopathy of prematurity. No study at low risk of bias reported neurodevelopmental outcomes.
A single study at low risk of bias for biochemical outcomes reported an abnormal serum ammonia > 122 μmol/L in one infant on higher amino acid intake (Blanco 2008). Meta‐analysis of two studies at low risk of bias revealed an increase in abnormal blood urea nitrogen (Blanco 2008; Clark 2007). No studies at low risk of bias reported hyperglycaemia, hyperglycaemia treated with insulin, hypoglycaemia, or metabolic acidosis. Meta‐analysis of studies at low risk of bias showed no difference in cholestasis.
We graded the evidence for no effect on mortality as low quality and downgraded evidence owing to lack of precision, which does not preclude a significant effect, particularly as a substantial number of studies did not report mortality. We graded evidence showing reduction in postnatal growth failure as very low. We downgraded the evidence as only a single study was at low risk of bias (this study reported a significant effect), confidence intervals were wide showing close to no effect, and a substantial number of studies did not report the outcome. We graded evidence for other growth and clinical effects as very low. We graded evidence for an increase in abnormal blood urea nitrogen as high owing to the magnitude and consistency of findings, including those reported by studies at low risk of bias.
Potential biases in the review process
We reported several outcomes in the overall review analysis that were not prespecified, including weight, length, and head circumference; weight, length, and head circumference z‐scores; patent ductus arteriosus; development quotient scores; nitrogen and protein balance; maximal blood urea nitrogen; and hyperkalaemia and discontinued parenteral nutrition (PN) due to biochemical intolerance. As these outcomes were not prespecified, we did not include them in subsequent comparisons and subgroup analyses.
We did not prespecify the additional subgroup analysis according to lipid intake.
We modified data extraction for abnormal blood urea nitrogen to adapt to reported data. Of seven trials that reported abnormal blood urea nitrogen (BUN), one did not document criteria, three were at or above the prespecified level (BUN > 14.3 to 21.4 mmol/L), and three were below the prespecified reporting level (two studies BUN > 10 mmol/L, and one study BUN > 11.6 mmol/L).
For studies that reported non‐parametric data, we calculated means and standard deviations using medians and interquartile ranges, which we did not prespecify.
Agreements and disagreements with other studies or reviews
The findings of this review are largely consistent with those of the Cochrane Review "Early versus late administration of amino acids in preterm infants receiving parenteral nutrition" (Trivedi 2013), which reported that "early administration of amino acids results in positive nitrogen balance. Metabolic acidosis, elevated serum ammonia and hypoglycaemia were not a complication of early administration of amino acids. Elevated blood urea nitrogen is consistently associated with early administration of amino acids." Elevated blood urea nitrogen levels reported in this review are above those reported in normal foetuses from cord blood, as in Gresham 1971, and in newborn infants receiving a mean 1.8 g/kg/d parenteral nutrition, as in Ridout 2005. However, it is unclear what ammonia levels are normal in preterm infants. All six infants with an ammonia > 69 μmol/L ‐ the level seen in infants after the first week ‐ were receiving higher levels of amino acid. The biochemical safety of very high early amino acid intake in parenteral nutrition remains unclear.
The Cochrane Review "Early introduction of lipids to parenterally‐fed preterm infants" reported that "no statistically significant effects of 'early introduction' of lipids on short‐term nutritional or other clinical outcomes, either benefits or adverse effects, were demonstrated in the studies reviewed" (Simmer 2006). That review did not report biochemical tolerance. The findings of our review that early lipid intake may have potential subgroup effects including increased growth, reduced glucose tolerance, reduced retinopathy of prematurity, and increased chronic lung disease are related to the effects of higher amino acid intake in parenteral nutrition in the context of early lipid intake.
Risk of bias graph: review authors' judgements about each risk of bias item presented as percentages across all included studies.
Risk of bias summary: review authors' judgements about each risk of bias item for each included study.
Funnel plot of comparison: 1 Higher versus lower amino acid intake in parenteral nutrition, outcome: 1.1 Mortality to hospital discharge.
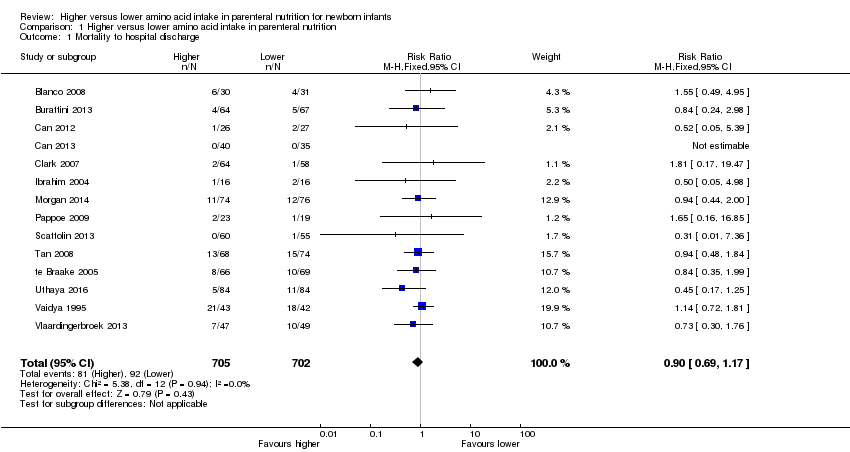
Comparison 1 Higher versus lower amino acid intake in parenteral nutrition, Outcome 1 Mortality to hospital discharge.

Comparison 1 Higher versus lower amino acid intake in parenteral nutrition, Outcome 2 Neurodevelopmental disability.

Comparison 1 Higher versus lower amino acid intake in parenteral nutrition, Outcome 3 Postnatal growth failure at discharge (weight < 10th centile).

Comparison 1 Higher versus lower amino acid intake in parenteral nutrition, Outcome 4 Postnatal growth failure at discharge (weight 2 SD below mean).

Comparison 1 Higher versus lower amino acid intake in parenteral nutrition, Outcome 5 Postnatal growth failure post discharge.

Comparison 1 Higher versus lower amino acid intake in parenteral nutrition, Outcome 6 Days to regain birth weight.

Comparison 1 Higher versus lower amino acid intake in parenteral nutrition, Outcome 7 Maximal weight loss (grams).

Comparison 1 Higher versus lower amino acid intake in parenteral nutrition, Outcome 8 Maximal weight loss %.

Comparison 1 Higher versus lower amino acid intake in parenteral nutrition, Outcome 9 Weight gain g/kg/d.
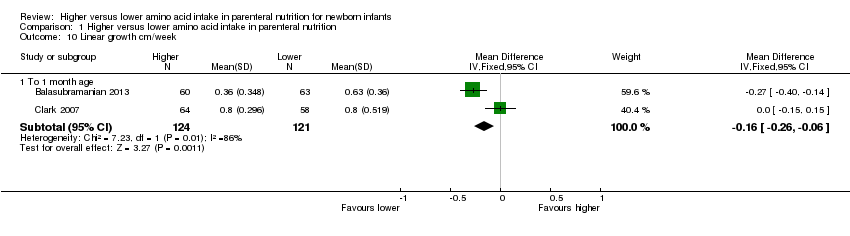
Comparison 1 Higher versus lower amino acid intake in parenteral nutrition, Outcome 10 Linear growth cm/week.

Comparison 1 Higher versus lower amino acid intake in parenteral nutrition, Outcome 11 Head circumference growth cm/week.

Comparison 1 Higher versus lower amino acid intake in parenteral nutrition, Outcome 12 Weight change z‐score.

Comparison 1 Higher versus lower amino acid intake in parenteral nutrition, Outcome 13 Head circumference change z‐score.

Comparison 1 Higher versus lower amino acid intake in parenteral nutrition, Outcome 14 Weight (grams).

Comparison 1 Higher versus lower amino acid intake in parenteral nutrition, Outcome 15 Length (cm).

Comparison 1 Higher versus lower amino acid intake in parenteral nutrition, Outcome 16 Head circumference (cm).
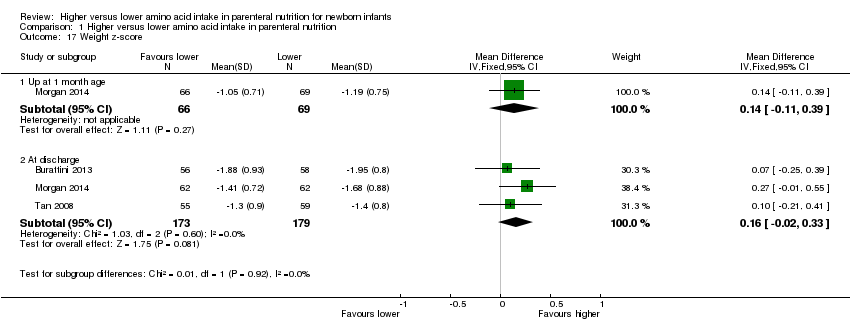
Comparison 1 Higher versus lower amino acid intake in parenteral nutrition, Outcome 17 Weight z‐score.

Comparison 1 Higher versus lower amino acid intake in parenteral nutrition, Outcome 18 Length z‐score.

Comparison 1 Higher versus lower amino acid intake in parenteral nutrition, Outcome 19 Head circumference z‐score.

Comparison 1 Higher versus lower amino acid intake in parenteral nutrition, Outcome 20 Days to full enteral feeds.
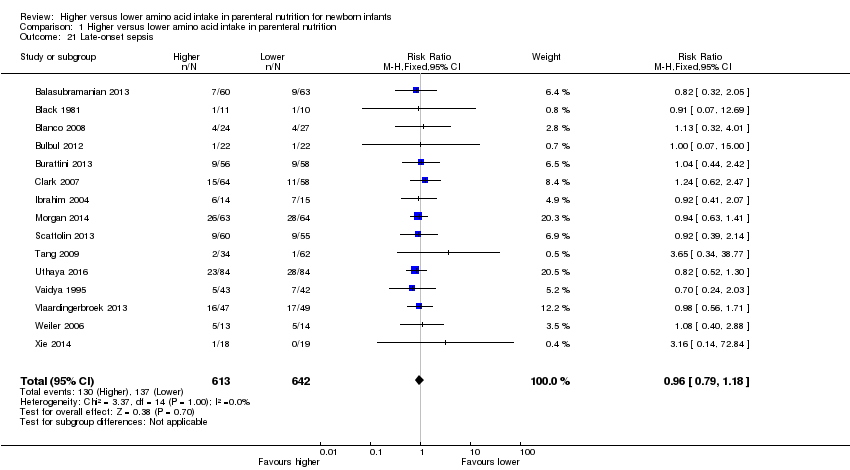
Comparison 1 Higher versus lower amino acid intake in parenteral nutrition, Outcome 21 Late‐onset sepsis.

Comparison 1 Higher versus lower amino acid intake in parenteral nutrition, Outcome 22 Necrotising enterocolitis.

Comparison 1 Higher versus lower amino acid intake in parenteral nutrition, Outcome 23 Chronic lung disease at ≥ 36 weeks' PMA.
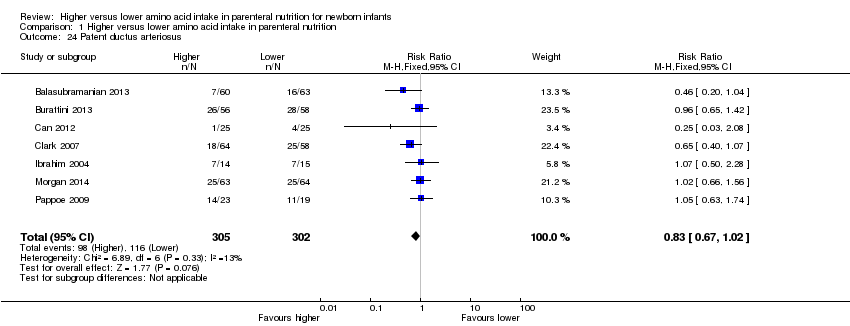
Comparison 1 Higher versus lower amino acid intake in parenteral nutrition, Outcome 24 Patent ductus arteriosus.

Comparison 1 Higher versus lower amino acid intake in parenteral nutrition, Outcome 25 Intraventricular haemorrhage.

Comparison 1 Higher versus lower amino acid intake in parenteral nutrition, Outcome 26 Severe intraventricular haemorrhage.

Comparison 1 Higher versus lower amino acid intake in parenteral nutrition, Outcome 27 Periventricular leukomalacia.
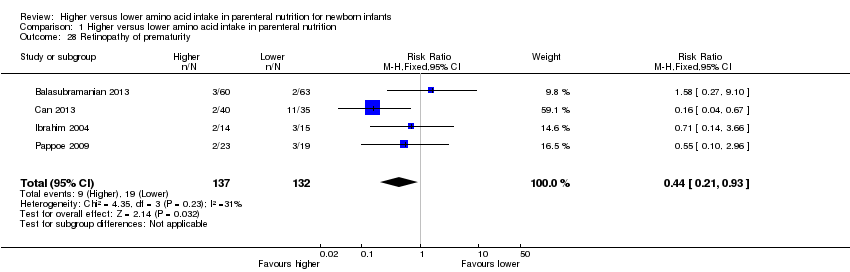
Comparison 1 Higher versus lower amino acid intake in parenteral nutrition, Outcome 28 Retinopathy of prematurity.

Comparison 1 Higher versus lower amino acid intake in parenteral nutrition, Outcome 29 Severe retinopathy of prematurity (> stage 2 or treated).
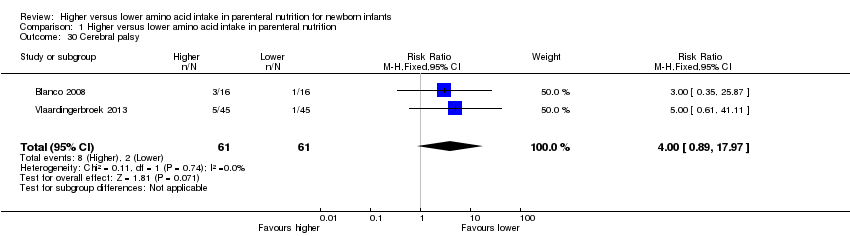
Comparison 1 Higher versus lower amino acid intake in parenteral nutrition, Outcome 30 Cerebral palsy.

Comparison 1 Higher versus lower amino acid intake in parenteral nutrition, Outcome 31 Developmental delay at ≥ 18 months.

Comparison 1 Higher versus lower amino acid intake in parenteral nutrition, Outcome 32 Blindness.

Comparison 1 Higher versus lower amino acid intake in parenteral nutrition, Outcome 33 Deafness.

Comparison 1 Higher versus lower amino acid intake in parenteral nutrition, Outcome 34 Bayley MDI at ≥ 18 months.

Comparison 1 Higher versus lower amino acid intake in parenteral nutrition, Outcome 35 Bayley III score at ≥ 18 months.

Comparison 1 Higher versus lower amino acid intake in parenteral nutrition, Outcome 36 Bayley PDI at ≥ 18 months.

Comparison 1 Higher versus lower amino acid intake in parenteral nutrition, Outcome 37 Autism.

Comparison 1 Higher versus lower amino acid intake in parenteral nutrition, Outcome 38 Nitrogen balance.
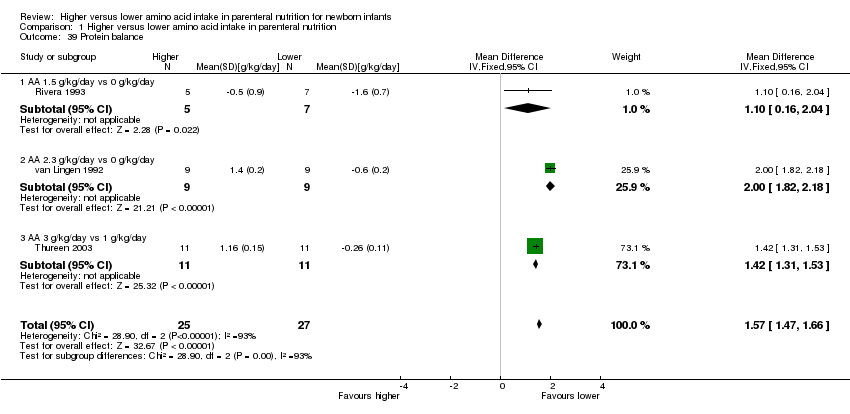
Comparison 1 Higher versus lower amino acid intake in parenteral nutrition, Outcome 39 Protein balance.
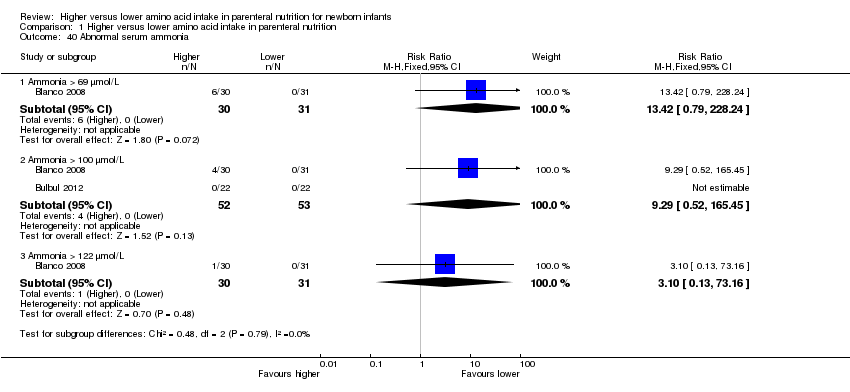
Comparison 1 Higher versus lower amino acid intake in parenteral nutrition, Outcome 40 Abnormal serum ammonia.

Comparison 1 Higher versus lower amino acid intake in parenteral nutrition, Outcome 41 Abnormal blood urea nitrogen (various criteria).

Comparison 1 Higher versus lower amino acid intake in parenteral nutrition, Outcome 42 Maximum blood urea nitrogen mmol/L.

Comparison 1 Higher versus lower amino acid intake in parenteral nutrition, Outcome 43 Hyperglycaemia, plasma glucose > 8.3 mmol/L.

Comparison 1 Higher versus lower amino acid intake in parenteral nutrition, Outcome 44 Hyperglycaemia treated with insulin.

Comparison 1 Higher versus lower amino acid intake in parenteral nutrition, Outcome 45 Hypoglycaemia.
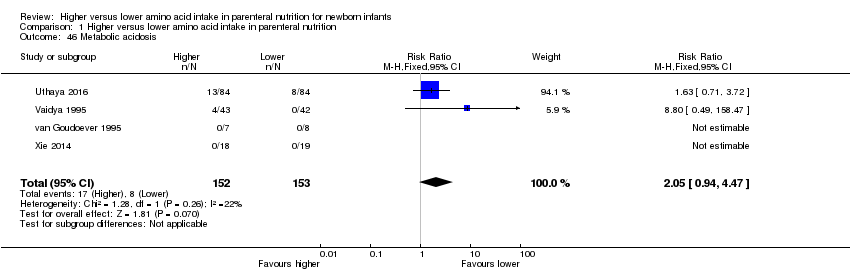
Comparison 1 Higher versus lower amino acid intake in parenteral nutrition, Outcome 46 Metabolic acidosis.
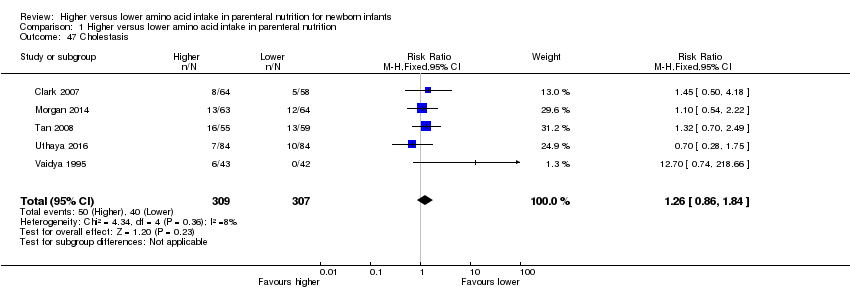
Comparison 1 Higher versus lower amino acid intake in parenteral nutrition, Outcome 47 Cholestasis.

Comparison 1 Higher versus lower amino acid intake in parenteral nutrition, Outcome 48 Hyperkalaemia.

Comparison 1 Higher versus lower amino acid intake in parenteral nutrition, Outcome 49 Discontinued PN owing to biochemical intolerance.
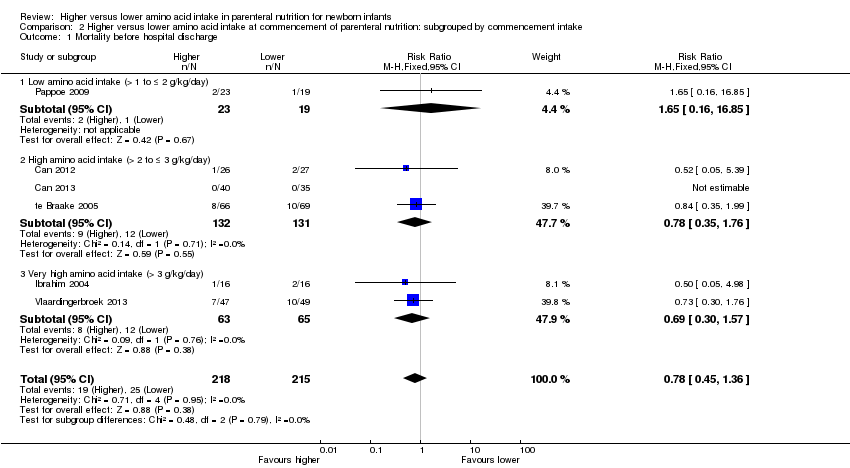
Comparison 2 Higher versus lower amino acid intake at commencement of parenteral nutrition: subgrouped by commencement intake, Outcome 1 Mortality before hospital discharge.

Comparison 2 Higher versus lower amino acid intake at commencement of parenteral nutrition: subgrouped by commencement intake, Outcome 2 Neurodevelopmental disability.

Comparison 2 Higher versus lower amino acid intake at commencement of parenteral nutrition: subgrouped by commencement intake, Outcome 3 Postnatal growth failure at discharge.

Comparison 2 Higher versus lower amino acid intake at commencement of parenteral nutrition: subgrouped by commencement intake, Outcome 4 Postnatal growth failure post discharge.
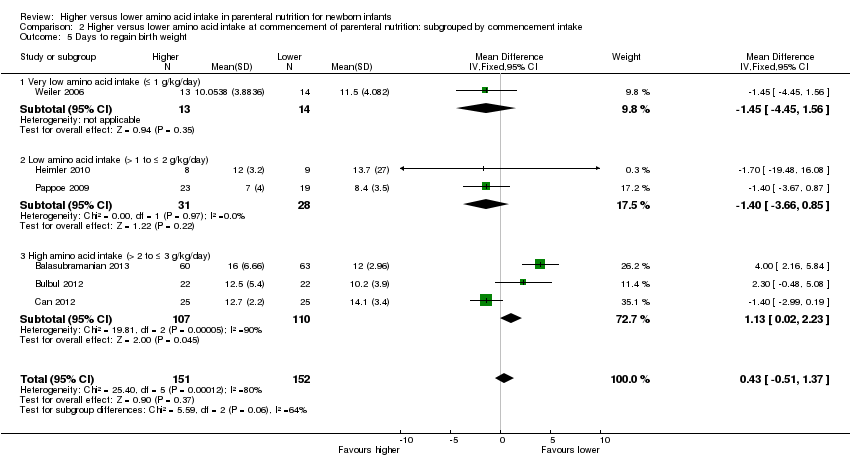
Comparison 2 Higher versus lower amino acid intake at commencement of parenteral nutrition: subgrouped by commencement intake, Outcome 5 Days to regain birth weight.

Comparison 2 Higher versus lower amino acid intake at commencement of parenteral nutrition: subgrouped by commencement intake, Outcome 6 Maximal weight loss (grams).

Comparison 2 Higher versus lower amino acid intake at commencement of parenteral nutrition: subgrouped by commencement intake, Outcome 7 Maximal weight loss %.

Comparison 2 Higher versus lower amino acid intake at commencement of parenteral nutrition: subgrouped by commencement intake, Outcome 8 Weight gain g/kg/day to 1 month age.

Comparison 2 Higher versus lower amino acid intake at commencement of parenteral nutrition: subgrouped by commencement intake, Outcome 9 Weight gain g/kg/day to discharge.

Comparison 2 Higher versus lower amino acid intake at commencement of parenteral nutrition: subgrouped by commencement intake, Outcome 10 Linear growth cm/week to 1 month age.

Comparison 2 Higher versus lower amino acid intake at commencement of parenteral nutrition: subgrouped by commencement intake, Outcome 11 Head circumference growth cm/week to 1 month age.

Comparison 2 Higher versus lower amino acid intake at commencement of parenteral nutrition: subgrouped by commencement intake, Outcome 12 Head circumference growth cm/week to discharge.
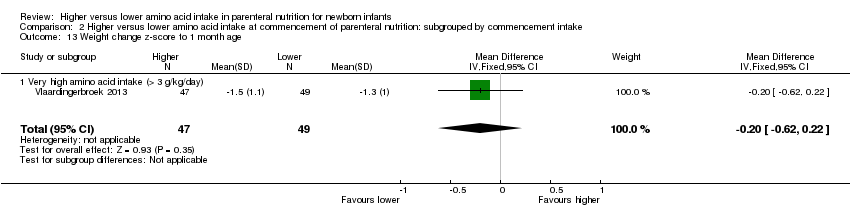
Comparison 2 Higher versus lower amino acid intake at commencement of parenteral nutrition: subgrouped by commencement intake, Outcome 13 Weight change z‐score to 1 month age.

Comparison 2 Higher versus lower amino acid intake at commencement of parenteral nutrition: subgrouped by commencement intake, Outcome 14 Weight change z‐score to discharge.

Comparison 2 Higher versus lower amino acid intake at commencement of parenteral nutrition: subgrouped by commencement intake, Outcome 15 Weight change z‐score post discharge.

Comparison 2 Higher versus lower amino acid intake at commencement of parenteral nutrition: subgrouped by commencement intake, Outcome 16 Head circumference change z‐score to 1 month age.

Comparison 2 Higher versus lower amino acid intake at commencement of parenteral nutrition: subgrouped by commencement intake, Outcome 17 Head circumference change z‐score to discharge.

Comparison 2 Higher versus lower amino acid intake at commencement of parenteral nutrition: subgrouped by commencement intake, Outcome 18 Head circumference change z‐score post discharge.

Comparison 2 Higher versus lower amino acid intake at commencement of parenteral nutrition: subgrouped by commencement intake, Outcome 19 Days to full enteral feeds.

Comparison 2 Higher versus lower amino acid intake at commencement of parenteral nutrition: subgrouped by commencement intake, Outcome 20 Late‐onset sepsis.

Comparison 2 Higher versus lower amino acid intake at commencement of parenteral nutrition: subgrouped by commencement intake, Outcome 21 Necrotising enterocolitis.

Comparison 2 Higher versus lower amino acid intake at commencement of parenteral nutrition: subgrouped by commencement intake, Outcome 22 Chronic lung disease at ≥ 36 weeks' PMA.
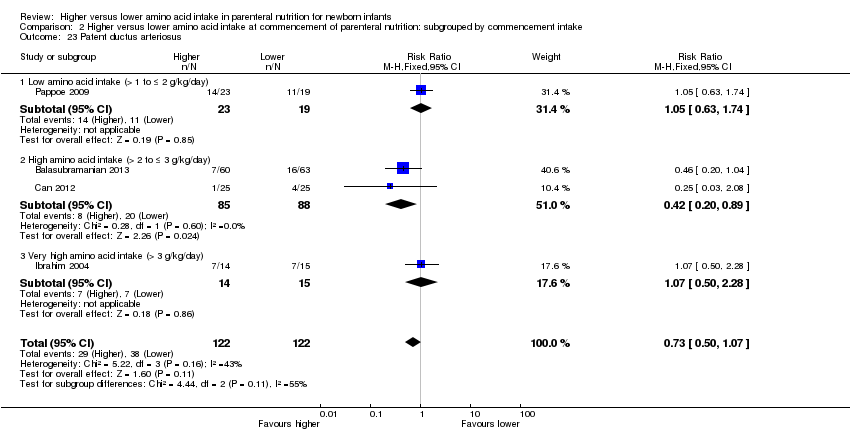
Comparison 2 Higher versus lower amino acid intake at commencement of parenteral nutrition: subgrouped by commencement intake, Outcome 23 Patent ductus arteriosus.

Comparison 2 Higher versus lower amino acid intake at commencement of parenteral nutrition: subgrouped by commencement intake, Outcome 24 Intraventricular haemorrhage.

Comparison 2 Higher versus lower amino acid intake at commencement of parenteral nutrition: subgrouped by commencement intake, Outcome 25 Severe intraventricular haemorrhage.

Comparison 2 Higher versus lower amino acid intake at commencement of parenteral nutrition: subgrouped by commencement intake, Outcome 26 Periventricular leukomalacia.
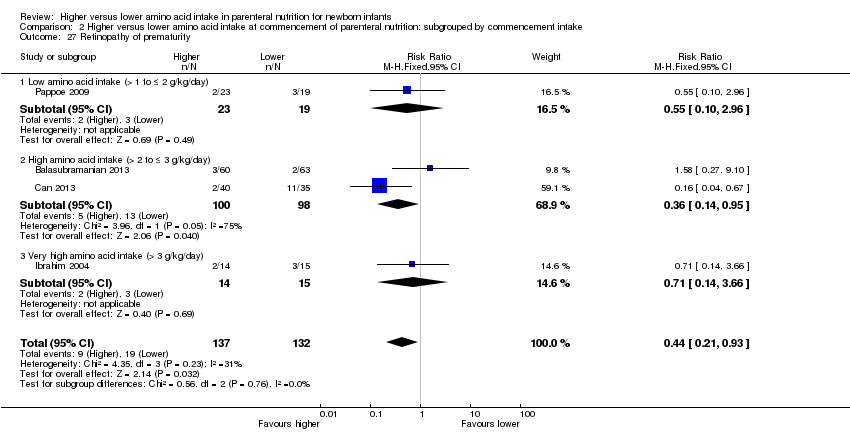
Comparison 2 Higher versus lower amino acid intake at commencement of parenteral nutrition: subgrouped by commencement intake, Outcome 27 Retinopathy of prematurity.

Comparison 2 Higher versus lower amino acid intake at commencement of parenteral nutrition: subgrouped by commencement intake, Outcome 28 Severe retinopathy of prematurity (> stage 2 or treated).

Comparison 2 Higher versus lower amino acid intake at commencement of parenteral nutrition: subgrouped by commencement intake, Outcome 29 Cerebral palsy.

Comparison 2 Higher versus lower amino acid intake at commencement of parenteral nutrition: subgrouped by commencement intake, Outcome 30 Developmental delay at ≥ 18 months.

Comparison 2 Higher versus lower amino acid intake at commencement of parenteral nutrition: subgrouped by commencement intake, Outcome 31 Blindness.

Comparison 2 Higher versus lower amino acid intake at commencement of parenteral nutrition: subgrouped by commencement intake, Outcome 32 Deafness.

Comparison 2 Higher versus lower amino acid intake at commencement of parenteral nutrition: subgrouped by commencement intake, Outcome 33 Abnormal serum ammonia (> 100 μmol/L).

Comparison 2 Higher versus lower amino acid intake at commencement of parenteral nutrition: subgrouped by commencement intake, Outcome 34 Abnormal blood urea nitrogen (various criteria).
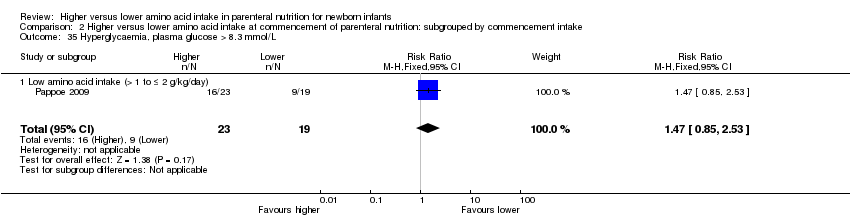
Comparison 2 Higher versus lower amino acid intake at commencement of parenteral nutrition: subgrouped by commencement intake, Outcome 35 Hyperglycaemia, plasma glucose > 8.3 mmol/L.

Comparison 2 Higher versus lower amino acid intake at commencement of parenteral nutrition: subgrouped by commencement intake, Outcome 36 Hyperglycaemia treated with insulin.

Comparison 2 Higher versus lower amino acid intake at commencement of parenteral nutrition: subgrouped by commencement intake, Outcome 37 Hypoglycaemia.

Comparison 2 Higher versus lower amino acid intake at commencement of parenteral nutrition: subgrouped by commencement intake, Outcome 38 Metabolic acidosis.
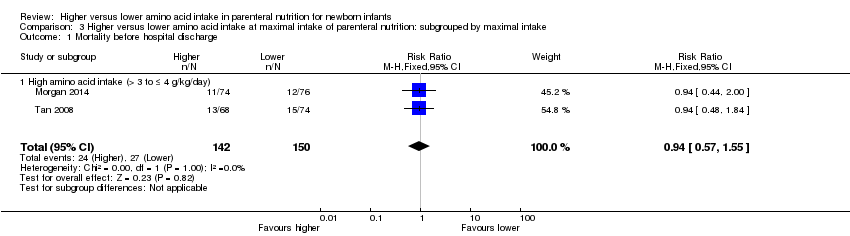
Comparison 3 Higher versus lower amino acid intake at maximal intake of parenteral nutrition: subgrouped by maximal intake, Outcome 1 Mortality before hospital discharge.

Comparison 3 Higher versus lower amino acid intake at maximal intake of parenteral nutrition: subgrouped by maximal intake, Outcome 2 Head circumference growth cm/week to 1 month.
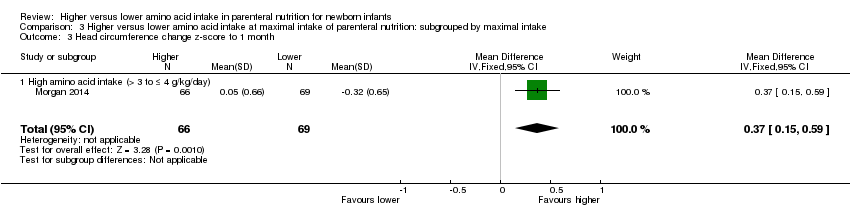
Comparison 3 Higher versus lower amino acid intake at maximal intake of parenteral nutrition: subgrouped by maximal intake, Outcome 3 Head circumference change z‐score to 1 month.
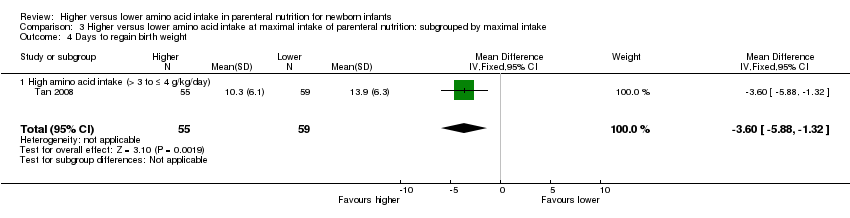
Comparison 3 Higher versus lower amino acid intake at maximal intake of parenteral nutrition: subgrouped by maximal intake, Outcome 4 Days to regain birth weight.

Comparison 3 Higher versus lower amino acid intake at maximal intake of parenteral nutrition: subgrouped by maximal intake, Outcome 5 Days to full enteral feeds.

Comparison 3 Higher versus lower amino acid intake at maximal intake of parenteral nutrition: subgrouped by maximal intake, Outcome 6 Late‐onset sepsis.
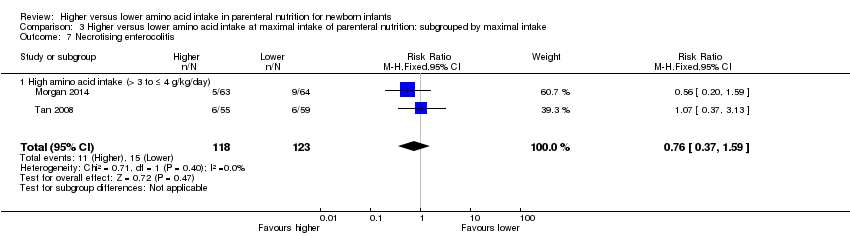
Comparison 3 Higher versus lower amino acid intake at maximal intake of parenteral nutrition: subgrouped by maximal intake, Outcome 7 Necrotising enterocolitis.

Comparison 3 Higher versus lower amino acid intake at maximal intake of parenteral nutrition: subgrouped by maximal intake, Outcome 8 Chronic lung disease at ≥ 36 weeks' PMA.

Comparison 3 Higher versus lower amino acid intake at maximal intake of parenteral nutrition: subgrouped by maximal intake, Outcome 9 Patent ductus arteriosus.

Comparison 3 Higher versus lower amino acid intake at maximal intake of parenteral nutrition: subgrouped by maximal intake, Outcome 10 Severe intraventricular haemorrhage.

Comparison 3 Higher versus lower amino acid intake at maximal intake of parenteral nutrition: subgrouped by maximal intake, Outcome 11 Periventricular leukomalacia.

Comparison 3 Higher versus lower amino acid intake at maximal intake of parenteral nutrition: subgrouped by maximal intake, Outcome 12 Severe retinopathy of prematurity (> stage 2 or treated).

Comparison 3 Higher versus lower amino acid intake at maximal intake of parenteral nutrition: subgrouped by maximal intake, Outcome 13 Hyperglycaemia treated with insulin.
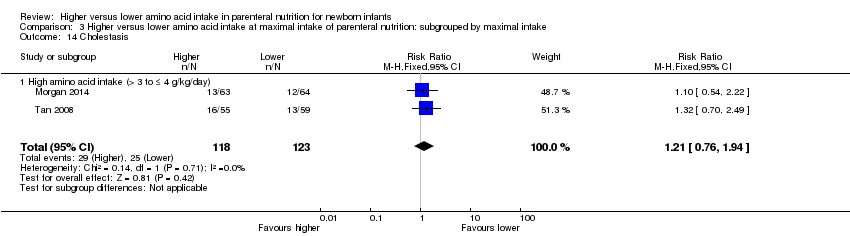
Comparison 3 Higher versus lower amino acid intake at maximal intake of parenteral nutrition: subgrouped by maximal intake, Outcome 14 Cholestasis.
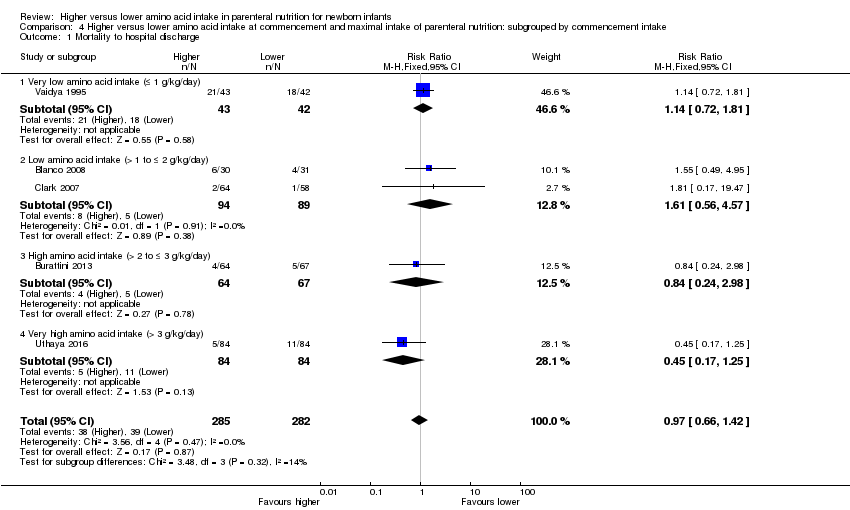
Comparison 4 Higher versus lower amino acid intake at commencement and maximal intake of parenteral nutrition: subgrouped by commencement intake, Outcome 1 Mortality to hospital discharge.

Comparison 4 Higher versus lower amino acid intake at commencement and maximal intake of parenteral nutrition: subgrouped by commencement intake, Outcome 2 Days to regain birth weight.

Comparison 4 Higher versus lower amino acid intake at commencement and maximal intake of parenteral nutrition: subgrouped by commencement intake, Outcome 3 Maximal weight loss (grams).

Comparison 4 Higher versus lower amino acid intake at commencement and maximal intake of parenteral nutrition: subgrouped by commencement intake, Outcome 4 Maximal weight loss %.

Comparison 4 Higher versus lower amino acid intake at commencement and maximal intake of parenteral nutrition: subgrouped by commencement intake, Outcome 5 Weight gain g/kg/day up to 1 month age.
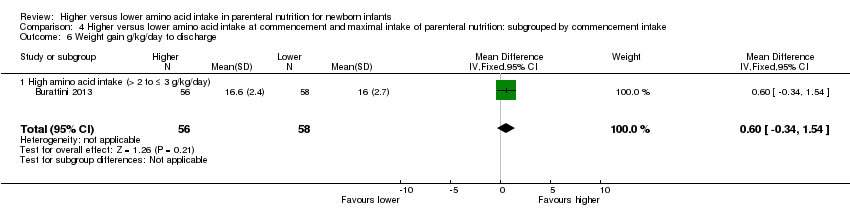
Comparison 4 Higher versus lower amino acid intake at commencement and maximal intake of parenteral nutrition: subgrouped by commencement intake, Outcome 6 Weight gain g/kg/day to discharge.

Comparison 4 Higher versus lower amino acid intake at commencement and maximal intake of parenteral nutrition: subgrouped by commencement intake, Outcome 7 Linear growth cm/week up to 1 month age.

Comparison 4 Higher versus lower amino acid intake at commencement and maximal intake of parenteral nutrition: subgrouped by commencement intake, Outcome 8 Head circumference growth cm/week up to 1 month age.

Comparison 4 Higher versus lower amino acid intake at commencement and maximal intake of parenteral nutrition: subgrouped by commencement intake, Outcome 9 Head circumference growth cm/week to discharge.

Comparison 4 Higher versus lower amino acid intake at commencement and maximal intake of parenteral nutrition: subgrouped by commencement intake, Outcome 10 Days to full enteral feeds.

Comparison 4 Higher versus lower amino acid intake at commencement and maximal intake of parenteral nutrition: subgrouped by commencement intake, Outcome 11 Late‐onset sepsis.

Comparison 4 Higher versus lower amino acid intake at commencement and maximal intake of parenteral nutrition: subgrouped by commencement intake, Outcome 12 Necrotising enterocolitis.

Comparison 4 Higher versus lower amino acid intake at commencement and maximal intake of parenteral nutrition: subgrouped by commencement intake, Outcome 13 Chronic lung disease at ≥ 36 weeks' PMA.

Comparison 4 Higher versus lower amino acid intake at commencement and maximal intake of parenteral nutrition: subgrouped by commencement intake, Outcome 14 Patent ductus arteriosus.
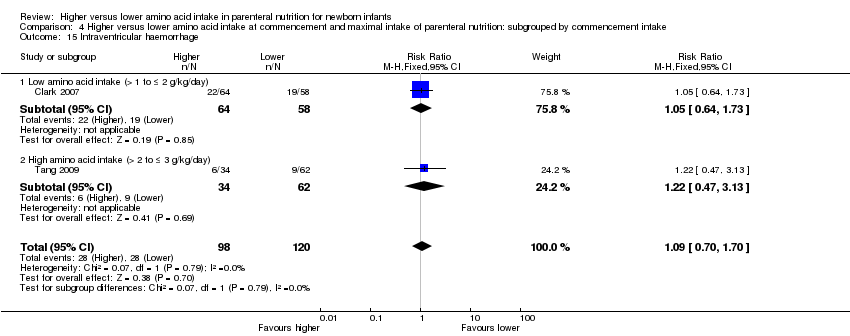
Comparison 4 Higher versus lower amino acid intake at commencement and maximal intake of parenteral nutrition: subgrouped by commencement intake, Outcome 15 Intraventricular haemorrhage.

Comparison 4 Higher versus lower amino acid intake at commencement and maximal intake of parenteral nutrition: subgrouped by commencement intake, Outcome 16 Severe intraventricular haemorrhage.

Comparison 4 Higher versus lower amino acid intake at commencement and maximal intake of parenteral nutrition: subgrouped by commencement intake, Outcome 17 Periventricular leukomalacia.

Comparison 4 Higher versus lower amino acid intake at commencement and maximal intake of parenteral nutrition: subgrouped by commencement intake, Outcome 18 Severe retinopathy of prematurity (> stage 2 or treated).

Comparison 4 Higher versus lower amino acid intake at commencement and maximal intake of parenteral nutrition: subgrouped by commencement intake, Outcome 19 Cerebral palsy.

Comparison 4 Higher versus lower amino acid intake at commencement and maximal intake of parenteral nutrition: subgrouped by commencement intake, Outcome 20 Developmental delay at ≥ 18 months.

Comparison 4 Higher versus lower amino acid intake at commencement and maximal intake of parenteral nutrition: subgrouped by commencement intake, Outcome 21 Blindness.

Comparison 4 Higher versus lower amino acid intake at commencement and maximal intake of parenteral nutrition: subgrouped by commencement intake, Outcome 22 Abnormal serum ammonia.
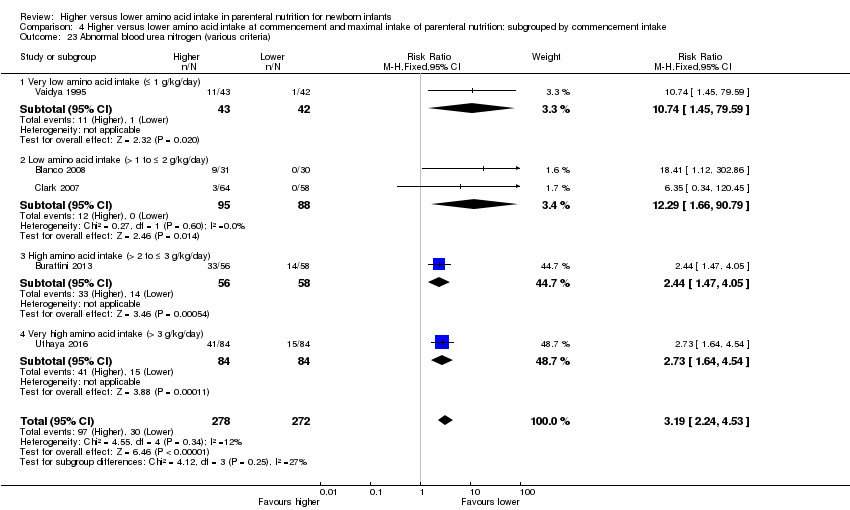
Comparison 4 Higher versus lower amino acid intake at commencement and maximal intake of parenteral nutrition: subgrouped by commencement intake, Outcome 23 Abnormal blood urea nitrogen (various criteria).

Comparison 4 Higher versus lower amino acid intake at commencement and maximal intake of parenteral nutrition: subgrouped by commencement intake, Outcome 24 Hyperglycaemia, plasma glucose > 8.3 mmol/L.

Comparison 4 Higher versus lower amino acid intake at commencement and maximal intake of parenteral nutrition: subgrouped by commencement intake, Outcome 25 Hyperglycaemia treated with insulin.
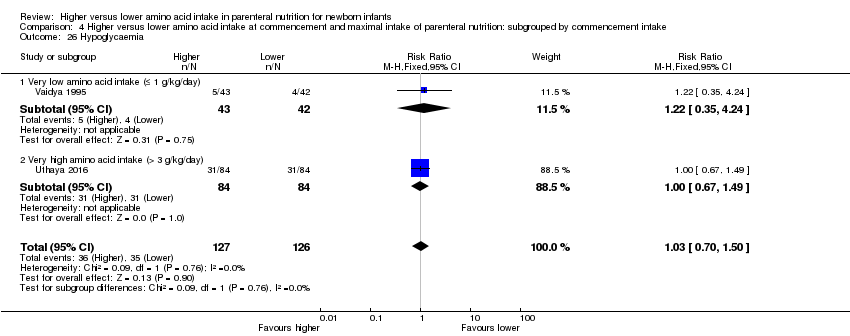
Comparison 4 Higher versus lower amino acid intake at commencement and maximal intake of parenteral nutrition: subgrouped by commencement intake, Outcome 26 Hypoglycaemia.
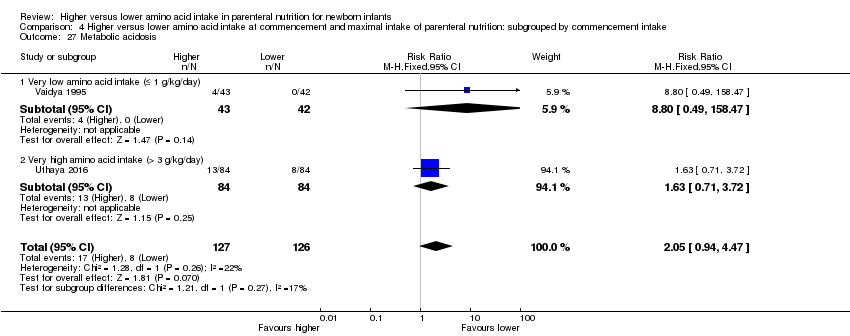
Comparison 4 Higher versus lower amino acid intake at commencement and maximal intake of parenteral nutrition: subgrouped by commencement intake, Outcome 27 Metabolic acidosis.

Comparison 4 Higher versus lower amino acid intake at commencement and maximal intake of parenteral nutrition: subgrouped by commencement intake, Outcome 28 Cholestasis.

Comparison 5 Higher versus lower amino acid intake at commencement and maximal intake of parenteral nutrition: subgrouped by maximal intake, Outcome 1 Mortality before hospital discharge.

Comparison 5 Higher versus lower amino acid intake at commencement and maximal intake of parenteral nutrition: subgrouped by maximal intake, Outcome 2 Days to regain birth weight.
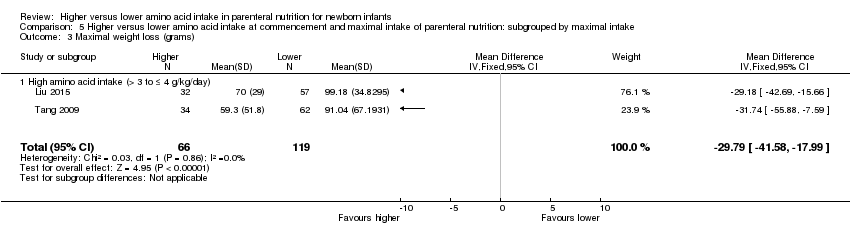
Comparison 5 Higher versus lower amino acid intake at commencement and maximal intake of parenteral nutrition: subgrouped by maximal intake, Outcome 3 Maximal weight loss (grams).

Comparison 5 Higher versus lower amino acid intake at commencement and maximal intake of parenteral nutrition: subgrouped by maximal intake, Outcome 4 Maximal weight loss %.

Comparison 5 Higher versus lower amino acid intake at commencement and maximal intake of parenteral nutrition: subgrouped by maximal intake, Outcome 5 Weight gain g/kg/day up to 1 month.

Comparison 5 Higher versus lower amino acid intake at commencement and maximal intake of parenteral nutrition: subgrouped by maximal intake, Outcome 6 Weight gain g/kg/day to discharge.

Comparison 5 Higher versus lower amino acid intake at commencement and maximal intake of parenteral nutrition: subgrouped by maximal intake, Outcome 7 Linear growth cm/week up to 1 month.

Comparison 5 Higher versus lower amino acid intake at commencement and maximal intake of parenteral nutrition: subgrouped by maximal intake, Outcome 8 Head circumference growth cm/week up to 1 month.

Comparison 5 Higher versus lower amino acid intake at commencement and maximal intake of parenteral nutrition: subgrouped by maximal intake, Outcome 9 Head circumference growth cm/week to discharge.

Comparison 5 Higher versus lower amino acid intake at commencement and maximal intake of parenteral nutrition: subgrouped by maximal intake, Outcome 10 Days to full enteral feeds.
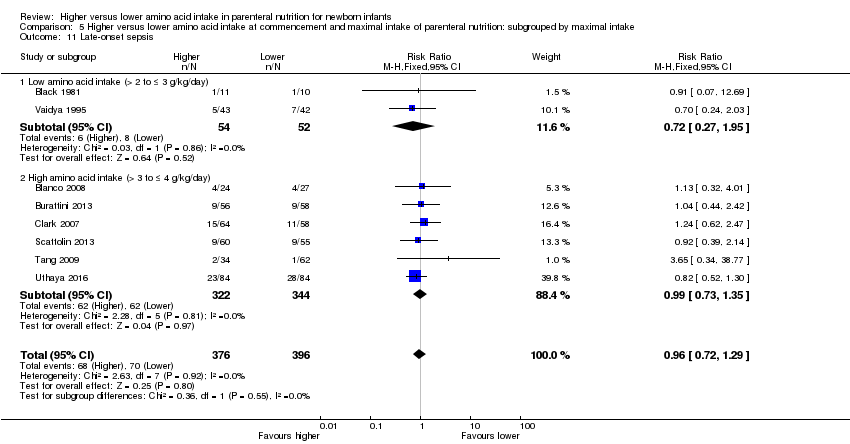
Comparison 5 Higher versus lower amino acid intake at commencement and maximal intake of parenteral nutrition: subgrouped by maximal intake, Outcome 11 Late‐onset sepsis.

Comparison 5 Higher versus lower amino acid intake at commencement and maximal intake of parenteral nutrition: subgrouped by maximal intake, Outcome 12 Necrotising enterocolitis.

Comparison 5 Higher versus lower amino acid intake at commencement and maximal intake of parenteral nutrition: subgrouped by maximal intake, Outcome 13 Chronic lung disease at ≥ 36 weeks' PMA.

Comparison 5 Higher versus lower amino acid intake at commencement and maximal intake of parenteral nutrition: subgrouped by maximal intake, Outcome 14 Patent ductus arteriosus.

Comparison 5 Higher versus lower amino acid intake at commencement and maximal intake of parenteral nutrition: subgrouped by maximal intake, Outcome 15 Intraventricular haemorrhage.

Comparison 5 Higher versus lower amino acid intake at commencement and maximal intake of parenteral nutrition: subgrouped by maximal intake, Outcome 16 Severe intraventricular haemorrhage.

Comparison 5 Higher versus lower amino acid intake at commencement and maximal intake of parenteral nutrition: subgrouped by maximal intake, Outcome 17 Periventricular leukomalacia.

Comparison 5 Higher versus lower amino acid intake at commencement and maximal intake of parenteral nutrition: subgrouped by maximal intake, Outcome 18 Severe retinopathy of prematurity (> stage 2 or treated).

Comparison 5 Higher versus lower amino acid intake at commencement and maximal intake of parenteral nutrition: subgrouped by maximal intake, Outcome 19 Cerebral palsy.

Comparison 5 Higher versus lower amino acid intake at commencement and maximal intake of parenteral nutrition: subgrouped by maximal intake, Outcome 20 Developmental delay at ≥ 18 months.
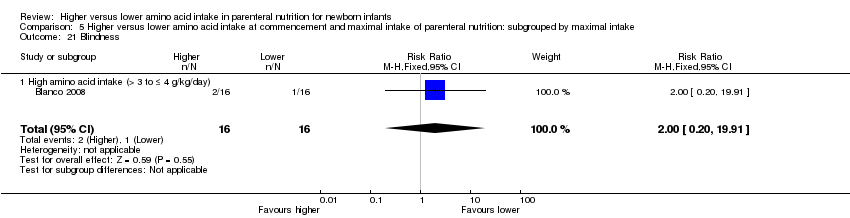
Comparison 5 Higher versus lower amino acid intake at commencement and maximal intake of parenteral nutrition: subgrouped by maximal intake, Outcome 21 Blindness.
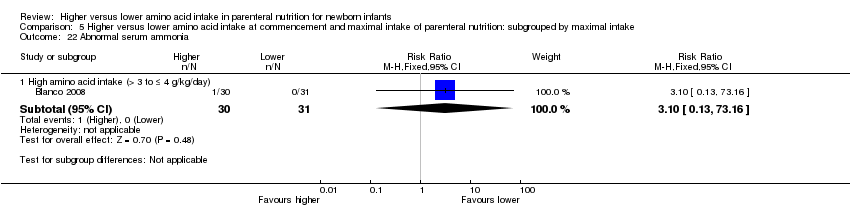
Comparison 5 Higher versus lower amino acid intake at commencement and maximal intake of parenteral nutrition: subgrouped by maximal intake, Outcome 22 Abnormal serum ammonia.

Comparison 5 Higher versus lower amino acid intake at commencement and maximal intake of parenteral nutrition: subgrouped by maximal intake, Outcome 23 Abnormal blood urea nitrogen (various criteria).

Comparison 5 Higher versus lower amino acid intake at commencement and maximal intake of parenteral nutrition: subgrouped by maximal intake, Outcome 24 Hyperglycaemia, plasma glucose > 8.3 mmol/L.

Comparison 5 Higher versus lower amino acid intake at commencement and maximal intake of parenteral nutrition: subgrouped by maximal intake, Outcome 25 Hyperglycaemia treated with insulin.

Comparison 5 Higher versus lower amino acid intake at commencement and maximal intake of parenteral nutrition: subgrouped by maximal intake, Outcome 26 Hypoglycaemia.

Comparison 5 Higher versus lower amino acid intake at commencement and maximal intake of parenteral nutrition: subgrouped by maximal intake, Outcome 27 Metabolic acidosis.

Comparison 5 Higher versus lower amino acid intake at commencement and maximal intake of parenteral nutrition: subgrouped by maximal intake, Outcome 28 Cholestasis.

Comparison 6 Higher versus lower amino acid intake in parenteral nutrition: subgrouped according to management of caloric balance, Outcome 1 Mortality to hospital discharge.

Comparison 6 Higher versus lower amino acid intake in parenteral nutrition: subgrouped according to management of caloric balance, Outcome 2 Neurodevelopmental disability.

Comparison 6 Higher versus lower amino acid intake in parenteral nutrition: subgrouped according to management of caloric balance, Outcome 3 Postnatal growth failure at discharge.

Comparison 6 Higher versus lower amino acid intake in parenteral nutrition: subgrouped according to management of caloric balance, Outcome 4 Days to regain birth weight.

Comparison 6 Higher versus lower amino acid intake in parenteral nutrition: subgrouped according to management of caloric balance, Outcome 5 Maximal weight loss (grams).

Comparison 6 Higher versus lower amino acid intake in parenteral nutrition: subgrouped according to management of caloric balance, Outcome 6 Maximal weight loss %.

Comparison 6 Higher versus lower amino acid intake in parenteral nutrition: subgrouped according to management of caloric balance, Outcome 7 Weight gain g/kg/day up to 1 month.

Comparison 6 Higher versus lower amino acid intake in parenteral nutrition: subgrouped according to management of caloric balance, Outcome 8 Weight gain g/kg/day to discharge.

Comparison 6 Higher versus lower amino acid intake in parenteral nutrition: subgrouped according to management of caloric balance, Outcome 9 Linear growth cm/week up to 1 month.
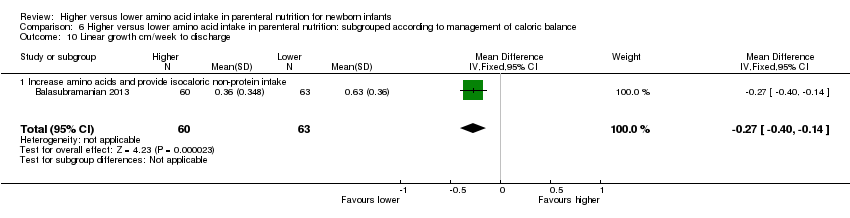
Comparison 6 Higher versus lower amino acid intake in parenteral nutrition: subgrouped according to management of caloric balance, Outcome 10 Linear growth cm/week to discharge.

Comparison 6 Higher versus lower amino acid intake in parenteral nutrition: subgrouped according to management of caloric balance, Outcome 11 Head circumference growth cm/week up to 1 month.
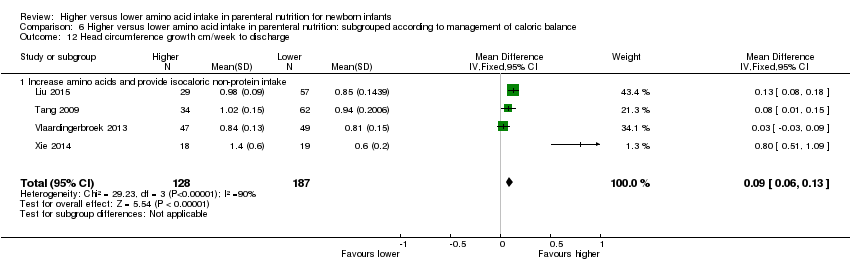
Comparison 6 Higher versus lower amino acid intake in parenteral nutrition: subgrouped according to management of caloric balance, Outcome 12 Head circumference growth cm/week to discharge.

Comparison 6 Higher versus lower amino acid intake in parenteral nutrition: subgrouped according to management of caloric balance, Outcome 13 Weight change z‐score to discharge.

Comparison 6 Higher versus lower amino acid intake in parenteral nutrition: subgrouped according to management of caloric balance, Outcome 14 Head circumference change z‐score to 1 month.

Comparison 6 Higher versus lower amino acid intake in parenteral nutrition: subgrouped according to management of caloric balance, Outcome 15 Head circumference change z‐score to discharge.

Comparison 6 Higher versus lower amino acid intake in parenteral nutrition: subgrouped according to management of caloric balance, Outcome 16 Days to full enteral feeds.

Comparison 6 Higher versus lower amino acid intake in parenteral nutrition: subgrouped according to management of caloric balance, Outcome 17 Late‐onset sepsis.
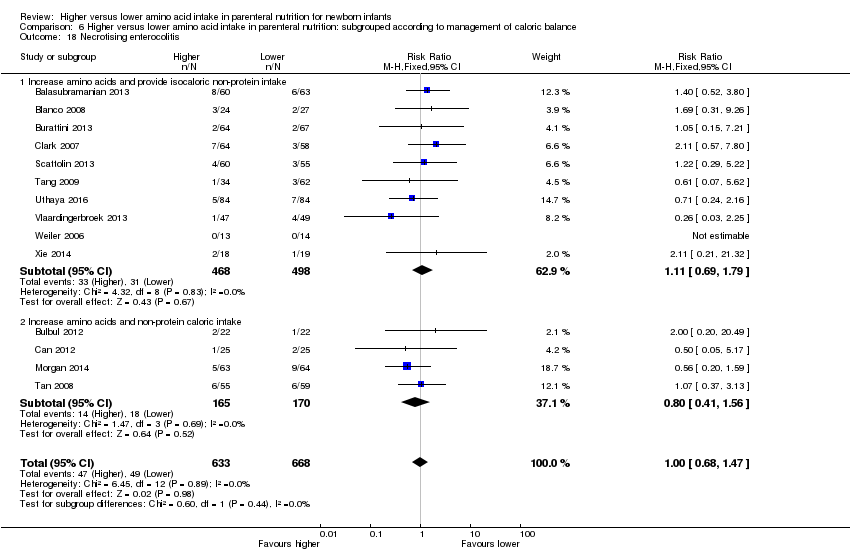
Comparison 6 Higher versus lower amino acid intake in parenteral nutrition: subgrouped according to management of caloric balance, Outcome 18 Necrotising enterocolitis.

Comparison 6 Higher versus lower amino acid intake in parenteral nutrition: subgrouped according to management of caloric balance, Outcome 19 Chronic lung disease ≥ 36 weeks' PMA.
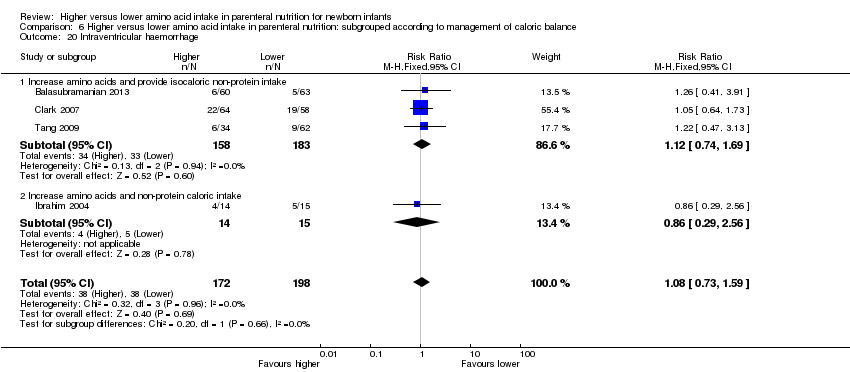
Comparison 6 Higher versus lower amino acid intake in parenteral nutrition: subgrouped according to management of caloric balance, Outcome 20 Intraventricular haemorrhage.

Comparison 6 Higher versus lower amino acid intake in parenteral nutrition: subgrouped according to management of caloric balance, Outcome 21 Severe intraventricular haemorrhage.

Comparison 6 Higher versus lower amino acid intake in parenteral nutrition: subgrouped according to management of caloric balance, Outcome 22 Periventricular leukomalacia.
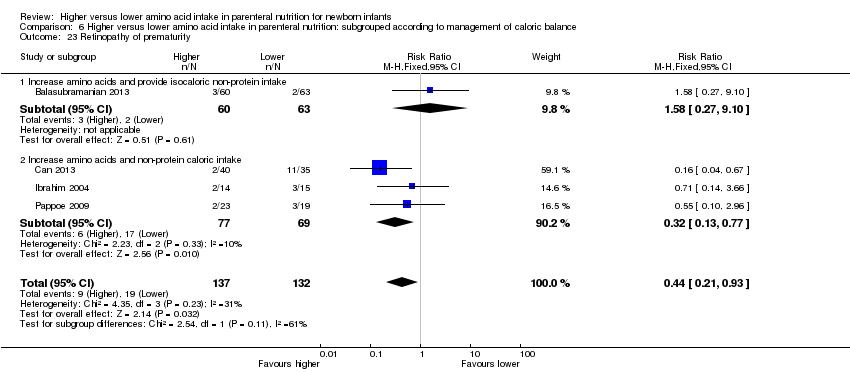
Comparison 6 Higher versus lower amino acid intake in parenteral nutrition: subgrouped according to management of caloric balance, Outcome 23 Retinopathy of prematurity.

Comparison 6 Higher versus lower amino acid intake in parenteral nutrition: subgrouped according to management of caloric balance, Outcome 24 Severe retinopathy of prematurity (> stage 2 or treated).

Comparison 6 Higher versus lower amino acid intake in parenteral nutrition: subgrouped according to management of caloric balance, Outcome 25 Cerebral palsy.

Comparison 6 Higher versus lower amino acid intake in parenteral nutrition: subgrouped according to management of caloric balance, Outcome 26 Developmental delay at ≥ 18 months.

Comparison 6 Higher versus lower amino acid intake in parenteral nutrition: subgrouped according to management of caloric balance, Outcome 27 Blindness.

Comparison 6 Higher versus lower amino acid intake in parenteral nutrition: subgrouped according to management of caloric balance, Outcome 28 Deafness.

Comparison 6 Higher versus lower amino acid intake in parenteral nutrition: subgrouped according to management of caloric balance, Outcome 29 Abnormal serum ammonia.

Comparison 6 Higher versus lower amino acid intake in parenteral nutrition: subgrouped according to management of caloric balance, Outcome 30 Abnormal blood urea nitrogen (various criteria).

Comparison 6 Higher versus lower amino acid intake in parenteral nutrition: subgrouped according to management of caloric balance, Outcome 31 Hyperglycaemia, plasma glucose > 8.3 mmol/L.

Comparison 6 Higher versus lower amino acid intake in parenteral nutrition: subgrouped according to management of caloric balance, Outcome 32 Hyperglycaemia treated with insulin.

Comparison 6 Higher versus lower amino acid intake in parenteral nutrition: subgrouped according to management of caloric balance, Outcome 33 Hypoglycaemia.

Comparison 6 Higher versus lower amino acid intake in parenteral nutrition: subgrouped according to management of caloric balance, Outcome 34 Metabolic acidosis.

Comparison 6 Higher versus lower amino acid intake in parenteral nutrition: subgrouped according to management of caloric balance, Outcome 35 Cholestasis.

Comparison 7 Higher versus lower amino acid intake in parenteral nutrition: very preterm or very low birth weight infants, Outcome 1 Mortality before hospital discharge.

Comparison 7 Higher versus lower amino acid intake in parenteral nutrition: very preterm or very low birth weight infants, Outcome 2 Neurodevelopmental disability.

Comparison 7 Higher versus lower amino acid intake in parenteral nutrition: very preterm or very low birth weight infants, Outcome 3 Postnatal growth failure.

Comparison 7 Higher versus lower amino acid intake in parenteral nutrition: very preterm or very low birth weight infants, Outcome 4 Days to regain birth weight.

Comparison 7 Higher versus lower amino acid intake in parenteral nutrition: very preterm or very low birth weight infants, Outcome 5 Maximal weight loss (grams).
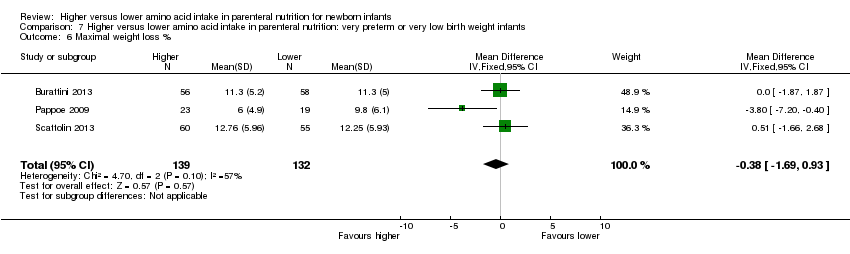
Comparison 7 Higher versus lower amino acid intake in parenteral nutrition: very preterm or very low birth weight infants, Outcome 6 Maximal weight loss %.

Comparison 7 Higher versus lower amino acid intake in parenteral nutrition: very preterm or very low birth weight infants, Outcome 7 Weight gain g/kg/day.
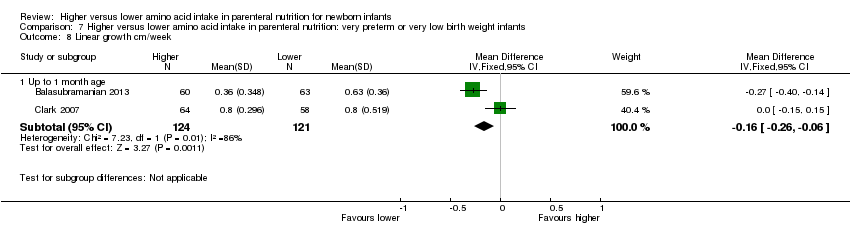
Comparison 7 Higher versus lower amino acid intake in parenteral nutrition: very preterm or very low birth weight infants, Outcome 8 Linear growth cm/week.

Comparison 7 Higher versus lower amino acid intake in parenteral nutrition: very preterm or very low birth weight infants, Outcome 9 Head circumference growth cm/week.

Comparison 7 Higher versus lower amino acid intake in parenteral nutrition: very preterm or very low birth weight infants, Outcome 10 Weight change z‐score.
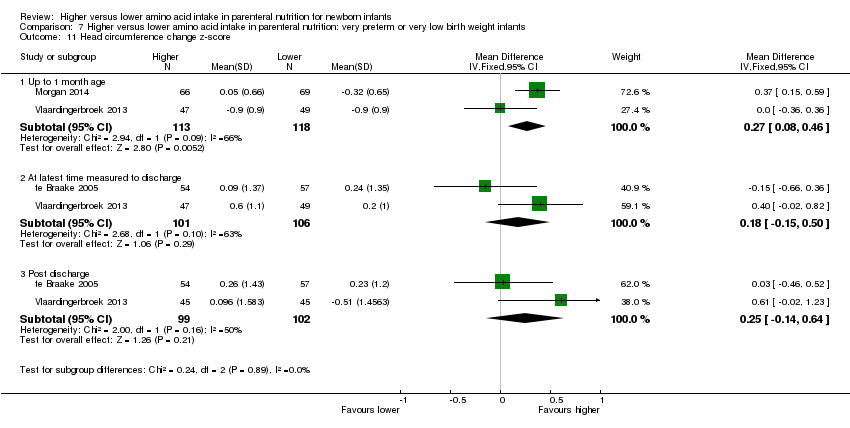
Comparison 7 Higher versus lower amino acid intake in parenteral nutrition: very preterm or very low birth weight infants, Outcome 11 Head circumference change z‐score.

Comparison 7 Higher versus lower amino acid intake in parenteral nutrition: very preterm or very low birth weight infants, Outcome 12 Days to full enteral feeds.

Comparison 7 Higher versus lower amino acid intake in parenteral nutrition: very preterm or very low birth weight infants, Outcome 13 Late‐onset sepsis.
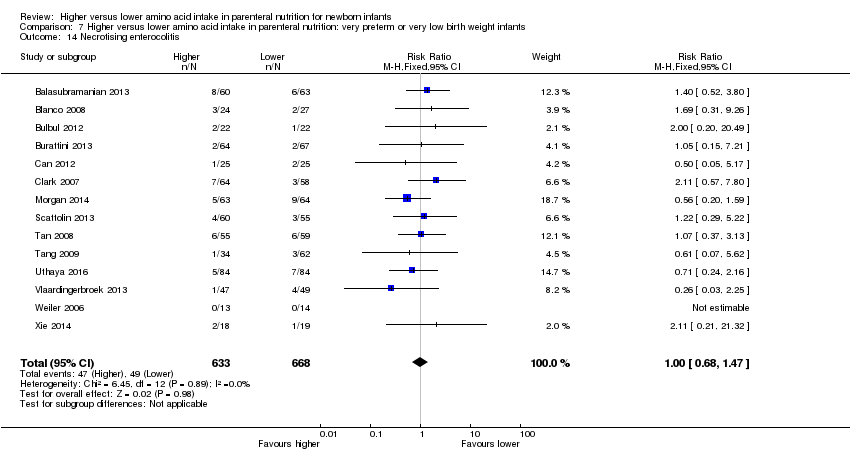
Comparison 7 Higher versus lower amino acid intake in parenteral nutrition: very preterm or very low birth weight infants, Outcome 14 Necrotising enterocolitis.

Comparison 7 Higher versus lower amino acid intake in parenteral nutrition: very preterm or very low birth weight infants, Outcome 15 Chronic lung disease ≥ 36 weeks' PMA.

Comparison 7 Higher versus lower amino acid intake in parenteral nutrition: very preterm or very low birth weight infants, Outcome 16 Intraventricular haemorrhage.

Comparison 7 Higher versus lower amino acid intake in parenteral nutrition: very preterm or very low birth weight infants, Outcome 17 Severe intraventricular haemorrhage.
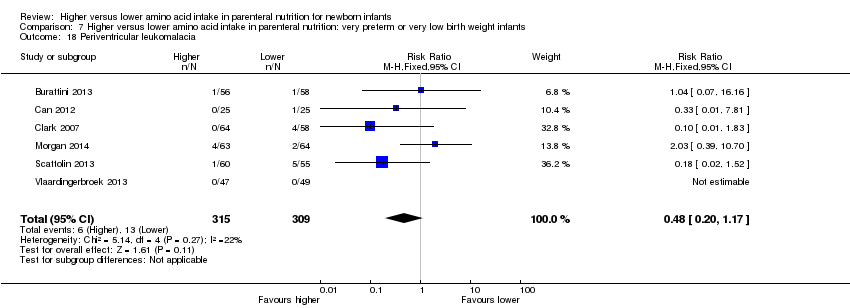
Comparison 7 Higher versus lower amino acid intake in parenteral nutrition: very preterm or very low birth weight infants, Outcome 18 Periventricular leukomalacia.

Comparison 7 Higher versus lower amino acid intake in parenteral nutrition: very preterm or very low birth weight infants, Outcome 19 Retinopathy of prematurity.

Comparison 7 Higher versus lower amino acid intake in parenteral nutrition: very preterm or very low birth weight infants, Outcome 20 Severe retinopathy of prematurity (> stage 2 or treated).

Comparison 7 Higher versus lower amino acid intake in parenteral nutrition: very preterm or very low birth weight infants, Outcome 21 Cerebral palsy.

Comparison 7 Higher versus lower amino acid intake in parenteral nutrition: very preterm or very low birth weight infants, Outcome 22 Developmental delay at ≥ 18 months.

Comparison 7 Higher versus lower amino acid intake in parenteral nutrition: very preterm or very low birth weight infants, Outcome 23 Blindness.

Comparison 7 Higher versus lower amino acid intake in parenteral nutrition: very preterm or very low birth weight infants, Outcome 24 Deafness.

Comparison 7 Higher versus lower amino acid intake in parenteral nutrition: very preterm or very low birth weight infants, Outcome 25 Abnormal serum ammonia > 122 μmol/L.
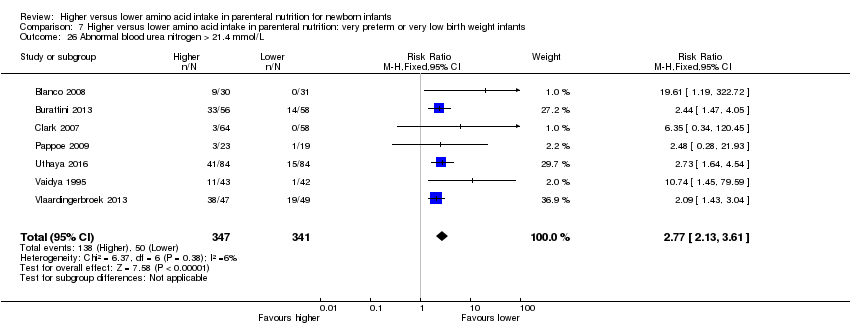
Comparison 7 Higher versus lower amino acid intake in parenteral nutrition: very preterm or very low birth weight infants, Outcome 26 Abnormal blood urea nitrogen > 21.4 mmol/L.

Comparison 7 Higher versus lower amino acid intake in parenteral nutrition: very preterm or very low birth weight infants, Outcome 27 Hyperglycaemia, plasma glucose > 8.3 mmol/L.
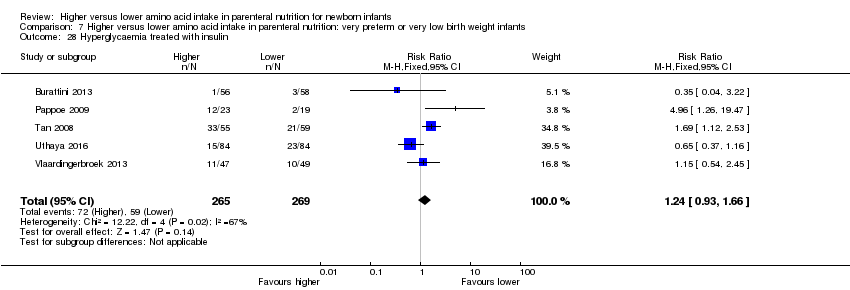
Comparison 7 Higher versus lower amino acid intake in parenteral nutrition: very preterm or very low birth weight infants, Outcome 28 Hyperglycaemia treated with insulin.

Comparison 7 Higher versus lower amino acid intake in parenteral nutrition: very preterm or very low birth weight infants, Outcome 29 Hypoglycaemia.

Comparison 7 Higher versus lower amino acid intake in parenteral nutrition: very preterm or very low birth weight infants, Outcome 30 Metabolic acidosis.

Comparison 7 Higher versus lower amino acid intake in parenteral nutrition: very preterm or very low birth weight infants, Outcome 31 Cholestasis.

Comparison 8 Higher versus lower amino acid intake in parenteral nutrition: subgrouped according to age at commencement, Outcome 1 Mortality before hospital discharge.

Comparison 8 Higher versus lower amino acid intake in parenteral nutrition: subgrouped according to age at commencement, Outcome 2 Neurodevelopmental disability.
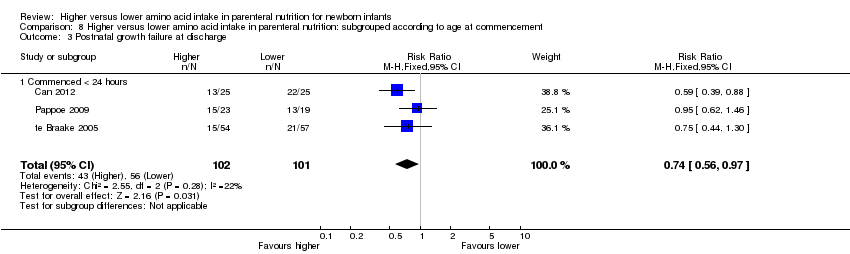
Comparison 8 Higher versus lower amino acid intake in parenteral nutrition: subgrouped according to age at commencement, Outcome 3 Postnatal growth failure at discharge.
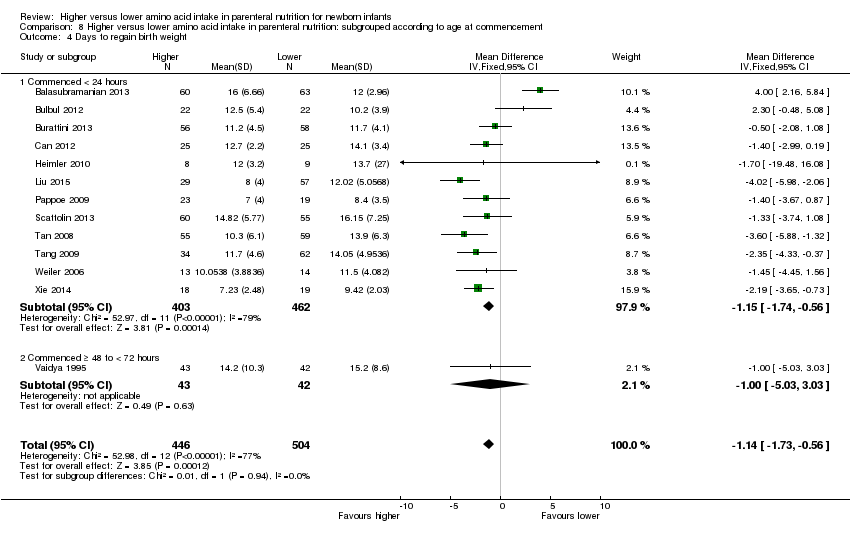
Comparison 8 Higher versus lower amino acid intake in parenteral nutrition: subgrouped according to age at commencement, Outcome 4 Days to regain birth weight.

Comparison 8 Higher versus lower amino acid intake in parenteral nutrition: subgrouped according to age at commencement, Outcome 5 Maximal weight loss (grams).

Comparison 8 Higher versus lower amino acid intake in parenteral nutrition: subgrouped according to age at commencement, Outcome 6 Maximal weight loss %.

Comparison 8 Higher versus lower amino acid intake in parenteral nutrition: subgrouped according to age at commencement, Outcome 7 Weight gain g/kg/day up to 1 month.

Comparison 8 Higher versus lower amino acid intake in parenteral nutrition: subgrouped according to age at commencement, Outcome 8 Weight gain g/kg/day to discharge.

Comparison 8 Higher versus lower amino acid intake in parenteral nutrition: subgrouped according to age at commencement, Outcome 9 Linear growth cm/week up to 1 month.

Comparison 8 Higher versus lower amino acid intake in parenteral nutrition: subgrouped according to age at commencement, Outcome 10 Head circumference growth cm/week up to 1 month age.

Comparison 8 Higher versus lower amino acid intake in parenteral nutrition: subgrouped according to age at commencement, Outcome 11 Head circumference growth cm/week to discharge.

Comparison 8 Higher versus lower amino acid intake in parenteral nutrition: subgrouped according to age at commencement, Outcome 12 Weight change z‐score to discharge.

Comparison 8 Higher versus lower amino acid intake in parenteral nutrition: subgrouped according to age at commencement, Outcome 13 Head circumference change z‐score to 1 month age.

Comparison 8 Higher versus lower amino acid intake in parenteral nutrition: subgrouped according to age at commencement, Outcome 14 Head circumference change z‐score to discharge.

Comparison 8 Higher versus lower amino acid intake in parenteral nutrition: subgrouped according to age at commencement, Outcome 15 Days to full enteral feeds.

Comparison 8 Higher versus lower amino acid intake in parenteral nutrition: subgrouped according to age at commencement, Outcome 16 Late‐onset sepsis.

Comparison 8 Higher versus lower amino acid intake in parenteral nutrition: subgrouped according to age at commencement, Outcome 17 Necrotising enterocolitis.

Comparison 8 Higher versus lower amino acid intake in parenteral nutrition: subgrouped according to age at commencement, Outcome 18 Chronic lung disease ≥ 36 weeks' PMA.

Comparison 8 Higher versus lower amino acid intake in parenteral nutrition: subgrouped according to age at commencement, Outcome 19 Intraventricular haemorrhage.
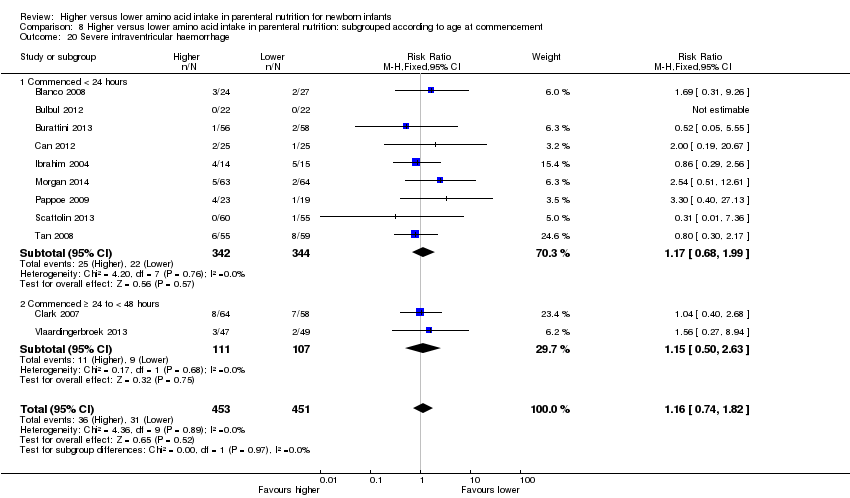
Comparison 8 Higher versus lower amino acid intake in parenteral nutrition: subgrouped according to age at commencement, Outcome 20 Severe intraventricular haemorrhage.

Comparison 8 Higher versus lower amino acid intake in parenteral nutrition: subgrouped according to age at commencement, Outcome 21 Periventricular leukomalacia.

Comparison 8 Higher versus lower amino acid intake in parenteral nutrition: subgrouped according to age at commencement, Outcome 22 Retinopathy of prematurity.

Comparison 8 Higher versus lower amino acid intake in parenteral nutrition: subgrouped according to age at commencement, Outcome 23 Severe retinopathy of prematurity (> stage 2 or treated).

Comparison 8 Higher versus lower amino acid intake in parenteral nutrition: subgrouped according to age at commencement, Outcome 24 Cerebral palsy.

Comparison 8 Higher versus lower amino acid intake in parenteral nutrition: subgrouped according to age at commencement, Outcome 25 Developmental delay at ≥ 18 months.

Comparison 8 Higher versus lower amino acid intake in parenteral nutrition: subgrouped according to age at commencement, Outcome 26 Blindness.

Comparison 8 Higher versus lower amino acid intake in parenteral nutrition: subgrouped according to age at commencement, Outcome 27 Deafness.

Comparison 8 Higher versus lower amino acid intake in parenteral nutrition: subgrouped according to age at commencement, Outcome 28 Abnormal serum ammonia > 122 μmol/L.

Comparison 8 Higher versus lower amino acid intake in parenteral nutrition: subgrouped according to age at commencement, Outcome 29 Abnormal blood urea nitrogen (various criteria).

Comparison 8 Higher versus lower amino acid intake in parenteral nutrition: subgrouped according to age at commencement, Outcome 30 Hyperglycaemia, plasma glucose > 8.3 mmol/L.
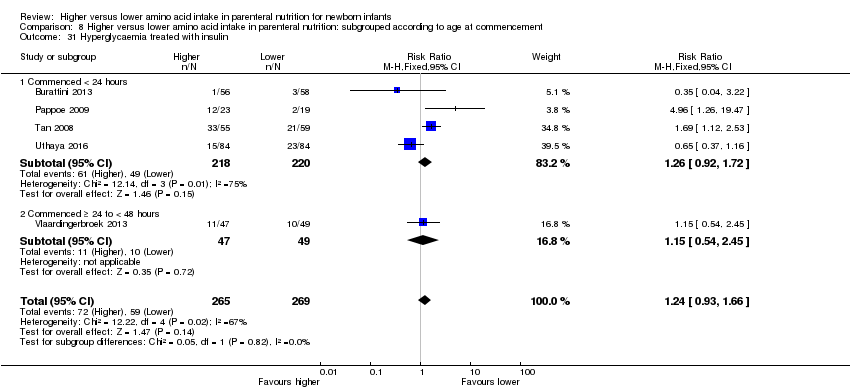
Comparison 8 Higher versus lower amino acid intake in parenteral nutrition: subgrouped according to age at commencement, Outcome 31 Hyperglycaemia treated with insulin.

Comparison 8 Higher versus lower amino acid intake in parenteral nutrition: subgrouped according to age at commencement, Outcome 32 Hypoglycaemia.
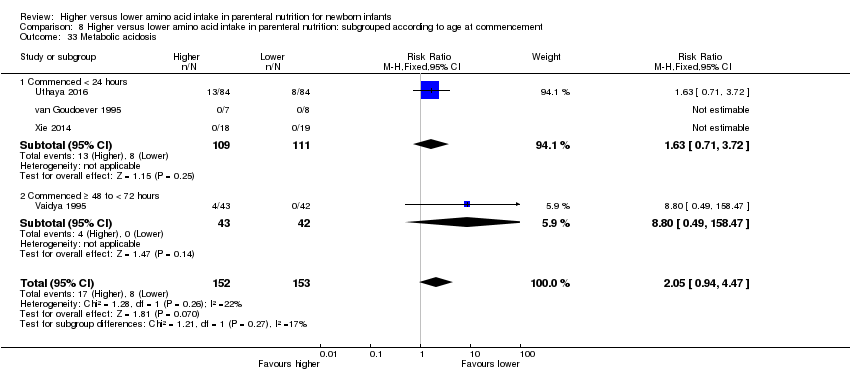
Comparison 8 Higher versus lower amino acid intake in parenteral nutrition: subgrouped according to age at commencement, Outcome 33 Metabolic acidosis.

Comparison 8 Higher versus lower amino acid intake in parenteral nutrition: subgrouped according to age at commencement, Outcome 34 Cholestasis.

Comparison 9 Higher versus lower amino acid intake in parenteral nutrition: subgrouped according to lipid intake, Outcome 1 Mortality before hospital discharge.

Comparison 9 Higher versus lower amino acid intake in parenteral nutrition: subgrouped according to lipid intake, Outcome 2 Neurodevelopmental disability.

Comparison 9 Higher versus lower amino acid intake in parenteral nutrition: subgrouped according to lipid intake, Outcome 3 Postnatal growth failure at discharge.

Comparison 9 Higher versus lower amino acid intake in parenteral nutrition: subgrouped according to lipid intake, Outcome 4 Days to regain birth weight.
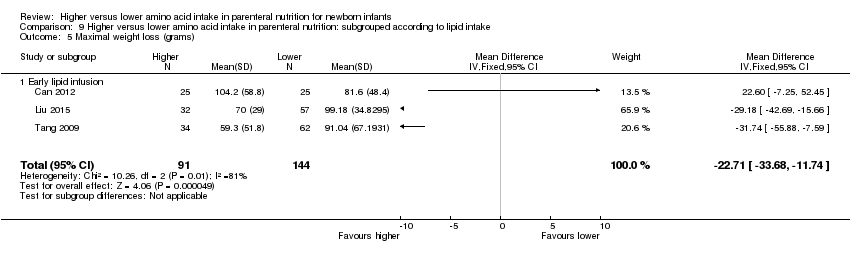
Comparison 9 Higher versus lower amino acid intake in parenteral nutrition: subgrouped according to lipid intake, Outcome 5 Maximal weight loss (grams).

Comparison 9 Higher versus lower amino acid intake in parenteral nutrition: subgrouped according to lipid intake, Outcome 6 Maximal weight loss %.

Comparison 9 Higher versus lower amino acid intake in parenteral nutrition: subgrouped according to lipid intake, Outcome 7 Weight gain g/kg/day to 1 month.

Comparison 9 Higher versus lower amino acid intake in parenteral nutrition: subgrouped according to lipid intake, Outcome 8 Weight gain g/kg/day to discharge.

Comparison 9 Higher versus lower amino acid intake in parenteral nutrition: subgrouped according to lipid intake, Outcome 9 Linear growth cm/week up to 1 month age.

Comparison 9 Higher versus lower amino acid intake in parenteral nutrition: subgrouped according to lipid intake, Outcome 10 Head circumference growth cm/week up to 1 month age.

Comparison 9 Higher versus lower amino acid intake in parenteral nutrition: subgrouped according to lipid intake, Outcome 11 Head circumference growth cm/week to discharge.

Comparison 9 Higher versus lower amino acid intake in parenteral nutrition: subgrouped according to lipid intake, Outcome 12 Weight change z‐score to 1 month.

Comparison 9 Higher versus lower amino acid intake in parenteral nutrition: subgrouped according to lipid intake, Outcome 13 Weight change z‐score to discharge.

Comparison 9 Higher versus lower amino acid intake in parenteral nutrition: subgrouped according to lipid intake, Outcome 14 Weight change z‐score post discharge.

Comparison 9 Higher versus lower amino acid intake in parenteral nutrition: subgrouped according to lipid intake, Outcome 15 Head circumference change z‐score to 1 month.
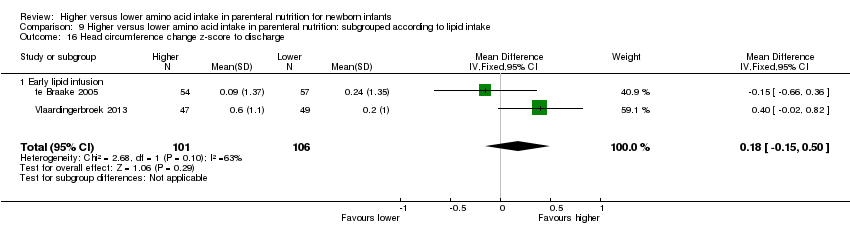
Comparison 9 Higher versus lower amino acid intake in parenteral nutrition: subgrouped according to lipid intake, Outcome 16 Head circumference change z‐score to discharge.

Comparison 9 Higher versus lower amino acid intake in parenteral nutrition: subgrouped according to lipid intake, Outcome 17 Head circumference change z‐score post discharge.

Comparison 9 Higher versus lower amino acid intake in parenteral nutrition: subgrouped according to lipid intake, Outcome 18 Days to full enteral feeds.

Comparison 9 Higher versus lower amino acid intake in parenteral nutrition: subgrouped according to lipid intake, Outcome 19 Late‐onset sepsis.

Comparison 9 Higher versus lower amino acid intake in parenteral nutrition: subgrouped according to lipid intake, Outcome 20 Necrotising enterocolitis.
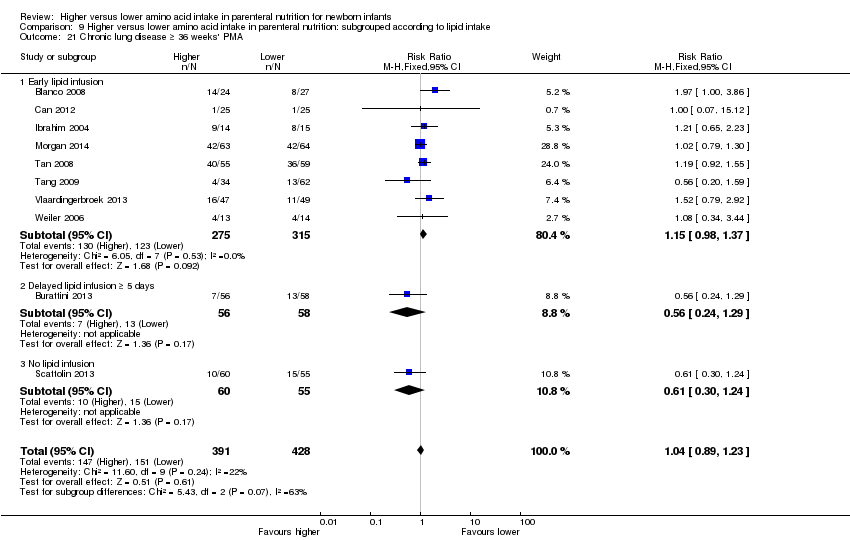
Comparison 9 Higher versus lower amino acid intake in parenteral nutrition: subgrouped according to lipid intake, Outcome 21 Chronic lung disease ≥ 36 weeks' PMA.
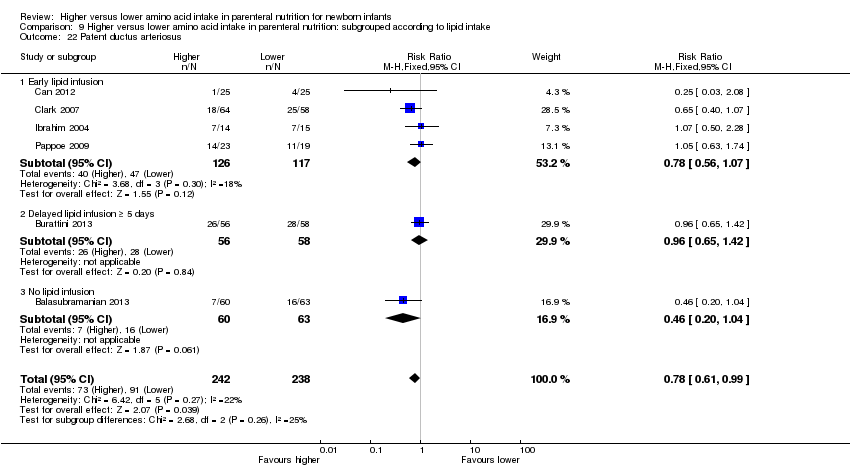
Comparison 9 Higher versus lower amino acid intake in parenteral nutrition: subgrouped according to lipid intake, Outcome 22 Patent ductus arteriosus.

Comparison 9 Higher versus lower amino acid intake in parenteral nutrition: subgrouped according to lipid intake, Outcome 23 Intraventricular haemorrhage.

Comparison 9 Higher versus lower amino acid intake in parenteral nutrition: subgrouped according to lipid intake, Outcome 24 Severe intraventricular haemorrhage.
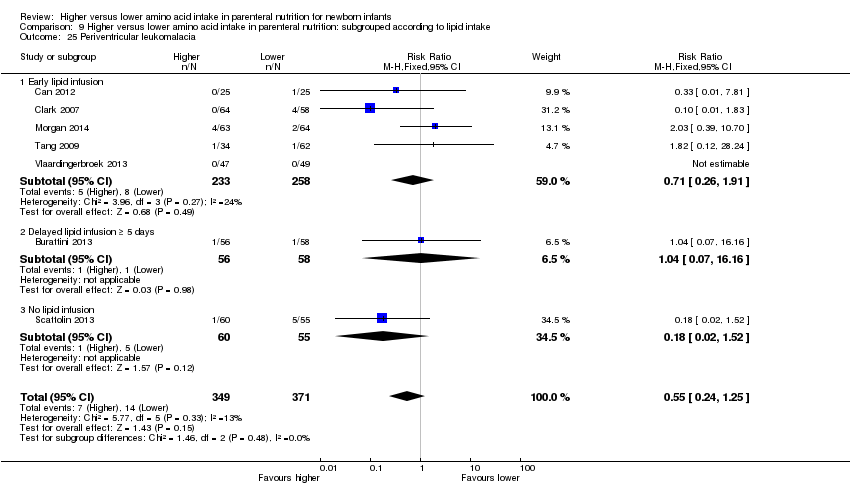
Comparison 9 Higher versus lower amino acid intake in parenteral nutrition: subgrouped according to lipid intake, Outcome 25 Periventricular leukomalacia.

Comparison 9 Higher versus lower amino acid intake in parenteral nutrition: subgrouped according to lipid intake, Outcome 26 Retinopathy of prematurity.
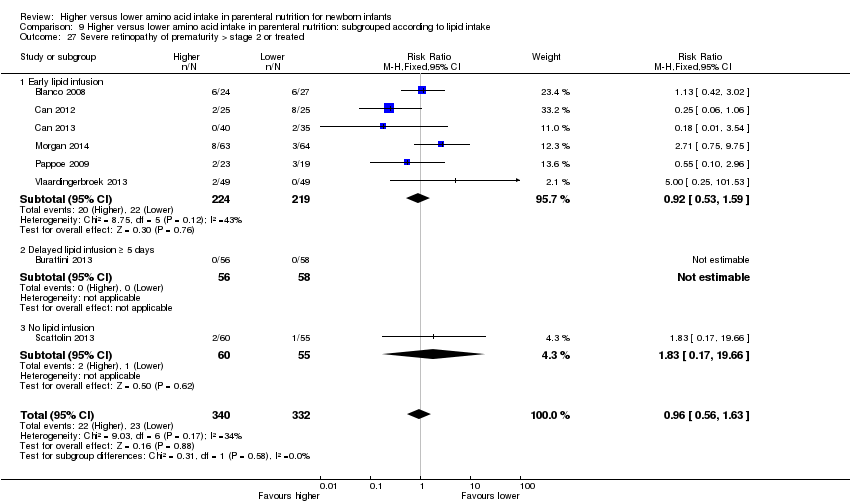
Comparison 9 Higher versus lower amino acid intake in parenteral nutrition: subgrouped according to lipid intake, Outcome 27 Severe retinopathy of prematurity > stage 2 or treated.

Comparison 9 Higher versus lower amino acid intake in parenteral nutrition: subgrouped according to lipid intake, Outcome 28 Cerebral palsy.

Comparison 9 Higher versus lower amino acid intake in parenteral nutrition: subgrouped according to lipid intake, Outcome 29 Developmental delay at ≥ 18 months.

Comparison 9 Higher versus lower amino acid intake in parenteral nutrition: subgrouped according to lipid intake, Outcome 30 Blindness.

Comparison 9 Higher versus lower amino acid intake in parenteral nutrition: subgrouped according to lipid intake, Outcome 31 Deafness.

Comparison 9 Higher versus lower amino acid intake in parenteral nutrition: subgrouped according to lipid intake, Outcome 32 Abnormal serum ammonia.

Comparison 9 Higher versus lower amino acid intake in parenteral nutrition: subgrouped according to lipid intake, Outcome 33 Abnormal blood urea nitrogen.

Comparison 9 Higher versus lower amino acid intake in parenteral nutrition: subgrouped according to lipid intake, Outcome 34 Hyperglycaemia, plasma glucose > 8.3 mmol/L.

Comparison 9 Higher versus lower amino acid intake in parenteral nutrition: subgrouped according to lipid intake, Outcome 35 Hyperglycaemia treated with insulin.
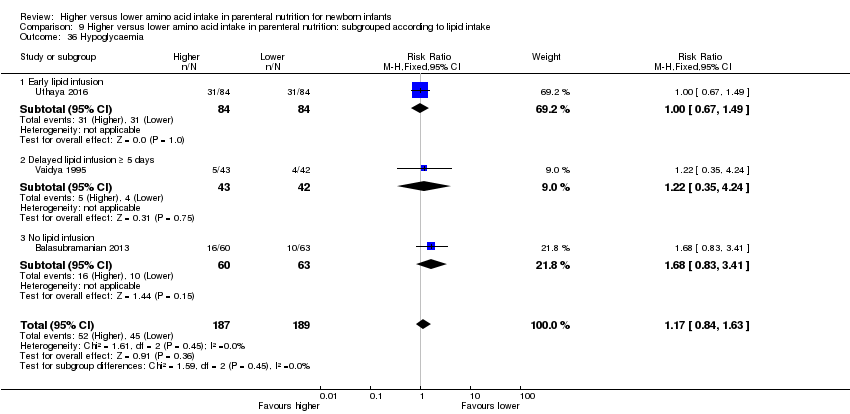
Comparison 9 Higher versus lower amino acid intake in parenteral nutrition: subgrouped according to lipid intake, Outcome 36 Hypoglycaemia.

Comparison 9 Higher versus lower amino acid intake in parenteral nutrition: subgrouped according to lipid intake, Outcome 37 Metabolic acidosis.
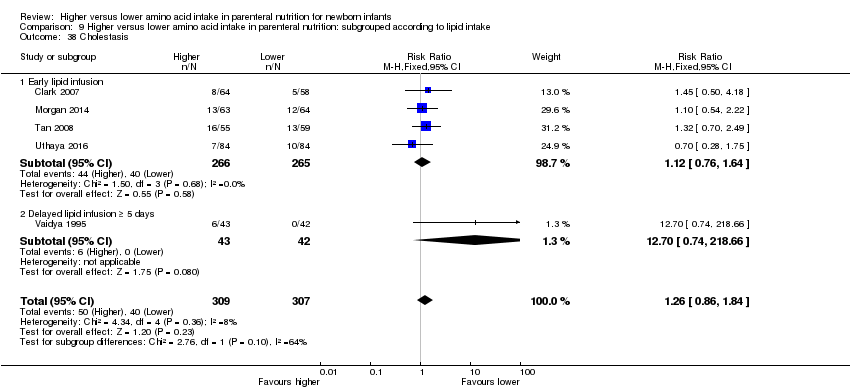
Comparison 9 Higher versus lower amino acid intake in parenteral nutrition: subgrouped according to lipid intake, Outcome 38 Cholestasis.

Comparison 10 Higher versus lower amino acid intake in parenteral nutrition: sensitivity analysis (allocation concealment, adequate randomisation, blinding of treatment, less than 10% loss to follow‐up), Outcome 1 Mortality before hospital discharge.

Comparison 10 Higher versus lower amino acid intake in parenteral nutrition: sensitivity analysis (allocation concealment, adequate randomisation, blinding of treatment, less than 10% loss to follow‐up), Outcome 2 Neurodevelopmental disability.

Comparison 10 Higher versus lower amino acid intake in parenteral nutrition: sensitivity analysis (allocation concealment, adequate randomisation, blinding of treatment, less than 10% loss to follow‐up), Outcome 3 Postnatal growth failure at discharge.

Comparison 10 Higher versus lower amino acid intake in parenteral nutrition: sensitivity analysis (allocation concealment, adequate randomisation, blinding of treatment, less than 10% loss to follow‐up), Outcome 4 Postnatal growth failure post discharge.

Comparison 10 Higher versus lower amino acid intake in parenteral nutrition: sensitivity analysis (allocation concealment, adequate randomisation, blinding of treatment, less than 10% loss to follow‐up), Outcome 5 Days to regain birth weight.

Comparison 10 Higher versus lower amino acid intake in parenteral nutrition: sensitivity analysis (allocation concealment, adequate randomisation, blinding of treatment, less than 10% loss to follow‐up), Outcome 6 Maximal weight loss (grams).

Comparison 10 Higher versus lower amino acid intake in parenteral nutrition: sensitivity analysis (allocation concealment, adequate randomisation, blinding of treatment, less than 10% loss to follow‐up), Outcome 7 Maximal weight loss %.

Comparison 10 Higher versus lower amino acid intake in parenteral nutrition: sensitivity analysis (allocation concealment, adequate randomisation, blinding of treatment, less than 10% loss to follow‐up), Outcome 8 Weight gain g/kg/day up to 1 month age.

Comparison 10 Higher versus lower amino acid intake in parenteral nutrition: sensitivity analysis (allocation concealment, adequate randomisation, blinding of treatment, less than 10% loss to follow‐up), Outcome 9 Weight gain g/kg/day to discharge.

Comparison 10 Higher versus lower amino acid intake in parenteral nutrition: sensitivity analysis (allocation concealment, adequate randomisation, blinding of treatment, less than 10% loss to follow‐up), Outcome 10 Linear growth cm/week up to 1 month age.

Comparison 10 Higher versus lower amino acid intake in parenteral nutrition: sensitivity analysis (allocation concealment, adequate randomisation, blinding of treatment, less than 10% loss to follow‐up), Outcome 11 Head circumference growth cm/week up to 1 month age.

Comparison 10 Higher versus lower amino acid intake in parenteral nutrition: sensitivity analysis (allocation concealment, adequate randomisation, blinding of treatment, less than 10% loss to follow‐up), Outcome 12 Head circumference growth cm/week to discharge.
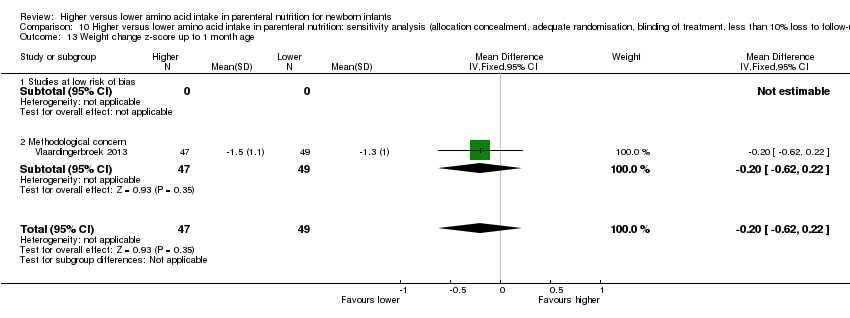
Comparison 10 Higher versus lower amino acid intake in parenteral nutrition: sensitivity analysis (allocation concealment, adequate randomisation, blinding of treatment, less than 10% loss to follow‐up), Outcome 13 Weight change z‐score up to 1 month age.

Comparison 10 Higher versus lower amino acid intake in parenteral nutrition: sensitivity analysis (allocation concealment, adequate randomisation, blinding of treatment, less than 10% loss to follow‐up), Outcome 14 Weight change z‐score to discharge.

Comparison 10 Higher versus lower amino acid intake in parenteral nutrition: sensitivity analysis (allocation concealment, adequate randomisation, blinding of treatment, less than 10% loss to follow‐up), Outcome 15 Weight change z‐score post discharge.

Comparison 10 Higher versus lower amino acid intake in parenteral nutrition: sensitivity analysis (allocation concealment, adequate randomisation, blinding of treatment, less than 10% loss to follow‐up), Outcome 16 Head circumference change z‐score up to 1 month.

Comparison 10 Higher versus lower amino acid intake in parenteral nutrition: sensitivity analysis (allocation concealment, adequate randomisation, blinding of treatment, less than 10% loss to follow‐up), Outcome 17 Head circumference change z‐score to discharge.

Comparison 10 Higher versus lower amino acid intake in parenteral nutrition: sensitivity analysis (allocation concealment, adequate randomisation, blinding of treatment, less than 10% loss to follow‐up), Outcome 18 Head circumference change z‐score post discharge.

Comparison 10 Higher versus lower amino acid intake in parenteral nutrition: sensitivity analysis (allocation concealment, adequate randomisation, blinding of treatment, less than 10% loss to follow‐up), Outcome 19 Days to full enteral feeds.

Comparison 10 Higher versus lower amino acid intake in parenteral nutrition: sensitivity analysis (allocation concealment, adequate randomisation, blinding of treatment, less than 10% loss to follow‐up), Outcome 20 Late‐onset sepsis.

Comparison 10 Higher versus lower amino acid intake in parenteral nutrition: sensitivity analysis (allocation concealment, adequate randomisation, blinding of treatment, less than 10% loss to follow‐up), Outcome 21 Necrotising enterocolitis.

Comparison 10 Higher versus lower amino acid intake in parenteral nutrition: sensitivity analysis (allocation concealment, adequate randomisation, blinding of treatment, less than 10% loss to follow‐up), Outcome 22 Chronic lung disease at ≥ 36 weeks' PMA.

Comparison 10 Higher versus lower amino acid intake in parenteral nutrition: sensitivity analysis (allocation concealment, adequate randomisation, blinding of treatment, less than 10% loss to follow‐up), Outcome 23 Intraventricular haemorrhage.

Comparison 10 Higher versus lower amino acid intake in parenteral nutrition: sensitivity analysis (allocation concealment, adequate randomisation, blinding of treatment, less than 10% loss to follow‐up), Outcome 24 Severe intraventricular haemorrhage.

Comparison 10 Higher versus lower amino acid intake in parenteral nutrition: sensitivity analysis (allocation concealment, adequate randomisation, blinding of treatment, less than 10% loss to follow‐up), Outcome 25 Periventricular leukomalacia.

Comparison 10 Higher versus lower amino acid intake in parenteral nutrition: sensitivity analysis (allocation concealment, adequate randomisation, blinding of treatment, less than 10% loss to follow‐up), Outcome 26 Retinopathy of prematurity.

Comparison 10 Higher versus lower amino acid intake in parenteral nutrition: sensitivity analysis (allocation concealment, adequate randomisation, blinding of treatment, less than 10% loss to follow‐up), Outcome 27 Severe retinopathy of prematurity (> stage 2 or treated).

Comparison 10 Higher versus lower amino acid intake in parenteral nutrition: sensitivity analysis (allocation concealment, adequate randomisation, blinding of treatment, less than 10% loss to follow‐up), Outcome 28 Cerebral palsy.

Comparison 10 Higher versus lower amino acid intake in parenteral nutrition: sensitivity analysis (allocation concealment, adequate randomisation, blinding of treatment, less than 10% loss to follow‐up), Outcome 29 Developmental delay at ≥ 18 months.

Comparison 10 Higher versus lower amino acid intake in parenteral nutrition: sensitivity analysis (allocation concealment, adequate randomisation, blinding of treatment, less than 10% loss to follow‐up), Outcome 30 Blindness.

Comparison 10 Higher versus lower amino acid intake in parenteral nutrition: sensitivity analysis (allocation concealment, adequate randomisation, blinding of treatment, less than 10% loss to follow‐up), Outcome 31 Deafness.

Comparison 10 Higher versus lower amino acid intake in parenteral nutrition: sensitivity analysis (allocation concealment, adequate randomisation, blinding of treatment, less than 10% loss to follow‐up), Outcome 32 Abnormal serum ammonia > 122 μmol/L.

Comparison 10 Higher versus lower amino acid intake in parenteral nutrition: sensitivity analysis (allocation concealment, adequate randomisation, blinding of treatment, less than 10% loss to follow‐up), Outcome 33 Abnormal blood urea nitrogen.

Comparison 10 Higher versus lower amino acid intake in parenteral nutrition: sensitivity analysis (allocation concealment, adequate randomisation, blinding of treatment, less than 10% loss to follow‐up), Outcome 34 Hyperglycaemia, plasma glucose > 8.3 mmol/L.

Comparison 10 Higher versus lower amino acid intake in parenteral nutrition: sensitivity analysis (allocation concealment, adequate randomisation, blinding of treatment, less than 10% loss to follow‐up), Outcome 35 Hyperglycaemia treated with insulin.

Comparison 10 Higher versus lower amino acid intake in parenteral nutrition: sensitivity analysis (allocation concealment, adequate randomisation, blinding of treatment, less than 10% loss to follow‐up), Outcome 36 Hypoglycaemia.

Comparison 10 Higher versus lower amino acid intake in parenteral nutrition: sensitivity analysis (allocation concealment, adequate randomisation, blinding of treatment, less than 10% loss to follow‐up), Outcome 37 Metabolic acidosis.

Comparison 10 Higher versus lower amino acid intake in parenteral nutrition: sensitivity analysis (allocation concealment, adequate randomisation, blinding of treatment, less than 10% loss to follow‐up), Outcome 38 Cholestasis.
| Higher versus lower amino acid intake in parenteral nutrition for newborn infants | ||||||
| Patient or population: preterm infants | ||||||
| Outcomes | Illustrative comparative risks* (95% CI) | Relative effect | No. of participants | Quality of the evidence | Comments | |
| Assumed risk | Corresponding risk | |||||
| Control | Higher vs lower amino acid intake in parenteral nutrition | |||||
| Mortality to hospital discharge | Study population | RR 0.9 | 1407 | ⊕⊕⊝⊝ | No significant differences found in subgroup analyses according to amino acid intake at commencement, at maximal intake, or at commencement and maximal intake; according to management of caloric balance (non‐protein caloric intake); in very preterm or very low birth weight infants; according to age of commencement; or according to timing of lipid intake Quality of evidence downgraded owing to imprecision and potential for publication or reporting bias | |
| 131 per 1000 | 118 per 1000 | |||||
| Moderate | ||||||
| 127 per 1000 | 114 per 1000 | |||||
| Neurodevelopmental disability | Study population | RR 1.04 | 201 | ⊕⊝⊝⊝ | Limited neurodevelopmental data. No significant differences found for any secondary outcome including cerebral palsy, developmental delay, blindness, deafness, Bayley Scales of Infant Development scores, or autism Quality of evidence downgraded owing to risk of bias, inconsistency, imprecision, and potential for publication or reporting bias | |
| 118 per 1000 | 122 per 1000 | |||||
| Moderate | ||||||
| 108 per 1000 | 112 per 1000 | |||||
| Postnatal growth failure at discharge (weight < 10th centile) | Study population | RR 0.74 | 203 | ⊕⊝⊝⊝ | Subgroup analyses found significant reduction in postnatal growth failure at discharge for infants commenced on high amino acid intake (> 2 to ≤ 3 g/kg/d) that increased amino acid and non‐protein caloric intake; commenced intake at < 24 hours' age; and provided early lipid infusion. Quality of evidence downgraded owing to risk of bias, imprecision, and potential for publication or reporting bias | |
| 554 per 1000 | 410 per 1000 | |||||
| Moderate | ||||||
| 684 per 1000 | 506 per 1000 | |||||
| Weight gain to discharge (g/kg/d) | Mean weight gain to discharge (g/kg/d) in intervention groups was | 291 | ⊕⊝⊝⊝ | No significant subgroup effects found according to intake; timing of commencement; management of caloric balance; or timing of lipid intake Reduction in weight gain to 1 month age attributable to the effect of a single study (Balasubramanian 2013) that did not provide a lipid infusion Quality of evidence downgraded owing to risk of bias, imprecision, and potential for publication or reporting bias | ||
| Head circumference growth to discharge (cm/week) | Mean head circumference growth to discharge (cm/week) in intervention groups was | 315 | ⊕⊝⊝⊝ | Subgroup analyses found a significant increase in head circumference growth to discharge for infants on high amino acid intake (> 2 to ≤ 3 g/kg/d) at commencement; and for infants on high (> 3 to ≤ 4 g/kg/d) amino acid intake at maximal intake. All studies provided isocaloric non‐protein energy intake and early lipid infusion in both groups. Quality of evidence downgraded owing to risk of bias, inconsistency, imprecision, and potential for publication or reporting bias | ||
| Retinopathy of prematurity | Study population | RR 0.44 | 269 | ⊕⊝⊝⊝ | Subgroup analyses found reduction in retinopathy of prematurity in studies that commenced high (> 2 to ≤ 3 g/kg/d) amino acid intake; that increased amino acid and non‐protein caloric intake; in very preterm or very low birth weight infants; that commenced intake at < 24 hours' age; and provided early lipid infusion. Quality of evidence downgraded owing to risk of bias, imprecision, and potential for publication or reporting bias | |
| 144 per 1000 | 63 per 1000 | |||||
| Moderate | ||||||
| 179 per 1000 | 79 per 1000 | |||||
| Abnormal blood urea nitrogen (various criteria) | Study population | RR 2.77 | 688 | ⊕⊕⊕⊕ | Various criteria for abnormal blood urea nitrogen reported ranging from 10.0 mmol/L up to 21.4 mmol/L Significant subgroup effect with increasing level of amino acid intake | |
| 147 per 1000 | 406 per 1000 | |||||
| Moderate | ||||||
| 53 per 1000 | 147 per 1000 | |||||
| *The basis for the assumed risk (e.g. the median control group risk across studies) is provided in footnotes. The corresponding risk (and its 95% confidence interval) is based on the assumed risk in the comparison group and the relative effect of the intervention (and its 95% CI). | ||||||
| GRADE Working Group grades of evidence. | ||||||
| aWide confidence intervals do not preclude a significant effect. | ||||||
| Trial | Infants | Higher AA group | Lower AA group | Lipid | Enteral feed |
| Anderson 1979 | Infants at < 37 weeks, AGA | 2.5 g/kg/d day 1 to 5 | 0 g/kg/d day 1 to 5 | No lipid. Isocaloric | No enteral feeds |
| Balasubramanian 2013 | Birth weight 900 to 1250 grams | 3 g/kg day 1 graded to 4 g/kg day 2 | 1 g/kg day 1 graded to 4 g/kg day 4 | No lipid | Similar early enteral feeds |
| Black 1981 | Infants with respiratory distress | Graded up to 2.8 g/kg/d from day 3 to 4 | 0 g/kg/d from day 3 to 4 | Lipid in amino acid group | Similar delayed enteral feeds |
| Blanco 2008 | Birth weight < 1000 grams | 2.0 g/kg day 1 graded to 4.0 g/kg day 3 | 0.5 g/kg day 2 graded to 3.0 g/kg day 7 | Similar lipid from day 1 | Enteral feeds unclear |
| Bulbul 2012 | Infants at < 32 weeks' gestation | 3 g/kg from day 1 | 1 g/kg day 1 graded to 3 g/kg day 3 | Lipid 3 g/kg day 1 vs 1 g/kg day 1 increasing to 3 g/kg day 3 | Similar early enteral feeds |
| Burattini 2013 | Birth weight 500 to 1249 grams | 2.5 g/kg day 1 graded to 4.0 g/kg day 4 | 1.5 g/kg day 1 graded to 2.5 g/kg day 3 | Similar lipid from day 5 | Similar early enteral feeds |
| Can 2012 | Infants at 27 to 33 weeks' gestation | 3.0 g/kg day 1 graded to 4.0 g/kg day 2 | 1.5 g/kg day 1 graded to 4.0 g/kg day 3 | Higher early lipid from day 1 (2 g/kg day 1 and 3 g/kg day 2 vs 1 g/kg day 1 graded to 3 g/kg day 3) | Similar early enteral feeds |
| Can 2013 | Infants at < 32 weeks' gestation | 3.0 g/kg day 1 graded to 4.0 g/kg day 2 | 1.5 g/kg day 1 graded to 4.0 g/kg day 3 | Higher early lipid from day 1 (2 g/kg day 1 and 3 g/kg day 2 vs 1 g/kg day 1 graded to 3 g/kg day 3) | Similar early enteral feeds |
| Clark 2007 | Infants at 23 to < 30 weeks' gestation | 1.5 g/kg day 2 graded to 3.5 g/kg day 3 | 1.0 g/kg day 2 graded to 2.5 g/kg day 4 | Similar early lipid from day 1 | Similar early enteral feeds |
| Hata 2002 | Surgical term infants | 3.45 g/kg/d | 2.59 g/kg/d vs 1.72 g/kg/d | No lipid | No enteral feeds |
| Heimler 2010 | Infants at < 34 weeks' gestation | 1.5 g/kg day 1 graded to 2.5 g/kg day 3 | 0 g/kg day 1 to 3 graded to 2.5 g/kg day 7 | Similar lipid from day 4 | No enteral feeds to day 4 |
| Ibrahim 2004 | Birth weight 501 to 1250 grams and at 24 to 32 weeks' gestation | 3.5 g/kg day 1 to 7 | 0 g/kg day 1 to 2, 2.0 g/kg day 3 graded to 3.5 g/kg day 7 | Higher early lipid from day 1 | No enteral feeds to day 7 |
| Kashyap 2007 | Birth weight < 1250 grams | 18% protein:NPE day 1 graded to 4.0 g/kg/d | 12.5% protein:NPE graded to 3.0 g/kg/d | Early lipid from day 1 | Similar early enteral feeds |
| Liu 2014 | Birth weight 1000 to 2000 grams | 3.0 g/kg day 1 graded to 4.0 g/kg/d | 2.0 g/kg day 1 graded to 3.7 g/kg/d 1.0 g/kg day 1 graded to 3.5 g/kg/d | Similar early lipid from day 2 | Similar early enteral feeds from day 3 |
| Makay 2007 | Infants at ≥ 35 weeks' gestation | 1.0 g/kg day 1 graded to 3.0 g/kg day 5 | 0 g/kg day 1 graded to 3.0 g/kg day 7 | Higher lipid from day 2 | No enteral feeds |
| Morgan 2014 | Infants at < 29 weeks’ gestation and birth weight < 1200 grams | 1.8 g/kg day 1 to 2; 2.9 g/kg day 3 to 4 increased to 3.9 g/kg day 5 | 1.8 g/kg day 1 to 2; AA 2.4 g/kg day 3 to 4 increased to 2.8 g/kg day 5 | Similar early lipid from day 1; higher lipid from day 5 Similar glucose day 1 to 2; higher glucose from day 3 | Similar early enteral feeds |
| Murdoch 1995 | Birth weight < 2000 grams | 1.0 g/kg day 1 and 1.4 g/kg day 2 | 0 g/kg day 1 to 2 | Higher lipid (no lipid control group) | No enteral feeds |
| Pappoe 2009 | Birth weight 600 to 1200 grams | 2.0 g/kg day 1 graded to 3.5 g/kg day 3 | 1.0 g/kg day 1 graded to 3.5 g/kg day 6 | Higher lipid from day 1 | Similar early enteral feeds |
| Pildes 1973 | Infants < 1500 grams at 24 to 48 hours' age | Unclear intake (solution 3.4 g/100 mL) | 0 g/kg/d | No lipid | Similar enteral feeds |
| Rivera 1993 | Preterm infants with respiratory distress < 24 hours old on mechanical ventilation | 1.5 g/kg day 1 to 3 | 0 g/kg/d | No lipid | No enteral feeds |
| Scattolin 2013 | Birth weight < 1250 grams | 2.0 g/kg day 1 graded to 4.0 g/kg day 4 | 1.5 g/kg day 1 graded to 3.0 g/kg day 4 | Lipid intake not reported | Similar early enteral feeds |
| Tan 2008 | Infants at < 33 weeks' gestation | 1.0 g/kg day 1 graded to 4.0 g/kg day 7 | 1.0 g/kg day 1 graded to 3.0 g/kg day 7 | Higher lipid from day 1 | Similar early enteral feeds |
| Tang 2009 | Birth weight 1000 to 2000 grams | 2.4 g/kg day 1 graded to 3.6 g/kg day 2 | 1.0 g/kg day 1 graded to 3.0 g/kg day 6 vs 0 g/kg day 1 graded to 3.0 g/kg day 9 | Similar lipid from day 3 | Enteral feeds unclear |
| te Braake 2005 | Birth weight ≤ 1500 grams | 2.4 g/kg day 1 to 4 | 0 g/kg day 1 to 2 graded to 2.4 g/kg day 3 to 4 | Similar early lipid from day 2 | Similar early enteral feeds |
| Thureen 2003 | Birth weight ≤ 1300 grams | 2.56 g/kg day 1 to 2 | 0.85 g/kg day 1 to 2 | Similar early lipid from day 1 | No early enteral feeds |
| Uthaya 2016 | Infants at < 31 weeks' gestation | 3.6 g/kg/d from day 1 | 1.7 g/kg/d day 1, 2.1 g/kg/d day 2, maximum 2.7 g/kg/d day 3 | Similar early lipid from day 1 | Similar early enteral feeds |
| Vaidya 1995 | Birth weight < 1250 grams | 0.5 g/kg day 3 graded to 3.0 g/kg day 7 | 0 g/kg/d | Higher lipid from day 5 (control no lipid) | Early enteral feed |
| van Goudoever 1995 | Birth weight < 2000 grams | 1.15 g/kg day 1 | 0 g/kg/d | No lipid | No enteral feeds |
| van Lingen 1992 | Preterm infants | Average 1.9 g/kg/d | 0 g/kg/d | Similar early lipid from day 2 | No enteral feeds |
| Vlaardingerbroek 2013 | Birth weight < 1500 grams | 3.6 g/kg day 2 to 6 | 2.4 g/kg day 2 to 6 | Similar early lipid from day 1 | No enteral feeds |
| Weiler 2006 | Infants at 24 to 32 weeks' gestation | 1.0 g/kg day 1 graded to 3.0 g/kg/d | 0 g/kg day 1, 1.0 g/kg day 2 graded to 3.0 g/kg/d | Similar lipid from day 3 | Factorial trial minimal enteral feeds from 3 days |
| Wilson 1997 | Birth weight < 1200 grams or 1200 to 1499 grams on mechanical ventilation | 0.5 g/kg day 1 graded to 3.5 g/kg day 7 | 0 g/kg day 1 to 2 graded to 2.5 g/kg day 7 | Higher early lipid intake from day 1 | Higher early enteral intake |
| Xie 2014 | Infants at < 34 weeks' gestation | 1.5 g/kg day 1 graded to 3.5 g/kg/d: graded by 1.0 g/kg/d | 1.5 g/kg day 1 graded to 3.5 g/kg/d: graded by 0.5 g/kg/d | Similar lipid from day 1 | Enteral feeds unclear |
| Outcome or subgroup title | No. of studies | No. of participants | Statistical method | Effect size |
| 1 Mortality to hospital discharge Show forest plot | 14 | 1407 | Risk Ratio (M‐H, Fixed, 95% CI) | 0.90 [0.69, 1.17] |
| 2 Neurodevelopmental disability Show forest plot | 2 | 201 | Risk Ratio (M‐H, Fixed, 95% CI) | 1.04 [0.48, 2.23] |
| 3 Postnatal growth failure at discharge (weight < 10th centile) Show forest plot | 3 | 203 | Risk Ratio (M‐H, Fixed, 95% CI) | 0.74 [0.56, 0.97] |
| 4 Postnatal growth failure at discharge (weight 2 SD below mean) Show forest plot | 1 | 114 | Risk Ratio (M‐H, Fixed, 95% CI) | 0.96 [0.66, 1.40] |
| 5 Postnatal growth failure post discharge Show forest plot | 1 | 111 | Risk Ratio (M‐H, Fixed, 95% CI) | 0.66 [0.33, 1.32] |
| 6 Days to regain birth weight Show forest plot | 13 | 950 | Mean Difference (IV, Fixed, 95% CI) | ‐1.14 [‐1.73, ‐0.56] |
| 7 Maximal weight loss (grams) Show forest plot | 3 | 235 | Mean Difference (IV, Fixed, 95% CI) | ‐22.71 [‐33.68, ‐11.74] |
| 8 Maximal weight loss % Show forest plot | 4 | 288 | Mean Difference (IV, Fixed, 95% CI) | ‐0.33 [‐1.61, 0.96] |
| 9 Weight gain g/kg/d Show forest plot | 7 | Mean Difference (IV, Fixed, 95% CI) | Subtotals only | |
| 9.1 To 1 month age | 4 | 373 | Mean Difference (IV, Fixed, 95% CI) | ‐1.50 [‐2.56, ‐0.44] |
| 9.2 To discharge | 4 | 291 | Mean Difference (IV, Fixed, 95% CI) | 0.76 [‐0.02, 1.54] |
| 10 Linear growth cm/week Show forest plot | 2 | Mean Difference (IV, Fixed, 95% CI) | Subtotals only | |
| 10.1 To 1 month age | 2 | 245 | Mean Difference (IV, Fixed, 95% CI) | ‐0.16 [‐0.26, ‐0.06] |
| 11 Head circumference growth cm/week Show forest plot | 7 | Mean Difference (IV, Fixed, 95% CI) | Subtotals only | |
| 11.1 To 1 month age | 4 | 476 | Mean Difference (IV, Fixed, 95% CI) | 0.01 [‐0.04, 0.06] |
| 11.2 To discharge | 4 | 315 | Mean Difference (IV, Fixed, 95% CI) | 0.09 [0.06, 0.13] |
| 12 Weight change z‐score Show forest plot | 2 | Mean Difference (IV, Fixed, 95% CI) | Subtotals only | |
| 12.1 To 1 month age | 1 | 96 | Mean Difference (IV, Fixed, 95% CI) | ‐0.20 [‐0.62, 0.22] |
| 12.2 To discharge | 2 | 207 | Mean Difference (IV, Fixed, 95% CI) | 0.01 [‐0.33, 0.36] |
| 12.3 Post discharge | 2 | 201 | Mean Difference (IV, Fixed, 95% CI) | 0.13 [‐0.26, 0.52] |
| 13 Head circumference change z‐score Show forest plot | 3 | Mean Difference (IV, Fixed, 95% CI) | Subtotals only | |
| 13.1 To 1 month age | 2 | 231 | Mean Difference (IV, Fixed, 95% CI) | 0.27 [0.08, 0.46] |
| 13.2 To discharge | 2 | 207 | Mean Difference (IV, Fixed, 95% CI) | 0.18 [‐0.15, 0.50] |
| 13.3 Post discharge | 2 | 201 | Mean Difference (IV, Fixed, 95% CI) | 0.25 [‐0.14, 0.64] |
| 14 Weight (grams) Show forest plot | 12 | Mean Difference (IV, Fixed, 95% CI) | Subtotals only | |
| 14.1 At 1 month age | 4 | 430 | Mean Difference (IV, Fixed, 95% CI) | ‐18.45 [‐68.42, 31.52] |
| 14.2 At discharge | 10 | 874 | Mean Difference (IV, Fixed, 95% CI) | 81.07 [36.59, 125.56] |
| 14.3 Post discharge | 2 | 211 | Mean Difference (IV, Fixed, 95% CI) | ‐11.07 [‐493.31, 471.18] |
| 15 Length (cm) Show forest plot | 8 | Mean Difference (IV, Fixed, 95% CI) | Subtotals only | |
| 15.1 At 1 month age | 3 | 295 | Mean Difference (IV, Fixed, 95% CI) | ‐0.41 [‐1.03, 0.20] |
| 15.2 At discharge | 6 | 553 | Mean Difference (IV, Fixed, 95% CI) | 0.57 [0.17, 0.98] |
| 15.3 Post discharge | 1 | 100 | Mean Difference (IV, Fixed, 95% CI) | ‐0.10 [‐1.81, 1.61] |
| 16 Head circumference (cm) Show forest plot | 11 | Mean Difference (IV, Fixed, 95% CI) | Subtotals only | |
| 16.1 At 1 month age | 4 | 430 | Mean Difference (IV, Fixed, 95% CI) | 0.19 [‐0.13, 0.51] |
| 16.2 At discharge | 9 | 834 | Mean Difference (IV, Fixed, 95% CI) | 0.08 [‐0.14, 0.29] |
| 16.3 Post discharge | 2 | 211 | Mean Difference (IV, Fixed, 95% CI) | ‐0.04 [‐0.52, 0.44] |
| 17 Weight z‐score Show forest plot | 3 | Mean Difference (IV, Fixed, 95% CI) | Subtotals only | |
| 17.1 Up at 1 month age | 1 | 135 | Mean Difference (IV, Fixed, 95% CI) | 0.14 [‐0.11, 0.39] |
| 17.2 At discharge | 3 | 352 | Mean Difference (IV, Fixed, 95% CI) | 0.16 [‐0.02, 0.33] |
| 18 Length z‐score Show forest plot | 2 | Mean Difference (IV, Fixed, 95% CI) | Subtotals only | |
| 18.1 At discharge | 2 | 228 | Mean Difference (IV, Fixed, 95% CI) | 0.12 [‐0.14, 0.38] |
| 19 Head circumference z‐score Show forest plot | 3 | Mean Difference (IV, Fixed, 95% CI) | Subtotals only | |
| 19.1 At 1 month age | 1 | 135 | Mean Difference (IV, Fixed, 95% CI) | 0.30 [0.01, 0.59] |
| 19.2 At discharge | 3 | 354 | Mean Difference (IV, Fixed, 95% CI) | 0.04 [‐0.18, 0.26] |
| 19.3 Post discharge | 1 | 100 | Mean Difference (IV, Fixed, 95% CI) | ‐0.01 [‐0.50, 0.48] |
| 20 Days to full enteral feeds Show forest plot | 11 | 778 | Mean Difference (IV, Fixed, 95% CI) | ‐0.19 [‐1.07, 0.70] |
| 21 Late‐onset sepsis Show forest plot | 15 | 1255 | Risk Ratio (M‐H, Fixed, 95% CI) | 0.96 [0.79, 1.18] |
| 22 Necrotising enterocolitis Show forest plot | 14 | 1301 | Risk Ratio (M‐H, Fixed, 95% CI) | 1.00 [0.68, 1.47] |
| 23 Chronic lung disease at ≥ 36 weeks' PMA Show forest plot | 10 | 819 | Risk Ratio (M‐H, Fixed, 95% CI) | 1.04 [0.89, 1.23] |
| 24 Patent ductus arteriosus Show forest plot | 7 | 607 | Risk Ratio (M‐H, Fixed, 95% CI) | 0.83 [0.67, 1.02] |
| 25 Intraventricular haemorrhage Show forest plot | 3 | 341 | Risk Ratio (M‐H, Fixed, 95% CI) | 1.12 [0.74, 1.69] |
| 26 Severe intraventricular haemorrhage Show forest plot | 11 | 904 | Risk Ratio (M‐H, Fixed, 95% CI) | 1.16 [0.74, 1.82] |
| 27 Periventricular leukomalacia Show forest plot | 7 | 720 | Risk Ratio (M‐H, Fixed, 95% CI) | 0.55 [0.24, 1.25] |
| 28 Retinopathy of prematurity Show forest plot | 4 | 269 | Risk Ratio (M‐H, Fixed, 95% CI) | 0.44 [0.21, 0.93] |
| 29 Severe retinopathy of prematurity (> stage 2 or treated) Show forest plot | 8 | 672 | Risk Ratio (M‐H, Fixed, 95% CI) | 0.96 [0.56, 1.63] |
| 30 Cerebral palsy Show forest plot | 2 | 122 | Risk Ratio (M‐H, Fixed, 95% CI) | 4.0 [0.89, 17.97] |
| 31 Developmental delay at ≥ 18 months Show forest plot | 3 | 301 | Risk Ratio (M‐H, Fixed, 95% CI) | 1.35 [0.52, 3.53] |
| 32 Blindness Show forest plot | 2 | 122 | Risk Ratio (M‐H, Fixed, 95% CI) | 2.0 [0.20, 19.91] |
| 33 Deafness Show forest plot | 1 | 90 | Risk Ratio (M‐H, Fixed, 95% CI) | 0.0 [0.0, 0.0] |
| 34 Bayley MDI at ≥ 18 months Show forest plot | 2 | 105 | Mean Difference (IV, Fixed, 95% CI) | ‐4.18 [‐8.53, 0.17] |
| 35 Bayley III score at ≥ 18 months Show forest plot | 1 | 100 | Mean Difference (IV, Fixed, 95% CI) | 3.0 [‐2.52, 8.52] |
| 36 Bayley PDI at ≥ 18 months Show forest plot | 1 | 32 | Mean Difference (IV, Fixed, 95% CI) | 3.00 [‐6.41, 12.41] |
| 37 Autism Show forest plot | 1 | 32 | Risk Ratio (M‐H, Fixed, 95% CI) | 1.0 [0.07, 14.64] |
| 38 Nitrogen balance Show forest plot | 6 | 153 | Mean Difference (IV, Fixed, 95% CI) | 505.20 [492.01, 518.39] |
| 38.1 AA 1.0 g/kg increase per day vs 0.5 g/kg increase per day | 1 | 37 | Mean Difference (IV, Fixed, 95% CI) | 31.77 [‐61.98, 125.51] |
| 38.2 AA 1.15 g/kg/day vs 0 g/kg/day | 1 | 15 | Mean Difference (IV, Fixed, 95% CI) | 120.00 [21.10, 218.90] |
| 38.3 AA 1.5 g/kg/day vs 0 g/kg/day | 1 | 23 | Mean Difference (IV, Fixed, 95% CI) | 223.0 [182.18, 263.82] |
| 38.4 AA 2.0‐2.5 g/kg/day vs 0‐0.4 g/kg/day | 2 | 49 | Mean Difference (IV, Fixed, 95% CI) | 280.75 [234.74, 326.76] |
| 38.5 AA 3.5 g/kg/day vs 0 g/kg/day | 1 | 29 | Mean Difference (IV, Fixed, 95% CI) | 587.9 [572.92, 602.88] |
| 39 Protein balance Show forest plot | 3 | 52 | Mean Difference (IV, Fixed, 95% CI) | 1.57 [1.47, 1.66] |
| 39.1 AA 1.5 g/kg/day vs 0 g/kg/day | 1 | 12 | Mean Difference (IV, Fixed, 95% CI) | 1.1 [0.16, 2.04] |
| 39.2 AA 2.3 g/kg/day vs 0 g/kg/day | 1 | 18 | Mean Difference (IV, Fixed, 95% CI) | 2.0 [1.82, 2.18] |
| 39.3 AA 3 g/kg/day vs 1 g/kg/day | 1 | 22 | Mean Difference (IV, Fixed, 95% CI) | 1.42 [1.31, 1.53] |
| 40 Abnormal serum ammonia Show forest plot | 2 | Risk Ratio (M‐H, Fixed, 95% CI) | Subtotals only | |
| 40.1 Ammonia > 69 μmol/L | 1 | 61 | Risk Ratio (M‐H, Fixed, 95% CI) | 13.42 [0.79, 228.24] |
| 40.2 Ammonia > 100 μmol/L | 2 | 105 | Risk Ratio (M‐H, Fixed, 95% CI) | 9.29 [0.52, 165.45] |
| 40.3 Ammonia > 122 μmol/L | 1 | 61 | Risk Ratio (M‐H, Fixed, 95% CI) | 3.10 [0.13, 73.16] |
| 41 Abnormal blood urea nitrogen (various criteria) Show forest plot | 7 | 688 | Risk Ratio (M‐H, Fixed, 95% CI) | 2.77 [2.13, 3.61] |
| 41.1 AA started 0.5 g/kg/day and graded to 3.0 g/kg/day vs 0 g/kg/day: high BUN criteria not reported | 1 | 85 | Risk Ratio (M‐H, Fixed, 95% CI) | 10.74 [1.45, 79.59] |
| 41.2 AA started 2 g/kg/day and graded to 3.5 g/kg/day vs started 1.0 g/kg/day and graded to 3.5 g/kg/day: BUN > 14.3 mmol/L | 1 | 42 | Risk Ratio (M‐H, Fixed, 95% CI) | 2.48 [0.28, 21.93] |
| 41.3 AA started 1.5 g/kg/day and graded to 3.5 g/kg/day vs started 1.0 g/kg/day and graded to 2.5 g/kg/day: BUN > 17.85 mmol/L | 1 | 122 | Risk Ratio (M‐H, Fixed, 95% CI) | 6.35 [0.34, 120.45] |
| 41.4 AA started 2 g/kg/day and graded to 4.0 g/kg/day vs started 0.5 g/kg/day and graded to 3.0 g/kg/day: BUN > 21.4 mmol/L | 1 | 61 | Risk Ratio (M‐H, Fixed, 95% CI) | 19.61 [1.19, 322.72] |
| 41.5 AA started 2.5 g/kg/day and graded to 4.0 g/kg/day vs started 1.5 g/kg/day and graded to 2.5 g/kg/day: BUN > 11.6 mmol/L | 1 | 114 | Risk Ratio (M‐H, Fixed, 95% CI) | 2.44 [1.47, 4.05] |
| 41.6 AA started 3.6 g/kg/day vs started 1.7 g/kg/day amino acids and graded to 2.7 g/kg/day: BUN > 10 mmol/L | 1 | 168 | Risk Ratio (M‐H, Fixed, 95% CI) | 2.73 [1.64, 4.54] |
| 41.7 AA 3.6 g/kg/day vs 2.4 g/kg/day: BUN > 10 mmol/L | 1 | 96 | Risk Ratio (M‐H, Fixed, 95% CI) | 2.09 [1.43, 3.04] |
| 42 Maximum blood urea nitrogen mmol/L Show forest plot | 2 | 159 | Mean Difference (IV, Fixed, 95% CI) | 4.48 [3.43, 5.53] |
| 43 Hyperglycaemia, plasma glucose > 8.3 mmol/L Show forest plot | 5 | 505 | Risk Ratio (M‐H, Fixed, 95% CI) | 0.69 [0.49, 0.96] |
| 44 Hyperglycaemia treated with insulin Show forest plot | 5 | 534 | Risk Ratio (M‐H, Fixed, 95% CI) | 1.24 [0.93, 1.66] |
| 45 Hypoglycaemia Show forest plot | 3 | 376 | Risk Ratio (M‐H, Fixed, 95% CI) | 1.17 [0.84, 1.63] |
| 46 Metabolic acidosis Show forest plot | 4 | 305 | Risk Ratio (M‐H, Fixed, 95% CI) | 2.05 [0.94, 4.47] |
| 47 Cholestasis Show forest plot | 5 | 616 | Risk Ratio (M‐H, Fixed, 95% CI) | 1.26 [0.86, 1.84] |
| 48 Hyperkalaemia Show forest plot | 1 | 61 | Risk Ratio (M‐H, Fixed, 95% CI) | 0.62 [0.16, 2.37] |
| 49 Discontinued PN owing to biochemical intolerance Show forest plot | 1 | 61 | Risk Ratio (M‐H, Fixed, 95% CI) | 13.42 [0.79, 228.24] |
| Outcome or subgroup title | No. of studies | No. of participants | Statistical method | Effect size |
| 1 Mortality before hospital discharge Show forest plot | 6 | 433 | Risk Ratio (M‐H, Fixed, 95% CI) | 0.78 [0.45, 1.36] |
| 1.1 Low amino acid intake (> 1 to ≤ 2 g/kg/day) | 1 | 42 | Risk Ratio (M‐H, Fixed, 95% CI) | 1.65 [0.16, 16.85] |
| 1.2 High amino acid intake (> 2 to ≤ 3 g/kg/day) | 3 | 263 | Risk Ratio (M‐H, Fixed, 95% CI) | 0.78 [0.35, 1.76] |
| 1.3 Very high amino acid intake (> 3 g/kg/day) | 2 | 128 | Risk Ratio (M‐H, Fixed, 95% CI) | 0.69 [0.30, 1.57] |
| 2 Neurodevelopmental disability Show forest plot | 2 | 201 | Risk Ratio (M‐H, Fixed, 95% CI) | 1.04 [0.48, 2.23] |
| 2.1 High amino acid intake (> 2 to ≤ 3 g/kg/day) | 1 | 111 | Risk Ratio (M‐H, Fixed, 95% CI) | 0.48 [0.18, 1.29] |
| 2.2 Very high amino acid intake (> 3 g/kg/day) | 1 | 90 | Risk Ratio (M‐H, Fixed, 95% CI) | 7.0 [0.90, 54.60] |
| 3 Postnatal growth failure at discharge Show forest plot | 3 | 203 | Risk Ratio (M‐H, Fixed, 95% CI) | 0.74 [0.56, 0.97] |
| 3.1 Low amino acid intake (> 1 to ≤ 2 g/kg/day) | 1 | 42 | Risk Ratio (M‐H, Fixed, 95% CI) | 0.95 [0.62, 1.46] |
| 3.2 High amino acid intake (> 2 to ≤ 3 g/kg/day) | 2 | 161 | Risk Ratio (M‐H, Fixed, 95% CI) | 0.67 [0.48, 0.94] |
| 4 Postnatal growth failure post discharge Show forest plot | 1 | 111 | Risk Ratio (M‐H, Fixed, 95% CI) | 0.66 [0.33, 1.32] |
| 4.1 High amino acid intake (> 2 to ≤ 3 g/kg/day) | 1 | 111 | Risk Ratio (M‐H, Fixed, 95% CI) | 0.66 [0.33, 1.32] |
| 5 Days to regain birth weight Show forest plot | 6 | 303 | Mean Difference (IV, Fixed, 95% CI) | 0.43 [‐0.51, 1.37] |
| 5.1 Very low amino acid intake (≤ 1 g/kg/day) | 1 | 27 | Mean Difference (IV, Fixed, 95% CI) | ‐1.45 [‐4.45, 1.56] |
| 5.2 Low amino acid intake (> 1 to ≤ 2 g/kg/day) | 2 | 59 | Mean Difference (IV, Fixed, 95% CI) | ‐1.40 [‐3.66, 0.85] |
| 5.3 High amino acid intake (> 2 to ≤ 3 g/kg/day) | 3 | 217 | Mean Difference (IV, Fixed, 95% CI) | 1.13 [0.02, 2.23] |
| 6 Maximal weight loss (grams) Show forest plot | 1 | 50 | Mean Difference (IV, Fixed, 95% CI) | 22.60 [‐7.25, 52.45] |
| 6.1 High amino acid intake (> 2 to ≤ 3 g/kg/day) | 1 | 50 | Mean Difference (IV, Fixed, 95% CI) | 22.60 [‐7.25, 52.45] |
| 7 Maximal weight loss % Show forest plot | 2 | 59 | Mean Difference (IV, Fixed, 95% CI) | ‐2.73 [‐5.71, 0.25] |
| 7.1 Low amino acid intake (> 1 to ≤ 2 g/kg/day) | 2 | 59 | Mean Difference (IV, Fixed, 95% CI) | ‐2.73 [‐5.71, 0.25] |
| 8 Weight gain g/kg/day to 1 month age Show forest plot | 2 | 219 | Mean Difference (IV, Fixed, 95% CI) | ‐3.17 [‐4.49, ‐1.84] |
| 8.1 High amino acid intake (> 2 to ≤ 3 g/kg/day) | 1 | 123 | Mean Difference (IV, Fixed, 95% CI) | ‐4.48 [‐6.17, ‐2.79] |
| 8.2 Very high amino acid intake (> 3 g/kg/day) | 1 | 96 | Mean Difference (IV, Fixed, 95% CI) | ‐1.10 [‐3.22, 1.02] |
| 9 Weight gain g/kg/day to discharge Show forest plot | 2 | 140 | Mean Difference (IV, Fixed, 95% CI) | 1.05 [‐0.55, 2.66] |
| 9.1 Low amino acid intake (> 1 to ≤ 2 g/kg/day) | 1 | 42 | Mean Difference (IV, Fixed, 95% CI) | 0.40 [‐1.69, 2.49] |
| 9.2 Very high amino acid intake (> 3 g/kg/day) | 1 | 98 | Mean Difference (IV, Fixed, 95% CI) | 2.0 [‐0.51, 4.51] |
| 10 Linear growth cm/week to 1 month age Show forest plot | 1 | 123 | Mean Difference (IV, Fixed, 95% CI) | ‐0.27 [‐0.40, ‐0.14] |
| 10.1 High amino acid intake (> 2 to ≤ 3 g/kg/day) | 1 | 123 | Mean Difference (IV, Fixed, 95% CI) | ‐0.27 [‐0.40, ‐0.14] |
| 11 Head circumference growth cm/week to 1 month age Show forest plot | 2 | 219 | Mean Difference (IV, Fixed, 95% CI) | ‐0.12 [‐0.21, ‐0.04] |
| 11.1 High amino acid intake (> 2 to ≤ 3 g/kg/day) | 1 | 123 | Mean Difference (IV, Fixed, 95% CI) | ‐0.38 [‐0.51, ‐0.24] |
| 11.2 Very high amino acid intake (> 3 g/kg/day) | 1 | 96 | Mean Difference (IV, Fixed, 95% CI) | 0.02 [‐0.09, 0.13] |
| 12 Head circumference growth cm/week to discharge Show forest plot | 1 | 96 | Mean Difference (IV, Fixed, 95% CI) | 0.03 [‐0.03, 0.09] |
| 12.1 Very high amino acid intake (> 3 g/kg/day) | 1 | 96 | Mean Difference (IV, Fixed, 95% CI) | 0.03 [‐0.03, 0.09] |
| 13 Weight change z‐score to 1 month age Show forest plot | 1 | 96 | Mean Difference (IV, Fixed, 95% CI) | ‐0.20 [‐0.62, 0.22] |
| 13.1 Very high amino acid intake (> 3 g/kg/day) | 1 | 96 | Mean Difference (IV, Fixed, 95% CI) | ‐0.20 [‐0.62, 0.22] |
| 14 Weight change z‐score to discharge Show forest plot | 2 | 207 | Mean Difference (IV, Fixed, 95% CI) | 0.01 [‐0.33, 0.36] |
| 14.1 High amino acid intake (> 2 to ≤ 3 g/kg/day) | 1 | 111 | Mean Difference (IV, Fixed, 95% CI) | ‐0.22 [‐0.70, 0.26] |
| 14.2 Very high amino acid intake (> 3 g/kg/day) | 1 | 96 | Mean Difference (IV, Fixed, 95% CI) | 0.27 [‐0.23, 0.77] |
| 15 Weight change z‐score post discharge Show forest plot | 2 | 201 | Mean Difference (IV, Fixed, 95% CI) | 0.13 [‐0.26, 0.52] |
| 15.1 High amino acid intake (> 2 to ≤ 3 g/kg/day) | 1 | 111 | Mean Difference (IV, Fixed, 95% CI) | ‐0.17 [‐0.75, 0.41] |
| 15.2 Very high amino acid intake (> 3 g/kg/day) | 1 | 90 | Mean Difference (IV, Fixed, 95% CI) | 0.38 [‐0.15, 0.91] |
| 16 Head circumference change z‐score to 1 month age Show forest plot | 1 | 96 | Mean Difference (IV, Fixed, 95% CI) | 0.0 [‐0.36, 0.36] |
| 16.1 Very high amino acid intake (> 3 g/kg/day) | 1 | 96 | Mean Difference (IV, Fixed, 95% CI) | 0.0 [‐0.36, 0.36] |
| 17 Head circumference change z‐score to discharge Show forest plot | 2 | 207 | Mean Difference (IV, Fixed, 95% CI) | 0.18 [‐0.15, 0.50] |
| 17.1 High amino acid intake (> 2 to ≤ 3 g/kg/day) | 1 | 111 | Mean Difference (IV, Fixed, 95% CI) | ‐0.15 [‐0.66, 0.36] |
| 17.2 Very high amino acid intake (> 3 g/kg/day) | 1 | 96 | Mean Difference (IV, Fixed, 95% CI) | 0.4 [‐0.02, 0.82] |
| 18 Head circumference change z‐score post discharge Show forest plot | 2 | 201 | Mean Difference (IV, Fixed, 95% CI) | 0.25 [‐0.14, 0.64] |
| 18.1 High amino acid intake (> 2 to ≤ 3 g/kg/day) | 1 | 111 | Mean Difference (IV, Fixed, 95% CI) | 0.03 [‐0.46, 0.52] |
| 18.2 Very high amino acid intake (> 3 g/kg/day) | 1 | 90 | Mean Difference (IV, Fixed, 95% CI) | 0.61 [‐0.02, 1.23] |
| 19 Days to full enteral feeds Show forest plot | 4 | 196 | Mean Difference (IV, Fixed, 95% CI) | ‐0.22 [‐1.60, 1.17] |
| 19.1 Very low amino acid intake (≤ 1 g/kg/day) | 1 | 27 | Mean Difference (IV, Fixed, 95% CI) | ‐0.91 [‐9.80, 7.98] |
| 19.2 High amino acid intake (> 2 to ≤ 3 g/kg/day) | 3 | 169 | Mean Difference (IV, Fixed, 95% CI) | ‐0.20 [‐1.60, 1.20] |
| 20 Late‐onset sepsis Show forest plot | 5 | 319 | Risk Ratio (M‐H, Fixed, 95% CI) | 0.94 [0.65, 1.38] |
| 20.1 Very low amino acid intake (≤ 1 g/kg/day) | 1 | 27 | Risk Ratio (M‐H, Fixed, 95% CI) | 1.08 [0.40, 2.88] |
| 20.2 High amino acid intake (> 2 to ≤ 3 g/kg/day) | 2 | 167 | Risk Ratio (M‐H, Fixed, 95% CI) | 0.84 [0.35, 2.00] |
| 20.3 Very high amino acid intake (> 3 g/kg/day) | 2 | 125 | Risk Ratio (M‐H, Fixed, 95% CI) | 0.96 [0.61, 1.52] |
| 21 Necrotising enterocolitis Show forest plot | 5 | 340 | Risk Ratio (M‐H, Fixed, 95% CI) | 0.96 [0.45, 2.03] |
| 21.1 Very low amino acid intake (≤ 1 g/kg/day) | 1 | 27 | Risk Ratio (M‐H, Fixed, 95% CI) | 0.0 [0.0, 0.0] |
| 21.2 High amino acid intake (> 2 to ≤ 3 g/kg/day) | 3 | 217 | Risk Ratio (M‐H, Fixed, 95% CI) | 1.26 [0.55, 2.92] |
| 21.3 Very high amino acid intake (> 3 g/kg/day) | 1 | 96 | Risk Ratio (M‐H, Fixed, 95% CI) | 0.26 [0.03, 2.25] |
| 22 Chronic lung disease at ≥ 36 weeks' PMA Show forest plot | 4 | 202 | Risk Ratio (M‐H, Fixed, 95% CI) | 1.32 [0.86, 2.02] |
| 22.1 Very low amino acid intake (≤ 1 g/kg/day) | 1 | 27 | Risk Ratio (M‐H, Fixed, 95% CI) | 1.08 [0.34, 3.44] |
| 22.2 High amino acid intake (> 2 to ≤ 3 g/kg/day) | 1 | 50 | Risk Ratio (M‐H, Fixed, 95% CI) | 1.0 [0.07, 15.12] |
| 22.3 Very high amino acid intake (> 3 g/kg/day) | 2 | 125 | Risk Ratio (M‐H, Fixed, 95% CI) | 1.39 [0.87, 2.21] |
| 23 Patent ductus arteriosus Show forest plot | 4 | 244 | Risk Ratio (M‐H, Fixed, 95% CI) | 0.73 [0.50, 1.07] |
| 23.1 Low amino acid intake (> 1 to ≤ 2 g/kg/day) | 1 | 42 | Risk Ratio (M‐H, Fixed, 95% CI) | 1.05 [0.63, 1.74] |
| 23.2 High amino acid intake (> 2 to ≤ 3 g/kg/day) | 2 | 173 | Risk Ratio (M‐H, Fixed, 95% CI) | 0.42 [0.20, 0.89] |
| 23.3 Very high amino acid intake (> 3 g/kg/day) | 1 | 29 | Risk Ratio (M‐H, Fixed, 95% CI) | 1.07 [0.50, 2.28] |
| 24 Intraventricular haemorrhage Show forest plot | 1 | 123 | Risk Ratio (M‐H, Fixed, 95% CI) | 1.26 [0.41, 3.91] |
| 24.1 High amino acid intake (> 2 to ≤ 3 g/kg/day) | 1 | 123 | Risk Ratio (M‐H, Fixed, 95% CI) | 1.26 [0.41, 3.91] |
| 25 Severe intraventricular haemorrhage Show forest plot | 5 | 261 | Risk Ratio (M‐H, Fixed, 95% CI) | 1.44 [0.66, 3.17] |
| 25.1 Low amino acid intake (> 1 to ≤ 2 g/kg/day) | 1 | 42 | Risk Ratio (M‐H, Fixed, 95% CI) | 3.30 [0.40, 27.13] |
| 25.2 High amino acid intake (> 2 to ≤ 3 g/kg/day) | 2 | 94 | Risk Ratio (M‐H, Fixed, 95% CI) | 2.0 [0.19, 20.67] |
| 25.3 Very high amino acid intake (> 3 g/kg/day) | 2 | 125 | Risk Ratio (M‐H, Fixed, 95% CI) | 1.06 [0.42, 2.69] |
| 26 Periventricular leukomalacia Show forest plot | 2 | 146 | Risk Ratio (M‐H, Fixed, 95% CI) | 0.33 [0.01, 7.81] |
| 26.1 High amino acid intake (> 2 to ≤ 3 g/kg/day) | 1 | 50 | Risk Ratio (M‐H, Fixed, 95% CI) | 0.33 [0.01, 7.81] |
| 26.2 Very high amino acid intake (> 3 g/kg/day) | 1 | 96 | Risk Ratio (M‐H, Fixed, 95% CI) | 0.0 [0.0, 0.0] |
| 27 Retinopathy of prematurity Show forest plot | 4 | 269 | Risk Ratio (M‐H, Fixed, 95% CI) | 0.44 [0.21, 0.93] |
| 27.1 Low amino acid intake (> 1 to ≤ 2 g/kg/day) | 1 | 42 | Risk Ratio (M‐H, Fixed, 95% CI) | 0.55 [0.10, 2.96] |
| 27.2 High amino acid intake (> 2 to ≤ 3 g/kg/day) | 2 | 198 | Risk Ratio (M‐H, Fixed, 95% CI) | 0.36 [0.14, 0.95] |
| 27.3 Very high amino acid intake (> 3 g/kg/day) | 1 | 29 | Risk Ratio (M‐H, Fixed, 95% CI) | 0.71 [0.14, 3.66] |
| 28 Severe retinopathy of prematurity (> stage 2 or treated) Show forest plot | 4 | 265 | Risk Ratio (M‐H, Fixed, 95% CI) | 0.47 [0.20, 1.11] |
| 28.1 Low amino acid intake (> 1 to ≤ 2 g/kg/day) | 1 | 42 | Risk Ratio (M‐H, Fixed, 95% CI) | 0.55 [0.10, 2.96] |
| 28.2 High amino acid intake (> 2 to ≤ 3 g/kg/day) | 2 | 125 | Risk Ratio (M‐H, Fixed, 95% CI) | 0.23 [0.06, 0.85] |
| 28.3 Very high amino acid intake (> 3 g/kg/day) | 1 | 98 | Risk Ratio (M‐H, Fixed, 95% CI) | 5.0 [0.25, 101.53] |
| 29 Cerebral palsy Show forest plot | 1 | 90 | Risk Ratio (M‐H, Fixed, 95% CI) | 5.0 [0.61, 41.11] |
| 29.1 Very high amino acid intake (> 3 g/kg/day) | 1 | 90 | Risk Ratio (M‐H, Fixed, 95% CI) | 5.0 [0.61, 41.11] |
| 30 Developmental delay at ≥ 18 months Show forest plot | 2 | 201 | Risk Ratio (M‐H, Fixed, 95% CI) | 1.04 [0.35, 3.11] |
| 30.1 High amino acid intake (> 2 to ≤ 3 g/kg/day) | 1 | 111 | Risk Ratio (M‐H, Fixed, 95% CI) | 0.84 [0.24, 2.98] |
| 30.2 Very high amino acid intake (> 3 g/kg/day) | 1 | 90 | Risk Ratio (M‐H, Fixed, 95% CI) | 2.0 [0.19, 21.28] |
| 31 Blindness Show forest plot | 1 | 90 | Risk Ratio (M‐H, Fixed, 95% CI) | 0.0 [0.0, 0.0] |
| 31.1 Very high amino acid intake (> 3 g/kg/day) | 1 | 90 | Risk Ratio (M‐H, Fixed, 95% CI) | 0.0 [0.0, 0.0] |
| 32 Deafness Show forest plot | 1 | 90 | Risk Ratio (M‐H, Fixed, 95% CI) | 0.0 [0.0, 0.0] |
| 32.1 Very high amino acid intake (> 3 g/kg/day) | 1 | 90 | Risk Ratio (M‐H, Fixed, 95% CI) | 0.0 [0.0, 0.0] |
| 33 Abnormal serum ammonia (> 100 μmol/L) Show forest plot | 1 | Risk Ratio (M‐H, Fixed, 95% CI) | Subtotals only | |
| 33.1 High amino acid intake (> 2 to ≤ 3 g/kg/day) | 1 | 44 | Risk Ratio (M‐H, Fixed, 95% CI) | 0.0 [0.0, 0.0] |
| 34 Abnormal blood urea nitrogen (various criteria) Show forest plot | 2 | 138 | Risk Ratio (M‐H, Fixed, 95% CI) | 2.11 [1.44, 3.08] |
| 34.1 Low amino acid intake (> 1 to ≤ 2 g/kg/day) | 1 | 42 | Risk Ratio (M‐H, Fixed, 95% CI) | 2.48 [0.28, 21.93] |
| 34.2 Very high amino acid intake (> 3 g/kg/day) | 1 | 96 | Risk Ratio (M‐H, Fixed, 95% CI) | 2.09 [1.43, 3.04] |
| 35 Hyperglycaemia, plasma glucose > 8.3 mmol/L Show forest plot | 1 | 42 | Risk Ratio (M‐H, Fixed, 95% CI) | 1.47 [0.85, 2.53] |
| 35.1 Low amino acid intake (> 1 to ≤ 2 g/kg/day) | 1 | 42 | Risk Ratio (M‐H, Fixed, 95% CI) | 1.47 [0.85, 2.53] |
| 36 Hyperglycaemia treated with insulin Show forest plot | 2 | 138 | Risk Ratio (M‐H, Fixed, 95% CI) | 1.84 [0.97, 3.49] |
| 36.1 Low amino acid intake (> 1 to ≤ 2 g/kg/day) | 1 | 42 | Risk Ratio (M‐H, Fixed, 95% CI) | 4.96 [1.26, 19.47] |
| 36.2 Very high amino acid intake (> 3 g/kg/day) | 1 | 96 | Risk Ratio (M‐H, Fixed, 95% CI) | 1.15 [0.54, 2.45] |
| 37 Hypoglycaemia Show forest plot | 1 | 123 | Risk Ratio (M‐H, Fixed, 95% CI) | 1.68 [0.83, 3.41] |
| 37.1 High amino acid intake (> 2 to ≤ 3 g/kg/day) | 1 | 123 | Risk Ratio (M‐H, Fixed, 95% CI) | 1.68 [0.83, 3.41] |
| 38 Metabolic acidosis Show forest plot | 1 | 15 | Risk Ratio (M‐H, Fixed, 95% CI) | 0.0 [0.0, 0.0] |
| 38.1 Low amino acid intake (> 1 to ≤ 2 g/kg/day) | 1 | 15 | Risk Ratio (M‐H, Fixed, 95% CI) | 0.0 [0.0, 0.0] |
| Outcome or subgroup title | No. of studies | No. of participants | Statistical method | Effect size |
| 1 Mortality before hospital discharge Show forest plot | 2 | 292 | Risk Ratio (M‐H, Fixed, 95% CI) | 0.94 [0.57, 1.55] |
| 1.1 High amino acid intake (> 3 to ≤ 4 g/kg/day) | 2 | 292 | Risk Ratio (M‐H, Fixed, 95% CI) | 0.94 [0.57, 1.55] |
| 2 Head circumference growth cm/week to 1 month Show forest plot | 1 | 135 | Mean Difference (IV, Fixed, 95% CI) | 0.13 [0.05, 0.20] |
| 2.1 High amino acid intake (> 3 to ≤ 4 g/kg/day) | 1 | 135 | Mean Difference (IV, Fixed, 95% CI) | 0.13 [0.05, 0.20] |
| 3 Head circumference change z‐score to 1 month Show forest plot | 1 | 135 | Mean Difference (IV, Fixed, 95% CI) | 0.37 [0.15, 0.59] |
| 3.1 High amino acid intake (> 3 to ≤ 4 g/kg/day) | 1 | 135 | Mean Difference (IV, Fixed, 95% CI) | 0.37 [0.15, 0.59] |
| 4 Days to regain birth weight Show forest plot | 1 | 114 | Mean Difference (IV, Fixed, 95% CI) | ‐3.60 [‐5.88, ‐1.32] |
| 4.1 High amino acid intake (> 3 to ≤ 4 g/kg/day) | 1 | 114 | Mean Difference (IV, Fixed, 95% CI) | ‐3.60 [‐5.88, ‐1.32] |
| 5 Days to full enteral feeds Show forest plot | 1 | 114 | Mean Difference (IV, Fixed, 95% CI) | 4.0 [1.01, 6.99] |
| 5.1 High amino acid intake (> 3 to ≤ 4 g/kg/day) | 1 | 114 | Mean Difference (IV, Fixed, 95% CI) | 4.0 [1.01, 6.99] |
| 6 Late‐onset sepsis Show forest plot | 1 | 127 | Risk Ratio (M‐H, Fixed, 95% CI) | 0.94 [0.63, 1.41] |
| 6.1 High amino acid intake (> 3 to ≤ 4 g/kg/day) | 1 | 127 | Risk Ratio (M‐H, Fixed, 95% CI) | 0.94 [0.63, 1.41] |
| 7 Necrotising enterocolitis Show forest plot | 2 | 241 | Risk Ratio (M‐H, Fixed, 95% CI) | 0.76 [0.37, 1.59] |
| 7.1 High amino acid intake (> 3 to ≤ 4 g/kg/day) | 2 | 241 | Risk Ratio (M‐H, Fixed, 95% CI) | 0.76 [0.37, 1.59] |
| 8 Chronic lung disease at ≥ 36 weeks' PMA Show forest plot | 2 | 241 | Risk Ratio (M‐H, Fixed, 95% CI) | 1.10 [0.92, 1.31] |
| 8.1 High amino acid intake (> 3 to ≤ 4 g/kg/day) | 2 | 241 | Risk Ratio (M‐H, Fixed, 95% CI) | 1.10 [0.92, 1.31] |
| 9 Patent ductus arteriosus Show forest plot | 1 | 127 | Risk Ratio (M‐H, Fixed, 95% CI) | 1.02 [0.66, 1.56] |
| 9.1 High amino acid intake (> 3 to ≤ 4 g/kg/day) | 1 | 127 | Risk Ratio (M‐H, Fixed, 95% CI) | 1.02 [0.66, 1.56] |
| 10 Severe intraventricular haemorrhage Show forest plot | 2 | 241 | Risk Ratio (M‐H, Fixed, 95% CI) | 1.16 [0.51, 2.63] |
| 10.1 High amino acid intake (> 3 to ≤ 4 g/kg/day) | 2 | 241 | Risk Ratio (M‐H, Fixed, 95% CI) | 1.16 [0.51, 2.63] |
| 11 Periventricular leukomalacia Show forest plot | 1 | 127 | Risk Ratio (M‐H, Fixed, 95% CI) | 2.03 [0.39, 10.70] |
| 11.1 High amino acid intake (> 3 to ≤ 4 g/kg/day) | 1 | 127 | Risk Ratio (M‐H, Fixed, 95% CI) | 2.03 [0.39, 10.70] |
| 12 Severe retinopathy of prematurity (> stage 2 or treated) Show forest plot | 1 | 127 | Risk Ratio (M‐H, Fixed, 95% CI) | 2.71 [0.75, 9.75] |
| 12.1 High amino acid intake (> 3 to ≤ 4 g/kg/day) | 1 | 127 | Risk Ratio (M‐H, Fixed, 95% CI) | 2.71 [0.75, 9.75] |
| 13 Hyperglycaemia treated with insulin Show forest plot | 1 | 114 | Risk Ratio (M‐H, Fixed, 95% CI) | 1.69 [1.12, 2.53] |
| 13.1 High amino acid intake (> 3 to ≤ 4 g/kg/day) | 1 | 114 | Risk Ratio (M‐H, Fixed, 95% CI) | 1.69 [1.12, 2.53] |
| 14 Cholestasis Show forest plot | 2 | 241 | Risk Ratio (M‐H, Fixed, 95% CI) | 1.21 [0.76, 1.94] |
| 14.1 High amino acid intake (> 3 to ≤ 4 g/kg/day) | 2 | 241 | Risk Ratio (M‐H, Fixed, 95% CI) | 1.21 [0.76, 1.94] |
| Outcome or subgroup title | No. of studies | No. of participants | Statistical method | Effect size |
| 1 Mortality to hospital discharge Show forest plot | 5 | 567 | Risk Ratio (M‐H, Fixed, 95% CI) | 0.97 [0.66, 1.42] |
| 1.1 Very low amino acid intake (≤ 1 g/kg/day) | 1 | 85 | Risk Ratio (M‐H, Fixed, 95% CI) | 1.14 [0.72, 1.81] |
| 1.2 Low amino acid intake (> 1 to ≤ 2 g/kg/day) | 2 | 183 | Risk Ratio (M‐H, Fixed, 95% CI) | 1.61 [0.56, 4.57] |
| 1.3 High amino acid intake (> 2 to ≤ 3 g/kg/day) | 1 | 131 | Risk Ratio (M‐H, Fixed, 95% CI) | 0.84 [0.24, 2.98] |
| 1.4 Very high amino acid intake (> 3 g/kg/day) | 1 | 168 | Risk Ratio (M‐H, Fixed, 95% CI) | 0.45 [0.17, 1.25] |
| 2 Days to regain birth weight Show forest plot | 5 | 496 | Mean Difference (IV, Fixed, 95% CI) | ‐1.86 [‐2.79, ‐0.93] |
| 2.1 Very low amino acid intake (≤ 1 g/kg/day) | 1 | 85 | Mean Difference (IV, Fixed, 95% CI) | ‐1.0 [‐5.03, 3.03] |
| 2.2 Low amino acid intake (> 1 to ≤ 2 g/kg/day) | 1 | 115 | Mean Difference (IV, Fixed, 95% CI) | ‐1.33 [‐3.74, 1.08] |
| 2.3 High amino acid intake (> 2 to ≤ 3 g/kg/day) | 3 | 296 | Mean Difference (IV, Fixed, 95% CI) | ‐2.02 [‐3.06, ‐0.97] |
| 3 Maximal weight loss (grams) Show forest plot | 2 | 185 | Mean Difference (IV, Fixed, 95% CI) | ‐29.79 [‐41.58, ‐17.99] |
| 3.1 High amino acid intake (> 2 to ≤ 3 g/kg/day) | 2 | 185 | Mean Difference (IV, Fixed, 95% CI) | ‐29.79 [‐41.58, ‐17.99] |
| 4 Maximal weight loss % Show forest plot | 2 | 229 | Mean Difference (IV, Fixed, 95% CI) | 0.22 [‐1.20, 1.64] |
| 4.1 Low amino acid intake (> 1 to ≤ 2 g/kg/day) | 1 | 115 | Mean Difference (IV, Fixed, 95% CI) | 0.51 [‐1.66, 2.68] |
| 4.2 High amino acid intake (> 2 to ≤ 3 g/kg/day) | 1 | 114 | Mean Difference (IV, Fixed, 95% CI) | 0.0 [‐1.87, 1.87] |
| 5 Weight gain g/kg/day up to 1 month age Show forest plot | 2 | 154 | Mean Difference (IV, Fixed, 95% CI) | 1.48 [‐0.29, 3.25] |
| 5.1 Low amino acid intake (> 1 to ≤ 2 g/kg/day) | 2 | 154 | Mean Difference (IV, Fixed, 95% CI) | 1.48 [‐0.29, 3.25] |
| 6 Weight gain g/kg/day to discharge Show forest plot | 1 | 114 | Mean Difference (IV, Fixed, 95% CI) | 0.60 [‐0.34, 1.54] |
| 6.1 High amino acid intake (> 2 to ≤ 3 g/kg/day) | 1 | 114 | Mean Difference (IV, Fixed, 95% CI) | 0.60 [‐0.34, 1.54] |
| 7 Linear growth cm/week up to 1 month age Show forest plot | 1 | 122 | Mean Difference (IV, Fixed, 95% CI) | 0.0 [‐0.15, 0.15] |
| 7.1 Low amino acid intake (> 1 to ≤ 2 g/kg/day) | 1 | 122 | Mean Difference (IV, Fixed, 95% CI) | 0.0 [‐0.15, 0.15] |
| 8 Head circumference growth cm/week up to 1 month age Show forest plot | 1 | Mean Difference (IV, Fixed, 95% CI) | Subtotals only | |
| 8.1 Low amino acid intake (> 1 to ≤ 2 g/kg/day) | 1 | 122 | Mean Difference (IV, Fixed, 95% CI) | 0.0 [‐0.12, 0.12] |
| 9 Head circumference growth cm/week to discharge Show forest plot | 2 | 182 | Mean Difference (IV, Fixed, 95% CI) | 0.11 [0.07, 0.15] |
| 9.1 High amino acid intake (> 2 to ≤ 3 g/kg/day) | 2 | 182 | Mean Difference (IV, Fixed, 95% CI) | 0.11 [0.07, 0.15] |
| 10 Days to full enteral feeds Show forest plot | 5 | 431 | Mean Difference (IV, Fixed, 95% CI) | ‐1.08 [‐2.42, 0.25] |
| 10.1 Low amino acid intake (> 1 to ≤ 2 g/kg/day) | 2 | 147 | Mean Difference (IV, Fixed, 95% CI) | 2.47 [‐1.73, 6.68] |
| 10.2 High amino acid intake (> 2 to ≤ 3 g/kg/day) | 2 | 158 | Mean Difference (IV, Fixed, 95% CI) | ‐3.32 [‐5.39, ‐1.25] |
| 10.3 Very high amino acid intake (> 3 g/kg/day) | 1 | 126 | Mean Difference (IV, Fixed, 95% CI) | 0.09 [‐1.83, 2.01] |
| 11 Late‐onset sepsis Show forest plot | 8 | 772 | Risk Ratio (M‐H, Fixed, 95% CI) | 0.96 [0.72, 1.29] |
| 11.1 Very low amino acid intake (≤ 1 g/kg/day) | 2 | 106 | Risk Ratio (M‐H, Fixed, 95% CI) | 0.72 [0.27, 1.95] |
| 11.2 Low amino acid intake (> 1 to ≤ 2 g/kg/day) | 3 | 288 | Risk Ratio (M‐H, Fixed, 95% CI) | 1.10 [0.67, 1.80] |
| 11.3 High amino acid intake (> 2 to ≤ 3 g/kg/day) | 2 | 210 | Risk Ratio (M‐H, Fixed, 95% CI) | 1.23 [0.56, 2.69] |
| 11.4 Very high amino acid intake (> 3 g/kg/day) | 1 | 168 | Risk Ratio (M‐H, Fixed, 95% CI) | 0.82 [0.52, 1.30] |
| 12 Necrotising enterocolitis Show forest plot | 6 | 683 | Risk Ratio (M‐H, Fixed, 95% CI) | 1.14 [0.63, 2.07] |
| 12.1 Low amino acid intake (> 1 to ≤ 2 g/kg/day) | 3 | 288 | Risk Ratio (M‐H, Fixed, 95% CI) | 1.67 [0.72, 3.87] |
| 12.2 High amino acid intake (> 2 to ≤ 3 g/kg/day) | 2 | 227 | Risk Ratio (M‐H, Fixed, 95% CI) | 0.82 [0.19, 3.47] |
| 12.3 Very high amino acid intake (> 3 g/kg/day) | 1 | 168 | Risk Ratio (M‐H, Fixed, 95% CI) | 0.71 [0.24, 2.16] |
| 13 Chronic lung disease at ≥ 36 weeks' PMA Show forest plot | 4 | 376 | Risk Ratio (M‐H, Fixed, 95% CI) | 0.81 [0.55, 1.19] |
| 13.1 Low amino acid intake (> 1 to ≤ 2 g/kg/day) | 2 | 166 | Risk Ratio (M‐H, Fixed, 95% CI) | 1.05 [0.66, 1.69] |
| 13.2 High amino acid intake (> 2 to ≤ 3 g/kg/day) | 2 | 210 | Risk Ratio (M‐H, Fixed, 95% CI) | 0.56 [0.29, 1.08] |
| 14 Patent ductus arteriosus Show forest plot | 2 | 236 | Risk Ratio (M‐H, Fixed, 95% CI) | 0.81 [0.60, 1.10] |
| 14.1 Low amino acid intake (> 1 to ≤ 2 g/kg/day) | 1 | 122 | Risk Ratio (M‐H, Fixed, 95% CI) | 0.65 [0.40, 1.07] |
| 14.2 High amino acid intake (> 2 to ≤ 3 g/kg/day) | 1 | 114 | Risk Ratio (M‐H, Fixed, 95% CI) | 0.96 [0.65, 1.42] |
| 15 Intraventricular haemorrhage Show forest plot | 2 | 218 | Risk Ratio (M‐H, Fixed, 95% CI) | 1.09 [0.70, 1.70] |
| 15.1 Low amino acid intake (> 1 to ≤ 2 g/kg/day) | 1 | 122 | Risk Ratio (M‐H, Fixed, 95% CI) | 1.05 [0.64, 1.73] |
| 15.2 High amino acid intake (> 2 to ≤ 3 g/kg/day) | 1 | 96 | Risk Ratio (M‐H, Fixed, 95% CI) | 1.22 [0.47, 3.13] |
| 16 Severe intraventricular haemorrhage Show forest plot | 4 | 402 | Risk Ratio (M‐H, Fixed, 95% CI) | 0.96 [0.46, 2.02] |
| 16.1 Low amino acid intake (> 1 to ≤ 2 g/kg/day) | 3 | 288 | Risk Ratio (M‐H, Fixed, 95% CI) | 1.04 [0.47, 2.29] |
| 16.2 High amino acid intake (> 2 to ≤ 3 g/kg/day) | 1 | 114 | Risk Ratio (M‐H, Fixed, 95% CI) | 0.52 [0.05, 5.55] |
| 17 Periventricular leukomalacia Show forest plot | 4 | 447 | Risk Ratio (M‐H, Fixed, 95% CI) | 0.32 [0.10, 1.00] |
| 17.1 Low amino acid intake (> 1 to ≤ 2 g/kg/day) | 2 | 237 | Risk Ratio (M‐H, Fixed, 95% CI) | 0.14 [0.03, 0.79] |
| 17.2 High amino acid intake (> 2 to ≤ 3 g/kg/day) | 2 | 210 | Risk Ratio (M‐H, Fixed, 95% CI) | 1.37 [0.20, 9.33] |
| 18 Severe retinopathy of prematurity (> stage 2 or treated) Show forest plot | 3 | 280 | Risk Ratio (M‐H, Fixed, 95% CI) | 1.24 [0.49, 3.09] |
| 18.1 Low amino acid intake (> 1 to ≤ 2 g/kg/day) | 2 | 166 | Risk Ratio (M‐H, Fixed, 95% CI) | 1.24 [0.49, 3.09] |
| 18.2 High amino acid intake (> 2 to ≤ 3 g/kg/day) | 1 | 114 | Risk Ratio (M‐H, Fixed, 95% CI) | 0.0 [0.0, 0.0] |
| 19 Cerebral palsy Show forest plot | 1 | 32 | Risk Ratio (M‐H, Fixed, 95% CI) | 3.0 [0.35, 25.87] |
| 19.1 Low amino acid intake (> 1 to ≤ 2 g/kg/day) | 1 | 32 | Risk Ratio (M‐H, Fixed, 95% CI) | 3.0 [0.35, 25.87] |
| 20 Developmental delay at ≥ 18 months Show forest plot | 1 | 100 | Risk Ratio (M‐H, Fixed, 95% CI) | 3.25 [0.35, 30.19] |
| 20.1 High amino acid intake (> 2 to ≤ 3 g/kg/day) | 1 | 100 | Risk Ratio (M‐H, Fixed, 95% CI) | 3.25 [0.35, 30.19] |
| 21 Blindness Show forest plot | 1 | 32 | Risk Ratio (M‐H, Fixed, 95% CI) | 2.0 [0.20, 19.91] |
| 21.1 Low amino acid intake (> 1 to ≤ 2 g/kg/day) | 1 | 32 | Risk Ratio (M‐H, Fixed, 95% CI) | 2.0 [0.20, 19.91] |
| 22 Abnormal serum ammonia Show forest plot | 1 | 61 | Risk Ratio (M‐H, Fixed, 95% CI) | 3.10 [0.13, 73.16] |
| 22.1 Low amino acid intake (> 1 to ≤ 2 g/kg/day) | 1 | 61 | Risk Ratio (M‐H, Fixed, 95% CI) | 3.10 [0.13, 73.16] |
| 23 Abnormal blood urea nitrogen (various criteria) Show forest plot | 5 | 550 | Risk Ratio (M‐H, Fixed, 95% CI) | 3.19 [2.24, 4.53] |
| 23.1 Very low amino acid intake (≤ 1 g/kg/day) | 1 | 85 | Risk Ratio (M‐H, Fixed, 95% CI) | 10.74 [1.45, 79.59] |
| 23.2 Low amino acid intake (> 1 to ≤ 2 g/kg/day) | 2 | 183 | Risk Ratio (M‐H, Fixed, 95% CI) | 12.29 [1.66, 90.79] |
| 23.3 High amino acid intake (> 2 to ≤ 3 g/kg/day) | 1 | 114 | Risk Ratio (M‐H, Fixed, 95% CI) | 2.44 [1.47, 4.05] |
| 23.4 Very high amino acid intake (> 3 g/kg/day) | 1 | 168 | Risk Ratio (M‐H, Fixed, 95% CI) | 2.73 [1.64, 4.54] |
| 24 Hyperglycaemia, plasma glucose > 8.3 mmol/L Show forest plot | 4 | 463 | Risk Ratio (M‐H, Fixed, 95% CI) | 0.54 [0.36, 0.82] |
| 24.1 Very low amino acid intake (≤ 1 g/kg/day) | 1 | 85 | Risk Ratio (M‐H, Fixed, 95% CI) | 1.95 [0.18, 20.74] |
| 24.2 High amino acid intake (> 2 to ≤ 3 g/kg/day) | 2 | 210 | Risk Ratio (M‐H, Fixed, 95% CI) | 0.51 [0.30, 0.87] |
| 24.3 Very high amino acid intake (> 3 g/kg/day) | 1 | 168 | Risk Ratio (M‐H, Fixed, 95% CI) | 0.53 [0.26, 1.06] |
| 25 Hyperglycaemia treated with insulin Show forest plot | 2 | 282 | Risk Ratio (M‐H, Fixed, 95% CI) | 0.62 [0.35, 1.08] |
| 25.1 High amino acid intake (> 2 to ≤ 3 g/kg/day) | 1 | 114 | Risk Ratio (M‐H, Fixed, 95% CI) | 0.35 [0.04, 3.22] |
| 25.2 Very high amino acid intake (> 3 g/kg/day) | 1 | 168 | Risk Ratio (M‐H, Fixed, 95% CI) | 0.65 [0.37, 1.16] |
| 26 Hypoglycaemia Show forest plot | 2 | 253 | Risk Ratio (M‐H, Fixed, 95% CI) | 1.03 [0.70, 1.50] |
| 26.1 Very low amino acid intake (≤ 1 g/kg/day) | 1 | 85 | Risk Ratio (M‐H, Fixed, 95% CI) | 1.22 [0.35, 4.24] |
| 26.2 Very high amino acid intake (> 3 g/kg/day) | 1 | 168 | Risk Ratio (M‐H, Fixed, 95% CI) | 1.0 [0.67, 1.49] |
| 27 Metabolic acidosis Show forest plot | 2 | 253 | Risk Ratio (M‐H, Fixed, 95% CI) | 2.05 [0.94, 4.47] |
| 27.1 Very low amino acid intake (≤ 1 g/kg/day) | 1 | 85 | Risk Ratio (M‐H, Fixed, 95% CI) | 8.80 [0.49, 158.47] |
| 27.2 Very high amino acid intake (> 3 g/kg/day) | 1 | 168 | Risk Ratio (M‐H, Fixed, 95% CI) | 1.63 [0.71, 3.72] |
| 28 Cholestasis Show forest plot | 3 | 375 | Risk Ratio (M‐H, Fixed, 95% CI) | 1.34 [0.71, 2.50] |
| 28.1 Very low amino acid intake (≤ 1 g/kg/day) | 1 | 85 | Risk Ratio (M‐H, Fixed, 95% CI) | 12.70 [0.74, 218.66] |
| 28.2 Low amino acid intake (> 1 to ≤ 2 g/kg/day) | 1 | 122 | Risk Ratio (M‐H, Fixed, 95% CI) | 1.45 [0.50, 4.18] |
| 28.3 Very high amino acid intake (> 3 g/kg/day) | 1 | 168 | Risk Ratio (M‐H, Fixed, 95% CI) | 0.7 [0.28, 1.75] |
| Outcome or subgroup title | No. of studies | No. of participants | Statistical method | Effect size |
| 1 Mortality before hospital discharge Show forest plot | 5 | 567 | Risk Ratio (M‐H, Fixed, 95% CI) | 0.97 [0.66, 1.42] |
| 2 Days to regain birth weight Show forest plot | 5 | 496 | Mean Difference (IV, Fixed, 95% CI) | ‐1.86 [‐2.79, ‐0.93] |
| 2.1 Low amino acid intake (> 2 to ≤ 3 g/kg/day) | 1 | 85 | Mean Difference (IV, Fixed, 95% CI) | ‐1.0 [‐5.03, 3.03] |
| 2.2 High amino acid intake (> 3 to ≤ 4 g/kg/day) | 4 | 411 | Mean Difference (IV, Fixed, 95% CI) | ‐1.91 [‐2.87, ‐0.95] |
| 3 Maximal weight loss (grams) Show forest plot | 2 | 185 | Mean Difference (IV, Fixed, 95% CI) | ‐29.79 [‐41.58, ‐17.99] |
| 3.1 High amino acid intake (> 3 to ≤ 4 g/kg/day) | 2 | 185 | Mean Difference (IV, Fixed, 95% CI) | ‐29.79 [‐41.58, ‐17.99] |
| 4 Maximal weight loss % Show forest plot | 2 | 229 | Mean Difference (IV, Fixed, 95% CI) | 0.22 [‐1.20, 1.64] |
| 4.1 High amino acid intake (> 3 to ≤ 4 g/kg/day) | 2 | 229 | Mean Difference (IV, Fixed, 95% CI) | 0.22 [‐1.20, 1.64] |
| 5 Weight gain g/kg/day up to 1 month Show forest plot | 2 | 154 | Mean Difference (IV, Fixed, 95% CI) | 1.48 [‐0.29, 3.25] |
| 5.1 High amino acid intake (> 3 to ≤ 4 g/kg/day) | 2 | 154 | Mean Difference (IV, Fixed, 95% CI) | 1.48 [‐0.29, 3.25] |
| 6 Weight gain g/kg/day to discharge Show forest plot | 1 | 114 | Mean Difference (IV, Fixed, 95% CI) | 0.60 [‐0.34, 1.54] |
| 6.1 High amino acid intake (> 3 to ≤ 4 g/kg/day) | 1 | 114 | Mean Difference (IV, Fixed, 95% CI) | 0.60 [‐0.34, 1.54] |
| 7 Linear growth cm/week up to 1 month Show forest plot | 1 | 122 | Mean Difference (IV, Fixed, 95% CI) | 0.0 [‐0.15, 0.15] |
| 7.1 High amino acid intake (> 3 to ≤ 4 g/kg/day) | 1 | 122 | Mean Difference (IV, Fixed, 95% CI) | 0.0 [‐0.15, 0.15] |
| 8 Head circumference growth cm/week up to 1 month Show forest plot | 1 | 122 | Mean Difference (IV, Fixed, 95% CI) | 0.0 [‐0.12, 0.12] |
| 8.1 High amino acid intake (> 3 to ≤ 4 g/kg/day) | 1 | 122 | Mean Difference (IV, Fixed, 95% CI) | 0.0 [‐0.12, 0.12] |
| 9 Head circumference growth cm/week to discharge Show forest plot | 2 | 182 | Mean Difference (IV, Fixed, 95% CI) | 0.11 [0.07, 0.15] |
| 9.1 High amino acid intake (> 3 to ≤ 4 g/kg/day) | 2 | 182 | Mean Difference (IV, Fixed, 95% CI) | 0.11 [0.07, 0.15] |
| 10 Days to full enteral feeds Show forest plot | 5 | 431 | Mean Difference (IV, Fixed, 95% CI) | ‐1.08 [‐2.42, 0.25] |
| 10.1 High amino acid intake (> 3 to ≤ 4 g/kg/day) | 5 | 431 | Mean Difference (IV, Fixed, 95% CI) | ‐1.08 [‐2.42, 0.25] |
| 11 Late‐onset sepsis Show forest plot | 8 | 772 | Risk Ratio (M‐H, Fixed, 95% CI) | 0.96 [0.72, 1.29] |
| 11.1 Low amino acid intake (> 2 to ≤ 3 g/kg/day) | 2 | 106 | Risk Ratio (M‐H, Fixed, 95% CI) | 0.72 [0.27, 1.95] |
| 11.2 High amino acid intake (> 3 to ≤ 4 g/kg/day) | 6 | 666 | Risk Ratio (M‐H, Fixed, 95% CI) | 0.99 [0.73, 1.35] |
| 12 Necrotising enterocolitis Show forest plot | 6 | 683 | Risk Ratio (M‐H, Fixed, 95% CI) | 1.14 [0.63, 2.07] |
| 12.1 High amino acid intake (> 3 to ≤ 4 g/kg/day) | 6 | 683 | Risk Ratio (M‐H, Fixed, 95% CI) | 1.14 [0.63, 2.07] |
| 13 Chronic lung disease at ≥ 36 weeks' PMA Show forest plot | 4 | 376 | Risk Ratio (M‐H, Fixed, 95% CI) | 0.81 [0.55, 1.19] |
| 13.1 High amino acid intake (> 3 to ≤ 4 g/kg/day) | 4 | 376 | Risk Ratio (M‐H, Fixed, 95% CI) | 0.81 [0.55, 1.19] |
| 14 Patent ductus arteriosus Show forest plot | 2 | 236 | Risk Ratio (M‐H, Fixed, 95% CI) | 0.81 [0.60, 1.10] |
| 14.1 High amino acid intake (> 3 to ≤ 4 g/kg/day) | 2 | 236 | Risk Ratio (M‐H, Fixed, 95% CI) | 0.81 [0.60, 1.10] |
| 15 Intraventricular haemorrhage Show forest plot | 2 | 218 | Risk Ratio (M‐H, Fixed, 95% CI) | 1.09 [0.70, 1.70] |
| 15.1 High amino acid intake (> 3 to ≤ 4 g/kg/day) | 2 | 218 | Risk Ratio (M‐H, Fixed, 95% CI) | 1.09 [0.70, 1.70] |
| 16 Severe intraventricular haemorrhage Show forest plot | 4 | 402 | Risk Ratio (M‐H, Fixed, 95% CI) | 0.96 [0.46, 2.02] |
| 16.1 High amino acid intake (> 3 to ≤ 4 g/kg/day) | 4 | 402 | Risk Ratio (M‐H, Fixed, 95% CI) | 0.96 [0.46, 2.02] |
| 17 Periventricular leukomalacia Show forest plot | 4 | 447 | Risk Ratio (M‐H, Fixed, 95% CI) | 0.32 [0.10, 1.00] |
| 17.1 High amino acid intake (> 3 to ≤ 4 g/kg/day) | 4 | 447 | Risk Ratio (M‐H, Fixed, 95% CI) | 0.32 [0.10, 1.00] |
| 18 Severe retinopathy of prematurity (> stage 2 or treated) Show forest plot | 3 | 280 | Risk Ratio (M‐H, Fixed, 95% CI) | 1.24 [0.49, 3.09] |
| 18.1 High amino acid intake (> 3 to ≤ 4 g/kg/day) | 3 | 280 | Risk Ratio (M‐H, Fixed, 95% CI) | 1.24 [0.49, 3.09] |
| 19 Cerebral palsy Show forest plot | 1 | 32 | Risk Ratio (M‐H, Fixed, 95% CI) | 3.0 [0.35, 25.87] |
| 19.1 High amino acid intake (> 3 to ≤ 4 g/kg/day) | 1 | 32 | Risk Ratio (M‐H, Fixed, 95% CI) | 3.0 [0.35, 25.87] |
| 20 Developmental delay at ≥ 18 months Show forest plot | 1 | 100 | Risk Ratio (M‐H, Fixed, 95% CI) | 3.25 [0.35, 30.19] |
| 20.1 High amino acid intake (> 3 to ≤ 4 g/kg/day) | 1 | 100 | Risk Ratio (M‐H, Fixed, 95% CI) | 3.25 [0.35, 30.19] |
| 21 Blindness Show forest plot | 1 | 32 | Risk Ratio (M‐H, Fixed, 95% CI) | 2.0 [0.20, 19.91] |
| 21.1 High amino acid intake (> 3 to ≤ 4 g/kg/day) | 1 | 32 | Risk Ratio (M‐H, Fixed, 95% CI) | 2.0 [0.20, 19.91] |
| 22 Abnormal serum ammonia Show forest plot | 1 | Risk Ratio (M‐H, Fixed, 95% CI) | Subtotals only | |
| 22.1 High amino acid intake (> 3 to ≤ 4 g/kg/day) | 1 | 61 | Risk Ratio (M‐H, Fixed, 95% CI) | 3.10 [0.13, 73.16] |
| 23 Abnormal blood urea nitrogen (various criteria) Show forest plot | 5 | 550 | Risk Ratio (M‐H, Fixed, 95% CI) | 3.19 [2.24, 4.53] |
| 23.1 Low amino acid intake (> 2 to ≤ 3 g/kg/day) | 1 | 85 | Risk Ratio (M‐H, Fixed, 95% CI) | 10.74 [1.45, 79.59] |
| 23.2 High amino acid intake (> 3 to ≤ 4 g/kg/day) | 4 | 465 | Risk Ratio (M‐H, Fixed, 95% CI) | 2.93 [2.05, 4.18] |
| 24 Hyperglycaemia, plasma glucose > 8.3 mmol/L Show forest plot | 4 | 463 | Risk Ratio (M‐H, Fixed, 95% CI) | 0.54 [0.36, 0.82] |
| 24.1 Low amino acid intake (> 2 to ≤ 3 g/kg/day) | 1 | 85 | Risk Ratio (M‐H, Fixed, 95% CI) | 1.95 [0.18, 20.74] |
| 24.2 High amino acid intake (> 3 to ≤ 4 g/kg/day) | 3 | 378 | Risk Ratio (M‐H, Fixed, 95% CI) | 0.51 [0.34, 0.79] |
| 25 Hyperglycaemia treated with insulin Show forest plot | 2 | 282 | Risk Ratio (M‐H, Fixed, 95% CI) | 0.62 [0.35, 1.08] |
| 25.1 High amino acid intake (> 3 to ≤ 4 g/kg/day) | 2 | 282 | Risk Ratio (M‐H, Fixed, 95% CI) | 0.62 [0.35, 1.08] |
| 26 Hypoglycaemia Show forest plot | 2 | 253 | Risk Ratio (M‐H, Fixed, 95% CI) | 1.03 [0.70, 1.50] |
| 26.1 Low amino acid intake (> 2 to ≤ 3 g/kg/day) | 1 | 85 | Risk Ratio (M‐H, Fixed, 95% CI) | 1.22 [0.35, 4.24] |
| 26.2 High amino acid intake (> 3 to ≤ 4 g/kg/day) | 1 | 168 | Risk Ratio (M‐H, Fixed, 95% CI) | 1.0 [0.67, 1.49] |
| 27 Metabolic acidosis Show forest plot | 2 | 253 | Risk Ratio (M‐H, Fixed, 95% CI) | 2.05 [0.94, 4.47] |
| 27.1 Low amino acid intake (> 2 to ≤ 3 g/kg/day) | 1 | 85 | Risk Ratio (M‐H, Fixed, 95% CI) | 8.80 [0.49, 158.47] |
| 27.2 High amino acid intake (> 3 to ≤ 4 g/kg/day) | 1 | 168 | Risk Ratio (M‐H, Fixed, 95% CI) | 1.63 [0.71, 3.72] |
| 28 Cholestasis Show forest plot | 3 | 375 | Risk Ratio (M‐H, Fixed, 95% CI) | 1.34 [0.71, 2.50] |
| 28.1 Low amino acid intake (> 2 to ≤ 3 g/kg/day) | 1 | 85 | Risk Ratio (M‐H, Fixed, 95% CI) | 12.70 [0.74, 218.66] |
| 28.2 High amino acid intake (> 3 to ≤ 4 g/kg/day) | 2 | 290 | Risk Ratio (M‐H, Fixed, 95% CI) | 0.96 [0.48, 1.90] |
| Outcome or subgroup title | No. of studies | No. of participants | Statistical method | Effect size |
| 1 Mortality to hospital discharge Show forest plot | 14 | 1407 | Risk Ratio (M‐H, Fixed, 95% CI) | 0.90 [0.69, 1.17] |
| 1.1 Increase amino acids and provide isocaloric non‐protein intake | 7 | 828 | Risk Ratio (M‐H, Fixed, 95% CI) | 0.78 [0.51, 1.20] |
| 1.2 Increase amino acids and non‐protein caloric intake | 7 | 579 | Risk Ratio (M‐H, Fixed, 95% CI) | 1.00 [0.71, 1.39] |
| 2 Neurodevelopmental disability Show forest plot | 2 | 201 | Risk Ratio (M‐H, Fixed, 95% CI) | 1.04 [0.48, 2.23] |
| 2.1 Increase amino acids and provide isocaloric non‐protein intake | 2 | 201 | Risk Ratio (M‐H, Fixed, 95% CI) | 1.04 [0.48, 2.23] |
| 3 Postnatal growth failure at discharge Show forest plot | 3 | 203 | Risk Ratio (M‐H, Fixed, 95% CI) | 0.74 [0.56, 0.97] |
| 3.1 Increase amino acids and provide isocaloric non‐protein intake | 1 | 111 | Risk Ratio (M‐H, Fixed, 95% CI) | 0.75 [0.44, 1.30] |
| 3.2 Increase amino acids and non‐protein caloric intake | 2 | 92 | Risk Ratio (M‐H, Fixed, 95% CI) | 0.73 [0.55, 0.98] |
| 4 Days to regain birth weight Show forest plot | 13 | 950 | Mean Difference (IV, Fixed, 95% CI) | ‐1.14 [‐1.73, ‐0.56] |
| 4.1 Increase amino acids and provide isocaloric non‐protein intake | 8 | 615 | Mean Difference (IV, Fixed, 95% CI) | ‐1.06 [‐1.77, ‐0.34] |
| 4.2 Increase amino acids and non‐protein caloric intake | 5 | 335 | Mean Difference (IV, Fixed, 95% CI) | ‐1.32 [‐2.33, ‐0.31] |
| 5 Maximal weight loss (grams) Show forest plot | 3 | 235 | Mean Difference (IV, Fixed, 95% CI) | ‐22.71 [‐33.68, ‐11.74] |
| 5.1 Increase amino acids and provide isocaloric non‐protein intake | 2 | 185 | Mean Difference (IV, Fixed, 95% CI) | ‐29.79 [‐41.58, ‐17.99] |
| 5.2 Increase amino acids and non‐protein caloric intake | 1 | 50 | Mean Difference (IV, Fixed, 95% CI) | 22.60 [‐7.25, 52.45] |
| 6 Maximal weight loss % Show forest plot | 4 | 288 | Mean Difference (IV, Fixed, 95% CI) | ‐0.33 [‐1.61, 0.96] |
| 6.1 Increase amino acids and provide isocaloric non‐protein intake | 3 | 246 | Mean Difference (IV, Fixed, 95% CI) | 0.25 [‐1.13, 1.64] |
| 6.2 Increase amino acids and non‐protein caloric intake | 1 | 42 | Mean Difference (IV, Fixed, 95% CI) | ‐3.80 [‐7.20, ‐0.40] |
| 7 Weight gain g/kg/day up to 1 month Show forest plot | 4 | 373 | Mean Difference (IV, Fixed, 95% CI) | ‐1.50 [‐2.56, ‐0.44] |
| 7.1 Increase amino acids and provide isocaloric non‐protein intake | 4 | 373 | Mean Difference (IV, Fixed, 95% CI) | ‐1.50 [‐2.56, ‐0.44] |
| 8 Weight gain g/kg/day to discharge Show forest plot | 4 | 291 | Mean Difference (IV, Fixed, 95% CI) | 0.76 [‐0.02, 1.54] |
| 8.1 Increase amino acids and provide isocaloric non‐protein nutrition | 3 | 249 | Mean Difference (IV, Fixed, 95% CI) | 0.81 [‐0.03, 1.66] |
| 8.2 Increase amino acids and non‐protein caloric intake | 1 | 42 | Mean Difference (IV, Fixed, 95% CI) | 0.40 [‐1.69, 2.49] |
| 9 Linear growth cm/week up to 1 month Show forest plot | 1 | 122 | Mean Difference (IV, Fixed, 95% CI) | 0.0 [‐0.15, 0.15] |
| 9.1 Increase amino acids and provide isocaloric non‐protein intake | 1 | 122 | Mean Difference (IV, Fixed, 95% CI) | 0.0 [‐0.15, 0.15] |
| 10 Linear growth cm/week to discharge Show forest plot | 1 | 123 | Mean Difference (IV, Fixed, 95% CI) | ‐0.27 [‐0.40, ‐0.14] |
| 10.1 Increase amino acids and provide isocaloric non‐protein intake | 1 | 123 | Mean Difference (IV, Fixed, 95% CI) | ‐0.27 [‐0.40, ‐0.14] |
| 11 Head circumference growth cm/week up to 1 month Show forest plot | 3 | 380 | Mean Difference (IV, Fixed, 95% CI) | 0.01 [‐0.05, 0.07] |
| 11.1 Increase amino acids and provide isocaloric non‐protein intake | 2 | 245 | Mean Difference (IV, Fixed, 95% CI) | ‐0.16 [‐0.25, ‐0.07] |
| 11.2 Increase amino acids and non‐protein caloric intake | 1 | 135 | Mean Difference (IV, Fixed, 95% CI) | 0.13 [0.05, 0.20] |
| 12 Head circumference growth cm/week to discharge Show forest plot | 4 | 315 | Mean Difference (IV, Fixed, 95% CI) | 0.09 [0.06, 0.13] |
| 12.1 Increase amino acids and provide isocaloric non‐protein intake | 4 | 315 | Mean Difference (IV, Fixed, 95% CI) | 0.09 [0.06, 0.13] |
| 13 Weight change z‐score to discharge Show forest plot | 2 | 207 | Mean Difference (IV, Fixed, 95% CI) | 0.01 [‐0.33, 0.36] |
| 13.1 Increase amino acids and provide isocaloric non‐protein intake | 2 | 207 | Mean Difference (IV, Fixed, 95% CI) | 0.01 [‐0.33, 0.36] |
| 14 Head circumference change z‐score to 1 month Show forest plot | 2 | 231 | Mean Difference (IV, Fixed, 95% CI) | 0.27 [0.08, 0.46] |
| 14.1 Increase amino acids and provide isocaloric non‐protein intake | 1 | 96 | Mean Difference (IV, Fixed, 95% CI) | 0.0 [‐0.36, 0.36] |
| 14.2 Increase amino acids and non‐protein caloric intake | 1 | 135 | Mean Difference (IV, Fixed, 95% CI) | 0.37 [0.15, 0.59] |
| 15 Head circumference change z‐score to discharge Show forest plot | 2 | 207 | Mean Difference (IV, Fixed, 95% CI) | 0.18 [‐0.15, 0.50] |
| 15.1 Increase amino acids and provide isocaloric non‐protein intake | 2 | 207 | Mean Difference (IV, Fixed, 95% CI) | 0.18 [‐0.15, 0.50] |
| 16 Days to full enteral feeds Show forest plot | 11 | 778 | Mean Difference (IV, Fixed, 95% CI) | ‐0.19 [‐1.07, 0.70] |
| 16.1 Increase amino acids and provide isocaloric non‐protein intake | 7 | 495 | Mean Difference (IV, Fixed, 95% CI) | ‐0.90 [‐2.14, 0.35] |
| 16.2 Increase amino acids and non‐protein caloric intake | 4 | 283 | Mean Difference (IV, Fixed, 95% CI) | 0.56 [‐0.71, 1.83] |
| 17 Late‐onset sepsis Show forest plot | 15 | 1255 | Risk Ratio (M‐H, Fixed, 95% CI) | 0.96 [0.79, 1.18] |
| 17.1 Increase amino acids and provide isocaloric non‐protein intake | 10 | 949 | Risk Ratio (M‐H, Fixed, 95% CI) | 0.99 [0.77, 1.27] |
| 17.2 Increase amino acids and non‐protein caloric intake | 5 | 306 | Risk Ratio (M‐H, Fixed, 95% CI) | 0.90 [0.64, 1.27] |
| 18 Necrotising enterocolitis Show forest plot | 14 | 1301 | Risk Ratio (M‐H, Fixed, 95% CI) | 1.00 [0.68, 1.47] |
| 18.1 Increase amino acids and provide isocaloric non‐protein intake | 10 | 966 | Risk Ratio (M‐H, Fixed, 95% CI) | 1.11 [0.69, 1.79] |
| 18.2 Increase amino acids and non‐protein caloric intake | 4 | 335 | Risk Ratio (M‐H, Fixed, 95% CI) | 0.80 [0.41, 1.56] |
| 19 Chronic lung disease ≥ 36 weeks' PMA Show forest plot | 10 | 819 | Risk Ratio (M‐H, Fixed, 95% CI) | 1.04 [0.89, 1.23] |
| 19.1 Increase amino acids and provide isocaloric non‐protein intake | 6 | 499 | Risk Ratio (M‐H, Fixed, 95% CI) | 0.96 [0.70, 1.31] |
| 19.2 Increase amino acids and non‐protein caloric intake | 4 | 320 | Risk Ratio (M‐H, Fixed, 95% CI) | 1.10 [0.93, 1.31] |
| 20 Intraventricular haemorrhage Show forest plot | 4 | 370 | Risk Ratio (M‐H, Fixed, 95% CI) | 1.08 [0.73, 1.59] |
| 20.1 Increase amino acids and provide isocaloric non‐protein intake | 3 | 341 | Risk Ratio (M‐H, Fixed, 95% CI) | 1.12 [0.74, 1.69] |
| 20.2 Increase amino acids and non‐protein caloric intake | 1 | 29 | Risk Ratio (M‐H, Fixed, 95% CI) | 0.86 [0.29, 2.56] |
| 21 Severe intraventricular haemorrhage Show forest plot | 11 | 904 | Risk Ratio (M‐H, Fixed, 95% CI) | 1.16 [0.74, 1.82] |
| 21.1 Increase amino acids and provide isocaloric non‐protein intake | 6 | 527 | Risk Ratio (M‐H, Fixed, 95% CI) | 1.00 [0.56, 1.78] |
| 21.2 Increase amino acids and non‐protein caloric intake | 5 | 377 | Risk Ratio (M‐H, Fixed, 95% CI) | 1.43 [0.70, 2.92] |
| 22 Periventricular leukomalacia Show forest plot | 7 | 720 | Risk Ratio (M‐H, Fixed, 95% CI) | 0.55 [0.24, 1.25] |
| 22.1 Increase amino acids and provide isocaloric non‐protein intake | 5 | 543 | Risk Ratio (M‐H, Fixed, 95% CI) | 0.32 [0.10, 1.00] |
| 22.2 Increase amino acids and non‐protein caloric intake | 2 | 177 | Risk Ratio (M‐H, Fixed, 95% CI) | 1.30 [0.33, 5.11] |
| 23 Retinopathy of prematurity Show forest plot | 4 | 269 | Risk Ratio (M‐H, Fixed, 95% CI) | 0.44 [0.21, 0.93] |
| 23.1 Increase amino acids and provide isocaloric non‐protein intake | 1 | 123 | Risk Ratio (M‐H, Fixed, 95% CI) | 1.58 [0.27, 9.10] |
| 23.2 Increase amino acids and non‐protein caloric intake | 3 | 146 | Risk Ratio (M‐H, Fixed, 95% CI) | 0.32 [0.13, 0.77] |
| 24 Severe retinopathy of prematurity (> stage 2 or treated) Show forest plot | 8 | 672 | Risk Ratio (M‐H, Fixed, 95% CI) | 0.96 [0.56, 1.63] |
| 24.1 Increase amino acids and provide isocaloric non‐protein intake | 4 | 378 | Risk Ratio (M‐H, Fixed, 95% CI) | 1.50 [0.63, 3.55] |
| 24.2 Increase amino acids and non‐protein caloric intake | 4 | 294 | Risk Ratio (M‐H, Fixed, 95% CI) | 0.73 [0.36, 1.46] |
| 25 Cerebral palsy Show forest plot | 2 | 122 | Risk Ratio (M‐H, Fixed, 95% CI) | 4.0 [0.89, 17.97] |
| 25.1 Increase amino acids and provide isocaloric non‐protein intake | 2 | 122 | Risk Ratio (M‐H, Fixed, 95% CI) | 4.0 [0.89, 17.97] |
| 26 Developmental delay at ≥ 18 months Show forest plot | 3 | 301 | Risk Ratio (M‐H, Fixed, 95% CI) | 1.35 [0.52, 3.53] |
| 26.1 Increase amino acids and provide isocaloric non‐protein calorie nutrition | 3 | 301 | Risk Ratio (M‐H, Fixed, 95% CI) | 1.35 [0.52, 3.53] |
| 27 Blindness Show forest plot | 2 | 122 | Risk Ratio (M‐H, Fixed, 95% CI) | 2.0 [0.20, 19.91] |
| 27.1 Increase amino acids and provide isocaloric non‐protein intake | 2 | 122 | Risk Ratio (M‐H, Fixed, 95% CI) | 2.0 [0.20, 19.91] |
| 28 Deafness Show forest plot | 1 | 90 | Risk Ratio (M‐H, Fixed, 95% CI) | 0.0 [0.0, 0.0] |
| 28.1 Increase amino acids and provide isocaloric non‐protein intake | 1 | 90 | Risk Ratio (M‐H, Fixed, 95% CI) | 0.0 [0.0, 0.0] |
| 29 Abnormal serum ammonia Show forest plot | 1 | 61 | Risk Ratio (M‐H, Fixed, 95% CI) | 3.10 [0.13, 73.16] |
| 29.1 Increase amino acids and provide isocaloric non‐protein intake | 1 | 61 | Risk Ratio (M‐H, Fixed, 95% CI) | 3.10 [0.13, 73.16] |
| 30 Abnormal blood urea nitrogen (various criteria) Show forest plot | 7 | 688 | Risk Ratio (M‐H, Fixed, 95% CI) | 2.77 [2.13, 3.61] |
| 30.1 Increase amino acids and provide isocaloric non‐protein intake | 5 | 561 | Risk Ratio (M‐H, Fixed, 95% CI) | 2.61 [2.00, 3.41] |
| 30.2 Increase amino acids and non‐protein calorie nutrition | 2 | 127 | Risk Ratio (M‐H, Fixed, 95% CI) | 6.45 [1.55, 26.84] |
| 31 Hyperglycaemia, plasma glucose > 8.3 mmol/L Show forest plot | 5 | 505 | Risk Ratio (M‐H, Fixed, 95% CI) | 0.69 [0.49, 0.96] |
| 31.1 Increase amino acids and provide isocaloric non‐protein intake | 3 | 378 | Risk Ratio (M‐H, Fixed, 95% CI) | 0.51 [0.34, 0.79] |
| 31.2 Increase amino acids and non‐protein calorie nutrition | 2 | 127 | Risk Ratio (M‐H, Fixed, 95% CI) | 1.51 [0.88, 2.62] |
| 32 Hyperglycaemia treated with insulin Show forest plot | 5 | 534 | Risk Ratio (M‐H, Fixed, 95% CI) | 1.24 [0.93, 1.66] |
| 32.1 Increase amino acids and provide isocaloric non‐protein intake | 3 | 378 | Risk Ratio (M‐H, Fixed, 95% CI) | 0.76 [0.49, 1.19] |
| 32.2 Increase amino acids and non‐protein calorie nutrition | 2 | 156 | Risk Ratio (M‐H, Fixed, 95% CI) | 2.00 [1.35, 2.98] |
| 33 Hypoglycaemia Show forest plot | 3 | 376 | Risk Ratio (M‐H, Fixed, 95% CI) | 1.17 [0.84, 1.63] |
| 33.1 Increase amino acids and provide isocaloric non‐protein intake | 2 | 291 | Risk Ratio (M‐H, Fixed, 95% CI) | 1.16 [0.82, 1.64] |
| 33.2 Increase amino acids and non‐protein calorie nutrition | 1 | 85 | Risk Ratio (M‐H, Fixed, 95% CI) | 1.22 [0.35, 4.24] |
| 34 Metabolic acidosis Show forest plot | 4 | 305 | Risk Ratio (M‐H, Fixed, 95% CI) | 2.05 [0.94, 4.47] |
| 34.1 Increase amino acids and provide isocaloric non‐protein intake | 3 | 220 | Risk Ratio (M‐H, Fixed, 95% CI) | 1.63 [0.71, 3.72] |
| 34.2 Increase amino acids and non‐protein calorie nutrition | 1 | 85 | Risk Ratio (M‐H, Fixed, 95% CI) | 8.80 [0.49, 158.47] |
| 35 Cholestasis Show forest plot | 5 | 616 | Risk Ratio (M‐H, Fixed, 95% CI) | 1.26 [0.86, 1.84] |
| 35.1 Increase amino acids and provide isocaloric non‐protein intake | 2 | 290 | Risk Ratio (M‐H, Fixed, 95% CI) | 0.96 [0.48, 1.90] |
| 35.2 Increase amino acids and non‐protein calorie nutrition | 3 | 326 | Risk Ratio (M‐H, Fixed, 95% CI) | 1.45 [0.92, 2.28] |
| Outcome or subgroup title | No. of studies | No. of participants | Statistical method | Effect size |
| 1 Mortality before hospital discharge Show forest plot | 14 | 1407 | Risk Ratio (M‐H, Fixed, 95% CI) | 0.90 [0.69, 1.17] |
| 2 Neurodevelopmental disability Show forest plot | 2 | 201 | Risk Ratio (M‐H, Fixed, 95% CI) | 1.04 [0.48, 2.23] |
| 3 Postnatal growth failure Show forest plot | 3 | Risk Ratio (M‐H, Fixed, 95% CI) | Subtotals only | |
| 3.1 At latest time measured to discharge | 3 | 203 | Risk Ratio (M‐H, Fixed, 95% CI) | 0.74 [0.56, 0.97] |
| 3.2 Post discharge | 1 | 111 | Risk Ratio (M‐H, Fixed, 95% CI) | 0.66 [0.33, 1.32] |
| 4 Days to regain birth weight Show forest plot | 10 | 800 | Mean Difference (IV, Fixed, 95% CI) | ‐0.78 [‐1.46, ‐0.11] |
| 5 Maximal weight loss (grams) Show forest plot | 2 | 139 | Mean Difference (IV, Fixed, 95% CI) | ‐20.37 [‐32.68, ‐8.05] |
| 6 Maximal weight loss % Show forest plot | 3 | 271 | Mean Difference (IV, Fixed, 95% CI) | ‐0.38 [‐1.69, 0.93] |
| 7 Weight gain g/kg/day Show forest plot | 6 | Mean Difference (IV, Fixed, 95% CI) | Subtotals only | |
| 7.1 Up to 1 month age | 4 | 373 | Mean Difference (IV, Fixed, 95% CI) | ‐1.50 [‐2.56, ‐0.44] |
| 7.2 At latest time measured to discharge | 3 | 254 | Mean Difference (IV, Fixed, 95% CI) | 0.72 [‐0.09, 1.52] |
| 8 Linear growth cm/week Show forest plot | 2 | Mean Difference (IV, Fixed, 95% CI) | Subtotals only | |
| 8.1 Up to 1 month age | 2 | 245 | Mean Difference (IV, Fixed, 95% CI) | ‐0.16 [‐0.26, ‐0.06] |
| 9 Head circumference growth cm/week Show forest plot | 5 | 658 | Mean Difference (IV, Fixed, 95% CI) | 0.06 [0.03, 0.09] |
| 9.1 Up to 1 month age | 4 | 476 | Mean Difference (IV, Fixed, 95% CI) | 0.01 [‐0.04, 0.06] |
| 9.2 At latest time measured to discharge | 2 | 182 | Mean Difference (IV, Fixed, 95% CI) | 0.08 [0.05, 0.12] |
| 10 Weight change z‐score Show forest plot | 2 | Mean Difference (IV, Fixed, 95% CI) | Subtotals only | |
| 10.1 Up to 1 month age | 1 | 96 | Mean Difference (IV, Fixed, 95% CI) | ‐0.20 [‐0.62, 0.22] |
| 10.2 At latest time measured to discharge | 2 | 207 | Mean Difference (IV, Fixed, 95% CI) | 0.01 [‐0.33, 0.36] |
| 10.3 Post discharge | 2 | 201 | Mean Difference (IV, Fixed, 95% CI) | 0.13 [‐0.26, 0.52] |
| 11 Head circumference change z‐score Show forest plot | 3 | Mean Difference (IV, Fixed, 95% CI) | Subtotals only | |
| 11.1 Up to 1 month age | 2 | 231 | Mean Difference (IV, Fixed, 95% CI) | 0.27 [0.08, 0.46] |
| 11.2 At latest time measured to discharge | 2 | 207 | Mean Difference (IV, Fixed, 95% CI) | 0.18 [‐0.15, 0.50] |
| 11.3 Post discharge | 2 | 201 | Mean Difference (IV, Fixed, 95% CI) | 0.25 [‐0.14, 0.64] |
| 12 Days to full enteral feeds Show forest plot | 11 | 778 | Mean Difference (IV, Fixed, 95% CI) | ‐0.19 [‐1.07, 0.70] |
| 13 Late‐onset sepsis Show forest plot | 15 | 1255 | Risk Ratio (M‐H, Fixed, 95% CI) | 0.96 [0.79, 1.18] |
| 14 Necrotising enterocolitis Show forest plot | 14 | 1301 | Risk Ratio (M‐H, Fixed, 95% CI) | 1.00 [0.68, 1.47] |
| 15 Chronic lung disease ≥ 36 weeks' PMA Show forest plot | 10 | 819 | Risk Ratio (M‐H, Fixed, 95% CI) | 1.04 [0.89, 1.23] |
| 16 Intraventricular haemorrhage Show forest plot | 3 | 341 | Risk Ratio (M‐H, Fixed, 95% CI) | 1.12 [0.74, 1.69] |
| 17 Severe intraventricular haemorrhage Show forest plot | 11 | 904 | Risk Ratio (M‐H, Fixed, 95% CI) | 1.16 [0.74, 1.82] |
| 18 Periventricular leukomalacia Show forest plot | 6 | 624 | Risk Ratio (M‐H, Fixed, 95% CI) | 0.48 [0.20, 1.17] |
| 19 Retinopathy of prematurity Show forest plot | 4 | 269 | Risk Ratio (M‐H, Fixed, 95% CI) | 0.44 [0.21, 0.93] |
| 20 Severe retinopathy of prematurity (> stage 2 or treated) Show forest plot | 8 | 672 | Risk Ratio (M‐H, Fixed, 95% CI) | 0.96 [0.56, 1.63] |
| 21 Cerebral palsy Show forest plot | 2 | 122 | Risk Ratio (M‐H, Fixed, 95% CI) | 4.0 [0.89, 17.97] |
| 22 Developmental delay at ≥ 18 months Show forest plot | 3 | 301 | Risk Ratio (M‐H, Fixed, 95% CI) | 1.35 [0.52, 3.53] |
| 22.1 MDI < 70 | 2 | 201 | Risk Ratio (M‐H, Fixed, 95% CI) | 1.04 [0.35, 3.11] |
| 22.2 Severe mental retardation | 1 | 100 | Risk Ratio (M‐H, Fixed, 95% CI) | 3.25 [0.35, 30.19] |
| 23 Blindness Show forest plot | 2 | 122 | Risk Ratio (M‐H, Fixed, 95% CI) | 2.0 [0.20, 19.91] |
| 24 Deafness Show forest plot | 1 | 90 | Risk Ratio (M‐H, Fixed, 95% CI) | 0.0 [0.0, 0.0] |
| 25 Abnormal serum ammonia > 122 μmol/L Show forest plot | 1 | 61 | Risk Ratio (M‐H, Fixed, 95% CI) | 3.10 [0.13, 73.16] |
| 26 Abnormal blood urea nitrogen > 21.4 mmol/L Show forest plot | 7 | 688 | Risk Ratio (M‐H, Fixed, 95% CI) | 2.77 [2.13, 3.61] |
| 27 Hyperglycaemia, plasma glucose > 8.3 mmol/L Show forest plot | 4 | 409 | Risk Ratio (M‐H, Fixed, 95% CI) | 0.66 [0.45, 0.96] |
| 28 Hyperglycaemia treated with insulin Show forest plot | 5 | 534 | Risk Ratio (M‐H, Fixed, 95% CI) | 1.24 [0.93, 1.66] |
| 29 Hypoglycaemia Show forest plot | 3 | 376 | Risk Ratio (M‐H, Fixed, 95% CI) | 1.17 [0.84, 1.63] |
| 30 Metabolic acidosis Show forest plot | 2 | 253 | Risk Ratio (M‐H, Fixed, 95% CI) | 2.05 [0.94, 4.47] |
| 31 Cholestasis Show forest plot | 5 | 616 | Risk Ratio (M‐H, Fixed, 95% CI) | 1.26 [0.86, 1.84] |
| Outcome or subgroup title | No. of studies | No. of participants | Statistical method | Effect size |
| 1 Mortality before hospital discharge Show forest plot | 14 | 1407 | Risk Ratio (M‐H, Fixed, 95% CI) | 0.90 [0.69, 1.17] |
| 1.1 Commenced < 24 hours | 12 | 1200 | Risk Ratio (M‐H, Fixed, 95% CI) | 0.82 [0.60, 1.13] |
| 1.2 Commenced ≥ 24 to < 48 hours | 1 | 122 | Risk Ratio (M‐H, Fixed, 95% CI) | 1.81 [0.17, 19.47] |
| 1.3 Commenced ≥ 48 to < 72 hours | 1 | 85 | Risk Ratio (M‐H, Fixed, 95% CI) | 1.14 [0.72, 1.81] |
| 2 Neurodevelopmental disability Show forest plot | 2 | 201 | Risk Ratio (M‐H, Fixed, 95% CI) | 1.04 [0.48, 2.23] |
| 2.1 Commenced < 24 hours | 2 | 201 | Risk Ratio (M‐H, Fixed, 95% CI) | 1.04 [0.48, 2.23] |
| 3 Postnatal growth failure at discharge Show forest plot | 3 | 203 | Risk Ratio (M‐H, Fixed, 95% CI) | 0.74 [0.56, 0.97] |
| 3.1 Commenced < 24 hours | 3 | 203 | Risk Ratio (M‐H, Fixed, 95% CI) | 0.74 [0.56, 0.97] |
| 4 Days to regain birth weight Show forest plot | 13 | 950 | Mean Difference (IV, Fixed, 95% CI) | ‐1.14 [‐1.73, ‐0.56] |
| 4.1 Commenced < 24 hours | 12 | 865 | Mean Difference (IV, Fixed, 95% CI) | ‐1.15 [‐1.74, ‐0.56] |
| 4.2 Commenced ≥ 48 to < 72 hours | 1 | 85 | Mean Difference (IV, Fixed, 95% CI) | ‐1.0 [‐5.03, 3.03] |
| 5 Maximal weight loss (grams) Show forest plot | 3 | 235 | Mean Difference (IV, Fixed, 95% CI) | ‐22.71 [‐33.68, ‐11.74] |
| 5.1 Commenced < 24 hours | 3 | 235 | Mean Difference (IV, Fixed, 95% CI) | ‐22.71 [‐33.68, ‐11.74] |
| 6 Maximal weight loss % Show forest plot | 4 | 288 | Mean Difference (IV, Fixed, 95% CI) | ‐0.33 [‐1.61, 0.96] |
| 6.1 Commenced < 24 hours | 4 | 288 | Mean Difference (IV, Fixed, 95% CI) | ‐0.33 [‐1.61, 0.96] |
| 7 Weight gain g/kg/day up to 1 month Show forest plot | 1 | 122 | Mean Difference (IV, Fixed, 95% CI) | 1.5 [‐0.27, 3.27] |
| 7.1 Commenced ≥ 24 to < 48 hours | 1 | 122 | Mean Difference (IV, Fixed, 95% CI) | 1.5 [‐0.27, 3.27] |
| 8 Weight gain g/kg/day to discharge Show forest plot | 6 | 446 | Mean Difference (IV, Fixed, 95% CI) | ‐0.16 [‐0.87, 0.54] |
| 8.1 Commenced < 24 hours | 5 | 348 | Mean Difference (IV, Fixed, 95% CI) | ‐0.35 [‐1.09, 0.39] |
| 8.2 Commenced ≥ 24 to < 48 hours | 1 | 98 | Mean Difference (IV, Fixed, 95% CI) | 2.0 [‐0.51, 4.51] |
| 9 Linear growth cm/week up to 1 month Show forest plot | 2 | 245 | Mean Difference (IV, Fixed, 95% CI) | ‐0.16 [‐0.26, ‐0.06] |
| 9.1 Commenced < 24 hours | 1 | 123 | Mean Difference (IV, Fixed, 95% CI) | ‐0.27 [‐0.40, ‐0.14] |
| 9.2 Commenced ≥ 24 to < 48 hours | 1 | 122 | Mean Difference (IV, Fixed, 95% CI) | 0.0 [‐0.15, 0.15] |
| 10 Head circumference growth cm/week up to 1 month age Show forest plot | 4 | 476 | Mean Difference (IV, Fixed, 95% CI) | 0.01 [‐0.04, 0.06] |
| 10.1 Commenced < 24 hours | 2 | 258 | Mean Difference (IV, Fixed, 95% CI) | 0.01 [‐0.06, 0.08] |
| 10.2 Commenced ≥ 24 to < 48 hours | 2 | 218 | Mean Difference (IV, Fixed, 95% CI) | 0.01 [‐0.07, 0.09] |
| 11 Head circumference growth cm/week to discharge Show forest plot | 4 | 315 | Mean Difference (IV, Fixed, 95% CI) | 0.09 [0.06, 0.13] |
| 11.1 Commenced < 24 hours | 3 | 219 | Mean Difference (IV, Fixed, 95% CI) | 0.12 [0.08, 0.17] |
| 11.2 Commenced ≥ 24 to < 48 hours | 1 | 96 | Mean Difference (IV, Fixed, 95% CI) | 0.03 [‐0.03, 0.09] |
| 12 Weight change z‐score to discharge Show forest plot | 2 | 207 | Mean Difference (IV, Fixed, 95% CI) | 0.01 [‐0.33, 0.36] |
| 12.1 Commenced < 24 hours | 1 | 111 | Mean Difference (IV, Fixed, 95% CI) | ‐0.22 [‐0.70, 0.26] |
| 12.2 Commenced ≥ 24 to < 48 hours | 1 | 96 | Mean Difference (IV, Fixed, 95% CI) | 0.27 [‐0.23, 0.77] |
| 13 Head circumference change z‐score to 1 month age Show forest plot | 2 | 231 | Mean Difference (IV, Fixed, 95% CI) | 0.27 [0.08, 0.46] |
| 13.1 Commenced < 24 hours | 1 | 135 | Mean Difference (IV, Fixed, 95% CI) | 0.37 [0.15, 0.59] |
| 13.2 Commenced ≥ 24 to < 48 hours | 1 | 96 | Mean Difference (IV, Fixed, 95% CI) | 0.0 [‐0.36, 0.36] |
| 14 Head circumference change z‐score to discharge Show forest plot | 2 | 207 | Mean Difference (IV, Fixed, 95% CI) | 0.18 [‐0.15, 0.50] |
| 14.1 Commenced < 24 hours | 1 | 111 | Mean Difference (IV, Fixed, 95% CI) | ‐0.15 [‐0.66, 0.36] |
| 14.2 Commenced ≥ 24 to < 48 hours | 1 | 96 | Mean Difference (IV, Fixed, 95% CI) | 0.4 [‐0.02, 0.82] |
| 15 Days to full enteral feeds Show forest plot | 11 | 778 | Mean Difference (IV, Fixed, 95% CI) | ‐0.19 [‐1.07, 0.70] |
| 15.1 Commenced < 24 hours | 11 | 778 | Mean Difference (IV, Fixed, 95% CI) | ‐0.19 [‐1.07, 0.70] |
| 16 Late‐onset sepsis Show forest plot | 15 | 1255 | Risk Ratio (M‐H, Fixed, 95% CI) | 0.96 [0.79, 1.18] |
| 16.1 Commenced < 24 hours | 12 | 952 | Risk Ratio (M‐H, Fixed, 95% CI) | 0.95 [0.75, 1.20] |
| 16.2 Commenced ≥ 24 to < 48 hours | 2 | 218 | Risk Ratio (M‐H, Fixed, 95% CI) | 1.09 [0.70, 1.67] |
| 16.3 Commenced ≥ 48 to < 72 hours | 1 | 85 | Risk Ratio (M‐H, Fixed, 95% CI) | 0.70 [0.24, 2.03] |
| 17 Necrotising enterocolitis Show forest plot | 14 | 1301 | Risk Ratio (M‐H, Fixed, 95% CI) | 1.00 [0.68, 1.47] |
| 17.1 Commenced < 24 hours | 12 | 1083 | Risk Ratio (M‐H, Fixed, 95% CI) | 0.98 [0.65, 1.49] |
| 17.2 Commenced ≥ 24 to < 48 hours | 2 | 218 | Risk Ratio (M‐H, Fixed, 95% CI) | 1.09 [0.40, 2.95] |
| 18 Chronic lung disease ≥ 36 weeks' PMA Show forest plot | 10 | 819 | Risk Ratio (M‐H, Fixed, 95% CI) | 1.04 [0.89, 1.23] |
| 18.1 Commenced < 24 hours | 9 | 723 | Risk Ratio (M‐H, Fixed, 95% CI) | 1.01 [0.85, 1.19] |
| 18.2 Commenced ≥ 24 to < 48 hours | 1 | 96 | Risk Ratio (M‐H, Fixed, 95% CI) | 1.52 [0.79, 2.92] |
| 19 Intraventricular haemorrhage Show forest plot | 3 | 341 | Risk Ratio (M‐H, Fixed, 95% CI) | 1.12 [0.74, 1.69] |
| 19.1 Commenced < 24 hours | 2 | 219 | Risk Ratio (M‐H, Fixed, 95% CI) | 1.23 [0.60, 2.55] |
| 19.2 Commenced ≥ 24 to < 48 hours | 1 | 122 | Risk Ratio (M‐H, Fixed, 95% CI) | 1.05 [0.64, 1.73] |
| 20 Severe intraventricular haemorrhage Show forest plot | 11 | 904 | Risk Ratio (M‐H, Fixed, 95% CI) | 1.16 [0.74, 1.82] |
| 20.1 Commenced < 24 hours | 9 | 686 | Risk Ratio (M‐H, Fixed, 95% CI) | 1.17 [0.68, 1.99] |
| 20.2 Commenced ≥ 24 to < 48 hours | 2 | 218 | Risk Ratio (M‐H, Fixed, 95% CI) | 1.15 [0.50, 2.63] |
| 21 Periventricular leukomalacia Show forest plot | 7 | 720 | Risk Ratio (M‐H, Fixed, 95% CI) | 0.55 [0.24, 1.25] |
| 21.1 Commenced < 24 hours | 5 | 502 | Risk Ratio (M‐H, Fixed, 95% CI) | 0.75 [0.30, 1.85] |
| 21.2 Commenced ≥ 24 to < 48 hours | 2 | 218 | Risk Ratio (M‐H, Fixed, 95% CI) | 0.10 [0.01, 1.83] |
| 22 Retinopathy of prematurity Show forest plot | 4 | 269 | Risk Ratio (M‐H, Fixed, 95% CI) | 0.44 [0.21, 0.93] |
| 22.1 Commenced < 24 hours | 4 | 269 | Risk Ratio (M‐H, Fixed, 95% CI) | 0.44 [0.21, 0.93] |
| 23 Severe retinopathy of prematurity (> stage 2 or treated) Show forest plot | 8 | 672 | Risk Ratio (M‐H, Fixed, 95% CI) | 0.96 [0.56, 1.63] |
| 23.1 Commenced < 24 hours | 7 | 574 | Risk Ratio (M‐H, Fixed, 95% CI) | 0.87 [0.50, 1.51] |
| 23.2 Commenced ≥ 24 to < 48 hours | 1 | 98 | Risk Ratio (M‐H, Fixed, 95% CI) | 5.0 [0.25, 101.53] |
| 24 Cerebral palsy Show forest plot | 2 | 122 | Risk Ratio (M‐H, Fixed, 95% CI) | 4.0 [0.89, 17.97] |
| 24.1 Commenced < 24 hours | 2 | 122 | Risk Ratio (M‐H, Fixed, 95% CI) | 4.0 [0.89, 17.97] |
| 25 Developmental delay at ≥ 18 months Show forest plot | 3 | 301 | Risk Ratio (M‐H, Fixed, 95% CI) | 1.35 [0.52, 3.53] |
| 25.1 Commenced < 24 hours | 3 | 301 | Risk Ratio (M‐H, Fixed, 95% CI) | 1.35 [0.52, 3.53] |
| 26 Blindness Show forest plot | 2 | 122 | Risk Ratio (M‐H, Fixed, 95% CI) | 2.0 [0.20, 19.91] |
| 26.1 Commenced < 24 hours | 2 | 122 | Risk Ratio (M‐H, Fixed, 95% CI) | 2.0 [0.20, 19.91] |
| 27 Deafness Show forest plot | 1 | 90 | Risk Ratio (M‐H, Fixed, 95% CI) | 0.0 [0.0, 0.0] |
| 27.1 Commenced ≥ 24 to < 48 hours | 1 | 90 | Risk Ratio (M‐H, Fixed, 95% CI) | 0.0 [0.0, 0.0] |
| 28 Abnormal serum ammonia > 122 μmol/L Show forest plot | 1 | 61 | Risk Ratio (M‐H, Fixed, 95% CI) | 3.10 [0.13, 73.16] |
| 28.1 Commenced < 24 hours | 1 | 61 | Risk Ratio (M‐H, Fixed, 95% CI) | 3.10 [0.13, 73.16] |
| 29 Abnormal blood urea nitrogen (various criteria) Show forest plot | 7 | 689 | Risk Ratio (M‐H, Fixed, 95% CI) | 2.77 [2.13, 3.60] |
| 29.1 Commenced < 24 hours | 4 | 386 | Risk Ratio (M‐H, Fixed, 95% CI) | 2.86 [2.01, 4.07] |
| 29.2 Commenced ≥ 24 to < 48 hours | 2 | 218 | Risk Ratio (M‐H, Fixed, 95% CI) | 2.20 [1.50, 3.23] |
| 29.3 Commenced ≥ 48 to < 72 hours | 1 | 85 | Risk Ratio (M‐H, Fixed, 95% CI) | 10.74 [1.45, 79.59] |
| 30 Hyperglycaemia, plasma glucose > 8.3 mmol/L Show forest plot | 5 | 505 | Risk Ratio (M‐H, Fixed, 95% CI) | 0.69 [0.49, 0.96] |
| 30.1 Commenced < 24 hours | 4 | 420 | Risk Ratio (M‐H, Fixed, 95% CI) | 0.67 [0.48, 0.94] |
| 30.2 Commenced ≥ 48 to < 72 hours | 1 | 85 | Risk Ratio (M‐H, Fixed, 95% CI) | 1.95 [0.18, 20.74] |
| 31 Hyperglycaemia treated with insulin Show forest plot | 5 | 534 | Risk Ratio (M‐H, Fixed, 95% CI) | 1.24 [0.93, 1.66] |
| 31.1 Commenced < 24 hours | 4 | 438 | Risk Ratio (M‐H, Fixed, 95% CI) | 1.26 [0.92, 1.72] |
| 31.2 Commenced ≥ 24 to < 48 hours | 1 | 96 | Risk Ratio (M‐H, Fixed, 95% CI) | 1.15 [0.54, 2.45] |
| 32 Hypoglycaemia Show forest plot | 3 | 376 | Risk Ratio (M‐H, Fixed, 95% CI) | 1.17 [0.84, 1.63] |
| 32.1 Commenced < 24 hours | 2 | 291 | Risk Ratio (M‐H, Fixed, 95% CI) | 1.16 [0.82, 1.64] |
| 32.2 Commenced ≥ 48 to < 72 hours | 1 | 85 | Risk Ratio (M‐H, Fixed, 95% CI) | 1.22 [0.35, 4.24] |
| 33 Metabolic acidosis Show forest plot | 4 | 305 | Risk Ratio (M‐H, Fixed, 95% CI) | 2.05 [0.94, 4.47] |
| 33.1 Commenced < 24 hours | 3 | 220 | Risk Ratio (M‐H, Fixed, 95% CI) | 1.63 [0.71, 3.72] |
| 33.2 Commenced ≥ 48 to < 72 hours | 1 | 85 | Risk Ratio (M‐H, Fixed, 95% CI) | 8.80 [0.49, 158.47] |
| 34 Cholestasis Show forest plot | 5 | 616 | Risk Ratio (M‐H, Fixed, 95% CI) | 1.26 [0.86, 1.84] |
| 34.1 Commenced < 24 hours | 3 | 409 | Risk Ratio (M‐H, Fixed, 95% CI) | 1.06 [0.70, 1.61] |
| 34.2 Commenced ≥ 24 to < 48 hours | 1 | 122 | Risk Ratio (M‐H, Fixed, 95% CI) | 1.45 [0.50, 4.18] |
| 34.3 Commenced ≥ 48 to < 72 hours | 1 | 85 | Risk Ratio (M‐H, Fixed, 95% CI) | 12.70 [0.74, 218.66] |
| Outcome or subgroup title | No. of studies | No. of participants | Statistical method | Effect size |
| 1 Mortality before hospital discharge Show forest plot | 14 | 1407 | Risk Ratio (M‐H, Fixed, 95% CI) | 0.90 [0.69, 1.17] |
| 1.1 Early lipid infusion | 12 | 1161 | Risk Ratio (M‐H, Fixed, 95% CI) | 0.91 [0.70, 1.20] |
| 1.2 Delayed lipid infusion ≥ 5 days | 1 | 131 | Risk Ratio (M‐H, Fixed, 95% CI) | 0.84 [0.24, 2.98] |
| 1.3 No lipid infusion | 1 | 115 | Risk Ratio (M‐H, Fixed, 95% CI) | 0.31 [0.01, 7.36] |
| 2 Neurodevelopmental disability Show forest plot | 2 | 201 | Risk Ratio (M‐H, Fixed, 95% CI) | 1.04 [0.48, 2.23] |
| 2.1 Early lipid infusion | 2 | 201 | Risk Ratio (M‐H, Fixed, 95% CI) | 1.04 [0.48, 2.23] |
| 3 Postnatal growth failure at discharge Show forest plot | 3 | 203 | Risk Ratio (M‐H, Fixed, 95% CI) | 0.74 [0.56, 0.97] |
| 3.1 Early lipid infusion | 3 | 203 | Risk Ratio (M‐H, Fixed, 95% CI) | 0.74 [0.56, 0.97] |
| 4 Days to regain birth weight Show forest plot | 13 | 950 | Mean Difference (IV, Fixed, 95% CI) | ‐1.14 [‐1.73, ‐0.56] |
| 4.1 Early lipid infusion | 9 | 513 | Mean Difference (IV, Fixed, 95% CI) | ‐2.02 [‐2.73, ‐1.31] |
| 4.2 Delayed lipid infusion ≥ 5 days | 2 | 199 | Mean Difference (IV, Fixed, 95% CI) | ‐0.57 [‐2.04, 0.91] |
| 4.3 No lipid infusion | 2 | 238 | Mean Difference (IV, Fixed, 95% CI) | 2.04 [0.58, 3.50] |
| 5 Maximal weight loss (grams) Show forest plot | 3 | 235 | Mean Difference (IV, Fixed, 95% CI) | ‐22.71 [‐33.68, ‐11.74] |
| 5.1 Early lipid infusion | 3 | 235 | Mean Difference (IV, Fixed, 95% CI) | ‐22.71 [‐33.68, ‐11.74] |
| 6 Maximal weight loss % Show forest plot | 4 | 288 | Mean Difference (IV, Fixed, 95% CI) | ‐0.33 [‐1.61, 0.96] |
| 6.1 Early lipid infusion | 2 | 59 | Mean Difference (IV, Fixed, 95% CI) | ‐2.73 [‐5.71, 0.25] |
| 6.2 Delayed lipid infusion ≥ 5 days | 1 | 114 | Mean Difference (IV, Fixed, 95% CI) | 0.0 [‐1.87, 1.87] |
| 6.3 No lipid infusion | 1 | 115 | Mean Difference (IV, Fixed, 95% CI) | 0.51 [‐1.66, 2.68] |
| 7 Weight gain g/kg/day to 1 month Show forest plot | 4 | 373 | Mean Difference (IV, Fixed, 95% CI) | ‐1.50 [‐2.56, ‐0.44] |
| 7.1 Early lipid infusion | 3 | 250 | Mean Difference (IV, Fixed, 95% CI) | 0.42 [‐0.94, 1.78] |
| 7.2 No lipid infusion | 1 | 123 | Mean Difference (IV, Fixed, 95% CI) | ‐4.48 [‐6.17, ‐2.79] |
| 8 Weight gain g/kg/day to discharge Show forest plot | 4 | 291 | Mean Difference (IV, Fixed, 95% CI) | 0.76 [‐0.02, 1.54] |
| 8.1 Early lipid infusion | 3 | 177 | Mean Difference (IV, Fixed, 95% CI) | 1.11 [‐0.30, 2.52] |
| 8.2 Delayed lipid infusion ≥ 5 days | 1 | 114 | Mean Difference (IV, Fixed, 95% CI) | 0.60 [‐0.34, 1.54] |
| 9 Linear growth cm/week up to 1 month age Show forest plot | 2 | 245 | Mean Difference (IV, Fixed, 95% CI) | ‐0.16 [‐0.26, ‐0.06] |
| 9.1 Early lipid infusion | 1 | 122 | Mean Difference (IV, Fixed, 95% CI) | 0.0 [‐0.15, 0.15] |
| 9.2 No lipid infusion | 1 | 123 | Mean Difference (IV, Fixed, 95% CI) | ‐0.27 [‐0.40, ‐0.14] |
| 10 Head circumference growth cm/week up to 1 month age Show forest plot | 4 | 476 | Mean Difference (IV, Fixed, 95% CI) | 0.01 [‐0.04, 0.06] |
| 10.1 Early lipid infusion | 3 | 353 | Mean Difference (IV, Fixed, 95% CI) | 0.07 [0.02, 0.13] |
| 10.2 No lipid infusion | 1 | 123 | Mean Difference (IV, Fixed, 95% CI) | ‐0.38 [‐0.51, ‐0.24] |
| 11 Head circumference growth cm/week to discharge Show forest plot | 4 | 315 | Mean Difference (IV, Fixed, 95% CI) | 0.09 [0.06, 0.13] |
| 11.1 Early lipid infusion | 4 | 315 | Mean Difference (IV, Fixed, 95% CI) | 0.09 [0.06, 0.13] |
| 12 Weight change z‐score to 1 month Show forest plot | 1 | 96 | Mean Difference (IV, Fixed, 95% CI) | ‐0.20 [‐0.62, 0.22] |
| 12.1 Early lipid infusion | 1 | 96 | Mean Difference (IV, Fixed, 95% CI) | ‐0.20 [‐0.62, 0.22] |
| 13 Weight change z‐score to discharge Show forest plot | 2 | 207 | Mean Difference (IV, Fixed, 95% CI) | 0.01 [‐0.33, 0.36] |
| 13.1 Early lipid infusion | 2 | 207 | Mean Difference (IV, Fixed, 95% CI) | 0.01 [‐0.33, 0.36] |
| 14 Weight change z‐score post discharge Show forest plot | 2 | 201 | Mean Difference (IV, Fixed, 95% CI) | 0.13 [‐0.26, 0.52] |
| 14.1 Early lipid infusion | 2 | 201 | Mean Difference (IV, Fixed, 95% CI) | 0.13 [‐0.26, 0.52] |
| 15 Head circumference change z‐score to 1 month Show forest plot | 2 | 231 | Mean Difference (IV, Fixed, 95% CI) | 0.27 [0.08, 0.46] |
| 15.1 Early lipid infusion | 2 | 231 | Mean Difference (IV, Fixed, 95% CI) | 0.27 [0.08, 0.46] |
| 16 Head circumference change z‐score to discharge Show forest plot | 2 | 207 | Mean Difference (IV, Fixed, 95% CI) | 0.18 [‐0.15, 0.50] |
| 16.1 Early lipid infusion | 2 | 207 | Mean Difference (IV, Fixed, 95% CI) | 0.18 [‐0.15, 0.50] |
| 17 Head circumference change z‐score post discharge Show forest plot | 2 | 201 | Mean Difference (IV, Fixed, 95% CI) | 0.25 [‐0.14, 0.64] |
| 17.1 Early lipid infusion | 2 | 201 | Mean Difference (IV, Fixed, 95% CI) | 0.25 [‐0.14, 0.64] |
| 18 Days to full enteral feeds Show forest plot | 11 | 778 | Mean Difference (IV, Fixed, 95% CI) | ‐0.19 [‐1.07, 0.70] |
| 18.1 Early lipid infusion | 10 | 663 | Mean Difference (IV, Fixed, 95% CI) | ‐0.24 [‐1.14, 0.66] |
| 18.2 No lipid infusion | 1 | 115 | Mean Difference (IV, Fixed, 95% CI) | 2.04 [‐3.63, 7.71] |
| 19 Late‐onset sepsis Show forest plot | 15 | 1255 | Risk Ratio (M‐H, Fixed, 95% CI) | 0.96 [0.79, 1.18] |
| 19.1 Early lipid infusion | 12 | 933 | Risk Ratio (M‐H, Fixed, 95% CI) | 0.98 [0.79, 1.22] |
| 19.2 Delayed lipid infusion ≥ 5 days | 2 | 199 | Risk Ratio (M‐H, Fixed, 95% CI) | 0.89 [0.46, 1.71] |
| 19.3 No lipid infusion | 1 | 123 | Risk Ratio (M‐H, Fixed, 95% CI) | 0.82 [0.32, 2.05] |
| 20 Necrotising enterocolitis Show forest plot | 14 | 1301 | Risk Ratio (M‐H, Fixed, 95% CI) | 1.00 [0.68, 1.47] |
| 20.1 Early lipid infusion | 11 | 932 | Risk Ratio (M‐H, Fixed, 95% CI) | 0.91 [0.58, 1.43] |
| 20.2 Delayed lipid infusion ≥5 days | 1 | 131 | Risk Ratio (M‐H, Fixed, 95% CI) | 1.05 [0.15, 7.21] |
| 20.3 No lipid infusion | 2 | 238 | Risk Ratio (M‐H, Fixed, 95% CI) | 1.34 [0.59, 3.04] |
| 21 Chronic lung disease ≥ 36 weeks' PMA Show forest plot | 10 | 819 | Risk Ratio (M‐H, Fixed, 95% CI) | 1.04 [0.89, 1.23] |
| 21.1 Early lipid infusion | 8 | 590 | Risk Ratio (M‐H, Fixed, 95% CI) | 1.15 [0.98, 1.37] |
| 21.2 Delayed lipid infusion ≥ 5 days | 1 | 114 | Risk Ratio (M‐H, Fixed, 95% CI) | 0.56 [0.24, 1.29] |
| 21.3 No lipid infusion | 1 | 115 | Risk Ratio (M‐H, Fixed, 95% CI) | 0.61 [0.30, 1.24] |
| 22 Patent ductus arteriosus Show forest plot | 6 | 480 | Risk Ratio (M‐H, Fixed, 95% CI) | 0.78 [0.61, 0.99] |
| 22.1 Early lipid infusion | 4 | 243 | Risk Ratio (M‐H, Fixed, 95% CI) | 0.78 [0.56, 1.07] |
| 22.2 Delayed lipid infusion ≥ 5 days | 1 | 114 | Risk Ratio (M‐H, Fixed, 95% CI) | 0.96 [0.65, 1.42] |
| 22.3 No lipid infusion | 1 | 123 | Risk Ratio (M‐H, Fixed, 95% CI) | 0.46 [0.20, 1.04] |
| 23 Intraventricular haemorrhage Show forest plot | 3 | 341 | Risk Ratio (M‐H, Fixed, 95% CI) | 1.12 [0.74, 1.69] |
| 23.1 Early lipid infusion | 2 | 218 | Risk Ratio (M‐H, Fixed, 95% CI) | 1.09 [0.70, 1.70] |
| 23.2 No lipid infusion | 1 | 123 | Risk Ratio (M‐H, Fixed, 95% CI) | 1.26 [0.41, 3.91] |
| 24 Severe intraventricular haemorrhage Show forest plot | 11 | 904 | Risk Ratio (M‐H, Fixed, 95% CI) | 1.16 [0.74, 1.82] |
| 24.1 Early lipid infusion | 9 | 675 | Risk Ratio (M‐H, Fixed, 95% CI) | 1.25 [0.79, 2.00] |
| 24.2 Delayed lipid infusion ≥ 5 days | 1 | 114 | Risk Ratio (M‐H, Fixed, 95% CI) | 0.52 [0.05, 5.55] |
| 24.3 No lipid infusion | 1 | 115 | Risk Ratio (M‐H, Fixed, 95% CI) | 0.31 [0.01, 7.36] |
| 25 Periventricular leukomalacia Show forest plot | 7 | 720 | Risk Ratio (M‐H, Fixed, 95% CI) | 0.55 [0.24, 1.25] |
| 25.1 Early lipid infusion | 5 | 491 | Risk Ratio (M‐H, Fixed, 95% CI) | 0.71 [0.26, 1.91] |
| 25.2 Delayed lipid infusion ≥ 5 days | 1 | 114 | Risk Ratio (M‐H, Fixed, 95% CI) | 1.04 [0.07, 16.16] |
| 25.3 No lipid infusion | 1 | 115 | Risk Ratio (M‐H, Fixed, 95% CI) | 0.18 [0.02, 1.52] |
| 26 Retinopathy of prematurity Show forest plot | 4 | 269 | Risk Ratio (M‐H, Fixed, 95% CI) | 0.44 [0.21, 0.93] |
| 26.1 Early lipid infusion | 3 | 146 | Risk Ratio (M‐H, Fixed, 95% CI) | 0.32 [0.13, 0.77] |
| 26.2 No lipid infusion | 1 | 123 | Risk Ratio (M‐H, Fixed, 95% CI) | 1.58 [0.27, 9.10] |
| 27 Severe retinopathy of prematurity > stage 2 or treated Show forest plot | 8 | 672 | Risk Ratio (M‐H, Fixed, 95% CI) | 0.96 [0.56, 1.63] |
| 27.1 Early lipid infusion | 6 | 443 | Risk Ratio (M‐H, Fixed, 95% CI) | 0.92 [0.53, 1.59] |
| 27.2 Delayed lipid infusion ≥ 5 days | 1 | 114 | Risk Ratio (M‐H, Fixed, 95% CI) | 0.0 [0.0, 0.0] |
| 27.3 No lipid infusion | 1 | 115 | Risk Ratio (M‐H, Fixed, 95% CI) | 1.83 [0.17, 19.66] |
| 28 Cerebral palsy Show forest plot | 2 | 122 | Risk Ratio (M‐H, Fixed, 95% CI) | 4.0 [0.89, 17.97] |
| 28.1 Early lipid infusion | 2 | 122 | Risk Ratio (M‐H, Fixed, 95% CI) | 4.0 [0.89, 17.97] |
| 29 Developmental delay at ≥ 18 months Show forest plot | 3 | 301 | Risk Ratio (M‐H, Fixed, 95% CI) | 1.35 [0.52, 3.53] |
| 29.1 Early lipid infusion | 2 | 201 | Risk Ratio (M‐H, Fixed, 95% CI) | 1.04 [0.35, 3.11] |
| 29.2 Delayed lipid infusion ≥ 5 days | 1 | 100 | Risk Ratio (M‐H, Fixed, 95% CI) | 3.25 [0.35, 30.19] |
| 30 Blindness Show forest plot | 2 | 122 | Risk Ratio (M‐H, Fixed, 95% CI) | 2.0 [0.20, 19.91] |
| 30.1 Early lipid infusion | 2 | 122 | Risk Ratio (M‐H, Fixed, 95% CI) | 2.0 [0.20, 19.91] |
| 31 Deafness Show forest plot | 1 | 90 | Risk Ratio (M‐H, Fixed, 95% CI) | 0.0 [0.0, 0.0] |
| 31.1 Early lipid infusion | 1 | 90 | Risk Ratio (M‐H, Fixed, 95% CI) | 0.0 [0.0, 0.0] |
| 32 Abnormal serum ammonia Show forest plot | 1 | 61 | Risk Ratio (M‐H, Fixed, 95% CI) | 3.10 [0.13, 73.16] |
| 32.1 Early lipid infusion | 1 | 61 | Risk Ratio (M‐H, Fixed, 95% CI) | 3.10 [0.13, 73.16] |
| 33 Abnormal blood urea nitrogen Show forest plot | 7 | 688 | Risk Ratio (M‐H, Fixed, 95% CI) | 2.77 [2.12, 3.60] |
| 33.1 Early lipid infusion | 5 | 489 | Risk Ratio (M‐H, Fixed, 95% CI) | 2.66 [1.95, 3.64] |
| 33.2 Delayed lipid infusion ≥ 5 days | 2 | 199 | Risk Ratio (M‐H, Fixed, 95% CI) | 3.01 [1.83, 4.95] |
| 34 Hyperglycaemia, plasma glucose > 8.3 mmol/L Show forest plot | 5 | 505 | Risk Ratio (M‐H, Fixed, 95% CI) | 0.69 [0.49, 0.96] |
| 34.1 Early lipid infusion | 3 | 306 | Risk Ratio (M‐H, Fixed, 95% CI) | 0.84 [0.57, 1.22] |
| 34.2 Delayed lipid infusion ≥ 5 days | 2 | 199 | Risk Ratio (M‐H, Fixed, 95% CI) | 0.39 [0.18, 0.83] |
| 35 Hyperglycaemia treated with insulin Show forest plot | 5 | 534 | Risk Ratio (M‐H, Fixed, 95% CI) | 1.24 [0.93, 1.66] |
| 35.1 Early lipid infusion | 4 | 420 | Risk Ratio (M‐H, Fixed, 95% CI) | 1.29 [0.96, 1.73] |
| 35.2 Delayed lipid infusion ≥ 5 days | 1 | 114 | Risk Ratio (M‐H, Fixed, 95% CI) | 0.35 [0.04, 3.22] |
| 36 Hypoglycaemia Show forest plot | 3 | 376 | Risk Ratio (M‐H, Fixed, 95% CI) | 1.17 [0.84, 1.63] |
| 36.1 Early lipid infusion | 1 | 168 | Risk Ratio (M‐H, Fixed, 95% CI) | 1.0 [0.67, 1.49] |
| 36.2 Delayed lipid infusion ≥ 5 days | 1 | 85 | Risk Ratio (M‐H, Fixed, 95% CI) | 1.22 [0.35, 4.24] |
| 36.3 No lipid infusion | 1 | 123 | Risk Ratio (M‐H, Fixed, 95% CI) | 1.68 [0.83, 3.41] |
| 37 Metabolic acidosis Show forest plot | 4 | 305 | Risk Ratio (M‐H, Fixed, 95% CI) | 2.05 [0.94, 4.47] |
| 37.1 Early lipid infusion | 2 | 205 | Risk Ratio (M‐H, Fixed, 95% CI) | 1.63 [0.71, 3.72] |
| 37.2 Delayed lipid infusion ≥ 5 days | 1 | 85 | Risk Ratio (M‐H, Fixed, 95% CI) | 8.80 [0.49, 158.47] |
| 37.3 No lipid infusion | 1 | 15 | Risk Ratio (M‐H, Fixed, 95% CI) | 0.0 [0.0, 0.0] |
| 38 Cholestasis Show forest plot | 5 | 616 | Risk Ratio (M‐H, Fixed, 95% CI) | 1.26 [0.86, 1.84] |
| 38.1 Early lipid infusion | 4 | 531 | Risk Ratio (M‐H, Fixed, 95% CI) | 1.12 [0.76, 1.64] |
| 38.2 Delayed lipid infusion ≥ 5 days | 1 | 85 | Risk Ratio (M‐H, Fixed, 95% CI) | 12.70 [0.74, 218.66] |
| Outcome or subgroup title | No. of studies | No. of participants | Statistical method | Effect size |
| 1 Mortality before hospital discharge Show forest plot | 14 | 1407 | Risk Ratio (M‐H, Fixed, 95% CI) | 0.90 [0.69, 1.17] |
| 1.1 Studies at low risk of bias | 5 | 568 | Risk Ratio (M‐H, Fixed, 95% CI) | 0.74 [0.42, 1.29] |
| 1.2 Methodological concern | 9 | 839 | Risk Ratio (M‐H, Fixed, 95% CI) | 0.96 [0.71, 1.30] |
| 2 Neurodevelopmental disability Show forest plot | 2 | 201 | Risk Ratio (M‐H, Fixed, 95% CI) | 1.04 [0.48, 2.23] |
| 2.1 Studies at low risk of bias | 0 | 0 | Risk Ratio (M‐H, Fixed, 95% CI) | 0.0 [0.0, 0.0] |
| 2.2 Methodological concern | 2 | 201 | Risk Ratio (M‐H, Fixed, 95% CI) | 1.04 [0.48, 2.23] |
| 3 Postnatal growth failure at discharge Show forest plot | 3 | 203 | Risk Ratio (M‐H, Fixed, 95% CI) | 0.74 [0.56, 0.97] |
| 3.1 Studies at low risk of bias | 1 | 50 | Risk Ratio (M‐H, Fixed, 95% CI) | 0.59 [0.39, 0.88] |
| 3.2 Methodological concern | 2 | 153 | Risk Ratio (M‐H, Fixed, 95% CI) | 0.84 [0.58, 1.20] |
| 4 Postnatal growth failure post discharge Show forest plot | 1 | 111 | Risk Ratio (M‐H, Fixed, 95% CI) | 0.66 [0.33, 1.32] |
| 4.1 Studies at low risk of bias | 0 | 0 | Risk Ratio (M‐H, Fixed, 95% CI) | 0.0 [0.0, 0.0] |
| 4.2 Methodological concern | 1 | 111 | Risk Ratio (M‐H, Fixed, 95% CI) | 0.66 [0.33, 1.32] |
| 5 Days to regain birth weight Show forest plot | 13 | 950 | Mean Difference (IV, Fixed, 95% CI) | ‐1.14 [‐1.73, ‐0.56] |
| 5.1 Studies at low risk of bias | 2 | 94 | Mean Difference (IV, Fixed, 95% CI) | ‐0.49 [‐1.87, 0.89] |
| 5.2 Methodological concern | 11 | 856 | Mean Difference (IV, Fixed, 95% CI) | ‐1.29 [‐1.93, ‐0.64] |
| 6 Maximal weight loss (grams) Show forest plot | 3 | 235 | Mean Difference (IV, Fixed, 95% CI) | ‐22.71 [‐33.68, ‐11.74] |
| 6.1 Studies at low risk of bias | 1 | 50 | Mean Difference (IV, Fixed, 95% CI) | 22.60 [‐7.25, 52.45] |
| 6.2 Methodological concern | 2 | 185 | Mean Difference (IV, Fixed, 95% CI) | ‐29.79 [‐41.58, ‐17.99] |
| 7 Maximal weight loss % Show forest plot | 4 | 288 | Mean Difference (IV, Fixed, 95% CI) | ‐0.33 [‐1.61, 0.96] |
| 7.1 Studies at low risk of bias | 0 | 0 | Mean Difference (IV, Fixed, 95% CI) | 0.0 [0.0, 0.0] |
| 7.2 Methodological concern | 4 | 288 | Mean Difference (IV, Fixed, 95% CI) | ‐0.33 [‐1.61, 0.96] |
| 8 Weight gain g/kg/day up to 1 month age Show forest plot | 4 | 373 | Mean Difference (IV, Fixed, 95% CI) | ‐1.50 [‐2.56, ‐0.44] |
| 8.1 Studies at low risk of bias | 1 | 122 | Mean Difference (IV, Fixed, 95% CI) | 1.5 [‐0.27, 3.27] |
| 8.2 Methodological concern | 3 | 251 | Mean Difference (IV, Fixed, 95% CI) | ‐3.16 [‐4.48, ‐1.84] |
| 9 Weight gain g/kg/day to discharge Show forest plot | 4 | Mean Difference (IV, Fixed, 95% CI) | Subtotals only | |
| 9.1 Studies at low risk of bias | 0 | 0 | Mean Difference (IV, Fixed, 95% CI) | 0.0 [0.0, 0.0] |
| 9.2 Methodological concern | 4 | 291 | Mean Difference (IV, Fixed, 95% CI) | 0.76 [‐0.02, 1.54] |
| 10 Linear growth cm/week up to 1 month age Show forest plot | 2 | 245 | Mean Difference (IV, Fixed, 95% CI) | ‐0.16 [‐0.26, ‐0.06] |
| 10.1 Studies at low risk of bias | 1 | 122 | Mean Difference (IV, Fixed, 95% CI) | 0.0 [‐0.15, 0.15] |
| 10.2 Methodological concern | 1 | 123 | Mean Difference (IV, Fixed, 95% CI) | ‐0.27 [‐0.40, ‐0.14] |
| 11 Head circumference growth cm/week up to 1 month age Show forest plot | 5 | 562 | Mean Difference (IV, Fixed, 95% CI) | 0.07 [0.03, 0.11] |
| 11.1 Studies at low risk of bias | 2 | 257 | Mean Difference (IV, Fixed, 95% CI) | 0.09 [0.02, 0.15] |
| 11.2 Methodological concern | 3 | 305 | Mean Difference (IV, Fixed, 95% CI) | 0.06 [0.02, 0.10] |
| 12 Head circumference growth cm/week to discharge Show forest plot | 3 | 229 | Mean Difference (IV, Fixed, 95% CI) | 0.07 [0.02, 0.11] |
| 12.1 Studies at low risk of bias | 0 | 0 | Mean Difference (IV, Fixed, 95% CI) | 0.0 [0.0, 0.0] |
| 12.2 Methodological concern | 3 | 229 | Mean Difference (IV, Fixed, 95% CI) | 0.07 [0.02, 0.11] |
| 13 Weight change z‐score up to 1 month age Show forest plot | 1 | 96 | Mean Difference (IV, Fixed, 95% CI) | ‐0.20 [‐0.62, 0.22] |
| 13.1 Studies at low risk of bias | 0 | 0 | Mean Difference (IV, Fixed, 95% CI) | 0.0 [0.0, 0.0] |
| 13.2 Methodological concern | 1 | 96 | Mean Difference (IV, Fixed, 95% CI) | ‐0.20 [‐0.62, 0.22] |
| 14 Weight change z‐score to discharge Show forest plot | 2 | 207 | Mean Difference (IV, Fixed, 95% CI) | 0.01 [‐0.33, 0.36] |
| 14.1 Studies at low risk of bias | 0 | 0 | Mean Difference (IV, Fixed, 95% CI) | 0.0 [0.0, 0.0] |
| 14.2 Methodological concern | 2 | 207 | Mean Difference (IV, Fixed, 95% CI) | 0.01 [‐0.33, 0.36] |
| 15 Weight change z‐score post discharge Show forest plot | 2 | 201 | Mean Difference (IV, Fixed, 95% CI) | 0.13 [‐0.26, 0.52] |
| 15.1 Studies at low risk of bias | 0 | 0 | Mean Difference (IV, Fixed, 95% CI) | 0.0 [0.0, 0.0] |
| 15.2 Methodological concern | 2 | 201 | Mean Difference (IV, Fixed, 95% CI) | 0.13 [‐0.26, 0.52] |
| 16 Head circumference change z‐score up to 1 month Show forest plot | 2 | 231 | Mean Difference (IV, Fixed, 95% CI) | 0.27 [0.08, 0.46] |
| 16.1 Studies at low risk of bias | 1 | 135 | Mean Difference (IV, Fixed, 95% CI) | 0.37 [0.15, 0.59] |
| 16.2 Methodological concern | 1 | 96 | Mean Difference (IV, Fixed, 95% CI) | 0.0 [‐0.36, 0.36] |
| 17 Head circumference change z‐score to discharge Show forest plot | 2 | 207 | Mean Difference (IV, Fixed, 95% CI) | 0.18 [‐0.15, 0.50] |
| 17.1 Studies at low risk of bias | 0 | 0 | Mean Difference (IV, Fixed, 95% CI) | 0.0 [0.0, 0.0] |
| 17.2 Methodological concern | 2 | 207 | Mean Difference (IV, Fixed, 95% CI) | 0.18 [‐0.15, 0.50] |
| 18 Head circumference change z‐score post discharge Show forest plot | 1 | 111 | Mean Difference (IV, Fixed, 95% CI) | 0.03 [‐0.46, 0.52] |
| 18.1 Studies at low risk of bias | 0 | 0 | Mean Difference (IV, Fixed, 95% CI) | 0.0 [0.0, 0.0] |
| 18.2 Methodological concern | 1 | 111 | Mean Difference (IV, Fixed, 95% CI) | 0.03 [‐0.46, 0.52] |
| 19 Days to full enteral feeds Show forest plot | 11 | 778 | Mean Difference (IV, Fixed, 95% CI) | ‐0.19 [‐1.07, 0.70] |
| 19.1 Studies at low risk of bias | 3 | 169 | Mean Difference (IV, Fixed, 95% CI) | ‐0.20 [‐1.60, 1.20] |
| 19.2 Methodological concern | 8 | 609 | Mean Difference (IV, Fixed, 95% CI) | ‐0.17 [‐1.32, 0.97] |
| 20 Late‐onset sepsis Show forest plot | 15 | 1255 | Risk Ratio (M‐H, Fixed, 95% CI) | 0.96 [0.79, 1.18] |
| 20.1 Studies at low risk of bias | 4 | 461 | Risk Ratio (M‐H, Fixed, 95% CI) | 0.94 [0.71, 1.25] |
| 20.2 Methodological concern | 11 | 794 | Risk Ratio (M‐H, Fixed, 95% CI) | 0.98 [0.73, 1.31] |
| 21 Necrotising enterocolitis Show forest plot | 14 | 1428 | Risk Ratio (M‐H, Fixed, 95% CI) | 0.93 [0.65, 1.33] |
| 21.1 Studies at low risk of bias | 5 | 511 | Risk Ratio (M‐H, Fixed, 95% CI) | 0.89 [0.50, 1.60] |
| 21.2 Methodological concern | 10 | 917 | Risk Ratio (M‐H, Fixed, 95% CI) | 0.95 [0.60, 1.50] |
| 22 Chronic lung disease at ≥ 36 weeks' PMA Show forest plot | 10 | 819 | Risk Ratio (M‐H, Fixed, 95% CI) | 1.04 [0.89, 1.23] |
| 22.1 Studies at low risk of bias | 2 | 177 | Risk Ratio (M‐H, Fixed, 95% CI) | 1.02 [0.79, 1.31] |
| 22.2 Methodological concern | 8 | 642 | Risk Ratio (M‐H, Fixed, 95% CI) | 1.06 [0.86, 1.30] |
| 23 Intraventricular haemorrhage Show forest plot | 3 | 341 | Risk Ratio (M‐H, Fixed, 95% CI) | 1.12 [0.74, 1.69] |
| 23.1 Studies at low risk of bias | 1 | 122 | Risk Ratio (M‐H, Fixed, 95% CI) | 1.05 [0.64, 1.73] |
| 23.2 Methodological concern | 2 | 219 | Risk Ratio (M‐H, Fixed, 95% CI) | 1.23 [0.60, 2.55] |
| 24 Severe intraventricular haemorrhage Show forest plot | 11 | 904 | Risk Ratio (M‐H, Fixed, 95% CI) | 1.16 [0.74, 1.82] |
| 24.1 Studies at low risk of bias | 4 | 343 | Risk Ratio (M‐H, Fixed, 95% CI) | 1.42 [0.66, 3.03] |
| 24.2 Methodological concern | 7 | 561 | Risk Ratio (M‐H, Fixed, 95% CI) | 1.03 [0.59, 1.81] |
| 25 Periventricular leukomalacia Show forest plot | 7 | 720 | Risk Ratio (M‐H, Fixed, 95% CI) | 0.55 [0.24, 1.25] |
| 25.1 Studies at low risk of bias | 3 | 299 | Risk Ratio (M‐H, Fixed, 95% CI) | 0.61 [0.21, 1.81] |
| 25.2 Methodological concern | 4 | 421 | Risk Ratio (M‐H, Fixed, 95% CI) | 0.47 [0.13, 1.69] |
| 26 Retinopathy of prematurity Show forest plot | 4 | 269 | Risk Ratio (M‐H, Fixed, 95% CI) | 0.44 [0.21, 0.93] |
| 26.1 Studies at low risk of bias | 1 | 75 | Risk Ratio (M‐H, Fixed, 95% CI) | 0.16 [0.04, 0.67] |
| 26.2 Methodological concern | 3 | 194 | Risk Ratio (M‐H, Fixed, 95% CI) | 0.85 [0.33, 2.22] |
| 27 Severe retinopathy of prematurity (> stage 2 or treated) Show forest plot | 8 | 672 | Risk Ratio (M‐H, Fixed, 95% CI) | 0.96 [0.56, 1.63] |
| 27.1 Studies at low risk of bias | 3 | 252 | Risk Ratio (M‐H, Fixed, 95% CI) | 0.77 [0.36, 1.66] |
| 27.2 Methodological concern | 5 | 420 | Risk Ratio (M‐H, Fixed, 95% CI) | 1.20 [0.57, 2.55] |
| 28 Cerebral palsy Show forest plot | 2 | 122 | Risk Ratio (M‐H, Fixed, 95% CI) | 4.0 [0.89, 17.97] |
| 28.1 Studies at low risk of bias | 0 | 0 | Risk Ratio (M‐H, Fixed, 95% CI) | 0.0 [0.0, 0.0] |
| 28.2 Methodological concern | 2 | 122 | Risk Ratio (M‐H, Fixed, 95% CI) | 4.0 [0.89, 17.97] |
| 29 Developmental delay at ≥ 18 months Show forest plot | 3 | 301 | Risk Ratio (M‐H, Fixed, 95% CI) | 1.35 [0.52, 3.53] |
| 29.1 Studies at low risk of bias | 0 | 0 | Risk Ratio (M‐H, Fixed, 95% CI) | 0.0 [0.0, 0.0] |
| 29.2 Methodological concern | 3 | 301 | Risk Ratio (M‐H, Fixed, 95% CI) | 1.35 [0.52, 3.53] |
| 30 Blindness Show forest plot | 2 | 122 | Risk Ratio (M‐H, Fixed, 95% CI) | 2.0 [0.20, 19.91] |
| 30.1 Studies at low risk of bias | 0 | 0 | Risk Ratio (M‐H, Fixed, 95% CI) | 0.0 [0.0, 0.0] |
| 30.2 Methodological concern | 2 | 122 | Risk Ratio (M‐H, Fixed, 95% CI) | 2.0 [0.20, 19.91] |
| 31 Deafness Show forest plot | 1 | 90 | Risk Ratio (M‐H, Fixed, 95% CI) | 0.0 [0.0, 0.0] |
| 31.1 Studies at low risk of bias | 0 | 0 | Risk Ratio (M‐H, Fixed, 95% CI) | 0.0 [0.0, 0.0] |
| 31.2 Methodological concern | 1 | 90 | Risk Ratio (M‐H, Fixed, 95% CI) | 0.0 [0.0, 0.0] |
| 32 Abnormal serum ammonia > 122 μmol/L Show forest plot | 1 | 61 | Risk Ratio (M‐H, Fixed, 95% CI) | 3.10 [0.13, 73.16] |
| 32.1 Studies at low risk of bias | 1 | 61 | Risk Ratio (M‐H, Fixed, 95% CI) | 3.10 [0.13, 73.16] |
| 32.2 Methodological concern | 0 | 0 | Risk Ratio (M‐H, Fixed, 95% CI) | 0.0 [0.0, 0.0] |
| 33 Abnormal blood urea nitrogen Show forest plot | 7 | 688 | Risk Ratio (M‐H, Fixed, 95% CI) | 2.77 [2.12, 3.60] |
| 33.1 Studies at low risk of bias | 2 | 183 | Risk Ratio (M‐H, Fixed, 95% CI) | 12.29 [1.66, 90.79] |
| 33.2 Methodological concern | 5 | 505 | Risk Ratio (M‐H, Fixed, 95% CI) | 2.57 [1.97, 3.34] |
| 34 Hyperglycaemia, plasma glucose > 8.3 mmol/L Show forest plot | 5 | 505 | Risk Ratio (M‐H, Fixed, 95% CI) | 0.69 [0.49, 0.96] |
| 34.1 Studies at low risk of bias | 0 | 0 | Risk Ratio (M‐H, Fixed, 95% CI) | 0.0 [0.0, 0.0] |
| 34.2 Methodological concern | 5 | 505 | Risk Ratio (M‐H, Fixed, 95% CI) | 0.69 [0.49, 0.96] |
| 35 Hyperglycaemia treated with insulin Show forest plot | 5 | 534 | Risk Ratio (M‐H, Fixed, 95% CI) | 1.24 [0.93, 1.66] |
| 35.1 Studies at low risk of bias | 0 | 0 | Risk Ratio (M‐H, Fixed, 95% CI) | 0.0 [0.0, 0.0] |
| 35.2 Methodological concern | 5 | 534 | Risk Ratio (M‐H, Fixed, 95% CI) | 1.24 [0.93, 1.66] |
| 36 Hypoglycaemia Show forest plot | 3 | 376 | Risk Ratio (M‐H, Fixed, 95% CI) | 1.17 [0.84, 1.63] |
| 36.1 Studies at low risk of bias | 0 | 0 | Risk Ratio (M‐H, Fixed, 95% CI) | 0.0 [0.0, 0.0] |
| 36.2 Methodological concern | 3 | 376 | Risk Ratio (M‐H, Fixed, 95% CI) | 1.17 [0.84, 1.63] |
| 37 Metabolic acidosis Show forest plot | 4 | 305 | Risk Ratio (M‐H, Fixed, 95% CI) | 2.05 [0.94, 4.47] |
| 37.1 Studies at low risk of bias | 0 | 0 | Risk Ratio (M‐H, Fixed, 95% CI) | 0.0 [0.0, 0.0] |
| 37.2 Methodological concern | 4 | 305 | Risk Ratio (M‐H, Fixed, 95% CI) | 2.05 [0.94, 4.47] |
| 38 Cholestasis Show forest plot | 5 | 616 | Risk Ratio (M‐H, Fixed, 95% CI) | 1.26 [0.86, 1.84] |
| 38.1 Studies at low risk of bias | 2 | 249 | Risk Ratio (M‐H, Fixed, 95% CI) | 1.21 [0.67, 2.17] |
| 38.2 Methodological concern | 3 | 367 | Risk Ratio (M‐H, Fixed, 95% CI) | 1.30 [0.79, 2.13] |