| 1 ADAS‐Cog mean changes in score from baseline at 6 months or later (ITT‐LOCF) Show forest plot | 10 | 4236 | Mean Difference (IV, Fixed, 95% CI) | ‐2.37 [‐2.73, ‐2.02] |
|
| 2 MMSE mean change in score from baseline at 6 months or later (ITT‐LOCF) Show forest plot | 9 | 3118 | Mean Difference (IV, Fixed, 95% CI) | 1.37 [1.13, 1.61] |
|
| 3 Activities of daily living (DAD) mean changes in score from baseline at 6 months or later (ITT‐LOCF) Show forest plot | 2 | 669 | Mean Difference (IV, Fixed, 95% CI) | 4.39 [1.96, 6.81] |
|
| 4 Activities of daily living (PDS) mean change in score from baseline at 6 months (ITT) Show forest plot | 5 | 2188 | Mean Difference (IV, Fixed, 95% CI) | 2.46 [1.55, 3.37] |
|
| 5 Behavioural disturbance (NPI) mean changes from score from baseline at 6 months (ITT) Show forest plot | 3 | 1005 | Mean Difference (IV, Fixed, 95% CI) | ‐2.44 [‐4.12, ‐0.76] |
|
| 6 Global assessment with carer input (CIBIC‐Plus) (numbers improved or unchanged) at 6 months (ITT) Show forest plot | 3 | 1306 | Odds Ratio (M‐H, Fixed, 95% CI) | 1.84 [1.47, 2.30] |
|
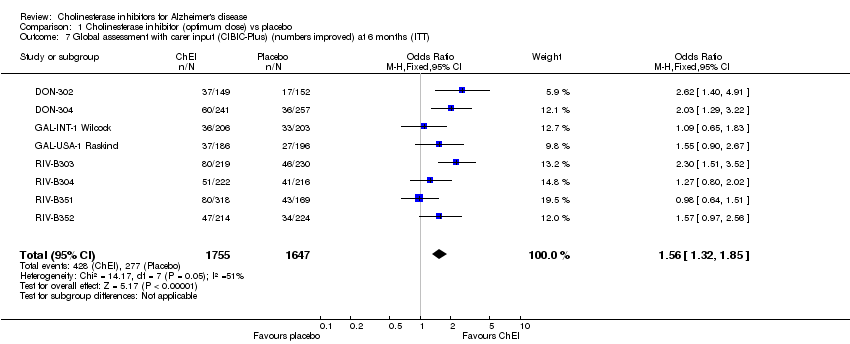
| 7 Global assessment with carer input (CIBIC‐Plus) (numbers improved) at 6 months (ITT) Show forest plot | 8 | 3402 | Odds Ratio (M‐H, Fixed, 95% CI) | 1.56 [1.32, 1.85] |
|
| 8 GBS‐global assessment mean change in score from baseline at 52 weeks (ITT) Show forest plot | 1 | 282 | Mean Difference (IV, Fixed, 95% CI) | ‐3.26 [‐7.38, 0.86] |
|
| 9 Time spent by carer assisting in IADL and PSMS (mean changes in score from baseline min/day) at 6 months (ITT) Show forest plot | 1 | 221 | Mean Difference (IV, Fixed, 95% CI) | ‐52.4 [‐118.78, 13.98] |
|
| 10 Total number of withdrawals before end of treatment at 6 months or later (ITT) Show forest plot | 13 | 5143 | Odds Ratio (M‐H, Fixed, 95% CI) | 1.76 [1.54, 2.02] |
|
| 11 Total number of withdrawals due to an adverse event before end of treatment at 6 months or later (ITT) Show forest plot | 13 | 5143 | Odds Ratio (M‐H, Fixed, 95% CI) | 2.32 [1.95, 2.76] |
|
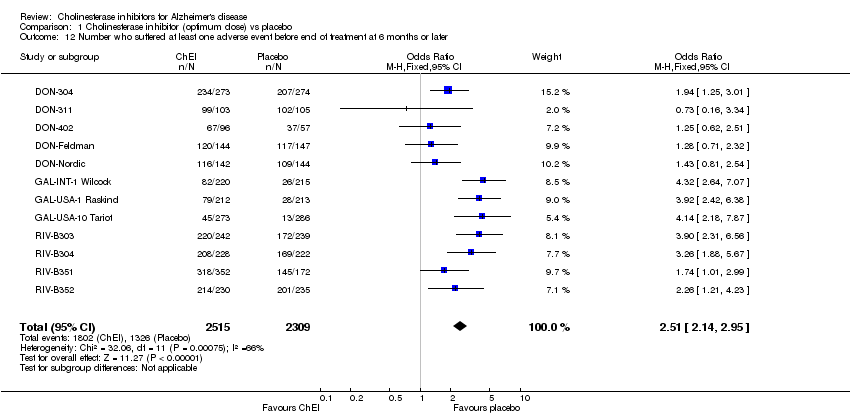
| 12 Number who suffered at least one adverse event before end of treatment at 6 months or later Show forest plot | 12 | 4824 | Odds Ratio (M‐H, Fixed, 95% CI) | 2.51 [2.14, 2.95] |
|
| 13 Number who suffered at least one adverse event of abdominal pain before end of treatment at 6 months or later Show forest plot | 7 | 2704 | Odds Ratio (M‐H, Fixed, 95% CI) | 1.95 [1.46, 2.61] |
|
| 14 Number who suffered at least one adverse event of abnormal gait before end of treatment at 6 months or later Show forest plot | 1 | 208 | Odds Ratio (M‐H, Fixed, 95% CI) | 1.60 [0.63, 4.09] |
|
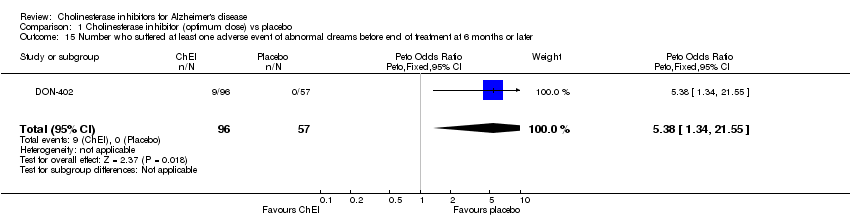
| 15 Number who suffered at least one adverse event of abnormal dreams before end of treatment at 6 months or later Show forest plot | 1 | 153 | Peto Odds Ratio (Peto, Fixed, 95% CI) | 5.38 [1.34, 21.55] |
|
| 16 Number who suffered at least one adverse event of accidental injury before end of treatment at 6 monthsorlater Show forest plot | 3 | 651 | Odds Ratio (M‐H, Fixed, 95% CI) | 1.35 [0.86, 2.10] |
|
| 17 Number who suffered at least one adverse event of agitation before end of treatment at 6 months or later Show forest plot | 2 | 767 | Odds Ratio (M‐H, Fixed, 95% CI) | 0.95 [0.57, 1.56] |
|
| 18 Number who suffered at least one adverse event of anorexia before end of treatment at 6 months or later Show forest plot | 10 | 4419 | Odds Ratio (M‐H, Fixed, 95% CI) | 3.75 [2.89, 4.87] |
|
| 19 Number who suffered at least one adverse event of anxiety before end of treatment at 6 months or later Show forest plot | 1 | 286 | Odds Ratio (M‐H, Fixed, 95% CI) | 2.01 [0.82, 4.90] |
|
| 20 Number who suffered at least one adverse event of arthralgia before end of treatment at 6 months or later Show forest plot | 2 | 498 | Odds Ratio (M‐H, Fixed, 95% CI) | 1.22 [0.62, 2.40] |
|
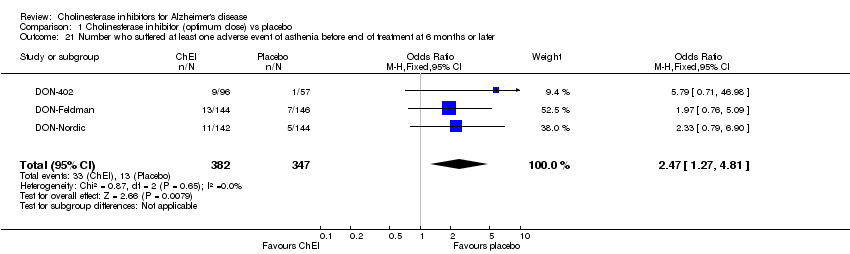
| 21 Number who suffered at least one adverse event of asthenia before end of treatment at 6 months or later Show forest plot | 3 | 729 | Odds Ratio (M‐H, Fixed, 95% CI) | 2.47 [1.27, 4.81] |
|
| 22 Number who suffered at least one adverse event of back pain before end of treatment at 6 months or later Show forest plot | 1 | 290 | Odds Ratio (M‐H, Fixed, 95% CI) | 1.64 [0.62, 4.36] |
|
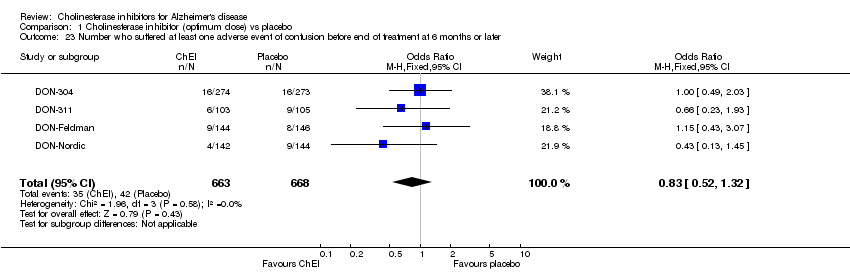
| 23 Number who suffered at least one adverse event of confusion before end of treatment at 6 months or later Show forest plot | 4 | 1331 | Odds Ratio (M‐H, Fixed, 95% CI) | 0.83 [0.52, 1.32] |
|
| 24 Number who suffered at least one adverse event of conjunctivitis before end of treatment at 6 months or later Show forest plot | 1 | 208 | Odds Ratio (M‐H, Fixed, 95% CI) | 1.97 [0.70, 5.55] |
|
| 25 Number who suffered at least one adverse event of constipation before end of treatment at 6 months or later Show forest plot | 1 | 286 | Odds Ratio (M‐H, Fixed, 95% CI) | 0.66 [0.23, 1.91] |
|
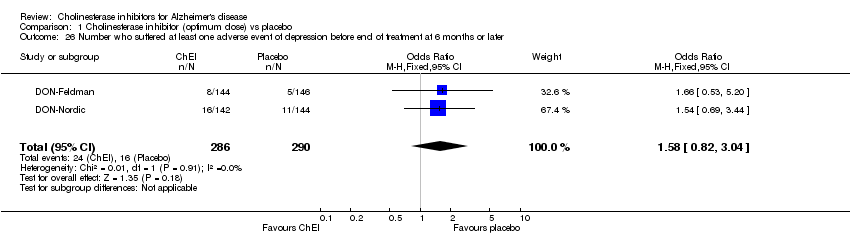
| 26 Number who suffered at least one adverse event of depression before end of treatment at 6 months or later Show forest plot | 2 | 576 | Odds Ratio (M‐H, Fixed, 95% CI) | 1.58 [0.82, 3.04] |
|
| 27 Number who suffered at least one adverse event of diarrhoea before end of treatment at 6 months or later Show forest plot | 13 | 5173 | Odds Ratio (M‐H, Fixed, 95% CI) | 1.91 [1.59, 2.30] |
|
| 28 Number who suffered at least one adverse event of dizziness before end of treatment at 6 months or later Show forest plot | 12 | 4583 | Odds Ratio (M‐H, Fixed, 95% CI) | 1.99 [1.64, 2.42] |
|
| 29 Number who suffered at least one adverse event of ecchymosis before end of treatment at 6 months or later Show forest plot | 1 | 208 | Odds Ratio (M‐H, Fixed, 95% CI) | 1.58 [0.54, 4.61] |
|
| 30 Number who suffered at least one adverse event of fatigue before end of treatment at 6 months or later Show forest plot | 1 | 319 | Odds Ratio (M‐H, Fixed, 95% CI) | 4.39 [1.21, 15.85] |
|
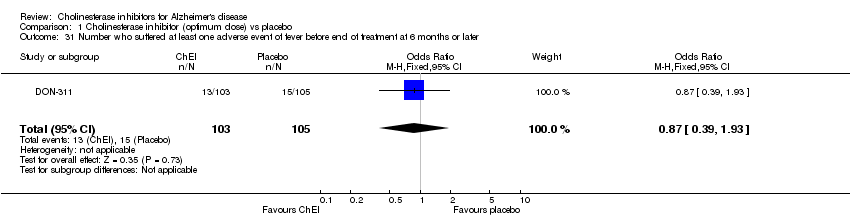
| 31 Number who suffered at least one adverse event of fever before end of treatment at 6 months or later Show forest plot | 1 | 208 | Odds Ratio (M‐H, Fixed, 95% CI) | 0.87 [0.39, 1.93] |
|
| 32 Number who suffered at least one adverse event of fracture before end of treatment at 6 months or later Show forest plot | 5 | 2269 | Odds Ratio (M‐H, Fixed, 95% CI) | 0.96 [0.53, 1.74] |
|
| 33 Number who suffered at least one adverse event of haemorrhage before end of treatment at 6 months or later Show forest plot | 1 | 208 | Odds Ratio (M‐H, Fixed, 95% CI) | 1.02 [0.35, 3.02] |
|
| 34 Number who suffered at least one adverse event of headache before end of treatment at 6 months or later Show forest plot | 9 | 3686 | Odds Ratio (M‐H, Fixed, 95% CI) | 1.56 [1.27, 1.91] |
|
| 35 Number who suffered at least one adverse event of hostility before end of treatment at 6 months or later Show forest plot | 2 | 576 | Odds Ratio (M‐H, Fixed, 95% CI) | 0.96 [0.49, 1.87] |
|
| 36 Number who suffered at least one adverse event of increased cough before end of treatment at 6 months or later Show forest plot | 1 | 208 | Odds Ratio (M‐H, Fixed, 95% CI) | 1.19 [0.56, 2.52] |
|
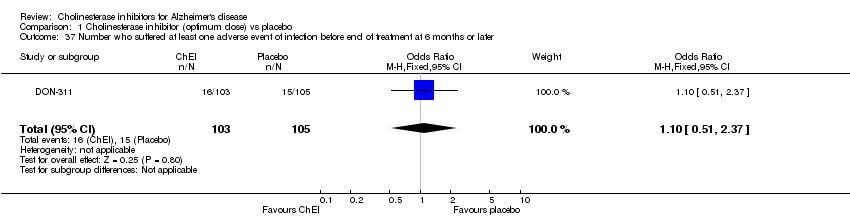
| 37 Number who suffered at least one adverse event of infection before end of treatment at 6 months or later Show forest plot | 1 | 208 | Odds Ratio (M‐H, Fixed, 95% CI) | 1.10 [0.51, 2.37] |
|
| 38 Number who suffered at least one adverse event of insomnia before end of treatment at 6 months or later Show forest plot | 7 | 2906 | Odds Ratio (M‐H, Fixed, 95% CI) | 1.49 [1.12, 2.00] |
|
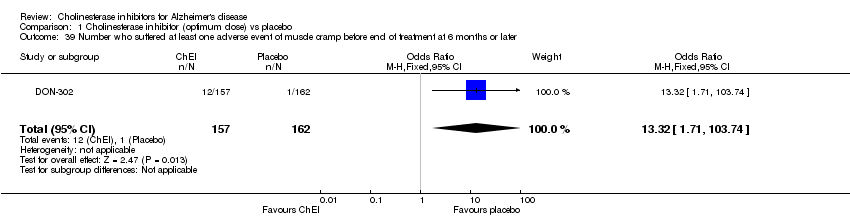
| 39 Number who suffered at least one adverse event of muscle cramp before end of treatment at 6 months or later Show forest plot | 1 | 319 | Odds Ratio (M‐H, Fixed, 95% CI) | 13.32 [1.71, 103.74] |
|
| 40 Number who suffered at least one adverse event of myasthenia before end of treatment at 6 months or later Show forest plot | 1 | 208 | Odds Ratio (M‐H, Fixed, 95% CI) | 2.10 [0.51, 8.64] |
|
| 41 Number who suffered at least one adverse event of nausea before end of treatment at 6 months or later Show forest plot | 13 | 5089 | Odds Ratio (M‐H, Fixed, 95% CI) | 4.87 [4.13, 5.74] |
|
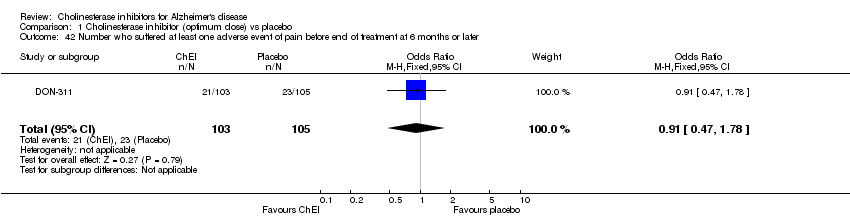
| 42 Number who suffered at least one adverse event of pain before end of treatment at 6 months or later Show forest plot | 1 | 208 | Odds Ratio (M‐H, Fixed, 95% CI) | 0.91 [0.47, 1.78] |
|
| 43 Number who suffered at least one adverse event of peripheral oedema before end of treatment at 6 monthsorlater Show forest plot | 1 | 208 | Odds Ratio (M‐H, Fixed, 95% CI) | 2.08 [1.01, 4.28] |
|
| 44 Number who suffered at least one adverse event of a rash before end of treatment at 6 months or later Show forest plot | 1 | 208 | Odds Ratio (M‐H, Fixed, 95% CI) | 0.72 [0.37, 1.42] |
|
| 45 Number who suffered at least one adverse event of a respiratory tract infection before end of treatment at 6 m Show forest plot | 1 | 290 | Odds Ratio (M‐H, Fixed, 95% CI) | 1.02 [0.49, 2.12] |
|
| 46 Number who suffered at least one adverse event of rhinitis before end of treatment at 6 months or later Show forest plot | 2 | 527 | Odds Ratio (M‐H, Fixed, 95% CI) | 1.38 [0.74, 2.58] |
|
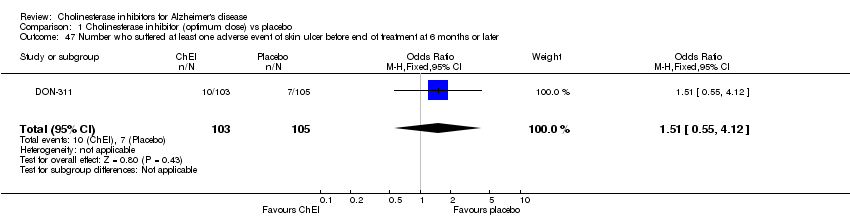
| 47 Number who suffered at least one adverse event of skin ulcer before end of treatment at 6 months or later Show forest plot | 1 | 208 | Odds Ratio (M‐H, Fixed, 95% CI) | 1.51 [0.55, 4.12] |
|
| 48 Number who suffered at least one adverse event of syncope before end of treatment at 6 months or later Show forest plot | 5 | 2206 | Odds Ratio (M‐H, Fixed, 95% CI) | 1.90 [1.09, 3.33] |
|
| 49 Number who suffered at least one adverse event of tremor before end of treatment at 6 months or later Show forest plot | 2 | 633 | Odds Ratio (M‐H, Fixed, 95% CI) | 6.82 [1.99, 23.37] |
|
| 50 Number who suffered at least one adverse event of urinary tract infection before end of treatment at 6 month Show forest plot | 3 | 784 | Odds Ratio (M‐H, Fixed, 95% CI) | 0.90 [0.54, 1.48] |
|
| 51 Number who suffered at least one adverse event of vertigo before end of treatment at 6 months or later Show forest plot | 1 | 286 | Odds Ratio (M‐H, Fixed, 95% CI) | 3.95 [1.08, 14.46] |
|
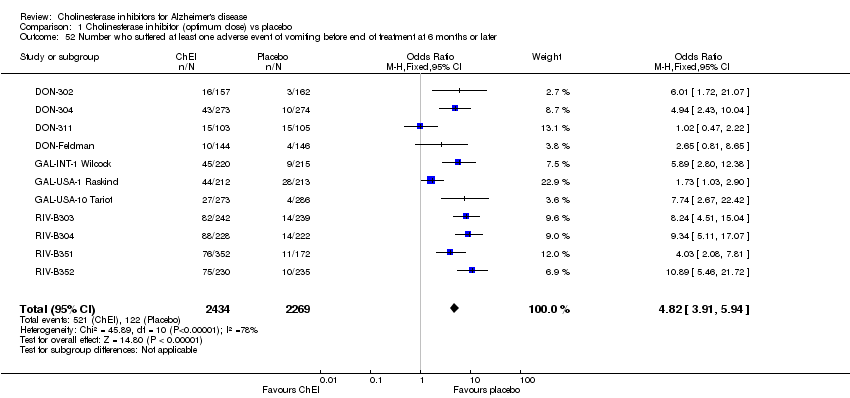
| 52 Number who suffered at least one adverse event of vomiting before end of treatment at 6 months or later Show forest plot | 11 | 4703 | Odds Ratio (M‐H, Fixed, 95% CI) | 4.82 [3.91, 5.94] |
|
| 53 Number who suffered at least one adverse event of weight loss before end of treatment at 6 months or later Show forest plot | 4 | 1358 | Odds Ratio (M‐H, Fixed, 95% CI) | 2.99 [1.89, 4.75] |
|