Metformina versus la píldora anticonceptiva oral combinada para el hirsutismo, el acné y el patrón menstrual en el síndrome de ovarios poliquísticos
Resumen
Antecedentes
La metformina se ha propuesto como un posible tratamiento a largo plazo más seguro y efectivo que la píldora anticonceptiva oral (PAO) en mujeres con síndrome de ovarios poliquísticos (SOPQ). Es importante comparar directamente la eficacia y la seguridad de la metformina versus las PAO para el tratamiento a largo plazo de las mujeres con SOPQ. Esta es una actualización de una revisión Cochrane que compara los agentes sensibilizantes a la insulina con la PAO, y solo incluye estudios sobre la metformina.
Objetivos
Evaluar la efectividad y la seguridad de la metformina versus las PAO (solas o en combinación) para mejorar las características clínicas, hormonales y metabólicas del SOPQ.
Métodos de búsqueda
En agosto de 2019 se realizaron búsquedas en el registro de ensayos del Grupo Cochrane de Ginecología y Fertilidad (Cochrane Gynaecology and Fertility Group), en el Registro Cochrane Central de Ensayos Controlados (Cochrane Central Register of Controlled Trials, CENTRAL), en MEDLINE, Embase y CINAHL, en los registros de ensayos, se realizaron búsquedas manuales en las referencias de los artículos identificados y se estableció contacto con expertos en el campo para identificar estudios adicionales.
Criterios de selección
Se incluyeron ensayos controlados aleatorizados (ECA) sobre la administración de metformina versus PAO (solas o en combinación) para mujeres con SOPQ.
Obtención y análisis de los datos
Se utilizaron los métodos estándar recomendados por Cochrane. Los criterios de valoración principales de la revisión fueron los parámetros clínicos del hirsutismo y los eventos adversos, ya sea graves (que requirieron la interrupción del fármaco) o menores. En presencia de heterogeneidad sustancial (estadística I2 > 50), que se podría explicar por los análisis de subgrupos preespecificados sobre la base del IMC, los subgrupos se informaron por separado.
Resultados principales
Esta es una actualización importante. Se identificaron 38 estudios adicionales. Se incluyeron 44 ECA (2253 mujeres), con 39 ECA en mujeres adultas (2047 mujeres) y cinco ECA en mujeres adolescentes (206 mujeres). La calidad de la evidencia varió de muy baja a baja. Las limitaciones principales fueron el riesgo de sesgo, la imprecisión y la inconsistencia.
Metformina versus PAO
En las mujeres adultas, no se conoce con certeza el efecto de la metformina comparada con la PAO sobre el hirsutismo en el subgrupo con un índice de masa corporal (IMC) < 25 kg/m2 (diferencia de medias [DM] 0,38; intervalo de confianza [IC] del 95%: ‐0,44 a 1,19; tres ECA, n = 134; I2 = 50%, evidencia de calidad muy baja) y el IMC del subgrupo > 30 kg/m2 (DM ‐0,38; IC del 95%: ‐1,93 a 1,17; dos ECA, n = 85, I2 = 34%, evidencia de calidad baja). La metformina puede ser menos efectiva para mejorar el hirsutismo en comparación con la PAO en el subgrupo con IMC 25 kg/m2 a 30 kg/m2(DM 1,92; IC del 95%: 1,21 a 2,64; cinco ECA, n = 254, I2 = 0%, evidencia de calidad baja). La metformina puede aumentar la tasa de eventos adversos gastrointestinales graves en comparación con la PAO (odds ratio [OR] de Peto 6,42; IC del 95%: 2,98 a 13,84; 11 ECA, n = 602, I2 = 0%, evidencia de calidad baja). La metformina puede disminuir la incidencia de otros eventos adversos graves en comparación con la PAO (OR de Peto 0,20; IC del 95%: 0,09 a 0,44; ocho ECA, n = 363;I2 = 0%, evidencia de calidad baja). No hubo ensayos que informaran sobre eventos adversos menores.
En las adolescentes, no se conoce si existen diferencias entre la metformina y la PAO en cuanto al hirsutismo y los eventos adversos.
Metformina versus metformina combinada con PAO
En las mujeres adultas, la metformina puede ser menos efectiva para mejorar el hirsutismo en comparación con la metformina combinada con la PAO (DM 1,36, IC del 95%: 0,62 a 2,11; tres ECA, n = 135, I2= 9%, evidencia de calidad baja). No se conoce con certeza si hubo alguna diferencia entre la metformina y la metformina combinada con la PAO para los eventos adversos gastrointestinales graves (OR 0,74; IC del 95%: 0,21 a 2,53; tres ECA, n = 171, I2= 0%, evidencia de calidad baja), ni para otros eventos adversos graves (OR 0,56; IC del 95%: 0,11 a 2,82; dos ECA, n = 109, I2= 44%, evidencia de calidad baja). No hubo ensayos que informaran sobre eventos adversos menores. En las adolescentes no hubo ensayos para esta comparación.
PAO versus metformina combinada con PAO
En las mujeres adultas, la PAO puede ser menos efectiva para mejorar el hirsutismo en comparación con la metformina combinada con la PAO (DM 0,54; IC del 95%: 0,20 a 0,89; seis ECA, n = 389, I2= 1%, evidencia de calidad baja). La PAO puede disminuir la incidencia de eventos adversos gastrointestinales graves, en comparación con la metformina combinada con la PAO (OR 0,20, IC del 95%: 0,06 a 0,72; cinco ECA, n = 228, I2 = 0%, evidencia de calidad baja). No se conoce con certeza si existe alguna diferencia entre la PAO y la metformina combinada con la PAO para otros eventos adversos graves (OR 1,61; IC del 95%: 0,49 a 5,37; cuatro ECA; n = 159; I2 = 12%; evidencia de calidad baja). La PAO puede disminuir la incidencia de eventos adversos menores (gastrointestinales), en comparación con la metformina combinada con la PAO (OR 0,06; IC del 95%: 0,01 a 0,44; dos ECA, n = 98, I2 = 0%, evidencia de calidad baja). En las adolescentes no se sabe si hay diferencias entre la PAO, en comparación con la metformina combinada con la PAO, en cuanto al hirsutismo o los eventos adversos.
Conclusiones de los autores
En las mujeres adultas con SOPQ, la metformina puede ser menos efectiva para mejorar el hirsutismo en comparación con la PAO en el subgrupo de IMC de 25 kg/m2 a 30 kg/m2, pero no existe certeza acerca de si hubo diferencias entre la metformina y la PAO en los subgrupos de IMC < 25 kg/m2 e IMC > 30 kg/m2. En comparación con la PAO, la metformina puede aumentar la incidencia de eventos adversos gastrointestinales graves y disminuir la incidencia de otros eventos adversos graves; ningún ensayo informó sobre eventos adversos menores. La metformina sola o la PAO sola pueden ser menos efectivas para mejorar el hirsutismo, en comparación con la metformina combinada con la PAO. No se conoce con certeza si hay diferencias entre la PAO sola y la metformina sola, en comparación con la metformina combinada con la PAO, para los eventos adversos graves o menores, excepto para la PAO versus la metformina combinada con la PAO, donde la PAO puede disminuir la incidencia de eventos adversos gastrointestinales graves y menores.
En las mujeres adolescentes con SOPQ, no existe certeza de que haya diferencias entre cualquiera de las comparaciones para el hirsutismo y los eventos adversos, debido a la falta de evidencia o a la calidad muy baja de la evidencia.
Se necesitan más ECA grandes y bien diseñados que estratifiquen según el IMC para evaluar la metformina versus la PAO y las combinaciones en mujeres con SOPQ, en concreto en las adolescentes.
PICO
Resumen en términos sencillos
Metformina versus la píldora anticonceptiva oral combinada para el vello facial y corporal excesivo, el acné y los trastornos menstruales en el síndrome de ovarios poliquísticos
Pregunta de la revisión
¿La metformina es más efectiva y segura que la píldora anticonceptiva oral (PAO) (solas o en combinación) para mejorar las características clínicas, hormonales y metabólicas (ciclos menstruales irregulares/prolongados, exceso de vello facial y corporal, acné, obesidad) en mujeres con síndrome de ovarios poliquísticos (SOPQ)?
Antecedentes
El síndrome de ovarios poliquísticos es un problema hormonal y metabólico frecuente que afecta a aproximadamente 1 de cada 10 mujeres en edad fértil, y que a menudo da lugar a períodos menstruales poco frecuentes, exceso de vello corporal y facial, acné y ovarios poliquísticos (ovarios agrandados debido a numerosas y pequeñas acumulaciones de líquido [folículos]). La PAO ha sido durante mucho tiempo un tratamiento efectivo probado para las mujeres con SOPQ que no intentan quedar embarazadas. Más recientemente se ha defendido la metformina (un fármaco que reduce los niveles de insulina y de azúcar en la sangre, y que se utiliza a menudo para tratar la diabetes de tipo 2) como un tratamiento a largo plazo posiblemente más efectivo y seguro que la PAO en las mujeres con SOPQ. Por lo tanto, es importante comparar directamente los efectos beneficiosos y los riesgos de estos dos tratamientos en mujeres con SOPQ.
Características de los estudios
Se encontraron 44 ensayos controlados aleatorizados (ECA) que compararon la metformina versus la PAO (solas o en combinación) en 2253 mujeres con SOPQ, de los que 39 ECA fueron en mujeres adultas (2047 mujeres) y cinco en mujeres adolescentes (206 mujeres). Se combinaron los resultados de los estudios y se evaluó su calidad para valorar cuánta certeza podía haber en sus resultados. La evidencia está actualizada hasta agosto de 2019.
Resultados clave
En las mujeres adultas, cuando se compara la metformina con la PAO en cuanto a la mejora del vello facial y corporal excesivo, la metformina puede ser menos efectiva en las mujeres con SOPQ con un índice de masa corporal (IMC) entre 25 kg/m2 y 30 kg/m2, pero no existe certeza acerca del efecto con un IMC inferior a 25 kg/m2 o superior a 30 kg/m2. En cuanto a los eventos adversos graves (que requirieron la interrupción del fármaco), la metformina puede dar lugar a una mayor incidencia de eventos gastrointestinales (es decir, náuseas, vómitos, diarrea), pero a una menor incidencia de otros efectos adversos. La evidencia indica que si la tasa de eventos adversos gastrointestinales graves de la PAO es del 0,3%, entonces la tasa de eventos adversos gastrointestinales graves después de la metformina estaría entre el 1% y el 4,5%. La evidencia también indica que si la tasa de otros eventos adversos graves después de la PAO es del 12%, la tasa de otros eventos adversos graves después de la metformina estaría entre el 1% y el 6%.
La metformina sola o la PAO sola pueden ser menos efectivas para mejorar el exceso de vello facial y corporal, en comparación con la combinación de la PAO con la metformina. En cuanto a los eventos adversos graves, no se conoce con certeza si hubo diferencias entre la metformina y la metformina combinada con la PAO para los eventos adversos gastrointestinales o de otro tipo. Si la tasa de eventos adversos gastrointestinales graves después de la metformina combinada con la PAO es del 7%, entonces la tasa correspondiente después de la metformina estaría entre el 2% y el 17%, y si la tasa de otros eventos adversos graves después de la metformina combinada con la PAO es del 6%, la tasa correspondiente después de la metformina estaría entre el 0,7% y el 15%.
Cuando se compara la PAO con la metformina combinada con la PAO en cuanto a los eventos adversos graves, puede haber una menor incidencia de eventos adversos gastrointestinales con la PAO, pero no se conoce si hay alguna diferencia en cuanto a otros eventos adversos. Si la tasa de eventos adversos gastrointestinales graves es del 10% después de la metformina combinada con la PAO, la tasa correspondiente después de la PAO estaría entre el 1% y el 7%. Si la tasa de otros eventos adversos graves es del 4% después de la metformina combinada con la PAO, la tasa correspondiente después de la PAO estaría entre el 2% y el 18%.
En las mujeres adolescentes, no se conoce con certeza si existen diferencias entre cualquiera de las tres comparaciones de esta revisión en cuanto al hirsutismo y los eventos adversos (tanto graves que requieren la interrupción del fármaco como leves), debido a la falta de evidencia o a la calidad muy baja de la evidencia basada en un ensayo.
Calidad de la evidencia
La evidencia fue de calidad baja a muy baja. Las principales limitaciones de la evidencia fueron el informe deficiente sobre la metodología de los estudios y la falta de precisión y consistencia de los resultados.
Authors' conclusions
Summary of findings
| Metformin compared to OCP for hirsutism, acne, and menstrual pattern in adult women with PCOS | |||||||
| Patient or population: adult women with PCOS | |||||||
| Outcomes | Anticipated absolute effects* (95% CI) | Relative effect | № of participants | Quality of the evidence | Comments | ||
|---|---|---|---|---|---|---|---|
| Risk with OCP | Risk with metformin | ||||||
| Hirsutism ‐ Clinical F‐G score | BMI ≤ 25kg/m2 | The mean hirsutism ‐ Clinical F‐G score was 7.5 | MD 0.38 higher | ‐ | 134 | ⊕⊝⊝⊝ | |
| BMI > 25 kg/m2 < 30 kg/m2 | The mean hirsutism ‐ Clinical F‐G score was 6.44 | MD 1.92 higher | ‐ | 254 (5 RCTs) | ⊕⊕⊝⊝ LOW1,4 | ||
| BMI ≥ 30 kg/m2 | The mean hirsutism ‐ Clinical F‐G score was 6.05 | MD 0.38 lower | ‐ | 85 (2 RCTs) | ⊕⊕⊝⊝ LOW1,5 | ||
| Adverse events ‐ Severe | Gastro‐intestinal | 3 per 1 000 | 21 per 1 000 | OR 6.42 | 602 | ⊕⊕⊝⊝ | |
| Others | 122 per 1000 | 27 per 1000 (12 to 57) | OR 0.20 | 363 | ⊕⊕⊝⊝ | ||
| Adverse events ‐ Minor | Gastro‐intestinal | No trials reported on outcome "Adverse events ‐ Minor ‐ Gastro‐intestinal" | |||||
| Others | No trials reported on outcome "Adverse events ‐ Minor ‐ Others" | ||||||
| Improved menstrual pattern | Shortening of intermenstrual days | The mean improved menstrual pattern (ie. shortening of intermenstrual days) was 32.4 | MD 6.05 higher | ‐ | 153 | ⊕⊕⊝⊝⊝ | |
| An initiation of menses or cycle regularity) ‐ ≤ | 1000 per 1 000 | 1000 per 1 000 | OR 0.07 | 17 | ⊕⊕⊝⊝ | ||
| An initiation of menses or cycle regularity)‐ BMI > 25 kg/m2 < 30 kg/m2 | 931 per 1000 | 669 per 1000 (486 to 817) | OR 0.15 (0.07 to 0.33) | 129 (3 RCTs) | ⊕⊝⊝⊝ VERY LOW 7,8,9 | ||
| An initiation of menses or cycle regularity) ‐ BMI ≥ 30 kg/m2 | 1000 per 1 000 | 1000 per 1 000 | OR 0.09 (0.01 to 1.62) | 18 (1 RCT) | ⊕⊝⊝⊝ | ||
| An initiation of menses or cycle regularity) ‐ BMI not stated | 500 per 1000 | 661 per 1000 (281 to 906) | OR 1.95 (0.39 to 9.65) | 25 (1 RCT) | ⊕⊝⊝⊝ VERY LOW 8,10 | ||
| Acne ‐ Visual analogue scale | The mean acne ‐ Visual analogue scale was 1 | MD 0.90 higher | ‐ | 34 | ⊕⊕⊝⊝ | ||
| BMI (kg/m2) | BMI ≤ 25 kg/m2 | The mean BMI (kg/m2) was 22.7 | MD 0.59 lower | ‐ | 451 | ⊕⊝⊝⊝ VERY LOW 1,12,13 | |
| BMI > 25 kg/m2 < 30 kg/m2 | The mean BMI (kg/m2) was 27.4 | MD 0.11 higher | ‐ | 353 (8 RCTs) | ⊕⊝⊝⊝ VERY LOW 1,14,15 | ||
| BMI ≥ 30 kg/m2 | The mean BMI (kg/m2) was 35.1 | MD 2.31 lower | ‐ | 119 (3 RCTs) | ⊕⊝⊝⊝ VERY LOW 1, 15,16 | ||
| *The risk in the intervention group (and its 95% confidence interval) is based on the assumed risk in the comparison group and the relative effect of the intervention (and its 95% CI). | |||||||
| GRADE Working Group grades of evidence | |||||||
| 1 Evidence downgraded by one level for serious risk of bias ‐ the majority of the RCTs have unclear or high risk of bias 3 Evidence downgraded by one level for serious imprecision – 95% CI includes both appreciable effect and little or no effect and low number of participants (total number of participants < 400) 4 Evidence downgraded by one level for serious imprecision – low number of participants (total number of participants < 400) 5 Evidence downgraded by one level for serious imprecision ‐ low number of participants (total number of participants < 400) and 95% CI includes both appreciable benefit and harm 6 Evidence downgraded by one level for serious risk of bias ‐ the majority of the RCTs have unclear risk of bias 7 Evidence downgraded by one level for serious imprecision – low number of events (total number of events < 300) 8 Evidence downgraded by one level for serious risk of bias ‐ the majority of the RCTs have high risk of bias 9 Evidence downgraded by one level for serious inconsistency (I2 = 51%) as unexplained heterogeneity (i.e. heterogeneity not explained by subgrouping of data according to mean study BMI) 10 Evidence downgraded by two levels for very serious imprecision – 95% CI includes both appreciable benefit and harm or no effect and very low number of events (total number of events < 300) 11 Evidence downgraded by two levels for serious imprecision – 95% CI includes both appreciable benefit and harm or no effect and low number of participants (total number of participants < 400) 12 Evidence downgraded by one level for serious inconsistency (I2 = 76%) as unexplained heterogeneity (i.e. heterogeneity not explained by subgrouping of data according to mean study BMI) 13 Evidence downgraded by one level for serious imprecision – 95% CI includes both appreciable effect and little or no effect 14 Evidence downgraded by one level for serious inconsistency (I2 = 72%) as unexplained heterogeneity (i.e. heterogeneity not explained by subgrouping of data according to mean study BMI) 15 Evidence downgraded by one level for serious imprecision ‐ low number of participants (total number of participants < 400) and 95% CI includes both appreciable effect and little or no effect 16 Evidence downgraded by one level for serious inconsistency (I2 = 52%) as unexplained heterogeneity (i.e. heterogeneity not explained by subgrouping of data according to mean study BMI) | |||||||
| Metformin compared to metformin combined with OCP for hirsutism, acne, and menstrual pattern in adult women with PCOS | |||||||
| Patient or population: adult women with PCOS | |||||||
| Outcomes | Anticipated absolute effects* (95% CI) | Relative effect | № of participants | Quality of the evidence | Comments | ||
|---|---|---|---|---|---|---|---|
| Risk with Metformin combined with OCP | Risk with metformin | ||||||
| Hirsutism ‐ Clinical F‐G score | The mean hirsutism ‐ Clinical F‐G score was 5.6 | MD 1.36 higher | ‐ | 135 | ⊕⊕⊝⊝ | ||
| Adverse events ‐ Severe | Gastro‐intestinal | 74 per 1 000 | 56 per 1 000 | OR 0.74 | 171 | ⊕⊕⊝⊝ | |
| Others | 60 per 1 000 | 35 per 1 000 | OR 0.56 | 109 | ⊕⊕⊝⊝ | ||
| Adverse events ‐ Minor | Gastro‐intestinal | No trials reported on outcome "Adverse events ‐ Minor ‐ Gastro‐intestinal" | |||||
| Others | No trials reported on outcome "Adverse events ‐ Minor ‐ Others" | ||||||
| Improved menstrual pattern | Shortening of intermenstrual days | No trials reported on outcome "Improved menstrual pattern (i.e. shortening of intermenstrual days)" | |||||
| An initiation of menses or cycle regularity | No trials reported on outcome "Improved menstrual pattern (i.e. an initiation of menses or cycle regularity)" | ||||||
| Acne ‐ Visual analogue scale/Clinical acne score | No trials reported either on outcome "Acne ‐ Visual analogue scale" or "Acne ‐ Clinical acne score" | ||||||
| BMI (kg/m2) | The mean Body Mass Index (kg/m2) was 25.49 | MD 1.47 lower | ‐ | 199 | ⊕⊕⊝⊝ | ||
| *The risk in the intervention group (and its 95% confidence interval) is based on the assumed risk in the comparison group and the relative effect of the intervention (and its 95% CI). | |||||||
| GRADE Working Group grades of evidence | |||||||
| 1 Evidence downgraded by one level for serious risk of bias ‐ the majority of the RCTs have unclear risk of bias | |||||||
| OCP compared to Metformin combined with OCP for hirsutism, acne, and menstrual pattern in adult women with polycystic ovary syndrome | |||||||
| Patient or population:aAdult women with PCOS | |||||||
| Outcomes | Anticipated absolute effects* (95% CI) | Relative effect | № of participants | Quality of the evidence | Comments | ||
|---|---|---|---|---|---|---|---|
| Risk with metformin combined with OCP | Risk with OCP | ||||||
| Hirsutism ‐ Clinical F‐G score | The mean hirsutism ‐ Clinical F‐G score was 5.57 | MD 0.54 higher | ‐ | 389 | ⊕⊕⊝⊝ | ||
| Adverse events ‐ Severe | Gastro‐intestinal | 98 per 1000 | 21 per 1000 | OR 0.20 | 228 | ⊕⊕⊝⊝ | |
| Others | 39 per 1000 | 61 per 1000 | OR 1.61 | 159 | ⊕⊕⊝⊝ | ||
| Adverse events ‐ Minor | Gastro‐intestinal | 260 per 1000 | 21 per 1000 | OR 0.06 | 98 | ⊕⊕⊝⊝ | |
| Others | No trials reported on outcome "Adverse events ‐ Minor ‐ Others" | ||||||
| Improved menstrual pattern | Shortening of inter menstrual days | No trials reported on outcome "Improved menstrual pattern (i.e. shortening of inter menstrual days)" | |||||
| An initiation of menses or cycle regularity | No trials reported on outcome "Improved menstrual pattern (i.e. an initiation of menses or cycle regularity)" | ||||||
| Acne ‐ Clinical acne score | The mean acne ‐ Clinical acne score was 0.54 | MD 0.09 lower | ‐ | 82 | ⊕⊕⊝⊝ | ||
| BMI (kg/m2) | The mean BMI (kg/m2) was 28.6 | MD 0.21 lower | ‐ | 661 | ⊕⊝⊝⊝ | ||
| *The risk in the intervention group (and its 95% confidence interval) is based on the assumed risk in the comparison group and the relative effect of the intervention (and its 95% CI). | |||||||
| GRADE Working Group grades of evidence | |||||||
| 1 Evidence downgraded by one level for serious risk of bias ‐ the majority of the RCTs have unclear risk of bias 9 Evidence downgraded by one level for serious imprecision ‐ 95% CI includes both appreciable effect and little or no effect | |||||||
| Metformin compared to OCP for hirsutism, acne, and menstrual pattern in adolescent women with PCOS | |||||||
| Patient or population: adolescent women with PCOS | |||||||
| Outcomes | Anticipated absolute effects* (95% CI) | Relative effect | № of participants | Quality of the evidence | Comments | ||
|---|---|---|---|---|---|---|---|
| Risk with OCP | Risk with metformin | ||||||
| Hirsutism ‐ Clinical F‐G score | The mean hirsutism ‐ Clinical F‐G score was 8.6 | MD 0.40 lower | ‐ | 16 | ⊕⊝⊝⊝ | ||
| Adverse event ‐ Severe | Gastro‐intestinal | No trials reported on outcome "Adverse event ‐ Severe ‐ Gastro‐intestinal" | |||||
| Others | 150 per 1 000 | 100 per 1 000 | OR 0.63 | 80 | ⊕⊝⊝⊝ | ||
| Adverse event ‐ Minor | Gastro‐intestinal | 0 per 1 000 | 3 per 1 000 | OR 11.67 | 22 | ⊕⊝⊝⊝ | There were only 3 events in the arm metformin and 0 in the arm OCP |
| Others | No trials reported on outcome "Adverse event ‐ Minor ‐ Others" | ||||||
| Improved menstrual pattern | Shortening of inter menstrual days | No trials reported on outcome "Improved menstrual pattern (i.e. shortening of inter menstrual days)" | |||||
| An initiation of menses or cycle regularity | 1 000 per 1 000 | 1000 per 1 000 | OR 0.10 | 80 | ⊕⊝⊝⊝ | 40 out of 40 participants had improved menstrual patter in the OCP group compared to 36 out of 40 in the metformin group | |
| Acne ‐ Visual analogue scale or Clinical acne score | No trials reported either on outcome "Acne ‐ Visual analogue scale" or "Acne ‐ Clinical acne score" | ||||||
| BMI (kg/m2) | The mean BMI (kg/m2) was 36 | MD 1.45 lower higher) | ‐ | 69 | ⊕⊝⊝⊝ | ||
| *The risk in the intervention group (and its 95% confidence interval) is based on the assumed risk in the comparison group and the relative effect of the intervention (and its 95% CI). | |||||||
| GRADE Working Group grades of evidence | |||||||
| 1 Evidence downgraded by one level for serious risk of bias – a single RCT which has unclear risk of bias | |||||||
| Metformin compared to metformin combined with OCP for hirsutism, acne and menstrual pattern in adolescent women with PCOS | |||||||
| Patient or population: adolescent women with PCOS | |||||||
| Outcomes | Anticipated absolute effects* (95% CI) | Relative effect | No of participants | Quality of the evidence | Comments | ||
|---|---|---|---|---|---|---|---|
| Risk with metformin combined with OCP | Risk with metformin | ||||||
| Hirsutism ‐ Clinical F‐G score | No trials reported on outcome "Hirsutism ‐ Clinical F‐G score" | ||||||
| Adverse event ‐ Severe | Gastro‐intestinal | No trials reported on outcome "Adverse event ‐ Severe ‐ Gastro‐intestinal" | |||||
| Others | No trials reported on outcome "Adverse event ‐ Severe ‐ Others" | ||||||
| Adverse event ‐ Minor | Gastro‐intestinal | No trials reported on outcome "Adverse event ‐ Minor ‐ Gastro‐intestinal" | |||||
| Others | No trials reported on outcome "Adverse event ‐ Minor ‐ Others" | ||||||
| Improved menstrual pattern | Shortening of inter menstrual day | No trials reported on outcome "Improved menstrual pattern (i.e. shortening of intermenstrual days)" | |||||
| An initiation of menses or cycle regularity | No trials reported on outcome "Improved menstrual pattern (i.e. an initiation of menses or cycle regularity)" | ||||||
| Acne ‐ Visual analogue scale or Clinical acne score | No trials reported either on outcome "Acne ‐ Visual analogue scale" or "Acne ‐ Clinical acne score" | ||||||
| BMI (kg/m2) | No trials reported on outcome "BMI" | ||||||
| *The risk in the intervention group (and its 95% confidence interval) is based on the assumed risk in the comparison group and the relative effect of the intervention (and its 95% CI). | |||||||
| GRADE Working Group grades of evidence | |||||||
| OCP compared to metformin combined with OCP for hirsutism, acne, and menstrual pattern in adolescent women with PCOS | |||||||
| Patient or population: adolescent women with PCOS | |||||||
| Outcomes | Anticipated absolute effects* (95% CI) | Relative effect | № of participants | Quality of the evidence | Comments | ||
|---|---|---|---|---|---|---|---|
| Risk with metformin combined with OCP | Risk with OCP | ||||||
| Hirsutism ‐ Clinical F‐G score | The mean hirsutism ‐ Clinical F‐G score was 6.2 | MD 0.80 higher | ‐ | 32 | ⊕⊝⊝⊝ | ||
| Adverse events ‐ Severe | Gastro‐intestinal | 56 per 1 000 | 56 per 1 000 | OR 1.00 | 36 | ⊕⊝⊝⊝ | |
| Others | No trials reported on outcome "Adverse events ‐ Severe ‐ Others" | ||||||
| Adverse events ‐ Minor | Gastro‐intestinal | No trials reported on outcome "Adverse events ‐ Minor ‐ Gastro‐intestinal" | |||||
| Others | No trials reported on outcome "Adverse events ‐ Minor ‐ Others" | ||||||
| Improved menstrual pattern | Shortening of intermenstrual days | No trials reported on outcome "Improved menstrual pattern (i.e. shortening of intermenstrual days)" | |||||
| An initiation of menses or cycle regularity | No trials reported on outcome "Improved menstrual pattern (i.e. an initiation of menses or cycle regularity)" | ||||||
| Acne ‐ Visual analogue scale or Clinical acne score | No trials reported either on outcome "Acne ‐ Visual analogue scale" or "Acne ‐ Clinical acne score" | ||||||
| BMI (kg/m2) | The mean BMI (kg/m2) was 32.4 | MD 1.5 higher | ‐ | 32 | ⊕⊝⊝⊝ | ||
| *The risk in the intervention group (and its 95% confidence interval) is based on the assumed risk in the comparison group and the relative effect of the intervention (and its 95% CI). | |||||||
| GRADE Working Group grades of evidence | |||||||
| 1 Evidence downgraded by one level for serious risk of bias – a single RCT which has unclear risk of bias | |||||||
Background
Description of the condition
Polycystic ovary syndrome (PCOS) is characterised by chronic anovulation (failure or absence of ovulation) and hyperandrogenism (excessive production of male hormones in women) with clinical manifestations of irregular menstrual cycles (periods), infertility (failure to conceive), hirsutism (excessive hairiness) and acne (pimples). This condition is the most common endocrinopathy in women, affecting approximately 8% to 18% of women of reproductive age (Teede 2010a; Teede 2018). PCOS is a heterogenous condition, both clinically and biochemically. Women with PCOS are at increased risk of a number of metabolic disturbances, including gestational diabetes, impaired glucose tolerance (IGT), type 2 diabetes mellitus (T2DM) and metabolic syndrome. However, it remains unclear whether women with PCOS have a higher risk of cardiovascular disease (CVD) (Fauser 2012; Ovalle 2002; Teede 2010a; Teede 2018; Wild 2002a; Wild 2002b).
Recent international evidence‐based guidelines for the assessment, diagnosis and management of polycystic ovary syndrome have been published (Teede 2018). The guidelines recommend that all clinicians and investigators now use an internationally agreed definition of PCOS according to Rotterdam criteria (Rotterdam ESHRE 2004). Therefore, the diagnosis of PCOS in adult women requires that at least two of the following three criteria are met: (1) oligo‐ or anovulation (infrequent or no ovulation); (2) clinical and/or biochemical signs of hyperandrogenism; (3) polycystic ovaries on ultrasound. However, ultrasound is not indicated for adolescent patients due to overlap with normal reproductive physiology. Other causes for hyperandrogenism which mimic PCOS (such as congenital adrenal hyperplasia, Cushing's syndrome, or androgen‐secreting tumours) and amenorrhoea (such as thyroid disease or hyperprolactinaemia) should be excluded. These guidelines also recommend that standardised visual scales are preferred when assessing hirsutism, and one such scale is the Ferriman‐Gallwey (F‐G) score (Martin 2018; Teede 2018).
The exact pathophysiological mechanism (body characteristics) leading to the characteristic PCOS phenotype remains unclear. Some investigators explain it as primarily an intrinsic ovarian problem (excess ovarian production of androgens), others as adrenal (excess adrenal gland production of androgens), and again others as hypothalamic‐pituitary dysfunction (exaggerated gonadotropin‐releasing hormone pulsatility that results in hypersecretion of luteinising hormone). Insulin resistance (IR) (defined as a reduced glucose response to a given amount of insulin) seems to be one of the key pathophysiological feature of PCOS leading to both reproductive and metabolic disorders. Evidence of decreased insulin sensitivity is seen in both lean (30% incidence) and obese women (75% incidence) with PCOS; but IR accompanied by compensatory hyperinsulinaemia is most marked when there is an interaction between obesity and the syndrome (Conway 1990; Diamanti‐Kandarakis 2012; Dunaif 1989; Dunaif 1994). Hyperinsulinaemia directly stimulates both ovarian and adrenal androgen secretion and suppresses liver sex hormone‐binding globulin (SHBG) synthesis, resulting in an increase in free, biologically‐active androgens. This excess in local ovarian androgen production, augmented by hyperinsulinaemia, causes premature follicular atresia (the breakdown of the ovarian follicles) and anovulation along with the other clinical manifestations of hyperandrogenism such as hirsutism and acne (Costello 2003; Utiger 1996).
Description of the intervention
Metformin, an insulin‐sensitising drug (ISD), has been advocated as a long‐term treatment given the importance of hyperinsulinaemia in the development of hyperandrogenism and disrupted folliculogenesis in PCOS. Metformin may be useful in the restoration of normal endocrinological and clinical parameters of PCOS by lowering insulin secretion (Hasegawa 1999). The most common side effects of metformin include gastrointestinal complaints such as nausea, diarrhoea, and abdominal cramping. These occur in up to 50% of treated patients, usually improving or completely subsiding with continued treatment (Hundal 2003).
Oral contraceptive pills (OCP) have been the traditional therapy for the long‐term treatment of PCOS to regularise and lighten menses, improve hirsutism and acne by reducing ovarian androgen production and to provide endometrial protection. It has been advocated that the OCP may reduce insulin sensitivity, glucose tolerance in women with PCOS, and increase triglycerides in women with PCOS (Diamanti‐Kandarakis 2003; Freitas de Medeiros 2017). The most common side effects in women taking the OCP include headache, mood changes, gastrointestinal disturbances, and breast pain (Gallo 2013).
Oral contraceptive pills have been demonstrated to be effective therapy for hirsutism and acne, whilst the evidence for such efficacy with metformin for these outcomes is less so and inconsistent (Buzney 2014; Martin 2018; Teede 2018).
How the intervention might work
Metformin, improves insulin sensitivity, reduces insulin and consequently androgen levels, and therefore could improve menstrual cyclicity, acne and hirsutism (Katsiki 2010). OCPs contain oestrogen and progestin components allowing a regularisation of the menstrual cycle. OCP therapy reduces hyperandrogenism via a number of mechanisms, including the following: suppression of luteinising hormone secretion (and therefore ovarian androgen secretion), stimulation of hepatic production of sex hormone binding globulin (thereby increasing androgen binding in serum and reducing serum free androgen concentrations), and a slight reduction in both adrenal androgen secretion and binding of androgens to their receptor. Consequently, there is a reduction of androgen production and action yielding an improvement in hirsutism and acne (Martin 2018).
Why it is important to do this review
The OCP has been the traditional therapy for the long‐term treatment of women with PCOS not seeking fertility treatment in terms of the reproductive features of menstrual dysfunction and hyperandrogenic symptoms such as hirsutism and acne. However, metformin has more recently been proposed and used as an alternative therapy to the OCP for these reproductive manifestations with perhaps more favourable effect on the metabolic features of PCOS. It is therefore important to directly compare these two interventions in terms of both efficacy and adverse events to help guide clinical practice in the management of women with PCOS. Therefore, the overall aim of this review was to compare the efficacy and safety of metformin versus the OCP (alone or in combination) in improving clinical, hormonal, and metabolic features of PCOS.
This review is a substantive update of a previous Cochrane Review (Costello 2007).
Objectives
To assess the effectiveness and safety of metformin versus the oral contraceptive pill (OCP) (alone or in combination) for the long‐term treatment of women with polycystic ovary syndrome (PCOS).
Methods
Criteria for considering studies for this review
Types of studies
We considered randomised controlled trials (RCTs) for inclusion in the review. Cross‐over trials were not eligible for inclusion unless phase‐one data (i.e. pre‐cross‐over) were available.
Types of participants
Women (adults or adolescents) with PCOS based on clinical (ovulatory dysfunction, hirsutism, acne, androgen dependent alopecia), biochemical (hyperandrogaenemia), or ultrasound (polycystic ovaries) evidence as defined by included studies.
Note was taken as to whether the participants of the included studies met the internationally agreed definitions of PCOS (ESHRE/ASRM 2004), which were endorsed as the diagnostic criteria for PCOS in the recently published international guidelines on PCOS (Teede 2018).
Note was also taken of whether any of the participants had diabetes mellitus or were taking any other medications which might alter insulin sensitivity.
The RCTs of adult women with PCOS were analysed separately to those involving adolescent women with PCOS.
Types of interventions
(a) Metformin versus the combined oral contraceptive pill (MET versus OCP).
(b) Metformin versus metformin in combination with the combined oral contraceptive pill (MET versus MET + the OCP).
(c) Combined oral contraceptive pill versus metformin in combination with the combined oral contraceptive pill (the OCP versus MET + the OCP).
Types of outcome measures
Outcomes measures were defined as primary (clinical) outcomes and secondary (clinical, hormonal, and metabolic) outcomes.
This review considered trials with a minimum length of follow‐up of three months.
Primary outcomes
(a) Clinical parameters
1. Hirsutism as assessed clinically by a trained observer (using a scoring system such as the Ferriman and Gallwey (F‐G) score or a Visual Analogue Scale (VAS)), or participant self‐scoring of subjective improvement or not.
2. Adverse events (gastro‐intestinal and other): severe (requiring stopping of medication), and minor.
Secondary outcomes
(a) Clinical parameters
3. Improved menstrual pattern (i.e. an initiation of menses or cycle regularity or significant shortening of intermenstrual days).
4. Acne as assessed clinically by a trained observer (using a scoring system such as a VAS, or participant self‐scoring of subjective improvement or not.
5. Diagnosis of type 2 diabetes mellitus
6. Body weight (kg)
7. Body mass index (BMI) (kg/m2)
8. Blood pressure systolic (mmHg)
9 Blood pressure diastolic (mmHg)
(b) Hormonal parameters
10. Serum total testosterone (nmol/L)
11. Free androgen index (FAI) (%)
(c) Metabolic parameters
12. Fasting insulin (mLU/L)
13. Fasting glucose (mmol/L)
14. Fasting total cholesterol (mmol/L)
15. Fasting high‐density lipoprotein (HDL) cholesterol (mmol/L)
16. Fasting low‐density lipoprotein (LDL) cholesterol (mmol/L)
17. Fasting triglycerides (mmol/L)
Search methods for identification of studies
We searched for all published and unpublished RCTs on the use of metformin and the OCP (alone or in combination) in women with PCOS, without language restriction and in consultation with the Gynaecology and Fertility Group Information Specialist.
Electronic searches
We searched the following electronic databases for relevant trials:
(1) The Cochrane Gynaecology and Fertility Group (CGF) Specialised Register of Controlled Trials; PROCITE platform (searched 15 August 2019) (Appendix 1)
(2) The Cochrane Central Register of Controlled Trials; Ovid platform (searched 15 August 2019, Issue July 2019) (Appendix 2)
(3) MEDLINE (Epub Ahead of Print, In‐Process & Other Non‐Indexed Citations); Ovid platform (searched from 1946 to 15 August 2019) (Appendix 3)
(4) Embase; Ovid platform (searched from 1980 to 15 August 2019) (Appendix 4)
(5) PsycINFO; Ovid platform (searched from 1806 to 15 August 2019) (Appendix 5)
(6) CINAHL (Cumulative Index to Nursing and Allied Health Literature); EBSCO platform (searched from 1961 to 15 August 2019) (Appendix 6)
Searching other resources
(7) Reference lists of included studies, other relevant review articles and textbooks were handsearched.
(8) Trial registers for ongoing and registered trials were checked and authors contacted if required.
(9) We contacted experts in the field to identify additional studies.
Data collection and analysis
We conducted data collection and analysis in accordance with the Cochrane Handbook for Systematic Reviews of Interventions (Higgins 2017).
Selection of studies
After an initial screen of titles and abstracts retrieved by the search, conducted by review authors EF, LM, CV, and MC, the full texts of all potentially eligible studies were retrieved. Three review authors (LM, EF and MC) independently examined these full‐text articles for compliance with the inclusion criteria and selected eligible studies. If papers contained insufficient information to make a decision about eligibility, we contacted the authors of those papers in order to seek further information to clarify study eligibility. Disagreements were resolved by discussion.
Studies from non‐English language journals were translated if necessary. The selection process is documented in the PRISMA flow chart (Figure 1). We provide a list of excluded studies, showing the reasons for exclusion in the Characteristics of excluded studies table.
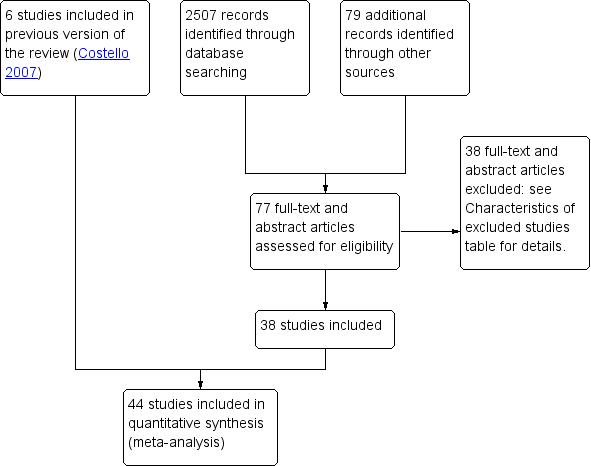
Study flow diagram.
Data extraction and management
Four review authors (EF, LM, CE and SB) independently extracted data from eligible studies using a data extraction form designed and pilot‐tested by the authors. Any disagreements were resolved by discussion. Data extracted included study characteristics and outcome data. Unit conversion factors are shown in Table 1. Where studies had multiple publications, we collated multiple reports of the same under a single study ID with multiple references. We corresponded with study investigators for further data on methods or results, or both, when required. In multiple‐arm studies; data from arms that did not meet the inclusion criteria were not used.
| Convert from | Convert to | Conversion factor | |
|---|---|---|---|
| Androstenedione | ng/mL | nmol/L | 3.49 |
| Cholesterol | mg/dL | mmol/L | 0.026 |
| Confidence intervals | Confidence intervals | Standard error | (upper limit ‐ lower limit)/3.92 |
| Glucose | mg/dL | mmol/L | 0.056 |
| Insulin | pmol/L | mIU/L (= microIU/mL) | 0.1667 |
| Sex hormone‐binding globulin | mcg/dL | nmol/L | 34.7 |
| Standard deviation | Standard error | Standard deviation | Sqrt n |
| Testosterone | pg/mL | pmol/L | 3.47 |
| Triglycerides | mg/dL | mmol/L | 0.011 |
Assessment of risk of bias in included studies
Four review authors (EF, LM, CE and MC) independently assessed the included studies for risk of bias using the Cochrane 'Risk of bias' assessment tool (Higgins 2017). We assessed selection (random sequence generation and allocation concealment); performance (blinding of participants and personnel); detection (blinding of outcome assessors); attrition (incomplete outcome data); reporting (selective reporting) bias; and other bias (other potential bias), and summarised our judgements in the 'Risk of bias' tables, Figure 2 and Figure 3. Judgements were assigned as low, high or unclear risk using the criteria from the Cochrane Handbook Table 8.5.d: 'Criteria for judging risk bias' in the 'Risk of bias' assessment tool (Higgins 2017). Disagreements were resolved by discussion. All judgements were fully described and the conclusions are presented in the 'Risk of Bias' table, and incorporated into the interpretation of review findings by means of sensitivity analyses where indicated.

'Risk of bias' graph: review authors' judgements about each 'Risk of bias' item presented as percentages across all included studies

'Risk of bias' summary: review authors' judgements about each 'Risk of bias' item for each included study .
Measures of treatment effect
For dichotomous data, results for each study were expressed as odds ratios (ORs) with 95% confidence intervals (CIs) and combined for meta‐analysis with Review Manager software using the fixed‐effect model (Peto method). The goal was to calculate a pooled estimate of treatment effect for each outcome across studies.
For continuous data, we measured the mean post‐treatment or intervention values and standard deviations for each group and calculated the weighted mean differences (MDs) with 95% CIs. If different scales measured the same continuous data outcome, we planned to measure the mean post‐treatment or intervention values and standard deviations for each group and to calculate the standardised mean difference (SMD) with 95% CI.
Unit of analysis issues
We took into account the level at which the randomisation occurred in each trials.
We considered whether in each study:
-
groups of individuals were randomised together to the same intervention (i.e. cluster‐ randomised trials);
-
or each individual was individually randomised to one of the intervention groups;
-
or if individuals underwent more than one intervention (e.g. in cross‐over trial). Only first‐phase data from cross‐over trials were included.
The analysis was by woman randomised.
Dealing with missing data
If data were missing from included studies, we contacted the investigators to request the relevant missing data.
If this was not possible, we analysed the data on an intention‐to‐treat basis as far as possible (i.e. including all randomised participants in analysis, in the groups to which they were randomised). Otherwise, available data were analysed.
If studies reported sufficient detail to calculate mean differences (MD), but no information on associated standard deviation, we assumed the outcome to have a standard deviation equal to the highest standard deviation from other studies within the same analysis.
Assessment of heterogeneity
Heterogeneity reflects any type of variability among the studies in a systematic review. The clinical and methodological characteristics of the included studies were considered in order to check if they were sufficiently similar for meta‐analysis to provide a clinically‐meaningful summary. A consistent treatment effect among the included studies suggests there is sufficient homogeneity for pooled analysis. Heterogeneity (inconsistency) between the results of different studies was examined by inspecting the scatter in the data points on the graph and the overlap in their confidence intervals on the forest plot and, more formally, by checking the results of the Chi2 tests and the measure of the I2 statistic (Higgins 2003). An I2 statistic greater than 50% was taken to indicate substantial heterogeneity (Deeks 2017).
Substantial heterogeneity for the review outcomes was explored (investigated) with subgroup and sensitivity analyses by consideration of factors such as study quality, differences in population, interventions and outcomes (see below section 'Subgroup analysis and investigation of heterogeneity'.
Assessment of reporting biases
In view of the difficulty of detecting and correcting for publication bias and other reporting biases, we aimed to minimise their potential impact by ensuring a comprehensive search for eligible studies and by being alert for duplication of data. If there were 10 or more studies in an analysis, we used a funnel plot for the main review outcomes to explore the possibility of small‐study effects (a tendency for estimates of the intervention effect to be more beneficial in smaller studies).
Data synthesis
Studies were sufficiently similar in order to combine the data using a fixed‐effect model in the following comparisons.
(a) Metformin versus the combined oral contraceptive pill (MET versus the OCP).
(b) Metformin versus the combined oral contraceptive pill in combination with metformin (MET versus the OCP + MET).
(c) Combined oral contraceptive pill versus the combined oral contraceptive pill in combination with metformin (the OCP versus the OCP + MET).
Statistical analysis was performed using Review manager 5.3 in accordance with the guidelines for statistical analysis developed by Cochrane (Review Manager 2014).
For all outcomes, where data were available, we stratified comparisons by subgroups of studies of women with different mean body mass index (BMI) (e.g. BMI ≤ 25 kg/m2, BMI > 25 kg/m2 but < 30 kg/m2, BMI ≥ 30 kg/m2) with an additional stratum for studies in which BMI was not reported, apart from the outcome of adverse events (which were divided into gastro‐intestinal and other adverse events).
Subgroup analysis and investigation of heterogeneity
Where data were available, we conducted pre‐specified subgroup analyses to determine the separate evidence within the following subgroups for all outcomes.
All outcomes (apart from the outcome of adverse events) were divided or subgrouped according to studies of women with different mean BMI (e.g. BMI ≤ 25 kg/m2, BMI > 25 kg/m2 but < 30 kg/m2, BMI ≥ 30 kg/m2) in order to assess any differences in intervention effect between these subgroups and to assess whether any substantial heterogeneity, if detected, could be explained by such subgroup analysis according to BMI (i.e. whether BMI is an important effect modifier). The rationale for pre‐specifying BMI for subgroup analysis was that metformin is an insulin‐sensitising agent and insulin resistance in PCOS is exacerbated by obesity (see Background section), and therefore it is clinically plausible for metformin to possibly have a larger (or different) relative effect with increasing BMI.
The assessment of whether there was a statistically significant difference between the subgroups was performed by comparing the different subgroups directly with each other using the "statistical test for subgroup differences" (I2 statistic > 50 and/or P value < 0.05) in the forest plot graph.
If substantial heterogeneity could be explained by such pre‐specified subgroup analyses (i.e. explained substantial heterogeneity), we analysed/reported the subgroups separately (and did not analyse/report the pooled results).
If substantial heterogeneity was detected, which could not be explained by such pre‐specified subgroup analyses (i.e. unexplained substantial heterogeneity), we conducted sensitivity analyses to determine whether the conclusions are robust to arbitrary decisions made regarding the eligibility and analysis. These analyses included consideration of whether the review conclusions would have differed if (i) eligibility was restricted to studies at low risk of bias (defined as low risk of selection bias (both random sequence generation and allocation concealment) and not at high risk of bias in any domain) for the main review outcomes and if (ii) a random‐effects model had been adopted for all outcomes. If the random‐effects model and the fixed‐effect model produced substantially different pooled estimates, then this is an excellent indication of heterogeneity and the random‐effects model is the preferred model and as such was used. If the two models yielded similar pooled estimates then the fixed‐effect model is preferred and as such was used, because usually it will have a narrower confidence interval; that is, it is more precise than the random‐effects model (Ryan 2016). Unexplained substantial heterogeneity was taken into account when assessing the quality of the evidence using GRADE in terms of inconsistency and interpreting the results, especially when there was variation in the direction of effect.
Sensitivity analysis
We conducted sensitivity analyses to determine whether the conclusions are robust to arbitrary decisions made regarding the eligibility and analysis. These analyses included consideration of whether the review conclusions would have differed if eligibility was restricted to studies at low risk of bias (defined as low risk of selection bias (both random sequence generation and allocation concealment) and not at high risk of bias in any domain) for the main review outcomes and if a random‐effects model had been adopted in the presence of unexplained substantial heterogeneity for all outcomes.
Overall quality of the body of the evidence: 'Summary of findings' table
We generated 'Summary of findings' tables using GRADEpro software and Cochrane methods (GRADEpro GDT). This tables evaluated the overall quality of the body of the evidence for the main review outcomes (hirsutism, improvement in menstrual pattern, acne assessed clinically (as opposed to subjectively) by either visual analogue scale (VAS) or clinical acne score, BMI and adverse events (severe and minor) (subgrouped according to type of adverse event: gastro‐intestinal or other)) for the main review comparisons (metformin versus the OCP, metformin versus metformin in combination with the OCP, and the OCP versus metformin in combination with the OCP). We assessed the quality of the evidence using GRADE criteria: risk of bias, inconsistency, imprecision, indirectness and publication bias). Judgements about evidence quality (high, moderate, low or very low) were made by three review authors (EF, EK and MC) working independently, with disagreements resolved by discussion. Judgements were justified, documented and incorporated into reporting of results for each main review outcome. Unexplained substantial heterogeneity was taken into account when assessing the quality of the evidence using GRADE in terms of inconsistency and interpreting the results, especially when there was variation in the direction of effect.
Results
Description of studies
Results of the search
The previous version of this review included six trials (Costello 2007). The search for the current review update resulted in the retrieval of 77 full‐text papers and abstracts (Figure 1). We included 38 new studies, 37 full‐text papers and one abstract (Characteristics of included studies). Three included studies from non‐English language journals required translation (Jin 2006; Liu 2006;Teng 2007). We excluded 38 new studies (Characteristics of excluded studies). Four new studies are awaiting classification (Characteristics of studies awaiting classification); we have contacted the authors and still await a response. We one study from awaiting classification to included studies (Sahu 2018), and another study from awaiting classification to excluded studies (NCT02866786). We classified three new studies as ongoing (NCT02744131; NCT03229057;NCT03905941), (Characteristics of ongoing studies).
Included studies
Study design and setting
In this 2020 updated review, we included 44 randomised controlled trials ( RCTs) consisting of 43 parallel‐designed RCTs and 1 cross‐over RCT (in which only pre‐cross over data were used). The updated review includes 37 full‐text articles, one abstract and six full‐text references from the former review.
The studies were performed in different locations around the world.
-
Australia (Meyer 2007; Moran 2010)
-
Czech Republic (Cibula 2005)
-
China (Feng 2016; Jin 2006; Kuek 2011; Liu 2006; Lv 2005; Song 2017; Ruan 2018; Teng 2007; Wei 2012; Wu 2008)
-
Denmark (Glintborg 2014a)
-
Egypt (El Maghraby 2015)
-
Finland (Morin‐Papunen 2000; Morin‐Papunen 2003; Rautio 2005)
-
Greece (Christakou 2014)
-
Italy (Moro 2013)
-
India (Bhattacharya 2016 (abstract); Kumar 2018; Sahu 2018)
-
Iran (Aghamohammadzadeh 2010)
-
Iraq (Mhao 2015)
-
Poland (Dardzinska 2014)
-
Scotland (Harborne 2003)
-
Spain (Luque‐Ramirez 2007a; Luque‐Ramirez 2007b; Luque‐Ramirez 2008a; Luque‐Ramirez 2009b)
-
Turkey (Bodur 2018; Cetinkalp 2009; Elter 2002; Kaya 2015; Kebapcilar 2009a; Kebapcilar 2009b; Kilic 2011; Ozgurtas 2008)
-
USA (Allen 2005; Al‐Zubeidi 2015; Essah 2011; Hoeger 2008a; Hoeger 2008b).
Participants
The studies included 2253 women with polycystic ovary syndrome (PCOS).
-
43/44 studies fulfilled the Rotterdam PCOS criteria (Bhattacharya 2016; Bodur 2018; Cetinkalp 2009; Dardzinska 2014; El Maghraby 2015; Elter 2002; Essah 2011; Feng 2016; Glintborg 2014a; Harborne 2003; Jin 2006; Kaya 2015; Kebapcilar 2009a; Kebapcilar 2009b; Kilic 2011; Kuek 2011; Kumar 2018; Lv 2005; Mhao 2015; Morin‐Papunen 2000; Morin‐Papunen 2003; Moro 2013; Ozgurtas 2008; Rautio 2005; Song 2017; Sahu 2018; Ruan 2018; Teng 2007; Wei 2012; Wu 2008); including 12/44 studies which fulfilled the stricter National Institutes of Health (NIH) PCOS criteria (Aghamohammadzadeh 2010; Allen 2005; Al‐Zubeidi 2015; Christakou 2014; Cibula 2005; Hoeger 2008a; Hoeger 2008b; Luque‐Ramirez 2007a; Luque‐Ramirez 2007b; Luque‐Ramirez 2008a; Luque‐Ramirez 2009b; Meyer 2007); and including 1/44 studies fulfilled either NIH or Rotterdam PCOS criteria (Moran 2010).
-
1/44 studies did not described any diagnostic criteria (Liu 2006).
The mean age of the women ranged across studies from 12 to 40 years.
-
5/44 studies (206 women analysed) recruited adolescent women (Allen 2005; Al‐Zubeidi 2015; El Maghraby 2015; Hoeger 2008a; Hoeger 2008b).
-
39/44 studies (2047 women analysed) recruited adult women (Aghamohammadzadeh 2010; Bhattacharya 2016; Bodur 2018; Cetinkalp 2009; Christakou 2014; Cibula 2005; Dardzinska 2014; Elter 2002; Essah 2011; Feng 2016; Glintborg 2014a; Harborne 2003; Jin 2006; Kaya 2015; Kebapcilar 2009a; Kebapcilar 2009b; Kilic 2011; Kuek 2011; Kumar 2018; Liu 2006; Luque‐Ramirez 2007a; Luque‐Ramirez 2007b; Luque‐Ramirez 2008a; Luque‐Ramirez 2009b; Lv 2005; Meyer 2007; Mhao 2015; Moran 2010; Morin‐Papunen 2000; Morin‐Papunen 2003; Moro 2013; Ozgurtas 2008; Rautio 2005; Song 2017; Sahu 2018; Ruan 2018; Teng 2007; Wei 2012; Wu 2008).
Interventions
-
26/44 studies compared metformin (MET) versus the combined oral contraceptive (OCP) (Aghamohammadzadeh 2010; Allen 2005; Al‐Zubeidi 2015; Cetinkalp 2009; Christakou 2014; Cibula 2005; Dardzinska 2014; El Maghraby 2015; Harborne 2003; Hoeger 2008a; Jin 2006; Kilic 2011; Kuek 2011; Luque‐Ramirez 2007a; Luque‐Ramirez 2007b; Luque‐Ramirez 2008a; Luque‐Ramirez 2009b; Meyer 2007; Mhao 2015; Moran 2010; Morin‐Papunen 2000; Morin‐Papunen 2003; Ozgurtas 2008; Rautio 2005; Sahu 2018; Teng 2007).
-
11/44 studies compared MET versus MET + the OCP (Bhattacharya 2016; Elter 2002; Essah 2011; Feng 2016; Hoeger 2008b; Kaya 2015; Kebapcilar 2009b; Lv 2005; Song 2017; Ruan 2018; Wei 2012).
-
7/44 studies compared MET versus the OCP versus MET + the OCP (Bodur 2018; Glintborg 2014a; Kebapcilar 2009a; Kumar 2018; Liu 2006; Moro 2013; Wu 2008).
(See Characteristics of included studies table).
Outcomes
-
18/44 studies reported hirsutism by woman randomised (Bhattacharya 2016; Cetinkalp 2009; Dardzinska 2014; El Maghraby 2015; Elter 2002; Feng 2016; Glintborg 2014a; Harborne 2003; Hoeger 2008a; Hoeger 2008b; Jin 2006; Kumar 2018; Luque‐Ramirez 2007a; Meyer 2007; Morin‐Papunen 2000; Morin‐Papunen 2003; Sahu 2018; Wu 2008).
-
17/44 studies reported adverse events (severe or minor) by woman randomised (Aghamohammadzadeh 2010; Bodur 2018; Christakou 2014; Cibula 2005; Dardzinska 2014; El Maghraby 2015; Elter 2002; Essah 2011; Glintborg 2014a; Harborne 2003; Hoeger 2008b; Kilic 2011; Luque‐Ramirez 2007a; Morin‐Papunen 2000; Morin‐Papunen 2003; Moro 2013; Wei 2012).
-
7/44 studies reported improved menstrual pattern by woman randomised (El Maghraby 2015; Jin 2006; Luque‐Ramirez 2007a; Mhao 2015; Morin‐Papunen 2000; Morin‐Papunen 2003; Sahu 2018).
-
6/44 studies reported acne (Bhattacharya 2016; Cetinkalp 2009; Feng 2016; Harborne 2003; Jin 2006; Mhao 2015).
-
39/44 studies reported body mass index (BMI) by woman randomised (Aghamohammadzadeh 2010; Allen 2005; Al‐Zubeidi 2015; Bhattacharya 2016; Bodur 2018; Cetinkalp 2009; Christakou 2014; Cibula 2005; Dardzinska 2014; Elter 2002; Essah 2011; Feng 2016; Glintborg 2014a; Harborne 2003; Hoeger 2008a; Hoeger 2008b; Jin 2006; Kaya 2015; Kebapcilar 2009a; Kebapcilar 2009b; Kilic 2011; Kuek 2011; Kumar 2018; Liu 2006; Luque‐Ramirez 2007a; Lv 2005; Meyer 2007; Mhao 2015; Moran 2010; Morin‐Papunen 2000; Morin‐Papunen 2003; Moro 2013; Ozgurtas 2008; Song 2017; Sahu 2018; Ruan 2018; Teng 2007; Wei 2012; Wu 2008).
Excluded studies
We excluded 38 trials from this review, 36 full texts (Alpanes 2017; Altinok 2018; Bachani 2016; Bhattacharya 2012; Bredella 2013; Burchall 2015; Cakiroglu 2013; Diaz 2016; Glintborg 2014b; Glintborg 2015; Glintborg 2017; Hadziomerovic‐Pekic 2010; Harris‐Glocker 2009; Hu 2010; Hutchison 2008; Ibanez 2010; Ibanez 2017; Kebapcilar 2010; Kim 2010; Ladson 2011; Lazaro 2011; Lemay 2006; Luque‐Ramirez 2008c; Luque‐Ramirez 2009; Luque‐Ramirez 2010a; Luque‐Ramirez 2011; Mehrabian 2016; Mitkov 2005; NCT02866786; Orbetzova 2011; Panidis 2011; Pedersen 2018; Romualdi 2010; Suvarna 2016; Teede 2010b; Wang 2016) and two abstract articles (Moghtadaei 2009; Moretti 2016). The primary reasons for exclusion of the studies were no randomisation, other interventions, or other outcome of interest .
(See Characteristics of excluded studies table).
Risk of bias in included studies
Allocation
Twenty‐four studies were at low risk of selection bias in relation to random sequence generation. These 24 studies used a computer random number generator or a random number table. In the remaining 20 studies, insufficient information about the random sequence generation was given and therefore were rated at unclear risk of bias for this domain (Figure 3).
Ten studies were at low risk of selection bias in relation to allocation concealment. These 10 studies used central allocation, sequentially numbered drug containers of identical appearance or sequentially numbered, opaque, sealed envelopes. The other 34 studies did not describe allocation concealment sufficiently and therefore were rated at unclear risk of bias for this domain (Figure 3).
Blinding
In relation to the blinding of all outcomes:
-
participants (performance bias): three out of 44 studies described the blinding of participants and were thus rated at low risk of performance bias. Thirty‐one out of 44 studies did not report on blinding of participants and were rated at unclear risk of performance bias. Ten out of 44 studies described no blinding for participants and were rated at high risk of performance bias (Figure 3)
-
personnel (performance bias): one out of 44 studies described the blinding of personnel and were thus rated at low risk of performance bias. Thirty‐two out of 44 studies did not mention blinding of personnel and were rated at unclear risk of performance bias. Eleven out of 44 studies described no blinding for personnel and were rated at high risk of performance bias (Figure 3)
-
outcome assessor (detection bias): Five out of 44 studies described the blinding of outcome assessor and were thus rated at low risk of detection bias. Thirty‐five out of 44 studies did not mention blinding of outcome assessor and were rated at unclear risk of detection bias. Four out of 44 studies described no blinding for outcome assessor and were rated at high risk of detection bias (Figure 3)
Incomplete outcome data
Thirteen out of 44 studies had no missing outcome data and were rated at low risk of attrition bias.
Twenty six out of 44 studies were rated at unclear risk of attrition bias. In 20 of these studies the reasons for missing data were judged as unclear: no show, unreachable, declined treatment, regrets, loss of follow up, personal reason, not stated, discontinued treatment, protocol violation, voluntary drop off, wanted the other intervention, and incomplete data (Allen 2005; Al‐Zubeidi 2015; Dardzinska 2014; Glintborg 2014a; Harborne 2003; Hoeger 2008a; Hoeger 2008b; Kilic 2011; Kumar 2018; Luque‐Ramirez 2007a; Luque‐Ramirez 2007b; Luque‐Ramirez 2008a; Luque‐Ramirez 2009b; Meyer 2007; Moran 2010; Morin‐Papunen 2003; Moro 2013; Ozgurtas 2008; Sahu 2018; Wei 2012). In one study the number or patient randomised was unclear (states n = 100, n = 99, n=94) (Cetinkalp 2009). In two studies no information was provided after randomisation and the authors were contacted without success (Feng 2016; Lv 2005). In two studies the number of dropouts were considered quite important (50% for MET group and 37.5% for the OCP group), and it was unclear whether this could have had a clinically relevant impact on the intervention effect estimate (Morin‐Papunen 2000; Rautio 2005). In one study, there was a discrepancy between the figure and the text regarding number and reason for withdrawal (Wu 2008).
Five out of 44 studies were rated at high risk of attrition bias. In four of these studies, the reason for missing data were imbalanced and related to intervention (Aghamohammadzadeh 2010; Christakou 2014; Cibula 2005; Essah 2011). In one of these studies, the manner in which the use of imputation was performed was not appropriate (Bhattacharya 2016) (Figure 3).
Selective reporting
Fifteen out of 44 studies reported the outcomes that were stated in the methods section and thus were judged as low risk of reporting bias.
In 20 out of 44 studies, insufficient information was available to permit a judgement of 'low risk' or 'high risk' and therefore we rated them at unclear risk of reporting bias. In 19 of these studies, some secondary outcomes (BMI, BP, fasting glucose, weight, menstrual pattern, lipid profile, testosterone level, acne) were described in the methods section but not in the results and the study protocol was not available (Bodur 2018; Cetinkalp 2009; Dardzinska 2014; Feng 2016; Glintborg 2014a; Hoeger 2008a; Hoeger 2008b; Kebapcilar 2009b; Kilic 2011; Kumar 2018; Mhao 2015; Morin‐Papunen 2000; Morin‐Papunen 2003; Ozgurtas 2008; Rautio 2005; Song 2017; Ruan 2018; Wei 2012; Wu 2008). In two of these studies, the outcome measurements were not described in the methods section and the protocol was not available (Kaya 2015; Kebapcilar 2009b).
Nine out of 44 studies were rated at high risk of reporting bias. In four of these studies, hirsutism (which was a primary outcome) was described in the methods section but not reported in the results (Allen 2005; Al‐Zubeidi 2015; El Maghraby 2015; Jin 2006). In the other three of these studies, some of the primary outcomes were reported in the results without being prespecified in the methods section (Figure 3).
Other potential sources of bias
In six studies there were substantial baseline imbalances between the two intervention groups and thus we deemed the risk of other bias to be high (Cetinkalp 2009; Dardzinska 2014; Jin 2006; Kilic 2011; Kuek 2011; Mhao 2015). In one study the use of laser and waxing was considered a source of bias in terms of the evaluation of hirsutism (Glintborg 2014a), and therefore rated at high risk of other bias. In two studies there were substantial baseline differences in clinical and biochemical hyperandrogenism between the two intervention groups and we judged them at high risk of other bias (Meyer 2007; Moran 2010). We found no potential sources of other bias in the other 35 studies (Figure 3).
Effects of interventions
See: Summary of findings 1 Metformin compared to oral contraceptive pill (OCP) for hirsutism, acne, and menstrual pattern in adult women with polycystic ovary syndrome (PCOS); Summary of findings 2 Metformin compared to metformin combined with oral contraceptive pill (OCP) for hirsutism, acne, and menstrual pattern in adult women with polycystic ovary syndrome (PCOS); Summary of findings 3 Oral contraceptive pill (OCP) compared to metformin combined with OCP for hirsutism, acne, and menstrual pattern in adult women with polycystic ovary syndrome (PCOS); Summary of findings 4 Metformin compared to oral contraceptive pill (OCP) for hirsutism, acne, and menstrual pattern in adolescent women with polycystic ovary syndrome (PCOS); Summary of findings 5 Metformin compared to metformin combined with oral contraceptive pill (OCP) for hirsutism, acne and menstrual pattern in adolescent women with polycystic ovary syndrome (PCOS); Summary of findings 6 Oral contraceptive pill (OCP) compared to metformin combined with OCP for hirsutism, acne, and menstrual pattern in adolescent women with polycystic ovary syndrome PCOS
1. Metformin compared to the combined oral contraceptive pill (OCP) in adult women (clinical parameters)
Twenty‐eight randomised controlled trials (RCTs) including 1403 adult women compared metformin with the OCP (Aghamohammadzadeh 2010; Bodur 2018; Cetinkalp 2009; Christakou 2014; Cibula 2005; Dardzinska 2014; Glintborg 2014a; Harborne 2003; Jin 2006; Kebapcilar 2009a; Kilic 2011; Kuek 2011; Kumar 2018; Luque‐Ramirez 2007a; Luque‐Ramirez 2007b; Luque‐Ramirez 2008a; Luque‐Ramirez 2009b; Meyer 2007; Mhao 2015; Moran 2010; Morin‐Papunen 2000; Morin‐Papunen 2003; Moro 2013; Ozgurtas 2008; Rautio 2005; Sahu 2018; Teng 2007, Wu 2008).
Primary outcomes
1.1 Hirsutism ‐ Clinical Ferriman‐Gallwey (F‐G) score
Ten trials including 473 women compared metformin versus the OCP and reported hirsutism clinically using the Ferriman‐Gallwey (F‐G) score (Cetinkalp 2009; Dardzinska 2014; Glintborg 2014a; Meyer 2007; Morin‐Papunen 2000; Morin‐Papunen 2003; Kumar 2018; Luque‐Ramirez 2007a; Sahu 2018; Wu 2008).
Substantial heterogeneity was detected, which may be explained by the difference in effect of the interventions between the mean study body mass index (BMI) subgroups (test for subgroup difference: P = 0.003, I2 = 82.9%). Therefore, we analysed the results per mean BMI subgroup.
We are uncertain if there was a difference between metformin and the OCP on F‐G score in subgroup BMI < 25 kg/m2 (mean difference (MD) 0.38, 95% confidence interval (CI) ‐0.44 to 1.19; 3 RCTs; n = 134; I2 = 50%; very low‐quality evidence, Figure 4, Analysis 1.1). This suggests that for a mean F‐G score of 7.5 following the OCP, the mean F‐G score following metformin would be between 0.44 lower to 1.19 higher.

Forest plot of comparison: 1 Adult ‐ metformin versus OCP (Clinical parameters), outcome: 1.1 Hirsutism ‐ Clinical F‐G score.
Metformin may be less effective in improving F‐G score compared to the OCP in the subgroup BMI > 25 /kg2 < BMI 30 kg/m2 (MD 1.92, 95% CI 1.21 to 2.64; 5 RCTs; n = 254; I2 = 0%; low‐quality evidence, Figure 4, Analysis 1.1 ). This suggests that for a mean F‐G score of 6.44 following the OCP, the mean F‐G score following metformin would be between 1.21 higher to 2.64 higher.
We are uncertain if there was a difference between metformin and the OCP on F‐G score in subgroup BMI > 30 kg/m2 (MD ‐0.38, 95% CI ‐1.93 to 1.17; 2 RCTs; n = 85; I2 = 34%; low‐quality evidence, Figure 4, Analysis 1.1). This suggests that for a mean F‐G score of 6.05 following the OCP, the mean F‐G score following metformin would be between 1.93 lower to 1.17 higher.
Sensitivity analysis restricting studies to low risk of bias (defined in methods section 'Sensitivity analysis') was unable to be performed due to no RCTs having a low risk of bias.
The funnel plot (n = 10 studies) was asymmetrical indicating that our findings might be influenced by publication bias although asymmetrical funnel plots can also be due to true heterogeneity (Figure 5, Analysis 1.1).

Funnel plot of comparison: 1 Adult ‐ metformin versus OCP (Clinical parameters), outcome: 1.1 Hirsutism ‐ Clinical F‐G score.
1.2 Hirsutism ‐ Subjective visual analogue scale (VAS)
One trial including 34 women compared metformin versus the OCP and reported hirsutism subjectively (patient self‐assessed) using a VAS ranging from 0 to 10. All the participants in this trial had hirsutism (F‐G score > 8) (Harborne 2003).
Metformin resulted in an improvement of hirsutism compared to the OCP (MD ‐2.70, 95% CI ‐4.41 to ‐0.99, 1 RCT, n = 34, Analysis 1.2).
1.3Hirsutism ‐ Subjective improvement
One trial including 25 women compared metformin versus the OCP and reported on hirsutism subjective improvement (not reported if patient self‐assessed or clinician assessed) (Jin 2006).
There was insufficient evidence to determine whether there was a difference between metformin and the OCP for subjective improvement of hirsutism (odds ratio (OR) 0.64, 95% CI 0.04 to 11.63, 1 RCT, n = 25, Analysis 1.3).
One trial including 28 women compared metformin versus the OCP and reported an improvement of acne and hirsutism with both metformin and the OCP in the Discussion, but did not report supporting data and therefore could not be included in any meta‐analysis for this review (Kuek 2011).
1.4 Adverse events: severe (requiring stopping of medication) (gastro‐intestinal and others)
Twelve trials including 965 women compared metformin versus the OCP and reported severe adverse events (Aghamohammadzadeh 2010; Bodur 2018; Christakou 2014; Dardzinska 2014; Glintborg 2014a; Harborne 2003; Kilic 2011; Luque‐Ramirez 2007a; Morin‐Papunen 2000; Morin‐Papunen 2003; Moro 2013; Wu 2008).
Findings were not influenced by sensitivity analyses restricting studies to low risk of bias (defined in methods section 'Sensitivity analysis').
The funnel plot (n = 12 studies) was symmetrical indicating that our findings might not be influenced by publication bias (funnel plot not shown).
1.4.1 Gastro‐intestinal
Eleven trials including 602 women compared metformin versus the OCP and reported severe gastro‐intestinal adverse events (Aghamohammadzadeh 2010; Bodur 2018; Christakou 2014; Glintborg 2014a; Harborne 2003; Kilic 2011; Luque‐Ramirez 2007a; Morin‐Papunen 2000; Morin‐Papunen 2003; Moro 2013; Wu 2008).
Metformin resulted in a higher incidence of severe gastro‐intestinal adverse events compared to the OCP (Peto OR 6.42, 95% CI 2.98 to 13.84, 11 RCTs, n = 602, I2 = 0%; low‐quality evidence, Figure 6, Analysis 1.4) This suggests that if the severe gastro‐intestinal adverse event rate following the OCP is 0.3%, then the severe gastro‐intestinal adverse event rate after metformin would be between 1% and 4.5%.

Forest plot of comparison: 1 Adult ‐ metformin versus OCP (Clinical parameters), outcome: 1.4 Adverse events ‐ severe.
Findings were not influenced by sensitivity analysis restricting to the one study with low risk of bias (defined in methods section 'Sensitivity analysis') (Harborne 2003).
1.4.2 Others
Eight trials including 363 women compared metformin versus the OCP and reported other severe adverse events (Aghamohammadzadeh 2010; Bodur 2018; Dardzinska 2014; Glintborg 2014a; Harborne 2003; Morin‐Papunen 2000; Morin‐Papunen 2003; Wu 2008.
Metformin may result in a lower incidence of severe other adverse events compared to the OCP (Peto OR 0.20, 95% CI 0.09 to 0.44, 8 RCTs, n = 363, I2 = 0%, low‐quality evidence, Figure 6;Analysis 1.4). This suggests that if the severe other adverse event rate following the OCP is 12%, then the severe other adverse event rate after metformin would between 1% and 6%.
Findings were not influenced by sensitivity analysis restricting to the one study with low risk of bias (defined in methods section 'Sensitivity analysis') (Harborne 2003).
One trial including 101 women compared metformin versus the OCP and reported severe adverse events with both metformin and the OCP, but did not report supporting data and therefore could not be included in any meta‐analysis for this review (Sahu 2018).
One trial including 24 women compared metformin versus the OCP and reported minor adverse events with metformin only, but did not report supporting data and therefore could not be included in any meta‐analysis for this review (Kebapcilar 2009a).
Adverse events ‐ minor (gastro‐intestinal and others)
No RCT reported on this outcome.
Secondary outcomes
1.5Improved menstrual pattern: i.e. significant shortening of intermenstrual days
Two trials including 153 women compared metformin versus the OCP and reported improvement in menstrual pattern (Meyer 2007; Sahu 2018).
Overall, metformin may be less effective in improving menstrual pattern compared to the OCP (MD 6.05, 95% CI 2.37 to 9.74, 2 RCTs, n = 153, I2= 0%; low‐quality evidence,Analysis 1.5). This suggests that for a mean Improved menstrual pattern (i.e. significant shortening of intermenstrual days) of 32.4 following the OCP, the mean Improved menstrual pattern following metformin would be between 2.37 higher to 9.74 higher.
Subgroup analysis showed insufficient evidence to suggest a difference in effect by mean study BMI (test for subgroup difference: P = 0.73, I2 = 0%).
Sensitivity analysis restricting studies to low risk of bias (defined in methods section 'Sensitivity analysis') was unable to be performed due to no RCTs having a low risk of bias.
1.6 Improved menstrual pattern: i.e. an initiation of menses or cycle regularity
Six trials including 189 women compared metformin versus the OCP and reported improvement in menstrual pattern (Cetinkalp 2009; Jin 2006, Luque‐Ramirez 2007b; Mhao 2015; Morin‐Papunen 2000; Morin‐Papunen 2003).
Substantial heterogeneity was detected which may be explained by the difference in effect of the interventions between the mean BMI subgroups (test for subgroup difference: P = 0.03, I2 = 67.8%) (Analysis 1.6). Therefore, we analysed the results per mean BMI subgroup.
Metformin compared to the OCP may be less effective in improving menstrual pattern in subgroup BMI ≤ 25 kg/m2 (Peto OR 0.07, 95% CI 0.01 to 0.65; 1 RCT; n = 17; low‐quality evidence).
We are uncertain if metformin is less effective in improving menstrual pattern compared to the OCP in subgroup BMI > 25 kg/m2 < 30kg/m2 (Peto OR 0.15, 95% CI 0.07 to 0.33; 3 RCTs; n = 129; I2 = 51%; verylLow‐quality evidence).
We are uncertain of the effect of metformin compared to the OCP on menstrual pattern in subgroup BMI ≥30 kg/m2 (Peto OR 0.09, 95% CI 0.01 to 1.62; 1 RCT; n = 18; very low‐quality evidence).
We are uncertain of the effect of metformin compared to the OCP on menstrual pattern in subgroup BMI not stated (Peto OR 1.95, 95% CI 0.39 to 9.65; 1 RCT; n = 25; very low‐quality evidence).
Sensitivity analysis restricting studies to low risk of bias (defined in methods section 'Sensitivity analysis') was unable to be performed due to no RCTs having a low risk of bias.
One trial including 60 women compared metformin versus the OCP and reported improvement in menstrual pattern in both group but did not report supporting and therefore could not be included in any meta‐analysis in this review (Wu 2008).
1.7 Acne ‐ visual analogue scale (VAS)
One trial including 34 women compared metformin versus the OCP and reported acne subjectively (patient self assessed) using a VAS ranging from 0 to 10. (Harborne 2003).
There was uncertainty as to whether there was a difference between metformin and the OCP for acne (patient self‐assessed) (MD 0.90, 95% CI ‐0.40 to 2.20, 1 RCT, n = 34, low‐quality evidence;Analysis 1.7). This suggests that for a mean acne ‐ VAS of 1 following the OCP, the mean acne ‐ VAS following metformin would be between 0.40 lower to 2.2 higher.
1.8 Acne ‐ Subjective improvement
Three trials including 131 women compared metformin versus the OCP and reported acne subjectively (Cetinkalp 2009; Jin 2006, Mhao 2015).
Metformin was less effective in improving subjective improvement of acne compared to the OCP (OR 0.30, 95% CI 0.11 to 0.79; 3 RCTs; n = 131; I2 = 18%) (Analysis 1.8).
One trial including 28 women compared metformin versus the OCP and reported an improvement of acne and hirsutism with both metformin and the OCP in the Discussion but did not report supporting data and therefore could not be included in any meta‐analysis in this review (Kuek 2011).
1.9 Diagnosis of Type II diabetes mellitus
One trial including 18 women compared metformin versus the OCP and reported on diagnosis of T2DM (Morin‐Papunen 2000).
There was insufficient evidence to determine whether there was a difference between metformin and the OCP for the diagnosis of T2DM. (Peto OR 0.17, 95% CI 0.00 to 8.54, 1 RCT, n = 18, Analysis 1.9).
1.10 Body weight (kg)
Seven trials including 358 women compared metformin versus the OCP and reported on body weight (Aghamohammadzadeh 2010; Cetinkalp 2009; Dardzinska 2014; Glintborg 2014a; Kuek 2011; Kumar 2018; Moran 2010).
Overall, there was insufficient evidence to determine whether there was a difference between metformin and the OCP for body weight (MD ‐0.93, 95% CI ‐2.93 to 1.08, 7 RCTs, n = 358, I2 = 30%, Analysis 1.10).
Subgroup analysis showed sufficient evidence to suggest a difference in effect by mean study BMI (test for subgroup difference: P = 0.03, I2 = 70.5%).
1.11 Body Mass Index (BMI) (kg/m2)
Nineteen trials including 923 women compared metformin versus the OCP and reported on BMI (Aghamohammadzadeh 2010; Cetinkalp 2009; Christakou 2014; Dardzinska 2014; Glintborg 2014a; Harborne 2003; Kebapcilar 2009a; Kilic 2011; Kuek 2011; Kumar 2018; Luque‐Ramirez 2007a; Mhao 2015; Meyer 2007; Morin‐Papunen 2000; Morin‐Papunen 2003; Ozgurtas 2008; Teng 2007; Sahu 2018; Wu 2008).
Substantial heterogeneity was detected which may be explained by the difference in effect of the interventions between the mean BMI subgroups (test for subgroup difference: P = 0.03, I2 = 70.9%) (Analysis 1.11). Therefore, we analysed the results per mean BMI subgroup.
We are uncertain if metformin decreases BMI compared to the OCP in subgroup BMI < 25 kg/m2 (MD ‐0.59, 95% CI ‐1.02 to ‐0.17; 9 RCTs; n = 451; I2 = 76%, very low‐quality evidence). This suggests that for a mean BMI of 22.7 following the OCP, the mean BMI following metformin would be between 1.02 lower to 0.17 lower.
We are uncertain of the effect of metformin compared to the OCP on BMI in subgroup BMI > 25 kg/m2 < 30 kg/m2.(MD 0.11, 95% CI ‐0.48 to 0.70; 8 RCTs; n = 353; I2 = 72%, very low‐quality evidence). This suggests that for a mean BMI of 27.4 following the OCP, the mean BMI following metformin would be between 0.48 lower to 0.7 higher.
We are uncertain if metformin decreases BMI compared to the OCP in subgroup BMI > 30 kg/m2 (MD ‐2.31, 95% CI ‐4.40 to ‐0.21; 3 RCTs; n = 119; I2 = 52%), very low‐quality evidence). This suggests that for a mean BMI of 35.1 following the OCP, the mean BMI following metformin would be between 4.4 lower to 0.21 lower.
Findings were not influenced by sensitivity analysis restricting to the one study with low risk of bias (defined in methods section 'Sensitivity analysis') (Harborne 2003).
The funnel plot (n = 19 studies) was asymmetrical indicating that our findings might be influenced by publication bias although asymmetrical funnel plots can also be due to true heterogeneity (funnel plot not shown).
1.12 Blood pressure ‐ systolic (mmHg)
Five trials including 209 women compared metformin versus the OCP and reported on systolic blood pressure (Dardzinska 2014; Glintborg 2014a; Harborne 2003; Luque‐Ramirez 2009b; Meyer 2007).
Overall, metformin resulted in an improvement in systolic blood pressure compared to the OCP (MD ‐4.81, 95% CI ‐8.55 to ‐1.06, 5 RCTs, n = 209, I2 = 0%, Analysis 1.12).
Subgroup analysis showed insufficient evidence to suggest a difference in effect by mean study BMI (test for subgroup difference: P = 0.41, I2 = 0%).
1.13 Blood pressure ‐ diastolic (mmHg)
Four trials including 142 women compared metformin versus the OCP and reported on diastolic blood pressure (Dardzinska 2014; Glintborg 2014a; Harborne 2003; Luque‐Ramirez 2009b).
Substantial heterogeneity was detected which may be explained by the difference in effect of the interventions between the mean BMI subgroups (test for subgroup difference: P = 0.0009, I2 = 90.9%) (Analysis 1.13). Therefore, we analysed the results per mean BMI subgroup.
Metformin compared to the OCP showed appreciable benefit in the " BMI > 25 kg/m2< 30 kg/m2 " subgroup (MD ‐4.25, 95% CI ‐7.30 to ‐1.20; 3 RCTs; n = 108; I2 = 0%) and appreciable harm in the BMI ≥ 30kg/m2 " subgroup (MD 7.50, 95% CI 1.27 to 13.73; 1 RCT; n = 34; I2 = 0%)
2. Metformin compared to the combined oral contraceptive pill (OCP) in adult women (hormonal parameters)
2.1 Serum total testosterone (nmol/L)
Seventeen trials including 818 women compared metformin versus the OCP and reported on serum total testosterone (Aghamohammadzadeh 2010; Cetinkalp 2009; Christakou 2014; Dardzinska 2014; Glintborg 2014a; Harborne 2003; Jin 2006; Kuek 2011; Kumar 2018; Meyer 2007; Morin‐Papunen 2000; Morin‐Papunen 2003; Moro 2013; Ozgurtas 2008; Sahu 2018; Teng 2007; Wu 2008).
Substantial heterogeneity was detected which may be explained by the difference in effect of the interventions between the mean BMI subgroups (test for subgroup difference: P = 0.006, I2 = 76.1%). Therefore, we analysed the results per mean BMI subgroup.
The effect of metformin compared to the OCP showed a slight benefit for the OCP in all three subgroups: BMI ≤ 25 kg/m2 (MD 0.48, 95% CI 0.38 to 0.57; 9 RCTs; n = 454; I2 = 57%); BMI > 25kg/m2 < 30kg/m2 (MD 0.21, 95% CI 0.07 to 0.35; 4 RCTs; n = 220; I2 = 0%); BMI ≥30 kg/m2(MD 0.42, 95% CI 0.11 to 0.74; 3 RCTs; n = 119; I2 = 0%) (Analysis 2.1)
2.2 Free androgen index (FAI) (%)
Ten trials including 433 women compared metformin versus the OCP and reported on FAI (Christakou 2014; Dardzinska 2014; Glintborg 2014a; Harborne 2003; Kuek 2011; Luque‐Ramirez 2008a; Meyer 2007; Morin‐Papunen 2000; Morin‐Papunen 2003; Moro 2013).
Substantial heterogeneity was detected which may be explained by the difference in effect of the interventions between the mean BMI subgroups (test for subgroup difference: P = 0.006, I2 = 78%). Therefore, we analysed the results per mean BMI subgroup.
The effect of metformin compared to the OCP showed an important benefit for the OCP in all three subgroups: BMI ≤ 25 kg/m2(MD 4.48, 95% CI 3.56 to 5.40; 4 RCTs; n = 204; I2 = 84%); BMI > 25 kg/m2 < 30 kg/m2(MD 3.06, 95% CI 2.14 to 3.97; 3 RCTs; n = 110; I2 = 78%); BMI ≥30 kg/m2 (MD 7.12, 95% CI 4.46 to 9.79; 3 RCTs; n = 119; I2 = 27%) (Analysis 2.2).
3. Metformin compared to the combined oral contraceptive pill (OCP) in adult women (metabolic parameters)
3.1 Fasting insulin (mLU/L)
Twelve trials including 474 women compared metformin versus the OCP and reported on fasting insulin (Glintborg 2014a; Harborne 2003; Kebapcilar 2009a; Kumar 2018; Luque‐Ramirez 2007a; Meyer 2007; Morin‐Papunen 2000; Morin‐Papunen 2003; Moro 2013; Sahu 2018; Teng 2007; Wu 2008).
Overall, metformin resulted in an improvement of fasting insulin compared to the OCP (MD ‐ 3.85, 95% CI ‐4.73 to ‐2.97, 12 RCTs, n = 474, I2= 23%, Analysis 3.1).
Subgroup analysis showed sufficient evidence to suggest a difference in effect by mean study BMI (test for subgroup difference: P = 0.04, I2 = 65.1%).
3.2 Fasting glucose (mmol/L)
Twelve trials including 519 women compared metformin versus the OCP and reported on fasting glucose (Bodur 2018; Cetinkalp 2009; Glintborg 2014a; Harborne 2003; Kumar 2018; Kuek 2011; Luque‐Ramirez 2007a; Moran 2010; Morin‐Papunen 2000; Morin‐Papunen 2003; Sahu 2018; Teng 2007).
Overall, metformin resulted in an improvement of fasting glucose compared to the OCP (MD ‐0.15, 95% CI ‐0.22 to ‐0.07, 12 RCTs, n = 519; I2= 46%, Analysis 3.2).
Subgroup analysis showed insufficient evidence to suggest a difference in effect by mean study BMI (test for subgroup difference: P = 0.16, I2 = 45%).
3.3 Total cholesterol (mmol/L)
Thirteen trials including 610 women compared metformin versus the OCP and reported on total cholesterol (Cetinkalp 2009; Dardzinska 2014; Glintborg 2014a; Harborne 2003; Kebapcilar 2009a; Kumar 2018; Luque‐Ramirez 2007a; Mhao 2015; Meyer 2007; Moro 2013; Ozgurtas 2008; Rautio 2005; Sahu 2018).
Substantial heterogeneity was detected which may be explained by the difference in effect of the interventions between the BMI subgroups (test for subgroup difference: P < 0.0001, I2 = 91.2%). Therefore, we analysed the result per mean BMI subgroup (Analysis 3.3). Metformin decreased total cholesterol compared to the OCP in the subgroup BMI < 25 kg/m2 (MD ‐0.77, 95% CI ‐1.00 to ‐0.53; 4 RCTs; n = 206; I2 = 61%). There was insufficient evidence to determine whether there was a difference between metformin and the OCP for total cholesterol in the subgroup BMI > 25 kg/m2 < 30 kg/m2 (MD ‐0.14, 95% CI ‐0.30 to 0.01; 7 RCTs; n = 303; I2 = 0%), and in the subgroup BMI > 30 kg/m2 (MD ‐0.02, 95% CI ‐0.32 to 0.28; 2 RCTs; n = 101; I2 = 0%).
3.4 High‐density lipoprotein (HDL) cholesterol (mmol/L)
Thirteen trials including 610 women compared metformin versus the OCP and reported on HDL cholesterol (Cetinkalp 2009; Dardzinska 2014; Glintborg 2014a; Harborne 2003; Kebapcilar 2009a; Kumar 2018; Luque‐Ramirez 2007a; Mhao 2015; Meyer 2007; Moro 2013; Ozgurtas 2008; Rautio 2005; Sahu 2018).
Substantial heterogeneity was detected which may be explained by the difference in effect of the interventions between the mean BMI subgroups (test for subgroup difference: P = 0.04, I2 = 69.5%) (Analysis 3.4).Therefore, we analysed the results per mean BMI subgroup.
Metformin compared to the OCP showed no benefit in subgroup BMI ≤ 25 kg/m2 (MD ‐0.02, 95% CI ‐0.01 to 0.07; 4 RCTs; n = 206; I2 = 90%) and BMI > 25 kg/m2 but < 30 kg/m2 (MD 0.02, 95% CI ‐0.02 to 0.06; 7 RCTs; n = 303; I2 = 75%), or slight harm in subgroup BMI ≥ 30kg/m2 (MD 0.20, 95% CI 0.05 to 0.35; 2 RCTs; n = 101; I2 = 0%) for the metformin in the three subgroups.
3.5 Low‐density lipoprotein (LDL) cholesterol (mmol/L)
Thirteen trials including 610 women compared metformin versus the OCP and reported on LDL cholesterol (Cetinkalp 2009; Dardzinska 2014; Glintborg 2014a; Harborne 2003; Kebapcilar 2009a; Kumar 2018; Luque‐Ramirez 2007a; Mhao 2015; Meyer 2007; Moro 2013; Ozgurtas 2008; Rautio 2005; Sahu 2018).
Substantial heterogeneity was detected which may be explained by the difference in effect of the interventions between the mean BMI subgroups (test for subgroup difference: P < 0.00001, I2 = 92.7%). Therefore, we analysed the results per mean BMI subgroup.
The effect of the metformin compared to the OCP showed a slight harm in subgroup BMI ≥30 kg/m2 (MD 0.35, 95% CI 0.02 to 0.67; 2 RCTs; n = 101; I2 = 0%), or benefit in subgroup BMI ≤ 25kg/m2 (MD ‐0.39, 95% CI ‐0.54 to ‐0.23; 4 RCTs; n = 206; I2 = 50%), or no important benefit/harm in subgroup BMI > 25 kg/m2 but < 30 kg/m2 (MD 0.02, 95% CI ‐0.06 to 0.10; 7 RCTs; n = 303; I2 = 12%) for metformin in the three subgroups (Analysis 3.5).
3.6 Triglycerides (mmol/L)
Thirteen trials including 610 women compared metformin versus the OCP and reported on triglycerides (Cetinkalp 2009; Dardzinska 2014; Glintborg 2014a; Harborne 2003; Kebapcilar 2009a; Kumar 2018; Luque‐Ramirez 2007a; Mhao 2015; Meyer 2007; Moro 2013; Ozgurtas 2008; Rautio 2005; Sahu 2018).
Substantial heterogeneity was detected which may be explained by the difference in effect of the interventions between the mean BMI subgroups (test for subgroup difference: P < 0.00001, I2 = 93.1%).(Analysis 3.6) Therefore, we analysed the results per BMI subgroup.
The effect of metformin compared to the OCP showed slight benefit in subgroup BMI ≤ 25 kg/m2 (MD ‐0.45, 95% CI ‐0.61 to ‐0.30; 4 RCTs; n = 206; I2 = 67%), and no improvement in groups BMI > 25k g/m2 < 30kg/m2 (MD ‐0.01, 95% CI ‐0.07 to 0.05; 7 RCTs; n = 303; I2 = 20%), and BMI ≥30 kg/m2 (MD ‐0.31, 95% CI ‐0.64 to 0.01; 2 RCTs; n = 101; I2 = 0%).
4. Metformin compared to metformin combined with the OCP in adult women (clinical parameters)
Six trials including 295 adult women compared metformin combined with the OCP compared to metformin (Bodur 2018; Glintborg 2014a; Harborne 2003; Jin 2006; Kebapcilar 2009a; Kumar 2018; Liu 2006; Moro 2013; Wu 2008).
Primary outcomes
4.1 Hirsutism ‐ Clinical Ferriman‐Gallwey (F‐G) score
Three trials including 135 women compared metformin versus metformin combined with the OCP and reported hirsutism clinically using the F‐G score (Glintborg 2014a; Kumar 2018; Wu 2008).
Overall, metformin may be less effective in improving hirsutism compared to metformin combined with the OCP (MD 1.36, 95% CI 0.62 to 2.11, 3 RCTs, n = 135, I2= 9%, low‐quality evidence, Analysis 4.1).
This suggests that for a mean F‐G score of 5.6 following the metformin combined with the OCP, the mean F‐G score following metformin would be between 0.62 higher to 2.11 higher.
Subgroup analysis showed insufficient evidence to suggest a difference in effect by mean study BMI (test for subgroup difference: P = 0.18, I2 = 43.5%).
Sensitivity analysis restricting studies to low risk of bias (defined in methods section 'Sensitivity analysis') was unable to be performed due to no RCTs having a low risk of bias.
Hirsutism ‐ Subjective visual analogue scale (VAS)
No RCT reported on this outcome
Hirsutism ‐ subjective improvement
No RCT reported on this outcome
4.2 Adverse events: severe (requiring stopping of medication) (gastro‐intestinal and others)
Three trials compared metformin versus metformin combined with the OCP and reported severe adverse events (Bodur 2018; Glintborg 2014a; Moro 2013).
4.2.1 Gastro‐intestinal
Three trials including 171 women compared metformin versus metformin combined with the OCP and reported severe gastro‐intestinal adverse events (Bodur 2018; Glintborg 2014a; Moro 2013).
We are uncertain if there was a difference between metformin and metformin combined with the OCP for severe gastro‐intestinal adverse events (OR 0.74, 95% CI 0.21 to 2.53, 3 RCTs, n = 171, I2 = 0%, low‐quality evidence Analysis 4.2). This suggests that if the severe gastrointestinal adverse event rate following metformin combined with the OCP is 7%, then the severe gastrointestinal adverse event rate after metformin would be between 2% and 17%.
Sensitivity analysis restricting studies to low risk of bias (defined in methods section 'Sensitivity analysis') was unable to be performed due to no RCTs having a low risk of bias.
4.2.2 Others
Two trials including 109 women compared metformin versus metformin combined with the OCP and reported severe other adverse events (Bodur 2018; Glintborg 2014a).
We are uncertain if there was a difference between metformin and metformin combined with the OCP for severe other adverse events (OR 0.56, 95% CI 0.11 to 2.82, 2 RCTs, n = 109, I2 = 44%, low‐quality evidence Analysis 4.2). This suggests that if the severe other adverse event rate following metformin combined with the OCP is 6%, then the severe other adverse event rate after metformin would between 1% and 15%.
Sensitivity analysis restricting studies to low risk of bias (defined in methods section 'Sensitivity analysis') was unable to be performed due to no RCTs having a low risk of bias.
One trial including 24 women compared metformin versus metformin combined with the OCP and reported minor adverse events with metformin combined with the OCP and metformin only, but did not report supporting data and therefore could not be included in any meta‐analysis in this review (Kebapcilar 2009a).
Adverse events ‐ minor (gastro‐intestinal and others)
No RCT reported on this outcome.
Secondary outcomes
Improved menstrual pattern (i.e. shortening of intermenstrual days)
No RCT reported on this outcome.
Improved menstrual pattern (i.e. an initiation of menses or cycle regularity)
No RCT reported on this outcome.
Acne ‐ visual analogue scale (VAS)
No RCT reported on this outcome.
Acne ‐ subjective improvement
No RCT reported on this outcome.
Diagnosis of Type II diabetes mellitus
No RCT reported on this outcome.
4.3 Body weight (kg)
Two trials including 101 women compared metformin versus metformin combined with the OCP and reported on body weight (Glintborg 2014a; Kumar 2018).
Overall, metformin resulted in an improvement of body weight compared to metformin combined with the OCP (MD ‐5.39, 95% CI ‐10.70 to ‐0.08, 2 RCTs, n = 101, I2= 0%, Analysis 4.3).
Subgroup analysis was not applicable as both RCTs were in the same mean study BMI subgroup.
4.4 Body mass index (BMI) (kg/m2)
Five trials including 199 women compared metformin versus metformin combined with the OCP and reported on BMI (Glintborg 2014a; Kebapcilar 2009a; Kumar 2018; Liu 2006; Wu 2008).
Overall, metformin may improve BMI compared to metformin combined with the OCP (MD ‐1.47, 95% CI ‐2.27 to ‐0.66, 5 RCTs, n = 199, I2= 25%, low‐quality evidence, Analysis 4.4). This suggests that for a mean BMI of 25.49 following metformin combined with the OCP, the mean BMI following metformin would be between 2.27 lower to 0.66 lower.
Subgroup analysis showed insufficient evidence to suggest a difference in effect by mean study BMI (test for subgroup difference: P = 0.90, I2 = 0%).
Sensitivity analysis restricting studies to low risk of bias (defined in methods section 'Sensitivity analysis') was unable to be performed due to no RCTs having a low risk of bias.
4.5 Blood pressure ‐ systolic (mmHg)
One trial including 42 women compared metformin versus metformin combined with the OCP and reported on systolic blood pressure (Glintborg 2014a).
Metformin resulted in an improvement of systolic blood pressure compared to metformin combined with the OCP (MD ‐10.59, 95% CI ‐15.76 to ‐5.42, 1 RCT, n = 42, Analysis 4.5).
4.6 Blood pressure ‐ diastolic (mmHg)
One trial including 42 women compared metformin versus metformin combined with the OCP and reported on diastolic blood pressure (Glintborg 2014a).
Metformin resulted in an improvement of diastolic blood pressure compared to metformin combined with the OCP (MD ‐7.93, 95% CI ‐14.01 to ‐1.85, 1 RCT, n = 42, Analysis 4.6).
5. Metformin compared to metformin combined with the OCP in adult women (hormonal parameters)
5.1 Serum total testosterone (nmol/L)
Five trials including 226 women compared metformin versus metformin combined with the OCP and reported on serum total testosterone (Glintborg 2014a; Kumar 2018; Liu 2006; Moro 2013; Wu 2008).
Substantial heterogeneity was detected, which may be explained by the difference in effect of the interventions between the mean BMI subgroups (test for subgroup difference: P < 0.00001, I2 = 95.9%). (Analysis 5.1). Therefore, we analysed the results per mean BMI subgroup.
Metformin compared to metformin combined with the OCP showed no important benefit/harm for metformin in the subgroup BMI ≤ 25 kg/m2(MD 0.09, 95% CI ‐0.08 to 0.26; 2 RCTs; n = 74; I2 = 0%), and important harm in the other subgroup BMI > 25 kg/m2 < 30kg/m2 (MD 0.79, 95% CI 0.57 to 1.00; 3 RCTs; n = 152; I2 = 65%).
5.2 Free androgen index (FAI) (%)
Three trials including 133 women compared metformin versus metformin combined with the OCP and reported on FAI (Glintborg 2014a; Liu 2006; Moro 2013).
Substantial heterogeneity was detected which may be explained by the difference in effect of the interventions between the mean BMI subgroups (test for subgroup difference: P < 0.0001, I2 = 93.7%) (Analysis 5.2). Therefore, we analysed the results per mean BMI subgroup.
Metformin compared to metformin combined with the OCP showed appreciable benefit for the OCP combined with metformin in the " BMI > 25 kg/m2 < 30 kg/m2" subgroup (MD 3.80, 95% CI 2.91 to 4.69; 2 RCTs; n = 93; I2 = 97%), and no important benefit/harm in the other subgroup (BMI ≤ 25 kg/m2) (MD 0.35, 95% CI ‐1.09 to 1.79; 1 RCT; n = 40; I2 = 0%).
6. Metformin compared to metformin combined with the OCP in adult women (metabolic parameters)
6.1 Fasting insulin (mLU/L)
Five trials including 199 women compared metformin versus metformin combined with the OCP and reported on fasting insulin (Glintborg 2014a; Kebapcilar 2009a; Kumar 2018; Liu 2006; Wu 2008).
Overall, metformin resulted in an improvement of fasting insulin compared to metformin combined with the OCP (MD ‐1.32, 95% CI ‐2.63 to ‐0.01, 5 RCTs, n = 199, I2= 33%, Analysis 6.1).
Subgroup analysis showed insufficient evidence to suggest a difference in effect by mean study BMI (test for subgroup difference: P = 0.72, I2 = 0%).
6.2 Fasting glucose (mmol/L)
Four trials including 170 women compared metformin versus metformin combined with the OCP and reported on fasting glucose (Bodur 2018; Glintborg 2014a; Kumar 2018; Liu 2006).
Overall, metformin resulted in an improvement of fasting glucose compared to metformin combined with the OCP (MD ‐0.21, 95% CI ‐0.37 to ‐0.06, 4 RCTs, n = 170, I2= 49%, Analysis 6.2).
Subgroup analysis showed insufficient evidence to suggest a difference in effect by mean study BMI (test for subgroup difference: P = 0.76, I2 = 0%).
6.3 Total cholesterol (mmol/L)
Five trials including 216 women compared metformin versus metformin combined with the OCP and reported on total cholesterol (Glintborg 2014a; Kebapcilar 2009a; Kumar 2018; Liu 2006; Moro 2013).
Overall, metformin resulted in an improvement of total cholesterol compared to metformin combined with the OCP (MD ‐0.54, 95% CI ‐0.97 to ‐0.11, 5 RCTs, n = 216, I2= 65%, Analysis 6.3).
Substantial heterogeneity was detected, which was not explained by a difference in effect of the interventions between the BMI subgroups (test for subgroup difference: P = 0.81, I2 = 0%).
Findings were not influenced by sensitivity analyses using a random‐effects model (in the presence of unexplained substantial heterogeneity).
6.4 High‐density lipoprotein (HDL) cholesterol (mmol/L)
Five trials including 216 women compared metformin versus metformin combined with the OCP and reported on HDL cholesterol (Glintborg 2014a; Kebapcilar 2009a; Kumar 2018; Liu 2006; Moro 2013).
Substantial heterogeneity was detected which may be explained by the difference in effect of the interventions between the mean BMI subgroups (test for subgroup difference: P = 0.0002, I2 = 93.0%) (Analysis 6.4). Therefore, we analysed the results per mean BMI subgroup.
Metformin compared to metformin combined with the OCP showed appreciable benefit for metformin in the "BMI ≤ 2 5kg/m2 " subgroup (MD ‐0.64, 95% CI ‐0.99 to ‐0.29; n = 40; 1 RCT; I2 = 0%), and no important benefit/harm in the other subgroup (BMI > 25 kg/m2 < 30 kg/m2) (MD 0.05, 95% CI ‐0.04 to 0.14; n = 176; 4 RCTs; I2 = 0%)
6.5 Low‐density lipoprotein (LDL) cholesterol (mmol/L)
Four trials including 176 women compared metformin versus metformin combined with the OCP and reported on LDL cholesterol (Glintborg 2014a; Kebapcilar 2009a; Kumar 2018; Moro 2013).
Overall, there was insufficient evidence to determine whether there was a difference between metformin combined with the OCP and metformin for LDL cholesterol (MD ‐0.13, 95% CI ‐0.32 to 0.06, 4 RCTs, n = 176, I2 = 40%, Analysis 6.5).
Subgroup analysis was not applicable as all four RCTs were in the same mean study BMI subgroup.
6.6 Triglycerides (mmol/L)
Five trials including 216 women compared metformin combined with the OCP versus metformin and reported on triglycerides (Glintborg 2014a; Kebapcilar 2009a; Kumar 2018; Liu 2006; Moro 2013).
Overall, metformin resulted in an improvement of triglycerides compared to metformin combined with the OCP (MD ‐0.22, 95% CI ‐0.37 to ‐0.07, 5 RCTs, n = 216, I2= 85%, Analysis 6.6).
Substantial heterogeneity was detected which could not be explained by the difference in effect of the interventions between the BMI subgroups (test for subgroup difference: P = 0.03, I2 = 78.6%) but could be explained by the effect of one of the included studies which showed benefit for metformin combined with the OCP (Kebapcilar 2009a).
7. Oral contraceptive pill (OCP) compared with metformin combined with the OCP in adult women (clinical parameters)
Sixteen trials including 1043 adult women compared metformin combined with the OCP to the combined OCP (Bhattacharya 2016; Bodur 2018; Elter 2002; Essah 2011; Feng 2016; Glintborg 2014a; Kaya 2015; Kebapcilar 2009a; Kebapcilar 2009b; Kumar 2018; Lv 2005; Moro 2013; Song 2017; Ruan 2018; Wei 2012; Wu 2008).
Primary outcomes
7.1 Hirsutism ‐ Clinical Ferriman‐Gallwey (F‐G) score
Six trials including 389 women compared the OCP versus metformin combined with the OCP and reported hirsutism clinically using the F‐G score (Bhattacharya 2016; Elter 2002; Feng 2016; Glintborg 2014a; Kumar 2018; Wu 2008).
Overall, the OCP may be less effective in improving hirsutism compared to metformin combined with the OCP (MD 0.54, 95% CI 0.20 to 0.89, 6 RCTs, n = 389, I2= 1%, low‐quality evidence, Analysis 7.1). This suggests that for a mean F‐G score of 5.57 following metformin combined with the OCP, the mean F‐G score following the OCP would be between 0.20 higher to 0.89 higher.
Subgroup analysis showed insufficient evidence to suggest a difference in effect by mean study BMI (test for subgroup difference: P = 0.36, I2 = 0%).
Findings were not influenced by sensitivity analysis restricting to the one study with low risk of bias (defined in methods section 'Sensitivity analysis') (Feng 2016).
Hirsutism ‐ subjective visual analogue scale (VAS)
No RCT reported on this outcome.
Hirsutism ‐ Subjective improvement
No RCT reported on this outcome.
7.2 Adverse events: severe (requiring stopping of medication) (gastro‐intestinal and others)
Six trials including 387 women compared the OCP versus metformin combined with the OCP and reported severe adverse events (Bodur 2018; Cibula 2005; Glintborg 2014a; Essah 2011; Moro 2013; Wu 2008).
7.2.1 Gastro‐intestinal
Five trials including 228 women compared the OCP versus metformin combined with the OCP and reported severe gastro‐intestinal adverse events (Bodur 2018; Cibula 2005; Glintborg 2014a; Moro 2013; Wu 2008).
The OCP may result in a lower incidence of severe gastro‐intestinal adverse events compared to metformin combined with the OCP (OR 0.20, 95% CI 0.06 to 0.72, 5 RCTs, n = 228, I2 = 0%, low‐quality evidence Analysis 7.2). This suggests that for severe gastro‐intestinal adverse event rate of 10% following metformin combined with the OCP, the severe gastro‐intestinal adverse event rate following the OCP would be between 1% and 7%.
Sensitivity analysis restricting studies to low risk of bias (defined in methods section 'Sensitivity analysis') was unable to be performed due to no RCTs having a low risk of bias.
7.2.2 Others
Four trials including 159 women compared the OCP versus metformin combined with the OCP and reported other severe adverse events (Bodur 2018; Essah 2011; Glintborg 2014a; Wu 2008).
We are uncertain if there is a difference between the OCP and metformin combined with the OCP for other severe adverse events (OR 1.61, 95% CI 0.49 to 5.37, 4 RCTs, n = 159, I2 = 12%, low‐quality evidence, Analysis 7.2). This suggests that for severe other adverse event rate of 4% following metformin combined with the OCP, the severe other adverse event rate following the OCP would be between 1.9% and 17.9%.
Sensitivity analysis restricting studies to low risk of bias (defined in methods section 'Sensitivity analysis') was unable to be performed due to no RCTs having a low risk of bias.
7.3 Adverse events: minor (gastro‐intestinal and others)
Two trials including 98 women compared the OCP versus metformin combined with the OCP and reported minor adverse events (Elter 2002; Wei 2012).
7.3.1 Gastro‐intestinal
Overall, the OCP may have a lower incidence of minor (gastro‐intestinal) adverse events compared to metformin combined with the OCP (OR 0.06, 95% CI 0.01 to 0.44, 2 RCTs, n = 98, I2 = 0%,low‐quality evidence; Analysis 7.3). This suggests that for an overall minor (gastro‐intestinal) adverse event rate of 26% following metformin combined with the OCP, the minor (gastro‐intestinal) adverse event rate following the OCP would be between 0.4% and 13%.
Subgroup analysis was not applicable as all minor adverse events were gastro‐intestinal in nature.
Sensitivity analysis restricting studies to low risk of bias (defined in methods section 'Sensitivity analysis') was unable to be performed due to no RCTs having a low risk of bias.
One trial including 24 women compared the OCP versus metformin combined with the OCP and reported minor adverse events with metformin combined with the OCP, but did not report supporting data and therefore could not be included in any meta‐analysis in this review (Kebapcilar 2009a).
Secondary outcomes
Improved menstrual pattern (i.e. shortening of intermenstrual days)
No RCT reported on this outcome.
Improved menstrual pattern (i.e. an initiation of menses or cycle regularity)
No RCT reported on this outcome
7.4 Acne ‐ clinical acne score
One trial including 82 women compared the OCP versus metformin combined with the OCP and reported acne using a clinical acne score. (Feng 2016).
The OCP may improve slightly acne compared to metformin combined with the OCP (MD ‐0.09, 95% CI ‐0.10 to ‐ 0.08, 1 RCT, n = 82, low‐quality evidence, Analysis 7.4).
This one RCT had a low risk of bias (defined in methods section 'Sensitivity analysis').
7.5 Acne ‐ subjective improvement
One trial including 129 women compared the OCP versus metformin combined with the OCP and reported acne subjectively. (Bhattacharya 2016).
There was insufficient evidence to determine whether there was a difference between the OCP and metformin combined with the OCP for acne (OR 0.67, 95% CI 0.33 to 1.35, 1 RCT, n = 129, Analysis 7.5).
Diagnosis of Type II diabetes mellitus
No RCT reported on this outcome.
7.6 Body weight (kg)
Seven trials including 387 women compared the OCP versus metformin combined with the OCP and reported on body weight (Bhattacharya 2016; Cibula 2005; Essah 2011; Glintborg 2014a; Kaya 2015; Kumar 2018; Wei 2012).
Overall, there was insufficient evidence to determine whether there was a difference between the OCP and metformin combined with the OCP for body weight (MD ‐0.63, 95% CI ‐1.58 to 0.33, 7 RCTs, n = 387, I2 = 18%, Analysis 7.6).
Subgroup analysis showed insufficient evidence to suggest a difference in effect by mean study BMI (test for subgroup difference: P = 0.80, I2 = 0%).
7.7 Body Mass Index (BMI) (kg/m2)
Thirteen trials including 661 women compared the OCP versus metformin combined with the OCP and reported on BMI (Bhattacharya 2016; Cibula 2005; Elter 2002; Essah 2011; Feng 2016; Glintborg 2014a; Lv 2005; Kaya 2015; Kebapcilar 2009a; Kebapcilar 2009b; Kumar 2018; Wei 2012; Wu 2008).
Overall, there was uncertainty as to whether there was a difference between the OCP and metformin combined with the OCP for BMI (MD ‐0.21, 95% CI ‐0.53 to 0.12, 13 RCTs, n = 661, I2 = 50%, very low‐quality evidence, Analysis 7.7).
Substantial heterogeneity was detected, which was not explained by the difference in effect of the interventions between the BMI subgroups (test for subgroup difference: P = 0.64, I2 = 0%).
Findings were not influenced by sensitivity analysis restricting to the one study with low risk of bias (defined in methods section'Sensitivity analysis') (Feng 2016).
Findings were not influenced by sensitivity analyses using a random‐effects model (in the presence of unexplained substantial heterogeneity).
The funnel plot (n = 13 studies) was symmetrical indicating that our findings might not be influenced by publication bias (funnel plot not shown)
7.8 Blood pressure ‐ systolic (mmHg)
Five trials including 326 women compared the OCP versus metformin combined with the OCP and reported on systolic blood pressure (Bhattacharya 2016; Essah 2011; Feng 2016; Glintborg 2014a; Kaya 2015).
Overall, there was insufficient evidence to determine whether there was a difference between the OCP and metformin combined with the OCP for systolic blood pressure (MD ‐1.75, 95% CI ‐4.03 to 0.53, 5 RCTs, n = 326, I2 = 76%, Analysis 7.8).
Substantial heterogeneity was detected which was not explained by a difference in effect of the interventions between the BMI subgroups (test for subgroup difference: P = 0.16, I2 = 45.8%).
Findings were not influenced by sensitivity analyses using a random‐effects model (in the presence of unexplained substantial heterogeneity).
7.9 Blood pressure ‐ diastolic (mmHg)
Five trials including 326 women compared the OCP versus metformin combined with the OCP and reported on diastolic blood pressure (Bhattacharya 2016; Essah 2011; Feng 2016; Glintborg 2014a; Kaya 2015).
Overall, there was insufficient evidence to determine whether there was a difference between the OCP and metformin combined with the OCP for diastolic blood pressure (MD ‐1.05, 95% CI ‐2.79 to 0.68, 5 RCTs, n = 326, I2 = 76%, Analysis 7.9).
Substantial heterogeneity was detected which was not explained by a difference in effect of the interventions between the BMI subgroups (test for subgroup difference: P = 0.28, I2 = 20.8%).
Findings were not influenced by sensitivity analyses using a random‐effects model (in the presence of unexplained substantial heterogeneity).
8. The OCP compared to metformin combined with the OCP in adult women (hormonal parameters)
8.1 Serum total testosterone (nmol/L)
Twelve trials including 715 women compared the OCP versus metformin combined with the OCP and reported on serum total testosterone (Bhattacharya 2016; Cibula 2005; Elter 2002; Essah 2011; Feng 2016; Glintborg 2014a; Kumar 2018; Lv 2005; Moro 2013; Song 2017; Wei 2012; Wu 2008).
Overall, the OCP resulted in an increase of serum total testosterone compared to metformin combined with the OCP (MD 0.08, 95% CI 0.01 to 0.16, 12 RCTs, n = 715, I2 = 0%, Analysis 8.1).
Subgroup analysis showed insufficient evidence to suggest a difference in effect by mean study BMI (test for subgroup difference: P = 0.91, I2 = 0%).
8.2 Free androgen index (FAI) (%)
Seven trials including 482 women compared the OCP versus metformin combined with the OCP and reported on FAI (Bhattacharya 2016; Cibula 2005; Glintborg 2014a; Kaya 2015; Moro 2013; Song 2017; Wei 2012).
Overall, the OCP resulted in an increase of FAI compared to metformin combined with the OCP (MD 0.51, 95% CI 0.30 to 0.71, 7 RCTs, n = 482, I2= 28%, Analysis 8.2).
Subgroup analysis showed insufficient evidence to suggest a difference in effect by mean study BMI (test for subgroup difference: P = 0.90, I2 = 0%).
9. The oral contraceptive pill (OCP) compared to metformin combined with the OCP in adult women (metabolic parameters)
9.1 Fasting insulin (mLU/L)
Twelve trials including 602 women compared the OCP versus metformin combined with the OCP and reported on fasting insulin (Cibula 2005; Elter 2002; Essah 2011; Feng 2016; Glintborg 2014a; Kebapcilar 2009a; Kebapcilar 2009b; Kumar 2018; Lv 2005; Song 2017; Wei 2012; Wu 2008).
Substantial heterogeneity was detected which may be explained by the difference in effect of the interventions between the mean BMI subgroups (test for subgroup difference: P = 0.0006, I2 = 86.6%). Therefore, we analysed the results per mean BMI subgroup.
The OCP compared to metformin combined with the OCP showed appreciable benefit for metformin combined with the OCP in the BMI < 25 kg/m2 subgroup (MD 4.77, 95% CI 3.26 to 6.28; 5 RCTs; n = 198; I2 = 0%), and in the BMI > 25 kg/m2 < 30 kg/m2 subgroup (MD 0.25, 95% CI 0.14 to 0.36; 4 RCTs; = 305; n = 4; I2 = 39%). There was no important effect between the OCP and metformin combined with the OCP in the BMI > 30 kg/m2 subgroup (MD ‐0.30, 95% CI ‐0.81 to 0.21; 1 RCT; n = 19; I2 = 0%).
9.2 Fasting glucose (mmol/L)
Ten trials including 529 women compared the OCP versus metformin combined with the OCP and reported on fasting glucose (Bodur 2018; Cibula 2005; Elter 2002; Essah 2011; Feng 2016; Glintborg 2014a; Kumar 2018; Lv 2005; Song 2017; Wei 2012).
Subgroup analysis showed sufficient evidence to suggest a difference in effect by mean study BMI (test for subgroup difference: P = 0.06, I2 = 64.1%), and therefore we did not pool the results and performed the analysis per BMI subgroup. (Analysis 9.2). The OCP compared to metformin combined with the OCP showed insufficient evidence of a difference in effect in the BMI ≤ 25 kg/m2 subgroup (MD 0.11, 95% CI ‐0.07 to 0.29; 5 RCTs; n = 205; I2 = 42%), and in the BMI ≥30 kg/m2 subgroup (MD ‐0.30, 95% CI ‐0.81 to 0.21; participants = 19; studies = 1; I2 = 0%). The OCP compared to metformin combined with the OCP showed an increase in fasting glucose levels in subgroup BMI > 25 kg/m2 < 30 kg/m2 (MD 1.37, 95% CI 0.42 to 2.32; participants = 385; studies = 7; I2 = 51%).
9.3 Total cholesterol (mmol/L)
Thirteen trials including 668 women compared the OCP versus metformin combined with the OCP and reported on total cholesterol (Cibula 2005; Elter 2002; Essah 2011; Feng 2016; Glintborg 2014a; Kaya 2015; Kebapcilar 2009a; Kebapcilar 2009b; Kumar 2018; Lv 2005; Moro 2013; Song 2017; Wei 2012).
Overall, there was insufficient evidence to determine whether there was a difference between the OCP and metformin combined with the OCP for total cholesterol (MD 0.07, 95% CI ‐0.05 to 0.17, 13 RCTs, n = 668, I2 = 55%, Analysis 9.3).
Substantial heterogeneity was detected which was not explained by a difference in effect of the interventions between the BMI subgroups (test for subgroup difference: P = 0.43, I2 = 0%).
Findings were not influenced by sensitivity analyses using a random‐effects model (in the presence of unexplained substantial heterogeneity).
9.4 High‐density lipoprotein (HDL) cholesterol (mmol/L)
Thirteen trials including 668 women compared the OCP versus metformin combined with the OCP and reported on HDL cholesterol (Cibula 2005; Elter 2002; Essah 2011; Feng 2016; Glintborg 2014a; Kaya 2015; Kebapcilar 2009a; Kebapcilar 2009b; Kumar 2018; Lv 2005; Moro 2013; Song 2017; Wei 2012).
Overall, the OCP resulted in a slight worsening of HDL cholesterol compared to metformin combined with the OCP (MD 0.05, 95% CI 0.01 to 0.09, 13 RCTs, n = 668, I2= 70%, Analysis 9.4).
Substantial heterogeneity was detected which was not explained by a difference in effect of the interventions between the BMI subgroups (test for subgroup difference: P = 0.40, I2 = 0%).
Findings were not influenced by sensitivity analyses using a random‐effects model (in the presence of unexplained substantial heterogeneity).
9.5 Low‐density lipoprotein (LDL) cholesterol (mmol/L)
Thirteen trials including 668 women compared the OCP versus metformin combined with the OCP and reported on LDL cholesterol (Cibula 2005; Elter 2002; Essah 2011; Feng 2016; Glintborg 2014a; Kaya 2015; Kebapcilar 2009a; Kebapcilar 2009b; Kumar 2018; Lv 2005; Moro 2013; Song 2017; Wei 2012).
Overall, there was insufficient evidence to determine whether there was a difference between the OCP and metformin combined with the OCP for LDL cholesterol (MD 0.04, 95% CI ‐0.05 to 0.14, 13 RCTs, n = 668, I2 = 25%, Analysis 9.5).
Subgroup analysis showed insufficient evidence to suggest a difference in effect by mean study BMI (test for subgroup difference: P = 0.65, I2 = 0%).
9.6 Triglycerides (mmol/L)
Thirteen trials including 668 women compared the OCP versus metformin combined with the OCP and reported on triglycerides (Cibula 2005; Elter 2002; Essah 2011; Feng 2016; Glintborg 2014a; Kaya 2015; Kebapcilar 2009a; Kebapcilar 2009b; Kumar 2018; Lv 2005; Moro 2013; Song 2017; Wei 2012).
Overall, there was insufficient evidence to determine whether there was a difference between the OCP and metformin combined with the OCP for total cholesterol (MD ‐0.02, 95% CI ‐0.09 to 0.04, 13 RCTs, n = 668, I2 = 45%, Analysis 9.6).
Subgroup analysis showed insufficient evidence to suggest a difference in effect by mean study BMI (test for subgroup difference: P = 0.43, I2 = 0%).
10. Metformin compared to the combined oral contraceptive pill (OCP) in adolescent women (clinical parameters)
Four trials including 42 adolescent women compared metformin to the OCP (Al‐Zubeidi 2015; Allen 2005; El Maghraby 2015; Hoeger 2008a).
Primary outcomes
10.1 Hirsutism ‐ Clinical Ferriman‐Gallwey (F‐G) score
One trial including 16 adolescent women compared metformin versus the OCP and reported hirsutism clinically using the F‐G score (Hoeger 2008a).
There was uncertainty as to whether there was a difference between metformin and the OCP for hirsutism (MD ‐0.40, 95% CI ‐3.42 to 2.62, 1 RCT, n = 16, very low‐quality evidence, Analysis 10.1). This suggests that for a mean F‐G score of 8.6 following the OCP, the mean F‐G score following metformin would be between 3.42 lower to 2.62 higher.
Sensitivity analysis restricting studies to low risk of bias (defined in methods section Sensitivity analysis') was unable to be performed due to no RCTs having a low risk of bias.
Hirsutism ‐ Subjective visual analogue scale (VAS)
No RCT reported on this outcome.
10.2Hirsutism ‐ Subjective improvement
One trial including 80 adolescent women compared metformin versus the OCP and reported hirsutism subjectively (not reported if patient self‐assessed or clinician assessed) (El Maghraby 2015).
There was insufficient evidence to determine whether there was a difference between metformin and the OCP for hirsutism (Peto OR 0.50, 95% CI 0.19 to 1.30, 1 RCT, n = 80, Analysis 10.2).
10.3 Adverse events: severe (requiring stopping of medication) (gastro‐intestinal and others)
10.3.1 Others
One trial including 80 adolescent women compared metformin versus the OCP and reported severe other adverse events (El Maghraby 2015).
There was uncertainty as to whether there was a difference between metformin and the OCP for severe other adverse events (OR 0.63, 95% CI 0.16 to 2.43, 1 RCT, n = 80, very low‐quality evidence, Analysis 10.3).
This suggests that for a severe other adverse event rate of 1.5% following the OCP, the severe other adverse event rate following metformin would be between 2.7% and 30%.
10.4 Adverse events: minor (gastro‐intestinal and others)
10.4.1 Gastro‐intestinal
One trial including 22 adolescent women compared metformin versus the OCP and reported minor gastro‐intestinal adverse events (Al‐Zubeidi 2015).
There was uncertainty as to whether there was a difference between metformin and the OCP for minor gastro‐intestinal adverse events (OR 11.67, 95% CI 0.53 to 258.56, 1 RCT, n = 12, very low‐quality evidence, Analysis 10.4). This suggests that for a minor (gastro‐intestinal) adverse event rate of 0% following the OCP, the minor (gastro‐intestinal) adverse event rate following metformin would be between 0% and 0%.
Secondary outcomes
Improved menstrual pattern (i.e. shortening of intermenstrual days)
No RCT reported on this outcome.
10.5 Improved menstrual pattern (i.e. an initiation of menses or cycle regularity)
One trial including 80 adolescent women compared metformin versus the OCP and reported improvement in menstrual pattern (El Maghraby 2015).
There was uncertainty as to whether there was a difference between metformin and the OCP for improvement of menstrual pattern (OR 0.10, 95% CI 0.01 to 1.92, 1 RCT, n = 80, very low‐quality evidence, Analysis 10.5).
Sensitivity analysis restricting studies to low risk of bias (defined in methods section 'Sensitivity analysis') was unable to be performed due to no RCTs having a low risk of bias.
One trial including 34 adolescent women compared metformin versus the OCP and reported improvement in menstrual pattern but did not report supporting data, and therefore could not be included in any meta‐analysis in this review (Al‐Zubeidi 2015).
Acne ‐ visual analogue scale (VAS)
No RCT reported on this outcome.
Acne ‐ Subjective improvement
No RCT reported on this outcome.
Diagnosis of type II diabetes mellitus
No RCT reported on this outcome.
10.6 Body weight (kg)
Two trials including 111 adolescent women compared metformin versus the OCP and reported on body weight (Allen 2005; El Maghraby 2015).
Substantial heterogeneity was detected which may be explained by the difference in effect of the interventions between the mean BMI subgroups (test for subgroup difference: P = 0.04, I2 = 77.1%) (Analysis 10.6) . Therefore, we analysed the results per mean BMI subgroup. The effect of metformin compared to the OCP showed an appreciable benefit for metformin in subgroup, mean BMI not stated (MD ‐19.00, 95% CI ‐20.81 to ‐17.19; 1 RCT; n = 80; I2 = 0%), and no appreciable benefit/harm in subgroup BMI ≥30 kg/m2 (MD ‐2.60, 95% CI ‐17.87 to 12.67; 1 RCT; n = 31; I2 = 0%).
10.7 Body Mass Index (kg/m2)
Three trials including 69 adolescent women compared metformin versus the OCP and reported on BMI (Al‐Zubeidi 2015; Allen 2005; Hoeger 2008a).
Overall, there was uncertainty as to whether there was a difference between metformin and the OCP for BMI (MD ‐1.45, 95% CI ‐5.08 to 2.17, 3 RCTs, n = 69, I2 = 0%, very low‐quality evidence, Analysis 10.7). This suggests that for a mean BMI of 36 following the OCP, the mean BMI following metformin would be between 5.08 lower to 2.17 higher.
Subgroup analysis was not applicable as all three RCTs were in the same mean study BMI subgroup.
Sensitivity analysis restricting studies to low risk of bias (defined in methods section 'Sensitivity analysis') was unable to be performed due to no RCTs having a low risk of bias.
10.8 Blood pressure ‐ systolic (mmHg)
One trial including 16 adolescent women compared metformin versus the OCP and reported on systolic blood pressure (Hoeger 2008a).
There was insufficient evidence to determine whether there was a difference between metformin and the OCP for systolic blood pressure (MD ‐1.40, 95% CI ‐12.87 to 10.07, 1 RCT, n = 16, Analysis 10.8).
10.9 Blood pressure ‐ diastolic (mmHg)
One trial including 16 adolescent women compared metformin versus the OCP and reported on diastolic blood pressure (Hoeger 2008a).
There was insufficient evidence to determine whether there was a difference between metformin and the OCP for diastolic blood pressure (MD ‐5.10, 95% CI ‐13.69 to 3.49, 1 RCT, n = 16, Analysis 10.9).
11. Metformin compared to the combined oral contraceptive pill (OCP) in adolescent women (hormonal parameters)
11.1 Serum total testosterone (nmol/L)
Three trials including 69 adolescent women compared metformin versus the OCP and reported on serum total testosterone (Al‐Zubeidi 2015; Allen 2005; Hoeger 2008a).
There was insufficient evidence to determine whether there was a difference between metformin and the OCP for serum total testosterone (MD 0.23, 95% CI ‐0.21 to 0.68, 3 RCTs, n = 69, I2= 0%, Analysis 11.1).
Subgroup analysis was not applicable as all three RCTs were in the same mean study BMI subgroup.
11.2 Free androgen index (FAI) (%)
One trial including 16 adolescent women compared metformin versus the OCP and reported on FAI (Hoeger 2008a).
Metformin resulted in an increase of FAI compared to the OCP (MD 8.50, 95% CI 1.99 to 15.01, 1 RCT, n = 16, Analysis 11.2).
12. Metformin compared to the combined oral contraceptive pill (OCP) in adolescent women (metabolic parameters)
12.1 Fasting insulin (mLU/L)
Two trials including 53 adolescent women compared metformin versus the OCP and reported on fasting insulin (Al‐Zubeidi 2015; Allen 2005).
Overall, there was insufficient evidence to determine whether there was a difference between metformin and the OCP for fasting insulin (MD 4.55, 95% CI ‐4.82 to 13.92, 2 RCTs, n = 53, I2= 21%, Analysis 12.1).
Subgroup analysis was not applicable as both RCTs were in the same mean study BMI subgroup.
12.2 Fasting glucose (mmol/L)
One trial including 16 adolescent women compared metformin versus the OCP and reported on fasting glucose (Hoeger 2008a).
There was insufficient evidence to determine whether there was a difference between metformin and the OCP for fasting glucose (MD 0.11, 95% CI ‐0.55 to 0.77, 1 RCT, n = 16, Analysis 12.2).
12.3 Total cholesterol (mmol/L)
Two trials including 47 adolescent women compared metformin versus the OCP and reported on total cholesterol (Allen 2005; Hoeger 2008a).
Overall, metformin resulted in an improvement of total cholesterol compared to the OCP (MD ‐1.12, 95% CI ‐1.66 to ‐0.58, 2 RCTs, n = 47, I2= 0%, Analysis 12.3).
Subgroup analysis was not applicable as both RCTs were in the same mean study BMI subgroup.
12.4 High‐density lipoprotein (HDL) cholesterol (mmol/L)
Two trials including 47 adolescent women compared metformin versus the OCP and reported on HDL cholesterol (Allen 2005; Hoeger 2008a).
Overall, there was insufficient evidence to determine whether there was a difference between metformin and the OCP for HDL cholesterol (MD 0.12, 95% CI ‐0.10 to 0.34, 2 RCTs, n = 47, I2= 6%, Analysis 12.4).
Subgroup analysis was not applicable as both RCTs were in the same mean study BMI subgroup.
12.5 Low‐density lipoprotein ( LDL) cholesterol (mmol/L)
Two trials including 47 adolescent women compared metformin versus the OCP and reported on LDL cholesterol (Allen 2005; Hoeger 2008a).
Overall, metformin resulted in an improvement of LDL cholesterol compared to the OCP (MD ‐0.92, 95% CI ‐1.49 to ‐0.35, 2 RCTs, n = 47, I2= 0%, Analysis 12.5).
Subgroup analysis was not applicable as both RCTs were in the same mean study BMI subgroup.
12.6 Triglycerides (mmol/L)
Three trials including 69 adolescent women compared metformin versus the OCP and reported on triglycerides (Bhattacharya 2016; Allen 2005; Hoeger 2008a).
Overall, there was insufficient evidence to determine whether there was a difference between metformin and the OCP for triglycerides (MD ‐0.13, 95% CI ‐0.37 to 0.10, 3 RCTs, n = 69, I2= 9%, Analysis 12.6).
Subgroup analysis was not applicable as all three RCTs were in the same mean study BMI subgroup.
Metformin compared to metformin combined with the oral contraceptive pill (OCP) in adolescent women
There were no trials identified comparing metformin with metformin combined with the OCP in adolescent women on the selected outcomes for this review.
13. The oral contraceptive pill (OCP) compared to metformin combined with the OCP in adolescent women (clinical parameters)
One trial including 36 adolescent women compared metformin combined with the OCP compared to the OCP (Hoeger 2008b).
Primary outcomes
13.1 Hirsutism ‐ Clinical Ferriman‐Gallwey (F‐G)score
One trial including 32 women compared the OCP versus metformin combined with the OCP and reported hirsutism clinically using the F‐G score (Hoeger 2008b).
There was uncertainty as to whether there was a difference between the OCP and metformin combined with the OCP for hirsutism (MD 0.80, 95% CI ‐1.19 to 2.79, 1 RCT, n = 32, very low‐quality evidence, Analysis 13.1). This suggests that for a mean F‐G score of 6.2 following metformin combined with the OCP, the mean F‐G score following the OCP would be between 1.19 lower to 2.79 higher.
Sensitivity analysis restricting studies to low risk of bias (defined in methods section 'Sensitivity analysis') was unable to be performed due to no RCTs having a low risk of bias.
Hirsutism ‐ subjective visual analogue scale (VAS)
No RCT reported on this outcome.
Hirsutism ‐ subjective improvement
No RCT reported on this outcome.
13.2 Adverse events: severe (requiring stopping of medication) (gastro‐intestinal and others)
13.2.1 Gastro‐intestinal
One trial including 36 women compared the OCP versus metformin combined with the OCP and reported severe gastro‐intestinal adverse events (Hoeger 2008b).
There was uncertainty as to whether there was a difference between the OCP and metformin combined with the OCP for severe gastro‐intestinal adverse event (OR 1.00, 95% CI 0.06 to 17.33, 1 RCT, n = 36, very low‐quality evidence, Analysis 13.2). This suggests that for a severe gastro‐intestinal adverse event rate of 5.6% following metformin combined with the OCP, the severe gastro‐intestinal adverse event rate following the OCP would be between 0.4% and 50.5%.
Adverse events ‐minor (gastro‐intestinal and others)
No RCT reported on this outcome.
Secondary outcomes
Improved menstrual pattern (i.e. shortening of intermenstrual days)
No RCT reported on this outcome.
Improved menstrual pattern (i.e. an initiation of menses or cycle regularity)
No RCT reported on this outcome.
Acne ‐ visual analogue scale (VAS)
No RCT reported on this outcome.
Acne ‐ subjective improvement
No RCT reported on this outcome.
Diagnosis of Type II diabetes mellitus
No RCT reported on this outcome.
Body weight (kg)
No RCT reported on this outcome.
13.3 Body mass index (kg/m2)
One trial including 32 women compared the OCP versus metformin combined with the OCP and reported BMI (Hoeger 2008b).
There was uncertainty as to whether there was a difference between the OCP and metformin combined with the OCP for BMI (MD 1.50, 95% CI ‐1.63 to 4.63, 1 RCT, n = 32, very low‐quality evidence, Analysis 13.3). This suggests that for a mean BMI of 32.4 following metformin combined with the OCP, the mean BMI following the OCP would be between 1.63 lower to 4.63 higher.
Sensitivity analysis restricting studies to low risk of bias (defined in methods section 'Sensitivity analysis') was unable to be performed due to no RCTs having a low risk of bias.
13.4 Blood pressure ‐ systolic (mmHg)
One trial including 32 women compared the OCP versus metformin combined with the OCP and reported systolic blood pressure (Hoeger 2008b).
There was insufficient evidence to determine whether there was a difference between the OCP and metformin combined with the OCP for systolic blood pressure (MD ‐3.50, 95% CI ‐12.65 to 5.65, 1 RCT, n = 32, Analysis 13.4).
13.5 Blood pressure ‐ diastolic (mmHg)
One trial including 32 women compared the OCP versus metformin combined with the OCP and reported diastolic blood pressure (Hoeger 2008b).
There was insufficient evidence to determine whether there was a difference between the OCP and metformin combined with the OCP for diastolic blood pressure (MD ‐1.00, 95% CI ‐6.94 to 4.94, 1 RCT, n = 32, Analysis 13.5).
14 The oral contraceptive pill (OCP) compared to metformin combined with the OCP in adolescent women (hormonal parameters)
14.1 Serum total testosterone (nmol/L)
One trial including 32 women compared the OCP versus metformin combined with the OCP and reported serum total testosterone (Hoeger 2008b)
There was insufficient evidence to determine whether there was a difference between the OCP and metformin combined with the OCP for serum total testosterone (MD 0.37, 95% CI ‐0.29 to 1.03, 1 RCT, n = 32, Analysis 14.1).
14.2 Free androgen index (FAI) (%)
One trial including 32 women compared the OCP versus metformin combined with the OCP and reported FAI (Hoeger 2008b).
There was insufficient evidence to determine whether there was a difference between the OCP and metformin combined with the OCP for FAI (MD 0.70, 95% CI ‐0.32 to 1.72, 1 RCT, n = 32, Analysis 14.2).
15 The oral contraceptive pill (OCP) compared to metformin combined with the OCP in adolescent women (metabolic parameters)
Fasting insulin (mLU/L)
No RCT reported on this outcome.
15.1 Fasting glucose (mmol/L)
One trial including 32 women compared the OCP versus metformin combined with the OCP and reported fasting glucose (Hoeger 2008b).
There was insufficient evidence to determine whether there was a difference between the OCP and metformin combined with the OCP for fasting glucose (MD 0.03, 95% CI ‐0.23 to 0.29, 1 RCT, n = 32, Analysis 15.1).
15.2 Total cholesterol (mmol/L)
One trial including 32 women compared the OCP versus metformin combined with the OCP and reported total cholesterol (Hoeger 2008b).
There was insufficient evidence to determine whether there was a difference between the OCP and metformin combined with the OCP for total cholesterol (MD ‐0.50, 95% CI ‐1.32 to 0.32, 1 RCT, n = 32, Analysis 15.2).
15.3 High‐density lipoprotein (HDL) cholesterol (mmol/L)
One trial including 32 women compared the OCP versus metformin combined with the OCP and reported HDL cholesterol (Hoeger 2008b)
There was insufficient evidence to determine whether there was a difference between the OCP and metformin combined with the OCP for HDL cholesterol (MD 0.23, 95% CI ‐0.00 to 0.46, 1 RCT, n = 32, Analysis 15.3).
15.4 Low‐density lipoprotein (LDL) cholesterol (mmol/L)
One trial including 32 women compared metformin combined with the OCP versus the OCP and reported LDL cholesterol (Hoeger 2008b).
There was insufficient evidence to determine whether there was a difference between the OCP and metformin combined with the OCP for LDL cholesterol (MD ‐0.29, 95% CI ‐0.99 to 0.41, 1 RCT, n = 32, Analysis 15.4).
15.5 Triglycerides (mmol/L)
One trial including 32 women compared metformin combined with the OCP versus the OCP and reported triglycerides (Hoeger 2008b).
There was insufficient evidence to determine whether there was a difference between the OCP and metformin combined with the OCP for triglycerides (MD 0.02, 95% CI ‐0.68 to 0.72, 1 RCT, n = 32, Analysis 15.5).
Discussion
Summary of main results
Metformin compared to the oral contraceptive pill (OCP) in adult women
Main outcomes
Metformin, when compared with the OCP, may be less effective in improving hirsutism in the subgroup BMI > 25/kg2 < BMI 30kg/m2 but we are uncertain of the effect of metformin compared to the OCP on hirsutism in subgroups body mass index (BMI) < 25 kg/m2 and BMI > 30 kg/m2. Metformin may result in a higher incidence of severe gastro‐intestinal side‐effects and a lower incidence of severe other side effects compared to the OCP. There were no trials reporting on minor adverse events. Metformin may be less effective in improving menstrual pattern compared to the OCP by lengthening of intermenstrual days. In terms of an initiation of menses or cycle regularity, Metformin compared to the OCP may be less effective in improving menstrual pattern in subgroup BMI ≤ 25 kg/m2 but we are uncertain if metformin is less effective in improving menstrual pattern in subgroup BMI > 25 kg/m2 < 30kg/m2 and uncertain of the effect of metformin compared to the OCP in subgroup BMI ≥ 30 kg/m2 and subgroup BMI not stated. There was uncertainty as to whether there was a difference between metformin and the OCP for acne. We are uncertain if metformin decreases BMI compared to the OCP in subgroup BMI < 25 kg/m2 and subgroup BMI > 30 kg/m2,whist there is uncertainty in the effect of metformin compared to the OCP on BMI in subgroup BMI > 25 kg/m2 < 30 kg/m2. The quality of the evidence for all reported main outcomes between these two interventions were either low (indicating that our confidence in the effect estimate is limited and that the true effect may be substantially different from the estimate of the effect), or very low (indicating that we have very little confidence in the effect estimate and that the true effect is likely to be substantially different from the estimate of effect).
Other outcomes
Metformin, when compared to the OCP, resulted in an improvement of the clinical parameters systolic blood pressure with insufficient evidence to determine whether there was a difference in diagnosis of type 2 diabetes mellitus, diastolic blood pressure and body weight. Metformin was less effective in improving hormonal parameters serum total testosterone and free androgen index (FAI) compared to the OCP. In terms of metabolic parameters, metformin resulted in an improvement in fasting insulin, glucose, total cholesterol and triglycerides with insufficient evidence to determine whether there was a difference in fasting high‐density lipoprotein (HDL) or low‐density lipoprotein (LDL) cholesterol when compared to the OCP.
Metformin compared to metformin combined with the OCP in adult women
Main outcomes
Metformin alone when compared with metformin combined with the OCP, may be less effective in improving hirsutism, but we are uncertain as to whether there is a difference between these two interventions for severe gastro‐intestinal adverse events and severe other adverse events requiring stopping medication. There were no trials reporting on minor adverse events, menstrual pattern or acne. Metformin may improve BMI compared to metformin combined with the OCP. The quality of the evidence for all reported main outcomes between these two interventions was low.
Other outcomes
Metformin, when compared to metformin combined with the OCP, resulted in an improvement of the clinical parameters body weight, systolic blood pressure, and diastolic blood pressure with no randomised controlled trials (RCTs) reporting on diagnosis of type 2 diabetes mellitus. Metformin alone was less effective in improving hormonal parameters serum total testosterone and FAI compared to metformin combined with the OCP. In terms of metabolic parameters, metformin resulted in an improvement in fasting insulin, glucose, total cholesterol (in the presence of unexplained substantial heterogeneity), and triglycerides with insufficient evidence to determine whether there was a difference in fasting HDL or LDL cholesterol when compared to metformin combined with the OCP.
The OCP compared to metformin combined with the OCP in adult women
Main outcomes
The OCP alone when compared with metformin combined with the OCP, may be less effective in improving hirsutism. The OCP may result in a lower incidence of severe gastro‐intestinal side effects, but there is uncertainty as to whether there is a difference for other severe adverse events when compared to metformin combined with the OCP. The OCP may have a lower incidence of minor (gastro‐intestinal) adverse events compared to metformin combined with the OCP. There were no trials reporting on menstrual pattern. The OCP alone may slightly improve acne compared to metformin combined with the OCP. We are uncertain as to whether there is a difference between these two interventions for BMI. The quality of the evidence for all reported main outcomes between these two interventions were low except for the outcome of BMI which had very low‐quality evidence .
Other outcomes
There was insufficient evidence to determine whether there was a difference in the clinical parameters body weight, systolic blood pressure, and diastolic blood pressure when comparing the OCP to metformin combined with the OCP, with no RCTs reporting on diagnosis of type 2 diabetes mellitus. The OCP was less effective in improving hormonal parameters serum total testosterone and FAI compared to metformin combined with the OCP. In terms of metabolic parameters, the OCP was less effective in improving fasting insulin and glucose with insufficient evidence to determine whether there was a difference in fasting lipids (total cholesterol, HDL cholesterol, LDL cholesterol and triglycerides) when compared to metformin combined with the OCP.
Metformin compared to the OCP in adolescent women
Main outcomes
We are uncertain as to whether there is a difference between metformin, when compared to the OCP, in the outcomes hirsutism, adverse events (severe other requiring stopping medication and minor gastro‐intestinal), menstrual pattern, acne (no trials reporting this outcome) and BMI. The quality of the evidence for all reported main outcomes between these two interventions were very low due primarily to very serious imprecision as the evidence for all reported main outcomes derived from a single RCT.
Other outcomes
Metformin, when compared to the OCP, resulted in an improvement of the clinical parameter body weight with insufficient evidence to determine whether there was a difference in systolic or diastolic blood pressure and no RCTs reporting on diagnosis of type 2 diabetes mellitus. Metformin was less effective in improving the hormonal parameter FAI when compared to the OCP, with insufficient evidence to determine whether there was a difference in serum total testosterone. In terms of metabolic parameters, metformin resulted in an improvement in fasting total and LDL cholesterol with insufficient evidence to determine whether there was a difference in fasting insulin, glucose, HDL cholesterol and triglycerides when compared to the OCP.
Metformin compared to metformin combined with the OCP in adolescent women
There were no trials identified comparing metformin versus metformin combined with the OCP in adolescent women reporting on the outcomes for this review.
The OCP compared to metformin combined with the OCP in adolescent women
Main outcomes
We are uncertain as to whether there is a difference between the OCP alone when compared with metformin combined with the OCP, in the outcomes hirsutism, adverse events (both severe requiring stopping medication and minor (no trials reporting this latter outcome)), menstrual pattern (no trials reporting this outcome), acne (no trials reporting this outcome), and BMI. The quality of the evidence for all reported main outcomes between these two interventions were very low due primarily to very serious imprecision as the evidence for all reported main outcomes derived from a single RCT.
Other outcomes
There was insufficient evidence to determine whether there was a difference in the clinical parameters systolic and diastolic blood pressure with no RCTs reporting on diagnosis of type 2 diabetes mellitus and body weight. There was insufficient evidence to determine whether there was a difference in the hormonal parameters serum total testosterone and FAI when comparing the OCP with metformin combined with the OCP. In terms of metabolic parameters, there was also insufficient evidence to determine whether there was a difference in fasting glucose and lipids (total cholesterol, HDL cholesterol, LDL cholesterol and triglycerides) when comparing the OCP with metformin combined with the OCP, with no RCTs reporting fasting insulin.
Overall completeness and applicability of evidence
In adult women with PCOS, we found sufficient studies reporting on our main clinical outcomes of hirsutism, menstrual pattern and adverse events to answer our main review questions for our main comparison of metformin compared to the OCP. However, there were only two RCTs reporting on the other main clinical outcome of acne for this comparison. For the other comparisons for this review (metformin versus metformin in combination with the OCP; and the OCP versus metformin in combination with the OCP), there was only a small number of RCTs reporting on our main clinical outcomes. In adolescent women with PCOS, there was only a small number of RCTs reporting on our main clinical outcomes for all three comparisons. Unfortuately, the predominantly low or very low quality of the evidence provided by the included studies limited the confidence we have in the effect estimate for our main clinical outcomes for all three comparisons in both adult and adolescent women with PCOS.
In terms of the applicability of the evidence with respect to the participants, this review includes 44 RCTs with 2253 PCOS women who met the Rotterdam diagnostic criteria for PCOS (Rotterdam ESHRE 2004) in 43/44 studies as 1/44 studies did not described any diagnostic criteria. 2047 adult women were recruited in 39/44 studies and 206 adolescent women were recruited in 5/44 studies. The women with PCOS were recruited in and thus representative of a number of continents around the world including Europe (see section on description of studies for list of European countries), North America (USA), Africa (Egypt), Asia (Iran, Iraq and Turkey) and Australia.
In terms of the applicability of the evidence with respect to reporting results per pre‐specified population mean BMI subgroups (e.g. BMI ≤ 25kg/m2, BMI > 25kg/m2 but < 30kg/m2, BMI ≥30kg/m2) in the presence of explained (by the BMI subgroup) significant heterogeneity, it is important to note that when interpreting these subgroup findings that the subgroups were defined on this basis of mean BMI, rather than on the basis of a population restricted to a certain BMI range according to strict study inclusion criteria. Participants in the particular subgroup may be very heterogeneous with some having a BMI much lower or higher than the mean BMI and thus does not imply that participants in the study generally have a BMI close to that value. Therefore, caution is required in that the translation of findings into treatment recommendations from a population with a particular mean BMI is different from saying that this is the effect in a population restricted to a given BMI range and thus should not be misinterpreted as showing the latter.
In terms of the applicability of the evidence with respect to the interventions, all the studies compared the relevant interventions of metformin versus the OCP (alone or in combination). There were no trials identified comparing metformin with metformin combined with the OCP in adolescent women on the selected outcomes for this review. The daily dose of metformin ranged from 500 mg to 2000 mg in the included studies. This review compared OCPs as a group, however, different types and doses of oestrogen and progesterone were used. Indeed, 31 trials used ethinyl estradiol (EE) 35 µg combined with cyproterone acetate (CPA) 2 mg (EE 35/CPA2) as the OCP, four trials used EE 35 µg combined with drospirenone 3 mg, three trials used EE 35 µg combined with desogestrel 150, three trials used EE 35 µg combined with norgestimate 0.25, one trial used EE 30 µg with norethisterone 1mg, one trial used EE 20 µg with drospirenone 3 µg, and one trial used EE 30 µg with progestin 15 mg. Therefore, the results of this review are generally applicable to these specific types of the OCP.
In terms of the applicability of the evidence with respect to the outcomes, the review investigated the main clinically important outcomes of hirsutism, acne, improvement of menstrual pattern, BMI and adverse events for the three comparisons (the OCP versus metformin, metformin versus metformin combined with the OCP, and the OCP versus metformin combined with the OCP) in both adolescent and adult women with PCOS separately. The majority of the outcomes reported in the studies were hirsutism, improvement of menses (the OCP versus metformin), BMI and adverse outcomes with only two studies reporting on acne. There was only one study identified reporting on the diagnosis of type 2 diabetes mellitus (the OCP versus metformin). The review also investigated the important surrogate outcomes related to the clinically important outcomes including hormonal (serum total testosterone and FAI) and metabolic (fasting insulin, glucose and lipids [total cholesterol, HDL cholesterol, LDL cholesterol and triglycerides) parameters.
There were four studies, all recruiting adult women with PCOS, that measured outcomes but had no 'usable' data. Two of these studies were for the comparison of metformin versus the OCP, one study was for the outcome of 'Hirsutism ‐ Subjective improvement' and the other study was for the outcome of 'Acne ‐ Subjective improvement'. One study was for the comparison of metformin versus metformin combined with the OCP for the outcome of severe adverse events. The last such study was for the comparison of the OCP versus metformin combined with the OCP for the comparison of minor adverse events.
The review findings both support and will help guide the current common practice of using the OCP and metformin, either alone or in combination, in the long‐term treatment of both adult and adolescent women with PCOS.
Quality of the evidence
Evidence quality for the main outcomes of the review ranged from very low to low based on GRADE assessment. The main limitations were risk of bias (very few studies at low risk of bias defined as low risk of selection bias (both random sequence generation and allocation concealment) and not at high risk of bias in any domain), imprecision and inconsistency. Only two of 44 studies in total were judged to be at low risk of bias (Feng 2016; Harborne 2003). This review had six comparisons as follows.
1. Metformin compared to the OCP in adult women.
The quality of the evidence for all reported main outcomes between these two interventions was either low (indicating that our confidence in the effect estimate is limited and that the true effect may be substantially different from the estimate of the effect) or very low (indicating that we have very little confidence in the effect estimate and that the true effect is likely to be substantially different from the estimate of effect).
2. Metformin compared to metformin combined with the OCP in adult women.
The quality of the evidence for all reported main outcomes between these two interventions was low .
3. The OCP compared to metformin combined with the OCP in adult women.
The quality of the evidence for all reported main outcomes between these two interventions was low except for the outcome of BMI which had very low‐quality evidence.
4. Metformin compared to the OCP in adolescent women.
The quality of the evidence for all reported main outcomes between these two interventions was very low due primarily to very serious imprecision as the evidence for all reported main outcomes derived from a single RCT.
5. Metformin compared to metformin combined with the OCP in adolescent women.
There were no trials identified comparing metformin versus metformin combined with the OCP in adolescent women reporting on the outcomes for this review.
6. The OCP compared to metformin combined with the OCP in adolescent women.
The quality of the evidence for all reported main outcomes between these two interventions was very low due primarily to very serious imprecision as the evidence for all reported main outcomes derived from a single RCT.
We observed significant (substantial) heterogeneity in many of the analyses, which was explained in most cases by the pre‐defined subgroup analysis of mean study BMI. Unexplained substantial heterogeneity was observed for the outcomes of BMI (the OCP versus metformin combined with the OCP in adults), systolic and diastolic blood pressure (the OCP versus metformin combined with the OCP in adults), fasting total cholesterol (metformin versus metformin combined with the OCP in adults), fasting total cholesterol (the OCP versus metformin combined with the OCP in adults) and fasting HDL cholesterol (the OCP versus metformin combined with the OCP in adults). Of these outcomes, all showed insufficient evidence to determine whether there was a difference between the interventions except for fasting total cholesterol (metformin versus metformin combined with the OCP in adults), which favoured the intervention of metformin and the result being unchanged with random‐effects meta‐analysis. Unexplained substantial heterogeneity resulted in the downgrading of evidence quality for the main review outcome of BMI (the OCP versus metformin combined with the OCP in adults).
Potential biases in the review process
We conducted a comprehensive search with the help of an experienced Information Specialist, and ran extensive manual searches in order to identify all relevant studies and in an effort to minimise the risk of publication bias. At the review level, we performed funnel plots for the main review outcomes if there were 10 or more studies in an analysis in order to explore the possibility of small‐study effects that may indicate incomplete identification of studies (publication bias). Four funnel plots were performed in total (metformin versus the OCP in adult women for the outcomes of hirsutism ‐ Clinical Ferriman‐Gallwey (F‐G) score, severe adverse events and BMI; the OCP versus metformin combined with the OCP for the outcome of BMI). Two of the funnel plots were symmetrical (metformin versus the OCP in adult women for the outcome of severe adverse events; the OCP versus metformin combined with the OCP for the outcome of BMI), indicating that our findings might not be influenced by publication bias. The other two funnel plots (metformin versus the OCP in adult women for the outcomes of hirsutism ‐ Clinical F‐G score and BMI) were asymmetrical indicating that our findings might be influenced by publication bias although the asymmetrical funnel plots for these two outcomes may also be due to the substantial heterogeneity (explained by mean study BMI subgroups) observed for these two outcomes.
We followed Cochrane guidelines to search for and identify all the studies eligible for this review, extract data and assess the quality and potential risks of different types of biases in all our included studies, in order to minimise the chance of error and bias by the review authors. Subjective judgements are involved in the assessment of risk of bias. This potential limitation is minimised by following the procedures in the Cochrane Handbook for Systematic Reviews of Interventions (Higgins 2017), with review authors independently assessing studies and resolving any disagreement through discussion, and if required involving a third review author in the decision.
There are four studies awaiting classification (Fruzzeti 2009; NCT01573377; Spremovic‐Radjenovic 2014; Vieira 2010), and three ongoing clinical trials (NCT02744131; NCT03229057; NCT03905941) that are likely to provide further useful information.
Agreements and disagreements with other studies or reviews
A recent systematic review and meta‐analysis of RCTs assessed the efficacy and safety of therapeutic approaches for adult patients with PCOS not seeking fertility including OCPs, antiandrogens (AA) and/or insulin sensitisers including metformin (Luque‐Ramirez 2018). This review did not compare metformin versus the OCP as such, but compared metformin versus the OCP and/or AAs, and agreed with our main outcome findings of a reduction in hirsutism and an improved menstrual pattern for the OCP and/or AAs along with a reduction in BMI for metformin. The outcomes of acne and adverse events were not reported. The global quality of evidence was low for the review, which was consistent with our findings. This review also compared the OCP and/or AAs versus metformin combined with the OCP and/or AAs, and reported on only one of our main outcomes for our review which was BMI. The review found a reduction in BMI with the addition of metformin to the OCP and/or AAs (low‐quality evidence), which disagreed with our findings, although our review did not compare exactly the same interventions as we did not include studies combining AA's with the OCP.
A more recent systematic review and meta‐analysis of RCTs aimed to investigate the effect of the OCP and/or metformin in the management of hormonal and clinical features of PCOS in order to inform the recent international guidelines on PCOS (Teede 2018; Teede 2019). This review restricted studies to those published in English language, used stricter study selection criteria in terms of including a RCT in terms of random sequence generation and allocation concealment and different methods for data synthesis (random‐effects model), and grading the quality of evidence (according to risk of bias with each study being allocated a risk of bias rating of either low, moderate of high) compared to our review, and did not report on the outcome of acne. For the comparison metformin versus the OCP, this review's findings agreed with our main outcomes findings with respect to an improvement in menstrual pattern with the OCP, but differed by finding no statistically significant difference between the two interventions for hirsutism, BMI, gastro‐intestinal side effects (all i.e. minor and severe) and other side effects (all i.e. minor and severe). The majority of included studies for this comparison were judged to be of moderate quality, and therefore, the authors recommended that the findings should be interpreted with some degree of caution.
The review by Teede and colleagues also compared metformin versus metformin + the OCP and reported on only one of our review main outcomes, BMI, and found no statistically significant difference between the two interventions and thus differed from our review. There were no RCTs reporting on adverse events (Teede 2019). The authors advised caution when interpreting the results due to moderate risk of bias across all studies. The same review also compared the OCP versus metformin + the OCP and found, in terms of the main outcomes for our review, no statistically significant difference between the two interventions for BMI (agreement with our review), gastro‐intestinal severe side effects (disagreement with our review) and gastro‐intestinal minor side effects (disagreement with our review). The RCTs were of moderate quality with small sample sizes (only 1 RCT reporting on gastro‐intestinal severe or minor side‐effects) with the authors advising that the results should be interpreted with caution.
The recently published international guideline on PCOS made recommendations based on Grading of Recommendations, Assessment, Development and Evaluation (GRADE) framework covering evidence quality, balance between desirable versus undesirable effects (direction and magnitude), feasibility, acceptability, cost, implementation and ultimately recommendation strength (Teede 2018). In terms of pharmacological treatment for non‐fertility indications in adult women with PCOS, the guideline, based on low‐quality evidence, made a strong recommendation for the use of the OCP alone for management of hyperandrogenism and/or irregular menstrual cycles, conditional recommendation for the use of metformin (in addition to lifestyle) for the treatment of weight, hormonal and metabolic outcomes, and a strong recommendation for the use of the OCP combined with metformin for management of metabolic features where the OCP and lifestyle changes do not achieve desired goals. Our review findings are likely to be consistent with these recommendations given that the recommendations are based on more factors than just the evidence (both direction and magnitude in addition to quality), but also take into consideration the balance between desirable versus undesirable consequences, feasibility, acceptability, cost, and implementation.
In terms of specifically adolescents with PCOS, two recent systematic review and meta‐analysis of RCTs have evaluated the use of metformin versus the OCP (but not combinations of metformin and/or the OCP) for the treatment of PCOS in adolescents (Al Khalifah 2016, Teede 2019). Both of these reviews included the same RCTs that were included for our review and both assessed the quality of evidence as very low or low, and as a result identified the need for future high‐quality RCTs to address several questions for the treatment of adolescents with PCOS, which is in accordance with our conclusions. The latter review also advised caution in the interpretation of the results due to the low quality of the evidence, whilst the former review, in light of the very low/low‐quality evidence, concluded that treatment choice should be guided by patient values and preferences while balancing potential adverse events. This conclusion was performed in order to formulate the recommendations in the recently published international guideline on PCOS which resulted in conditional recommendations (low‐quality evidence) to consider the use of both metformin alone or the OCP alone in adolescents with PCOS as pharmacological treatment for non‐fertility indications (Teede 2018). These conditional recommendations of the international guideline in PCOS reflect our review's findings of there being uncertainty as to whether there is a difference between metformin, when compared to the OCP, in the main outcomes in adolescents with PCOS.

Study flow diagram.

'Risk of bias' graph: review authors' judgements about each 'Risk of bias' item presented as percentages across all included studies

'Risk of bias' summary: review authors' judgements about each 'Risk of bias' item for each included study .

Forest plot of comparison: 1 Adult ‐ metformin versus OCP (Clinical parameters), outcome: 1.1 Hirsutism ‐ Clinical F‐G score.

Funnel plot of comparison: 1 Adult ‐ metformin versus OCP (Clinical parameters), outcome: 1.1 Hirsutism ‐ Clinical F‐G score.

Forest plot of comparison: 1 Adult ‐ metformin versus OCP (Clinical parameters), outcome: 1.4 Adverse events ‐ severe.

Comparison 1: Adult ‐ Metformin versus OCP (Clinical parameters), Outcome 1: Hirsutism ‐ Clinical F‐G score

Comparison 1: Adult ‐ Metformin versus OCP (Clinical parameters), Outcome 2: Hirsutism ‐ Subjective visual analogue scale

Comparison 1: Adult ‐ Metformin versus OCP (Clinical parameters), Outcome 3: Hirsutism ‐ Subjective improvement

Comparison 1: Adult ‐ Metformin versus OCP (Clinical parameters), Outcome 4: Adverse events ‐ severe

Comparison 1: Adult ‐ Metformin versus OCP (Clinical parameters), Outcome 5: Improved menstrual pattern (ie. shortening of intermenstrual days)

Comparison 1: Adult ‐ Metformin versus OCP (Clinical parameters), Outcome 6: Improved menstrual pattern (ie. an initiation of menses or cycle regularity)

Comparison 1: Adult ‐ Metformin versus OCP (Clinical parameters), Outcome 7: Acne ‐ Visual analogue scale

Comparison 1: Adult ‐ Metformin versus OCP (Clinical parameters), Outcome 8: Acne ‐ Subjective improvement

Comparison 1: Adult ‐ Metformin versus OCP (Clinical parameters), Outcome 9: Diagnosis of Type II diabetes mellitus

Comparison 1: Adult ‐ Metformin versus OCP (Clinical parameters), Outcome 10: Body weight (kg)

Comparison 1: Adult ‐ Metformin versus OCP (Clinical parameters), Outcome 11: Body Mass Index (kg/m2)

Comparison 1: Adult ‐ Metformin versus OCP (Clinical parameters), Outcome 12: Blood pressure ‐ systolic (mm Hg)

Comparison 1: Adult ‐ Metformin versus OCP (Clinical parameters), Outcome 13: Blood pressure ‐ diastolic (mm Hg)

Comparison 2: Adult ‐ Metformin versus OCP (Hormonal parameters), Outcome 1: Serum total testosterone (nmol/L)

Comparison 2: Adult ‐ Metformin versus OCP (Hormonal parameters), Outcome 2: Free androgen index (FAI) (%)

Comparison 3: Adult ‐ Metformin versus OCP (Metabolic parameters), Outcome 1: Fasting insulin (mIU/L)

Comparison 3: Adult ‐ Metformin versus OCP (Metabolic parameters), Outcome 2: Fasting glucose (mmol/L)

Comparison 3: Adult ‐ Metformin versus OCP (Metabolic parameters), Outcome 3: Total Cholesterol (mmol/L)

Comparison 3: Adult ‐ Metformin versus OCP (Metabolic parameters), Outcome 4: HDL Cholesterol (mmol/L)

Comparison 3: Adult ‐ Metformin versus OCP (Metabolic parameters), Outcome 5: LDL Cholesterol (mmol/L)

Comparison 3: Adult ‐ Metformin versus OCP (Metabolic parameters), Outcome 6: Triglycerides (mmol/L)

Comparison 4: Adult ‐ Metformin versus Metformin combined with OCP (Clinical parameters), Outcome 1: Hirsutism ‐ Clinical F‐G score

Comparison 4: Adult ‐ Metformin versus Metformin combined with OCP (Clinical parameters), Outcome 2: Adverse events ‐severe

Comparison 4: Adult ‐ Metformin versus Metformin combined with OCP (Clinical parameters), Outcome 3: Body weight (kg)

Comparison 4: Adult ‐ Metformin versus Metformin combined with OCP (Clinical parameters), Outcome 4: Body Mass Index (kg/m2)

Comparison 4: Adult ‐ Metformin versus Metformin combined with OCP (Clinical parameters), Outcome 5: Blood pressure ‐ systolic (mm Hg)

Comparison 4: Adult ‐ Metformin versus Metformin combined with OCP (Clinical parameters), Outcome 6: Blood pressure ‐ diastolic (mm Hg)

Comparison 5: Adult ‐ Metformin versus Metformin combined with OCP (Hormonal parameters), Outcome 1: Serum total testosterone (nmol/L)

Comparison 5: Adult ‐ Metformin versus Metformin combined with OCP (Hormonal parameters), Outcome 2: FAI (%)

Comparison 6: Adult ‐ Metformin versus Metformin combined with OCP (Metabolic parameters), Outcome 1: Fasting insulin (mIU/L)

Comparison 6: Adult ‐ Metformin versus Metformin combined with OCP (Metabolic parameters), Outcome 2: Fasting glucose (mmol/L)

Comparison 6: Adult ‐ Metformin versus Metformin combined with OCP (Metabolic parameters), Outcome 3: Total Cholesterol (mmol/L)

Comparison 6: Adult ‐ Metformin versus Metformin combined with OCP (Metabolic parameters), Outcome 4: HDL Cholesterol (mmol/L)

Comparison 6: Adult ‐ Metformin versus Metformin combined with OCP (Metabolic parameters), Outcome 5: LDL Cholesterol (mmol/L)

Comparison 6: Adult ‐ Metformin versus Metformin combined with OCP (Metabolic parameters), Outcome 6: Triglycerides (mmol/L)

Comparison 7: Adult ‐ OCP versus Metformin combined with OCP (Clinical parameters), Outcome 1: Hirsutism ‐ Clinical F‐G score

Comparison 7: Adult ‐ OCP versus Metformin combined with OCP (Clinical parameters), Outcome 2: Adverse events ‐ severe

Comparison 7: Adult ‐ OCP versus Metformin combined with OCP (Clinical parameters), Outcome 3: Adverse events ‐ minor

Comparison 7: Adult ‐ OCP versus Metformin combined with OCP (Clinical parameters), Outcome 4: Acne ‐ Clinical acne score

Comparison 7: Adult ‐ OCP versus Metformin combined with OCP (Clinical parameters), Outcome 5: Acne ‐ Subjective improvement

Comparison 7: Adult ‐ OCP versus Metformin combined with OCP (Clinical parameters), Outcome 6: Body weight (kg)

Comparison 7: Adult ‐ OCP versus Metformin combined with OCP (Clinical parameters), Outcome 7: Body Mass Index (kg/m2)

Comparison 7: Adult ‐ OCP versus Metformin combined with OCP (Clinical parameters), Outcome 8: Blood Pressure ‐ Systolic (mmHg)

Comparison 7: Adult ‐ OCP versus Metformin combined with OCP (Clinical parameters), Outcome 9: Blood Pressure ‐ Diastolic (mmHg)

Comparison 8: Adult ‐ OCP versus Metformin combined with OCP (Hormonal parameters), Outcome 1: Serum total testosterone (nmol/L)

Comparison 8: Adult ‐ OCP versus Metformin combined with OCP (Hormonal parameters), Outcome 2: Free androgen index (FAI) (%)

Comparison 9: Adult ‐ OCP versus Metformin combined with OCP (Metabolic parameters), Outcome 1: Fasting insulin (mIU/L)

Comparison 9: Adult ‐ OCP versus Metformin combined with OCP (Metabolic parameters), Outcome 2: Fasting glucose (mmol/L)

Comparison 9: Adult ‐ OCP versus Metformin combined with OCP (Metabolic parameters), Outcome 3: Total Cholesterol (mmol/L)

Comparison 9: Adult ‐ OCP versus Metformin combined with OCP (Metabolic parameters), Outcome 4: HDL Cholesterol (mmol/L)

Comparison 9: Adult ‐ OCP versus Metformin combined with OCP (Metabolic parameters), Outcome 5: LDL Cholesterol (mmol/L)

Comparison 9: Adult ‐ OCP versus Metformin combined with OCP (Metabolic parameters), Outcome 6: Triglycerides (mmol/L)

Comparison 10: Adolescent ‐ Metformin versus OCP (Clinical parameters), Outcome 1: Hirsutism ‐ Clinical F‐G score

Comparison 10: Adolescent ‐ Metformin versus OCP (Clinical parameters), Outcome 2: Hirsutism ‐ Subjective improvement

Comparison 10: Adolescent ‐ Metformin versus OCP (Clinical parameters), Outcome 3: Adverse event ‐ severe

Comparison 10: Adolescent ‐ Metformin versus OCP (Clinical parameters), Outcome 4: Adverse event ‐ minor

Comparison 10: Adolescent ‐ Metformin versus OCP (Clinical parameters), Outcome 5: Improved menstrual pattern (ie. an initiation of menses or cycle regularity)

Comparison 10: Adolescent ‐ Metformin versus OCP (Clinical parameters), Outcome 6: Body Weight (kg)

Comparison 10: Adolescent ‐ Metformin versus OCP (Clinical parameters), Outcome 7: Body Mass Index (kg/m2)

Comparison 10: Adolescent ‐ Metformin versus OCP (Clinical parameters), Outcome 8: Blood pressure ‐ systolic (mm Hg)

Comparison 10: Adolescent ‐ Metformin versus OCP (Clinical parameters), Outcome 9: Blood pressure ‐ diastolic (mm Hg)

Comparison 11: Adolescent ‐ Metformin versus OCP (Hormonal parameters), Outcome 1: Serum total testosterone (nmol/L)

Comparison 11: Adolescent ‐ Metformin versus OCP (Hormonal parameters), Outcome 2: Free androgen index (FAI) (%)

Comparison 12: Adolescent ‐ Metformin versus OCP (Metabolic parameters), Outcome 1: Fasting insulin (mIU/L)

Comparison 12: Adolescent ‐ Metformin versus OCP (Metabolic parameters), Outcome 2: Fasting glucose (mmol/L)

Comparison 12: Adolescent ‐ Metformin versus OCP (Metabolic parameters), Outcome 3: Total Cholesterol (mmol/L)

Comparison 12: Adolescent ‐ Metformin versus OCP (Metabolic parameters), Outcome 4: HDL Cholesterol (mmol/L)

Comparison 12: Adolescent ‐ Metformin versus OCP (Metabolic parameters), Outcome 5: LDL Cholesterol (mmol/L)

Comparison 12: Adolescent ‐ Metformin versus OCP (Metabolic parameters), Outcome 6: Triglycerides (mmol/L)

Comparison 13: Adolescent ‐ OCP versus Metformin combined with OCP (Clinical parameters), Outcome 1: Hirsutism ‐ Clinical F‐G score

Comparison 13: Adolescent ‐ OCP versus Metformin combined with OCP (Clinical parameters), Outcome 2: Adverse events ‐ severe

Comparison 13: Adolescent ‐ OCP versus Metformin combined with OCP (Clinical parameters), Outcome 3: Body Mass Index (kg/m2)

Comparison 13: Adolescent ‐ OCP versus Metformin combined with OCP (Clinical parameters), Outcome 4: Blood Pressure ‐ Systolic (mmHg)

Comparison 13: Adolescent ‐ OCP versus Metformin combined with OCP (Clinical parameters), Outcome 5: Blood Pressure ‐ Diastolic (mmHg)

Comparison 14: Adolescent ‐ OCP versus Metformin combined with OCP (Hormonal parameters), Outcome 1: Serum total testosterone (nmol/L)

Comparison 14: Adolescent ‐ OCP versus Metformin combined with OCP (Hormonal parameters), Outcome 2: Free androgen index (FAI) (%)

Comparison 15: Adolescent ‐ OCP versus Metformin combined with OCP (Metabolic parameters), Outcome 1: Fasting glucose (mmol/L)

Comparison 15: Adolescent ‐ OCP versus Metformin combined with OCP (Metabolic parameters), Outcome 2: Total Cholesterol (mmol/L)

Comparison 15: Adolescent ‐ OCP versus Metformin combined with OCP (Metabolic parameters), Outcome 3: HDL Cholesterol (mmol/L)

Comparison 15: Adolescent ‐ OCP versus Metformin combined with OCP (Metabolic parameters), Outcome 4: LDL Cholesterol (mmol/L)

Comparison 15: Adolescent ‐ OCP versus Metformin combined with OCP (Metabolic parameters), Outcome 5: Triglycerides (mmol/L)
| Metformin compared to OCP for hirsutism, acne, and menstrual pattern in adult women with PCOS | |||||||
| Patient or population: adult women with PCOS | |||||||
| Outcomes | Anticipated absolute effects* (95% CI) | Relative effect | № of participants | Quality of the evidence | Comments | ||
|---|---|---|---|---|---|---|---|
| Risk with OCP | Risk with metformin | ||||||
| Hirsutism ‐ Clinical F‐G score | BMI ≤ 25kg/m2 | The mean hirsutism ‐ Clinical F‐G score was 7.5 | MD 0.38 higher | ‐ | 134 | ⊕⊝⊝⊝ | |
| BMI > 25 kg/m2 < 30 kg/m2 | The mean hirsutism ‐ Clinical F‐G score was 6.44 | MD 1.92 higher | ‐ | 254 (5 RCTs) | ⊕⊕⊝⊝ LOW1,4 | ||
| BMI ≥ 30 kg/m2 | The mean hirsutism ‐ Clinical F‐G score was 6.05 | MD 0.38 lower | ‐ | 85 (2 RCTs) | ⊕⊕⊝⊝ LOW1,5 | ||
| Adverse events ‐ Severe | Gastro‐intestinal | 3 per 1 000 | 21 per 1 000 | OR 6.42 | 602 | ⊕⊕⊝⊝ | |
| Others | 122 per 1000 | 27 per 1000 (12 to 57) | OR 0.20 | 363 | ⊕⊕⊝⊝ | ||
| Adverse events ‐ Minor | Gastro‐intestinal | No trials reported on outcome "Adverse events ‐ Minor ‐ Gastro‐intestinal" | |||||
| Others | No trials reported on outcome "Adverse events ‐ Minor ‐ Others" | ||||||
| Improved menstrual pattern | Shortening of intermenstrual days | The mean improved menstrual pattern (ie. shortening of intermenstrual days) was 32.4 | MD 6.05 higher | ‐ | 153 | ⊕⊕⊝⊝⊝ | |
| An initiation of menses or cycle regularity) ‐ ≤ | 1000 per 1 000 | 1000 per 1 000 | OR 0.07 | 17 | ⊕⊕⊝⊝ | ||
| An initiation of menses or cycle regularity)‐ BMI > 25 kg/m2 < 30 kg/m2 | 931 per 1000 | 669 per 1000 (486 to 817) | OR 0.15 (0.07 to 0.33) | 129 (3 RCTs) | ⊕⊝⊝⊝ VERY LOW 7,8,9 | ||
| An initiation of menses or cycle regularity) ‐ BMI ≥ 30 kg/m2 | 1000 per 1 000 | 1000 per 1 000 | OR 0.09 (0.01 to 1.62) | 18 (1 RCT) | ⊕⊝⊝⊝ | ||
| An initiation of menses or cycle regularity) ‐ BMI not stated | 500 per 1000 | 661 per 1000 (281 to 906) | OR 1.95 (0.39 to 9.65) | 25 (1 RCT) | ⊕⊝⊝⊝ VERY LOW 8,10 | ||
| Acne ‐ Visual analogue scale | The mean acne ‐ Visual analogue scale was 1 | MD 0.90 higher | ‐ | 34 | ⊕⊕⊝⊝ | ||
| BMI (kg/m2) | BMI ≤ 25 kg/m2 | The mean BMI (kg/m2) was 22.7 | MD 0.59 lower | ‐ | 451 | ⊕⊝⊝⊝ VERY LOW 1,12,13 | |
| BMI > 25 kg/m2 < 30 kg/m2 | The mean BMI (kg/m2) was 27.4 | MD 0.11 higher | ‐ | 353 (8 RCTs) | ⊕⊝⊝⊝ VERY LOW 1,14,15 | ||
| BMI ≥ 30 kg/m2 | The mean BMI (kg/m2) was 35.1 | MD 2.31 lower | ‐ | 119 (3 RCTs) | ⊕⊝⊝⊝ VERY LOW 1, 15,16 | ||
| *The risk in the intervention group (and its 95% confidence interval) is based on the assumed risk in the comparison group and the relative effect of the intervention (and its 95% CI). | |||||||
| GRADE Working Group grades of evidence | |||||||
| 1 Evidence downgraded by one level for serious risk of bias ‐ the majority of the RCTs have unclear or high risk of bias 3 Evidence downgraded by one level for serious imprecision – 95% CI includes both appreciable effect and little or no effect and low number of participants (total number of participants < 400) 4 Evidence downgraded by one level for serious imprecision – low number of participants (total number of participants < 400) 5 Evidence downgraded by one level for serious imprecision ‐ low number of participants (total number of participants < 400) and 95% CI includes both appreciable benefit and harm 6 Evidence downgraded by one level for serious risk of bias ‐ the majority of the RCTs have unclear risk of bias 7 Evidence downgraded by one level for serious imprecision – low number of events (total number of events < 300) 8 Evidence downgraded by one level for serious risk of bias ‐ the majority of the RCTs have high risk of bias 9 Evidence downgraded by one level for serious inconsistency (I2 = 51%) as unexplained heterogeneity (i.e. heterogeneity not explained by subgrouping of data according to mean study BMI) 10 Evidence downgraded by two levels for very serious imprecision – 95% CI includes both appreciable benefit and harm or no effect and very low number of events (total number of events < 300) 11 Evidence downgraded by two levels for serious imprecision – 95% CI includes both appreciable benefit and harm or no effect and low number of participants (total number of participants < 400) 12 Evidence downgraded by one level for serious inconsistency (I2 = 76%) as unexplained heterogeneity (i.e. heterogeneity not explained by subgrouping of data according to mean study BMI) 13 Evidence downgraded by one level for serious imprecision – 95% CI includes both appreciable effect and little or no effect 14 Evidence downgraded by one level for serious inconsistency (I2 = 72%) as unexplained heterogeneity (i.e. heterogeneity not explained by subgrouping of data according to mean study BMI) 15 Evidence downgraded by one level for serious imprecision ‐ low number of participants (total number of participants < 400) and 95% CI includes both appreciable effect and little or no effect 16 Evidence downgraded by one level for serious inconsistency (I2 = 52%) as unexplained heterogeneity (i.e. heterogeneity not explained by subgrouping of data according to mean study BMI) | |||||||
| Metformin compared to metformin combined with OCP for hirsutism, acne, and menstrual pattern in adult women with PCOS | |||||||
| Patient or population: adult women with PCOS | |||||||
| Outcomes | Anticipated absolute effects* (95% CI) | Relative effect | № of participants | Quality of the evidence | Comments | ||
|---|---|---|---|---|---|---|---|
| Risk with Metformin combined with OCP | Risk with metformin | ||||||
| Hirsutism ‐ Clinical F‐G score | The mean hirsutism ‐ Clinical F‐G score was 5.6 | MD 1.36 higher | ‐ | 135 | ⊕⊕⊝⊝ | ||
| Adverse events ‐ Severe | Gastro‐intestinal | 74 per 1 000 | 56 per 1 000 | OR 0.74 | 171 | ⊕⊕⊝⊝ | |
| Others | 60 per 1 000 | 35 per 1 000 | OR 0.56 | 109 | ⊕⊕⊝⊝ | ||
| Adverse events ‐ Minor | Gastro‐intestinal | No trials reported on outcome "Adverse events ‐ Minor ‐ Gastro‐intestinal" | |||||
| Others | No trials reported on outcome "Adverse events ‐ Minor ‐ Others" | ||||||
| Improved menstrual pattern | Shortening of intermenstrual days | No trials reported on outcome "Improved menstrual pattern (i.e. shortening of intermenstrual days)" | |||||
| An initiation of menses or cycle regularity | No trials reported on outcome "Improved menstrual pattern (i.e. an initiation of menses or cycle regularity)" | ||||||
| Acne ‐ Visual analogue scale/Clinical acne score | No trials reported either on outcome "Acne ‐ Visual analogue scale" or "Acne ‐ Clinical acne score" | ||||||
| BMI (kg/m2) | The mean Body Mass Index (kg/m2) was 25.49 | MD 1.47 lower | ‐ | 199 | ⊕⊕⊝⊝ | ||
| *The risk in the intervention group (and its 95% confidence interval) is based on the assumed risk in the comparison group and the relative effect of the intervention (and its 95% CI). | |||||||
| GRADE Working Group grades of evidence | |||||||
| 1 Evidence downgraded by one level for serious risk of bias ‐ the majority of the RCTs have unclear risk of bias | |||||||
| OCP compared to Metformin combined with OCP for hirsutism, acne, and menstrual pattern in adult women with polycystic ovary syndrome | |||||||
| Patient or population:aAdult women with PCOS | |||||||
| Outcomes | Anticipated absolute effects* (95% CI) | Relative effect | № of participants | Quality of the evidence | Comments | ||
|---|---|---|---|---|---|---|---|
| Risk with metformin combined with OCP | Risk with OCP | ||||||
| Hirsutism ‐ Clinical F‐G score | The mean hirsutism ‐ Clinical F‐G score was 5.57 | MD 0.54 higher | ‐ | 389 | ⊕⊕⊝⊝ | ||
| Adverse events ‐ Severe | Gastro‐intestinal | 98 per 1000 | 21 per 1000 | OR 0.20 | 228 | ⊕⊕⊝⊝ | |
| Others | 39 per 1000 | 61 per 1000 | OR 1.61 | 159 | ⊕⊕⊝⊝ | ||
| Adverse events ‐ Minor | Gastro‐intestinal | 260 per 1000 | 21 per 1000 | OR 0.06 | 98 | ⊕⊕⊝⊝ | |
| Others | No trials reported on outcome "Adverse events ‐ Minor ‐ Others" | ||||||
| Improved menstrual pattern | Shortening of inter menstrual days | No trials reported on outcome "Improved menstrual pattern (i.e. shortening of inter menstrual days)" | |||||
| An initiation of menses or cycle regularity | No trials reported on outcome "Improved menstrual pattern (i.e. an initiation of menses or cycle regularity)" | ||||||
| Acne ‐ Clinical acne score | The mean acne ‐ Clinical acne score was 0.54 | MD 0.09 lower | ‐ | 82 | ⊕⊕⊝⊝ | ||
| BMI (kg/m2) | The mean BMI (kg/m2) was 28.6 | MD 0.21 lower | ‐ | 661 | ⊕⊝⊝⊝ | ||
| *The risk in the intervention group (and its 95% confidence interval) is based on the assumed risk in the comparison group and the relative effect of the intervention (and its 95% CI). | |||||||
| GRADE Working Group grades of evidence | |||||||
| 1 Evidence downgraded by one level for serious risk of bias ‐ the majority of the RCTs have unclear risk of bias 9 Evidence downgraded by one level for serious imprecision ‐ 95% CI includes both appreciable effect and little or no effect | |||||||
| Metformin compared to OCP for hirsutism, acne, and menstrual pattern in adolescent women with PCOS | |||||||
| Patient or population: adolescent women with PCOS | |||||||
| Outcomes | Anticipated absolute effects* (95% CI) | Relative effect | № of participants | Quality of the evidence | Comments | ||
|---|---|---|---|---|---|---|---|
| Risk with OCP | Risk with metformin | ||||||
| Hirsutism ‐ Clinical F‐G score | The mean hirsutism ‐ Clinical F‐G score was 8.6 | MD 0.40 lower | ‐ | 16 | ⊕⊝⊝⊝ | ||
| Adverse event ‐ Severe | Gastro‐intestinal | No trials reported on outcome "Adverse event ‐ Severe ‐ Gastro‐intestinal" | |||||
| Others | 150 per 1 000 | 100 per 1 000 | OR 0.63 | 80 | ⊕⊝⊝⊝ | ||
| Adverse event ‐ Minor | Gastro‐intestinal | 0 per 1 000 | 3 per 1 000 | OR 11.67 | 22 | ⊕⊝⊝⊝ | There were only 3 events in the arm metformin and 0 in the arm OCP |
| Others | No trials reported on outcome "Adverse event ‐ Minor ‐ Others" | ||||||
| Improved menstrual pattern | Shortening of inter menstrual days | No trials reported on outcome "Improved menstrual pattern (i.e. shortening of inter menstrual days)" | |||||
| An initiation of menses or cycle regularity | 1 000 per 1 000 | 1000 per 1 000 | OR 0.10 | 80 | ⊕⊝⊝⊝ | 40 out of 40 participants had improved menstrual patter in the OCP group compared to 36 out of 40 in the metformin group | |
| Acne ‐ Visual analogue scale or Clinical acne score | No trials reported either on outcome "Acne ‐ Visual analogue scale" or "Acne ‐ Clinical acne score" | ||||||
| BMI (kg/m2) | The mean BMI (kg/m2) was 36 | MD 1.45 lower higher) | ‐ | 69 | ⊕⊝⊝⊝ | ||
| *The risk in the intervention group (and its 95% confidence interval) is based on the assumed risk in the comparison group and the relative effect of the intervention (and its 95% CI). | |||||||
| GRADE Working Group grades of evidence | |||||||
| 1 Evidence downgraded by one level for serious risk of bias – a single RCT which has unclear risk of bias | |||||||
| Metformin compared to metformin combined with OCP for hirsutism, acne and menstrual pattern in adolescent women with PCOS | |||||||
| Patient or population: adolescent women with PCOS | |||||||
| Outcomes | Anticipated absolute effects* (95% CI) | Relative effect | No of participants | Quality of the evidence | Comments | ||
|---|---|---|---|---|---|---|---|
| Risk with metformin combined with OCP | Risk with metformin | ||||||
| Hirsutism ‐ Clinical F‐G score | No trials reported on outcome "Hirsutism ‐ Clinical F‐G score" | ||||||
| Adverse event ‐ Severe | Gastro‐intestinal | No trials reported on outcome "Adverse event ‐ Severe ‐ Gastro‐intestinal" | |||||
| Others | No trials reported on outcome "Adverse event ‐ Severe ‐ Others" | ||||||
| Adverse event ‐ Minor | Gastro‐intestinal | No trials reported on outcome "Adverse event ‐ Minor ‐ Gastro‐intestinal" | |||||
| Others | No trials reported on outcome "Adverse event ‐ Minor ‐ Others" | ||||||
| Improved menstrual pattern | Shortening of inter menstrual day | No trials reported on outcome "Improved menstrual pattern (i.e. shortening of intermenstrual days)" | |||||
| An initiation of menses or cycle regularity | No trials reported on outcome "Improved menstrual pattern (i.e. an initiation of menses or cycle regularity)" | ||||||
| Acne ‐ Visual analogue scale or Clinical acne score | No trials reported either on outcome "Acne ‐ Visual analogue scale" or "Acne ‐ Clinical acne score" | ||||||
| BMI (kg/m2) | No trials reported on outcome "BMI" | ||||||
| *The risk in the intervention group (and its 95% confidence interval) is based on the assumed risk in the comparison group and the relative effect of the intervention (and its 95% CI). | |||||||
| GRADE Working Group grades of evidence | |||||||
| OCP compared to metformin combined with OCP for hirsutism, acne, and menstrual pattern in adolescent women with PCOS | |||||||
| Patient or population: adolescent women with PCOS | |||||||
| Outcomes | Anticipated absolute effects* (95% CI) | Relative effect | № of participants | Quality of the evidence | Comments | ||
|---|---|---|---|---|---|---|---|
| Risk with metformin combined with OCP | Risk with OCP | ||||||
| Hirsutism ‐ Clinical F‐G score | The mean hirsutism ‐ Clinical F‐G score was 6.2 | MD 0.80 higher | ‐ | 32 | ⊕⊝⊝⊝ | ||
| Adverse events ‐ Severe | Gastro‐intestinal | 56 per 1 000 | 56 per 1 000 | OR 1.00 | 36 | ⊕⊝⊝⊝ | |
| Others | No trials reported on outcome "Adverse events ‐ Severe ‐ Others" | ||||||
| Adverse events ‐ Minor | Gastro‐intestinal | No trials reported on outcome "Adverse events ‐ Minor ‐ Gastro‐intestinal" | |||||
| Others | No trials reported on outcome "Adverse events ‐ Minor ‐ Others" | ||||||
| Improved menstrual pattern | Shortening of intermenstrual days | No trials reported on outcome "Improved menstrual pattern (i.e. shortening of intermenstrual days)" | |||||
| An initiation of menses or cycle regularity | No trials reported on outcome "Improved menstrual pattern (i.e. an initiation of menses or cycle regularity)" | ||||||
| Acne ‐ Visual analogue scale or Clinical acne score | No trials reported either on outcome "Acne ‐ Visual analogue scale" or "Acne ‐ Clinical acne score" | ||||||
| BMI (kg/m2) | The mean BMI (kg/m2) was 32.4 | MD 1.5 higher | ‐ | 32 | ⊕⊝⊝⊝ | ||
| *The risk in the intervention group (and its 95% confidence interval) is based on the assumed risk in the comparison group and the relative effect of the intervention (and its 95% CI). | |||||||
| GRADE Working Group grades of evidence | |||||||
| 1 Evidence downgraded by one level for serious risk of bias – a single RCT which has unclear risk of bias | |||||||
| Convert from | Convert to | Conversion factor | |
|---|---|---|---|
| Androstenedione | ng/mL | nmol/L | 3.49 |
| Cholesterol | mg/dL | mmol/L | 0.026 |
| Confidence intervals | Confidence intervals | Standard error | (upper limit ‐ lower limit)/3.92 |
| Glucose | mg/dL | mmol/L | 0.056 |
| Insulin | pmol/L | mIU/L (= microIU/mL) | 0.1667 |
| Sex hormone‐binding globulin | mcg/dL | nmol/L | 34.7 |
| Standard deviation | Standard error | Standard deviation | Sqrt n |
| Testosterone | pg/mL | pmol/L | 3.47 |
| Triglycerides | mg/dL | mmol/L | 0.011 |
| Outcome or subgroup title | No. of studies | No. of participants | Statistical method | Effect size |
| 1.1 Hirsutism ‐ Clinical F‐G score Show forest plot | 10 | 473 | Mean Difference (IV, Fixed, 95% CI) | 1.08 [0.57, 1.59] |
| 1.1.1 BMI ≤ 25 kg/m2 | 3 | 134 | Mean Difference (IV, Fixed, 95% CI) | 0.38 [‐0.44, 1.19] |
| 1.1.2 BMI > 25 kg/m2 < 30 kg/m2 | 5 | 254 | Mean Difference (IV, Fixed, 95% CI) | 1.92 [1.21, 2.64] |
| 1.1.3 BMI ≥ 30 kg/m2 | 2 | 85 | Mean Difference (IV, Fixed, 95% CI) | ‐0.38 [‐1.93, 1.17] |
| 1.2 Hirsutism ‐ Subjective visual analogue scale Show forest plot | 1 | Mean Difference (IV, Fixed, 95% CI) | Totals not selected | |
| 1.2.1 BMI ≥ 30 kg/m2 | 1 | Mean Difference (IV, Fixed, 95% CI) | Totals not selected | |
| 1.3 Hirsutism ‐ Subjective improvement Show forest plot | 1 | Odds Ratio (M‐H, Fixed, 95% CI) | Totals not selected | |
| 1.3.1 Mean BMI not stated | 1 | Odds Ratio (M‐H, Fixed, 95% CI) | Totals not selected | |
| 1.4 Adverse events ‐ severe Show forest plot | 12 | Peto Odds Ratio (Peto, Fixed, 95% CI) | Subtotals only | |
| 1.4.1 Gastro‐intestinal | 11 | 602 | Peto Odds Ratio (Peto, Fixed, 95% CI) | 6.42 [2.98, 13.84] |
| 1.4.2 Others | 8 | 363 | Peto Odds Ratio (Peto, Fixed, 95% CI) | 0.20 [0.09, 0.44] |
| 1.5 Improved menstrual pattern (ie. shortening of intermenstrual days) Show forest plot | 2 | 153 | Mean Difference (IV, Fixed, 95% CI) | 6.05 [2.37, 9.74] |
| 1.5.1 BMI > 25 kg/m2< 30 kg/m2 | 1 | 86 | Mean Difference (IV, Fixed, 95% CI) | 6.10 [2.40, 9.80] |
| 1.5.2 BMI ≥ 30 kg/m2 | 1 | 67 | Mean Difference (IV, Fixed, 95% CI) | ‐3.10 [‐55.47, 49.27] |
| 1.6 Improved menstrual pattern (ie. an initiation of menses or cycle regularity) Show forest plot | 6 | 189 | Peto Odds Ratio (Peto, Fixed, 95% CI) | 0.21 [0.11, 0.40] |
| 1.6.1 BMI ≤ 25 kg/m2 | 1 | 17 | Peto Odds Ratio (Peto, Fixed, 95% CI) | 0.07 [0.01, 0.65] |
| 1.6.2 BMI > 25 kg/m2 < 30 kg/m2 | 3 | 129 | Peto Odds Ratio (Peto, Fixed, 95% CI) | 0.15 [0.07, 0.33] |
| 1.6.3 BMI ≥ 30 kg/m2 | 1 | 18 | Peto Odds Ratio (Peto, Fixed, 95% CI) | 0.09 [0.01, 1.62] |
| 1.6.4 Mean BMI not stated | 1 | 25 | Peto Odds Ratio (Peto, Fixed, 95% CI) | 1.95 [0.39, 9.65] |
| 1.7 Acne ‐ Visual analogue scale Show forest plot | 1 | Mean Difference (IV, Fixed, 95% CI) | Totals not selected | |
| 1.7.1 BMI ≥ 30 kg/m2 | 1 | Mean Difference (IV, Fixed, 95% CI) | Totals not selected | |
| 1.8 Acne ‐ Subjective improvement Show forest plot | 3 | 131 | Odds Ratio (M‐H, Fixed, 95% CI) | 0.30 [0.11, 0.79] |
| 1.8.1 BMI ≤ 25 kg/m2 | 1 | 80 | Odds Ratio (M‐H, Fixed, 95% CI) | 0.67 [0.16, 2.91] |
| 1.8.2 BMI > 25 kg/m2 < 30 kg/m2 | 1 | 26 | Odds Ratio (M‐H, Fixed, 95% CI) | 0.21 [0.03, 1.50] |
| 1.8.3 Mean BMI not stated | 1 | 25 | Odds Ratio (M‐H, Fixed, 95% CI) | 0.10 [0.01, 0.72] |
| 1.9 Diagnosis of Type II diabetes mellitus Show forest plot | 1 | Peto Odds Ratio (Peto, Fixed, 95% CI) | Totals not selected | |
| 1.9.1 BMI ≥ 30 kg/m2 | 1 | Peto Odds Ratio (Peto, Fixed, 95% CI) | Totals not selected | |
| 1.10 Body weight (kg) Show forest plot | 7 | 358 | Mean Difference (IV, Fixed, 95% CI) | ‐0.93 [‐2.93, 1.08] |
| 1.10.1 BMI ≤ 25 kg/m2 | 3 | 168 | Mean Difference (IV, Fixed, 95% CI) | 4.02 [‐0.22, 8.25] |
| 1.10.2 BMI > 25 kg/m2 < 30 kg/m2 | 3 | 134 | Mean Difference (IV, Fixed, 95% CI) | ‐1.96 [‐6.32, 2.41] |
| 1.10.3 BMI ≥ 30 kg/m2 | 1 | 56 | Mean Difference (IV, Fixed, 95% CI) | ‐2.50 [‐5.16, 0.16] |
| 1.11 Body Mass Index (kg/m2) Show forest plot | 19 | 923 | Mean Difference (IV, Fixed, 95% CI) | ‐0.40 [‐0.74, ‐0.06] |
| 1.11.1 BMI ≤ 25kg/m2 | 9 | 451 | Mean Difference (IV, Fixed, 95% CI) | ‐0.59 [‐1.02, ‐0.17] |
| 1.11.2 BMI > 25kg/m2< 30kg/m2 | 8 | 353 | Mean Difference (IV, Fixed, 95% CI) | 0.11 [‐0.48, 0.70] |
| 1.11.3 BMI ≥ 30 kg/m2 | 3 | 119 | Mean Difference (IV, Fixed, 95% CI) | ‐2.31 [‐4.40, ‐0.21] |
| 1.12 Blood pressure ‐ systolic (mm Hg) Show forest plot | 5 | 209 | Mean Difference (IV, Fixed, 95% CI) | ‐4.81 [‐8.55, ‐1.06] |
| 1.12.1 BMI > 25 kg/m2< 30 kg/m2 | 3 | 108 | Mean Difference (IV, Fixed, 95% CI) | ‐5.48 [‐9.56, ‐1.41] |
| 1.12.2 BMI ≥ 30 kg/m2 | 2 | 101 | Mean Difference (IV, Fixed, 95% CI) | ‐1.11 [‐10.62, 8.41] |
| 1.13 Blood pressure ‐ diastolic (mm Hg) Show forest plot | 4 | 142 | Mean Difference (IV, Fixed, 95% CI) | ‐1.98 [‐4.72, 0.76] |
| 1.13.1 BMI > 25 kg/m2< 30 kg/m2 | 3 | 108 | Mean Difference (IV, Fixed, 95% CI) | ‐4.25 [‐7.30, ‐1.20] |
| 1.13.2 BMI ≥ 30 kg/m2 | 1 | 34 | Mean Difference (IV, Fixed, 95% CI) | 7.50 [1.27, 13.73] |
| Outcome or subgroup title | No. of studies | No. of participants | Statistical method | Effect size |
| 2.1 Serum total testosterone (nmol/L) Show forest plot | 17 | 818 | Mean Difference (IV, Fixed, 95% CI) | 0.39 [0.32, 0.47] |
| 2.1.1 BMI ≤ 25 kg/m2 | 9 | 454 | Mean Difference (IV, Fixed, 95% CI) | 0.48 [0.38, 0.57] |
| 2.1.2 BMI > 25 kg/m2< 30 kg/m2 | 4 | 220 | Mean Difference (IV, Fixed, 95% CI) | 0.21 [0.07, 0.35] |
| 2.1.3 BMI ≥ 30 kg/m2 | 3 | 119 | Mean Difference (IV, Fixed, 95% CI) | 0.42 [0.11, 0.74] |
| 2.1.4 Mean BMI not stated | 1 | 25 | Mean Difference (IV, Fixed, 95% CI) | ‐0.69 [‐2.02, 0.64] |
| 2.2 Free androgen index (FAI) (%) Show forest plot | 10 | 433 | Mean Difference (IV, Fixed, 95% CI) | 3.95 [3.32, 4.58] |
| 2.2.1 BMI ≤ 25 kg/m2 | 4 | 204 | Mean Difference (IV, Fixed, 95% CI) | 4.48 [3.56, 5.40] |
| 2.2.2 BMI > 25 kg/m2< 30 kg/m2 | 3 | 110 | Mean Difference (IV, Fixed, 95% CI) | 3.06 [2.14, 3.97] |
| 2.2.3 BMI ≥ 30 kg/m2 | 3 | 119 | Mean Difference (IV, Fixed, 95% CI) | 7.12 [4.46, 9.79] |
| Outcome or subgroup title | No. of studies | No. of participants | Statistical method | Effect size |
| 3.1 Fasting insulin (mIU/L) Show forest plot | 12 | 474 | Mean Difference (IV, Fixed, 95% CI) | ‐3.85 [‐4.73, ‐2.97] |
| 3.1.1 BMI ≤ 25 kg/m2 | 3 | 86 | Mean Difference (IV, Fixed, 95% CI) | ‐3.91 [‐5.40, ‐2.42] |
| 3.1.2 BMI > 25 kg/m2< 30 kg/m2 | 5 | 244 | Mean Difference (IV, Fixed, 95% CI) | ‐4.08 [‐5.25, ‐2.91] |
| 3.1.3 BMI ≥ 30 kg/m2 | 3 | 119 | Mean Difference (IV, Fixed, 95% CI) | ‐5.00 [‐8.48, ‐1.53] |
| 3.1.4 Mean BMI not stated | 1 | 25 | Mean Difference (IV, Fixed, 95% CI) | 3.35 [‐1.64, 8.34] |
| 3.2 Fasting glucose (mmol/L) Show forest plot | 12 | 519 | Mean Difference (IV, Fixed, 95% CI) | ‐0.15 [‐0.22, ‐0.07] |
| 3.2.1 BMI ≤ 25 kg/m2 | 5 | 191 | Mean Difference (IV, Fixed, 95% CI) | ‐0.09 [‐0.23, 0.06] |
| 3.2.2 BMI > 25 kg/m2< 30 kg/m2 | 4 | 220 | Mean Difference (IV, Fixed, 95% CI) | ‐0.21 [‐0.31, ‐0.10] |
| 3.2.3 BMI ≥ 30 kg/m2 | 3 | 108 | Mean Difference (IV, Fixed, 95% CI) | 0.00 [‐0.22, 0.22] |
| 3.3 Total Cholesterol (mmol/L) Show forest plot | 13 | 610 | Mean Difference (IV, Fixed, 95% CI) | ‐0.28 [‐0.40, ‐0.16] |
| 3.3.1 BMI ≤ 25 kg/m2 | 4 | 206 | Mean Difference (IV, Fixed, 95% CI) | ‐0.77 [‐1.00, ‐0.53] |
| 3.3.2 BMI > 25 kg/m2< 30 kg/m2 | 7 | 303 | Mean Difference (IV, Fixed, 95% CI) | ‐0.14 [‐0.30, 0.01] |
| 3.3.3 BMI ≥ 30 kg/m2 | 2 | 101 | Mean Difference (IV, Fixed, 95% CI) | ‐0.02 [‐0.32, 0.28] |
| 3.4 HDL Cholesterol (mmol/L) Show forest plot | 13 | 610 | Mean Difference (IV, Fixed, 95% CI) | 0.02 [‐0.01, 0.06] |
| 3.4.1 BMI ≤ 25 kg/m2 | 4 | 206 | Mean Difference (IV, Fixed, 95% CI) | ‐0.02 [‐0.10, 0.07] |
| 3.4.2 BMI > 25 kg/m2< 30 kg/m2 | 7 | 303 | Mean Difference (IV, Fixed, 95% CI) | 0.02 [‐0.02, 0.06] |
| 3.4.3 BMI ≥ 30 kg/m2 | 2 | 101 | Mean Difference (IV, Fixed, 95% CI) | 0.20 [0.05, 0.35] |
| 3.5 LDL Cholesterol (mmol/L) Show forest plot | 13 | 610 | Mean Difference (IV, Fixed, 95% CI) | ‐0.05 [‐0.12, 0.02] |
| 3.5.1 BMI ≤ 25 kg/m2 | 4 | 206 | Mean Difference (IV, Fixed, 95% CI) | ‐0.39 [‐0.54, ‐0.23] |
| 3.5.2 BMI > 25 kg/m2< 30 kg/m2 | 7 | 303 | Mean Difference (IV, Fixed, 95% CI) | 0.02 [‐0.06, 0.10] |
| 3.5.3 BMI ≥ 30 kg/m2 | 2 | 101 | Mean Difference (IV, Fixed, 95% CI) | 0.35 [0.02, 0.67] |
| 3.6 Triglycerides (mmol/L) Show forest plot | 13 | 610 | Mean Difference (IV, Fixed, 95% CI) | ‐0.07 [‐0.12, ‐0.02] |
| 3.6.1 BMI ≤ 25 kg/m2 | 4 | 206 | Mean Difference (IV, Fixed, 95% CI) | ‐0.45 [‐0.61, ‐0.30] |
| 3.6.2 BMI > 25 kg/m2< 30 kg/m2 | 7 | 303 | Mean Difference (IV, Fixed, 95% CI) | ‐0.01 [‐0.07, 0.05] |
| 3.6.3 BMI ≥ 30 kg/m2 | 2 | 101 | Mean Difference (IV, Fixed, 95% CI) | ‐0.31 [‐0.64, 0.01] |
| Outcome or subgroup title | No. of studies | No. of participants | Statistical method | Effect size |
| 4.1 Hirsutism ‐ Clinical F‐G score Show forest plot | 3 | 135 | Mean Difference (IV, Fixed, 95% CI) | 1.36 [0.62, 2.11] |
| 4.1.1 BMI ≤ 25 kg/m2 | 1 | 34 | Mean Difference (IV, Fixed, 95% CI) | 1.07 [0.21, 1.93] |
| 4.1.2 BMI > 25k g/m2 < 30 kg/m2 | 2 | 101 | Mean Difference (IV, Fixed, 95% CI) | 2.24 [0.75, 3.74] |
| 4.2 Adverse events ‐severe Show forest plot | 3 | Odds Ratio (M‐H, Fixed, 95% CI) | Subtotals only | |
| 4.2.1 Gastro‐intestinal | 3 | 171 | Odds Ratio (M‐H, Fixed, 95% CI) | 0.74 [0.21, 2.53] |
| 4.2.2 Others | 2 | 109 | Odds Ratio (M‐H, Fixed, 95% CI) | 0.56 [0.11, 2.82] |
| 4.3 Body weight (kg) Show forest plot | 2 | 101 | Mean Difference (IV, Fixed, 95% CI) | ‐5.39 [‐10.70, ‐0.08] |
| 4.3.1 BMI > 25 kg/m2 < 30 kg/m2 | 2 | 101 | Mean Difference (IV, Fixed, 95% CI) | ‐5.39 [‐10.70, ‐0.08] |
| 4.4 Body Mass Index (kg/m2) Show forest plot | 5 | 199 | Mean Difference (IV, Fixed, 95% CI) | ‐1.47 [‐2.27, ‐0.66] |
| 4.4.1 BMI ≤ 25 kg/m2 | 2 | 74 | Mean Difference (IV, Fixed, 95% CI) | ‐1.50 [‐2.44, ‐0.55] |
| 4.4.2 BMI > 25 kg/m2 < 30 kg/m2 | 3 | 125 | Mean Difference (IV, Fixed, 95% CI) | ‐1.38 [‐2.94, 0.17] |
| 4.5 Blood pressure ‐ systolic (mm Hg) Show forest plot | 1 | Mean Difference (IV, Fixed, 95% CI) | Totals not selected | |
| 4.5.1 BMI > 25 kg/m2 < 30 kg/m2 | 1 | Mean Difference (IV, Fixed, 95% CI) | Totals not selected | |
| 4.6 Blood pressure ‐ diastolic (mm Hg) Show forest plot | 1 | Mean Difference (IV, Fixed, 95% CI) | Totals not selected | |
| 4.6.1 BMI > 25 kg/m2 < 30 kg/m2 | 1 | Mean Difference (IV, Fixed, 95% CI) | Totals not selected | |
| Outcome or subgroup title | No. of studies | No. of participants | Statistical method | Effect size |
| 5.1 Serum total testosterone (nmol/L) Show forest plot | 5 | 226 | Mean Difference (IV, Fixed, 95% CI) | 0.36 [0.22, 0.49] |
| 5.1.1 BMI ≤ 25 kg/m2 | 2 | 74 | Mean Difference (IV, Fixed, 95% CI) | 0.09 [‐0.08, 0.26] |
| 5.1.2 BMI > 25 kg/m2 < 30 kg/m2 | 3 | 152 | Mean Difference (IV, Fixed, 95% CI) | 0.79 [0.57, 1.00] |
| 5.2 FAI (%) Show forest plot | 3 | 133 | Mean Difference (IV, Fixed, 95% CI) | 2.84 [2.08, 3.59] |
| 5.2.1 BMI ≤ 25 kg/m2 | 1 | 40 | Mean Difference (IV, Fixed, 95% CI) | 0.35 [‐1.09, 1.79] |
| 5.2.2 BMI > 25 kg/m2 < 30 kg/m2 | 2 | 93 | Mean Difference (IV, Fixed, 95% CI) | 3.80 [2.91, 4.69] |
| Outcome or subgroup title | No. of studies | No. of participants | Statistical method | Effect size |
| 6.1 Fasting insulin (mIU/L) Show forest plot | 5 | 199 | Mean Difference (IV, Fixed, 95% CI) | ‐1.32 [‐2.63, ‐0.01] |
| 6.1.1 BMI ≤ 25 kg/m2 | 2 | 74 | Mean Difference (IV, Fixed, 95% CI) | ‐1.58 [‐3.47, 0.32] |
| 6.1.2 BMI > 25 kg/m2 < 30 kg/m2 | 3 | 125 | Mean Difference (IV, Fixed, 95% CI) | ‐1.09 [‐2.91, 0.72] |
| 6.2 Fasting glucose (mmol/L) Show forest plot | 4 | 170 | Mean Difference (IV, Fixed, 95% CI) | ‐0.21 [‐0.37, ‐0.06] |
| 6.2.1 BMI ≤ 25 kg/m2 | 1 | 40 | Mean Difference (IV, Fixed, 95% CI) | ‐0.25 [‐0.54, 0.04] |
| 6.2.2 BMI > 25 kg/m2 < 30 kg/m2 | 3 | 130 | Mean Difference (IV, Fixed, 95% CI) | ‐0.20 [‐0.38, ‐0.01] |
| 6.3 Total Cholesterol (mmol/L) Show forest plot | 5 | 216 | Mean Difference (IV, Random, 95% CI) | ‐0.54 [‐0.97, ‐0.11] |
| 6.3.1 BMI ≤ 25 kg/m2 | 1 | 40 | Mean Difference (IV, Random, 95% CI) | ‐0.65 [‐1.56, 0.26] |
| 6.3.2 BMI > 25 kg/m2 < 30 kg/m2 | 4 | 176 | Mean Difference (IV, Random, 95% CI) | ‐0.52 [‐1.02, ‐0.02] |
| 6.4 HDL Cholesterol (mmol/L) Show forest plot | 5 | 216 | Mean Difference (IV, Fixed, 95% CI) | 0.01 [‐0.08, 0.09] |
| 6.4.1 BMI ≤ 25 kg/m2 | 1 | 40 | Mean Difference (IV, Fixed, 95% CI) | ‐0.64 [‐0.99, ‐0.29] |
| 6.4.2 BMI > 25 kg/m2 < 30 kg/m2 | 4 | 176 | Mean Difference (IV, Fixed, 95% CI) | 0.05 [‐0.04, 0.14] |
| 6.5 LDL Cholesterol (mmol/L) Show forest plot | 4 | 176 | Mean Difference (IV, Fixed, 95% CI) | ‐0.13 [‐0.32, 0.06] |
| 6.5.1 BMI > 25 kg/m2 < 30 kg/m2 | 4 | 176 | Mean Difference (IV, Fixed, 95% CI) | ‐0.13 [‐0.32, 0.06] |
| 6.6 Triglycerides (mmol/L) Show forest plot | 5 | 216 | Mean Difference (IV, Fixed, 95% CI) | ‐0.22 [‐0.37, ‐0.07] |
| 6.6.1 BMI ≤ 25 kg/m2 | 1 | 40 | Mean Difference (IV, Fixed, 95% CI) | ‐0.69 [‐1.14, ‐0.24] |
| 6.6.2 BMI > 25 kg/m2 < 30 kg/m2 | 4 | 176 | Mean Difference (IV, Fixed, 95% CI) | ‐0.17 [‐0.32, ‐0.01] |
| Outcome or subgroup title | No. of studies | No. of participants | Statistical method | Effect size |
| 7.1 Hirsutism ‐ Clinical F‐G score Show forest plot | 6 | 389 | Mean Difference (IV, Fixed, 95% CI) | 0.54 [0.20, 0.89] |
| 7.1.1 BMI ≤ 25 kg/m2 | 3 | 191 | Mean Difference (IV, Fixed, 95% CI) | 0.30 [‐0.33, 0.92] |
| 7.1.2 BMI > 25 kg/m2< 30 kg/m2 | 4 | 198 | Mean Difference (IV, Fixed, 95% CI) | 0.65 [0.24, 1.06] |
| 7.2 Adverse events ‐ severe Show forest plot | 6 | Odds Ratio (M‐H, Fixed, 95% CI) | Subtotals only | |
| 7.2.1 Gastro‐intestinal | 5 | 228 | Odds Ratio (M‐H, Fixed, 95% CI) | 0.20 [0.06, 0.72] |
| 7.2.2 Others | 4 | 159 | Odds Ratio (M‐H, Fixed, 95% CI) | 1.61 [0.49, 5.37] |
| 7.3 Adverse events ‐ minor Show forest plot | 2 | 98 | Odds Ratio (M‐H, Fixed, 95% CI) | 0.06 [0.01, 0.44] |
| 7.3.1 Gastro‐intestinal | 2 | 98 | Odds Ratio (M‐H, Fixed, 95% CI) | 0.06 [0.01, 0.44] |
| 7.4 Acne ‐ Clinical acne score Show forest plot | 1 | Mean Difference (IV, Fixed, 95% CI) | Totals not selected | |
| 7.4.1 BMI > 25 kg/m2< 30 kg/m2 | 1 | Mean Difference (IV, Fixed, 95% CI) | Totals not selected | |
| 7.5 Acne ‐ Subjective improvement Show forest plot | 1 | Odds Ratio (M‐H, Fixed, 95% CI) | Totals not selected | |
| 7.5.1 BMI ≤ 25 kg/m2 | 1 | Odds Ratio (M‐H, Fixed, 95% CI) | Totals not selected | |
| 7.6 Body weight (kg) Show forest plot | 7 | 387 | Mean Difference (IV, Fixed, 95% CI) | ‐0.63 [‐1.58, 0.33] |
| 7.6.1 BMI ≤ 25 kg/m2 | 3 | 215 | Mean Difference (IV, Fixed, 95% CI) | ‐0.57 [‐1.55, 0.41] |
| 7.6.2 BMI > 25 kg/m2< 30 kg/m2 | 3 | 153 | Mean Difference (IV, Fixed, 95% CI) | ‐1.67 [‐6.46, 3.12] |
| 7.6.3 BMI ≥ 30 kg/m2 | 1 | 19 | Mean Difference (IV, Fixed, 95% CI) | ‐5.30 [‐23.46, 12.86] |
| 7.7 Body Mass Index (kg/m2) Show forest plot | 13 | 661 | Mean Difference (IV, Fixed, 95% CI) | ‐0.21 [‐0.53, 0.12] |
| 7.7.1 BMI ≤ 25 kg/m2 | 6 | 327 | Mean Difference (IV, Fixed, 95% CI) | ‐0.18 [‐0.52, 0.17] |
| 7.7.2 BMI > 25 kg/m2 < 30 kg/m2 | 7 | 315 | Mean Difference (IV, Fixed, 95% CI) | ‐0.37 [‐1.29, 0.56] |
| 7.7.3 BMI ≥ 30 kg/m2 | 1 | 19 | Mean Difference (IV, Fixed, 95% CI) | ‐3.10 [‐9.61, 3.41] |
| 7.8 Blood Pressure ‐ Systolic (mmHg) Show forest plot | 5 | 326 | Mean Difference (IV, Fixed, 95% CI) | ‐1.75 [‐4.03, 0.53] |
| 7.8.1 BMI ≤ 25kg/m2 | 1 | 129 | Mean Difference (IV, Fixed, 95% CI) | 0.52 [‐3.42, 4.46] |
| 7.8.2 BMI > 25 kg/m2 < 30 kg/m2 | 3 | 178 | Mean Difference (IV, Fixed, 95% CI) | ‐2.29 [‐5.24, 0.66] |
| 7.8.3 BMI ≥ 30 kg/m2 | 1 | 19 | Mean Difference (IV, Fixed, 95% CI) | ‐8.80 [‐17.94, 0.34] |
| 7.9 Blood Pressure ‐ Diastolic (mmHg) Show forest plot | 5 | 326 | Mean Difference (IV, Fixed, 95% CI) | ‐1.05 [‐2.79, 0.68] |
| 7.9.1 BMI ≤ 25 kg/m2 | 1 | 129 | Mean Difference (IV, Fixed, 95% CI) | ‐0.50 [‐3.75, 2.75] |
| 7.9.2 BMI > 25 kg/m2 < 30 kg/m2 | 3 | 178 | Mean Difference (IV, Fixed, 95% CI) | ‐0.61 [‐2.84, 1.61] |
| 7.9.3 BMI ≥ 30 kg/m2 | 1 | 19 | Mean Difference (IV, Fixed, 95% CI) | ‐5.20 [‐10.60, 0.20] |
| Outcome or subgroup title | No. of studies | No. of participants | Statistical method | Effect size |
| 8.1 Serum total testosterone (nmol/L) Show forest plot | 12 | 715 | Mean Difference (IV, Fixed, 95% CI) | 0.08 [0.01, 0.16] |
| 8.1.1 BMI ≤ 25 kg/m2 | 6 | 327 | Mean Difference (IV, Fixed, 95% CI) | 0.08 [‐0.01, 0.17] |
| 8.1.2 BMI > 25 kg/m2 < 30 kg/m2 | 6 | 369 | Mean Difference (IV, Fixed, 95% CI) | 0.10 [‐0.04, 0.24] |
| 8.1.3 BMI ≥ 30 kg/m2 | 1 | 19 | Mean Difference (IV, Fixed, 95% CI) | 0.90 [‐4.23, 6.03] |
| 8.2 Free androgen index (FAI) (%) Show forest plot | 7 | 482 | Mean Difference (IV, Fixed, 95% CI) | 0.51 [0.30, 0.71] |
| 8.2.1 BMI ≤ 25 kg/m2 | 3 | 215 | Mean Difference (IV, Fixed, 95% CI) | 0.47 [‐0.12, 1.06] |
| 8.2.2 BMI > 25 kg/m2 < 30 kg/m2 | 4 | 267 | Mean Difference (IV, Fixed, 95% CI) | 0.51 [0.29, 0.73] |
| Outcome or subgroup title | No. of studies | No. of participants | Statistical method | Effect size |
| 9.1 Fasting insulin (mIU/L) Show forest plot | 12 | 602 | Mean Difference (IV, Fixed, 95% CI) | 2.29 [1.49, 3.09] |
| 9.1.1 BMI ≤ 25 kg/m2 | 5 | 198 | Mean Difference (IV, Fixed, 95% CI) | 4.77 [3.26, 6.28] |
| 9.1.2 BMI > 25 kg/m2 < 30 kg/m2 | 7 | 385 | Mean Difference (IV, Fixed, 95% CI) | 1.37 [0.42, 2.32] |
| 9.1.3 BMI ≥ 30 kg/m2 | 1 | 19 | Mean Difference (IV, Fixed, 95% CI) | ‐1.63 [‐9.67, 6.41] |
| 9.2 Fasting glucose (mmol/L) Show forest plot | 10 | 529 | Mean Difference (IV, Fixed, 95% CI) | 0.20 [0.11, 0.29] |
| 9.2.1 BMI ≤ 25 kg/m2 | 5 | 205 | Mean Difference (IV, Fixed, 95% CI) | 0.11 [‐0.07, 0.29] |
| 9.2.2 BMI > 25 kg/m2 < 30 kg/m2 | 4 | 305 | Mean Difference (IV, Fixed, 95% CI) | 0.25 [0.14, 0.36] |
| 9.2.3 BMI ≥ 30 kg/m2 | 1 | 19 | Mean Difference (IV, Fixed, 95% CI) | ‐0.30 [‐0.81, 0.21] |
| 9.3 Total Cholesterol (mmol/L) Show forest plot | 13 | 668 | Mean Difference (IV, Fixed, 95% CI) | 0.06 [‐0.05, 0.17] |
| 9.3.1 BMI ≤ 25 kg/m2 | 4 | 176 | Mean Difference (IV, Fixed, 95% CI) | ‐0.02 [‐0.20, 0.16] |
| 9.3.2 BMI > 25 kg/m2 < 30 kg/m2 | 8 | 473 | Mean Difference (IV, Fixed, 95% CI) | 0.10 [‐0.04, 0.25] |
| 9.3.3 BMI ≥ 30 kg/m2 | 1 | 19 | Mean Difference (IV, Fixed, 95% CI) | 0.30 [‐0.31, 0.91] |
| 9.4 HDL Cholesterol (mmol/L) Show forest plot | 13 | 668 | Mean Difference (IV, Fixed, 95% CI) | 0.05 [0.01, 0.09] |
| 9.4.1 BMI ≤ 25 kg/m2 | 4 | 176 | Mean Difference (IV, Fixed, 95% CI) | 0.05 [‐0.00, 0.10] |
| 9.4.2 BMI > 25 kg/m2 < 30 kg/m2 | 8 | 473 | Mean Difference (IV, Fixed, 95% CI) | 0.04 [‐0.02, 0.11] |
| 9.4.3 BMI ≥ 30 kg/m2 | 1 | 19 | Mean Difference (IV, Fixed, 95% CI) | 0.20 [‐0.02, 0.42] |
| 9.5 LDL Cholesterol (mmol/L) Show forest plot | 13 | 668 | Mean Difference (IV, Fixed, 95% CI) | 0.04 [‐0.05, 0.14] |
| 9.5.1 BMI ≤ 25 kg/m2 | 4 | 176 | Mean Difference (IV, Fixed, 95% CI) | 0.01 [‐0.18, 0.21] |
| 9.5.2 BMI > 25 kg/m2 < 30 kg/m2 | 8 | 473 | Mean Difference (IV, Fixed, 95% CI) | 0.04 [‐0.07, 0.16] |
| 9.5.3 BMI ≥ 30 kg/m2 | 1 | 19 | Mean Difference (IV, Fixed, 95% CI) | 0.30 [‐0.27, 0.87] |
| 9.6 Triglycerides (mmol/L) Show forest plot | 13 | 668 | Mean Difference (IV, Fixed, 95% CI) | ‐0.02 [‐0.09, 0.04] |
| 9.6.1 BMI ≤ 25 kg/m2 | 4 | 176 | Mean Difference (IV, Fixed, 95% CI) | 0.02 [‐0.08, 0.11] |
| 9.6.2 BMI > 25 kg/m2 < 30 kg/m2 | 8 | 473 | Mean Difference (IV, Fixed, 95% CI) | ‐0.06 [‐0.15, 0.03] |
| 9.6.3 BMI ≥ 30 kg/m2 | 1 | 19 | Mean Difference (IV, Fixed, 95% CI) | 0.30 [‐0.67, 1.27] |
| Outcome or subgroup title | No. of studies | No. of participants | Statistical method | Effect size |
| 10.1 Hirsutism ‐ Clinical F‐G score Show forest plot | 1 | Mean Difference (IV, Fixed, 95% CI) | Totals not selected | |
| 10.1.1 BMI ≥ 30 kg/m2 | 1 | Mean Difference (IV, Fixed, 95% CI) | Totals not selected | |
| 10.2 Hirsutism ‐ Subjective improvement Show forest plot | 1 | Odds Ratio (M‐H, Fixed, 95% CI) | Totals not selected | |
| 10.2.1 Mean BMI not stated | 1 | Odds Ratio (M‐H, Fixed, 95% CI) | Totals not selected | |
| 10.3 Adverse event ‐ severe Show forest plot | 1 | Odds Ratio (M‐H, Fixed, 95% CI) | Totals not selected | |
| 10.3.1 Others | 1 | Odds Ratio (M‐H, Fixed, 95% CI) | Totals not selected | |
| 10.4 Adverse event ‐ minor Show forest plot | 1 | Odds Ratio (M‐H, Fixed, 95% CI) | Totals not selected | |
| 10.4.1 Gastro‐intestinal | 1 | Odds Ratio (M‐H, Fixed, 95% CI) | Totals not selected | |
| 10.5 Improved menstrual pattern (ie. an initiation of menses or cycle regularity) Show forest plot | 1 | Odds Ratio (M‐H, Fixed, 95% CI) | Totals not selected | |
| 10.5.1 Mean BMI not stated | 1 | Odds Ratio (M‐H, Fixed, 95% CI) | Totals not selected | |
| 10.6 Body Weight (kg) Show forest plot | 2 | 111 | Mean Difference (IV, Fixed, 95% CI) | ‐18.77 [‐20.57, ‐16.98] |
| 10.6.1 BMI ≥ 30 kg/m2 | 1 | 31 | Mean Difference (IV, Fixed, 95% CI) | ‐2.60 [‐17.87, 12.67] |
| 10.6.2 Mean BMI not stated | 1 | 80 | Mean Difference (IV, Fixed, 95% CI) | ‐19.00 [‐20.81, ‐17.19] |
| 10.7 Body Mass Index (kg/m2) Show forest plot | 3 | 69 | Mean Difference (IV, Fixed, 95% CI) | ‐1.45 [‐5.08, 2.17] |
| 10.7.1 BMI ≥ 30 kg/m2 | 3 | 69 | Mean Difference (IV, Fixed, 95% CI) | ‐1.45 [‐5.08, 2.17] |
| 10.8 Blood pressure ‐ systolic (mm Hg) Show forest plot | 1 | Mean Difference (IV, Fixed, 95% CI) | Totals not selected | |
| 10.8.1 BMI ≥ 30 kg/m2 | 1 | Mean Difference (IV, Fixed, 95% CI) | Totals not selected | |
| 10.9 Blood pressure ‐ diastolic (mm Hg) Show forest plot | 1 | Mean Difference (IV, Fixed, 95% CI) | Totals not selected | |
| 10.9.1 BMI ≥ 30 kg/m2 | 1 | Mean Difference (IV, Fixed, 95% CI) | Totals not selected | |
| Outcome or subgroup title | No. of studies | No. of participants | Statistical method | Effect size |
| 11.1 Serum total testosterone (nmol/L) Show forest plot | 3 | 69 | Mean Difference (IV, Fixed, 95% CI) | 0.23 [‐0.21, 0.68] |
| 11.1.1 BMI ≥ 30 kg/m2 | 3 | 69 | Mean Difference (IV, Fixed, 95% CI) | 0.23 [‐0.21, 0.68] |
| 11.2 Free androgen index (FAI) (%) Show forest plot | 1 | Mean Difference (IV, Fixed, 95% CI) | Totals not selected | |
| 11.2.1 BMI ≥ 30 kg/m2 | 1 | Mean Difference (IV, Fixed, 95% CI) | Totals not selected | |
| Outcome or subgroup title | No. of studies | No. of participants | Statistical method | Effect size |
| 12.1 Fasting insulin (mIU/L) Show forest plot | 2 | 53 | Mean Difference (IV, Fixed, 95% CI) | 4.55 [‐4.82, 13.92] |
| 12.1.1 BMI ≥ 30 kg/m2 | 2 | 53 | Mean Difference (IV, Fixed, 95% CI) | 4.55 [‐4.82, 13.92] |
| 12.2 Fasting glucose (mmol/L) Show forest plot | 1 | Mean Difference (IV, Fixed, 95% CI) | Totals not selected | |
| 12.2.1 BMI ≥ 30 kg/m2 | 1 | Mean Difference (IV, Fixed, 95% CI) | Totals not selected | |
| 12.3 Total Cholesterol (mmol/L) Show forest plot | 2 | 47 | Mean Difference (IV, Fixed, 95% CI) | ‐1.12 [‐1.66, ‐0.58] |
| 12.3.1 BMI ≥ 30 kg/m2 | 2 | 47 | Mean Difference (IV, Fixed, 95% CI) | ‐1.12 [‐1.66, ‐0.58] |
| 12.4 HDL Cholesterol (mmol/L) Show forest plot | 2 | 47 | Mean Difference (IV, Fixed, 95% CI) | 0.12 [‐0.10, 0.34] |
| 12.4.1 BMI ≥ 30 kg/m2 | 2 | 47 | Mean Difference (IV, Fixed, 95% CI) | 0.12 [‐0.10, 0.34] |
| 12.5 LDL Cholesterol (mmol/L) Show forest plot | 2 | 47 | Mean Difference (IV, Fixed, 95% CI) | ‐0.92 [‐1.49, ‐0.35] |
| 12.5.1 BMI ≥ 30 kg/m2 | 2 | 47 | Mean Difference (IV, Fixed, 95% CI) | ‐0.92 [‐1.49, ‐0.35] |
| 12.6 Triglycerides (mmol/L) Show forest plot | 3 | 69 | Mean Difference (IV, Fixed, 95% CI) | ‐0.13 [‐0.37, 0.10] |
| 12.6.1 BMI ≥ 30 kg/m2 | 3 | 69 | Mean Difference (IV, Fixed, 95% CI) | ‐0.13 [‐0.37, 0.10] |
| Outcome or subgroup title | No. of studies | No. of participants | Statistical method | Effect size |
| 13.1 Hirsutism ‐ Clinical F‐G score Show forest plot | 1 | Mean Difference (IV, Fixed, 95% CI) | Totals not selected | |
| 13.1.1 BMI ≥ 30 kg/m2 | 1 | Mean Difference (IV, Fixed, 95% CI) | Totals not selected | |
| 13.2 Adverse events ‐ severe Show forest plot | 1 | Odds Ratio (M‐H, Fixed, 95% CI) | Totals not selected | |
| 13.2.1 Gastro‐intestinal | 1 | Odds Ratio (M‐H, Fixed, 95% CI) | Totals not selected | |
| 13.3 Body Mass Index (kg/m2) Show forest plot | 1 | Mean Difference (IV, Fixed, 95% CI) | Totals not selected | |
| 13.3.1 BMI ≥ 30 kg/m2 | 1 | Mean Difference (IV, Fixed, 95% CI) | Totals not selected | |
| 13.4 Blood Pressure ‐ Systolic (mmHg) Show forest plot | 1 | Mean Difference (IV, Fixed, 95% CI) | Totals not selected | |
| 13.4.1 BMI ≥ 30 kg/m2 | 1 | Mean Difference (IV, Fixed, 95% CI) | Totals not selected | |
| 13.5 Blood Pressure ‐ Diastolic (mmHg) Show forest plot | 1 | Mean Difference (IV, Fixed, 95% CI) | Totals not selected | |
| 13.5.1 BMI ≥ 30 kg/m2 | 1 | Mean Difference (IV, Fixed, 95% CI) | Totals not selected | |
| Outcome or subgroup title | No. of studies | No. of participants | Statistical method | Effect size |
| 14.1 Serum total testosterone (nmol/L) Show forest plot | 1 | Mean Difference (IV, Fixed, 95% CI) | Totals not selected | |
| 14.1.1 BMI ≥ 30 kg/m2 | 1 | Mean Difference (IV, Fixed, 95% CI) | Totals not selected | |
| 14.2 Free androgen index (FAI) (%) Show forest plot | 1 | Mean Difference (IV, Fixed, 95% CI) | Totals not selected | |
| 14.2.1 BMI ≥ 30 kg/m2 | 1 | Mean Difference (IV, Fixed, 95% CI) | Totals not selected | |
| Outcome or subgroup title | No. of studies | No. of participants | Statistical method | Effect size |
| 15.1 Fasting glucose (mmol/L) Show forest plot | 1 | Mean Difference (IV, Fixed, 95% CI) | Totals not selected | |
| 15.1.1 BMI ≥ 30 kg/m2 | 1 | Mean Difference (IV, Fixed, 95% CI) | Totals not selected | |
| 15.2 Total Cholesterol (mmol/L) Show forest plot | 1 | Mean Difference (IV, Fixed, 95% CI) | Totals not selected | |
| 15.2.1 BMI ≥ 30 kg/m2 | 1 | Mean Difference (IV, Fixed, 95% CI) | Totals not selected | |
| 15.3 HDL Cholesterol (mmol/L) Show forest plot | 1 | Mean Difference (IV, Fixed, 95% CI) | Totals not selected | |
| 15.3.1 BMI ≥ 30 kg/m2 | 1 | Mean Difference (IV, Fixed, 95% CI) | Totals not selected | |
| 15.4 LDL Cholesterol (mmol/L) Show forest plot | 1 | Mean Difference (IV, Fixed, 95% CI) | Totals not selected | |
| 15.4.1 BMI ≥ 30 kg/m2 | 1 | Mean Difference (IV, Fixed, 95% CI) | Totals not selected | |
| 15.5 Triglycerides (mmol/L) Show forest plot | 1 | Mean Difference (IV, Fixed, 95% CI) | Totals not selected | |
| 15.5.1 BMI ≥ 30 kg/m2 | 1 | Mean Difference (IV, Fixed, 95% CI) | Totals not selected | |