Cribado nutricional para mejorar la práctica profesional para los desenlaces de los pacientes en ámbitos hospitalarios y de atención primaria
Resumen
Antecedentes
Debido a la prevalencia de desnutrición y a los informes de un tratamiento nutricional inadecuado de los pacientes en hospitales y en la comunidad, el cribado nutricional podría desempeñar una función en la reducción de los riesgos de desnutrición. Los programas de cribado pueden suponer costes para los sistemas de salud y los pacientes. Por lo tanto, es importante evaluar la efectividad de los programas de cribado nutricional.
Objetivos
Examinar la efectividad del cribado nutricional para mejorar la calidad de la atención (práctica profesional) y los desenlaces de los pacientes en comparación con la atención habitual.
Métodos de búsqueda
Se buscó en las bases de datos siguientes: CENTRAL (La Biblioteca Cochrane), MEDLINE, EMBASE y CINAHL hasta junio de 2012 para encontrar estudios relevantes.
Criterios de selección
Fueron elegibles para inclusión en la revisión los estudios controlados aleatorizados, los ensayos clínicos controlados, los estudios controlados tipo antes y después (before‐after studies) y los estudios de series de tiempo interrumpido que evaluaron la efectividad del cribado nutricional. Se consideraron los desenlaces del proceso (por ejemplo, la identificación de los pacientes, la derivación a un nutricionista) y los desenlaces de los pacientes (por ejemplo, mortalidad, cambio en el índice de masa corporal [IMC]). Los participantes fueron pacientes adultos de 16 años o más. Se incluyeron estudios realizados en diferentes ámbitos incluidos los hospitales, los consultorios ambulatorios o los ámbitos de atención primaria o de larga estancia.
Obtención y análisis de los datos
De forma independiente se evaluó el riesgo de sesgo y se extrajeron los datos de los estudios incluidos. Se consideró la posibilidad de realizar un metanálisis, pero no se realizó debido a las discrepancias entre los estudios. Los estudios fueron heterogéneos en cuanto al diseño, el ámbito, la intervención y los desenlaces. Los datos se analizaron mediante un método de síntesis narrativa.
Resultados principales
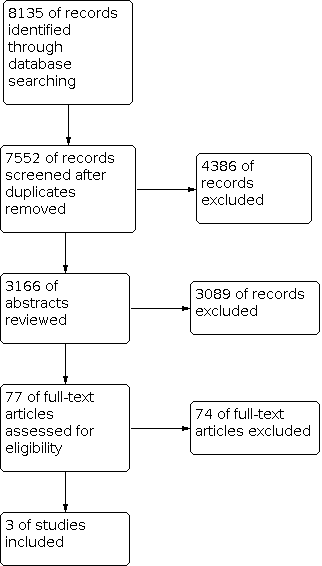
Después de realizar las búsquedas iniciales y la revisión de los títulos y los resúmenes de la bibliografía identificada, se obtuvieron y leyeron 77 artículos de texto completo. Finalmente se incluyeron tres estudios. Dos estudios controlados tipo antes y después se realizaron en ámbitos hospitalarios (uno en el Reino Unido y uno en los Países Bajos) y un ensayo controlado aleatorizado por conglomerados se realizó en un ámbito de atención primaria (en los EE.UU.).
El estudio realizado en la atención primaria informó que los médicos fueron receptivos a la intervención de cribado, pero la intervención no dio lugar a mejorías en la tasa de detección de la desnutrición ni en la tasa de intervención nutricional. Los dos estudios realizados en hospitales tuvieron limitaciones metodológicas importantes. Un estudio informó que como resultado de la intervención, el registro del peso de los pacientes aumentó en las salas de intervención. No se observaron cambios significativos en las tasas de derivación a nutricionistas ni en la atención al momento de las comidas. El tercer estudio informó aumentos de peso y una reducción en la tasa de infección intrahospitalaria en el hospital de intervención. No se encontraron diferencias significativas en la duración de la estancia hospitalaria, las úlceras de decúbito, la desnutrición ni los costes de tratamiento por paciente entre los dos hospitales.
Conclusiones de los autores
La evidencia actual no es suficiente para apoyar la efectividad del cribado nutricional, aunque tampoco existe evidencia de ningún efecto. Por lo tanto, se deben realizar más estudios de alta calidad para evaluar la efectividad del cribado nutricional en diferentes ámbitos.
PICO
Resumen en términos sencillos
Cribado nutricional para mejorar la atención del paciente y la práctica profesional
A menudo se observan procesos inadecuados establecidos para identificar a los pacientes desnutridos o en riesgo de desnutrición en los hospitales y en la comunidad. Por lo tanto, el cribado nutricional como una herramienta para identificar a dichos pacientes podría cumplir una función importante en cuanto a la reducción de los riesgos de desnutrición. Hay varios informes sobre la implementación de programas de cribado nutricional, aunque hay costes asociados para los sistemas de salud y los pacientes. Por lo tanto, es importante evaluar la efectividad de los programas de cribado nutricional. Se realizaron búsquedas de estudios que evaluaran los efectos del cribado nutricional como una intervención principal en ámbitos hospitalarios y de atención primaria sobre desenlaces de los pacientes como la mortalidad, la enfermedad, la calidad de vida relacionada con la salud y el cambio en el IMC o el peso. También se realizaron búsquedas de estudios que evaluaran los desenlaces del proceso como la identificación de los pacientes que requerían atención nutricional, el registro de los datos (p.ej., peso e IMC) o la derivación de los pacientes a nutricionistas o similares. Tres estudios cumplieron con los criterios de inclusión, aunque fueron muy diferentes en cuanto al diseño, el ámbito, la intervención y los desenlaces. Un estudio encontró que los médicos de atención primaria fueron receptivos a la intervención, aunque la misma no dio lugar a mejorías en la tasa de detección ni en la tasa de intervención nutricional. Dos estudios se realizaron en hospitales: uno informó que la documentación del peso del paciente aumentó como resultado de la intervención, y el otro informó aumentos de peso significativos y una reducción en la tasa de infección intrahospitalaria en el hospital de intervención. Ambos estudios tuvieron limitaciones en el diseño y no fue posible descartar el impacto de los factores de confusión en los hallazgos. Debido a lo anterior se concluye que la evidencia sobre la efectividad del cribado nutricional no es suficiente. Por lo tanto, se deben realizar estudios adicionales de alta calidad para evaluar la efectividad de los programas de cribado nutricional en hospitales y comunidades.
Authors' conclusions
Summary of findings
| Study ID | Outcomes | Before | After | Comments | ||||||||||
|---|---|---|---|---|---|---|---|---|---|---|---|---|---|---|
| Control group (mean) | N | Intervention group (mean) | N | Difference | P Value | Control group (mean) | N | Intervention group (mean) | N | Difference | P Value | |||
| Moore 1997 | General health score | 57 | 112 | 61 | 149 | 4(‐3 to 10) | 0.31 | 70 | 99 | 69 | 131 | ‐1(‐8 to 4) | 0.53 | |
| Nutrition problems detection rate (%) | NR# | 5 | 112 | 5 | 149 | 0(‐1 to 1) | 0.98 | |||||||
| Nutritional intervention rate (%) | NR | 4 | 112 | 4 | 149 | 0(‐4 to 4) | 0.84 | |||||||
| Study ID | Outcomes | Control group (%) | N | Intervention group (%) | N | Control group (%) | N | Intervention group (%) | N | Difference | P Value | |||
| Jordan 2003 | Dietitian referrals | 18.5 | 27 | 15.2 | 46 | ‐3.3 | 10.5 | 38 | 9.4 | 64 | ‐1.1 | |||
| Incidence of weight documentation | 29.6 | 27 | 26 | 46 | ‐3.6 | 7.9 | 38 | 72 | 64 | 64.1 | ||||
| Study ID | Outcomes | Control group | N | Intervention group | N | Difference | P Value | Control group | N | Intervention group | N | Difference | P Value | |
| Rypkema 2003 | Length of stay (days ‐ mean) | NR | 32.7 | 158 | 31.1 | 140 | 1.6 | 0.51 | ||||||
| Weight change (Kg ‐ mean) | NR | ‐0.76 | 140 | 0.92 | 105 | 1.68 | <0.001 | |||||||
| Number of patient with >3% weight loss | NR | 42 | 140 | 11 | 105 | ‐19% | <0.001 | |||||||
| Number of nosocomial infections | NR | 58 | 158 | 33 | 140 | ‐13% | 0.01 | |||||||
| Number of patients with pressure sores | NR | 33 | 158 | 23 | 140 | ‐0.4% | 0.37 | |||||||
| Mean hospital cost per patient (Euro)* | NR | 7908 | 158 | 7516 | 140 | ‐392 (‐1619 to 835) | ||||||||
| # NR: Not Reported. *Costs were compared by measuring time spent on training and extra time needed for screening monitoring and intervening in the intervention group; materials used, such as diagnostic tests for infection and supplements, in control and intervention group; and number of in‐hospital days for both groups. No discounting has been performed, as the study duration is less than one year. No price year was mentioned. | ||||||||||||||
Background
In 1997, the Association of Community Health Councils published the report, "Hungry in hospital" (Achcew 1997), in which the authors argued that many patients were not receiving the nutritional support they needed. Before that, the King's Fund estimated that adequate nutritional interventions could save a lot of money for the UK National Health Service (NHS) by reducing the length of hospital stay and improving recovery (Lennard‐Jones 1992). Similarly, concerns were raised in several countries about the nutritional status of hospitalised patients (Roubenoff 1987; White 1991; Stratton 2000; Corish 2001; Beck 2002). Since then, numerous efforts such as the further development of screening tools and guidelines (Elia 2003; NICE 2006) have been developed to target under‐nutrition of patients and the quality of nutritional support in hospitals and in the community. Despite these efforts, detailed survey studies conducted in the UK demonstrated that malnutrition affected more than one third of adults admitted to hospitals and, more importantly, the prevalence of malnutrition on admission to hospitals increased during the years 2007 to 2010 (BAPEN 2008; BAPEN 2009; BAPEN 2011). Globally, the high prevalence of malnutrition on admission to hospital was also widely reported. In Ireland the prevalence was very similar to the UK (BAPEN 2011) and a survey in Hungary identified that 41% of in‐patients were at nutritional risk (Lelovics 2008). A study from Australia reported lower numbers of patients at nutritional risk, 16.5% of adult surgical and medical in‐patients (Frew 2010). Patients' nutritional status in hospitals in low‐ and middle‐income countries was not favourable. A study on nutritional assessment in one hospital in Iran (a middle‐income country) showed that approximately 22% of patients were at moderate risk and 31% were at high risk of malnutrition (Mirmiran 2011).
Malnutrition is also a common feature in the community and in care homes. A UK nutritional screening survey in care homes in 2010 showed that the malnutrition rates were similar to hospitals. The prevalence of malnutrition was estimated at 37% in England, 31% in Northern Ireland and 45% in Scotland (BAPEN 2011). Another nutritional screening study of older adults living in 25 care homes in the UK found that approximately 42% of residents were at medium or high risk of malnutrition (Norris 2011). A survey of community dwelling Chinese adults aged 55 years and above living in Singapore showed that about 23% and 5% were at moderate and high risk of malnutrition, respectively (Yap 2007).
Many screening tools have been developed in order to help identify undernourished patients (Ferguson 1999; Jones 2002; Weekesa 2004; Kim 2011). Routine assessment of weight and height in hospitals, as well as in high risk groups in the community, has been recommended (Lennard‐Jones 1992; Sizer 1996; Elia 2003). Despite these efforts and the publicity, studies suggested that the weight and height of patients were not systematically recorded in hospitals, making it difficult to estimate body mass index (BMI), change in weight and risk of under‐nutrition (Campbell 2002). It was also known that the development of many of the suggested nutritional screening tools did not follow defined methodological criteria (Arrowsmith 1999; Jones 2002). However, easy to use under‐nutrition screening tools are available for use in different settings (Dent 2012; Elia 2012; Poulia 2012). The use of these screening tools have been recommended for improving the quality of nutritional care in hospitals in the American Society for Parenteral and Enteral Nutrition (ASPEN) and European Society for Clinical Nutrition and Metabolism (ESPEN) clinical guidelines (Kondrup 2003; Mueller 2011).
Given the prevalence of under‐nutrition and a lack of proper nutritional management of patients in hospitals and the community, nutritional screening may play a role in resolving the problem (Beck 2002). Nutritional screening could result in early identification of patients who may otherwise have been overlooked (Elia 2003). It may also help establish reliable pathways of care for undernourished patients, which could include provision of support, provision of advice from clinicians, access to dieticians and provision of adequate follow‐up. On the other hand, screening programmes can invoke costs to health systems (for example personnel time and treatment costs) and patients (for example because of false negative and false positive results, and from side effects of potential treatments) (Gigerenzer 2002). It is therefore important to assess the effectiveness of nutritional screening programmes.
Description of the intervention
The American Society for Parenteral and Enteral Nutrition (ASPEN) defined nutritional screening as “a process to identify an individual who is malnourished or who is at risk of malnutrition to determine if a detailed nutrition assessment is indicated” (Mueller 2011). The purpose of nutrition screening was described by the European Society for Clinical Nutrition and Metabolism as a method "to predict the probability of a better or worse outcome due to nutritional factors, and to determine whether nutritional treatment is likely to influence this" (Kondrup 2003).
Nutritional screening is a rapid and simple way of identifying patients at nutritional risk. Screening can be performed by busy nurses and other medical staff or other relevant professionals at the community or hospital, and normally involves quantitative and qualitative assessment of current weight and height, food and fluid intake, and duration of health status.
There are clear distinctions between nutritional screening and nutritional assessment. In nutritional assessment, the intervention is aimed at establishing whether a patient or individual is malnourished, or at risk of becoming malnourished (that is making a diagnosis), and deciding upon the best courses of action to alleviate nutritional risks (that is providing care). Nutritional assessment may follow nutritional screening. Nutrition assessment involves a more detailed assessment including an examination of functional, nutritional and metabolic variables, and is usually performed by a dietitian, an expert clinician, or a nutritional nurse and can result in a care plan for malnourished patients (Kondrup 2003).
For this review, nutritional screening is the application of a screening tool to a group of patients or apparently healthy individuals for whom the level of malnutrition risk is unknown, and is carried out in order to establish the level of risk.
Objectives
To examine the effectiveness of nutritional screening in improving quality of care (professional practice) and patient outcomes compared with usual care.
Methods
Criteria for considering studies for this review
Types of studies
Randomised controlled studies (randomised controlled trials (RCTs), clustered randomised controlled trials, (randomised) controlled cross‐over designs, block randomised designs (Pocock 1983)), controlled clinical trials (CCTs), interrupted time series studies and controlled before‐after studies were considered for inclusion in the review.
Blinding was not considered essential since it is virtually impossible to undertake in screening studies. Studies with historical controls only (without concurrent controls) were excluded. Although controlled before‐after studies without random allocation were considered eligible for inclusion in the review, their limitations were specifically noted as the nutritional screening interventions might be linked to other quality improvement initiatives or contextual issues that interact with effectiveness of the interventions.
Types of participants
We included studies conducted in different settings including acute hospitals, long term care institutions, community and primary care. Participants were adult patients aged 16 years or over, in hospital, an out‐patient clinic, primary care or long term care, and also individuals that were otherwise considered healthy but might be at risk of under‐nutrition. The definition of the latter group may differ but includes, for example, elderly people etc.
There was no restriction in terms of gender or the underlying health status of the participants (given this is the evaluation of the screening programmes). However, these variations were taken into account in the interpretation of the findings.
Types of interventions
The intervention ('screening programme') is loosely defined as the application of a screening tool on a group of patients, or otherwise healthy people, for whom the level of under‐nutrition risk is unknown to establish whether they are at under‐nutrition risk. Nutritional screening is different from nutritional assessment. The latter is usually more comprehensive and includes a more detailed assessment of patients who are likely to be malnourished. Nutritional assessments usually result in the establishment of levels of malnourishment and nutritional risk, and identification of clinical interventions to tackle those risks. In contrast, nutritional screening for under‐nutrition targets patients for whom the risk of under‐nutrition is unknown and usually involves the application of simpler tools. In practice, however, the line between the two is blurred and consequently special scrutiny of potentially included studies was required.
The intervention could be offered as a stand‐alone intervention or as part of a wider strategy. For example, it may be part of a wider strategy for quality improvement in which nutritional screening is one part. The intervention may also be offered as part of a more comprehensive screening package in which screening is being conducted for a few ailments. In the latter forms, the included studies should report outcomes that can be related to a nutritional screening programme. To be eligible for inclusion in this review, the intervention should be compared with a control group that does not receive the same screening intervention. In the case of potential time series studies, the 'pre' intervention period should not involve the screening intervention. Hence if the studies offer a similar nutritional screening programme to both the intervention and control groups, they will not meet the inclusion criteria even if the additional elements of the programme vary between the intervention and control groups.
Types of outcome measures
The outcomes included process outcomes and patient outcomes.
Primary outcomes
-
Patient outcomes: mortality, morbidity (e.g. wound infection), health related quality of life (measured by validated generic or condition specific instruments).
Secondary outcomes
-
Patient outcomes e.g. change in body mass index (BMI) or weight.
-
Process outcomes: identification of patients requiring nutritional care, data recording (e.g. weight and BMI), referral of patients to dietitians or similar, nutritional interventions, dietary advice to patients, direct medical costs, hospitalisation, hospital length of stay.
Adverse outcomes
-
Patient or process outcomes: false positive rates, adverse outcomes of nutritional interventions.
Search methods for identification of studies
Electronic searches
The search strategy had two main components: 'nutrition' and 'screening'. To increase the sensitivity of the search no study design filters were used and, apart from searches devised for systematic reviews and RCTs, there were no adequately validated search strategies available for quasi‐experimental designs.
We searched the following electronic databases: CENTRAL (The Cochrane Library), MEDLINE, EMBASE and CINAHL to find relevant studies published up to June 2012. The search strategies can be seen in Appendix 1. We included studies published in the English language.
Searching other resources
Authors of abstracts where the full paper was not published were contacted for ongoing and unpublished studies or any studies that may have been missed in our search. Reference lists of all included studies and relevant reviews and editorials were searched for appropriate studies. We also conducted forward citation searches on all included studies.
Data collection and analysis
Titles of all retrieved studies were checked by one review author to exclude those titles irrelevant to the review, and were checked again by another review author (SM). The abstracts of all the remaining titles were sought and independently assessed by two review authors (AHO, YV). The full‐texts of the papers were ordered if both review authors felt the studies were potentially relevant to the review according to the defined criteria. If only one review author considered the abstract as relevant, the view of a third review author was sought (SM). The full‐text of all obtained studies was independently assessed by two review authors against the inclusion criteria (AHO, YV). Disagreements were all resolved by discussion and by using the views of a third review author, where necessary (SM or AR).
Three review authors independently extracted the data from the included studies (YV, SM, AHO), and these were discussed with another review author (AR). Data about the intervention and control groups, setting, patient or participant characteristics, length of follow‐up, and outcome measures were extracted. Any further data that might help the interpretation of the findings were also extracted.
The methodological quality of the included studies was assessed by two review authors (YV, SM) and reviewed by two other review authors (AHO, AR). Quality assessments followed the approaches recommended by the Cochrane Pain, Palliative and Supportive Care (PaPaS) and Effective Practice and Organisation of Care (EPOC) Review Groups. Any potential sources of bias in the included studies were recorded and the implication of those biases for the reported outcomes were elaborated upon. Risk of bias was assessed using the criteria outlined in the Cochrane Handbook for Systematic Reviews of Interventions (Higgins 2009).
Pre‐planned subgroup analyses were: within different settings (for example hospital versus primary care); according to the definitions used for the establishment of malnutrition in the population (for example different nutritional screening tools or cut‐off points); and the prior probability of risk in the screened population (for example if certain wards are screened versus screening the whole hospital).
The results of each study were reported as point estimates with corresponding 95% confidence intervals (CIs), where possible. We had planned to conduct meta‐analyses if the studies provided similar outcomes and were not heterogenous. Potential sources of heterogeneity were elaborated on. Only two included studies were conducted in similar settings (that is hospitals), but they did not provide shared relevant outcomes. The third study was conducted in primary care. Hence quantitative synthesis was not possible.
As quantitative synthesis was not possible, the data were synthesised using narrative approaches. Two review authors independently synthesised the findings (AR, AHO), and the results were presented to the two other review authors (SM, YV). We presented the findings of the analyses using the Cochrane Collaboration's software RevMan 5.1 (RevMan 2011), and we discussed the results and elaborated on potential interpretations of the findings.
Results
Description of studies
Electronic searches identified 7552 studies. After assessing the titles, 3166 abstracts were reviewed. Then 77 full texts were retrieved and read. Ultimately three studies were included. Details can be seen in Figure 1.

Flowchart of search process.
Included studies
Three primary studies were considered eligible for inclusion (See Table 1). The first study, a cluster randomised trial, was conducted in a US primary care setting (Moore 1997). The intervention practices offered screening for eight ailments (including malnutrition) to patients older than 70 years on their first visit to the practices. The study addressed the following relevant outcomes: health status, nutritional problems detection rates, and interventions if nutritional risks were identified.
| ID | Title | Study design | Country | Setting | Intervention | Study period | Participants | Main relevant outcomes | |||
|---|---|---|---|---|---|---|---|---|---|---|---|
| Pre | Intervention | Post | Intervention group | Control group | |||||||
| Moore 1997 | A Randomized Trial of Office‐based Screening for common | Randomised Controlled Trial | USA | Community, general practice | Comprehensive health problem screening | Not stated in the text | patients >70yrs, English speaking, not acutely or terminally ill,able to answer questions visiting their physicians for a new visit or physical examination | 1.Ferequency of nutrition problems detection and 2.Intervention as a result of detection of nutrition problems | |||
| 112 | 149 | ||||||||||
| Jordan 2003 | Introducing a nutrition screening tool: an exploratory study in a district general hospital | Quasi experimental, Controlled before‐after study | UK | Hospital | Nutritional Screening | May 1999 | November 1999 | January 2000 | All patients admitted during study periods and able to give informed consent | 1.Nursing documentation, 2.patient care at mealtime and 3.referral to dietitian | |
| May:46 Jan:27 | May:64 Jan: 38 | ||||||||||
| Rypkema 2003 | Cost‐effectiveness of an interdisciplinary intervention in geriatric inpatients to prevent malnutrition | Prospective controlled trial plus a cost‐consequence study | Netherlands | Hospital | Nutritional Screening | 2001 | non‐terminally ill,60yr old inpatients of geriatric ward of two different hospitals who admitted for more than 2 and less than 150 days | 1.Lenght of stay, 2.Weight change, more than 3% 3.Weight loss, 4.Pressure sores, 5.Nosocomial infection 6.Total hospital cost per patient | |||
| 140 | 158 | ||||||||||
The other two studies were conducted in hospitals. One UK controlled before‐after study offered nutritional screening to patients admitted to one hospital ward and used another ward as the control (Jordan 2003). The control ward received usual care. The mean age of the hospitalised patients was 67 years. The reported outcomes were the nursing documentation process, patient care at mealtime, and frequency of referral to a dietitian.
The third study was conducted in two hospitals in the Netherlands (Rypkema 2003). The intervention was screening patients older than 60 years for malnutrition, dysphagia and dehydration followed by immediate treatment, including menu modification or supplements. The intervention was offered in one hospital and the other hospital acted as the control. The study outcomes included length of stay, weight change, more than 3% weight loss, pressure sores, nosocomial infection, and total cost of treatment. Details can be seen in Characteristics of included studies.
Excluded studies
We excluded 74 studies that did not meet the inclusion criteria. See Characteristics of excluded studies for details of the studies and reasons for exclusion.
Risk of bias in included studies
Only one of the included studies (Moore 1997) was a randomised trial and random sequence generation and allocation concealment were considered in this study, but the participants and personnel were not blind. The two other studies were non‐randomised controlled studies (Jordan 2003; Rypkema 2003); Rypkema 2003 also incorporated a cost‐consequence study design. In these two studies, it was not explicitly stated in the text whether the participants and personnel were blind or not. Detection bias and attrition bias had an unclear risk in all included studies while none of the included studies seemed to suffer from reporting bias (Figure 2 and Figure 3).

Risk of bias summary: review authors' judgements about each risk of bias item for each included study.

Risk of bias graph: review authors' judgements about each risk of bias item presented as percentages across all included studies.
There was not enough information provided in the studies to assess all potential risks of bias. Overall, the included studies were at high risk of bias. Details are described in Characteristics of included studies.
Effects of interventions
See: Summary of findings 1 Summary of findings
All details including participants, design, intervention and outcomes are described in the Characteristics of included studies table and summary of findings Table 1. The included studies were heterogeneous in their design, setting, intervention and outcomes. Therefore, no quantitative synthesis was conducted.
Moore 1997 study, a cluster randomised trial, reported that the participating primary care physicians were receptive to the intervention; but the intervention did not result in any significant improvement in general health status as measured by the SF‐36 (changing from 57 to 70 and from 61 to 69 out of 100 in the control and intervention groups, respectively), nutritional detection rate (5% versus 5%; 95% CI ‐1 to 1), and nutritional intervention rate (4% versus 4%; 95% CI ‐4 to 4). However, the study was underpowered and there were concerns about the quality of the nutritional screening tool used in the study.
Jordan 2003, a controlled before‐after study, suggested that the usage of the Nursing Nutritional Screening Tool improved the documentation processes of nutrition related issues. As a result of the intervention, patients’ weight recording in the intervention wards increased from 26% to 72% while it decreased in the control wards (P < 0.001). The study observed no change in mealtime observation for the ‘at risk’ patients, and referrals to the dietitians decreased in both the intervention and control wards (5.8% decrease in the intervention group versus 8% decrease in the control group). The study did not report patient outcomes. This study suffered from a weak design and lack of measurement of appropriate outcomes.
Rypkema 2003, a controlled trial which also incorporated a cost‐consequence study, reported weight gains (mean weight change: 0.92 kg increase in the intervention group versus 0.76 kg decrease in the control group; P < 0.001) and a reduction in the hospital acquired infection rate in the intervention hospital compared to the control hospital (33/140 versus 58/158; P = 0.01). It observed no significant changes in pressure ulcer rates and length of hospital stay. The study concluded that targeted nutritional screening improved quality of care for older patients and did not increase the hospital costs significantly. For some of the outcomes (for example length of stay, hospital infection rate) the study did not report the ‘before’ rates. This study suffered from a weak design.
Discussion
In this systematic review, only three studies met our inclusion criteria. All of the included studies had limitations in their design. Only one study (Moore 1997) was an RCT, involving 26 primary care centres. Two other studies did not conduct any random allocation, one (Jordan 2003) involved one control and one intervention ward and the other study (Rypkema 2003) involved one control and one intervention hospital. Both latter studies had methodological limitations. The three studies were different in design, participants, outcomes and settings. Due to their heterogeneity, no quantitative analysis was possible to evaluate the effectiveness of the intervention. Also, narrative analysis showed that nutritional screening had no effect on several reported outcomes. Nutritional problem detection rate, the rate of intervention as a result of detection, general health status, mealtime observation for the ‘at risk’ patient, appropriate dietitian referrals, length of stay and the pressure ulcer rate did not change following the nutritional screening in the included studies. The two non‐randomised studies (Jordan 2003; Rypkema 2003) reported improvements for certain outcomes: nutrition related issues documentation (in one study), weight gain and hospital acquired infection rate (in another study). There was no common outcome reported by the included studies, and none of the studies originated from a low‐ or middle‐income country.
As such, the available evidence is not adequate for making an informed judgment about the effectiveness of nutritional screening. There are, however, lower quality or indirectly relevant studies that have addressed nutritional screening, including studies focused on nutritional screening tools, studies that have focused on nutritional interventions after an initial screening, and lower quality studies of nutritional screening. Such studies, despite their limitations in making the link between nutritional screening and patient outcomes, might influence the decision making while robust evidence is still lacking. These studies could not be included because they did not meet the inclusion criteria of the review. We provide examples of such studies.
In recent years several studies have been conducted on the development of screening tools for assessing nutritional status. Green 2005 provided a concise summary of several studies of nutritional screening tools and reported on easy to administer nutritional screening tools. A recent review by Elia 2011 demonstrated that many such studies of screening tools assessment and comparative studies of different tools may be prone to important limitations and biases. A further review assessed the predictive value of the nutritional screening tools, such as the Mini Nutritional Assessment tool (Dent 2012). The review concluded that the tool could predict, to some extent, a need for higher level care among older people. Such studies did not provide direct evidence of effect for nutritional screening programmes. Still, they demonstrated the need for further studies to develop effective interventions involving nutritional screening.
Holyday 2012 and Bolin 2007 reported an RCT in which a nutritional intervention programme followed screening of all the patients in the control and intervention groups (hence these studies were not eligible for inclusion). These studies showed no effect on the overall length of stay, while the length of stay of malnourished patients decreased as a result of the intervention. Weight change and the readmission rate were not significantly different between the two groups.
There were several studies that used uncontrolled designs which considered the nutritional screening programmes and their impact on patient outcomes. A before‐after study with no control group (Brugler 1999) was conducted in a community hospital in the USA and assessed the effects of implementation of nutritional screening and malnutrition treatment pathways on patient health outcomes. The study reported that implementing a screening programme improved the proportion and timeliness of nutrition interventions in high risk patients, and decreased the incidence of major complications. A retrospective controlled study (Kruizenga 2005) from the Netherlands assessed the effects of early recognition and treatment of hospital malnourished patients on length of stay and costs in a hospital setting. The results suggested improvements in malnutrition detection rates and a reduction in patients' length of stay in the hospital, with a modest increase in costs. Another study (Vincent 2010), from the UK, assessed the influence of implementing national UK guidance for nutritional screening on clinical outcomes of patients who received parenteral nutrition. While the study concluded that "compliance with the national guidance in the UK on screening did not improve outcomes in patients requiring parenteral nutrition in this cohort", the study design had important limitations, and hence the conclusions may not be valid. The study did not involve random allocation of patients (or hospital wards) to screening or not screening. Rather, it compared those patients that had actually been screened with those that had not. Given that the patients who are more likely to be at nutritional risk are more likely to be screened, it is not possible to conclude that screening was ineffective using the research design employed in the Vincent 2010 study.
None of the studies mentioned above considered potential disadvantages of nutritional screening, in addition to the extra costs of implementing a screening programme. There is a risk that patients who are screened 'out' and are not considered a 'nutritional risk' (false negatives) could suffer from neglect as a result of screening. Also, nutritional screening might potentially result in ineffective or harmful interventions for some patients, but we found no study that assessed such potential outcomes of the screening programmes.
Future studies should consider the different implications of 'on admission nutritional screening' from 'screening as part of ongoing care'. While both approaches may result in changes in referrals to dietitians, the direction of effect for the latter approach might be different. Screening as part of ongoing care might be more likely to improve staff awareness, and might indirectly result in a reduced need for referrals. The included studies do not provide enough evidence on this issue, however, and Jordan 2003 noted that the nurses felt that the screening programme improved staff awareness.
Several studies and national and international guidance documents have recommended widespread application of screening programs. The NICE guideline on nutrition support in adults (NICE 2006) recommended screening for malnutrition "in all hospital inpatients on admission and all outpatients at their first clinic appointment". Also, nutritional screening for all care home residents has been emphasized in this guideline. In the USA, the Joint Commission and the American Society for Parenteral and Enteral Nutrition guidelines have recommended nutrition screening for hospitalised patients, while noting the limitations of the available evidence (Mueller 2011). These recommendations for nutritional screening for patients in hospital and primary care settings demonstrate the clinical anxiety associated with the risks of undetected and untreated malnutrition. They may also demonstrate a degree of consensus among clinical experts. For example, NICE 2006 recommended nutritional screening based on a formal consensus among the guideline development group members. In this guideline, the effectiveness evidence was assessed, and the lack of research evidence based on valid interventional studies was noted in the process. However, in the absence of evidence, the guideline development group felt justified in making the recommendations for these high risk groups (that is hospital patients and home care residents). As another example, Huhmann 2008 conducted a review that considered nutritional screening and assessment in cancer patients. They reported that “there are no studies that directly link the nutrition screening process to improved outcomes in oncology patients”. Despite this finding, the authors concluded that screening and recognition of malnourished patients can be effective in improving patient outcomes if severely malnourished patients receive nutritional intervention when they are identified via screening. On the other hand, Moreland 2010 assessed studies of nutritional screening and counselling in adults with lung cancer and concluded that "targeting specific patients through screening and counselling may provide a significant benefit to their nutrition status and improve their quality of life".
In our study, only one of the included studies utilised a random allocation design. RCT designs are now frequently used for assessing the effectiveness of breast cancer screening programmes (Shapiro 1989; Bjurstam 1997; Alexander 1999). As a notable example, a Cochrane systematic review included several RCTs of breast cancer screening interventions (Gøtzsche 2011). Additionally, several studies, including systematic reviews, have considered the cost‐effectiveness of breast cancer screening programmes (Rashidian 2013). RCTs are also used for assessing the cervical cancer screening programmes (Anttila 2006; Ogilvie 2010). Such a level of attention has not yet been devoted to the assessment of nutritional screening effectiveness.
In this systematic review, we searched MEDLINE, EMBASE, CINAHL and The Cochrane Library databases to identify the related studies. As such we may have missed potentially important, relevant studies not indexed in these databases. This is, however, unlikely to be the case, especially as our search strategy did not included any 'design' limitations, to increase the sensitivity of the search. We also considered non‐randomised controlled studies for inclusion in the review to improve the likelihood of identifying relevant evidence. Our backward and forward citation searches revealed no further studies meeting the inclusion criteria. Also, we did not identify any included study published after 2004, suggesting that the research community may not have attended to the need for interventional studies to assess the effectiveness of nutritional screening. At the same time, there were several studies that compared one or more nutrition screening tools to determine their sensitivity and specificity rather than the overall effectiveness of nutritional screening versus standard care. One important reason for this may be the assumption that 'nutritional screening is effective', whilst remaining unaware of the paucity of such evidence.
Flowchart of search process.

Risk of bias summary: review authors' judgements about each risk of bias item for each included study.

Risk of bias graph: review authors' judgements about each risk of bias item presented as percentages across all included studies.
| Study ID | Outcomes | Before | After | Comments | ||||||||||
|---|---|---|---|---|---|---|---|---|---|---|---|---|---|---|
| Control group (mean) | N | Intervention group (mean) | N | Difference | P Value | Control group (mean) | N | Intervention group (mean) | N | Difference | P Value | |||
| Moore 1997 | General health score | 57 | 112 | 61 | 149 | 4(‐3 to 10) | 0.31 | 70 | 99 | 69 | 131 | ‐1(‐8 to 4) | 0.53 | |
| Nutrition problems detection rate (%) | NR# | 5 | 112 | 5 | 149 | 0(‐1 to 1) | 0.98 | |||||||
| Nutritional intervention rate (%) | NR | 4 | 112 | 4 | 149 | 0(‐4 to 4) | 0.84 | |||||||
| Study ID | Outcomes | Control group (%) | N | Intervention group (%) | N | Control group (%) | N | Intervention group (%) | N | Difference | P Value | |||
| Jordan 2003 | Dietitian referrals | 18.5 | 27 | 15.2 | 46 | ‐3.3 | 10.5 | 38 | 9.4 | 64 | ‐1.1 | |||
| Incidence of weight documentation | 29.6 | 27 | 26 | 46 | ‐3.6 | 7.9 | 38 | 72 | 64 | 64.1 | ||||
| Study ID | Outcomes | Control group | N | Intervention group | N | Difference | P Value | Control group | N | Intervention group | N | Difference | P Value | |
| Rypkema 2003 | Length of stay (days ‐ mean) | NR | 32.7 | 158 | 31.1 | 140 | 1.6 | 0.51 | ||||||
| Weight change (Kg ‐ mean) | NR | ‐0.76 | 140 | 0.92 | 105 | 1.68 | <0.001 | |||||||
| Number of patient with >3% weight loss | NR | 42 | 140 | 11 | 105 | ‐19% | <0.001 | |||||||
| Number of nosocomial infections | NR | 58 | 158 | 33 | 140 | ‐13% | 0.01 | |||||||
| Number of patients with pressure sores | NR | 33 | 158 | 23 | 140 | ‐0.4% | 0.37 | |||||||
| Mean hospital cost per patient (Euro)* | NR | 7908 | 158 | 7516 | 140 | ‐392 (‐1619 to 835) | ||||||||
| # NR: Not Reported. *Costs were compared by measuring time spent on training and extra time needed for screening monitoring and intervening in the intervention group; materials used, such as diagnostic tests for infection and supplements, in control and intervention group; and number of in‐hospital days for both groups. No discounting has been performed, as the study duration is less than one year. No price year was mentioned. | ||||||||||||||
| ID | Title | Study design | Country | Setting | Intervention | Study period | Participants | Main relevant outcomes | |||
|---|---|---|---|---|---|---|---|---|---|---|---|
| Pre | Intervention | Post | Intervention group | Control group | |||||||
| Moore 1997 | A Randomized Trial of Office‐based Screening for common | Randomised Controlled Trial | USA | Community, general practice | Comprehensive health problem screening | Not stated in the text | patients >70yrs, English speaking, not acutely or terminally ill,able to answer questions visiting their physicians for a new visit or physical examination | 1.Ferequency of nutrition problems detection and 2.Intervention as a result of detection of nutrition problems | |||
| 112 | 149 | ||||||||||
| Jordan 2003 | Introducing a nutrition screening tool: an exploratory study in a district general hospital | Quasi experimental, Controlled before‐after study | UK | Hospital | Nutritional Screening | May 1999 | November 1999 | January 2000 | All patients admitted during study periods and able to give informed consent | 1.Nursing documentation, 2.patient care at mealtime and 3.referral to dietitian | |
| May:46 Jan:27 | May:64 Jan: 38 | ||||||||||
| Rypkema 2003 | Cost‐effectiveness of an interdisciplinary intervention in geriatric inpatients to prevent malnutrition | Prospective controlled trial plus a cost‐consequence study | Netherlands | Hospital | Nutritional Screening | 2001 | non‐terminally ill,60yr old inpatients of geriatric ward of two different hospitals who admitted for more than 2 and less than 150 days | 1.Lenght of stay, 2.Weight change, more than 3% 3.Weight loss, 4.Pressure sores, 5.Nosocomial infection 6.Total hospital cost per patient | |||
| 140 | 158 | ||||||||||