Monoterapia con ribavirina para la hepatitis C crónica
Resumen
Antecedentes
La hepatitis C es una causa importante de morbilidad relacionada con el hígado y mortalidad. Una alta proporción de pacientes nunca presenta síntomas. Peginterferón más ribavirina es el tratamiento recomendado para la hepatitis C crónica; sin embargo, se puede considerar la monoterapia con ribavirina en algunos pacientes.
Objetivos
Evaluar los efectos beneficiosos y perjudiciales de la monoterapia con ribavirina en pacientes con hepatitis C crónica.
Métodos de búsqueda
Los ensayos se identificaron mediante búsquedas en las bases de datos electrónicas, búsquedas manuales de bibliografías y revistas, autores de ensayos y compañías farmacéuticas hasta marzo de 2009.
Criterios de selección
Se incluyeron todos los ensayos aleatorizados independientemente del cegamiento, el idioma o el estado de publicación que compararon la ribavirina versus ninguna intervención, placebo o interferón para la hepatitis C crónica.
Obtención y análisis de los datos
Las principales medidas de resultado fueron la respuesta virológica sérica mantenida (eliminación del ARN del virus de la hepatitis C al menos seis meses después del tratamiento), la morbilidad relacionada con el hígado más la mortalidad por todas las causas y los eventos adversos. Las medidas de resultado secundarias fueron la respuesta virológica al final del tratamiento, la respuesta bioquímica (actividad de la transaminasa) y la respuesta histológica. Los métodos de asignación al azar, el cegamiento, el procesamiento de los datos y la financiación se extrajeron como medidas de control del sesgo. Se realizaron metanálisis con los modelos de efectos aleatorios y de efectos fijos para todos los resultados. Sólo se presentaron los resultados del modelo de efectos fijos si ambos modelos proporcionan el mismo resultado en cuanto a la significación estadística. Los datos se presentan como diferencia de riesgos (DR) con intervalos de confianza (IC) del 95%.
Resultados principales
Se incluyeron 14 ensayos aleatorizados con 657 pacientes. La mayoría de los ensayos no tuvieron un control claro del sesgo. En comparación con placebo o ninguna intervención, la ribavirina no tuvo un efecto significativo en la respuesta virológica mantenida (DR 0%; IC del 95%: ‐2% a 3%, cinco ensayos) o en la respuesta virológica al final del tratamiento (DR 0%; IC del 95%: ‐3% a 3%, diez ensayos). La ribavirina no tuvo un efecto significativo en la morbilidad relacionada con el hígado más la mortalidad (DR 0%; IC del 95%: ‐2% a 3%, 11 ensayos). La ribavirina aumentó considerablemente el riesgo de reacciones adversas, incluida la anemia. La ribavirina mejoró significativamente la respuesta bioquímica e histológica al final del tratamiento, pero no así la respuesta bioquímica mantenida. La ribavirina fue significativamente inferior al interferón con respecto a la respuesta virológica y bioquímica (cinco ensayos).
Conclusiones de los autores
La ribavirina parece no tener efectos beneficiosos en la respuesta virológica serológica ni en la morbilidad relacionada con el hígado o la mortalidad, y aumenta considerablemente el riesgo de reacciones adversas. La monoterapia con ribavirina parece ser significativamente inferior a la monoterapia con interferón. El número total de pacientes incluidos es pequeño y tal vez se necesiten más ensayos. El uso de la monoterapia con ribavirina para la hepatitis C crónica no se puede recomendar fuera de ensayos aleatorizados.
Resumen en términos sencillos
Tratamiento de pacientes infectados con el virus de la hepatitis C
A nivel mundial, alrededor de 170 000 000 de personas están infectadas de manera crónica con el virus de la hepatitis C. La hepatitis C es un virus que se transmite por la sangre y las vías de transmisión incluyen el uso de drogas por vía intravenosa, la transmisión de madre a hijo, las prácticas médicas inseguras, el comportamiento sexual de alto riesgo y la transfusión de sangre. La hepatitis C crónica es en la mayoría de los pacientes una infección viral benigna, pero una minoría de los pacientes desarrollan cirrosis hepática y pueden presentar complicaciones debido a la cirrosis o morir a causa de ella.
El tratamiento con interferón elimina el virus de la hepatitis C de la sangre en el 15% de los pacientes. Agregar ribavirina al interferón (tratamiento combinado) mejora significativamente el número que elimina la hepatitis C de la sangre a alrededor del 40%. No todos los pacientes toleran el interferón y además es costoso. Por este motivo, la ribavirina administrada como un único fármaco se puede considerar una opción para los pacientes con hepatitis C crónica. Esta revisión identificó 11 ensayos aleatorizados que compararon la ribavirina con ningún tratamiento antiviral en pacientes con hepatitis C crónica. La combinación de los resultados de todos los ensayos identificados de ribavirina sola no pareció tener efectos beneficiosos en los pacientes con hepatitis C crónica. Además, la ribavirina administrada sola fue significativamente inferior en comparación con el interferón con respecto a la eliminación de la hepatitis C de la sangre y a la reducción de la actividad de las enzimas hepáticas en la sangre. Además, la ribavirina administrada sola aumentó el riesgo de anemia. Por lo tanto, no se puede recomendar la ribavirina administrada sola, pero es posible que se necesiten más ensayos.
Authors' conclusions
Background
Description of the condition
Hepatitis C is a blood‐borne virus affecting about 170 million people worldwide (Consensus 2004). Routes of transmission include intravenous drug use, mother‐to‐infant transmission, unsafe medical practices, high‐risk sexual behavior, occupational exposure, blood transfusion, and infected donor organs (Alter 2002). In up to 40% of patients, however, no identifiable risk factor is found (McCarthy 2000). It is estimated that three to four million persons are newly infected each year. Acute hepatitis C is usually asymptomatic, but about 70% will develop chronic hepatitis (Seeff 1997). The majority of chronically infected patiens will never experience symptoms as the onset to cirrhosis stage is very protracted (Alter 1997; Hoofnagle 1997; Koretz 2000; Seeff 2002). The risk of developing cirrhosis probably depends on several factors, eg, age, sex, race, alcohol abuse, obesity, steatosis, transaminase activity, as well as coinfections (Lindsay 2002; Seeff 2002; Dienstag 2006). Once histological cirrhosis is established, hepatocellular carcinoma develops in 1% to 4% per year (Hoofnagle 1997; Poynard 1997).
Hepatitis C is an RNA virus of the Flaviviridae family. There are six hepatitis C genotypes including several subtypes, and it is characterised by the continuous emergence of virus variants (WHO 2000). Genotypes differ with geographic regions. Although the genotype does not predict the outcome of the infection, it does predict the treatment response to current antiviral therapy and accordingly influence the choice of treatment regimen (Hadziyannis 2004).
Description of the intervention
Therapy with interferon leads to sustained virological response in about 15% of patients with chronic hepatitis C and was the treatment of choice during the 1990s (Thevenot 1999; Myers 2002a). Due to the low number with sustained virological response, ribavirin was suggested as an alternative to interferon (Reichard 1990). Ribavirin is a broad spectrum nucleoside analogue with antiviral activity against a range of RNA viruses (Patterson 1990). However, subsequent small studies found no clear beneficial effect of ribavirin (Di Bisceglie 1995b; Dusheiko 1996), but adding ribavirin to interferons significantly increased the number with sustained virological response to about 40% (Kjaergard 2002; Brok 2005). Accordingly, combination therapy with ribavirin plus pegylated interferon is currently recommended (Consensus 2004; Dienstag 2006).
The primary observed serious adverse reactions to ribavirin is haemolytic anaemia, leukopenia, and skin reactions (Brok 2005). Ribavirin is teratogenic in some animals species and thus poses a theoretical reproductive risk in humans (Querenghi 2001). Ribavirin is administered orally as tablets or capsules. The dose of ribavirin is usually adjusted according to body weight and hepatitis C genotype.
How the intervention might work
Ribavirin significantly increases the sustained viral clearance when added to alfa‐interferon or pegylated interferon for the treatment of chronic hepatitis C (Brok 2005). The exact mechanism through which ribavirin produces its antiviral response in patients with chronic hepatitis C is unclear. Suggested mechanisms includes an immunomodulatory effect favouring an antiviral T‐helper cell‐1 cytokine, inhibition of inosine monophosphate dehydrogenase, or inhibition of HCV‐RNA dependent RNA polymerase, which both may inhibit viral replication, or that ribavirin is a a viral mutagen causing lethal mutagenesis (Lutchman 2007; De Clercq 2009).
Why it is important to do this review
Both ribavirin and interferon are expensive drugs and are associated with many adverse events, which often leads to dose reductions or treatment discontinuations (Brok 2005). Therefore, ribavirin monotherapy may represent an alternative for some patients. In our previous version of this review we found no clear beneficial effect of ribavirin (Brok 2003). This review updates our knowledge about ribavirin monotherapy for chronic hepatitis C.
Objectives
To assess the beneficial and harmful effects of ribavirin monotherapy for patients with chronic hepatitis C.
Methods
Criteria for considering studies for this review
Types of studies
Randomised trials were included irrespective of blinding, publication status, or language. Quasi‐randomised trials and observational studies were excluded.
Types of participants
We included patients with chronic hepatitis C. The diagnosis was based on presence of hepatitis C virus RNA plus elevated transaminases for more than six months or chronic hepatitis documented on liver biopsy. We also included patients diagnosed with 'non‐A, non‐B' chronic hepatitis as some trials may have been conducted before HCV‐RNA analyses were widely available. Based on previous antiviral treatment, the included patients were classified as naive (not previously treated), relapsers (patients with a transient response to previous treatment), or non‐responders (patients without response to previous treatment). We excluded patients who had human immune deficiency virus infection or had undergone liver transplantation.
Types of interventions
This review includes randomised comparisons of any dose or duration of
-
ribavirin versus no intervention or placebo;
-
ribavirin versus interferon.
Types of outcome measures
Primary outcome measures
-
Failure of serum (or plasma) sustained virological response: number of patients with detectable hepatitis C virus RNA at least six months after treatment;
-
Liver‐related morbidity plus all‐cause mortality: number of patients who developed cirrhosis, ascites, variceal haemorrhage, hepatic encephalopathy, hepatocellular carcinoma, or died;
-
All adverse events: number of patients with adverse events: number of patients with different types of adverse events, number of necessary dose reductions, and treatment discontinuations.
Secondary outcome measures
-
Failure of end of treatment virological response: number of patients with detectable hepatitis C virus RNA at the end of treatment;
-
Failure of sustained biochemical response (number of patients without normalisation of alanine aminotransferase (ALT) or aspartate transaminase (AST) six months or more after treatment);
-
Failure of end of treatment biochemical response (number of patients without normalisation of ALT or AST at the end of treatment);
-
Failure of histological response: number of patients without improvement of histology (inflammation score (grading) or fibrosis score (staging) as defined by the individual trials);
-
Quality of life.
Search methods for identification of studies
Electronic searches
As described in Appendix 1, we searched The Cochrane Hepato‐Biliary Group Controlled Trials Register (Gluud 2009), the Cochrane Central Register of Controlled Trials (CENTRAL) in The Cochrane Library, MEDLINE, EMBASE, and Science Citation index Expandeed (Royle 2003). We searched for ongoing clinical trials and unpublished trials on http://controlledtrials.gov, http://clinicaltrials.gov, and http://centerwatch.com. Searches were performed in March 2009.
Searching other resources
Trials were also identified through manual searches of bibliographies in relevant articles and through hand searches of conference proceedings. We also wrote to authors of included trials and pharmaceutical companies.
Data collection and analysis
Statistical methods
We performed the review and meta‐analyses following the recommendations of the Cochrane Handbook for Systematic Reviews of Interventions (Higgins 2008) and The Cochrane Hepato‐Biliary Group Module (Gluud 2009). The analyses were performed using Review Manager 5.0 and (RevMan 2008) and Trial Sequential Analysis version 0.8 (TSA 2008).
Selection of studies
We listed the identified trials, and JB and LLG evaluated whether the trials fulfilled the inclusion criteria. Disagreements were resolved by discussion together with CG. Excluded trials were listed with the reason for exclusion.
Data extraction and management
Data from all included trials were extracted by JB and LLG. Disagreements were resolved by discussion with CG. We wrote to the principal investigator of included trials to ask for data that were not presented in the published reports. From each trial we extracted the virological response to previous antiviral therapy, mean age, proportion of men, proportion of patients with cirrhosis, proportion of patients with hepatitis C virus genotype 1, limit of detectable HCV‐RNA, dose and duration of ribavirin and interferon therapy, type of interferon, bias risk components, funding, publication status, duration of follow‐up, and all outcome measures.
Assessment of risk of bias in included studies
We assessed the components below to estimate the risk of bias (Als‐Nielsen 2004; Higgins 2008; Wood 2008; Gluud 2009).
Sequence generation
‐ Adequate, sequence generation was achieved using computer random number generation or a random number table. Drawing of lots, tossing a coin, shuffling cards and throwing dice were considered as adequate if performed by an independent adjudicator.
‐ Unclear, the trial was described as randomised but the method of sequence generation was not specified.
‐ Inadequate allocation sequence generation using dates, names, or admittance numbers (quasi‐randomised trials) were excluded from the present review.
Allocation concealment
‐ Adequate, allocation concealment through a central and independent unit, sealed envelopes, or similar.
‐ Unclear, the trial was described as randomised but the method used to conceal the allocation was not described.
‐ Inadequate allocation sequence was known to the investigators who assigned participants through use of an open table of random numbers or similar or the study was quasi‐randomised as explained above.
Blinding
‐ Adequate, double blinding was achieved using identical placebo or active treatments. We classified trials that used the word 'placebo' as adequate even though it was not specified that placebo had same smell, appearance, taste, etc.
‐ Unclear, the trial was described as double blind, but the method of blinding was not described.
‐ Inadequate, the trial was not double blind.
Baseline imbalance
‐ Adequate, if there was no baseline imbalance in important characteristics.
‐ Unclear, if the baseline characteristics were not reported.
‐ Inadequate if there was a baseline imbalance due to chance or due to imbalanced exclusion after randomisation.
Early stopping
‐ Adequate, if sample size calculation was reported and the trial was not stopped, or the trial was stopped early by formal stopping rules at a point where the likelihood of observing an extreme intervention effect due to chance was low.
‐ Unclear, if sample size calculation was not reported and it is not clear whether the trial was stopped early or not.
‐ Inadequate, if the trial was stopped early due to informal stopping rules.
Incomplete reporting of outcome data
‐ Adequate the numbers and reasons for dropouts and withdrawals in all intervention groups were described or if it was specified that there were no dropouts or withdrawals.
‐ Unclear, the report gave the impression that there had been no dropouts or withdrawals, but this was not specifically stated.
‐ Inadequate, the number or reasons for dropouts and withdrawals were not described.
Selective outcome reporting
‐ Adequate, if the trial protocol is available and all of the trial's pre‐specified outcomes that are of interest in the review have been reported or similar.
‐ Unclear, there is insufficient information to assess whether the magnitude and direction of the observed effect is related to selective outcome reporting.
‐ Inadequate, not all of the trial's pre‐specified primary outcomes have been reported or relevant outcomes are omitted.
Source of funding bias
‐ Adequate, the trial's source(s) of funding did not come from any parties that might had conflicting interest (eg, a drug or a device manufacturer).
‐ Unclear, uncertain risk of bias if the source of funding was not clear.
‐ Inadequate, high risk of bias if the trial was funded by a drug or a device manufacturer.
Funnel plot were also applied to assess bias and publication bias (Egger 1997)
Measures of treatment effect
Data were analysed by both a random‐effects model (DerSimonian 1986) and a fixed‐effect model (DeMets 1987). We only present the results of the fixed‐effect model if both models provide the same result regarding statistical significance. We present data with risk difference (RD) and 95% confidence intervals (CI) due to the large number of trials with zero events. Such analyses may, however, provide too narrow CI (Brok 2003; Keus 2009).
Dealing with missing data
We analysed data by intention to treat including all patients irrespective of compliance or follow‐up. Because many patients relapse after the end of therapy, patients lost to follow‐up were counted as non‐responders. A large number of patients did not have post treatment liver biopsies. An additional per protocol sensitivity analysis of histological response was, therefore, performed.
Assessment of heterogeneity
Heterogeneity was explored by chi‐squared test with significance set at P‐value less than 0.10, and the quantity of heterogeneity was measured by I2 (Higgins 2008). We assessed sources of heterogeneity in random‐effects meta‐regression analyses for our primary outcome if the meta‐analysis included at least 10 trials. These analyses included all the extracted patient, intervention, and trial characteristics.
Sensitivity analysis
We performed sensitivity analyses excluding trials with patients diagnosed with 'non‐A, non‐B' chronic hepatitis.
Trial sequential analysis
We performed trial sequential analysis for sustained virological response with a maximum type I error of 5% and type II error of 20% (80% power) (Brok 2008; Wetterslev 2008; Thorlund 2009). We assumed event proportion of 97% without serum sustained virological response in the placebo or no intervention group (Myers 2002a). Because ribavirin is associated with adverse events, is expensive, and the duration of treatment is long, we considered that the minimally clinically relevant number needed to treat to obtain a beneficial effect (NNT = 1/RD) should be relatively low. Thus, we calculated the required information size, ie, number of patients in the meta‐analysis to detect or reject the estimated NNT, using an event proportion of 87% (NNT to obtain a beneficial effect = 10 patients) or 92% (NNT to obtain a beneficial effect = 50 patients) without serum sustained virological response in the ribavirin group.
Results
Description of studies
Results of search
We identified 2409 references through the electronic searches of The Cochrane Hepato‐Biliary Group Controlled Trials Register (n = 564), the Cochrane Central Register of Controlled Trials in The Cochrane Library (n = 676), MEDLINE (n = 637), EMBASE (n = 1102), and Science Citation Index Expanded (n = 1302). Of these references, we excluded clearly irrelevant references, non‐randomised studies, and duplicates. Accordingly, this review includes data from 14 randomised trials described in 24 references. Thirteen trials were published as full papers and one trial in abstract form. Searching clinical trial databases did not reveal any further trials.
Type of participants
The mean age of the included patients was reported in 12 trials (median 45 years; range 38 to 50 years). The proportion of men was reported in 12 trials (median 74%; range 63% to 100%). The proportion of patients with histological or clinical cirrhosis was reported in six trials (median 15%; range 0% to 35%). The proportion of patients with hepatitis C virus genotype 1 was reported in eight trials (median 73%; range 40% to 97%). Four trials included treatment naive patients (Chemello 1995; Felipe 2000; Stanimirovic 2002; Pawlotsky 2004). Three trials included non‐responders (Sostegni 1998; Hoofnagle 2003; Veldt 2003), three trials included naive, relapsers, and non‐responders (Dusheiko 1996; Bodenheimer 1997; Khakoo 1998), and four trials did not report previous antiviral treatment (Buti 1991; Kakumu 1993b; Di Bisceglie 1995; Gonzalez‐Peralt 1997).
One trial (Buti 1991) was conducted before HCV‐RNA analyses were widely available. These patients were diagnosed as chronic 'non‐A, non‐B' chronic hepatitis.
Type of interventions
In nine trials (Buti 1991; Di Bisceglie 1995; Dusheiko 1996; Bodenheimer 1997; Gonzalez‐Peralt 1997; Felipe 2000; Stanimirovic 2002; Hoofnagle 2003; Veldt 2003) patients were randomised to ribavirin versus placebo or no intervention. In two trials (Kakumu 1993b; Pawlotsky 2004), patients were randomised to ribavirin versus interferon or no intervention. In three trials (Chemello 1995; Khakoo 1998; Sostegni 1998) patients were randomised to ribavirin versus interferon.
The dose of ribavirin was 1200 mg/day in five trials (Buti 1991; Di Bisceglie 1995; Bodenheimer 1997; Khakoo 1998; Stanimirovic 2002), 1000 mg/day or 1200 mg/day (according to weight) in four trials (Dusheiko 1996; Hoofnagle 2003; Veldt 2003; Pawlotsky 2004), 800 mg/day to 1000 mg/day in three trials (Kakumu 1993b; Sostegni 1998; Felipe 2000), 15 mg/kg/day in one trial (Chemello 1995), and not reported in one trial (Gonzalez‐Peralt 1997). The median duration of therapy was 25 weeks (range 6 to 48 weeks).
The dose of interferon was 3 million units thrice weekly in four trials (Kakumu 1993b; Chemello 1995; Khakoo 1998; Sostegni 1998; Veldt 2003; Pawlotsky 2004) and not reported in one trial (Gonzalez‐Peralt 1997). The median duration of therapy was 20 weeks (range 6 to 26 weeks). The type of interferon was interferon‐alfa‐2b in three trials (Khakoo 1998; Veldt 2003; Pawlotsky 2004), interferon‐beta in one trial (Kakumu 1993b), leukocyte interferon‐alfa in two trials (Chemello 1995; Sostegni 1998), and not reported in one trial (Gonzalez‐Peralt 1997).
Risk of bias in included studies
The majority of trials had inadequate or unclear control of bias (Figure 1). Nine trials (64%) used placebo, but only three trials (21%) reported adequate randomisation methods. Only one trial protocol was available in order to assess selective outcome reporting, but most of the trials reported data for the relevant primary outcomes. Six trials (43%) reported the number and reasons for drop‐outs, and in three trials (21%) a sample size calculation was reported and the trials were not stopped before reaching the sample size. Six trials (43%) were fully or partly supported by the for‐profit manufacturers. We did not identify other forms of potential bias in any of the included trials (Figure 2).

Methodological quality graph: review authors' judgements about each methodological quality item presented as percentages across all included trials.
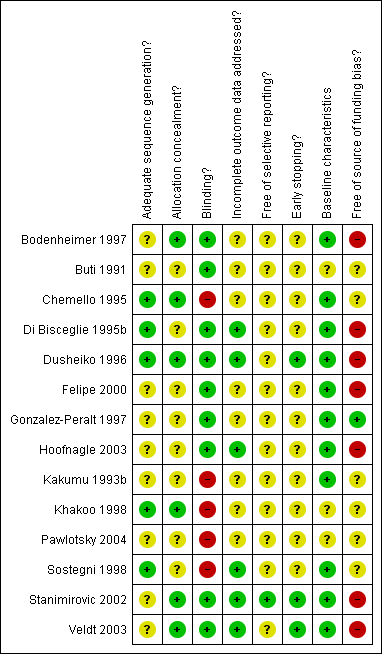
Methodological quality summary: review authors' judgements about each methodological quality item for each included study.
Effects of interventions
Ribavirin versus placebo or no intervention
Compared with placebo or no intervention, ribavirin had no significant effect on the sustained virological response (risk difference (RD) 0%; 95% CI ‐2% to 3% five trials) or the end of treatment virological response (RD 0%; 95% CI ‐3% to 3%, ten trials). One patient died due to liver cirrhosis and one due to meningitis (autopsy also showed hepatocellular carcinoma) in the ribavirin group. One patient in the placebo group had acute variceal haemorrhage. We found no significant difference in liver morbidity plus all‐cause mortality (RD 3% 95% CI ‐3% to 3%, 11 trials). Ribavirin significantly increased the risk of anaemia (RD 16%; 95% CI 11% to 25%, seven trials), treatment discontinuations (RD 5%; 95% CI 1% to 10%; six trials), and dose reduction (RD 11%; 95% CI 6% to 16%; six trials).
Ribavirin had a significant beneficial effect on the end of treatment biochemical response (RD ‐23%; 95% CI ‐29% to ‐17%, ten trials), but not on the sustained biochemical response (RR 0%; 95% CI ‐5% to 6%, five trials). Ribavirin had a significant beneficial effect on liver histology score including both inflammation and fibrosis assessment (RD ‐14%; 95% CI ‐25% to ‐2%, three trials). All post‐treatment biopsies were performed between 6 to 12 months after end of treatment. Post‐hoc analyses including only trials with pre‐treatment histological verification of chronic hepatitis found the same overall results. One trial assessed quality of life by using a fatigue score but found no statistically significant effect of ribavirin.
Trial sequential analysis rejects a number needed to treat of 10 patients (or fewer) for ribavirin compared with placebo or no intervention regarding sustained virological response (Figure 3). Trial sequential analysis cannot reject (or detect) a number needed to treat of 50 patients for sustained virological response. An additional 2661 patients randomised to ribavirin versus placebo are needed to rule out such effect size (Figure 4).

Trial sequential analysis illustrating that the cumulative Z‐curve (blue) has not crossed the monitoring boundary (red) but have surpassed the information size (n = 232) needed to detect of reject an effect size corresponding to a number needed to treat of 10 patient (or fewer) for ribavirin. Thus we can rule out a number needed to treat of 10 patients (or fewer) for ribavirin regarding sustained virological response.
Trial sequential analysis was performed with a type I error of 5% and type II error of 20% (80% power). We assumed a baseline event rate of 97% without sustained virological response in the placebo/no intervention group. We used an event rate of 87% (number needed to treat = 10 patients) without sustained virological response in the ribavirin group.

Trial sequential analysis illustrating that the cumulative Z‐curve (blue) has not crossed the monitoring boundary (red) nor reached the information size (n = 3014) needed to detect of reject an effect size corresponding to a number needed to treat of 50 (or fewer) for ribavirin. Thus we can not rule out a number needed to treat of 50 (or fewer) for ribavirin regarding sustained virological response. Additionally 2661 (3014 ‐ 353) patients are needed to detect or reject this effect size.
Trial sequential analysis was performed with a type I error of 5% and type II error of 20% (80% power). We assumed a baseline event rate of 97% for sustained virological response in the placebo/no intervention group. We used an event rate of 95% (number needed to treat = 50) without sustained virological response in the ribavirin group.
Ribavirin versus interferon
Compared with ribavirin, interferon significantly increased the number of patients with an end of treatment virological response (RD 17%; 95% CI 7% to 27%, five trials), but not the number with sustained virological response (RD 13%; 95% CI ‐4% to 29%, two trials). No liver‐related morbidity or mortality was reported in any trial. Compared with ribavirin, interferon increased the number with end of treatment and sustained biochemical responses. We found no significant difference in adverse events or treatment discontinuations between ribavirin and interferon. None of the trials reported histological response or quality of life.
Sensitivity analyses
Due to the limited number of data on our primary outcome 'sustained virological response', we were unable to perform any of the planned sensitivity analyses or funnel plot analyses.
Discussion
In this systematic review of 14 randomised trials with 657 patients, we found no significant beneficial effect of ribavirin monotherapy on virological response or liver morbidity, but ribavirin may transiently improve biochemical and histological responses. Ribavirin significantly increased the risk of anaemia. Trial sequential analysis found that we could rule out a benefit equalling a number needed to treat to obtain benefit of 10 patients (or fewer) for ribavirin regarding virological response. However, we are unable to rule out that ribavirin could leave a small but clinically relevant effect. Furthermore, compared with interferon monotherapy, ribavirin seemed significantly inferior regarding virological and biochemical responses.
In this review we tried to minimise publication and ascertainment bias by including trials regardless of publication status and language. Furthermore, all data were abstracted independently by two authors to avoid information bias. The main limitations of this review are the low number of patients, lack of clinical outcomes due to short‐term follow‐up, and the risk of bias in many of the included trials. A study demonstrated that in meta‐analyses with 500 patients, the pooled relative risk may change 0.6 to 1.7 fold in the immediate future (Ioannidis 2000). Accordingly, this review does not preclude the possibility of a beneficial effect of ribavirin monotherapy. However, our trial sequential analyses indicated that the benefits, if any, are small.
We assessed our outcomes with risk differences as this method offers the advantage of including trials with zero events. Furthermore, the risk difference can be used for calculating the number needed to treat. Risk difference results may overestimate the precision of the meta‐analyses as this method results in spuriously narrow confidence intervals (Keus 2009). Use of relative risk and different handling of zero event trials has, however, not changed the overall results.
The majority of the trials excluded patients with alcohol or intravenous drug abuse, human immune deficiency virus, and hepatitis B. Many patients with hepatitis C have these diseases (Alter 2002). Therefore, the average patient included in this review is not likely to be representative of the average patient with chronic hepatitis C in clinical practice. Furthermore, no trials specifically included patients intolerant to interferon. Such patients are those likely to be considered for ribavirin monotherapy. Thus, it may be difficult to transfer the results of this review to the subset of these hepatitis C patients.
We assessed 11 trials on ribavirin monotherapy versus placebo or no intervention for chronic hepatitis C that included both naive, relapsers, and non‐responders to previous antiviral treatment. The dose of ribavirin was relatively consistent (800 mg/day to 1200 mg/day), but the duration of therapy varied between 8 weeks to 52 weeks. We found no significant beneficial effect of ribavirin on liver‐related morbidity plus all‐cause mortality, and that only 1 out of 200 patients treated with ribavirin had sustained virological response. Most patients had genotype 1 (73%), which is considered the most difficult to treat. Ribavirin monotherapy may be beneficial in other genotypes (eg, 2 and 3) (Howaizi 2009). Conversely, ribavirin improved biochemical response after end of treatment, but sparse data showed no significant effect on sustained biochemical response. More data are needed to evaluate whether this beneficial effect is transient or sustained. However, biochemical response is a putative surrogate outcome and the clinical importance might be limited (Gluud 2007).
We found that ribavirin had a significant beneficial effect on liver histology. However, we were not able to assess liver inflammation or fibrosis individually and our histology analyses combine both inflammation and fibrosis scores. A weakness of this outcome is that liver biopsies have important technical limitations and histology assessments may have weak inter‐ and intraobserver reproducibility (Marcellin 2002). The short‐term histological results seem encouraging but are not supported by long‐term histological results or clinical benefits.
Ribavirin may be teratogenic (Ferm 1978), and it causes haemolytic anaemia (Maddrey 1999). Therefore, patients were required to practice birth control, and patients with cardiovascular disease or low level of haemoglobin were excluded. A total of 20% of patients treated with ribavirin experienced anaemia. Severe anaemia may be reduced with epoetin alfa (Dieterich 2003) or by replacing ribavirin with a prodrug, viramidine (Benhamou 2007). However, warnings that epoetin alfa may induce pure red blood cell aplasia have recently been published (Amgen 2009; Pollock 2008). Due to anaemia and other adverse events, about 10% had to discontinue ribavirin monotherapy. Few data on other adverse events related to ribavirin were reported. However, ribavirin added to interferon increase the risk of several dermatological, gastrointestinal, haematological, and miscellaneous adverse reactions (Brok 2005).
Two randomised trials observed that continued ribavirin failed to improve sustained virological response in patients who initially responded to combination therapy with interferon plus ribavirin (Shiffman 2001; Nagayama 2005). Pooling these data in a meta‐analysis confirm these conclusions (RR 0.97; 95% CI 0.66 to 1.44). Furthermore, retrospective studies of larger patients cohorts receiving ribavirin indicated limited changes in HCV viraemia (Zoulim 1998). These results support our finding that ribavirin seems without beneficial effects on virological response.
Sustained virological response is considered the target for chronic hepatitis treatment, but it is only a putative surrogate outcome (Gluud 2007; Koretz 2009). Virological response is attractive to use because analysing treatment effects on clinical outcomes are impeded by the protracted course of the hepatitis C infection. Epidemiological studies (eg, comparing morbidity in patients with and without viral clearance) have shown a correlation between sustained virological response and liver‐related morbidity (Chander 2002). Unfortunately, this correlation may be biased and has not been validated for any specific intervention in randomised trials (Gluud 2007; Koretz 2009). We, therefore, risk that ribavirin causes no response on virological parameters but may still have effect (harmful of beneficial) on clinical outcomes.
Five trials including 151 patients compared ribavirin versus interferon. Compared to ribavirin monotherapy, interferon monotherapy increased the number with virological and biochemical response. Knowing the beneficial effects of interferon monotherapy on viral clearance (Myers 2002a; Myers 2002b), interferon should be first choice between the two.
Currently, the treatment of choice for chronic hepatitis C is a combination therapy with ribavirin plus pegylated interferon (Chander 2002; Consensus 2004; Simin 2007). The beneficial effect of adding ribavirin to interferon is not fully understood (De Clercq 2009) and may theoretically be due to the following scenarios. Ribavirin has its own beneficial effect on the course of hepatitis C. This possibility seems to be contradicted by our present findings. Ribavirin has a beneficial effect on patients who do not respond to interferon. This also seems contradicted by our findings in non‐responders and relapsers to previous interferon therapy. Alternatively, ribavirin may potentiate some of the effect of interferon (Myers 2002a; Myers 2002b) or vice versa which currently seems the most plausible mechanism.
Methodological quality graph: review authors' judgements about each methodological quality item presented as percentages across all included trials.
Methodological quality summary: review authors' judgements about each methodological quality item for each included study.
Trial sequential analysis illustrating that the cumulative Z‐curve (blue) has not crossed the monitoring boundary (red) but have surpassed the information size (n = 232) needed to detect of reject an effect size corresponding to a number needed to treat of 10 patient (or fewer) for ribavirin. Thus we can rule out a number needed to treat of 10 patients (or fewer) for ribavirin regarding sustained virological response.
Trial sequential analysis was performed with a type I error of 5% and type II error of 20% (80% power). We assumed a baseline event rate of 97% without sustained virological response in the placebo/no intervention group. We used an event rate of 87% (number needed to treat = 10 patients) without sustained virological response in the ribavirin group.
Trial sequential analysis illustrating that the cumulative Z‐curve (blue) has not crossed the monitoring boundary (red) nor reached the information size (n = 3014) needed to detect of reject an effect size corresponding to a number needed to treat of 50 (or fewer) for ribavirin. Thus we can not rule out a number needed to treat of 50 (or fewer) for ribavirin regarding sustained virological response. Additionally 2661 (3014 ‐ 353) patients are needed to detect or reject this effect size.
Trial sequential analysis was performed with a type I error of 5% and type II error of 20% (80% power). We assumed a baseline event rate of 97% for sustained virological response in the placebo/no intervention group. We used an event rate of 95% (number needed to treat = 50) without sustained virological response in the ribavirin group.
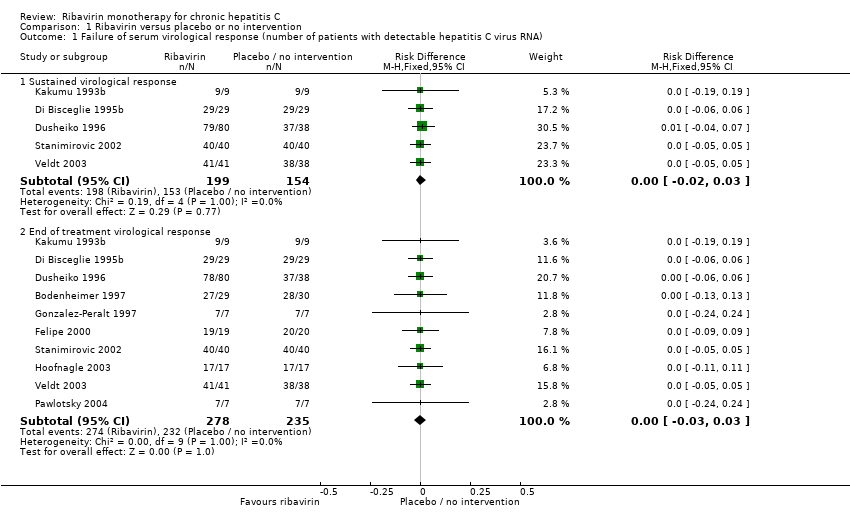
Comparison 1 Ribavirin versus placebo or no intervention, Outcome 1 Failure of serum virological response (number of patients with detectable hepatitis C virus RNA).

Comparison 1 Ribavirin versus placebo or no intervention, Outcome 2 Liver‐related morbidity and all‐cause mortality.
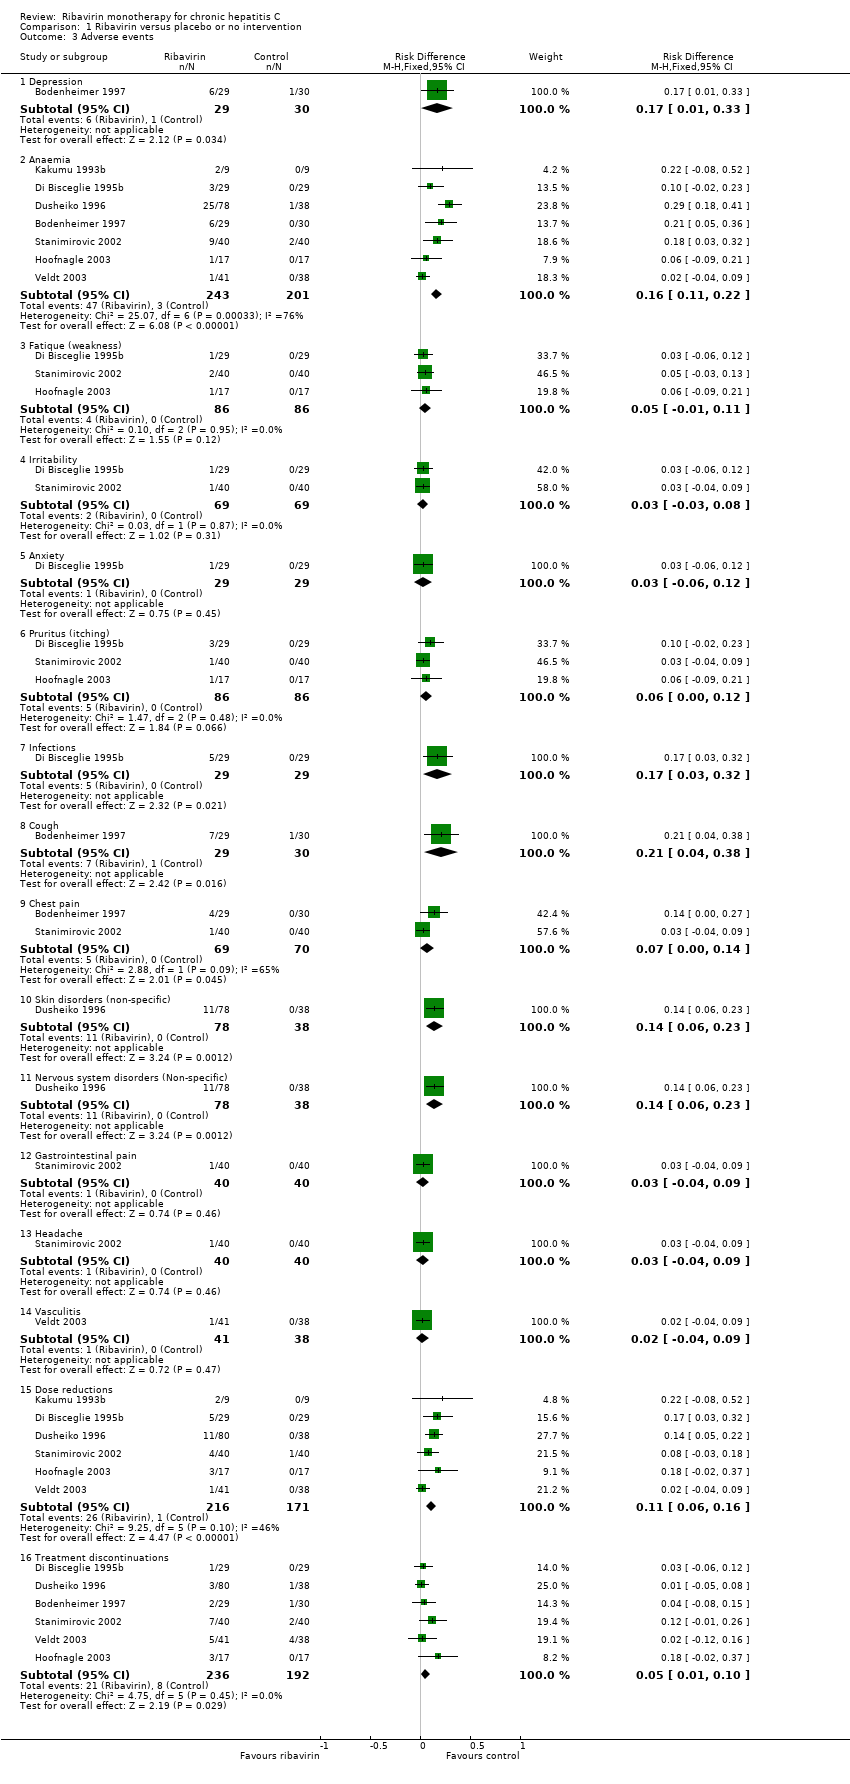
Comparison 1 Ribavirin versus placebo or no intervention, Outcome 3 Adverse events.

Comparison 1 Ribavirin versus placebo or no intervention, Outcome 4 Failure of biochemical response (number of patients with elevated transaminase).

Comparison 1 Ribavirin versus placebo or no intervention, Outcome 5 Failure of histologic response (number of patients without improvement in liver histology).

Comparison 1 Ribavirin versus placebo or no intervention, Outcome 6 Quality of life.

Comparison 2 Ribavirin versus interferon, Outcome 1 Failure of serum virological response (number of patients with detectable hepatitis C virus RNA).

Comparison 2 Ribavirin versus interferon, Outcome 2 Liver‐related and all‐cause morbidity and mortality.
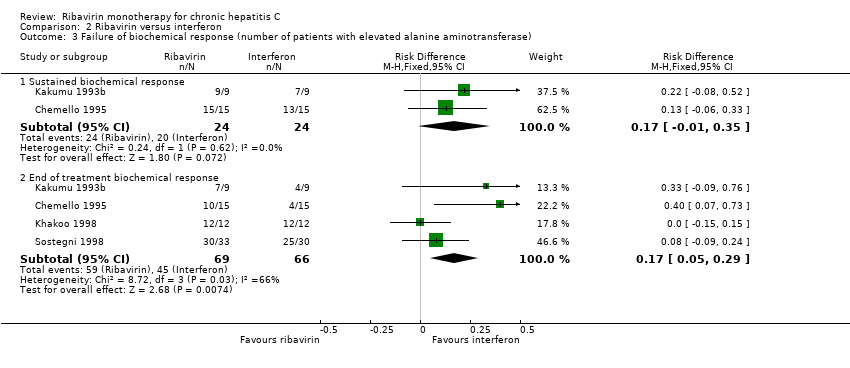
Comparison 2 Ribavirin versus interferon, Outcome 3 Failure of biochemical response (number of patients with elevated alanine aminotransferase).

Comparison 2 Ribavirin versus interferon, Outcome 4 Adverse events.
| Outcome or subgroup title | No. of studies | No. of participants | Statistical method | Effect size |
| 1 Failure of serum virological response (number of patients with detectable hepatitis C virus RNA) Show forest plot | 10 | Risk Difference (M‐H, Fixed, 95% CI) | Subtotals only | |
| 1.1 Sustained virological response | 5 | 353 | Risk Difference (M‐H, Fixed, 95% CI) | 0.00 [‐0.02, 0.03] |
| 1.2 End of treatment virological response | 10 | 513 | Risk Difference (M‐H, Fixed, 95% CI) | ‐ [‐0.03, 0.03] |
| 2 Liver‐related morbidity and all‐cause mortality Show forest plot | 11 | 521 | Risk Difference (M‐H, Fixed, 95% CI) | 0.00 [‐0.02, 0.03] |
| 3 Adverse events Show forest plot | 7 | Risk Difference (M‐H, Fixed, 95% CI) | Subtotals only | |
| 3.1 Depression | 1 | 59 | Risk Difference (M‐H, Fixed, 95% CI) | 0.17 [0.01, 0.33] |
| 3.2 Anaemia | 7 | 444 | Risk Difference (M‐H, Fixed, 95% CI) | 0.16 [0.11, 0.22] |
| 3.3 Fatique (weakness) | 3 | 172 | Risk Difference (M‐H, Fixed, 95% CI) | 0.05 [‐0.01, 0.11] |
| 3.4 Irritability | 2 | 138 | Risk Difference (M‐H, Fixed, 95% CI) | 0.03 [‐0.03, 0.08] |
| 3.5 Anxiety | 1 | 58 | Risk Difference (M‐H, Fixed, 95% CI) | 0.03 [‐0.06, 0.12] |
| 3.6 Pruritus (itching) | 3 | 172 | Risk Difference (M‐H, Fixed, 95% CI) | 0.06 [‐0.00, 0.12] |
| 3.7 Infections | 1 | 58 | Risk Difference (M‐H, Fixed, 95% CI) | 0.17 [0.03, 0.32] |
| 3.8 Cough | 1 | 59 | Risk Difference (M‐H, Fixed, 95% CI) | 0.21 [0.04, 0.38] |
| 3.9 Chest pain | 2 | 139 | Risk Difference (M‐H, Fixed, 95% CI) | 0.07 [0.00, 0.14] |
| 3.10 Skin disorders (non‐specific) | 1 | 116 | Risk Difference (M‐H, Fixed, 95% CI) | 0.14 [0.06, 0.23] |
| 3.11 Nervous system disorders (Non‐specific) | 1 | 116 | Risk Difference (M‐H, Fixed, 95% CI) | 0.14 [0.06, 0.23] |
| 3.12 Gastrointestinal pain | 1 | 80 | Risk Difference (M‐H, Fixed, 95% CI) | 0.03 [‐0.04, 0.09] |
| 3.13 Headache | 1 | 80 | Risk Difference (M‐H, Fixed, 95% CI) | 0.03 [‐0.04, 0.09] |
| 3.14 Vasculitis | 1 | 79 | Risk Difference (M‐H, Fixed, 95% CI) | 0.02 [‐0.04, 0.09] |
| 3.15 Dose reductions | 6 | 387 | Risk Difference (M‐H, Fixed, 95% CI) | 0.11 [0.06, 0.16] |
| 3.16 Treatment discontinuations | 6 | 428 | Risk Difference (M‐H, Fixed, 95% CI) | 0.05 [0.01, 0.10] |
| 4 Failure of biochemical response (number of patients with elevated transaminase) Show forest plot | 10 | Risk Difference (M‐H, Fixed, 95% CI) | Subtotals only | |
| 4.1 Sustained biochemical response | 5 | 294 | Risk Difference (M‐H, Fixed, 95% CI) | 0.00 [‐0.05, 0.06] |
| 4.2 End of treatment biochemical response | 10 | 509 | Risk Difference (M‐H, Fixed, 95% CI) | ‐0.23 [‐0.29, ‐0.17] |
| 5 Failure of histologic response (number of patients without improvement in liver histology) Show forest plot | 3 | Risk Difference (M‐H, Fixed, 95% CI) | Subtotals only | |
| 5.1 Combined necro‐inflammatory and fibrosis score (Intention to treat) | 3 | 211 | Risk Difference (M‐H, Fixed, 95% CI) | ‐0.14 [‐0.25, ‐0.02] |
| 5.2 Combined necro‐inflammatory and fibrosis score (Per protocol) | 3 | 156 | Risk Difference (M‐H, Fixed, 95% CI) | ‐0.20 [‐0.35, ‐0.06] |
| 6 Quality of life Show forest plot | 1 | Risk Difference (M‐H, Fixed, 95% CI) | Subtotals only | |
| 6.1 Improvement of fatigue at end of treatment | 1 | 59 | Risk Difference (M‐H, Fixed, 95% CI) | ‐0.11 [‐0.27, 0.06] |
| Outcome or subgroup title | No. of studies | No. of participants | Statistical method | Effect size |
| 1 Failure of serum virological response (number of patients with detectable hepatitis C virus RNA) Show forest plot | 5 | Risk Difference (M‐H, Fixed, 95% CI) | Subtotals only | |
| 1.1 Sustained virological response | 2 | 48 | Risk Difference (M‐H, Fixed, 95% CI) | 0.13 [‐0.04, 0.29] |
| 1.2 End of treatment virological response | 5 | 151 | Risk Difference (M‐H, Fixed, 95% CI) | 0.17 [0.07, 0.27] |
| 2 Liver‐related and all‐cause morbidity and mortality Show forest plot | 5 | 151 | Risk Difference (M‐H, Fixed, 95% CI) | 0.0 [‐0.06, 0.06] |
| 3 Failure of biochemical response (number of patients with elevated alanine aminotransferase) Show forest plot | 4 | Risk Difference (M‐H, Fixed, 95% CI) | Subtotals only | |
| 3.1 Sustained biochemical response | 2 | 48 | Risk Difference (M‐H, Fixed, 95% CI) | 0.17 [‐0.01, 0.35] |
| 3.2 End of treatment biochemical response | 4 | 135 | Risk Difference (M‐H, Fixed, 95% CI) | 0.17 [0.05, 0.29] |
| 4 Adverse events Show forest plot | 4 | Risk Difference (M‐H, Fixed, 95% CI) | Subtotals only | |
| 4.1 Flu‐like syndrome (non‐specific) | 1 | 30 | Risk Difference (M‐H, Fixed, 95% CI) | ‐0.2 [‐0.42, 0.02] |
| 4.2 Weight loss | 1 | 30 | Risk Difference (M‐H, Fixed, 95% CI) | 0.0 [‐0.18, 0.18] |
| 4.3 Fatique/Weakness | 2 | 54 | Risk Difference (M‐H, Fixed, 95% CI) | 0.11 [‐0.09, 0.31] |
| 4.4 Irritability | 2 | 93 | Risk Difference (M‐H, Fixed, 95% CI) | ‐0.00 [‐0.12, 0.11] |
| 4.5 Abdominal pain | 2 | 93 | Risk Difference (M‐H, Fixed, 95% CI) | 0.13 [0.03, 0.23] |
| 4.6 Diarrhea | 1 | 30 | Risk Difference (M‐H, Fixed, 95% CI) | 0.13 [‐0.06, 0.33] |
| 4.7 Pruritus | 2 | 93 | Risk Difference (M‐H, Fixed, 95% CI) | 0.06 [‐0.03, 0.15] |
| 4.8 Herpes labialis | 1 | 30 | Risk Difference (M‐H, Fixed, 95% CI) | 0.13 [‐0.11, 0.37] |
| 4.9 Anaemia | 2 | 93 | Risk Difference (M‐H, Fixed, 95% CI) | 0.09 [‐0.01, 0.18] |
| 4.10 Headache | 1 | 24 | Risk Difference (M‐H, Fixed, 95% CI) | ‐0.17 [‐0.51, 0.17] |
| 4.11 Pharyngitis | 1 | 24 | Risk Difference (M‐H, Fixed, 95% CI) | 0.08 [‐0.12, 0.29] |
| 4.12 Viral infections | 1 | 24 | Risk Difference (M‐H, Fixed, 95% CI) | 0.08 [‐0.12, 0.29] |
| 4.13 Myalgia | 1 | 24 | Risk Difference (M‐H, Fixed, 95% CI) | ‐0.08 [‐0.29, 0.12] |
| 4.14 Dose reductions | 3 | 72 | Risk Difference (M‐H, Fixed, 95% CI) | 0.08 [‐0.04, 0.21] |
| 4.15 Treatment discontinuations | 3 | 117 | Risk Difference (M‐H, Fixed, 95% CI) | 0.01 [‐0.09, 0.11] |