Scolaris Content Display Scolaris Content Display

Study flow diagram.
Figuras y tablas -
Figure 1

Study flow diagram.

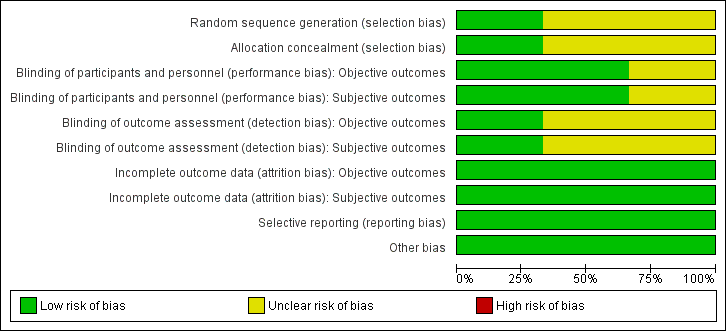
'Risk of bias' graph: review authors' judgements about each risk of bias item presented as percentages across all included studies.
Figuras y tablas -
Figure 2

'Risk of bias' graph: review authors' judgements about each risk of bias item presented as percentages across all included studies.

'Risk of bias' summary: review authors' judgements about each risk of bias item for each included study.
Figuras y tablas -
Figure 3

'Risk of bias' summary: review authors' judgements about each risk of bias item for each included study.

Comparison 1 Zinc supplementation versus placebo, Outcome 1 HOMA‐IR.
Figuras y tablas -
Analysis 1.1

Comparison 1 Zinc supplementation versus placebo, Outcome 1 HOMA‐IR.

Comparison 1 Zinc supplementation versus placebo, Outcome 2 Lipids.
Figuras y tablas -
Analysis 1.2

Comparison 1 Zinc supplementation versus placebo, Outcome 2 Lipids.

Comparison 2 Zinc supplementation versus exercise, Outcome 1 HOMA‐IR.
Figuras y tablas -
Analysis 2.1

Comparison 2 Zinc supplementation versus exercise, Outcome 1 HOMA‐IR.

Comparison 2 Zinc supplementation versus exercise, Outcome 2 Lipids.
Figuras y tablas -
Analysis 2.2

Comparison 2 Zinc supplementation versus exercise, Outcome 2 Lipids.

Zinc supplementation for the prevention of type 2 diabetes mellitus

Population: non‐diabetic adults with insulin resistance

Settings: not specified/outpatients

Intervention: zinc supplementation

Comparison: placebo or exercise

Outcomes

Illustrative comparative risks* (95% CI)

Relative effect
(95% CI)

No of participants
(studies)

Quality of the evidence
(GRADE)

Comments

Assumed risk

Corresponding risk

Placebo or exercise

Zinc supplementation

Incidence of type 2 diabetes mellitus

See comment

See comment

See comment

See comment

See comment

Outcome not reported

Diabetic complications

See comment

See comment

See comment

See comment

See comment

Outcome not reported

Adverse events

See comment

See comment

See comment

See comment

See comment

Outcome not reported

Health‐related quality of life

See comment

See comment

See comment

See comment

See comment

Outcome not reported

All‐cause mortality

See comment

See comment

See comment

See comment

See comment

Outcome not reported

Socioeconomic effects

See comment

See comment

See comment

See comment

See comment

Outcome not reported

*The basis for the assumed risk (e.g. the median control group risk across studies) is provided in footnotes. The corresponding risk (and its 95% confidence interval) is based on the assumed risk in the comparison group and the relative effect of the intervention (and its 95% CI).
CI: confidence interval

GRADE Working Group grades of evidence
High quality: Further research is very unlikely to change our confidence in the estimate of effect.
Moderate quality: Further research is likely to have an important impact on our confidence in the estimate of effect and may change the estimate.
Low quality: Further research is very likely to have an important impact on our confidence in the estimate of effect and is likely to change the estimate.
Very low quality: We are very uncertain about the estimate.

Figuras y tablas -
Table 1. Overview of study populations

Intervention(s) and comparator(s)

Sample sizea

Screened/eligible
[N]

Randomised
[N]

ITT
[N]

Analysed
[N]

Finishing study
[N]

Randomised finishing study
[%]

Follow‐up timeb

(1) Gómez‐García 2006

I: 100 mg/day zinc sulfate

12
(6 participants per group; 80% power)

14

7

7

7

100

1 month

C: placebo

7

7

7

100

total:

14

14

14

100

(2) Marreiro 2006

I: 30 mg/day zinc amino chelate

28

28

28

100

1 month

C: placebo

28

28

28

100

total:

56

56

56

100

(3) Soheilykhah 2012

I: 50 mg/day zinc sulfate

28

28

100

12 weeks

C: regular exercise and weight control

25

25

100

total:

58

53

53

91.4

Grand total

All interventions

63

63

All comparators

60

60

All interventions and comparators

128

123

aAccording to power calculation in study publication or report
bDuration of intervention and/or follow‐up under randomised conditions until end of study

"‐" denotes not reported

C: comparator; I: intervention; ITT: intention‐to‐treat.

Figuras y tablas -
Table 1. Overview of study populations
Comparison 1. Zinc supplementation versus placebo

Outcome or subgroup title

No. of studies

No. of participants

Statistical method

Effect size

1 HOMA‐IR Show forest plot

1

Mean Difference (IV, Fixed, 95% CI)

Totals not selected

1.1 HOMA‐IR

1

Mean Difference (IV, Fixed, 95% CI)

0.0 [0.0, 0.0]

2 Lipids Show forest plot

2

Mean Difference (IV, Fixed, 95% CI)

Totals not selected

2.1 Total cholesterol

1

Mean Difference (IV, Fixed, 95% CI)

0.0 [0.0, 0.0]

2.2 Total cholesterol

1

Mean Difference (IV, Fixed, 95% CI)

0.0 [0.0, 0.0]

2.3 HDL cholesterol

1

Mean Difference (IV, Fixed, 95% CI)

0.0 [0.0, 0.0]

2.4 HDL cholesterol

1

Mean Difference (IV, Fixed, 95% CI)

0.0 [0.0, 0.0]

2.5 LDL cholesterol

1

Mean Difference (IV, Fixed, 95% CI)

0.0 [0.0, 0.0]

2.6 LDL cholesterol

1

Mean Difference (IV, Fixed, 95% CI)

0.0 [0.0, 0.0]

2.7 VLDL cholesterol

1

Mean Difference (IV, Fixed, 95% CI)

0.0 [0.0, 0.0]

2.8 VLDL lipoprotein

1

Mean Difference (IV, Fixed, 95% CI)

0.0 [0.0, 0.0]

2.9 Triglycerides

1

Mean Difference (IV, Fixed, 95% CI)

0.0 [0.0, 0.0]

2.10 Triglycerides 

1

Mean Difference (IV, Fixed, 95% CI)

0.0 [0.0, 0.0]

Figuras y tablas -
Comparison 1. Zinc supplementation versus placebo
Comparison 2. Zinc supplementation versus exercise

Outcome or subgroup title

No. of studies

No. of participants

Statistical method

Effect size

1 HOMA‐IR Show forest plot

1

Mean Difference (IV, Fixed, 95% CI)

Totals not selected

2 Lipids Show forest plot

1

Mean Difference (IV, Fixed, 95% CI)

Totals not selected

2.1 Total cholesterol

1

Mean Difference (IV, Fixed, 95% CI)

0.0 [0.0, 0.0]

2.2 HDL cholesterol

1

Mean Difference (IV, Fixed, 95% CI)

0.0 [0.0, 0.0]

2.3 LDL cholesterol

1

Mean Difference (IV, Fixed, 95% CI)

0.0 [0.0, 0.0]

2.4 Triglycerides

1

Mean Difference (IV, Fixed, 95% CI)

0.0 [0.0, 0.0]

Figuras y tablas -
Comparison 2. Zinc supplementation versus exercise