Combined intermittent pneumatic leg compression and pharmacological prophylaxis for prevention of venous thromboembolism
Abstract
Background
It is generally assumed by practitioners and guideline authors that combined modalities (methods of treatment) are more effective than single modalities in preventing venous thromboembolism (VTE), defined as deep vein thrombosis (DVT) or pulmonary embolism (PE), or both. This is an update of the review first published in 2008.
Objectives
The aim of this review was to assess the efficacy of combined intermittent pneumatic leg compression (IPC) and pharmacological prophylaxis versus single modalities in preventing venous thromboembolism.
Search methods
For this update the Cochrane Vascular Information Specialist (CIS) searched the Specialised Register (May 2016). In addition the CIS searched the Cochrane Register of Studies (CENTRAL (2016, Issue 4)). Clinical trials databases were searched for details of ongoing or unpublished studies.
Selection criteria
Randomized controlled trials (RCTs) or controlled clinical trials (CCTs) of combined IPC and pharmacological interventions used to prevent VTE.
Data collection and analysis
We independently selected trials and extracted data. Disagreements were resolved by discussion. We performed fixed‐effect model meta‐analyses with odds ratios (ORs) and 95% confidence intervals (CIs). We used a random‐effects model when there was heterogeneity.
Main results
We included a total of 22 trials (9137 participants) of which 15 were randomized trials (7762 participants). The overall risk of bias was mostly unclear or high due to selection and performance bias. We used GRADE to assess the quality of the evidence and this was downgraded from high to moderate or very low due to the risk of bias, imprecision or indirectness.
The rate of PE in the studies comparing IPC alone with combined IPC and pharmacological prophylaxis was low, underpowering the analyses. The incidence of symptomatic PE was 0.79% with IPC, but ranged between 0.1 to 1% with combined IPC and pharmacological prophylaxis (OR 0.49, 95% CI 0.18 to 1.34; 12 studies, 3017 participants, moderate quality evidence). The incidence of DVT was 4.10% in the IPC group and 2.19% in the combined group showing a reduced incidence of DVT in favour of the combined group (OR 0.52, 95% CI 0.33 to 0.82; 11 studies, 2934 participants, moderate quality evidence). The addition of an anticoagulant to IPC, however, increased the risk of any bleeding compared to IPC alone; 0.66% (7/1053) in the IPC group and 4.0% (44/1102) in the combined group (OR 5.04, 95% CI 2.36 to 10.77; 7 studies, 2155 participants, moderate quality evidence). Major bleeding followed a similar pattern; 0.1% (1/1053) in the IPC group to 1.5% (17/1102) in the combined group (OR 6.81, 95% CI 1.99 to 23.28; 7 studies, 2155 participants, moderate quality evidence).
We detected no difference between the type of surgery subgroups such as orthopedic and non‐orthopedic participants for DVT incidence (P = 0.16). Tests for differences between type of surgery subgroups were not possible for PE incidence.
Compared with pharmacological prophylaxis alone, the use of combined IPC and pharmacological prophylaxis modalities reduced the incidence of symptomatic PE from 2.92% to 1.20% (OR 0.39, 95% CI 0.23 to 0.64; 10 studies, 3544 participants, moderate quality evidence). The incidence of DVT was 6.2% in the pharmacological prophylaxis group and 2.9% in the combined group showing no difference between the combined and pharmacological prophylaxis groups (OR 0.42, 95% CI 0.18 to 1.03; 11 studies, 2866 participants, moderate quality evidence). Increased bleeding side effects were not observed for IPC when it was added to anticoagulation (bleeding: OR 0.80, 95% CI 0.30 to 2.14, very low quality evidence; major bleeding: OR 1.21, 95% CI 0.35 to 4.18, very low quality evidence, 3 studies, 244 participants).
No difference was detected between the type of surgery subgroups for PE incidence (P = 0.68) or for DVT incidence (P = 0.10).
Authors' conclusions
Moderate quality evidence suggests that combining IPC and pharmacological prophylaxis, compared with IPC or pharmacological prophylaxis alone, decreases the incidence of DVT when compared to compression, and incidence of PE when compared to anticoagulation. Moderate quality evidence suggests that there is no difference between combined and single modalities in the incidence of PE when compared with compression alone and DVT when compared with anticoagulation alone. The quality of evidence for PE or DVT was downgraded to moderate due to imprecision or risk of bias in study methodology, highlighting the need for further research. Moderate quality evidence suggests the addition of pharmacological prophylaxis to IPC, increased the risk of bleeding compared to IPC alone, a side effect not observed for IPC when added to pharmacological prophylaxis (very low quality evidence), as expected for a physical method of thromboprophylaxis. The quality of evidence for bleeding was downgraded to moderate due to indirectness or very low due to risk of bias in study methodology, indirectness and imprecision highlighting the need for further research. Nevertheless, the results of the current review agree with current guideline recommendations, which support the use of combined modalities in hospitalised patients (limited to those with trauma or undergoing surgery) at risk of developing VTE. More studies on the role of combined modalities in VTE prevention are needed.
PICO
Plain language summary
Combined intermittent pneumatic leg compression and medication for the prevention of deep vein thrombosis and pulmonary embolism
Background
Deep vein thrombosis (DVT) and pulmonary embolism (PE) are collectively known as venous thromboembolism (VTE), and occur when a blood clot develops inside the leg veins (DVT) and travels to the lungs (PE). They are possible complications of hospitalisation resulting from surgery or trauma. These complications extend hospital stay and are associated with long‐term disability and death. Patients undergoing total hip or knee replacement surgery or surgery for colorectal cancer are at high risk of venous thromboembolism. Sluggish venous blood flow, increased blood clotting and blood vessel wall injury are contributing factors. Treating more than one of these causes may improve prevention. Mechanical intermittent pneumatic leg compression (IPC) reduces sluggish blood flow (venous stasis) while medications such as aspirin and anticoagulants (low molecular weight heparin) reduce blood clotting. These medications are known as pharmacological prophylaxis (drugs used to prevent blood clots). However, these medications can also increase the risk of bleeding. This review is an update of a review first published in 2008.
Study characteristics and key results
We identified 22 trials with a total of 9137 participants to include in this review (current until May 2016). The mean age of participants, where reported, was 65.2 years. Most participants had either a high‐risk procedure or condition. The predisposing conditions were orthopedic surgery in 12 studies and urology, cardiothoracic, neurosurgery, trauma, general surgery, gynaecology or other types of participants in the remaining studies.
Compared to IPC alone, IPC plus medication did not show differences in the incidence (rate of new cases) of PE (12 studies with a total of 3017 participants). The incidence of DVT was reduced for IPC combined with medication when compared with IPC alone (11 studies with a total of 2934 participants). The addition of a medication to IPC, however, increased the risk for any bleeding compared to IPC alone, from 0.66% to 4.0%. Major bleeding followed a similar pattern, with an increase from 0.1% to 1.5%.Further analysis looking at different subgroups of participants (orthopedic and non‐orthopedic participants) did not show any overall difference in DVT while it was not possible to assess differences between subgroups for PE.
Compared with medication alone, combined IPC and medication reduced the incidence of PE (10 studies with 3544 participants). DVT incidence was not different between the medication and the combined IPC and medication group (11 studies with 2866 participants). No differences were observed in rates of bleeding (three studies with 244 participants). Further analysis looking at different subgroups of participants did not show any overall difference in incidence of PE and DVT between orthopedic and non‐orthopedic participants.
Quality of the evidence
The findings of this review show moderate quality evidence and agree with current guideline recommendations supporting the use of combined IPC and pharmacological prophylaxis, compared with IPC or pharmacological prophylaxis alone, to reduce the incidence of DVT and PE in hospitalized patients. Moderate quality evidence suggests the addition of pharmacological prophylaxis to IPC, increased the risk of bleeding compared to IPC alone, a side effect not observed for IPC when added to pharmacological prophylaxis (very low quality evidence), as expected for a physical method for preventing blood clots. The quality of the evidence was downgraded from high to moderate or very low for risk of bias and imprecision and indirectness between the studies.
Authors' conclusions
Summary of findings
| Does combined intermittent pneumatic compression (IPC) plus pharmacological prophylaxis increase prevention of venous thromboembolism compared with IPC alone? | ||||||
| Patient or population: patients undergoing surgery or at risk of developing VTE because of other reasons (e.g. trauma) Settings: hospital (surgery, trauma or ICU stay) Intervention: combined IPC plus pharmacological prophylaxis Comparison: IPC alone | ||||||
| Outcomes | Illustrative comparative risks* (95% CI) | Relative effect | No of participants | Quality of the evidence | Comments | |
| Assumed risk | Corresponding risk | |||||
| Single modalities | Combined modalities | |||||
| Incidence of PEa | 8 per 1000 | 4 per 1000 (1 to 10) | OR 0.49 (0.18 to 1.34) | 3017 (12) | ⊕⊕⊕⊝ | |
| Incidence of DVTb | 41 per 1000 | 22 per 1000 (14 to 34) | OR 0.52 (0.33 to 0.82) | 2934 (11) | ⊕⊕⊕⊝ | |
| Incidence of bleedingc | 7 per 1000 | 33 per 1000 (16 to 67) | OR 5.04 (2.36 to 10.77) | 2155 (7) | ⊕⊕⊕⊝ moderate3 | |
| Incidence of major bleedingd | 1 per 1000 | 6 per 1000 (2 to 22) | OR 6.81 (1.99 to 23.28) | 2155 (7) | ⊕⊕⊕⊝ moderate3 | |
| * The basis for the assumed risk was the average risk in the single modalities group (i.e. the number of participants with events divided by total number of participants of the single modalities group included in the meta‐analysis). The corresponding risk (and its 95% confidence interval) is based on the assumed risk in the comparison group and the relative effect of the intervention (and its 95% CI) | ||||||
| GRADE Working Group grades of evidence | ||||||
| a PE assessed by pulmonary angiography or scintigraphy, computed tomography (CT), angiography, or autopsy | ||||||
| Does combined intermittent pneumatic compression (IPC) plus pharmacological prophylaxis increase prevention of venous thromboembolism compared with pharmacological prophylaxis alone? | ||||||
| Patient or population: patients undergoing surgery or at risk of developing VTE because of other reasons (e.g. trauma) Settings: hospital (surgery, trauma or ICU stay) Intervention: combined IPC plus pharmacological prophylaxis Comparison: pharmacological prophylaxis alone | ||||||
| Outcomes | Illustrative comparative risks* (95% CI) | Relative effect | No of participants | Quality of the evidence | Comments | |
| Assumed risk | Corresponding risk | |||||
| Single modalities | Combined modalities | |||||
| Incidence of PEa | 29 per 1000 | 12 per 1000 (7 to 19) | OR 0.39 (0.23 to 0.64) | 3544 (10) | ⊕⊕⊕⊝ | |
| Incidence of DVTb | 62 per 1000 | 27 per 1000 (12 to 64) | OR 0.42 (0.18 to 1.03) | 2866 (11) | ⊕⊕⊕⊝ | |
| Incidence of bleedingc | 81 per 1000 | 66 per 1000 (26 to 159) | OR 0.8 (0.3 to 2.14 | 244 (3) | ⊕⊝⊝⊝ very low3 | |
| Incidence of major bleedingd | 41 per 1000 | 49 per 1000 (15 to 150) | OR 1.21 (0.35 to 4.18) | 244 (3) | ⊕⊝⊝⊝ very low3 | |
| *The basis for the assumed risk was the average risk in the single modalities group (i.e. the number of participants with events divided by total number of participants of the single modalities group included in the meta‐analysis). The corresponding risk (and its 95% confidence interval) is based on the assumed risk in the comparison group and the relative effect of the intervention (and its 95% CI) | ||||||
| GRADE Working Group grades of evidence | ||||||
| a PE assessed by pulmonary angiography or scintigraphy, computed tomography (CT), angiography, or autopsy 1 Downgraded by one level due to risk of detection and attrition bias affecting effect estimate as shown by sensitivity analysis | ||||||
Background
Description of the condition
Deep vein thrombosis (DVT), i.e. the development of thrombi inside the deep veins of the legs (in most instances), is a potentially fatal disease as it can be complicated by pulmonary embolism (PE), resulting from the movement of thrombi from the leg veins to the pulmonary artery or its branches. The incidence of venous thromboembolism (VTE), DVT, PE or both, is still high despite the use of contemporary prophylactic measures. VTE risk is increased by the presence of certain risk factors, including, age, malignancy, immobilisation and the type of surgery. High‐risk patients include those undergoing total hip or knee replacement, or surgery for colorectal cancer (McLeod 2001). Experts in the field have indicated that this and similar observations are the result of failed and also omitted prophylaxis (Goldhaber 2001; Piazza 2007). The most recent guidelines recommend combined pharmacological and mechanical prophylaxis in high‐risk groups, in an effort to maximize thromboprophylaxis (Gould 2012; Nicolaides 2013). It is likely that mechanical methods increase the efficacy of thromboprophylaxis and reduce death and morbidity rates without increasing bleeding risk.
Description of the intervention
Intermittent pneumatic leg compression (IPC) involves wrapping the legs with inflatable sleeves, using commercially available devices. As a result of sleeve inflation, external pressure is exerted on the legs and its veins, resulting in an increase in blood flow and this reduction of blood stasis decreases the incidence of VTE. Pharmacological prophylaxis on the other hand is achieved by mostly small doses of anticoagulants given orally or subcutaneously; these also significantly reduce the incidence of VTE. Combined IPC and pharmacological prophylaxis in the form of dual modalities concurrently used for prevention of VTE may improve the efficacy of each method used alone.
How the intervention might work
Mechanical methods reduce VTE mainly by reducing venous stasis, while anticoagulants inhibit elements of the thrombosis cascade. Because single prophylactic modalities reduce but not completely eliminate VTE, combined modalities are expected to reduce further the frequency of VTE because of their different mechanisms of action.
Why it is important to do this review
Venous thromboembolism is the single most common, preventable cause of postoperative death. Better use of preventive resources is expected to reduce VTE events and mortality. Use of combined modalities is suggested by current guidelines in high risk patients, however the evidence supporting these recommendations requires better attention (Gould 2012; Nicolaides 2013). We performed this review to assess the breadth and strength of the best available evidence by pooling data from multiple studies to overcome limitations of small and underpowered studies. This review is an update of a review first published in 2008.
Objectives
The aim of this review was to assess the efficacy of combined intermittent pneumatic leg compression (IPC) and pharmacological prophylaxis versus single modalities in preventing venous thromboembolism.
Methods
Criteria for considering studies for this review
Types of studies
We included randomized controlled trials (RCTs) and controlled clinical trials (CCTs).
Types of participants
We included any type of hospitalized patient requiring prevention of venous thromboembolism (VTE) or at risk of developing VTE. We included patients undergoing surgery and trauma and ICU patients.
Types of interventions
We included studies which assessed the combined use of intermittent pneumatic leg compression (IPC) (including foot pumps and devices inflating calf sleeves) and pharmacological prophylaxis (including unfractionated heparin and low molecular weight heparin) compared with IPC or pharmacological prophylaxis alone. We excluded studies that used IPC for a short period of time (that is intraoperatively).
Types of outcome measures
Primary outcomes
Venous thromboembolism (symptomatic or asymptomatic) was the main outcome measure, with data on DVT and PE extracted as separate endpoints.
Outcomes were assessed by: ascending venography, I‐125 fibrinogen uptake test and ultrasound scanning for DVT; and pulmonary angiography or scintigraphy, computed tomography (CT), angiography and autopsy for PE.
Secondary outcomes
Bleeding was considered as a safety outcome and included all types reported i.e. any type, major bleeding (as defined by the study authors, but usually located at the surgical site or in a critical organ or site, requiring intervention or transfusion of at least two units of blood, or leading to death), and fatal bleeding reported separately. Fatal PE was an additional outcome.
Search methods for identification of studies
Electronic searches
For this update the Cochrane Vascular Information Specialist (CIS) searched the Specialised Register (May 2016). In addition the CIS searched the Cochrane Register of Studies (CRS) www.metaxis.com/CRSWeb/Index.asp (CENTRAL (2016, Issue 4)). See Appendix 1 for details of the search strategy used to search the CRS. The Specialised Register is maintained by the CIS and is constructed from weekly electronic searches of MEDLINE, EMBASE, CINAHL, AMED, and through handsearching relevant journals. The full list of the databases, journals and conference proceedings which have been searched, as well as the search strategies used are described in the Specialised Register section of the Cochrane Vascular module in the Cochrane Library (www.cochranelibrary.com).
The following trial databases were searched by the CIS (May 2016) for details of ongoing and unpublished studies using the terms pneumatic compression;
World Health Organization International Clinical Trials Registry (apps.who.int/trialsearch/)
ClinicalTrials.gov (clinicaltrials.gov/)
ISRCTN Register (www.isrctn.com/)
Searching other resources
We searched the reference lists of relevant articles and also similar systematic reviews and meta‐analyses to identify additional trials.
Data collection and analysis
Selection of studies
Two review authors (SK and IN) independently selected studies for inclusion on the basis of use of combined mechanical IPC and pharmacological modalities. Any disagreements were resolved by discussion.
Data extraction and management
SKK and two co‐authors (GG and IN) independently extracted the data. We used a data extraction form to record the type of patient or surgical procedure, total number of participants in the study (including those randomized, excluded and also withdrawn), the interventions used, the number of participants who reached an endpoint (DVT or PE) and the methodology used to establish this. A third author (JC) arbitrated any disagreements.
Assessment of risk of bias in included studies
We assessed the methodological quality of all included studies using Cochrane's 'Risk of bias' tool. . SKK and two co‐authors (GG and IN) independently performed the assessment according to Higgins 2011. The following domains were assessed: selection bias (random sequence generation, allocation concealment), performance bias (blinding of participants and personnel), detection bias (blinding of outcome assessment), attrition bias (incomplete outcome data), reporting bias (selective reporting) and other bias. We classified the domains as low risk, high risk, or unclear risk according to Higgins 2011. Any disagreements were resolved after discussion.
Measures of treatment effect
We performed separate analysis for the interventions of IPC versus combined modalities, and pharmacological prophylaxis versus combined modalities for the outcomes of PE and DVT. We used odds ratios (OR) and risk ratio (RR) with 95% confidence intervals (CIs) for assessment of dichotomous outcomes of all trials and RCTs only, respectively.
Unit of analysis issues
We excluded studies with non‐standard designs, such as cross‐over trials and cluster‐randomized trials. The individual patient was the unit of analysis.
Dealing with missing data
In case of missing participants due to drop‐out, we used intention‐to‐treat analysis. Where necessary, we contacted study authors to request that they provided any missing information.
Assessment of heterogeneity
We assessed statistical heterogeneity with the I2 test. I2 levels exceeding 50% were considered as substantial heterogeneity to justify the use of random‐effects analysis.
Assessment of reporting biases
We assessed publication bias with funnel plots when 10 or more studies were included in a comparison and contributed to the effect estimate; as described by Higgins 2011. Where the number of studies in each comparison was not greater than 10 the plots lack the power to distinguish chance from real asymmetry (Egger 1997).
Data synthesis
We used fixed‐effect models for each meta‐analysis to pool data, unless there was evidence of heterogeneity in which case we used a random‐effects model to calculate the RR or ORs and 95% CIs (see Assessment of heterogeneity)..
Subgroup analysis and investigation of heterogeneity
We performed subgroup analysis of the primary outcomes for surgery type (e.g. orthopedic surgery, etc), type of DVT (symptomatic) and type of IPC (foot IPC and other than foot IPC).
Sensitivity analysis
We performed sensitivity analysis of the primary outcomes by excluding studies with a high‐risk for bias, based on the 'Risk of bias' tool, and by excluding CCTs, in order to test the robustness of the evidence. Where significant heterogeneity was present, we performed sensitivity analysis to determine what effect this had on the results.
Summary of findings
We created 'Summary of findings' tables for the comparisons of IPC plus pharmacological prophylaxis versus IPC alone (summary of findings Table for the main comparison) and IPC plus pharmacological prophylaxis versus pharmacological prophylaxis alone (summary of findings Table 2). We used GRADEpro GDT software (GRADEpro GDT 2015) to present the main findings of the review. We included the primary outcomes DVT and PE and incidence of bleeding and major bleeding in the 'Summary of findings' tables. We calculated assumed control intervention risks from the mean number of events in the control groups of the selected studies for each outcome. The system developed by the Grading of Recommendation, Assessment, Development and Evaluation Working Group (GRADE working group) was used for grading the quality of evidence as high, moderate, low and very low, based on within‐study risk of bias, directness of evidence, heterogeneity, precision of effects estimates, and risk of publication bias (Atkins 2004).
Results
Description of studies
Results of the search
See Figure 1.

Study flow diagram.
Included studies
For this update 11 additional studies were included (Cahan 2000; Dickinson 1998; Edwards 2008; Kurtoglu 2003; Sakai 2016; Siragusa 1994; Song 2014; Stannard 1996; Tsutsumi 2012; Windisch 2011; Yokote 2011) making a total of 22 studies that met the inclusion criteria, reporting outcomes on 9137 participants (Bigg 1992; Borow 1983; Bradley 1993; Cahan 2000; Dickinson 1998; Edwards 2008; Eisele 2007; Kurtoglu 2003; Ramos 1996; Sakai 2016; Sieber 1997; Silbersack 2004; Siragusa 1994; Song 2014; Stannard 1996; Tsutsumi 2012; Turpie 2007; Westrich 2005; Westrich 2006; Windisch 2011; Woolson 1991; Yokote 2011). Four publications had three arms (Borow 1983; Cahan 2000; Dickinson 1998; Stannard 1996), using IPC, pharmacological prophylaxis and both, respectively. Fifteen studies were RCTs (Cahan 2000; Dickinson 1998; Edwards 2008; Eisele 2007; Ramos 1996; Sakai 2016; Silbersack 2004; Siragusa 1994; Song 2014; Stannard 1996; Turpie 2007; Westrich 2006; Windisch 2011; Yokote 2011; Woolson 1991) that studied a total of 7762 participants. The remaining seven studies were CCTs, which were classified according to the draft guidelines of the Cochrane Non‐Randomised Studies Methods Group (NRSMG). These included three quasi‐randomized CCTs (Bigg 1992; Bradley 1993; Kurtoglu 2003) that studied a total of 222 participants, and four CCTs with concurrent controls (Borow 1983; Sieber 1997; Tsutsumi 2012; Westrich 2005) that involved a total of 1153 participants.
The included studies evaluated orthopedic patients (n = 12) (Bradley 1993; Edwards 2008; Eisele 2007; Sakai 2016; Silbersack 2004; Siragusa 1994; Stannard 1996; Westrich 2005; Westrich 2006; Windisch 2011; Woolson 1991; Yokote 2011); urology patients (n = 2) (Bigg 1992; Sieber 1997); cardiothoracic patients (n = 1) (Ramos 1996); neurosurgery patients (n = 1) (Dickinson 1998); trauma patients (n = 1) (Kurtoglu 2003) or general surgery, gynecology and other types of patients (n = 5) (Borow 1983; Cahan 2000; Song 2014; Tsutsumi 2012; Turpie 2007). Patient weighted mean age (in 17 studies that reported age, 5638 participants) was 65.2 years (Bigg 1992; Bradley 1993; Cahan 2000; Dickinson 1998; Edwards 2008; Ramos 1996; Sakai 2016; Sieber 1997; Silbersack 2004; Song 2014; Stannard 1996; Tsutsumi 2012; Westrich 2005; Westrich 2006; Windisch 2011; Woolson 1991; Yokote 2011).
Pharmacological prophylaxis included unfractionated heparin (UFH) (Bigg 1992; Bradley 1993; Cahan 2000; Ramos 1996; Sieber 1997; Siragusa 1994; Stannard 1996), low molecular weight heparin (LMWH) (Dickinson 1998; Edwards 2008; Kurtoglu 2003; Silbersack 2004; Song 2014; Westrich 2006; Windisch 2011), fondaparinux (Eisele 2007; Tsutsumi 2012; Turpie 2007), LMWH or fondaparinux (Yokote 2011), UFH or warfarin (Borow 1983), warfarin or aspirin (Westrich 2005; Woolson 1991) and edoxaban, a direct oral Factor Xa inhibitor (Sakai 2016).
IPC types included foot pumps (Bradley 1993; Sakai 2016; Stannard 1996; Windisch 2011), and devices inflating calf sleeves (Edwards 2008; Eisele 2007; Silbersack 2004; Westrich 2005; Westrich 2006), or thigh‐high sleeves (Bigg 1992; Borow 1983; Cahan 2000; Dickinson 1998; Ramos 1996; Sieber 1997; Song 2014; Woolson 1991). The exact IPC type was not reported in four studies (Kurtoglu 2003; Siragusa 1994; Tsutsumi 2012; Yokote 2011), while in one multi centre study the investigators were allowed to use the device type of their choice (Turpie 2007).
Four publications had three arms (Borow 1983; Cahan 2000; Dickinson 1998; Stannard 1996), using IPC, pharmacological prophylaxis and both, respectively. Of the remaining 18 publications, prophylactic methods in the control group included: IPC in 11 studies, either without aspirin (Bigg 1992; Kurtoglu 2003; Ramos 1996; Sieber 1997; Song 2014; Tsutsumi 2012; Turpie 2007; Woolson 1991; Yokote 2011) or with aspirin (Westrich 2005; Westrich 2006); and pharmacological prophylaxis in seven studies (Bradley 1993; Edwards 2008; Eisele 2007; Sakai 2016; Silbersack 2004; Siragusa 1994; Windisch 2011), with aspirin in one of them (Silbersack 2004). The intervention group in all studies used combined modalities and aspirin was used only in two studies (Stannard 1996; Woolson 1991).
Ultrasound was the main diagnostic modality to diagnose DVT and was used by most studies (Borow 1983; Cahan 2000; Dickinson 1998; Edwards 2008; Eisele 2007; Kurtoglu 2003; Sakai 2016; Silbersack 2004; Siragusa 1994; Song 2014; Stannard 1996; Westrich 2005; Westrich 2006; Windisch 2011; Woolson 1991; Yokote 2011). PE, where reported, was diagnosed mainly with scintigraphy scanning (Bigg 1992; Ramos 1996; Turpie 2007; Woolson 1991), a pulmonary angiogram (Ramos 1996; Turpie 2007); or a CT pulmonary angiogram (Kurtoglu 2003; Sakai 2016; Silbersack 2004; Song 2014; Tsutsumi 2012; Turpie 2007; Westrich 2006; Windisch 2011; Yokote 2011).
Two studies did not report on DVT rates (Bigg 1992; Ramos 1996), and four studies did not report on PE rates (Bradley 1993; Dickinson 1998; Eisele 2007; Siragusa 1994).
Eleven studies reported on bleeding outcomes (Bigg 1992; Dickinson 1998; Sakai 2016; Song 2014; Tsutsumi 2012; Turpie 2007; Westrich 2005; Westrich 2006; Windisch 2011; Woolson 1991; Yokote 2011). For many studies no specific bleeding definitions were provided (Bigg 1992; Dickinson 1998; Song 2014; Westrich 2005; Westrich 2006; Windisch 2011; Woolson 1991). For the remaining studies that did provide bleeding definitions, the criteria were not uniform (Sakai 2016; Tsutsumi 2012; Turpie 2007; Yokote 2011).
Excluded studies
For this update an additional nine studies were excluded (Gagner 2012; Kiudelis 2010; Kumaran 2008; Lieberman 1994; Mehta 2010; Patel 2010; Wan 2015; Westrich 1996; Whitworth 2011); making a total of 21 excluded studies (Ailawadi 2001; Eskander 1997; Frim 1992; Gagner 2012; Gelfer 2006; Kamran 1998; Kiudelis 2010; Kumaran 2008; Lieberman 1994; Macdonald 2003; Mehta 2010; Nathan 2006; Patel 2010; Roberts 1975; Spinal cord injury investigators; Stannard 2006; Tsutsumi 2000; Wan 2015; Westrich 1996; Whitworth 2011; Winemiller 1999). Exclusions were due to: use of combined modalities was not concurrent or a different type of pharmacological prophylaxis was given in the two study groups (n = 5) (Eskander 1997; Gelfer 2006; Macdonald 2003; Spinal cord injury investigators; Stannard 2006); IPC use was limited to intraoperative use (n = 2) (Kiudelis 2010; Roberts 1975); they were controlled before and after studies (n = 3) (Frim 1992; Kamran 1998; Tsutsumi 2000); they were retrospective case‐control studies (n = 6) (Ailawadi 2001; Nathan 2006; Patel 2010; Wan 2015; Whitworth 2011; Winemiller 1999); a registry study (n = 1) (Gagner 2012); the single modalities group used either heparin or IPC (n = 1) (Kumaran 2008); aspirin was used for thromboprophylaxis (n = 2) (Lieberman 1994; Westrich 1996), and only aggregated VTE rates and not separate DVT and PE rates were provided (n = 1) (Mehta 2010).
Ongoing studies
Three additional studies were identified as ongoing (CHICTR‐IPR‐15007324; ISRCTN44653506 and NCT02040103; NCT00740987). See Characteristics of ongoing studies.
Risk of bias in included studies

Risk of bias graph: review authors' judgements about each risk of bias item presented as percentages across all included studies.
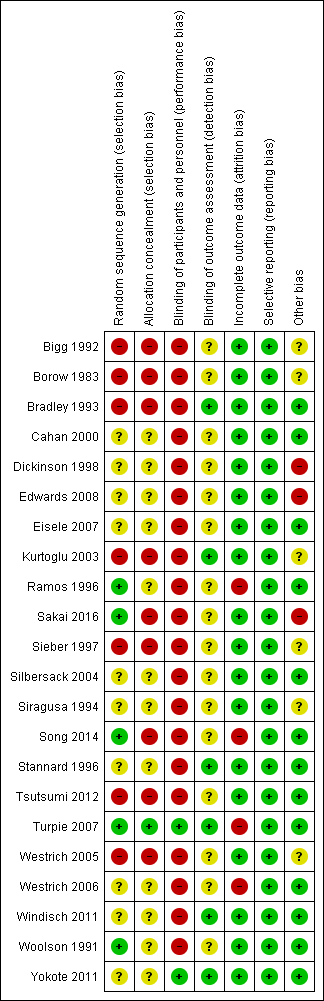
Risk of bias summary: review authors' judgements about each risk of bias item for each included study.
Overall risk of bias was mostly unclear or high.
Allocation
The randomization method was unclear in 10 of the 15 RCTs (Cahan 2000; Dickinson 1998; Edwards 2008; Eisele 2007; Silbersack 2004; Siragusa 1994; Stannard 1996; Westrich 2006; Windisch 2011; Yokote 2011). The studies that provided this information used random tables (Ramos 1996), a centralized computer‐generated schedule (Sakai 2016; Song 2014; Turpie 2007), and sealed envelopes (Woolson 1991). As a result, the quality of RCTs was mostly poor regarding selection bias, which was generally at high risk. By definition all quasi‐randomized trials and CCTs had a high risk for random sequence generation and therefore selection bias.
A high risk for allocation concealment was evident in nine studies (Bigg 1992; Borow 1983; Bradley 1993; Kurtoglu 2003; Sakai 2016; Sieber 1997; Song 2014; Tsutsumi 2012; Westrich 2005). Only Turpie 2007 had a low risk for allocation bias. In the remaining studies the risk of selection bias due to allocation concealment was unclear (Cahan 2000; Dickinson 1998; Edwards 2008; Eisele 2007; Ramos 1996; Silbersack 2004; Siragusa 1994; Stannard 1996; Westrich 2006; Windisch 2011; Woolson 1991; Yokote 2011).
Blinding
A high risk of performance bias was evident in all studies except two recent RCTs, which were double‐blinded (Turpie 2007; Yokote 2011). The remaining studies were judged as being at high risk because of the lack of use of a placebo medication or device. Blinding of outcome assessment was reported by six studies (Bradley 1993; Kurtoglu 2003; Stannard 1996; Turpie 2007; Windisch 2011; Yokote 2011), while in the remaining studies there was unclear evidence of detection bias. This lack of blinding may have affected the detection of DVT or PE and potentially increase the heterogeneity of the results.
Incomplete outcome data
A total of 324 participants (3.5%) were excluded. One study excluded eight participants due to non‐compliance, confinement to bed for more than one week, premature transfer to a different institution, or re‐operation or discharge from hospital without ultrasonography (Silbersack 2004). One study excluded 11 participants because of a protocol violation (discharged before the ultrasound) (n = 6), or because they did not receive the correct study medication (n = 5) (Westrich 2006). A third study excluded 24 participants because inclusion or exclusion criteria were not met, informed consent was withdrawn, adverse events occurred, or for other reasons not stated (Turpie 2007). Three additional studies excluded 3, 43 and 235 participants respectively (Edwards 2008; Ramos 1996; Song 2014).
A total of 78 participants (0.85%) were lost to follow‐up. One study reported a 26.5% loss to follow up (Westrich 2006), which was 0.8% of the total number of participants in this systematic review; however, short‐term data were provided.
Selective reporting
No findings of selective reporting were identified.
Other potential sources of bias
Three studies were considered as being at high risk for other sources of bias (Dickinson 1998; Edwards 2008; Sakai 2016). Reasons for this were because they were prematurely stopped (Dickinson 1998; Sakai 2016); or had a large number of post‐randomization exclusions (Edwards 2008).
Effects of interventions
See: Summary of findings for the main comparison IPC plus pharmacological prophylaxis versus IPC alone; Summary of findings 2 IPC plus pharmacological prophylaxis versus pharmacological prophylaxis alone
Intermittent pneumatic leg compression (IPC) plus pharmacological prophylaxis versus IPC alone
See summary of findings Table for the main comparison.
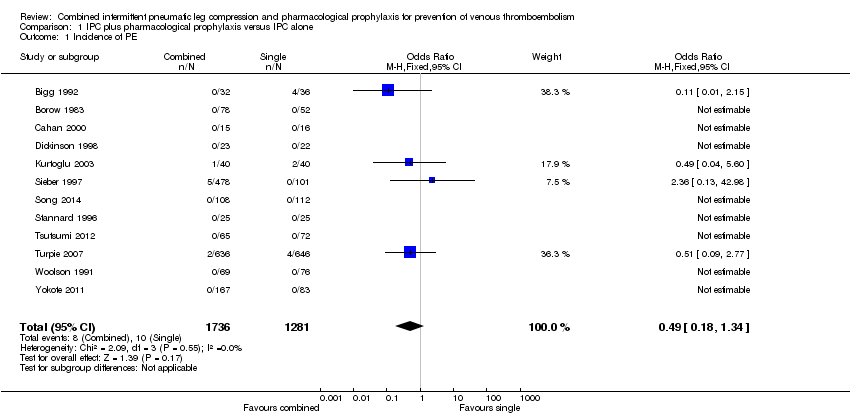
Twelve of the included studies evaluated the role of combined modalities on the incidence of symptomatic PE (Bigg 1992; Borow 1983; Cahan 2000; Dickinson 1998; Kurtoglu 2003; Sieber 1997; Song 2014; Stannard 1996; Tsutsumi 2012; Turpie 2007; Woolson 1991; Yokote 2011). The incidence of PE was 0.79% (10/1281) in the control group and 0.46% (8/1736) in the combined group showing no difference between the combined and control groups; OR 0.49, 95% CI 0.18 to 1.34; participants = 3017; studies = 12; Analysis 1.1. Results did not demonstrate heterogeneity (I2 = 0%). The quality of the evidence was downgraded to moderate for imprecision likely due to a type II error. Fatal PE was not reported.
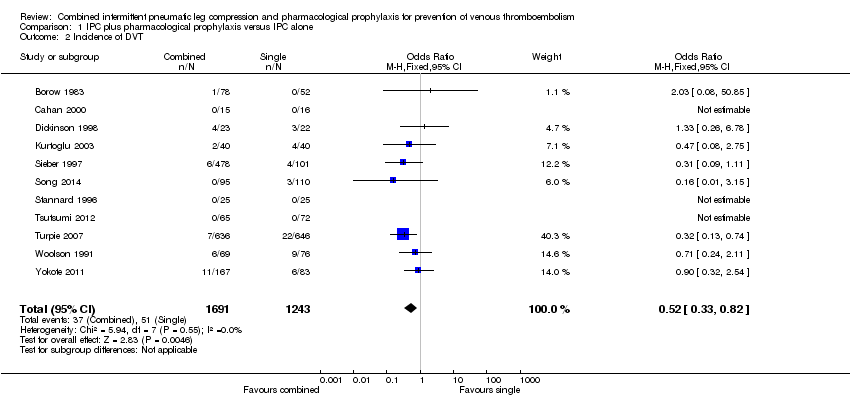
Eleven studies investigated the role of combined modalities on the incidence of DVT (Borow 1983; Cahan 2000; Dickinson 1998; Kurtoglu 2003; Sieber 1997; Song 2014; Stannard 1996; Tsutsumi 2012; Turpie 2007; Woolson 1991; Yokote 2011). The incidence of DVT was 4.10% (51/1243) in the control group and 2.19% (37/1691) in the combined group showing a reduced incidence of DVT in favor of the combined modalities group (OR 0.52, 95% CI 0.33 to 0.82; participants = 2934; studies = 11), Analysis 1.2. Results did not demonstrate heterogeneity (I2 = 0%). The quality of the evidence was downgraded to moderate for risk of attrition bias (see sensitivity analysis below).
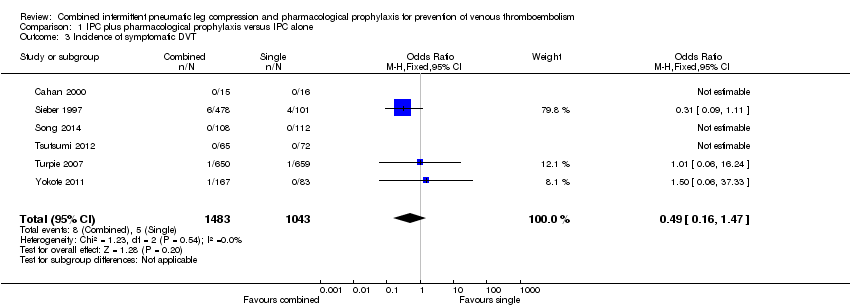
Six studies reported on the occurrence of symptomatic DVT (Cahan 2000; Sieber 1997; Song 2014; Tsutsumi 2012; Turpie 2007; Yokote 2011). The incidence of symptomatic DVT was 0.48% (5/1043) in the control group and 0.54% (8/1483) in the combined modalities group, showing no difference between the combined and control groups (OR 0.49, 95% CI 0.16 to 1.47; participants = 2526; studies = 6), Analysis 1.3. Results did not demonstrate heterogeneity (I2 = 0%).
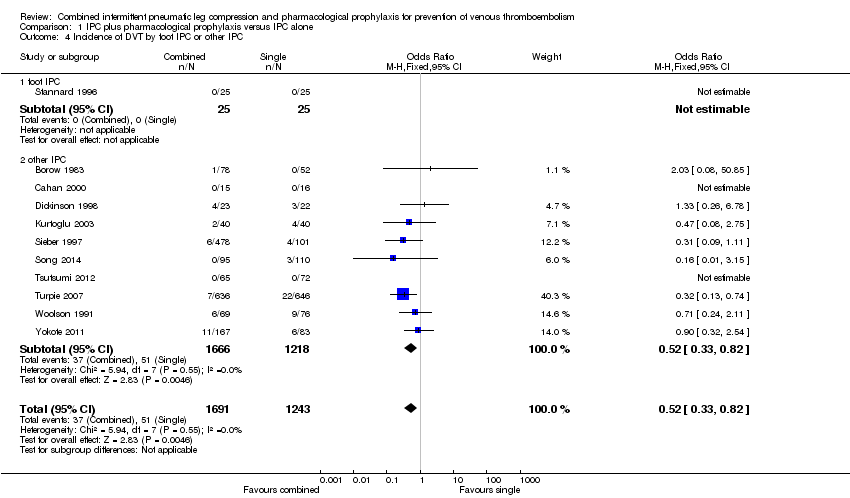
One study investigated the role of combined modalities on the incidence of DVT using a foot IPC (Stannard 1996), but because of a lack of events a risk estimate could not be calculated. Ten studies investigated the role of combined modalities on the incidence of DVT using IPC other than a foot IPC (Borow 1983; Cahan 2000; Dickinson 1998; Kurtoglu 2003; Sieber 1997; Song 2014; Tsutsumi 2012; Turpie 2007; Woolson 1991; Yokote 2011). The incidence of DVT was 4.19% (51/1218) in the control group and 2.22% (37/1666) in the combined group showing a reduced incidence of DVT in favor of the combined modalities group (OR 0.52, 95% CI 0.33 to 0.82; participants = 2884; studies = 10), Analysis 1.4. Results did not demonstrate heterogeneity (I2 = 0%).
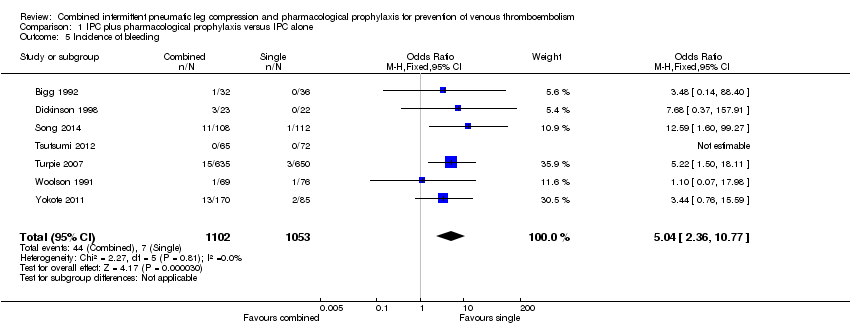
Seven studies reported on the incidence of bleeding in the combined modalities and IPC groups (Bigg 1992; Dickinson 1998; Song 2014; Tsutsumi 2012; Turpie 2007; Woolson 1991; Yokote 2011). The incidence of bleeding was 0.66% (7/1053) in the control (IPC) group and 4.0% (44/1102) in the combined group showing an increase in bleeding in the combined group (OR 5.04, 95% CI 2.36 to 10.77; participants = 2155; studies = 7), Analysis 1.5. Results did not demonstrate heterogeneity (I2 = 0%). The quality of the evidence was downgraded to moderate for indirectness. Major bleeding followed a similar pattern, with an incidence of 0.1% (1/1053) in the control (IPC) group and 1.5% (17/1102) in the combined group (OR 6.81, 95% CI 1.99 to 23.28; participants = 2155; studies = 7), Analysis 1.6. Results did not demonstrate heterogeneity (I2 = 0%). The quality of the evidence was downgraded to moderate for indirectness. Fatal bleeding during the intervention period was not reported.
IPC plus pharmacological prophylaxis versus pharmacological prophylaxis alone
See summary of findings Table 2.
Ten studies evaluated the role of combined modalities on the incidence of symptomatic PE (Borow 1983; Bradley 1993; Cahan 2000; Dickinson 1998; Edwards 2008; Ramos 1996; Sakai 2016; Silbersack 2004; Stannard 1996; Windisch 2011). The incidence of PE was 2.92% (50/1711) in the control group and 1.20% (22/1833) in the combined group showing a reduction in PE in favor of the combined modalities group (OR 0.39, 95% CI 0.23 to 0.64; participants = 3544; studies = 10), Analysis 2.1. Results did not demonstrate heterogeneity (I2 = 0%). The quality of the evidence was downgraded to moderate for risk of detection and attrition bias (see sensitivity analysis below). Fatal PE was not reported, except in one study, which did not provide the exact number of deaths or the treatment group they occurred in (Ramos 1996).
Eleven studies investigated the role of combined modalities on the incidence of DVT (Borow 1983; Bradley 1993; Cahan 2000; Dickinson 1998; Edwards 2008; Eisele 2007; Sakai 2016; Silbersack 2004; Siragusa 1994; Stannard 1996; Windisch 2011). The incidence of DVT was 6.20 (90/1452) in the control group and 2.90% (41/1414) in the combined group showing no difference between the combined and control groups (OR 0.42, 95% CI 0.18 to 1.03; participants = 2866; studies = 11), Analysis 2.2. Results demonstrated significant heterogeneity (I2 = 68%). The quality of the evidence was downgraded to moderate for risk of selection, detection and other bias (see sensitivity analysis below).
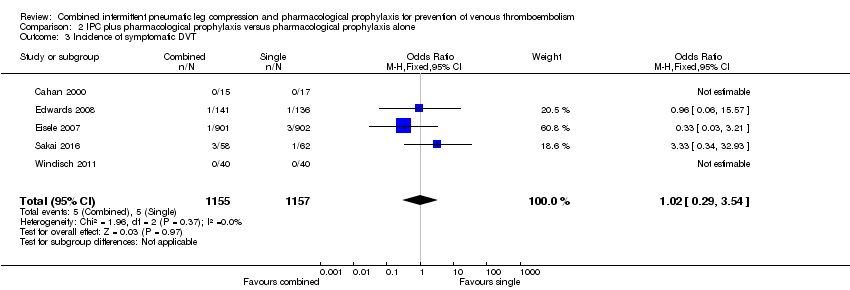
Five studies reported on the occurrence of symptomatic DVT (Cahan 2000; Edwards 2008; Eisele 2007; Sakai 2016; Windisch 2011). The incidence of symptomatic DVT was 0.43% (5/1157) in the control group and 0.43% (5/1155) in the combined group showing no difference between the combined and control groups (OR 1.02, 95% CI 0.29 to 3.54; participants = 2312; studies = 5), Analysis 2.3. Results did not demonstrate heterogeneity (I2 = 0%).
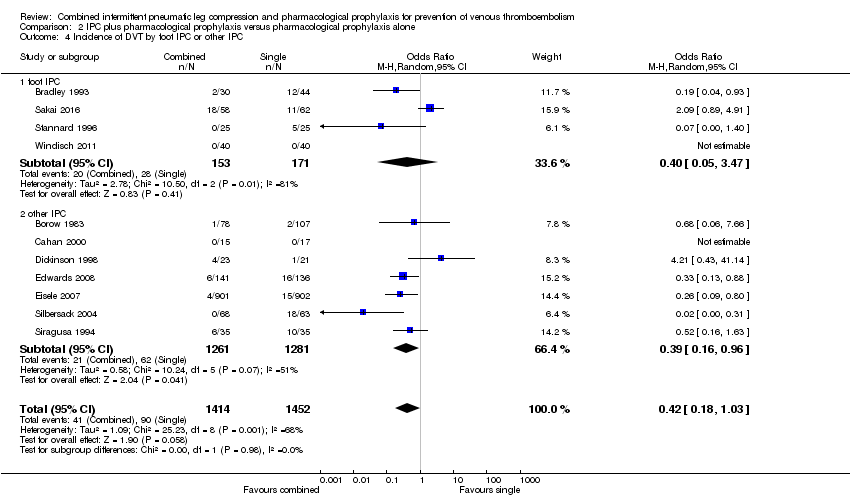
Four studies investigated the role of combined modalities on the incidence of DVT using a foot IPC (Bradley 1993; Sakai 2016; Stannard 1996; Windisch 2011). The incidence of DVT was 16.37% (28/171) in the control group and 13.07% (20/153) in the combined group showing no difference between the combined and control groups (OR 0.40, 95% CI 0.05 to 3.47; participants = 324; studies = 4). Results demonstrated significant heterogeneity (I2 = 81%). Seven studies investigated the role of combined modalities on the incidence of DVT using IPC other than a foot IPC (Borow 1983; Cahan 2000; Dickinson 1998; Edwards 2008; Eisele 2007; Silbersack 2004; Siragusa 1994). The incidence of DVT was 4.83% (62/1281) in the control group and 1.67% (21/1261) in the combined group showing a reduced incidence of DVT in favor of the combined modalities group (OR 0.39, 95% CI 0.16 to 0.96; participants = 2542; studies = 7), Analysis 2.4. Results did not demonstrate significant heterogeneity (I2 = 51%).
Three studies reported on the incidence of bleeding in the combined and pharmacological prophylaxis groups (Dickinson 1998; Sakai 2016; Windisch 2011). These studies showed no difference in bleeding rates between the combined group (8/121, 6.6%) and the control group (10/123, 8.1%) (OR 0.80, 95% CI 0.30 to 2.14; participants = 244; studies = 3), Analysis 2.5. Results did not demonstrate heterogeneity (I2 = 0%). The quality of the evidence was downgraded to very low for risk of bias due to blinding, indirectness.and imprecision. There was also no difference in major bleeding rates between the combined group (6/121, 5.0%) and the control group (5/123, 4.1%) (OR 1.21, 95% CI 0.35 to 4.18; participants = 244; studies = 3), Analysis 2.6. Results did not demonstrate heterogeneity (I2 = 0%). Fatal bleeding during the intervention period was not reported.
IPC plus pharmacological prophylaxis versus IPC plus aspirin
Three studies evaluated the role of combined IPC plus pharmacological prophylaxis versus IPC plus aspirin on the incidence of symptomatic PE (Westrich 2005; Westrich 2006; Woolson 1991). The studies showed a similar frequency of PE in the IPC plus aspirin control (2/268, 0.75%) and IPC plus pharmacological prophylaxis treatment groups (0/337, 0%) (OR 0.33, 95% CI 0.03 to 3.19; participants = 605; studies = 3), Analysis 3.1. Results did not demonstrate heterogeneity (I2 = 0%). Fatal PE was not reported.
The same studies investigated the role of combined modalities on the incidence of DVT. The studies showed a similar frequency in DVT in the IPC plus aspirin control (32/268, 11.9%) and IPC plus pharmacological prophylaxis treatment groups (30/337, 8.9%) (OR 0.83, 95% CI 0.48 to 1.42; participants = 605; studies = 3), Analysis 3.2. Results did not demonstrate heterogeneity (I2 = 0%).
One study reported on the occurrence of symptomatic DVT (Westrich 2005), but because of the lack of events, a risk estimate could not be calculated (Analysis 3.3). No foot IPC was used in this comparison and therefore subgroup analysis was not possible.
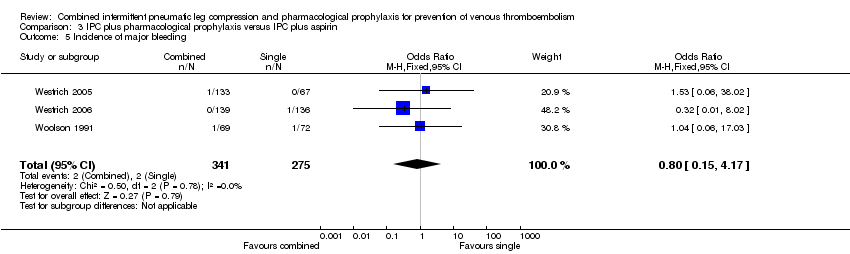
Three studies evaluated the role of combined IPC plus pharmacological prophylaxis versus IPC plus aspirin on the incidence of bleeding (Westrich 2005; Westrich 2006; Woolson 1991). The studies showed a similar frequency in bleeding in the IPC plus aspirin control (2/275, 0.7%) and IPC plus pharmacological prophylaxis treatment groups (4/341, 1.2%) (OR 1.23, 95% CI 0.27 to 5.53; participants = 616; studies = 3), Analysis 3.4. Results did not demonstrate heterogeneity (I2 = 0%). These studies showed also a similar frequency in major bleeding in the IPC plus aspirin control (2/275, 0.7%) and IPC plus pharmacological prophylaxis treatment groups (2/341, 0.6%) (OR 0.80, 95% CI 0.15 to 4.17; participants = 616; studies = 3), Analysis 3.5. Results did not demonstrate heterogeneity (I2 = 0%). Fatal bleeding during the intervention period was not reported.
Subgroup analysis according to surgery type
IPC plus pharmacological prophylaxis versus IPC in orthopedic and non‐orthopedic participants
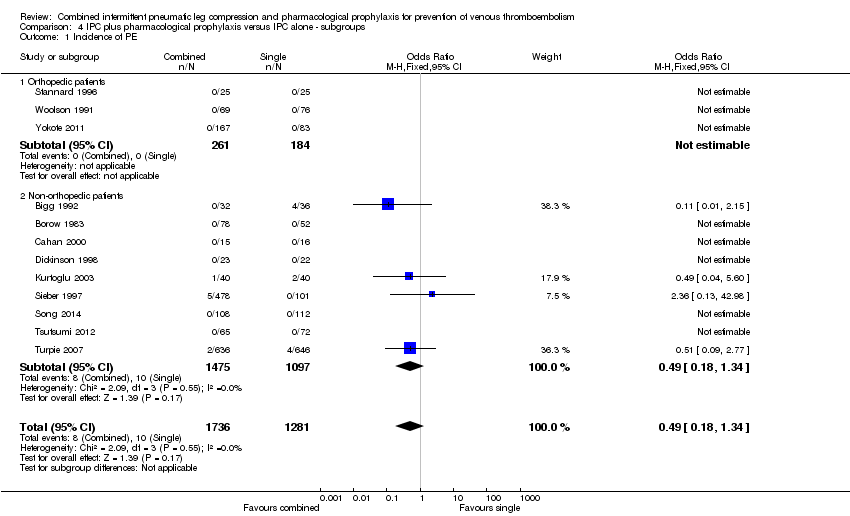
Three studies evaluated the role of combined modalities on the incidence of symptomatic PE in orthopedic participants (Stannard 1996; Woolson 1991; Yokote 2011). There were no events, which precluded any comparison (Analysis 4.1).
Nine studies evaluated the role of combined modalities versus IPC alone on the incidence of symptomatic PE in participants not undergoing orthopedic surgery (Bigg 1992; Borow 1983; Cahan 2000; Dickinson 1998; Kurtoglu 2003; Sieber 1997; Song 2014; Tsutsumi 2012; Turpie 2007). These studies showed no difference in the incidence of PE ( 0.91% (10/1097) in the control group and 0.54% (8/1475) in the combined treatment group(OR 0.49, 95% CI 0.18 to 1.34; participants = 2572; studies = 9), Analysis 4.1. Results did not demonstrate heterogeneity (I2 = 0%).
It was not possible to test for differences between the orthopedic and non‐orthopedic subgroups for PE incidence as no PE events were reported in the orthopedic subgroup.
The same three studies evaluated the role of combined modalities on the incidence of DVT in orthopedic participants (Stannard 1996; Woolson 1991; Yokote 2011). These studies showed no difference in the incidence of DVT (8.15% (15/184) in the control group and 6.51% (17/261) in the combined treatment group OR 0.80, 95% CI 0.38 to 1.69; participants = 445; studies = 3), Analysis 4.2. Results did not demonstrate heterogeneity (I2 = 0%).
Eight studies evaluated the role of combined modalities on the incidence of DVT in participants not under going orthopedic surgery (Borow 1983; Cahan 2000; Dickinson 1998; Kurtoglu 2003; Sieber 1997; Song 2014; Tsutsumi 2012; Turpie 2007). These studies showed a reduction in DVT for the combined treatment group (3.40% (36/1059) in the control group and 1.40% (20/1430) in the combined treatment group, OR 0.41, 95% CI 0.23 to 0.73; participants = 2489; studies = 8), Analysis 4.2. Results did not demonstrate heterogeneity (I2 = 0%).
No difference was detected between the orthopedic and non‐orthopedic subgroups for DVT incidence (P = 0.16).
IPC plus pharmacological prophylaxis versus pharmacological prophylaxis in orthopedic and non‐orthopedic participants
Six studies evaluated the role of combined modalities on the incidence of symptomatic PE in orthopedic participants (Bradley 1993; Edwards 2008; Sakai 2016; Silbersack 2004; Stannard 1996; Windisch 2011). These trials showed no difference in PE (0.54% (2/370) in the control group and 0.28% (1/362) in the combined treatment group, OR 0.58, 95% CI 0.08 to 4.49; participants = 732; studies = 6), Analysis 5.1. Results did not demonstrate heterogeneity (I2 = 0%).
Four studies evaluated the role of combined modalities versus pharmacological prophylaxis alone on the incidence of symptomatic PE in participants not undergoing orthopedic surgery (Borow 1983; Cahan 2000; Dickinson 1998; Ramos 1996). These studies showed a reduction in incidence of PE in favor of the combined treatment group; 3.58% (48/1341) in the control group and 1.43% (21/1471) in the combined treatment group (OR 0.38, 95% CI 0.22 to 0.63; participants = 2812; studies = 4), Analysis 5.1. Heterogeneity could not be calculated as only one study reported any PE events (Ramos 1996).
No difference was detected between the orthopedic and non‐orthopedic subgroups for PE incidence (P = 0.68).
Eight studies investigated the role of combined modalities on the incidence of DVT in orthopedic participants (Bradley 1993; Edwards 2008; Eisele 2007; Sakai 2016; Silbersack 2004; Siragusa 1994; Stannard 1996; Windisch 2011). These trials showed a reduction in incidence of DVT in favor of the combined treatment group; 6.66% (87/1307) in the control group to 2.79% (36/1298) in the combined treatment group OR 0.32, 95% CI 0.12 to 0.86; participants = 2605; studies = 8), Analysis 5.2. Results did demonstrate significant heterogeneity (I2 = 73%), and a random‐effects model was used.
Three studies investigated the role of combined modalities versus pharmacological prophylaxis alone on the incidence of DVT in participants not undergoing orthopedic surgery (Borow 1983; Cahan 2000; Dickinson 1998). These trials showed a similar frequency in DVT, 2.07% (3/145) in the control group and 4.31% (5/116) in the combined treatment group, OR 1.77, 95% CI 0.30 to 10.58; participants = 261; studies = 3), Analysis 5.2. Results demonstrated low heterogeneity (I2 = 14%).
No difference was detected between the orthopedic and non‐orthopedic subgroups for DVT incidence (P = 0.1).
IPC plus pharmacological prophylaxis versus IPC plus aspirin ‐ subgroups
The three studies in this comparison all included orthopedic participants and therefore subgroup analyses between orthopedic and non‐orthopedic groups were not possible (Westrich 2005; Westrich 2006; Woolson 1991). Details of the studies in this comparison are reported above and in Analysis 3.1 and Analysis 3.2.
Sensitivity analysis
Randomized controlled trials only ‐ intermittent pneumatic leg compression (IPC) plus pharmacological prophylaxis versus IPC alone
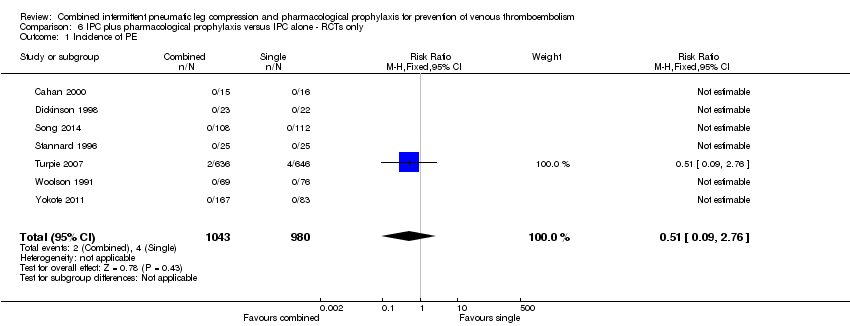
Seven RCTs evaluated the role of combined modalities on the incidence of symptomatic PE (Cahan 2000; Dickinson 1998; Song 2014; Stannard 1996; Turpie 2007; Woolson 1991; Yokote 2011). These trials showed no difference in incidence of PE; 0.41% (4/980) in the control group to 0.19% (2/1043) in the combined group, RR 0.51, 95% CI 0.09 to 2.76; participants = 2023; studies = 7), Analysis 6.1. Results did not demonstrate heterogeneity (I2 = 0%).
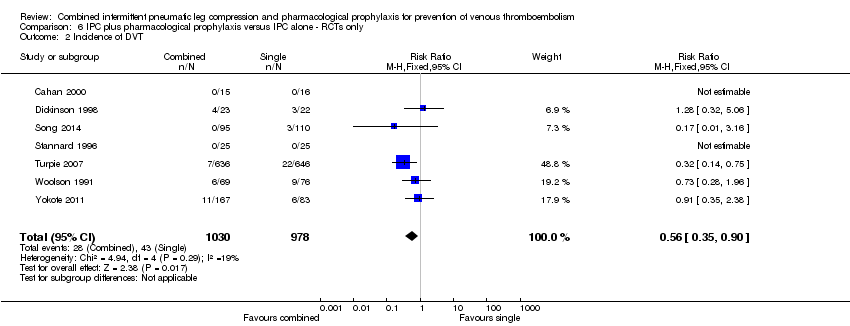
The same RCTs evaluated the role of combined modalities on the incidence of DVT (Cahan 2000; Dickinson 1998; Song 2014; Stannard 1996; Turpie 2007; Woolson 1991; Yokote 2011). These trials showed a reduction in DVT in favor of the combined treatment group; 4.40% (43/978) in the control group and 2.72% (28/1030) in the combined treatment group, RR 0.56, 95% CI 0.35 to 0.90; participants = 2008; studies = 7), Analysis 6.2. Low heterogeneity was present (I2 = 19%).
Randomized controlled trials only ‐ IPC plus pharmacological prophylaxis versus pharmacological prophylaxis alone
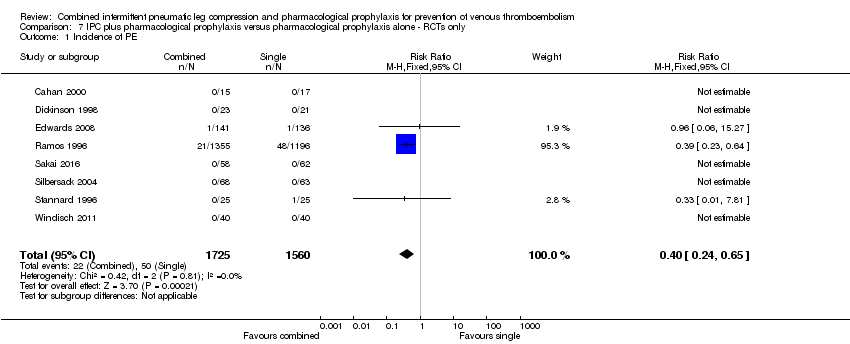
Eight RCTs evaluated the effect of combined modalities on the incidence of symptomatic PE (Cahan 2000; Dickinson 1998; Edwards 2008, Ramos 1996; Sakai 2016; Silbersack 2004; Stannard 1996; Windisch 2011). These trials showed a reduction in the incidence of PE in favor of the combined treatment group; 3.20% (50/1560) in the control group and 1.28% (22/1725) in the combined treatment group, RR 0.40, 95% CI 0.24 to 0.65; participants = 3285; studies = 8), Analysis 7.1. Results did not demonstrate heterogeneity (I2 = 0%).
Nine RCTs investigated the role of combined modalities on the incidence of DVT (Cahan 2000; Dickinson 1998; Edwards 2008, Eisele 2007; Sakai 2016; Silbersack 2004; Siragusa 1994; Stannard 1996; Windisch 2011). These trials showed no difference in incidence of DVT; 5.84% (76/1301) in the control group and 2.91% (38/1306) in the combined treatment group, RR 0.49, 95% CI 0.19 to 1.26; participants = 2607; studies = 9), Analysis 7.2. Substantial heterogeneity was present (I2 = 76%).
Randomized controlled trials only ‐ IPC plus pharmacological prophylaxis versus IPC plus aspirin
Two RCTs evaluated the role of these combined modalities on the incidence of symptomatic PE (Westrich 2006; Woolson 1991). These trials showed no difference in PE; 1.00% (2/201) in the IPC plus aspirin control group and 0% (0/204) in the IPC plus pharmacological prophylaxis treatment group,RR 0.33, 95% CI 0.03 to 3.17; participants = 405; studies = 2), Analysis 8.1. Results did not demonstrate heterogeneity (I2 = 0%).
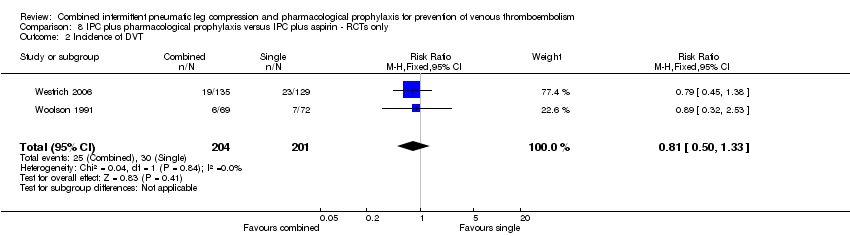
The same trials investigated the role of combined modalities on the incidence of DVT. These showed no difference in DVT; 14.92% (30/201) in the IPC plus aspirin control group and 12.25% (25/204) in the PC plus pharmacological prophylaxis treatment group, RR 0.81, 95% CI 0.50 to 1.33; participants = 405; studies = 2), Analysis 8.2. Results did not demonstrate heterogeneity (I2 = 0%).
Exclusion of studies with risk of bias
Assessing the included trials for risk of bias showed a high number of studies at high risk for performance bias and at unclear risk for selection and detection bias. See Figure 2 and Figure 3.
Below we report those analyses that show a change in direction of the effect when high risk of bias studies were excluded from the analyses. No change in direction of effect were identified for the other analyses.
Sensitivity analysis excluding studies at high risk for selection bias (random sequence generation issues: Bigg 1992; Borow 1983; Bradley 1993; Kurtoglu 2003; Sieber 1997; Tsutsumi 2012; Westrich 2005), revealed in Analysis 5.2 that incidence of DVT in orthopedic participants (OR 0.32, 95% CI 0.12 to 0.86) was no longer significant (OR 0.34, 95% CI 0.11 to 1.03).
Sensitivity analyses excluding studies at high risk for selection bias (allocation concealment issues: Bigg 1992; Borow 1983; Bradley 1993; Kurtoglu 2003; Sakai 2016; Sieber 1997; Song 2014; Tsutsumi 2012; Westrich 2005) revealed that Analysis 2.2 (incidence of DVT for the comparison IPC plus pharmacological prophylaxis versus pharmacological prophylaxis alone (OR 0.42, 95% CI 0.18 to 1.03; P = 0.06) became significant (OR 0.32, 95% CI 0.12 to 0.84; P = 0.02). Analysis 7.2 showed that the incidence of DVT for the comparison IPC plus pharmacological prophylaxis versus pharmacological prophylaxis alone with RCTs only (RR 0.49, 95% CI 0.19 to 1.26) also became significant (RR 0.37, 95% CI 0.15 to 0.89).
Sensitivity analyses excluding studies with a high or unclear risk for blinding of outcome assessment (detection bias: Bigg 1992; Borow 1983; Cahan 2000; Dickinson 1998; Edwards 2008; Eisele 2007; Ramos 1996; Sakai 2016; Sieber 1997; Silbersack 2004; Siragusa 1994; Song 2014; Tsutsumi 2012; Westrich 2005; Westrich 2006; Woolson 1991), revealed that Analysis 2.1 (incidence of PE for the comparison IPC plus pharmacological prophylaxis versus pharmacological prophylaxis alone (OR 0.39, 95% CI 0.23 to 0.64; P = 0.0002) was no longer significant (OR 0.32, 95% CI 0.01 to 8.25; P = 0.49) and similarly in Analysis 7.1 for RCTs only (OR 0.33, 95% CI 0.01 to 7.81). In Analysis 2.2 (incidence of DVT for the comparison IPC plus pharmacological prophylaxis versus pharmacological prophylaxis alone (OR 0.42, 95% CI 0.18 to 1.03; P = 0.06) became significant (OR 0.15, 95% CI 0.04 to 0.62; P = 0.008).
Sensitivity analyses excluding studies with a high risk for attrition bias (incomplete outcome data) (Song 2014; Turpie 2007), revealed that Analysis 1.2 (incidence of DVT for the comparison IPC plus pharmacological prophylaxis versus IPC alone; OR 0.52, 95% CI 0.33 to 0.82; P = 0.005) was no longer significant (OR 0.72, 95% CI 0.41 to 1.26; P = 0.25). A similar change in the level of effect was seen in Analysis 4.2 for the subgroup of non‐orthopedic participants which showed OR 0.62, 95% CI 0.27 to 1.44), Analysis 6.2 (OR 0.89, 95% CI 0.48 to 1.64) and Analysis 7.1 (OR 0.59, 95% CI 0.08 to 4.40) both for RCTs only. However for Analysis 5.1, no studies were left for the non‐orthopedic subgroup after removing Ramos 1996. For Analysis 2.1 the incidence of PE for the comparison IPC plus pharmacological prophylaxis versus pharmacological prophylaxis (OR 0.39, 95% CI 0.23 to 0.64; P = 0.0002) was no longer significant (OR 0.58, 95% CI 0.08 to 4.49; P = 0.60).
Sensitivity analysis excluding studies with a high risk for other bias (Dickinson 1998; Edwards 2008; Sakai 2016) revealed that Analysis 2.2 (incidence of DVT for the comparison IPC plus pharmacological prophylaxis versus pharmacological prophylaxis) became significant (OR 0.20, 95% CI 0.11 to 0.37; I2 = 29%) and so did Analysis 7.2 (RR 0.22, 95% CI 0.06 to 0.79) comparing RCTs only.
Sensitivity analysis excluding studies with a high risk for performance bias (blinding of participants and personnel) was not performed because only two studies were deemed to be of low risk of performance bias (Turpie 2007; Yokote 2011).
Regarding the outcomes of bleeding and major bleeding, sensitivity analyses excluding studies with a high risk for all types of bias was performed only for the comparison of combined modalities versus IPC because the number of studies reporting on bleeding in the remaining comparisons was insufficient to show meaningful results. No changes were observed in the direction of effect of bleeding when excluding studies with a high risk for all types of bias.
Discussion
Summary of main results
Our review showed that combined modalities are more effective than single modalities in reducing the incidence of deep vein thrombosis (DVT) when compared to compression and incidence of pulmonary (PE) when compared to anticoagulation. Our review showed no difference between combined and single modalities in the incidence of PE when compared with compression alone and DVT when compared with anticoagulation alone. For PE this was likely caused by the low number of events and can be attributed to a type II error, i.e. an incorrect retention of the null hypothesis. The latter also applies to the studies that investigated the combination of compression plus anticoagulant with compression plus aspirin. However the quality of evidence for the research that supports these conclusions was judged to be moderate as a result of bias being present in several domains. The addition of an anticoagulant to IPC, however, increased the risk of bleeding compared to IPC alone, a side effect not observed for IPC when added to anticoagulation, as indeed expected for a physical method of thromboprophylaxis. These findings highlight the need to tailor the use of additional pharmacological thromboprophylaxis in patients at low risk for bleeding or those where bleeding does not have catastrophic consequences. This issue deserves further study since the criteria for major bleeding were not uniform across the studies, with some of them reporting on blood loss during the procedures or through the drains nor providing rates for postoperative bleeding.
The mechanism responsible for the improved effectiveness of combined modalities may be attributed to the fact that DVT is a multifactorial process. Virchow in 1856 suggested that venous stasis, coagulopathy and endothelial injury are all causes of VTE (Virchow 1856). By treating the different causes of VTE it is expected to improve efficacy in DVT prevention. Rosendaal more recently extended Virchow's theory by proposing a model of risk factors, which considered the importance of the additive role and interaction of multiple risk factors (multiple hit model) (Rosendaal 1999). Based on the additive role of mechanical and pharmacological modalities, the results of this review suggest that venous stasis and hypercoagulopathy are truly independent risk factors. IPC reduces venous stasis by producing active flow enhancement (Kakkos 2005), and also increases tissue factor pathway inhibitor (TFPI) plasma levels (Chouhan 1999). Unfractionated and low molecular weight heparin inhibit factor X. These totally different mechanisms of action are most likely responsible for the synergy between these two modality types.
Subgroup analysis confirmed the efficacy of adding compression to anticoagulation in DVT prevention in orthopedic participants, known to suffer from venous stasis, and also the efficacy of adding anticoagulation to compression in DVT prevention in non‐orthopedic participants, known to have frequently hypercoagulation due to the presence of sepsis, malignancy or other reasons. However the studies were underpowered regarding the other comparisons and also for the outcome of PE, with the exception of the comparison combined modalities versus anticoagulation in non‐orthopedic participants. Interestingly, some comparisons became significant after removing studies deemed to be high risk for bias, as presented in the results section of this review. Similarly, comparisons for symptomatic DVT were also underpowered and further studies may be required. Interestingly, the subgroup analysis of the comparison IPC plus pharmacological prophylaxis versus pharmacological prophylaxis, restricted to IPCs other than foot IPCs was significantly in favor of the combined modalities, unlike the analysis of all IPCs combined, perhaps because the potentially less effective foot IPCs were not included.
Pulmonary embolism risk‐reduction rates were mostly consistent across the studies with no heterogeneity, perhaps because symptomatic PE is a clinically significant complication. In contrast, some heterogeneity was noted in the results on DVT reduction, particularly in non‐orthopedic participants. This might have been related to the fact that methodological quality of the assessed studies was low, with allocation concealment usually being unclear and performance bias usually being high. An alternative explanation is that the heterogeneity of the included participants who underwent various surgical procedures resulted in a variable risk of DVT. Indeed subgroup analysis by patient characteristic provided results with better heterogeneity.
The results of our review endorse the recommendations of the venous thromboembolism prevention guidelines that high‐risk patients should receive multimodal prophylaxis (Gould 2012; NICE 2009; Nicolaides 2013).
Overall completeness and applicability of evidence
The studies included in this review were carried out in a wide range of patient groups undergoing orthopedic but also urological, cardiothoracic, general surgery neurosurgery, gynecology procedures and trauma patients. Most of the participants had a high‐risk procedure or condition and, therefore, the results of this review are not necessarily applicable to different patient groups, where a much lower risk may reduce the absolute risk reduction with combined modalities.
In an effort to investigate the applicability of combined modalities in orthopedic and non‐orthopedic participants, subgroup analysis was performed, confirming the efficacy of adding compression to anticoagulation in orthopedic patients, and the efficacy of adding anticoagulation to compression in non‐orthopedic patients, results that indicate a need for further research in particular patient populations. Since studies on combined modalities are mostly performed in patients at a high risk for VTE, the absolute benefit that would be observed is expected to be much lower in moderate‐risk patients, calling for cost‐effectiveness calculations and studies.
Additionally, it should be noted that the various IPC types may not have the same effectiveness and should not be used interchangeably, for example foot pumps versus calf or calf and thigh leggings, taking into account the results of Analysis 2.4.
A potential confounding factor in the present review is the concurrent use of elastic stockings, very often used together with IPC.
Also, it should be mentioned that medical (non‐surgical) patients were not included in the present review because such studies were not identified by the literature searches.
Reporting of bleeding outcomes (major and minor bleeding) was not uniform across the studies, with some studies reporting on blood loss during the procedures or through the drains or providing rates for postoperative bleeding. Definitions used were also not uniform. This issue deserves further study.
Quality of the evidence
This review included some 9137 participants who were studied in 22 trials (15 RCTs). This provided a body of evidence to investigate our hypothesis that combined modalities are more effective than their single counterparts. However, risk for performance bias was high in most studies and risk for selection and detection bias was mostly unclear. Nevertheless, the results of the present meta‐analysis update are generally consistent with a low amount of heterogeneity in almost all comparisons.
Using GRADE assessment, the quality of evidence for DVT and PE prevention with combined modalities is considered as being moderate. See summary of findings Table for the main comparison and summary of findings Table 2. Regarding PE for the comparison of combined modalities with IPC alone, the quality of the evidence is downgraded due to very few events with only 4/12 studies contributing to the effect estimate leading to imprecision probably because of a type II error. For the comparison of combined modalities with anticoagulation, the quality of the evidence for PE is downgraded due to detection bias as a sensitivity analysis excluding studies at high or unclear risk of detection bias no longer show a reduction in the incidence of PE. Possible explanations for these two observations regarding PE include the elimination of low quality research leading to more accurate albeit negative results and also reduction of the number of studies and events (i.e. reduced the overall power to detect a difference). Since PE is a form of VTE, like DVT, we think that the second explanation is more rational than the first one. For DVT for both comparisons (combined modalities compared with IPC or anticoagulation) the quality of the evidence is downgraded to moderate due to risk of bias.
The quality of the evidence for bleeding and major bleeding for the comparison combined modalities versus IPC is moderate. The quality of the evidence was downgraded for indirectness as definitions of bleeding and the reporting of bleeding outcomes was not uniform across studies.
The quality of the evidence for bleeding and major bleeding for the comparison combined modalities versus pharmacological prophylaxis is very low. The quality of the evidence is downgraded for risk of bias due to blinding, indirectness (because the definition of bleeding and reporting of bleeding outcomes was not uniform across studies) and imprecision (due to the small number of participants and few events).
Potential biases in the review process
The review authors have made an enormous effort to identify potential trials for inclusion in the present review. Publication bias still could have limited the validity of our results.
This review set out to assess RCTs and CCTs. Many of the CCTs are old and the reporting of the study methodology is often poor. In addition, patient care and standard practice has changed considerably since then. When assessing the incidence of DVT and PE in RCTs only the overall direction and size of the effects were not affected. This was likely caused by the fact that many CCTs did not contribute to the analysis due to small number of reported events. However, when sufficient RCTs become available to perform meaningful analyses of the planned subgroups we will consider including RCTs only.
The review assessed symptomatic or asymptomatic DVT and symptomatic PE as outcomes. In future updates, data permitting, we will add proximal DVT and clinically important VTE (proximal DVT and symptomatic PE) as additional important outcomes.
In order to be as inclusive as possible and because not all studies reported on the type of IPC devices used, we included all IPC devices. This resulted in including some devices that may no longer be used in some parts of the world.
We performed no formal assessment of side effects of IPC. However, from the included studies we note these were rarely encountered and recorded by the studies. We will look into this in more detail in future updates.
Agreements and disagreements with other studies or reviews
The results presented here agree with previous systematic meta‐analyses on this topic (Ho 2013; Kakkos 2012; Sobieraj 2013; Zareba 2014), which showed that combined modalities are significantly better than single prophylactic modalities. The studies included in these reviews were mostly restricted to a particular patient category or were limited by the fact that they used IPC interchangeably with elastic stockings, which is a limitation when interpretation of the results is attempted.
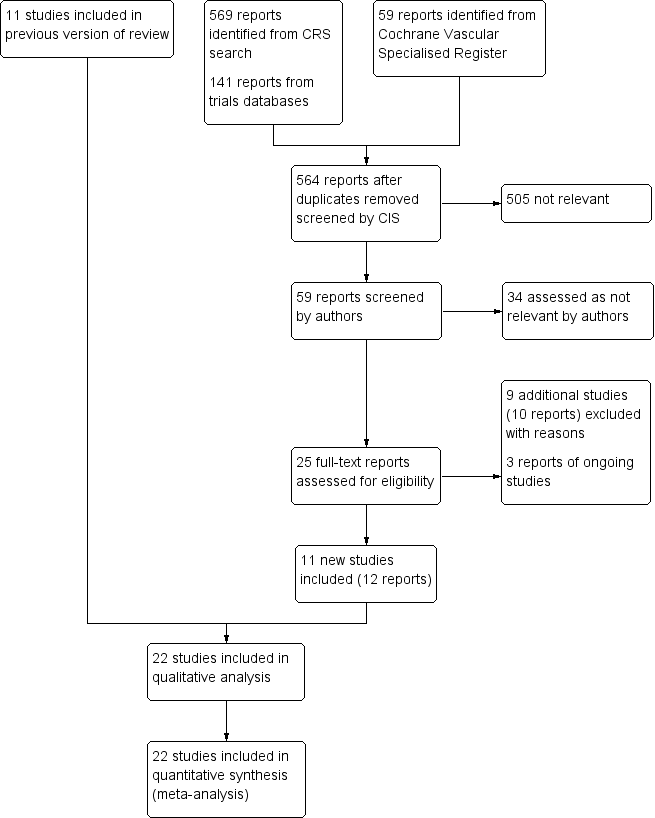
Study flow diagram.
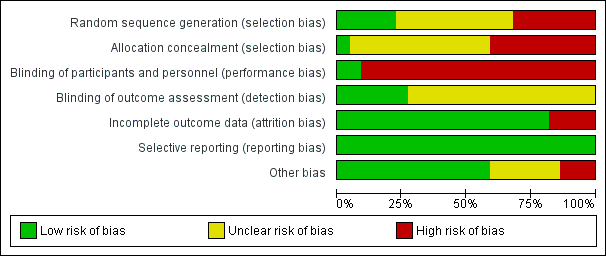
Risk of bias graph: review authors' judgements about each risk of bias item presented as percentages across all included studies.

Risk of bias summary: review authors' judgements about each risk of bias item for each included study.
Comparison 1 IPC plus pharmacological prophylaxis versus IPC alone, Outcome 1 Incidence of PE.
Comparison 1 IPC plus pharmacological prophylaxis versus IPC alone, Outcome 2 Incidence of DVT.
Comparison 1 IPC plus pharmacological prophylaxis versus IPC alone, Outcome 3 Incidence of symptomatic DVT.
Comparison 1 IPC plus pharmacological prophylaxis versus IPC alone, Outcome 4 Incidence of DVT by foot IPC or other IPC.
Comparison 1 IPC plus pharmacological prophylaxis versus IPC alone, Outcome 5 Incidence of bleeding.

Comparison 1 IPC plus pharmacological prophylaxis versus IPC alone, Outcome 6 Incidence of major bleeding.

Comparison 2 IPC plus pharmacological prophylaxis versus pharmacological prophylaxis alone, Outcome 1 Incidence of PE.

Comparison 2 IPC plus pharmacological prophylaxis versus pharmacological prophylaxis alone, Outcome 2 Incidence of DVT.
Comparison 2 IPC plus pharmacological prophylaxis versus pharmacological prophylaxis alone, Outcome 3 Incidence of symptomatic DVT.
Comparison 2 IPC plus pharmacological prophylaxis versus pharmacological prophylaxis alone, Outcome 4 Incidence of DVT by foot IPC or other IPC.

Comparison 2 IPC plus pharmacological prophylaxis versus pharmacological prophylaxis alone, Outcome 5 Incidence of bleeding.

Comparison 2 IPC plus pharmacological prophylaxis versus pharmacological prophylaxis alone, Outcome 6 Incidence of major bleeding.

Comparison 3 IPC plus pharmacological prophylaxis versus IPC plus aspirin, Outcome 1 Incidence of PE.

Comparison 3 IPC plus pharmacological prophylaxis versus IPC plus aspirin, Outcome 2 Incidence of DVT.

Comparison 3 IPC plus pharmacological prophylaxis versus IPC plus aspirin, Outcome 3 Incidence of symptomatic DVT.

Comparison 3 IPC plus pharmacological prophylaxis versus IPC plus aspirin, Outcome 4 Incidence of bleeding.
Comparison 3 IPC plus pharmacological prophylaxis versus IPC plus aspirin, Outcome 5 Incidence of major bleeding.
Comparison 4 IPC plus pharmacological prophylaxis versus IPC alone ‐ subgroups, Outcome 1 Incidence of PE.

Comparison 4 IPC plus pharmacological prophylaxis versus IPC alone ‐ subgroups, Outcome 2 Incidence of DVT.

Comparison 5 IPC plus pharmacological prophylaxis versus pharmacological prophylaxis alone ‐ subgroups, Outcome 1 Incidence of PE.

Comparison 5 IPC plus pharmacological prophylaxis versus pharmacological prophylaxis alone ‐ subgroups, Outcome 2 Incidence of DVT.
Comparison 6 IPC plus pharmacological prophylaxis versus IPC alone ‐ RCTs only, Outcome 1 Incidence of PE.
Comparison 6 IPC plus pharmacological prophylaxis versus IPC alone ‐ RCTs only, Outcome 2 Incidence of DVT.
Comparison 7 IPC plus pharmacological prophylaxis versus pharmacological prophylaxis alone ‐ RCTs only, Outcome 1 Incidence of PE.

Comparison 7 IPC plus pharmacological prophylaxis versus pharmacological prophylaxis alone ‐ RCTs only, Outcome 2 Incidence of DVT.

Comparison 8 IPC plus pharmacological prophylaxis versus IPC plus aspirin ‐ RCTs only, Outcome 1 Incidence of PE.
Comparison 8 IPC plus pharmacological prophylaxis versus IPC plus aspirin ‐ RCTs only, Outcome 2 Incidence of DVT.
| Does combined intermittent pneumatic compression (IPC) plus pharmacological prophylaxis increase prevention of venous thromboembolism compared with IPC alone? | ||||||
| Patient or population: patients undergoing surgery or at risk of developing VTE because of other reasons (e.g. trauma) Settings: hospital (surgery, trauma or ICU stay) Intervention: combined IPC plus pharmacological prophylaxis Comparison: IPC alone | ||||||
| Outcomes | Illustrative comparative risks* (95% CI) | Relative effect | No of participants | Quality of the evidence | Comments | |
| Assumed risk | Corresponding risk | |||||
| Single modalities | Combined modalities | |||||
| Incidence of PEa | 8 per 1000 | 4 per 1000 (1 to 10) | OR 0.49 (0.18 to 1.34) | 3017 (12) | ⊕⊕⊕⊝ | |
| Incidence of DVTb | 41 per 1000 | 22 per 1000 (14 to 34) | OR 0.52 (0.33 to 0.82) | 2934 (11) | ⊕⊕⊕⊝ | |
| Incidence of bleedingc | 7 per 1000 | 33 per 1000 (16 to 67) | OR 5.04 (2.36 to 10.77) | 2155 (7) | ⊕⊕⊕⊝ moderate3 | |
| Incidence of major bleedingd | 1 per 1000 | 6 per 1000 (2 to 22) | OR 6.81 (1.99 to 23.28) | 2155 (7) | ⊕⊕⊕⊝ moderate3 | |
| * The basis for the assumed risk was the average risk in the single modalities group (i.e. the number of participants with events divided by total number of participants of the single modalities group included in the meta‐analysis). The corresponding risk (and its 95% confidence interval) is based on the assumed risk in the comparison group and the relative effect of the intervention (and its 95% CI) | ||||||
| GRADE Working Group grades of evidence | ||||||
| a PE assessed by pulmonary angiography or scintigraphy, computed tomography (CT), angiography, or autopsy | ||||||
| Does combined intermittent pneumatic compression (IPC) plus pharmacological prophylaxis increase prevention of venous thromboembolism compared with pharmacological prophylaxis alone? | ||||||
| Patient or population: patients undergoing surgery or at risk of developing VTE because of other reasons (e.g. trauma) Settings: hospital (surgery, trauma or ICU stay) Intervention: combined IPC plus pharmacological prophylaxis Comparison: pharmacological prophylaxis alone | ||||||
| Outcomes | Illustrative comparative risks* (95% CI) | Relative effect | No of participants | Quality of the evidence | Comments | |
| Assumed risk | Corresponding risk | |||||
| Single modalities | Combined modalities | |||||
| Incidence of PEa | 29 per 1000 | 12 per 1000 (7 to 19) | OR 0.39 (0.23 to 0.64) | 3544 (10) | ⊕⊕⊕⊝ | |
| Incidence of DVTb | 62 per 1000 | 27 per 1000 (12 to 64) | OR 0.42 (0.18 to 1.03) | 2866 (11) | ⊕⊕⊕⊝ | |
| Incidence of bleedingc | 81 per 1000 | 66 per 1000 (26 to 159) | OR 0.8 (0.3 to 2.14 | 244 (3) | ⊕⊝⊝⊝ very low3 | |
| Incidence of major bleedingd | 41 per 1000 | 49 per 1000 (15 to 150) | OR 1.21 (0.35 to 4.18) | 244 (3) | ⊕⊝⊝⊝ very low3 | |
| *The basis for the assumed risk was the average risk in the single modalities group (i.e. the number of participants with events divided by total number of participants of the single modalities group included in the meta‐analysis). The corresponding risk (and its 95% confidence interval) is based on the assumed risk in the comparison group and the relative effect of the intervention (and its 95% CI) | ||||||
| GRADE Working Group grades of evidence | ||||||
| a PE assessed by pulmonary angiography or scintigraphy, computed tomography (CT), angiography, or autopsy 1 Downgraded by one level due to risk of detection and attrition bias affecting effect estimate as shown by sensitivity analysis | ||||||
| Outcome or subgroup title | No. of studies | No. of participants | Statistical method | Effect size |
| 1 Incidence of PE Show forest plot | 12 | 3017 | Odds Ratio (M‐H, Fixed, 95% CI) | 0.49 [0.18, 1.34] |
| 2 Incidence of DVT Show forest plot | 11 | 2934 | Odds Ratio (M‐H, Fixed, 95% CI) | 0.52 [0.33, 0.82] |
| 3 Incidence of symptomatic DVT Show forest plot | 6 | 2526 | Odds Ratio (M‐H, Fixed, 95% CI) | 0.49 [0.16, 1.47] |
| 4 Incidence of DVT by foot IPC or other IPC Show forest plot | 11 | 2934 | Odds Ratio (M‐H, Fixed, 95% CI) | 0.52 [0.33, 0.82] |
| 4.1 foot IPC | 1 | 50 | Odds Ratio (M‐H, Fixed, 95% CI) | 0.0 [0.0, 0.0] |
| 4.2 other IPC | 10 | 2884 | Odds Ratio (M‐H, Fixed, 95% CI) | 0.52 [0.33, 0.82] |
| 5 Incidence of bleeding Show forest plot | 7 | 2155 | Odds Ratio (M‐H, Fixed, 95% CI) | 5.04 [2.36, 10.77] |
| 6 Incidence of major bleeding Show forest plot | 7 | 2155 | Odds Ratio (M‐H, Fixed, 95% CI) | 6.81 [1.99, 23.28] |
| Outcome or subgroup title | No. of studies | No. of participants | Statistical method | Effect size |
| 1 Incidence of PE Show forest plot | 10 | 3544 | Odds Ratio (M‐H, Fixed, 95% CI) | 0.39 [0.23, 0.64] |
| 2 Incidence of DVT Show forest plot | 11 | 2866 | Odds Ratio (M‐H, Random, 95% CI) | 0.42 [0.18, 1.03] |
| 3 Incidence of symptomatic DVT Show forest plot | 5 | 2312 | Odds Ratio (M‐H, Fixed, 95% CI) | 1.02 [0.29, 3.54] |
| 4 Incidence of DVT by foot IPC or other IPC Show forest plot | 11 | 2866 | Odds Ratio (M‐H, Random, 95% CI) | 0.42 [0.18, 1.03] |
| 4.1 foot IPC | 4 | 324 | Odds Ratio (M‐H, Random, 95% CI) | 0.40 [0.05, 3.47] |
| 4.2 other IPC | 7 | 2542 | Odds Ratio (M‐H, Random, 95% CI) | 0.39 [0.16, 0.96] |
| 5 Incidence of bleeding Show forest plot | 3 | 244 | Odds Ratio (M‐H, Fixed, 95% CI) | 0.80 [0.30, 2.14] |
| 6 Incidence of major bleeding Show forest plot | 3 | 244 | Odds Ratio (M‐H, Fixed, 95% CI) | 1.21 [0.35, 4.18] |
| Outcome or subgroup title | No. of studies | No. of participants | Statistical method | Effect size |
| 1 Incidence of PE Show forest plot | 3 | 605 | Odds Ratio (M‐H, Fixed, 95% CI) | 0.33 [0.03, 3.19] |
| 2 Incidence of DVT Show forest plot | 3 | 605 | Odds Ratio (M‐H, Fixed, 95% CI) | 0.83 [0.48, 1.42] |
| 3 Incidence of symptomatic DVT Show forest plot | 1 | Odds Ratio (M‐H, Fixed, 95% CI) | Totals not selected | |
| 4 Incidence of bleeding Show forest plot | 3 | 616 | Odds Ratio (M‐H, Fixed, 95% CI) | 1.23 [0.27, 5.53] |
| 5 Incidence of major bleeding Show forest plot | 3 | 616 | Odds Ratio (M‐H, Fixed, 95% CI) | 0.80 [0.15, 4.17] |
| Outcome or subgroup title | No. of studies | No. of participants | Statistical method | Effect size |
| 1 Incidence of PE Show forest plot | 12 | 3017 | Odds Ratio (M‐H, Fixed, 95% CI) | 0.49 [0.18, 1.34] |
| 1.1 Orthopedic patients | 3 | 445 | Odds Ratio (M‐H, Fixed, 95% CI) | 0.0 [0.0, 0.0] |
| 1.2 Non‐orthopedic patients | 9 | 2572 | Odds Ratio (M‐H, Fixed, 95% CI) | 0.49 [0.18, 1.34] |
| 2 Incidence of DVT Show forest plot | 11 | 2934 | Odds Ratio (M‐H, Fixed, 95% CI) | 0.52 [0.33, 0.82] |
| 2.1 Orthopedic patients | 3 | 445 | Odds Ratio (M‐H, Fixed, 95% CI) | 0.80 [0.38, 1.69] |
| 2.2 Non‐orthopedic patients | 8 | 2489 | Odds Ratio (M‐H, Fixed, 95% CI) | 0.41 [0.23, 0.73] |
| Outcome or subgroup title | No. of studies | No. of participants | Statistical method | Effect size |
| 1 Incidence of PE Show forest plot | 10 | 3544 | Odds Ratio (M‐H, Fixed, 95% CI) | 0.39 [0.23, 0.64] |
| 1.1 Orthopedic patients | 6 | 732 | Odds Ratio (M‐H, Fixed, 95% CI) | 0.58 [0.08, 4.49] |
| 1.2 Non‐orthopedic patients | 4 | 2812 | Odds Ratio (M‐H, Fixed, 95% CI) | 0.38 [0.22, 0.63] |
| 2 Incidence of DVT Show forest plot | 11 | 2866 | Odds Ratio (M‐H, Random, 95% CI) | 0.42 [0.18, 1.03] |
| 2.1 Orthopedic patients | 8 | 2605 | Odds Ratio (M‐H, Random, 95% CI) | 0.32 [0.12, 0.86] |
| 2.2 Non‐orthopedic patients | 3 | 261 | Odds Ratio (M‐H, Random, 95% CI) | 1.77 [0.30, 10.58] |
| Outcome or subgroup title | No. of studies | No. of participants | Statistical method | Effect size |
| 1 Incidence of PE Show forest plot | 7 | 2023 | Risk Ratio (M‐H, Fixed, 95% CI) | 0.51 [0.09, 2.76] |
| 2 Incidence of DVT Show forest plot | 7 | 2008 | Risk Ratio (M‐H, Fixed, 95% CI) | 0.56 [0.35, 0.90] |
| Outcome or subgroup title | No. of studies | No. of participants | Statistical method | Effect size |
| 1 Incidence of PE Show forest plot | 8 | 3285 | Risk Ratio (M‐H, Fixed, 95% CI) | 0.40 [0.24, 0.65] |
| 2 Incidence of DVT Show forest plot | 9 | 2607 | Risk Ratio (M‐H, Random, 95% CI) | 0.49 [0.19, 1.26] |
| Outcome or subgroup title | No. of studies | No. of participants | Statistical method | Effect size |
| 1 Incidence of PE Show forest plot | 2 | 405 | Risk Ratio (M‐H, Fixed, 95% CI) | 0.33 [0.03, 3.17] |
| 2 Incidence of DVT Show forest plot | 2 | 405 | Risk Ratio (M‐H, Fixed, 95% CI) | 0.81 [0.50, 1.33] |