Selenio para la prevención del cáncer
Referencias
References to studies included in this review
References to studies excluded from this review
References to ongoing studies
Additional references
References to other published versions of this review
Characteristics of studies
Characteristics of included studies [ordered by study ID]
| Methods | Nested case‐cohort study Country: Canada | |
| Participants | Name of parent cohort: Canadian Study of Diet, Lifestyle and Health (CSDLH) Recruitment: between 1995 and 1998 Number of cases: Case definition: incidence Years of follow‐up: 4.3 to 7.7 mean Type of selenium marker: supplementation | |
| Interventions | d.n.a. | |
| Outcomes | Statistical methods: Cox proportional hazard model | |
| Risk estimates [95% CI] | Reference category: zero Results: | |
| Selenium levels in exposure categories | Lowest quartile (median value): 15.7 µg | |
| Notes | ||
| Methods | Cohort/subcohort controlled cohort study Country: France | |
| Participants | Name of parent cohort: Etude du Vieillissement Antériel Study (EVA study) Recruitment: 1991 to 1993 Number of cases: Case definition: mortality Years of follow‐up: 9.0 Type of selenium marker: plasma | |
| Interventions | d.n.a. | |
| Outcomes | Statistical methods: Cox proportional hazard model | |
| Risk estimates [95% CI] | Reference category: highest quartile Results: | |
| Selenium levels in exposure categories | Lowest quartile: 14.2 to 75.0 µg/L | |
| Notes | ||
| Methods | Randomised controlled trial Allocation: random Sequence generation: unclear Concealment: Study agent (2 doses) and matched placebo caplets were coated with titanium oxide to ensure identical appearance, weight, taste, and smell. Blinding: described only as double‐blinded Dropouts/withdrawals: Study dropout percentage was 34.1%, 41.9%, and 40.8% for placebo, 200 mg/d selenium group, and 400 mg/d selenium group, respectively (P = 0.173). Intention‐to‐treat‐analysis: yes Recruitment period: not specified Treatment duration: not specified Observation period/dermatological follow‐up: Participants were followed every 6 months for up to 5 years. Detection of cases: Tissue samples from participants' qualifying biopsies were requested by participants' physicians and were compiled in a biospecimen repository. Informed consent: An external Data and Safety Monitoring Committee (DSMC) was established before study initiation. This committee was responsible for reviewing protocol amendments, consent forms, accrual and retention rates, adverse events, and data analysis reports. | |
| Participants | 699 male participants with a negative prostate biopsy Countries: United States, New Zealand Participants: 699 (randomised to selenium 200 µg/d: 234; to selenium 400 µg/d: 233; to placebo: 233) Condition: male patients at high risk for prostate cancer (prostate‐specific antigen (PSA) > 4 ng/mL and/or suspicious digital rectal examination and/or PSA velocity > 0.75 ng/mL/y), but with a negative prostate biopsy Demographics: mean age 65.2 ± SD 8 years (selenium 200 µg/d), 65.5 ± 7.7 years (selenium 400 µg/d), 65.5 ± 7.4 years (placebo) Recruitment and setting: urology offices at 20 sites in the United States and New Zealand | |
| Interventions | Intervention: • 200 µg/d selenium supplied as selenium yeast • 400 µg/d selenium supplied as selenium yeast Control: placebo Recruitment: not reported End of blinded treatment period: For participants in the United States, participation was complete at 5 years, whereas those in New Zealand received intervention for no longer than 3 years. | |
| Outcomes | Primary outcome measure: • Incidence of biopsy‐proven prostate cancer over the course of the study Other reported outcomes: • Secondary endpoint was rate of change of PSA over time (i.e. PSA velocity) based on biannual PSA measurements. | |
| Risk estimates [95% CI] | Primary outcomes: • Hazard ratios for risk of developing prostate cancer in the selenium 200‐µg/d or the selenium 400‐µg/d group were 0.94 (95% CI 0.52 to 1.7) and 0.90 (95% CI 0.48 to 1.70), respectively. Other reported outcomes: • PSA velocity in the selenium arms was not significantly different from that observed in the placebo group (P = 0.18 and P = 0.17, respectively). | |
| Selenium levels in exposure categories | d.n.a. | |
| Notes | The DSMC recommended that the trial be stopped before all participants completed the full intervention duration. Adverse effects: No significant differences were seen in the incidences of cataract/glaucoma or in hair/nail changes in the 3 treatment groups. HR: adjusted for age at baseline, baseline PSA, baseline selenium concentrations | |
| Risk of bias | ||
| Bias | Authors' judgement | Support for judgement |
| Random sequence generation (selection bias) | Low risk | Number‐based stratified randomisation |
| Allocation concealment (selection bias) | Low risk | Treatments and placebo tablets of identical appearance and taste |
| Blinding (performance bias and detection bias) | Low risk | Identical appearance, weight, taste, and smell of tablets for treatments and placebo |
| Selective reporting (reporting bias) | Low risk | No problems found |
| Methods | Matched, nested case‐control study Countries: Denmark, Germany, Greece, Italy, the Netherlands, Spain, Sweden, the UK | |
| Participants | Participants: approximately 130,000 men Name of parent cohort: European Prospective Investigation into Cancer and Nutrition (EPIC) Recruitment: 1992 to 2000 Number of cases: Case definition: incidence Years of follow‐up: median 2.6 (Greece) to 9.2 (Sweden) Type of selenium marker: plasma | |
| Interventions | d.n.a. | |
| Outcomes | Statistical methods: conditional logistical regression Variables controlled by matching: age, study centre, time of day of blood collection, time between blood collection and last meal, sex | |
| Risk estimates [95% CI] | Reference category: lowest quintile Results: | |
| Selenium levels in exposure categories | Lowest quintile < 62.0 µg/L Highest quintile ≥ 84.1 µg/L | |
| Notes | ||
| Methods | Nested case‐cohort study Country: UK | |
| Participants | Participants: 23,658 men and women Inclusion criteria: aged 40 to 74, resident in Norfolk county, registered at 35 general practices in rural, suburban, and inner city areas, no history of pancreatic cancer at enrolment or within 12 months of entering the study Name of parent cohort: European Prospective Investigation of Cancer‐Norfolk Study (EPIC‐Norfolk) Recruitment: 1993 to 1997 Case definition: incidence Type of selenium marker: intake Outcome assessment: June 2010 Number of cases: Years of follow‐up: 17 Barrass 2013: Outcome assessment: December 2010 Number of cases: Years of follow‐up: not reported (probably 17) | |
| Interventions | d.n.a. | |
| Outcomes | Statistical methods: Cox proportional hazard model Variables controlled in analysis: age, sex, smoking, diabetes, total energy intake, body mass index category, respective antioxidant supplement (only Banim 2013) | |
| Risk estimates [95% CI] | Reference category: lowest quartile, lowest quintile Results: Banim 2013: Barrass 2013: • Renal cell cancer: highest quintile: HR 0.40 (95% CI 0.17 to 0.98) | |
| Selenium levels in exposure categories | • Lowest quartile < 43.6 µg/d Barrass 2013: • Lowest and highest quintiles not reported | |
| Notes | ||
| Methods | Cohort study Country: United States | |
| Participants | Name of parent cohort: Third National Health and Nutrition Examination Survey (NHANES III) Inclusion criteria: male and female adults, aged 20 to 90 years, participating in the NHANES III: "stratified, multistage probability cluster to provide data representing the noninstitutionalized US population" (Bleys 2008, p. 404) Recruitment: 1988 to 1994 Participants: 13,887 men and women Outcome assessment: 15 December 2000 Number of cases: Case definition: mortality Years of follow‐up: 6 to 12 Type of selenium marker: serum | |
| Interventions | d.n.a. | |
| Outcomes | Analysed cases: 457 (male/female: n.r.) Statistical methods: Cox proportional hazard regression | |
| Risk estimates [95% CI] | Reference category: lowest tertile Results: | |
| Selenium levels in exposure categories | Lowest tertile < 117.31 µg/L | |
| Notes | Updated results with longer follow‐up for the same population reported in Goyal 2013 | |
| Methods | Matched, nested case‐control study Country: United States | |
| Participants | Name of parent cohort: Baltimore Longitudinal Study of Aging Recruitment: n.r. Number of cases: Case definition: incidence Years of follow‐up: n.r. Type of selenium marker: plasma | |
| Interventions | d.n.a. | |
| Outcomes | Analysed cases: 52 of 133 (reason for non‐inclusion: plasma and/or histological confirmation of diagnosis not available) | |
| Risk estimates [95% CI] | Reference category: lowest quartile Results: | |
| Selenium levels in exposure categories | Lowest quartile: 82 to 107 µg/L | |
| Notes | ||
| Methods | Cohort/subcohort controlled cohort study Country: United States | |
| Participants | Participants: 177; no information on gender Recruitment: n.r. Number of cases: Case definition: incidence Years of follow‐up: mean 3 Type of selenium marker: plasma | |
| Interventions | d.n.a. | |
| Outcomes | Statistical methods: Cox proportional hazard model | |
| Risk estimates [95% CI] | Reference category: lower half Results: | |
| Selenium levels in exposure categories | n.r. | |
| Notes | ||
| Methods | Matched, nested case‐control study Country: United States | |
| Participants | Participants: 6167; both genders Recruitment: 1972 to 1973 and 1976 Number of cases: Case definition: incidence Years of follow‐up: n.r. Type of selenium marker: serum and plasma | |
| Interventions | d.n.a. | |
| Outcomes | Analysed cases: 154 (133 serum, 21 plasma) of 195 collected (reason for non‐inclusion: no sample available for analysis or no control available) | |
| Risk estimates [95% CI] | Reference category: lowest Results: | |
| Selenium levels in exposure categories | Serum: Plasma: | |
| Notes | Primary publication:Coates 1988 | |
| Methods | Cohort/subcohort controlled cohort study Country: United States | |
| Participants | Participants: 1239 men and women Recruitment: see: Nutritional Prevention of Cancer Trial Number of cases: Case definition: incidence Years of follow‐up: 2 Type of selenium marker: plasma | |
| Interventions | d.n.a. | |
| Outcomes | Statistical methods: Cox proportional hazard model | |
| Risk estimates [95% CI] | Reference category (unadjusted RR): lower half Results: | |
| Selenium levels in exposure categories | Lower half: ≤ 114.00 µg/L | |
| Notes | ||
| Methods | Matched, nested case‐control study Country: United States | |
| Participants | Participants: 44,960 men and women (20,305 from CLUE I; 24,655 from CLUE II) Recruitment: 1974/75 or 1989 Number of cases: Case definition: incidence Years of follow‐up: n.r. Type of selenium marker: serum/plasma | |
| Interventions | d.n.a. | |
| Outcomes | Statistical methods: conditional logistical regression | |
| Risk estimates [95% CI] | Reference category: lowest quintile Results: | |
| Selenium levels in exposure categories | n.r. | |
| Notes | ||
| Methods | Cohort study Country: United States | |
| Participants | Participants: 339 (male/female: 275/64) Name of parent cohort: Seattle Barrett's Esophagus Program Recruitment: 1983 to 2004, baseline assessment for this study: 1 February 1995 to 1 July 2004 Number of cases: oesophageal adenocarcinoma: 37 (male/female: 32/5) Case definition: incidence Years of follow‐up: mean: 5 Type of selenium marker: intake of selenium supplements (self‐administered food frequency questionnaire) | |
| Interventions | d.n.a. | |
| Outcomes | Statistical methods: Cox proportional hazard regression | |
| Risk estimates [95% CI] | Reference category: no supplemental selenium intake (lowest exposure category) Results: | |
| Selenium levels in exposure categories | Lowest category: no supplemental selenium intake Middle category: supplemental selenium intake < 50 µg/d Highest category: supplemental intake ≥ 50 µg/d | |
| Notes | ||
| Methods | Matched, nested case‐control study Country: United States | |
| Participants | Participants: 6426 women Recruitment: 1987 to 1997 Number of cases: Case definition: incidence Years of follow‐up: median: 2.7 Type of selenium marker: serum | |
| Interventions | d.n.a. | |
| Outcomes | Statistical methods: conditional logistical regression | |
| Risk estimates [95% CI] | Reference category: lowest quartile Results: | |
| Selenium levels in exposure categories | Lowest quartile: ≤ 112.9 µg/L | |
| Notes | ||
| Methods | Multi‐centre, randomised, placebo‐controlled, parallel‐group trial Allocation: random Sequence generation: unclear Concealment: unclear Blinding: described only as double‐blinded Dropouts/withdrawals: During treatment phase, 38 in the selenium group and 37 in the placebo group withdrew from the study. This distribution was similar in both treatment groups. Intention‐to‐treat‐analysis: unclear Recruitment period: not specified Treatment duration: 3 years Observation period/dermatological follow‐up: Participants were followed for 2 years longer after treatment. Detection of cases: Participants were seen by a dermatologist before grafting; any participants presenting with a non‐malignant or malignant skin keratosis or viral warts that had been present for less than 3 months were not selected. Within 10 weeks following the graft, a second visit was performed by a dermatologist to check that no new cutaneous lesion had appeared. Informed consent: The protocol and the consent form had been approved by a National Ethics Committee before the start of the study. Written informed consent was mandatory. | |
| Participants | Participants: 184 (randomised to selenium 200 μg/d: 91; to placebo: 93) Condition: organ transplant recipient population Demographics: mean age 44.3 ± SD 13 years (selenium 200 μg/d), 44.4 ± 10.7 years (placebo) | |
| Interventions | Intervention: • 200 µg/d selenium supplied as selenium yeast Control: placebo | |
| Outcomes | Primary outcome measure: • Occurrence rates of warts and various keratoses Other reported outcomes: • Skin cancers | |
| Risk estimates [95% CI] | Primary outcome: Events in selenium group = 33 (36.3%), events in placebo group = 31 (33.3%); odds ratio 1.09, P = 0.72 Secondary outcome: Events in selenium group = 6 (6.6%), events in placebo group = 2 (2.2%); odds ratio 3.08, P = 0.15 | |
| Selenium levels in exposure categories | ||
| Notes | ||
| Risk of bias | ||
| Bias | Authors' judgement | Support for judgement |
| Random sequence generation (selection bias) | Low risk | Multi‐centre randomised |
| Allocation concealment (selection bias) | Unclear risk | Not stated |
| Blinding (performance bias and detection bias) | Unclear risk | Described only as double‐blinded |
| Selective reporting (reporting bias) | Low risk | No problems found |
| Methods | Matched, nested case‐control study (Epplein 2009; Gill 2009) Country: United States | |
| Participants | Inclusion criteria: participants from the Multiethnic Cohort, aged 45 to 75 years (native Hawaiians: aged 42 years and older), blood sample provided before cancer diagnosis between 1997 and 2006 Name of parent cohort: Multiethnic Cohort Recruitment: 1993 to 1996 Case definition: incidence Type of selenium marker: serum Participants: 67,594 (male: 29,009/female: 38,585) men and women Outcome assessment: 2006 Number of cases: Years of follow‐up: 0 to 10 Gill 2009: Participants: 29,009 men Outcome assessment: n.r. Number of cases: Years of follow‐up: n.r. | |
| Interventions | d.n.a. | |
| Outcomes | Statistical methods: conditional logistical regression Epplein 2009: Gill 2009: | |
| Risk estimates [95% CI] | Epplein 2009: Results: Gill 2009: Results: | |
| Selenium levels in exposure categories | Epplein 2009: Gill 2009: | |
| Notes | Primary publication:Epplein 2009 | |
| Methods | Matched, nested case‐control study Country: Sweden | |
| Participants | Participants: 7935 men Recruitment: 1975 to 1979 Number of cases: Case definition: mortality Years of follow‐up: 3.5 to 8.0 Type of selenium marker: plasma | |
| Interventions | d.n.a. | |
| Outcomes | Analysed cases: 35 of 61 (reason for non‐inclusion: no plasma sample available) | |
| Risk estimates [95% CI] | Reference category: highest quintile Results: | |
| Selenium levels in exposure categories | n.r. | |
| Notes | CI and number of cases not reported | |
| Methods | Prospective cohort study Country: northern part of Japan | |
| Participants | Participants: 1041 men and women Recruitment: June 2003 to March 2004 Number of cases: Case definition: mortality Years of follow‐up: 5 Type of selenium marker: serum | |
| Interventions | d.n.a. | |
| Outcomes | Statistical methods: Cox logistical regression | |
| Risk estimates [95% CI] | Reference category: lowest quartile Results: | |
| Selenium levels in exposure categories | Lowest quartile: 18.4 to 85.3 µg/L | |
| Notes | ||
| Methods | Matched, nested case‐control study Country: United States | |
| Participants | Participants: 62,641 women Recruitment: 1976 (toenail sample collection in 1982) Number of cases: Number of cases: Case definition: incidence Years of follow‐up: 2.0 to 4.4 Type of selenium marker: toenail | |
| Interventions | d.n.a. | |
| Outcomes | Statistical methods: logistical regression, conditional logistical regression | |
| Risk estimates [95% CI] | Reference category: lowest quintile, lowest tertile Results: Garland 1995: Hunter 1990: | |
| Selenium levels in exposure categories | Garland 1995: Hunter 1990: | |
| Notes | Primary publication:Garland 1995 | |
| Methods | Matched, nested case‐control study Country: Norway | |
| Participants | Participants: 100,000 men and women Recruitment: 1972 to 1985 Number of cases: Case definition: incidence Years of follow‐up: 0.0 to 14.0 Type of selenium marker: serum | |
| Interventions | d.n.a. | |
| Outcomes | Statistical methods: conditional logistical regression | |
| Risk estimates [95% CI] | Reference category: highest tertile Results: | |
| Selenium levels in exposure categories | Lowest tertile: ≤ 98.7 µg/L | |
| Notes | ||
| Methods | Matched, nested case‐control study Country: United States | |
| Participants | Participants: 18,314 (male/female: 12,025/6289) Recruitment: 1988 to 1994 Number of cases: Case definition: incidence Years of follow‐up: 6.0 to 12.0 Type of selenium marker: serum | |
| Interventions | d.n.a. | |
| Outcomes | Analysed cases: 235 of 236 prostate cancer cases analysed (reason for non‐inclusion: no sample available for analysis or no control available); 356 of 385 lung cancer cases analysed (reason for non‐inclusion: missing selenium values for case‐control pairs) Statistical methods: conditional logistical regression | |
| Risk estimates [95% CI] | Reference category: lowest quartile Results: | |
| Selenium levels in exposure categories | Lung cancer Prostate cancer | |
| Notes | ||
| Methods | Cohort study Country: United States | |
| Participants | Name of parent cohort: Third National Health and Nutrition Examination Survey (NHANES III) Inclusion criteria: male and female adults, aged 20 to 90 years, participating in the NHANES III: "stratified, multistage probability cluster to provide data representing the noninstitutionalized US population" (Bleys 2008, p. 404) Recruitment: 1988 to 1994 Participants: 13,887 men and women Outcome assessment: 31 December 2006 Number of cases: • Cancer deaths: 891 (male/female: n.r.) Case definition: mortality Years of follow‐up: 14.2 Type of selenium marker: serum | |
| Interventions | d.n.a. | |
| Outcomes | Analysed cases: 864 (male/female: n.r.) Statistical methods: Cox proportional hazard regression Variables controlled in analysis: age, sex, race‐ethnicity, level of education, annual family income, body mass index, smoking status, serum cotinine level, alcohol consumption, fruit and vegetable intake, physical activity, serum total cholesterol levels, hypertension status, diabetes status, history of heart attack, congestive heart failure, stroke or cancer, hormone use in women, supplement use, serum levels of other micronutrients in the study (analysis only for both genders) | |
| Risk estimates [95% CI] | Reference category: lowest tertile Results: Cancer deaths • Both genders: highest quintile: HR 0.84 (95% CI 0.61 to 1.17) • Male: highest quintile: HR 0.67 (95% CI 0.54 to 0.83) • Female: highest quintile: HR 0.91 (95% CI 0.71 to 1.16) | |
| Selenium levels in exposure categories | Lowest quintile: ≤ 108.96 µg/L Highest quintile: ≥ 136.60 µg/L | |
| Notes | Second report on the same cohort of Bleys 2008; results updated | |
| Methods | Matched, nested case‐control study Country: United States | |
| Participants | Name of the parent cohort: Health Professional Follow‐up Study Participants: 18,259 men Inclusion criteria: patients free from prostate cancer between 1993 and 1995 who returned EDTA‐preserved blood samples from HPFS cohort (35% of total cohort) Recruitment: 1986 Outcome assessment: 31 January 1998 Number of cases: • Prostate cancer: 166 (male/female: 166/0) Case definition: incidence Years of follow‐up: up to 5 Type of selenium marker: plasma | |
| Interventions | d.n.a. | |
| Outcomes | Analysesd cases: 154 Statistical methods: conditional logistical regression model Variables controlled in analysis: age at blood draw, smoking status at blood draw, every PSA test before blood draw, timing and season of blood draw, time between blood draw and index date Variables controlled by matching: year of birth, PSA test before blood draw, timing, season and year of blood draw | |
| Risk estimates [95% CI] | Reference category: lowest quartile Results: • Highest quartile: 1.57 (95% CI 0.92 to 2.69) | |
| Selenium levels in exposure categories | Lowest quartile: 0.0894 ppm Highest quartile: 0.1308 ppm | |
| Notes | Exposure category cutpoints provided by trial author | |
| Methods | Cohort study Country: Sweden | |
| Participants | Participants: 2322 males Recruitment: 1991 to 1995 Number of cases: Case definition: incidence Years of follow‐up: median: 26.5 Type of selenium marker: serum | |
| Interventions | d.n.a. | |
| Outcomes | Statistical methods: proportional hazard model | |
| Risk estimates [95% CI] | Reference category: lowest level Results: | |
| Selenium levels in exposure categories | Lowest level: ≤ 70 µg/L | |
| Notes | ||
| Methods | Cohort study Country: United States | |
| Participants | Name of parent cohort: Vitamins and Lifestyles (VITAL) study Participants: 70,332 men and women Inclusion criteria: aged 50 to 76 years, participants recruited from subscribers to commercial mailing list, residents of western Washington state, no malignant disease at baseline, no (or missing) history of pancreatic cancer or neuroendocrine tumours Recruitment: 1 October 2000 to 31 December 2002 Outcome assessment: 31 December 2008 Number of cases: • Pancreatic cancer: 195 (male/female: n.r.); 184 adenocarcinoma pancreatic cancer and 11 neuroendocrine tumours Case definition: incidence Years of follow‐up: median: 7.1 Type of selenium marker: intake and supplement use (questionnaire: use of supplements over the past 10 years, mean supplemental intake/d calculated) | |
| Interventions | d.n.a. | |
| Outcomes | Analysed cases: Individuals with neuroendocrine tumours were excluded. Statistical methods: Cox proportional hazard model Variables controlled in analysis: age, sex, ethnicity, education, body mass index, physical activity, cigarette smoking status, total alcohol consumption, family history of pancreatic cancer, history of diabetes, total energy intake | |
| Risk estimates [95% CI] | Reference category: lowest tertile Results: Adenocarcinoma pancreatic cancer | |
| Selenium levels in exposure categories | Daily intake | |
| Notes | ||
| Methods | Cohort study Country: Denmark | |
| Participants | Participants: 54,208 men and women Inclusion criteria: aged 50 to 64, born in Denmark, no diagnosis of cancer registered in the Danish Cancer Registry, living in the Copenhagen, Frederiksberg Aarhus municipalities, Hinnerup or Hørning municipalities in Aarhus County, and nearly all in Copenhagen county Recruitment: 1993 to 1997 Outcome assessment: April 1995 to December 2009 Number of cases: 990 (male/female: n.r) Case definition: incidence Years of follow‐up: median: 13 Type of selenium marker: supplement use | |
| Interventions | d.n.a. | |
| Outcomes | Analysed cases: • Colon‐rectal cancer: 990 (male/female: n.r.) Statistical methods: Cox proportional hazard model Variables controlled in analysis: alcohol consumption, smoking status (ever/never), physical activity at work and at leisure, non‐steroidal anti‐inflammatory drug use, body mass index, education level, intake of red and processed meat, dietary intake, supplemental intake of nutrients alternatively | |
| Risk estimates [95% CI] | Reference category: high use Results: | |
| Selenium levels in exposure categories | Supplement use: | |
| Notes | Data on dietary intake and Total intake + supplement use not reported according to inclusion criteria: only 2 categories ‐ high vs low use | |
| Methods | Cohort/subcohort controlled cohort study Country: Finland | |
| Participants | Participants: 29,133 men Recruitment: 1985 to 1988 Number of cases: Case definition: incidence Years of follow‐up: 5.0 to 8.0 Type of selenium marker: intake | |
| Interventions | d.n.a. | |
| Outcomes | Analysed cases: 302 of 317 (reason for non‐inclusion: no dietary information available) | |
| Risk estimates [95% CI] | Reference category: lowest quartile Results: Total (nutritional and supplemental) selenium intake in participants with alpha‐tocopherol intervention Nutritional selenium intake in participants without active alpha‐tocopherol intervention Nutritional selenium intake in participants with alpha‐tocopherol intervention | |
| Selenium levels in exposure categories | Total nutritional and supplemental selenium intake: Nutritional selenium intake: | |
| Notes | ||
| Methods | Cohort study Country: Iran | |
| Participants | Name of parent cohort: Golestan Cohort Study Participants: 47,405 (male/female: 19,969/27,436) Inclusion criteria: aged 40 to 75, stable residents in Golestan region (Gonbad City and villages in Gonbad, Kalaleh, and Aq‐Qala counties); not having a current or previous diagnosis of upper gastrointestinal cancer Recruitment: 2004 to 2008 Outcome assessment: 2014 Number of cases: • Oesophageal squamous cell carcinoma: 201 (male/female: n.r.) Case definition: incidence Years of follow‐up: median: 7.2 Type of selenium marker: intake | |
| Interventions | d.n.a. | |
| Outcomes | Analysed cases: 201 (male/female: n.r.) Statistical methods: Cox proportional hazard model Variables controlled in analysis: age, sex, total energy, place of residence (urban or rural), smoking (never or ever), wealth score (low, medium, or high), ethnicity (non‐Turkmen or Turkmen), opiate use (never or ever), BMI, education (illiterate or formal education), marital status (single or married), physical activity score (continuous), fruit and vegetable intake | |
| Risk estimates [95% CI] | Reference category: lowest quartile Results: Oesophageal squamous cell carcinoma | |
| Selenium levels in exposure categories | Lowest quartile: < 116 µg/d | |
| Notes | ||
| Methods | Matched, nested case‐control study Country: United States | |
| Participants | Participants: 10,456 men Recruitment: 1989 Number of cases: Case definition: incidence Years of follow‐up: 6.8 to 7.8 Type of selenium marker: toenail | |
| Interventions | d.n.a. | |
| Outcomes | Analysed cases: 117 of 145 (reason for non‐inclusion: no toenail clipping available) | |
| Risk estimates [95% CI] | Reference category: lowest quintile Results: | |
| Selenium levels in exposure categories | Lowest quintile: ≤ 0.69 ppm | |
| Notes | ||
| Methods | Cohort study Country: United States | |
| Participants | Participants: 77,050 men and women, aged 50 to 76 years, participants recruited from subscribers to commercial mailing list, residents of western Washington state, non‐whites excluded, no malignant disease at baseline Name of parent cohort: Vitamins and Lifestyle (VITAL) study Recruitment: 1 October 2000 to 31 December 2002 Outcome assessment: 31 December 2002 Number of cases: Case definition: incidence Years of follow‐up: median: 6 Type of selenium marker: supplemental intake (questionnaire: use of supplements over the past 10 years, mean supplemental intake/day calculated) | |
| Interventions | d.n.a. | |
| Outcomes | Statistical methods: Cox proportional hazard regression | |
| Risk estimates [95% CI] | Reference category: non‐use Results: | |
| Selenium levels in exposure categories | Lowest level: non‐use | |
| Notes | ||
| Methods | Matched, nested case‐control study Countries: Denmark, France, Germany, Greece, Italy, the Nederlands, Spain, United Kindom | |
| Participants | Name of parent cohort: European Prospective Investigation into Cancer and Nutrition (EPIC) Participants: 428,917 (male/female: 129,961/298,956) Inclusion criteria: aged 25 to 70, participants from the EPIC study Recruitment: 1992 to 2000 Outcome assessment: at each country’s study closure date (between June 2002 and 2003) Number of cases: Case definition: incidence Years of follow‐up: average: approximately 4 Type of selenium marker: serum | |
| Interventions | d.n.a. | |
| Outcomes | Statistical methods: conditional logistical regression Variables controlled in analysis: smoking status/duration/intensity, BMI, total physical activity, education level, total dietary energy consumption, intake of total calcium, fruits, vegetables, red and processed meats, and alcohol Variables controlled by matching: study centre of enrolment, sex, age at blood collection, time of blood collection and fasting status; among women, the following: menopausal status. Premenopausal women were matched on phase of menstrual cycle, and postmenopausal women were matched on current hormonal replacement therapy (HRT) use. | |
| Risk estimates [95% CI] | Reference category: lowest quintile Results: | |
| Selenium levels in exposure categories | Both male and female • Lowest quintile: < 67.7 µg/L | |
| Notes | Data for study population from Riboli 2002 | |
| Methods | Matched, nested case‐control study Countries: Denmark, France, Germany, Greece, Italy, the Nederlands, Norway, Spain, Sweden, UK | |
| Participants | Name of parent cohort: European Prospective Investigation into Cancer and Nutrition (EPIC) Participants: 521,448 Inclusion criteria: aged 25 to 70 participants of the EPIC study Recruitment: 1992 to 2000 Outcome assessment: at each country’s study closure date (between December 2002 and December 2006) Number of cases: 261 (male/female: n.r.) Case definition: incidence Years of follow‐up: average: approximately 6 Type of selenium marker: serum | |
| Interventions | d.n.a. | |
| Outcomes | Analysed cases: Statistical methods: conditional logistical regression Variables controlled in analysis: BMI, waist circumference, baseline alcohol intake, physical activity (metabolic equivalent tasks), smoking status, education, alcohol intake pattern, self‐reported diabetes, total energy intake Variables controlled by matching: age at blood collection, sex, study centre, time of day, fasting status at blood collection. Additionally, women were matched by menopausal status and hormone replacement therapy use at the time of blood collection. | |
| Risk estimates [95% CI] | Reference category: lowest tertile Results | |
| Selenium levels in exposure categories | Lowest tertile: ≤ 80.5 µg/L | |
| Notes | Estimates for IHBC reported only for 20 µg/L increase: OR 0.42 (95% CI 0.15 to 1.20) | |
| Methods | Matched, nested case‐control study Country: Japan | |
| Participants | Participants: 20,000 men and women Recruitment: 1960 (blood samples drawn in 1970 to 1972) Number of cases: Case definition: incidence Years of follow‐up: 12.0 to 14.0 Type of selenium marker: serum | |
| Interventions | d.n.a. | |
| Outcomes | Statistical methods: conditional logistical regression | |
| Risk estimates [95% CI] | Reference category: highest quartile Results: | |
| Selenium levels in exposure categories | Lowest quartile ≤ 98.90 µg/L | |
| Notes | ||
| Methods | Matched, nested case‐control study Country: United States | |
| Participants | Participants: 1805 men and women Recruitment: February 1983 to February 1986 Number of cases: Case definition: incidence Years of follow‐up: 3.0 to 5.0 Type of selenium marker: plasma | |
| Interventions | d.n.a. | |
| Outcomes | Statistical methods: conditional logistical regression | |
| Risk estimates [95% CI] | Reference category: lowest quartile Results: | |
| Selenium levels in exposure categories | Lowest quartile: ≤ 0.12 ppm | |
| Notes | ||
| Methods | Randomised controlled trial Phase III Chemoprevention Trial of Selenium Supplementation In Persons With Resected Stage I Non‐Small Cell Lung Cancer: ECOG 5597 Allocation: random, permuted blocks stratified by smoking status (current, former, or never), sex, and stage (IA vs IB with other therapy vs IB without other therapy) Sequence generation: permuted blocks within strata with dynamic balancing Concealment: central assignments at ECOG Coordinating Center Blinding: participant blinded, doctor blinded, outcome assessor/pathologist unclear, review/coding of medical records unblinded Dropouts/withdrawals: of 1561 randomised participants, no dropouts Intention‐to‐treat‐analysis: yes Recruitment period: 6 October 2000 to 5 November 2009 End of study period: 5 November 2009 Treatment duration: Observation period: After end of treatment phase, participants enter the follow‐up phase. Analyses till June 2011 reported (until January 2014 in Pillai 2014 with median follow‐up of 5.6 years) Detection of cases: visit at 3 months for adverse effects, annual visit for other endpoints Informed consent: yes | |
| Participants | 1561 male and female participants with completely resected stage I non‐small‐cell lung cancer Countries: United States, Canada Participants: 1561 (randomised to selenium group: 1,040; to placebo group: 521) Condition: adult participants, 6 to 36 months from complete resection of histologically proven stage IA or IB non‐small‐cell lung cancer, with chest X‐ray or CT scan ≤ 8 weeks before registration without sign of new recurrent lung cancer, no recurrent cancers or any other prior cancer history within the past 5 years (except NMSC), normal hepatic function, ECOG performance status of 0 or 1, not taking selenium supplement regularly ≥ 70 μg/d, any therapy (chemo, radio, or biological therapy) completed at least 6 months before study registration and all related symptoms subsided Demographics: median age 66 in both intervention groups. Selenium and placebo participants were well balanced with respect to sex, age, smoking history, and stage at resection. Recruitment and setting: not reported | |
| Interventions | Intervention: 200 µg selenised yeast Control: placebo | |
| Outcomes | Primary outcome: incidence of second primary lung tumours | |
| Risk estimates [95% CI] | Primary outcome: • Lung cancer: RR 1.23 (95% CI 0.80 to 1.80) Pillai 2014: Primary outcome: • Lung cancer: RR 1.29 (95% CI 0.87 to 1.93) | |
| Selenium levels in exposure categories | d.n.a. | |
| Notes | Adverse effects: | |
| Risk of bias | ||
| Bias | Authors' judgement | Support for judgement |
| Random sequence generation (selection bias) | Low risk | Random, permuted blocks stratified |
| Allocation concealment (selection bias) | Low risk | Central assignments |
| Blinding (performance bias and detection bias) | Low risk | Participants blinded and doctor blinded, outcome assessor/pathologist unclear, review/coding of medical records unblinded |
| Selective reporting (reporting bias) | Low risk | No problems found |
| Methods | Matched, nested case‐control study (Hakama 1990; Knekt 1988;Knekt 1990;Knekt 1996) Country: Finland | |
| Participants | Inclusion criteria: no history of cancer at baseline Recruitment: 1968 to 1972 Knekt 1990: Number of cases: Hakama 1990: Number of cases: Knekt 1988: Number of cases: Knekt 1991: Number of cases: Knekt 1996: Number of cases: Case definition: incidence Years of follow‐up: 9 to 20 years Type of selenium marker: serum (Hakama 1990; Knekt 1988;Knekt 1990;Knekt 1996), intake (Knekt 1991: dietary history) | |
| Interventions | d.n.a. | |
| Outcomes | Knekt 1990 Hakama 1990 Knekt 1988 Knekt 1991 Knekt 1996 | |
| Risk estimates [95% CI] | Knekt 1990 Results: Hakama 1990 Results: Knekt 1988 Results: Knekt 1991 Results: • Lowest tertile: OR 1.03 (CI not reported) • Lowest tertile: OR 0.83 (CI not reported) Knekt 1996 Results: | |
| Selenium levels in exposure categories | Knekt 1990 • Highest quintile ≥ 78.00 µg/L Hakama 1990 Knekt 1988 • Highest tertile ≥ 70.10 µg/L • Highest 4 quintiles > 50 µg/L Knekt 1991 Knekt 1996 • Highest tertile: ≥ 68.10 µg/L | |
| Notes | Primary publication:Knekt 1990 | |
| Methods | Matched, nested case‐control study Country: Finland | |
| Participants | Participants: 9101 men and women Recruitment: 1973 to 1976 Number of cases: Case definition: incidence Years of follow‐up: 16.0 to 19.0 Type of selenium marker: serum | |
| Interventions | d.n.a. | |
| Outcomes | Analysed cases: 91 of 95 (male/female: 90/5) | |
| Risk estimates [95% CI] | Reference category: lowest tertile Results: | |
| Selenium levels in exposure categories | Lowest tertile: ≤ 45.49 µg/L | |
| Notes | ||
| Methods | Matched, nested case‐control study Country: the Netherlands | |
| Participants | Participants: 10,532 men and women Recruitment: 1975 to 1978 Number of cases: Case definition: mortality Years of follow‐up: 6.0 to 9.0 Type of selenium marker: serum | |
| Interventions | d.n.a. | |
| Outcomes | Analysed cases: 69 of 114 (reason for non‐inclusion: serum or baseline data not available, deaths in first year of follow‐up excluded) | |
| Risk estimates [95% CI] | Reference category: highest 4 quintiles Results: | |
| Selenium levels in exposure categories | Both genders Males Females | |
| Notes | ||
| Methods | Matched, nested case‐control study Country: Belgium | |
| Participants | Participants: 10,902 (male/female: 5,549/5,353) Recruitment: 1980 to 1984 Number of cases: Case definition: mortality Years of follow‐up: 10 Type of selenium marker: serum | |
| Interventions | d.n.a. | |
| Outcomes | Analysed cases: 143 male/50 female cases analysed from 252 male/91 female cases (reason for non‐inclusion: no selenium measurement available) | |
| Risk estimates [95% CI] | Reference category: highest tertile Results: | |
| Selenium levels in exposure categories | Lowest tertile ≤ 72.00 µg/L | |
| Notes | ||
| Methods | Matched, nested case‐control study Countries: United States, Canada, Puerto Rico | |
| Participants | Name of parent cohort: SELECT (Selenium and Vitamin E Cancer Prevention Trial), placebo arm Participants: 777 men from placebo arm of SELECT study Inclusion criteria: black men aged ≥ 50 years and all other men aged ≥ 55 years, without history of prostate cancer, serum PSA level ≤ 4 ng/L and non‐suspicious digital rectal examination Recruitment: July 2001 to May 2004 Outcome assessment: 31 July 2009 Number of cases: • Prostate cancer: 404 (male/female:404/0) Case definition: incidence Years of follow‐up: n.r. Type of selenium marker: toenail | |
| Interventions | d.n.a. | |
| Outcomes | Analysed cases: 404 (male/female: 404/0) Statistical methods: Cox proportional hazard model Variables controlled in analysis: age and race by matching, family history of prostate cancer, diabetes, body mass index, prostate‐specific antigen Variables controlled by matching: age and race | |
| Risk estimates [95% CI] | Reference category: lowest quintile Results: | |
| Selenium levels in exposure categories | Lowest quintile: < 0.758 µg/g | |
| Notes | ||
| Methods | Cohort/subcohort controlled cohort study Country: the Netherlands | |
| Participants | Participants: 878 men Recruitment: 1960 Number of cases: Case definition: mortality Years of follow‐up: 25 Type of selenium marker: intake (interview) | |
| Interventions | d.n.a. | |
| Outcomes | Statistical methods: Cox proportional hazard model | |
| Risk estimates [95% CI] | Reference category: lowest quartile Results: | |
| Selenium levels in exposure categories | Lowest quartile: ≤ 55.00 µg/d | |
| Notes | ||
| Methods | Randomised controlled trial Allocation: randomised, "based on their residence area" Sequence generation: unclear, not described Concealment: unclear, not described Blinding: of participants: adequate (placebo); of investigators and doctors: unclear, not described Dropouts/withdrawals: no significant difference between percentages of dropouts in intervention and control group (absolute numbers not reported) Intention‐to‐treat‐analysis: unclear Recruitment period: unclear, not described Observation period: 3 years, started in 1996 Study period: unclear, not described Detection of cases: unclear; the study followed the diagnostic menu published by the National Cancer Control and Prevention Center, follow‐up procedures not described Informed consent: unclear, not described | |
| Participants | Country: China Number of participants: 2065 (selenium group: 1112; placebo group: 953) Condition: HBs‐Ag carriers with negative AFP and normal ALT living in Qidong, Jiangsu province Demographics: men only; aged 20 to 65 years (screening group) Recruitment and setting: recruitment of 2065 HBs‐Ag carriers from 17 villages out of a screening group of 18,000 men | |
| Interventions | Intervention: 0.5 mg sodium selenite p.o. daily for 3 years Control: placebo | |
| Outcomes | Primary outcome measure: incidence of primary liver cancer Other: blood selenium levels, activity of glutathione peroxidase Results: person‐year incidence rate (number of cases/total number of persons) in intervention and control groups: • 1st year of follow‐up: selenium group 899.25/100,000 (10/1112); placebo group: 1888.77/100,000 (18/953) • 2nd year of follow‐up: selenium group 1708.60/100,000 (19/1112); placebo group: 4302.20/100,000 (41/953) • 3rd year of follow‐up: selenium group 3057.55/100,000 (34/1112); placebo group: 5981.11/100,000 (57/953) | |
| Risk estimates [95% CI] | n.r. | |
| Selenium levels in exposure categories | d.n.a. | |
| Notes | Adverse effects were not mentioned. | |
| Risk of bias | ||
| Bias | Authors' judgement | Support for judgement |
| Random sequence generation (selection bias) | Unclear risk | Randomisation based only on residential area |
| Allocation concealment (selection bias) | Unclear risk | Not described |
| Blinding (performance bias and detection bias) | Low risk | Blinding of participants and doctors |
| Selective reporting (reporting bias) | Low risk | No problems found |
| Methods | Matched, nested case‐control study Country: United States | |
| Participants | Participants: 14,916 men Recruitment: 1982 Number of cases: Case definition: incidence Years of follow‐up: 13 Type of selenium marker: plasma | |
| Interventions | d.n.a. | |
| Outcomes | Statistical methods: logistical regression | |
| Risk estimates [95% CI] | Reference category: lowest quintile Results: | |
| Selenium levels in exposure categories | Lowest quintile: 0.060 to 0.090 ppm | |
| Notes | ||
| Methods | Randomised controlled trial Allocation: random Sequence generation: unclear Concealment: unclear Blinding: described only as double‐blinded Dropouts/withdrawals: no description Intention‐to‐treat‐analysis: unclear Recruitment period: not specified Treatment duration: unclear Observation period/dermatological follow‐up: • Median: 35 months (range 6 to 62 months) Detection of cases: not described Informed consent: not described | |
| Participants | Country: Poland Number of participants: 1135 (randomised to selenium group: 563, to placebo group: 572) Condition: adult women, BRCA1+ mutation carriers Demographics: not reported Recruitment and setting: not reported | |
| Interventions | Intervention: • 250 µg/d selenium supplied as sodium selenite Control: • Placebo | |
| Outcomes | Case definition: incidence • All cancer • Primary breast cancer • Ovarian cancer | |
| Risk estimates [95% CI] | All cancer: HR 1.4 (95% CI 0.9 to 2.0), cases: selenium 60, placebo 45 Primary breast cancer: HR 1.3 (95% CI 0.7 to 2.5), cases: selenium 38, placebo 29 Ovarian cancer: HR 1.3 (95% CI 0.6 to 2.7), cases: selenium 17, placebo 10 | |
| Selenium levels in exposure categories | d.n.a | |
| Notes | ||
| Risk of bias | ||
| Bias | Authors' judgement | Support for judgement |
| Random sequence generation (selection bias) | Unclear risk | Described only as randomised trial |
| Allocation concealment (selection bias) | Unclear risk | Not stated |
| Blinding (performance bias and detection bias) | Unclear risk | Described only as double‐blinded |
| Selective reporting (reporting bias) | Low risk | No problems found |
| Methods | Cohort study Country: China | |
| Participants | Name of parent cohorts: Shangai Men's Health Study (SMHS) and Shangai Women's Health Study (SWHS) Participants: 133,957 (male/female: 61,470/74,941) Inclusion criteria: Recruitment: Outcome assessment: 31 December 2012 Number of cases: 536 (male/female: 344/192) Case definition: incidence Years of follow‐up: Type of selenium marker: intake | |
| Interventions | d.n.a. | |
| Outcomes | Analysed cases: Statistical methods: Cox proportional hazard model Variables controlled in analysis: | |
| Risk estimates [95% CI] | Reference category: lowest quintile Results: | |
| Selenium levels in exposure categories | SMHS: | |
| Notes | ||
| Methods | Randomised controlled trial Allocation: random Sequence generation: unclear Concealment: unclear Blinding: described only as double‐blinded. The central pathologist was also blinded to study assignment. Dropouts/withdrawals: 13/227 in the selenium arm and 12/225 in the placebo arm were lost to follow‐up. Intention‐to‐treat‐analysis: yes Recruitment period: not specified Treatment duration: not specified Observation period/dermatological follow‐up: • Participants were followed for 3 years. They were seen in clinic at baseline and every 6 months thereafter. Detection of cases: Tissue blocks and corresponding pathology reports for all prostate procedures were to be submitted to the central study pathologist for review. Informed consent: All participants gave oral and written informed consent in accordance with institutional and federal guidelines. The protocol was approved by the Institutional Review Boards at participating institutions, and was monitored by the Data and Safety Monitoring Committee of SWOG. | |
| Participants | Country: United States Participants: 452 (randomised to selenium 200 µg/d: 227; to placebo group: 225) Condition: 40 years of age or older; digital rectal examination; biopsy‐confirmed diagnosis of HGPIN with no evidence of cancer; upper limit of prostate‐specific antigen (PSA) of 10 ng/mL (as measured locally); American Urological Association (AUA) symptom score < 20 (41), signifying no debilitating urinary problems; ambulatory and able to carry out work of a light or sedentary nature Demographics: Selenium and placebo participants were well balanced with respect to age, race, ethnicity, pre‐study PSA category, vitamin E supplements, and number of cores in the initial biopsy. They also were well balanced in body mass index, baseline blood selenium, performance status, and number of cores revealing HGPIN. | |
| Interventions | Participants were randomised in fashion to placebo or 200 µg/d of selenium, with daily treatment scheduled for 3 years or until a prostate cancer diagnosis. Recruitment: not reported End of blinded treatment period: at 3 years | |
| Outcomes | Primary outcome measure: • progression of HGPIN to prostate cancer over a 3‐year period | |
| Risk estimates [95% CI] | Primary outcomes: • Adjusted OR 0.913 (95% CI 0.55 to 1.52, P = 0.727) for risk of prostate cancer as a function of treatment group (with placebo as referent group) | |
| Selenium levels in exposure categories | d.n.a. | |
| Notes | OR estimate was given by the trial author. | |
| Risk of bias | ||
| Bias | Authors' judgement | Support for judgement |
| Random sequence generation (selection bias) | Low risk | Described as randomised |
| Allocation concealment (selection bias) | Low risk | Central randomisation with pathology review |
| Blinding (performance bias and detection bias) | Low risk | Blinding of participants and personnel |
| Selective reporting (reporting bias) | Low risk | No problems found |
| Methods | Matched, nested case‐control study (McNaughton 2005b) Cohort study (Heinen 2007; van der Pols 2009) Country: Australia | |
| Participants | Name of parent cohort: Nambour Skin Cancer Study Recruitment: 1992 to 1996 Case definition: incidence Participants: approximately 1000 men and women Outcome assessment: December 2001 Number of cases: Years of follow‐up: 5.5 Type of selenium marker: serum and intake (FFQ) Heinen 2007 Participants: 1001 men and women Outcome assessment: 31 December 2004 Number of cases: Case definition: incidence (tumour‐based incidence and person‐based incidence) Years of follow‐up: 8 Type of selenium marker: intake (FFQ) van der Pols 2009: Participants: 485 (male/female: 223/262) men and women Outcome assessment: 31 December 2004 Number of cases: Years of follow‐up: 8 Type of selenium marker: serum | |
| Interventions | d.n.a. | |
| Outcomes | McNaughton 2005b: Heinen 2007 van der Pols 2009 | |
| Risk estimates [95% CI] | Reference category: lowest quartile Results: Heinen 2007 Reference category: lowest tertile Results: van der Pols 2009 Reference category: lowest exposure category Results: | |
| Selenium levels in exposure categories | McNaughton 2005b Heinen 2007 van der Pols 2009 | |
| Notes | Primary publication:McNaughton 2005b Tumour‐based incidence: number of newly developed histologically confirmed BCCs or SCCs divided by person‐years of follow‐up accumulated over follow‐up period Person‐based incidence: number of persons newly affected by BCC or SCC during the same person‐years of follow‐up time as calculated for the tumour‐based analysis | |
| Methods | Matched, nested case‐control study Country: United States | |
| Participants | Participants: 20,305 men and women Recruitment: September to November 1974 Menkes 1986b Number of cases: Helzlsour 1996 Number of cases: Breslow 1995 Number of cases: Zheng 1993 Number of cases: Batieha 1993 Number of cases: Helzlsour 1989 Number of cases: Burney 1989 Number of cases: Ko 1994 Number of cases: Case definition: incidence Years of follow‐up: 8.0 to 16.8 Type of selenium marker: serum | |
| Interventions | d.n.a. | |
| Outcomes | Menkes 1986b Helzlsour 1986 Breslow 1995 Zheng 1993 Batieha 1993 Helzlsour 1989 Burney 1989 Ko 1994 | |
| Risk estimates [95% CI] | Menkes 1986b Results: Helzlsouer 1986 Results: Breslow 1995 Results: Zheng 1993 Results: Batieha 1993 Results: Helzlsour 1989 Results: Burney 1989 Results: Ko 1994 Results: | |
| Selenium levels in exposure categories | Menkes 1986b Helzlsouer 1986 Breslow 1995 Zheng 1993 Batieha 1993 Helzlsour 1989 Burney 1989 Ko 1994 | |
| Notes | Primary publication:Menkes 1986b | |
| Methods | Matched, nested case‐control study Country: Finland | |
| Participants | Participants: 29,133 men Recruitment: 1985 to 1988 Number of cases: Case definition: incidence Years of follow‐up: 5 to 8 Type of selenium marker: toenail | |
| Interventions | d.n.a. | |
| Outcomes | Statistical methods: conditional logistical regression | |
| Risk estimates [95% CI] | Reference category: lowest tertile/quartile Results: | |
| Selenium levels in exposure categories | n.r. | |
| Notes | ||
| Methods | Matched, nested case‐control study Country: United States | |
| Participants | Participants: 101,950 (male/female: 33,737/68,213) Recruitment: 1987 (HPFS), 1983 (NHS) Number of cases: Case definition: incidence Years of follow‐up: 13 to 17 Type of selenium marker: toenail | |
| Interventions | d.n.a. | |
| Outcomes | Statistical methods: conditional logistical regression | |
| Risk estimates [95% CI] | Reference category: lowest quartile Results: | |
| Selenium levels in exposure categories | Men Women | |
| Notes | ||
| Methods | Cohort study Country: the Netherlands | |
| Participants | Name of parent cohort: The Rotterdam Study Participants: 5435 (male/female: n.r.) Inclusion criteria: aged ≥ 55 and living in the Ommoord district Recruitment: 1989 to 1993 Outcome assessment: December 2011 Number of cases: 211 (male/female: 128/83) Case definition: incidence Years of follow‐up: mean: 15.2 Type of selenium marker: intake | |
| Interventions | d.n.a. | |
| Outcomes | Analysed cases: 211 (male/female: 128/83) Statistical methods: Cox proportional hazard model Variables controlled in analysis: age, sex, alcohol intake, body mass index, smoking status, physical activity, Dutch healthy diet index, dietary processed meat intake, dietary unprocessed red meat intake, total energy intake, hormone replacement therapy, diabetes mellitus, education status, income status, total energy, adjusted sum of other minerals (excluding selenium), and family history of cancer | |
| Risk estimates [95% CI] | Reference category: lowest tertile Results: • Highest tertile: HR 1.39 (95% CI 0.97 to 1.99) | |
| Selenium levels in exposure categories | n.r. | |
| Notes | Lung cancer: highest tertile: HR 1.44 (95% CI 0.98 to 2.11) after exclusion of lung cancer within the first 2 years of follow‐up | |
| Methods | Unmatched, nested case‐control study Country: United States | |
| Participants | Participants: 6860 men Recruitment: 1971 to 1975 Number of cases: Case definition: incidence Years of follow‐up: 11 Type of selenium marker: serum | |
| Interventions | d.n.a. | |
| Outcomes | Statistical methods: proportional hazard regression/Cox regression | |
| Risk estimates [95% CI] | Reference category: highest quintile Results: | |
| Selenium levels in exposure categories | Lowest quintile: ≤ 103.0 µg/L | |
| Notes | N.B.: "Any cancer" in this study comprises all cancer cases for stomach, rectal, lung, colon, and bladder cancer. | |
| Methods | Matched, nested case‐control study Country: United States | |
| Participants | Participants: 9345 men Recruitment: 1971 to 1977 Number of cases: Case definition: incidence Years of follow‐up: 19 to 25 Type of selenium marker: serum | |
| Interventions | d.n.a. | |
| Outcomes | Analysed cases: random sample of 249 (out of 360) because of limited resources | |
| Risk estimates [95% CI] | Reference category: lowest quartile Results: | |
| Selenium levels in exposure categories | Lowest quartile: ≤ 119.29 µg/L | |
| Notes | ||
| Methods | Randomised controlled trial Nutritional Prevention of Cancer Trial (NPCT) Allocation: random, block/stratified by clinic Sequence generation: computer‐generated random numbers Concealment: central assignment (sealed pill bottles) Blinding: participant blinded, doctor blinded, outcome assessor/pathologist unclear, review/coding of medical records blinded Dropouts/withdrawals: “9 patients (5 in the selenium group and 4 in the placebo group) declined to provide additional illness information” (Clark 1996, p. 1959) ‐ 0 participants lost to vital follow‐up Intention‐to‐treat‐analysis: yes Recruitment period: 1983 to 1991 End of predefined study period: 31 December 1993 Blinded intervention continued until end of blinded period: 31 January 1996 Intervention duration: • 31 December 1993 (end of study period): mean = 4.5 years • 31 January 1996 (end of blinded period): mean = 7.9 years Observation period/dermatological follow‐up: • 31 December 1993 (end of study period): mean = 6.4 years • 31 January 1996 (end of blinded period): mean = 7.4 years Detection of cases: dermatological examination and interview every 6 months during follow‐up; incident BCC and SCC diagnosed by biopsy and confirmed by another dermatopathologist Informed consent: written informed consent forms, approval by institutional review board of participating institutions | |
| Participants | Country: United States Participants: 1312 (randomised to selenium group: 653; to placebo group: 659) Condition: male and female participants with history of 2 or more squamous cell or basal cell skin cancers Demographics: mean age 63.4 years (selenium)/63.0 years (placebo); 73.8% men (selenium), 75.6% men (placebo) Recruitment and setting: 7 dermatological clinics (3 academic units, 4 private practices) in the United States | |
| Interventions | Intervention: 200 µg selenium supplied as 500 mg selenium yeast tablets p.o. daily Control: placebo | |
| Outcomes | Primary outcome measure: incidence of basal and squamous cell carcinoma of the skin: • All analyses were based on 1250 participants with initial blood collection within 4 days after randomisation (621 in the selenium group and 629 in the placebo group) Other reported outcomes and secondary outcome measures: • Reported in Clark 1996: incidence of lung cancer, prostate cancer, colorectal cancer, any cancer, head and neck cancer, bladder cancer, oesophageal cancer, breast cancer, melanoma, haematological cancer • Reported in Duffield‐Lillico 2002: overall cancer mortality | |
| Risk estimates [95% CI] | Primary outcomes: At end of study period (31 December 1993) (Clark 1996) • BCC: RR 1.10 (95% CI 0.95 to 1.28); cases: selenium group: 377, placebo group: 350; incidence per person‐year under follow‐up: selenium group 0.16, placebo group 0.15 • SCC: RR 1.14 (95% CI 0.93 to 1.39); cases: selenium group 218, placebo group: 190; incidence per person‐year under follow‐up: selenium group 0.07, placebo group 0.06 At end of blinded period (31 January 1996) (Duffield‐Lillico 2003) • BCC: RR 1.17 (95% CI 1.02 to 1.35), HR 1.09 (95% CI 0.94 to 1.26); number of cases not reported; incidence per person‐year under follow‐up: selenium group: 0.16, placebo group 0.13 • SCC: RR 1.32 (95% CI 1.09 to 1.60), HR 1.25 (95% CI 1.03 to 1.51); number of cases not reported; incidence per person‐year under follow‐up: selenium group: 0.05, placebo group 0.07 • NMSC: RR 1.27 (95% CI 1.11 to 1.45), HR 1.17 (95% CI 1.02 to 1.34); number of cases not reported; incidence per person‐year under follow‐up: selenium group: 0.20, placebo group 0.16 Other reported outcomes and secondary outcomes: At end of study period (31 December 1993) (Clark 1996) • Lung cancer: RR 0.54 (95% CI 0.30 to 0.98), adjusted HR 0.56 (95% CI 0.31 to 1.01) cases selenium: 17, placebo: 31 • Prostate cancer: RR 0.37 (95% CI 0.18 to 0.71), adjusted HR 0.35 (95% CI 0.18 to 0.65) cases selenium: 13, placebo: 35 • Colorectal cancer: RR 0.42 (95% CI 0.18 to 0.95), adjusted HR 0.39 (95% CI 0.17 to 0.90) cases selenium: 8, placebo: 19 • Any cancer: RR 0.63 (95% CI 0.47 to 0.85), adjusted HR 0.61 (95% CI 0.46 to 0.82) cases selenium: 77, placebo: 119 • Head and neck cancer: RR 0.74 (95% CI 0.21 to 2.43), adjusted HR 0.77 (95% CI 0.27 to 2.24) cases selenium: 6, placebo: 8 • Bladder cancer: RR 1.32 (95% CI 0.40 to 4.61), adjusted HR 1.27 (95% CI 0.44 to 3.67) cases selenium: 8, placebo: 6 • Oesophageal cancer: RR 0.33 (95% CI 0.03 to 1.84), adjusted HR 0.30 (95% CI 0.06 to 1.49) cases selenium: 2, placebo: 6 • Breast cancer: RR 2.88 (95% CI 0.72 to 16.5), adjusted HR 2.95 (95% CI 0.80 to 10.9) cases selenium: 9, placebo:3 • Melanoma: RR 0.97 (95% CI 0.32 to 2.96), adjusted HR 0.92 (95% CI 0.34 to 2.45) cases selenium: 8, placebo: 8 • Haematological cancer: RR 1.58 (95% CI 0.46 to 6.14), adjusted HR 1.50 (95% CI 0.49 to 4.60) cases selenium: 8, placebo: 5 • Other specific carcinomas: RR 0.55 (95% CI 0.14 to 1.82), adjusted HR 0.54 (95% CI 0.18 to 1.62), cases selenium: 5, placebo: 9 • Total carcinoma: RR 0.55 (95% CI 0.40 to 0.77), adjusted HR 0.54 (95% CI 0.39 to 0.75), cases selenium: 59; placebo: 104 • Leukaemia/lymphoma: RR 1.58 (95% CI 0.46 to 6.14), adjusted HR 1.50 (95% CI 0.49 to 4.60), cases selenium: 8, placebo 5 • Other specific non‐carcinomas: RR 0.99 (95% CI 0.13 to 7.37), HR 0.99 (95% CI 0.20 to 4.94), cases selenium: 3, placebo: 3 • Total non‐carcinomas: RR 1.17 (95% CI 0.57 to 2.44), adjusted HR 1.16 (95% CI 0.60 to 2.27), cases selenium: 19; placebo: 16 At end of blinded period (31 January 1996) (Duffield‐Lillico 2002) • Lung cancer: RR 0.70 (95% CI 0.40 to 1.21), adjusted HR 0.74 (95% CI 0.44 to 1.24), cases selenium: 25, placebo: 35 • Prostate cancer: RR 0.51 (95% CI 0.29 to 0.87), adjusted HR 0.48 (95% CI 0.28 to 0.80), cases selenium: 22, placebo: 42 • Colorectal cancer: RR 0.46 (95% CI 0.19 to 1.08), adjusted HR 0.46 (95% CI 0.21 to 1.02), cases selenium: 9, placebo: 19 • Any cancer: RR 0.75 (95% CI 0.58 to 0.98), adjusted HR 0.75 (95% CI 0.58 to 0.97), cases selenium: 105, placebo: 137 • Head and neck cancer: RR 1.27 (95% CI 0.42 to 4.01), adjusted HR 1.27 (95% CI 0.47 to 3.42), cases selenium: 9, placebo: 7 • Bladder cancer: RR 1.24 (95% CI 0.44 to 3.61), adjusted HR 1.28 (95% CI 0.50 to 3.25), cases selenium: 10, placebo: 8 • Oesophageal cancer: RR 0.39 (95% CI 0.04 to 2.41), adjusted HR 0.40 (95% CI 0.08 to 2.07), cases selenium: 2, placebo: 5 • Breast cancer: RR 1.82 (95% CI 0.62 to 6.01), adjusted HR 1.89 (95% CI 0.69 to 5.14), cases selenium: 11, placebo: 6 • Melanoma: RR 1.21 (95% CI 0.46 to 3.30), adjusted HR 1.18 (95% CI 0.49 to 2.85), cases selenium: 11, placebo: 9 • Haematological cancer (lymphoma and leukaemia): RR 1.32 (95% CI 0.40 to 4.61), adjusted HR 1.25 (95% CI 0.43 to 3.61), cases selenium: 8, placebo: 6 • Cancer mortality, all sites: RR 0.59 (95% CI 0.39 to 0.89), adjusted HR 0.59 (95% CI 0.39 to 0.87), cases selenium: 40, placebo: 66 • Other carcinomas: RR 0.66 (95% CI 0.19 to 2.07), adjusted HR 0.67 (95% CI 0.24 to 1.88), cases selenium: 6, placebo:9 • Other non‐carcinomas: RR 0.59 (95% CI 0.09 to 3.04), adjusted HR 0.59 (95% CI 0.14 to 2.47), cases selenium: 3, placebo: 5 | |
| Selenium levels in exposure categories | d.n.a. | |
| Notes | Adverse effects: Clark 1996: 35 participants (21 in selenium and 14 in control group) complained of adverse effects, mostly involving gastrointestinal upset, and withdrew treatment. Post hoc introduced secondary outcomes: all‐cause mortality, total cancer mortality, total cancer incidence, and incidence of lung/prostate/colorectal cancers HR: adjusted for sex, age, smoking status, clinic site, plasma selenium concentration, clinical sun damage, sunscreen use at baseline, and number of BCCs/SCCs/NMSCs in the 12 months before randomisation | |
| Risk of bias | ||
| Bias | Authors' judgement | Support for judgement |
| Random sequence generation (selection bias) | Low risk | Random, block/stratified by clinic, computer‐generated random numbers |
| Allocation concealment (selection bias) | Low risk | Central assignment (sealed pill bottles) |
| Blinding (performance bias and detection bias) | Unclear risk | Occurrence of a detection bias, namely, a considerably higher rate of prostate biopsy in the placebo group |
| Selective reporting (reporting bias) | Low risk | No problems found |
| Methods | Cohort study Country: United States | |
| Participants | Name of parent cohort: National Institute of Health‐American Association of Retired Persons (NIH‐AARP) Diet and Health Study Participants: 482,807 (male/female: 287,944/194,863) Inclusion criteria: 50 to 71 years of age, AARP members, no previous diagnosis of cancer other than NMSC Recruitment: 1995 to 1996 Outcome assessment: December 2006 Number of cases: 592 (male/female: 257/335) Case definition: incidence Years of follow‐up: mean: 9.1 Type of selenium marker: intake | |
| Interventions | d.n.a. | |
| Outcomes | Analysed cases: Statistical methods: Cox proportional hazard model Variables controlled in analysis: entry age, sex, calories, smoking status, race, education, BMI, physical activity, vitamin C, vitamin E, beta‐carotene, and folate | |
| Risk estimates [95% CI] | Reference category: lowest quintile Results: | |
| Selenium levels in exposure categories | Lowest quintile: median 47 µg/d | |
| Notes | ||
| Methods | Matched, nested case‐control study Country: Denmark | |
| Participants | Name of parent cohort: Danish Prospective Diet, Cancer and Health Study Participants: 27,179 men Inclusion criteria: aged 50 to 64, born in Denmark, residents in the Copenhagen and Aarhus areas, no previous history of cancer Recruitment: December 1993 to May 1997 Outcome assessment: 31 December 2007 Number of cases: 911 (male/female: 911/0) Case definition: incidence Years of follow‐up: 8 Type of selenium marker: plasma | |
| Interventions | d.n.a. | |
| Outcomes | Analysed cases: Prostate cancer • 784 (male/female: 784/0) Statistical methods: conditional logistical regression Variables controlled in analysis: body mass index, education, smoking status, duration and frequency, and participation in sport Variables controlled by matching: age at blood collection, time of day of blood collection, and fasting status | |
| Risk estimates [95% CI] | Reference category: lowest quartile Results: • Highest quartile: OR 0.95 (95% CI 0.70 to 1.29) | |
| Selenium levels in exposure categories | Lowest quartile: ≤ 71.4 μg/d | |
| Notes | ||
| Methods | Cohort/subcohort controlled cohort study Country: Channel Islands (UK) | |
| Participants | Participants: 5162 women Recruitment: 1967 to 1976 Number of cases: Case definition: incidence Years of follow‐up: mean: 11 years for cases Type of selenium marker: plasma | |
| Interventions | d.n.a. | |
| Outcomes | Analysed cases: 46 of 88 (reason for non‐inclusion: no plasma available) | |
| Risk estimates [95% CI] | Reference category: highest quartile Results: | |
| Selenium levels in exposure categories | Lowest quartile: ≤ 84.90 µg/L | |
| Notes | ||
| Methods | Cohort study Country: the Netherlands | |
| Participants | Name of parent cohort: The Rotterdam Study Participants: 4877 women Inclusion criteria: aged ≥ 55 and living in the Ommoord district. no history of previous breast cancer Recruitment: July 1989 to September 1993 Outcome assessment: December 2010 Number of cases: 199 (male/female: 0/199) Case definition: incidence Years of follow‐up: median: 17 years Type of selenium marker: intake | |
| Interventions | d.n.a. | |
| Outcomes | Analysed cases: 199 (male/female: 0/199) Statistical methods: Cox proportional hazard model Variables controlled in analysis: age, body mass index, education level, family history of breast cancer, smoking status, alcohol consumption, use of multi‐vitamin supplement | |
| Risk estimates [95% CI] | Reference category: lowest tertile Results: • Highest tertile: HR 1.34 (95% CI 0.94 to 1.91) | |
| Selenium levels in exposure categories | Lowest tertile: median 23.58 µg/d | |
| Notes | ||
| Methods | Cohort study Country: United States (Hawaii and California) | |
| Participants | Name of parent cohort: The Multiethnic Cohort Participants: 75,216 men Inclusion criteria: aged 45 to 75, African Americans, Native Hawaiians, Japanese American, Latinos, and white men, without a previous diagnosis of prostate cancer Recruitment: 1993 to 1996 Outcome assessment: 31 December 2010 Number of cases: • Prostate cancer: 7115 Case definition: incidence Years of follow‐up: mean: 13.9 Type of selenium marker: intake | |
| Interventions | d.n.a. | |
| Outcomes | Analysed cases: • Prostate cancer: 7115 Statistical methods: Cox proportional hazard model Variables controlled in analysis: age at entry, race/ethnicity, family history of prostate cancer, body mass index, height, smoking status, education level, history of diabetes, physical activity, daily intakes of alcohol, calcium, legume, and lycopene | |
| Risk estimates [95% CI] | Reference category: lowest quintile Results: • Highest quintile: RR 1.01 (95% CI 0.84 to 1.20) | |
| Selenium levels in exposure categories | Lowest quintile: < 44.0 µg/1000 kcal/d | |
| Notes | ||
| Methods | Matched, nested case‐control study Country: United States | |
| Participants | Participants: 2530 men and women Recruitment: 1967 to 1969 Number of cases: Case definition: incidence Years of follow‐up: 11 to 14 Type of selenium marker: serum | |
| Interventions | d.n.a. | |
| Outcomes | Statistical methods: n.r. | |
| Risk estimates [95% CI] | Reference category: highest quartile Results: | |
| Selenium levels in exposure categories | Lowest quartile: ≤ 103 µg/L | |
| Notes | ||
| Methods | Matched, nested case‐control study Country: United States | |
| Participants | Participants: 26,975 white non‐Hispanic men Recruitment: September 1993 to June 2001 Number of cases: Case definition: incidence Years of follow‐up: 0.3 to 8.0 Type of selenium marker: serum | |
| Interventions | d.n.a. | |
| Outcomes | Analysed cases: 724 of 803 (reason for non‐inclusion: no selenium measurement available) | |
| Risk estimates [95% CI] | Reference category: lowest quartile Results: | |
| Selenium levels in exposure categories | Lowest quartile: 50.5 to 126.7 µg/L | |
| Notes | ||
| Methods | Cohort study Country: United States | |
| Participants | Inclusion criteria: aged 50 to 76 years, participants recruited from subscribers to commercial mailing list, residents of western Washington state, non‐whites excluded, no malignant disease at baseline Name of parent cohort: Vitamins and Lifestyle (VITAL) study Recruitment: 1 October 2000 to 31 December 2002 Type of selenium marker: supplemental intake (questionnaire: use of supplements over past 10 years, mean supplemental intake/day calculated) Case definition: incidence Participants: 35,242 men Outcome assessment: 31 December 2004 Number of cases: Years of follow‐up: 2 to 4 Asgari 2009 Participants: 69,671 men and women Outcome assessment: 31 December 2006 Number of cases: Years of follow‐up: 4 to 5 years | |
| Interventions | d.n.a. | |
| Outcomes | Analysed cases: 818 of 830 (reason for non‐inclusion: not reported) Asgari 2009 Analysed cases: 1 case not analysed (reason for non‐inclusion: not reported) Statistical methods: Cox proportional hazard regression Variables controlled in analysis: age, sex, education, family history of melanoma, personal history of non‐melanoma skin cancer, mole removal, freckles, sunburns, hair colour, reaction to sunlight exposure | |
| Risk estimates [95% CI] | Reference category: no supplemental selenium intake (lowest exposure category) Results: Asgari 2009 Results: | |
| Selenium levels in exposure categories | Stratification according to supplemental selenium intake Peters 2008 Asgari 2009 • Lowest exposure category: no supplemental intake | |
| Notes | ||
| Methods | Matched, nested case‐control study Country: China | |
| Participants | Participants: 9143 men Recruitment: 1992 to 1997 Number of cases: Case definition: incidence Years of follow‐up: ≈ 3 Type of selenium marker: serum | |
| Interventions | d.n.a. | |
| Outcomes | Analysed cases: plasma available for 108 of a total of 339 identified cases | |
| Risk estimates [95% CI] | Reference category: lowest tertile Results: | |
| Selenium levels in exposure categories | Lowest tertile: 20 to 39 µg/L | |
| Notes | ||
| Methods | Randomised controlled trial Substudy of the Nutritional Prevention of Cancer Trial (NPCT 2002) Allocation: random Sequence generation: computer‐generated random numbers Concealment: central assignment (sealed pill bottles) Blinding: participant blinded, doctor blinded, outcome assessor/pathologist unclear, review/coding of medical records blinded Dropouts/withdrawals: 2 participants declined to provide additional illness information, no participant lost to vital follow ‐up Intention‐to‐treat‐analysis: yes Recruitment period: 1989‐1992 Treatment duration: • Blinded intervention continued until the end of the blinded period; 1 February 1996. Observation period/dermatological follow‐up: 1 February 1996 Detection of cases: dermatological examination and interview every 6 months during follow‐up; incident BCC and SCC diagnosed by biopsy and confirmed by another dermatopathologist Informed consent: written informed consent forms, approval by institutional review boards of participating institutions | |
| Participants | 423 male and female participants with prior non‐melanoma skin cancer Country: United States Participants: 423 (randomised to selenium group: 210, to placebo group: 213) Condition: male and female with history of 2 or more squamous cell or basal cell skin cancers Demographics: mean age 63.8 years (selenium)/63.8 years (placebo); 66.2% men (selenium). 68.2% men (placebo) Recruitment and setting: dermatological clinic in Macon, Georgia | |
| Interventions | Intervention: • 400 µg selenium supplied as selenium yeast tablets p.o. daily Control: • Placebo • 400 µg/d of selenium yeast or identical‐appearing low selenium yeast placebo Recruitment: 12 September 1989 to 3 April 1992 End of blinded treatment period: 2 February 1996 | |
| Outcomes | Primary outcome measure: incidence of basal and squamous cell carcinoma of the skin • All analyses were based on n = 423 participants with initial blood collection within 4 days after randomisation Other reported outcomes: • Total internal cancer incidence | |
| Risk estimates [95% CI] | Primary outcomes: • BCC: RR 0.90 (95% CI 0.65 to 1.24); cases: selenium group: 76, placebo group: 83; adjusted HR: 0.95 (95% CI 0.69 to 1.29) • SCC: RR 1.05 (95% CI 0.71 to 1.56); cases: selenium group: 56, placebo group: 53; adjusted HR: 1.05 (95% CI 0.72 to 1.53) • NMSC: RR 0.88 (95% CI 0.66 to 1.16); cases: selenium group: 98, placebo group: 108; adjusted HR: 0.91 (95% CI 0.69 to 1.20) • NMSC in women: RR 0.40 (95% CI 0.20 to 0.80) Other reported outcomes: • Total internal cancer incidence: RR 1.10 (95% CI 0.57 to 2.17); cases: selenium group: 21, placebo group: 19 | |
| Selenium levels in exposure categories | d.n.a. | |
| Notes | Information on study design, which was not reported in Reid 2008, was taken from information available on the Nutritional Prevention of Cancer Trial. Adverse effects: not reported HR: adjusted for: age (continuous), smoking status (never, former, current), gender | |
| Methods | Matched, nested case‐control study Country: Norway | |
| Participants | Participants: 9364 men and women Recruitment: 1979 to 1980 Number of cases: Case definition: incidence Years of follow‐up: 5 to 7 Type of selenium marker: serum | |
| Interventions | d.n.a. | |
| Outcomes | Analysed cases: 60 of 72 (reason for non‐inclusion: no sample available) | |
| Risk estimates [95% CI] | Reference category: highest 3 quartiles Results: | |
| Selenium levels in exposure categories | Lowest quartile: ≤ 114.49 µg/L | |
| Notes | ||
| Methods | Matched, nested case‐control study Country: China | |
| Participants | Participants: 41,563 men and women Recruitment: January 1993 to December 1993 Number of cases: Case definition: mortality Years of follow‐up: 6.8 to 7.8 Type of selenium marker: toenail | |
| Interventions | d.n.a. | |
| Outcomes | Analysed cases: 166 of 455 observed cases (only cases with questionnaire, blood sample, and toenail specimen analysed after 2000 owing to different methods of selenium analysis) | |
| Risk estimates [95% CI] | Reference category: lowest quartile Results: | |
| Selenium levels in exposure categories | Both genders and men Women | |
| Notes | ||
| Methods | Matched, nested case‐control study Country: Finland | |
| Participants | Participants: 8113 men and women Recruitment: February to April 1972 Number of cases: Case definition: incidence Years of follow‐up: 8.5 Type of selenium marker: serum | |
| Interventions | d.n.a. | |
| Outcomes | Statistical methods: logistical regression/paired‐sample OR | |
| Risk estimates [95% CI] | Reference category: above 30th percentile Results: | |
| Selenium levels in exposure categories | 1st to 10th percentile ≤ 34.00 µg/L | |
| Notes | ||
| Methods | Matched, nested case‐control study Country: Finland | |
| Participants | Participants: 12,155 men and women Recruitment: January to March 1977 Number of cases: Case definition: mortality Years of follow‐up: 3.7 Type of selenium marker: serum | |
| Interventions | d.n.a. | |
| Outcomes | Analysed cases: 51 out of 56 (reason for non‐inclusion: no serum sample available) | |
| Risk estimates [95% CI] | Reference category: highest 2 tertiles Results: | |
| Selenium levels in exposure categories | Lowest tertile: ≤ 47.00 µg/L | |
| Notes | ||
| Methods | Randomised controlled trial SELECT (Selenium and Vitamin E Cancer Prevention Trial) Allocation: random, block/stratified by clinic Sequence generation: computer‐generated random numbers Concealment: central assignment (pill bottles) Blinding: participant blinded, doctor blinded, outcome assessor/pathologist blinded, review/coding of medical records blinded Dropouts/withdrawals: of 35,533 randomised participants, 645 were excluded from analysis because they had prior prostate cancer, did not give informed consent, or participated at 2 study sites that were excluded owing to management and regulatory issues Intention‐to‐treat‐analysis: yes Recruitment period: 22 August 2001 to 24 June 2004 End of study period: 1 August 2009 Blinded intervention was discontinued on 23 October 2008 following the recommendation of the Data Safety and Monitoring Committee after the second formal interim analysis in September 2008. Detection of cases: Participants had clinic visits once every 6 months and reported prostate cancers to the study staff. Study staff obtained medical records to verify the diagnosis. Tissue and the corresponding pathology report were sent to the central pathology laboratory for confirmation. Informed consent: yes | |
| Participants | Countries: United States, Canada, Puerto Rico Number of participants: 34,888 men, randomised to 4 groups: placebo (8696), vitamin E (8737), selenium (8752), selenium + vitamin E (8703) Condition: healthy men, aged 50 years or older (African American) or 55 years or older (all other), no prior diagnosis of prostate cancer, 4 ng/mL or less of PSA in serum, a digital rectal examination not suspicious for cancer, no current use of anticoagulant therapy other than 175 mg/d or less of acetylsalicylic acid, or 81 mg/d or less of acetylsalicylic acid with clopidogrel bisulphate, no history of haemorrhagic stroke, normal blood pressure Demographics: median age: 62.3 to 62.6 years in all 4 intervention groups, 79% white in all 4 intervention groups Recruitment and setting: 427 participating sites | |
| Interventions | Group 1: placebo + placebo Group 2: 400 IU/d all rac‐alpha‐tocopheryl acetate + placebo Group 3: 200 µg/d L‐selenomethionine + placebo Group 4: 400 IU/d all rac‐alpha‐tocopheryl acetate + 200 µg/d L‐selenomethionine | |
| Outcomes | Primary outcome: incidence of prostate cancer as determined by routine clinical management Secondary outcomes: incidence of any cancer/lung cancer/colorectal cancer, diabetes mellitus, cardiovascular events, death from any cause | |
| Risk estimates [95% CI] | Results are presented for the comparison of selenium alone (group 3) vs placebo (group 1) Primary outcome: • Prostate cancer: HR 1.04 (95% CI 0.90 to 1.18) (99% CI 0.87 to 1.24), cases: selenium 432 (5‐year rate: 4.56%), placebo 416 (5‐year rate 4.43%) Secondary outcomes: • Any cancer: HR 1.01 (95% CI 0.89 to 1.15) • Lung cancer: HR 1.12 (99% CI 0.73 to 1.72) • Colorectal cancer: HR 1.05 (99% CI 0.66 to 1.67) • Other primary cancer (excluding prostate cancer, basal cell and squamous cell skin cancer): HR 0.95 (99% CI 0.77 to 1.17) • Diabetes mellitus: HR 1.07 (99% CI 0.94 to 1.22) • Cardiovascular events: HR 1.02 (99% CI 0.92 to 1.13) • Deaths: HR 0.99 (99% CI 0.82 to 1.19) • Deaths from cancer: HR 1.02 (99% CI 0.74 to 1.41) | |
| Selenium levels in exposure categories | d.n.a. | |
| Notes | Adverse effects: • Alopecia: RR 1.28 (99% CI 1.01 to 1.62) • Dermatitis grade 1 to 2: RR 1.17 (99% CI 1.00 to 1.35) • Dermatitis grade 3 to 4: RR 1.74 (99% CI 0.56 to 5.44) • Halitosis: RR 1.17 (99% CI 0.99 to 1.38) • Nail changes: RR 1.04 (99% CI 0.94 to 1.16) • Fatigue grade 1 to 2: RR 1.09 (99% CI 0.95 to 1.26) • Fatigue grade 3 to 4: RR 0.87 (99% CI 0.40 to 1.88) • Nausea grade 1 to 2: RR 1.19 (99% CI 0.94 to 1.52) • Nausea grade 3: RR 0.99 (99% CI 0.30 to 3.34) | |
| Risk of bias | ||
| Bias | Authors' judgement | Support for judgement |
| Random sequence generation (selection bias) | Low risk | Random, block/stratified by clinic, computer‐generated random numbers |
| Allocation concealment (selection bias) | Low risk | Central assignment |
| Blinding (performance bias and detection bias) | Low risk | Participants, doctors, outcomes |
| Selective reporting (reporting bias) | Low risk | No problems found |
| Methods | Cohort/subcohort controlled cohort study Country: the Netherlands | |
| Participants | Name of parent cohort: Netherlands Cohort Study (NLCS) Recruitment: 1986 van den Brandt 1993b Number of cases: • Gastric cardia adenocarcinoma (GCA): 114 (male/female: 97/17) Case definition: incidence Years of follow‐up: 16.3 Type of selenium marker: toenail | |
| Interventions | d.n.a. | |
| Outcomes | Analysed cases: • Oesophageal squamous cell carcinoma (ESCC): 64 of 71 • Gastric cardia adenocarcinoma (GCA): 114 of 127 | |
| Risk estimates [95% CI] | Reference category: lowest quartile Results: | |
| Selenium levels in exposure categories | Lowest quartile: ≤ 0.498 µg/g | |
| Notes | ||
| Methods | Nested case‐control study Country: Germany | |
| Participants | Participants: 11,928 men (from the total cohort of 25,540 men and women) Name of parent cohort: EPIC‐Heidelberg cohort Recruitment: 1994 to 1998 Number of cases: • Prostate cancer: 248 Case definition: incidence Years of follow‐up: mean: 3 Type of selenium marker: serum | |
| Interventions | d.n.a. | |
| Outcomes | Statistical methods: conditional logistical regression Variables controlled in matching: age group and time of recruitment | |
| Risk estimates [95% CI] | Reference category: lowest quartile Results: Prostate cancer • Highest quartile: OR 1.10 (95% CI 0.58 to 2.09) | |
| Selenium levels in exposure categories | Lowest quartile: ≤ 78.9 µg/L | |
| Notes | ||
| Methods | Cohort study Country: Denmark | |
| Participants | Participants: 3333 males; male participants were derived from 14 workplaces in Copenhagen: the Air Force, Army, Navy, Emergency Management Agency, Postal Service, Customs Service, a railroad company, a national bank, a telephone company, 3 municipal service centres (for electricity and engineering and a fire brigade), a pharmaceutical company, and a building contractor company Name of parent cohort: Copenhagen male study Recruitment: from 1970 to 1971/1985 to 1986 Number of cases: • Deaths for lung cancer: 167 Case definition: death for lung cancer Years of follow‐up: 16 Type of selenium marker: serum | |
| Interventions | d.n.a. | |
| Outcomes | Statistical methods: Cox logistical regression | |
| Risk estimates [95% CI] | Reference category: lowest exposure category: 0.4 to 1.0 µmol/L Results: | |
| Selenium levels in exposure categories | Lowest category: 31.58 to 78.96 µg/L Highest category: 120.65 to 236.88 µg/L | |
| Notes | ||
| Methods | Cohort study Country: China | |
| Participants | Name of parent cohorts: Shangai Men's Health Study (SMHS) and Shangai Women's Health Study (SWHS) Participants: 133,957 (male/female: 61,470/74,941) Inclusion criteria: Recruitment: Outcome assessment: 31 December 2012 Number of cases: 2603 (male/female: 1798/805) Case definition: mortality Years of follow‐up: Type of selenium marker: intake | |
| Interventions | d.n.a | |
| Outcomes | Analysed cases: Statistical methods: Cox proportional hazard model Variables controlled in analysis: age, birth cohort, education, income, marital status, occupation, body mass index, physical activity, total energy intake, dietary fat intake, supplement use, smoking status, drinking status, status with regard to history of hypertension, diabetes, coronary hearth disease, or stroke, family history of cancer and menopausal status (women only) | |
| Risk estimates [95% CI] | Reference category: lowest quintile Results: | |
| Selenium levels in exposure categories | SMHS: | |
| Notes | ||
| Methods | Cohort study Country: United States | |
| Participants | Participants: 133,614 women Name of parent cohort: Women's Health Initiative (WHI) Recruitment: n.r. Number of cases: • Ovarian cancer: 451 Case definition: incidence Years of follow‐up: mean: 7 Type of selenium marker: supplemental selenium intake | |
| Interventions | d.n.a. | |
| Outcomes | Statistical methods: Cox logistical regression | |
| Risk estimates [95% CI] | Reference category: no intake of supplemental selenium (lowest exposure category) Results: | |
| Selenium levels in exposure categories | Lowest exposure category: no supplemental selenium intake Highest exposure category: > 20 µg/d supplemental selenium intake | |
| Notes | ||
| Methods | Cohort/subcohort controlled cohort study Country: the Netherlands | |
| Participants | Name of parent cohort: Netherlands Cohort Study (NLCS) Recruitment: 1986 Case definition: incidence van den Brandt 1993b Number of cases: van den Brandt 1993a Number of cases: van den Brandt 1994 Number of cases: Zeegers 2002 Number of cases: van den Brandt 2003 Number of cases: Years of follow‐up: Type of selenium marker: toenail | |
| Interventions | d.n.a. | |
| Outcomes | van den Brandt 1993b van den Brandt 1993a van den Brandt 1994 Zeegers 2002 van den Brandt 2003 | |
| Risk estimates [95% CI] | Reference category: lowest quartile/quintile Results: van den Brandt 1993b van den Brandt 1993a van den Brandt 1994 Zeegers 2002 van den Brandt 2003 | |
| Selenium levels in exposure categories | van den Brandt 1993b van den Brandt 1993a Women van den Brandt 1994 Zeegers 2002 van den Brandt 2003 | |
| Notes | Primary publication:van den Brandt 1993b | |
| Methods | Matched, nested case‐control study Country: the Netherlands | |
| Participants | Participants: 8760 women Recruitment: n.r. Number of cases: Case definition: incidence Years of follow‐up: 0.6 to 3.5, mean: 2.1 Type of selenium marker: toenail | |
| Interventions | d.n.a. | |
| Outcomes | Analysed cases: 7 detected during initial mammography screening in this study and not included in the analysis of incident cases Statistical methods: n.r. | |
| Risk estimates [95% CI] | Reference category: lowest quartile Results: | |
| Selenium levels in exposure categories | n.r. | |
| Notes | ||
| Methods | Cohort/subcohort controlled cohort study Country: Finland | |
| Participants | Participants: 1110 men Recruitment: 1974 Number of cases: Case definition: incidence Years of follow‐up: 10 Type of selenium marker: serum | |
| Interventions | d.n.a. | |
| Outcomes | Statistical methods: conditional logistical regression | |
| Risk estimates [95% CI] | Reference category: highest tertile Results: | |
| Selenium levels in exposure categories | Lowest tertile: 15 to 46 µg/L | |
| Notes | ||
| Methods | Cohort study Country: United States | |
| Participants | Inclusion criteria: aged 50 to 76 years, recruited from subscribers to commercial mailing list, residents of western Washington state, non‐whites excluded, no malignant disease at baseline Name of parent cohort: Vitamins and Lifestyle (VITAL) study Number of participants: 66,227 men and women (male/female: n.r.) Recruitment: 1 October 2000 to 31 December 2002 Outcome assessment: 31/12/2008 Number of cases: Case definition: incidence Years of follow‐up: mean: 6.5 years Type of selenium marker: supplemental intake (questionnaire: use of supplements over past 10 years, mean supplemental intake/d calculated) | |
| Interventions | d.n.a. | |
| Outcomes | Statistical methods: Cox proportional hazard regression | |
| Risk estimates [95% CI] | Reference category: none Results: | |
| Selenium levels in exposure categories | Lowest level: none Highest level: 20.1 to 400.0 µg/d | |
| Notes | ||
| Methods | Frequency‐matched cohort‐controlled study Country: China | |
| Participants | Participants:Mark 2000: 29,584 men and women; Wei 2004: 1103 people who were originally selected as disease‐free controls in Mark 2000 Recruitment: 1985 Number of cases: Mark 2000 Case definition: mortality, incidence Years of follow‐up: unclear/approximately 9 (Wei 2004), 6 (Mark 2000) Type of selenium marker: serum | |
| Interventions | d.n.a. | |
| Outcomes | Statistical methods: Cox‐proportional hazard model Variables controlled in analysis:Wei 2004: age, cholesterol, smoking, alcohol intake, BMI; Mark 2000: age | |
| Risk estimates [95% CI] | Wei 2004 Results: Mark 2000 Results: | |
| Selenium levels in exposure categories | Wei 2004 Mark 2000 | |
| Notes | Primary publication: Wei 2004 Remark: | |
| Methods | Matched, nested case‐control study Country: United States | |
| Participants | Participants: 10,940 men and women Recruitment: 1973 to 1974 Number of cases: Case definition: incidence Years of follow‐up: 5 Type of selenium marker: serum | |
| Interventions | d.n.a. | |
| Outcomes | Statistical methods: logistical regression of unmatched data | |
| Risk estimates [95% CI] | Reference category: highest quintile, highest 3 quintiles Results: | |
| Selenium levels in exposure categories | Lowest quintile: ≤ 114 µg/L | |
| Notes | ||
| Methods | Matched, nested case‐control study Country: United States | |
| Participants | Participants: 33,737 men Recruitment: 1986 to 1987 Number of cases: Case definition: incidence Years of follow‐up: 8 to 9 Type of selenium marker: toenail | |
| Interventions | d.n.a. | |
| Outcomes | Statistical methods: logistical regression, conditional logistical regression | |
| Risk estimates [95% CI] | Reference category: lowest quintile Results: | |
| Selenium levels in exposure categories | Lowest quintile: 0.530 to 0.730 µg/g | |
| Notes | ||
| Methods | Randomised controlled trial Allocation: random Sequence generation: unclear, not described Concealment: unclear, not described Blinding: described as double‐blind; blinding of participants: adequate, placebo tablets; blinding of investigators and doctors: unclear Dropouts/withdrawals: unclear, not described Intention‐to‐treat‐analysis: unclear, not described Recruitment period: unclear, not described Observation period: 2 years Study period: 2 years Detection of cases: unclear, use of "national standards" for the diagnosis of liver cancer Informed consent: unclear, not described | |
| Participants | Country: China Number of participants: 2474 Condition: first‐degree relatives within 3 generations of families with 2 or more cases of liver cancer during the period 1972 to 1985 Demographics: gender distribution not reported; age: 15 to 75 years Recruitment and setting: Participants were residents in Qidong province. | |
| Interventions | Intervention: 200 µg selenium as selenised yeast p.o. daily, intervention period unclear Control: placebo | |
| Outcomes | Primary outcome measure: incidence of primary liver cancer within 2 years after start of intervention Results: • 13 cases in 1030 placebo participants • 10 cases in 1444 selenium participants | |
| Risk estimates [95% CI] | n.r. | |
| Selenium levels in exposure categories | d.n.a. | |
| Notes | Data were extracted from Yu 1991. We identified 2 later publications (Li 1992, Yu 1993), which we assumed to report on the same trial as Yu 1991. However, the total number of participants differed from the initial report (N = 3849 in the later publications, with 1485 receiving placebo and 2364 receiving selenium). The total number of cases was not reported in either Li 1992 or Yu 1993. Reported results were as follows: Li 1992 Person‐year incidence rate in intervention and control groups: • Within 1 year of follow‐up: selenium group 175.36/100,000; placebo group: 414.65/100,000 • Within 2 years of follow‐up: selenium group 219.37/100,000; placebo group: 553.15/100,000 Yu 1993 Cumulated incidence • After 1 year: selenium group 1.75/1000; placebo group: 4.15/1000 • After 2 years: selenium group 2.19/1000; placebo group: 5.53/1000 • We could not make contact with study investigators to clarify these discrepancies. As we could not clarify the actual number of liver cancer cases in the later publications, we decided to use the data of Yu 1991 for this review. • Adverse effects were not mentioned in Yu 1991 or Li 1992. Yu 1993 stated that no cases of selenosis were observed in the trial. | |
| Risk of bias | ||
| Bias | Authors' judgement | Support for judgement |
| Random sequence generation (selection bias) | Unclear risk | Sequence generation not described |
| Allocation concealment (selection bias) | Unclear risk | Not described |
| Blinding (performance bias and detection bias) | Low risk | Participants blinded, doctors stated only as double‐blind |
| Selective reporting (reporting bias) | Unclear risk | Recruitment period unclear; dropout unclear |
| Methods | Randomised controlled trial Allocation: random Sequence generation: unclear, not described Concealment: unclear, not described Blinding: of participants: adequate (placebo); of investigators and doctors: unclear, not described Dropouts/withdrawals: unclear, not described Recruitment period: unclear, not described Intention‐to‐treat‐analysis: unclear, not described Observation period: 1987 to 1994 Intervention period: 1987 to 1990 Detection of cases: unclear, monthly blood sample during follow‐up for liver enzymes (SGPT, ZnTT), use of "national standards" for the diagnosis of liver cancer Informed consent: unclear, not described | |
| Participants | Country: China Number of participants: 226 (selenium group: 113; placebo group 113) Condition: HBs‐antigen carriers with normal liver function Demographics: 95 men, 131 women; age: 21 to 63 years Recruitment and setting: recruitment “through screening in a village in the city Qidong” (Li 1992) | |
| Interventions | Intervention: 200 µg selenium as selenised yeast p.o. daily for 4 years Control: placebo | |
| Outcomes | Primary outcome measure: incidence of primary liver cancer (defined as increase in SGPT and ZnTT) Results: At end of intervention period • 0 cases in the selenium group • 7 cases in the placebo group for a total of 445 person‐years of observation (person‐time incidence rate: 1573.03/100,000) | |
| Risk estimates [95% CI] | n.r. | |
| Selenium levels in exposure categories | d.n.a. | |
| Notes | Adverse effects: "No side effects have been found in these trials" (Yu 1997, p. 124) Further data reported in: Li 1992 (Chinese, translated); Yu 1991 In Yu 1991, a different incidence was reported for the selenium group (5 cases). We could not clarify this discrepancy with later papers Li 1992 and Yu 1997. | |
| Risk of bias | ||
| Bias | Authors' judgement | Support for judgement |
| Random sequence generation (selection bias) | Unclear risk | Sequence generation not described |
| Allocation concealment (selection bias) | Unclear risk | Not described |
| Blinding (performance bias and detection bias) | Low risk | Participants blinded, doctors stated only as double‐blind |
| Selective reporting (reporting bias) | Unclear risk | Recruitment period unclear; dropout unclear |
| Methods | Matched, nested case‐control study Country: China (Taiwan) | |
| Participants | Participants: 4841 men Recruitment: August 1988 to June 1992 Number of cases: Case definition: incidence Years of follow‐up: 4.5 to 8.3 Type of selenium marker: plasma | |
| Interventions | d.n.a. | |
| Outcomes | Analysed cases: 69 of 73 (reason for non‐inclusion: no sample available) | |
| Risk estimates [95% CI] | Reference category: lowest quintile Results: | |
| Selenium levels in exposure categories | Lowest quintile ≤ 124.90 µg/L | |
| Notes | ||
µ: micro.
AFP: alpha‐fetoprotein.
ALT: alanine aminotransferase.
ATBC: alpha‐tocopherol, beta‐carotene cancer prevention study.
AU: arbitrary unit.
AUA: American Urological Association.
BCC: basal cell carcinoma.
BMI: body mass index.
BPH: benign prostate hyperplasia.
CARET: Carotene and Retinol Efficacy Trial.
CHD: coronary heart disease.
CI: confidence interval.
CIS: carcinoma in situ.
CSDLH: Canadian Study of Diet, Lifestyle and Health.
CT: computed tomography.
CVD: cardiovascular disease.
dL: deciliter.
d.n.a.: does not apply.
DOM: Diagnostic onderzoek mammacarcinoom.
DSMC: Data and Safety Monitoring Committee.
ECOG: Eastern Cooperative Oncology Group.EPIC: European Prospective Investigation of Cancer.EVA: Etude du Vieillissement Antériel.
EPOZ: Epidemiologisch onderzoek naar risico‐indicatoren voor hart‐ en vaatziekten.
FFQ: food‐frequency questionnaire.
g: gram.
GBTC: gallbladder and biliary tract cancer.
HBs‐Ag: hepatitis B surface antigen.
HCC: hepatocellular carcinoma.
HCV: hepatitis C virus.
HGPIN: high‐grade prostatic intraepithelial neoplasia.
HPFP: Hypertension Detection Follow‐up Programme.
HPFS: Health Professionals Follow‐up Study.
HR: hazard ratio.
HRT: hormone replacement therapy.
IHBC: intrahepatic bile duct cancer.
IRR: incident rate ratio.
IU: international unit.
L: litre.
m: milli.
max. adj.: maximally adjusted.
MHC: Mobile Health Clinic.
n: nano.
NHS: Nurses‘ Health Study.
NLCS: Netherlands Cohort Study.
NMSC: non‐melanoma skin cancer.
NPCT: Nutritional Prevention of Cancer Trial.
n.r.: not reported.
NSAID: non‐steroidal anti‐inflammatory drug.
OR: odds ratio.
p.: page.
p.o.: per os.
ppm: parts per million.
PSA: prostate‐specific antigen.
RCT: randomised controlled trial.
RR: risk ratio.
SCC: squamous cell carcinoma.
SD: standard deviation.
SGPT: alanine aminotransferase.
TIA: transient ischaemic attack.
UK: United Kingdom.
USA: United States of America.
VITAL: Vitamins and Lifestyle study.
WHI: Women's Health Initiative.
ZnTT: zinc turbidity test.
Characteristics of excluded studies [ordered by study ID]
| Study | Reason for exclusion |
| Same results of SELECT 2009, stratified according to tocopherol status | |
| Results not reported according to inclusion criteria: HR estimated per SD increase of selenium level reported | |
| Cohort study: Iowa Women's Health Study cohort Selenium exposure not assessed according to eligibility: only intake of selenium supplements yes/no in questionnaire assessed | |
| Case‐control study with precancerous condition (carcinoma in situ of the cervix) | |
| Case‐control study | |
| Case‐control study | |
| Case‐control study | |
| APPOSE (Australian Prostate Cancer Prevention Trial Using Selenium): Publication describes study design; trial was not started. | |
| Population‐based, prospective case‐control study: Lipid Research Clinic Prevalence and Follow‐Up study Results not reported according to inclusion criteria: differences in mean selenium levels reported | |
| Nested case‐control study Selenium exposure not assessed according to eligibility: selenium measurement conducted in tissue of benign breast disease | |
| Nested case‐control study: EPIC Norfolk study cohort Results not reported according to inclusion criteria: RR estimate per unit increase in selenium level reported | |
| Results not reported according to inclusion criteria: selenium not reported as independent variable ‐ only selenoprotein P | |
| Randomised Study of Vitamin E, Selenium, and Soy Protein Isolate in Patients with High‐Grade Prostatic Intraepithelial Neoplasia: Multi‐component Intervention | |
| Same population as van den Brandt 1993, restricted only to advanced prostate cancer cases | |
| Same population as Geybels 2013, stratified according to genetic variation in SePP1 and GPX1 | |
| Historical cohort study | |
| Cancer was not a study endpoint. | |
| Nested case‐control study: ATBC cohort Results not reported according to inclusion criteria: differences in mean selenium levels reported; OR reported as graph and could not be calculated from reported data | |
| Interventional study without control group with 1489 female participants with BRCA1 mutation who received a selenium‐containing nutritional supplement | |
| Intervention study without control group with male participants with high‐grade intraepithelial neoplasia of the prostate who received a selenium‐containing nutritional supplement | |
| Results not reported according to inclusion criteria: differences in mean selenium levels reported | |
| Case‐control study | |
| Cohort study in Uppsala/Sweden Results not reported according to inclusion criteria: RR estimate per unit increase in selenium level reported | |
| Nested case‐control study: Mobile Health Clinic cohort Results not reported according to inclusion criteria: differences in mean selenium levels reported | |
| Nested case‐control study: Mobile Health Clinic cohort Results not reported according to inclusion criteria: differences in mean selenium levels reported | |
| Nested case‐control study: Mobile Health Clinic cohort Results not reported according to inclusion criteria: differences in mean selenium levels reported | |
| Nested case‐control study: Zoetermeer cohort Results not reported according to inclusion criteria: differences in mean selenium levels reported | |
| Case‐control study | |
| Case‐control study | |
| Some study participants had cancer at baseline. | |
| Cohort study on multi‐vitamin use and risk of prostate cancer | |
| Case‐control study | |
| RCT for gastric cancer prevention with multi‐component intervention (200 mg synthetic allitridum and 100 µg selenium per day) | |
| Randomised controlled trial: Primary endpoint in this 2‐by‐2 factorial design trial with selenomethionine 200 µg daily and/or celecoxib 200 mg twice daily was the per‐participant change (regression, stable, progression) in pre‐existing oesophageal dysplasia ‐ cancer incidence and mortality were not endpoints in this study. | |
| Randomised controlled trial of selenium supplements and celecoxib in participants with oesophageal squamous dysplasia in Linxian, China Endpoint was "regression of disease"; cancer was not an endpoint in this investigation. | |
| Selenium exposure not assessed according to eligibility: only intake of selenium supplements yes/no on questionnaire assessed | |
| Same participants as SELECT 2009, stratified according to NKX3.1 genetic variant | |
| Cohort study (Women's Health Initiative) on multi‐vitamin use and risks of cancer and cardiovascular disease No data reported for selenium and cancer risk | |
| Selenium exposure not assessed according to eligibility | |
| Cohort study (Women's Health and Aging Studies I and II) on selenium and carotenoid serum levels and mortality No data reported for selenium and cancer mortality | |
| PRECISE trial (Prevention of Cancer by Intervention with Selenium): Trial has been stopped. | |
| Randomised controlled trial: Vitamin E, Selenium, and Soy Protein in Preventing Cancer in Patients With High‐Grade Prostate Neoplasia: Multi‐component Intervention | |
| Cancer was not a study endpoint. | |
| Cohort study: Iowa Women's Health Study cohort Selenium exposure was not assessed according to eligibility; only intake of selenium supplements yes/no on questionnaire was assessed. | |
| Case‐control and cross‐sectional studies | |
| Part of this study is a prospective cohort study in Miyagi/Japan. Results were not reported according to inclusion criteria; differences in mean selenium levels were reported. | |
| Nested case‐control study: DOM cohort Results were not reported according to inclusion criteria; differences in mean selenium levels were reported. | |
| Nested case‐control study: DOM II cohort Results were not reported according to inclusion criteria; RR estimate per unit increase in selenium levels were reported. | |
| Case‐control study | |
| Case‐control study | |
| Cohort study on smoking and prostate cancer risk. Selenium was not reported as an independent variable. | |
| Cohort study: ATBC cohort Exposure to antioxidants was assessed via a self‐developed index. | |
| Randomised controlled trial to test retardation of progression of precancerous gastric lesions among 3400 adults in Shandong, China. Intervention: vitamin C, vitamin E, selenium, garlic preparation Multi‐component intervention | |
| Nested case‐control study: Shanghai cohort study No data reported on selenium and cancer risk | |
| Cohort study on factors influencing recurrence or progression of bladder cancer: West Midlands Bladder Cancer Prognosis Programme |
µ: micro.
APPOSE: Australian Prostate Cancer Prevention Trial Using Selenium.
ATBC: alpha‐tocopherol, beta‐carotene cancer prevention study.
BRCA: breast cancer.
DOM: Diagnostic Onderzoek Mammacarcinoom.
EPIC: European Prospective Investigation of Cancer.
m: milli.
g: gram.
OR: odds ratio.
PRECISE: Prevention of Cancer by Intervention with Selenium.
RCT: randomised controlled trial.
SELECT: Selenium and Vitamin E Cancer Prevention Trial.
Characteristics of ongoing studies [ordered by study ID]
| Trial name or title | Bangladesh Vitamin E and Selenium Trial (BEST) |
| Methods | Double‐blind, placebo‐controlled, 2‐by‐2 factorial, randomised controlled trial |
| Participants | 7000 adults having manifest arsenical skin lesions in Bangladesh Inclusion |
| Interventions | 6‐year supplementation, divided into 4 study arms: • Vitamin E (alpha‐tocopherol, 100 mg daily) • Selenium (L‐selenomethionine, 200 μg daily) • Vitamin E and selenium • Placebo |
| Outcomes | Primary endpoints • Prevention of non‐melanoma skin cancer Secondary endpoints: • All‐cause and cancer mortality • Diabetes mellitus • Oxidative stress biomarkers |
| Starting date | April 2006 |
| Contact information | Dr. Habibul Ahsan Center for Cancer Epidemiology and Prevention, The University of Chicago 5841 South Maryland Avenue, MC 2007 Chicago, IL 60637 |
| Notes |
BEST: Bangladesh Vitamin E and Selenium Trial.
Data and analyses
| Outcome or subgroup title | No. of studies | No. of participants | Statistical method | Effect size |
| 1 Any cancer risk Show forest plot | 5 | Risk Ratio (IV, Random, 95% CI) | Subtotals only | |
| Analysis 1.1 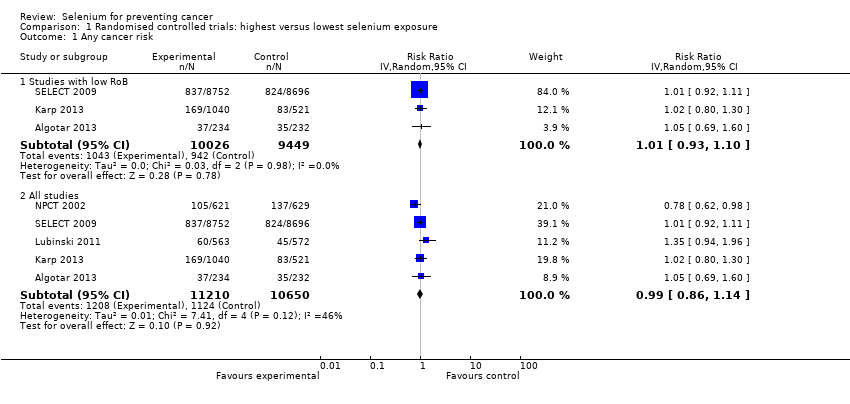 Comparison 1 Randomised controlled trials: highest versus lowest selenium exposure, Outcome 1 Any cancer risk. | ||||
| 1.1 Studies with low RoB | 3 | 19475 | Risk Ratio (IV, Random, 95% CI) | 1.01 [0.93, 1.10] |
| 1.2 All studies | 5 | 21860 | Risk Ratio (IV, Random, 95% CI) | 0.99 [0.86, 1.14] |
| 2 Cancer mortality Show forest plot | 2 | Risk Ratio (IV, Random, 95% CI) | Subtotals only | |
| Analysis 1.2  Comparison 1 Randomised controlled trials: highest versus lowest selenium exposure, Outcome 2 Cancer mortality. | ||||
| 2.1 Studies with low RoB | 1 | 17448 | Risk Ratio (IV, Random, 95% CI) | 1.02 [0.80, 1.30] |
| 2.2 All studies | 2 | 18698 | Risk Ratio (IV, Random, 95% CI) | 0.81 [0.49, 1.32] |
| 3 Head and neck cancer risk Show forest plot | 2 | Risk Ratio (IV, Random, 95% CI) | Subtotals only | |
| Analysis 1.3  Comparison 1 Randomised controlled trials: highest versus lowest selenium exposure, Outcome 3 Head and neck cancer risk. | ||||
| 3.1 Studies with low RoB | 1 | 1561 | Risk Ratio (IV, Random, 95% CI) | 1.00 [0.18, 5.45] |
| 3.2 All studies | 2 | 2811 | Risk Ratio (IV, Random, 95% CI) | 1.22 [0.52, 2.85] |
| 4 Oesophageal cancer risk Show forest plot | 2 | Risk Ratio (IV, Random, 95% CI) | Subtotals only | |
| Analysis 1.4  Comparison 1 Randomised controlled trials: highest versus lowest selenium exposure, Outcome 4 Oesophageal cancer risk. | ||||
| 4.1 Studies with low RoB | 1 | 1561 | Risk Ratio (IV, Random, 95% CI) | 1.50 [0.06, 36.86] |
| 4.2 All studies | 2 | 2811 | Risk Ratio (IV, Random, 95% CI) | 0.53 [0.12, 2.28] |
| 5 Colorectal cancer risk Show forest plot | 3 | Risk Ratio (IV, Random, 95% CI) | Subtotals only | |
| Analysis 1.5 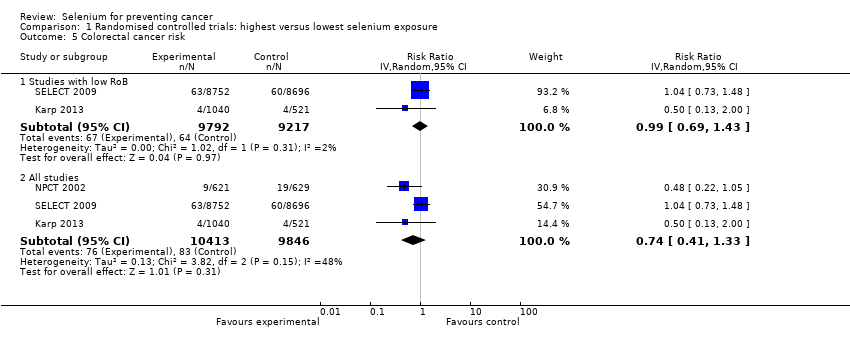 Comparison 1 Randomised controlled trials: highest versus lowest selenium exposure, Outcome 5 Colorectal cancer risk. | ||||
| 5.1 Studies with low RoB | 2 | 19009 | Risk Ratio (IV, Random, 95% CI) | 0.99 [0.69, 1.43] |
| 5.2 All studies | 3 | 20259 | Risk Ratio (IV, Random, 95% CI) | 0.74 [0.41, 1.33] |
| 6 Liver cancer risk Show forest plot | 4 | Risk Ratio (IV, Random, 95% CI) | Subtotals only | |
| Analysis 1.6  Comparison 1 Randomised controlled trials: highest versus lowest selenium exposure, Outcome 6 Liver cancer risk. | ||||
| 6.1 Studies with low RoB | 1 | 1561 | Risk Ratio (IV, Random, 95% CI) | 6.52 [0.37, 115.49] |
| 6.2 All studies | 4 | 6326 | Risk Ratio (IV, Random, 95% CI) | 0.52 [0.35, 0.79] |
| 7 Melanoma risk Show forest plot | 3 | Risk Ratio (IV, Random, 95% CI) | Subtotals only | |
| Analysis 1.7 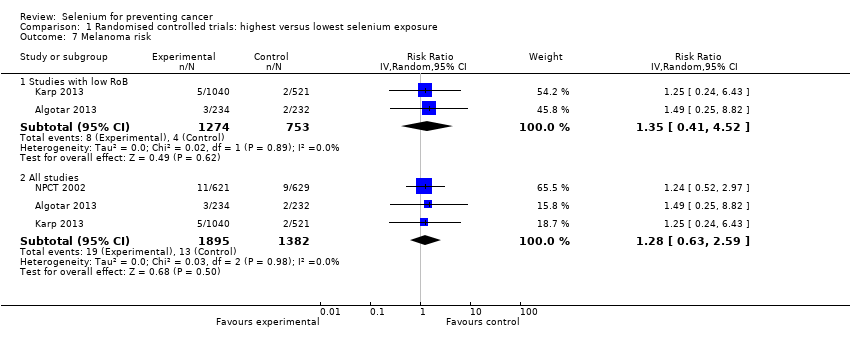 Comparison 1 Randomised controlled trials: highest versus lowest selenium exposure, Outcome 7 Melanoma risk. | ||||
| 7.1 Studies with low RoB | 2 | 2027 | Risk Ratio (IV, Random, 95% CI) | 1.35 [0.41, 4.52] |
| 7.2 All studies | 3 | 3277 | Risk Ratio (IV, Random, 95% CI) | 1.28 [0.63, 2.59] |
| 8 Non‐melanoma skin cancer risk Show forest plot | 4 | Risk Ratio (Random, 95% CI) | Subtotals only | |
| Analysis 1.8 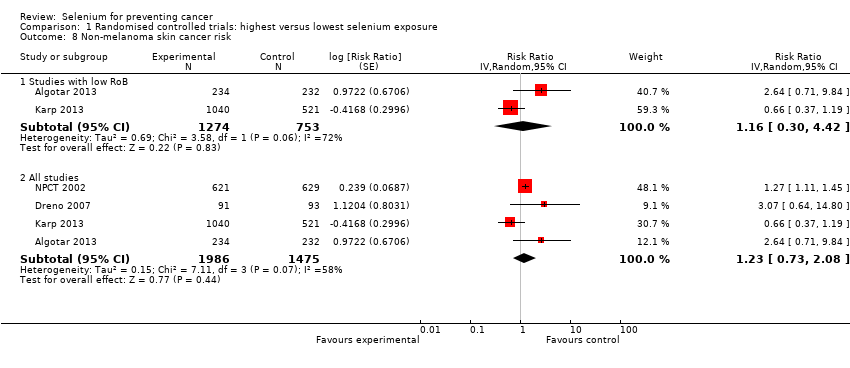 Comparison 1 Randomised controlled trials: highest versus lowest selenium exposure, Outcome 8 Non‐melanoma skin cancer risk. | ||||
| 8.1 Studies with low RoB | 2 | 2027 | Risk Ratio (Random, 95% CI) | 1.16 [0.30, 4.42] |
| 8.2 All studies | 4 | 3461 | Risk Ratio (Random, 95% CI) | 1.23 [0.73, 2.08] |
| 9 Lung cancer risk Show forest plot | 3 | Risk Ratio (IV, Random, 95% CI) | Subtotals only | |
| Analysis 1.9 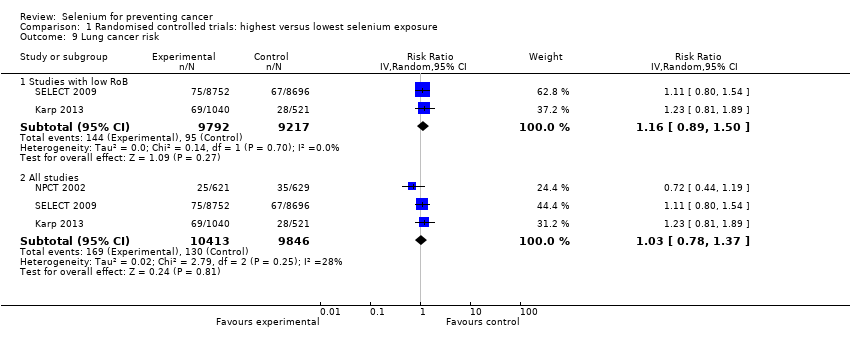 Comparison 1 Randomised controlled trials: highest versus lowest selenium exposure, Outcome 9 Lung cancer risk. | ||||
| 9.1 Studies with low RoB | 2 | 19009 | Risk Ratio (IV, Random, 95% CI) | 1.16 [0.89, 1.50] |
| 9.2 All studies | 3 | 20259 | Risk Ratio (IV, Random, 95% CI) | 1.03 [0.78, 1.37] |
| 10 Breast cancer risk Show forest plot | 3 | Risk Ratio (IV, Random, 95% CI) | Subtotals only | |
| Analysis 1.10  Comparison 1 Randomised controlled trials: highest versus lowest selenium exposure, Outcome 10 Breast cancer risk. | ||||
| 10.1 Studies with low RoB | 1 | 802 | Risk Ratio (IV, Random, 95% CI) | 2.04 [0.44, 9.55] |
| 10.2 All studies | 3 | 2260 | Risk Ratio (IV, Random, 95% CI) | 1.44 [0.96, 2.17] |
| 11 Bladder cancer risk Show forest plot | 3 | Risk Ratio (IV, Random, 95% CI) | Subtotals only | |
| Analysis 1.11  Comparison 1 Randomised controlled trials: highest versus lowest selenium exposure, Outcome 11 Bladder cancer risk. | ||||
| 11.1 Studies with low RoB | 2 | 19009 | Risk Ratio (IV, Random, 95% CI) | 1.07 [0.76, 1.52] |
| 11.2 All studies | 3 | 20259 | Risk Ratio (IV, Random, 95% CI) | 1.10 [0.79, 1.52] |
| 12 Prostate cancer risk Show forest plot | 5 | Risk Ratio (IV, Random, 95% CI) | Subtotals only | |
| Analysis 1.12 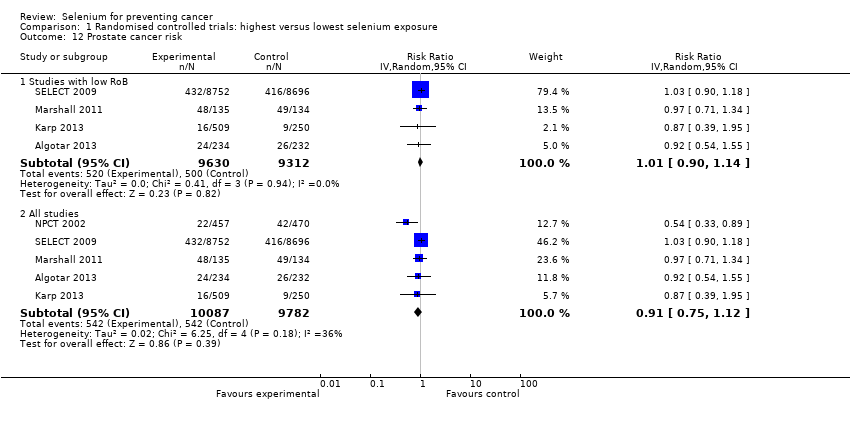 Comparison 1 Randomised controlled trials: highest versus lowest selenium exposure, Outcome 12 Prostate cancer risk. | ||||
| 12.1 Studies with low RoB | 4 | 18942 | Risk Ratio (IV, Random, 95% CI) | 1.01 [0.90, 1.14] |
| 12.2 All studies | 5 | 19869 | Risk Ratio (IV, Random, 95% CI) | 0.91 [0.75, 1.12] |
| 13 Leukaemia and lymphoma risk Show forest plot | 2 | Risk Ratio (IV, Random, 95% CI) | Subtotals only | |
| Analysis 1.13 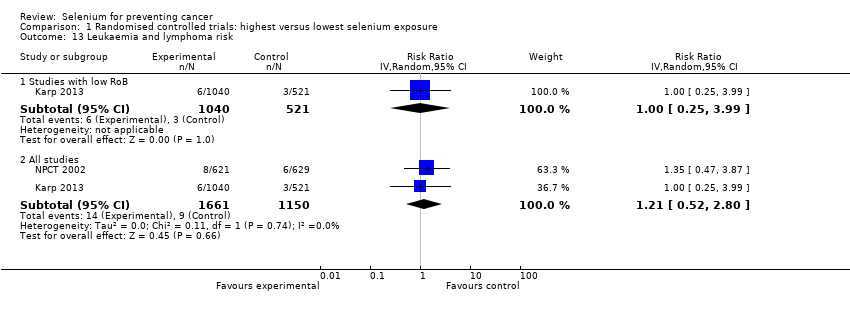 Comparison 1 Randomised controlled trials: highest versus lowest selenium exposure, Outcome 13 Leukaemia and lymphoma risk. | ||||
| 13.1 Studies with low RoB | 1 | 1561 | Risk Ratio (IV, Random, 95% CI) | 1.00 [0.25, 3.99] |
| 13.2 All studies | 2 | 2811 | Risk Ratio (IV, Random, 95% CI) | 1.21 [0.52, 2.80] |
| Outcome or subgroup title | No. of studies | No. of participants | Statistical method | Effect size |
| 1 Total cancer incidence and mortality Show forest plot | 14 | Odds Ratio (Random, 95% CI) | Subtotals only | |
| Analysis 2.1  Comparison 2 Observational studies: highest versus lowest selenium exposure, Outcome 1 Total cancer incidence and mortality. | ||||
| 1.1 Incidence | 7 | Odds Ratio (Random, 95% CI) | 0.72 [0.55, 0.93] | |
| 1.2 Mortality | 7 | Odds Ratio (Random, 95% CI) | 0.76 [0.59, 0.97] | |
| 2 Total cancer incidence and mortality (men) Show forest plot | 8 | Odds Ratio (Random, 95% CI) | Subtotals only | |
| Analysis 2.2 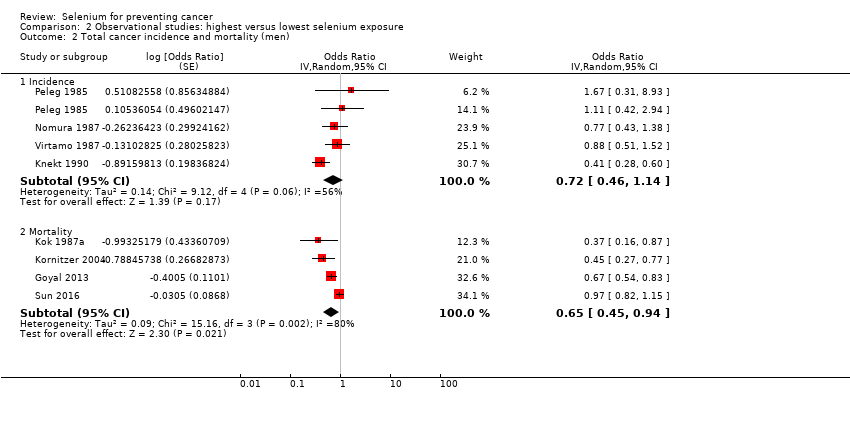 Comparison 2 Observational studies: highest versus lowest selenium exposure, Outcome 2 Total cancer incidence and mortality (men). | ||||
| 2.1 Incidence | 4 | Odds Ratio (Random, 95% CI) | 0.72 [0.46, 1.14] | |
| 2.2 Mortality | 4 | Odds Ratio (Random, 95% CI) | 0.65 [0.45, 0.94] | |
| 3 Total cancer incidence and mortality (women) Show forest plot | 6 | Odds Ratio (Random, 95% CI) | Subtotals only | |
| Analysis 2.3 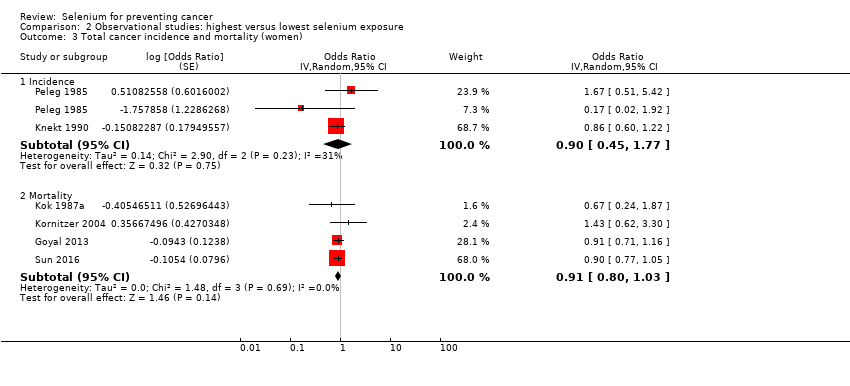 Comparison 2 Observational studies: highest versus lowest selenium exposure, Outcome 3 Total cancer incidence and mortality (women). | ||||
| 3.1 Incidence | 2 | Odds Ratio (Random, 95% CI) | 0.90 [0.45, 1.77] | |
| 3.2 Mortality | 4 | Odds Ratio (Random, 95% CI) | 0.91 [0.80, 1.03] | |
| 4 Total cancer incidence and mortality (ascending order of selenium levels) Show forest plot | 13 | Odds Ratio (Random, 95% CI) | Subtotals only | |
| Analysis 2.4  Comparison 2 Observational studies: highest versus lowest selenium exposure, Outcome 4 Total cancer incidence and mortality (ascending order of selenium levels). | ||||
| 4.1 Incidence | 7 | 1642 | Odds Ratio (Random, 95% CI) | 0.72 [0.55, 0.93] |
| 4.2 Mortality | 6 | 1230 | Odds Ratio (Random, 95% CI) | 0.63 [0.39, 1.01] |
| 5 Total cancer incidence and mortality (ascending order of differences in selenium levels) Show forest plot | 13 | Odds Ratio (Random, 95% CI) | Subtotals only | |
| Analysis 2.5  Comparison 2 Observational studies: highest versus lowest selenium exposure, Outcome 5 Total cancer incidence and mortality (ascending order of differences in selenium levels). | ||||
| 5.1 Incidence | 7 | 190 | Odds Ratio (Random, 95% CI) | 0.72 [0.55, 0.93] |
| 5.2 Mortality | 6 | 106 | Odds Ratio (Random, 95% CI) | 0.63 [0.39, 1.01] |
| 6 Stomach cancer risk Show forest plot | 5 | Odds Ratio (Random, 95% CI) | 0.66 [0.43, 1.01] | |
| Analysis 2.6  Comparison 2 Observational studies: highest versus lowest selenium exposure, Outcome 6 Stomach cancer risk. | ||||
| 7 Stomach cancer risk (by sex) Show forest plot | 5 | Odds Ratio (Random, 95% CI) | 0.66 [0.42, 1.04] | |
| Analysis 2.7  Comparison 2 Observational studies: highest versus lowest selenium exposure, Outcome 7 Stomach cancer risk (by sex). | ||||
| 7.1 All (male + female) | 2 | Odds Ratio (Random, 95% CI) | 0.75 [0.41, 1.36] | |
| 7.2 Male | 3 | Odds Ratio (Random, 95% CI) | 0.43 [0.14, 1.32] | |
| 7.3 Female | 2 | Odds Ratio (Random, 95% CI) | 0.73 [0.12, 4.35] | |
| 8 Colorectal cancer risk Show forest plot | 6 | Odds Ratio (Random, 95% CI) | 0.82 [0.72, 0.94] | |
| Analysis 2.8 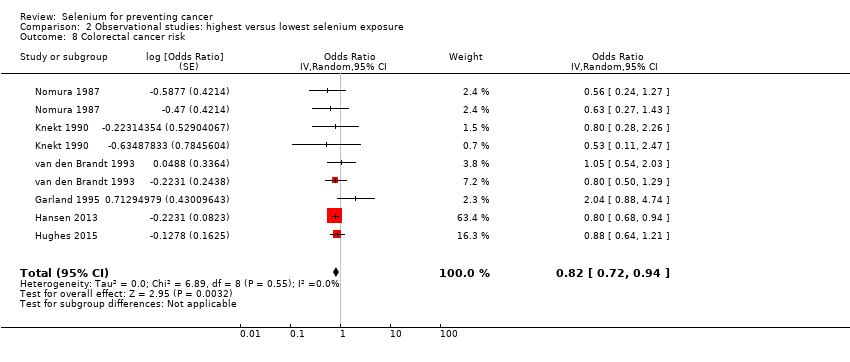 Comparison 2 Observational studies: highest versus lowest selenium exposure, Outcome 8 Colorectal cancer risk. | ||||
| 9 Colorectal cancer risk (by sex) Show forest plot | 6 | Odds Ratio (Random, 95% CI) | 0.83 [0.72, 0.95] | |
| Analysis 2.9  Comparison 2 Observational studies: highest versus lowest selenium exposure, Outcome 9 Colorectal cancer risk (by sex). | ||||
| 9.1 All (male + female) | 1 | Odds Ratio (Random, 95% CI) | 0.80 [0.68, 0.94] | |
| 9.2 Male | 4 | Odds Ratio (Random, 95% CI) | 0.86 [0.65, 1.16] | |
| 9.3 Female | 4 | Odds Ratio (Random, 95% CI) | 0.96 [0.61, 1.50] | |
| 10 Colon cancer risk Show forest plot | 5 | Odds Ratio (Random, 95% CI) | 0.81 [0.69, 0.96] | |
| Analysis 2.10  Comparison 2 Observational studies: highest versus lowest selenium exposure, Outcome 10 Colon cancer risk. | ||||
| 11 Colon cancer risk (by sex) Show forest plot | 5 | Odds Ratio (Random, 95% CI) | 0.81 [0.69, 0.96] | |
| Analysis 2.11 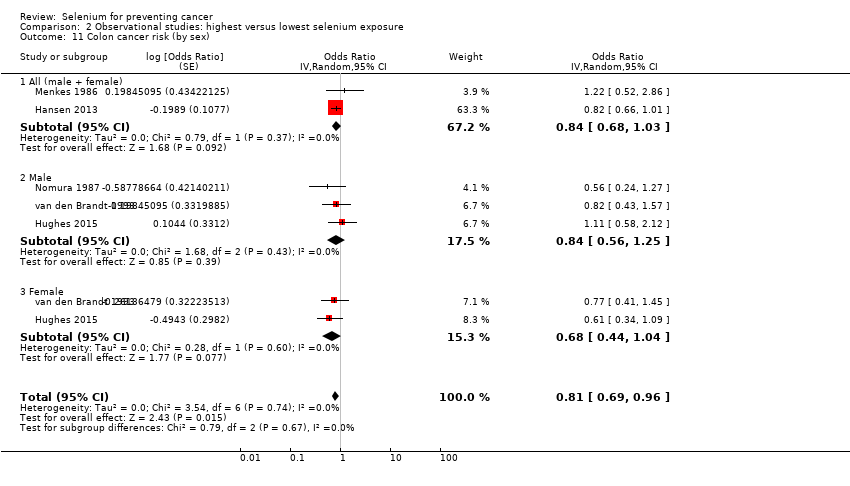 Comparison 2 Observational studies: highest versus lowest selenium exposure, Outcome 11 Colon cancer risk (by sex). | ||||
| 11.1 All (male + female) | 2 | Odds Ratio (Random, 95% CI) | 0.84 [0.68, 1.03] | |
| 11.2 Male | 3 | Odds Ratio (Random, 95% CI) | 0.84 [0.56, 1.25] | |
| 11.3 Female | 2 | Odds Ratio (Random, 95% CI) | 0.68 [0.44, 1.04] | |
| 12 Lung cancer incidence and mortality Show forest plot | 13 | Odds Ratio (Random, 95% CI) | Subtotals only | |
| Analysis 2.12 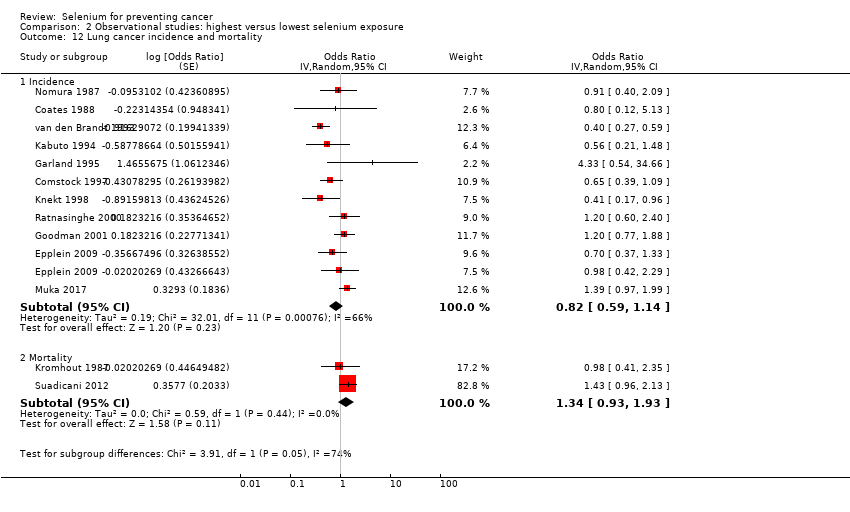 Comparison 2 Observational studies: highest versus lowest selenium exposure, Outcome 12 Lung cancer incidence and mortality. | ||||
| 12.1 Incidence | 11 | Odds Ratio (Random, 95% CI) | 0.82 [0.59, 1.14] | |
| 12.2 Mortality | 2 | Odds Ratio (Random, 95% CI) | 1.34 [0.93, 1.93] | |
| 13 Lung cancer risk (sex‐disaggregated data) Show forest plot | 13 | Odds Ratio (Random, 95% CI) | 0.89 [0.69, 1.14] | |
| Analysis 2.13 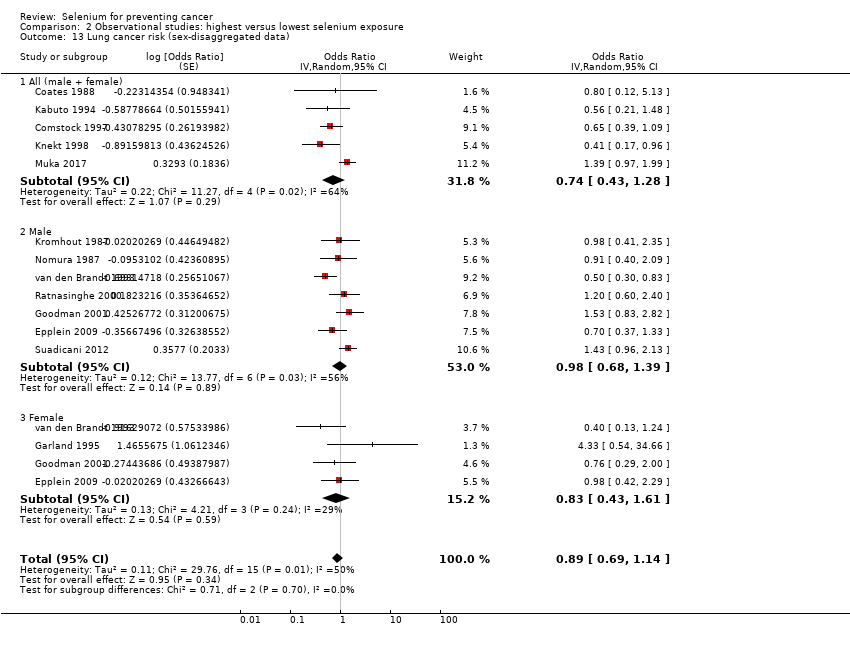 Comparison 2 Observational studies: highest versus lowest selenium exposure, Outcome 13 Lung cancer risk (sex‐disaggregated data). | ||||
| 13.1 All (male + female) | 5 | Odds Ratio (Random, 95% CI) | 0.74 [0.43, 1.28] | |
| 13.2 Male | 7 | Odds Ratio (Random, 95% CI) | 0.98 [0.68, 1.39] | |
| 13.3 Female | 4 | Odds Ratio (Random, 95% CI) | 0.83 [0.43, 1.61] | |
| 14 Lung cancer risk (by exposure assessment) Show forest plot | 13 | Odds Ratio (Random, 95% CI) | 0.88 [0.65, 1.18] | |
| Analysis 2.14 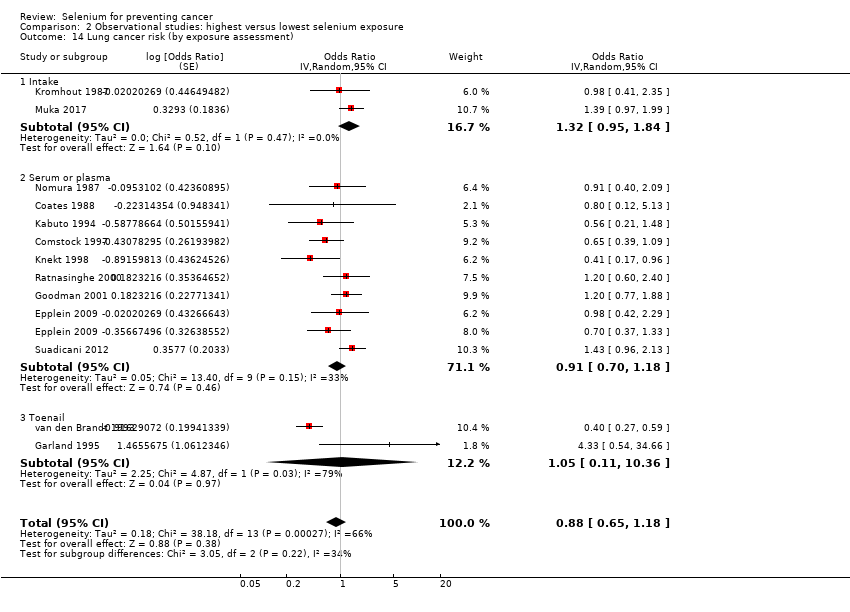 Comparison 2 Observational studies: highest versus lowest selenium exposure, Outcome 14 Lung cancer risk (by exposure assessment). | ||||
| 14.1 Intake | 2 | Odds Ratio (Random, 95% CI) | 1.32 [0.95, 1.84] | |
| 14.2 Serum or plasma | 9 | Odds Ratio (Random, 95% CI) | 0.91 [0.70, 1.18] | |
| 14.3 Toenail | 2 | Odds Ratio (Random, 95% CI) | 1.05 [0.11, 10.36] | |
| 15 Lung cancer risk (ascending order of selenium levels) Show forest plot | 8 | 1938 | Odds Ratio (Random, 95% CI) | 0.97 [0.74, 1.27] |
| Analysis 2.15 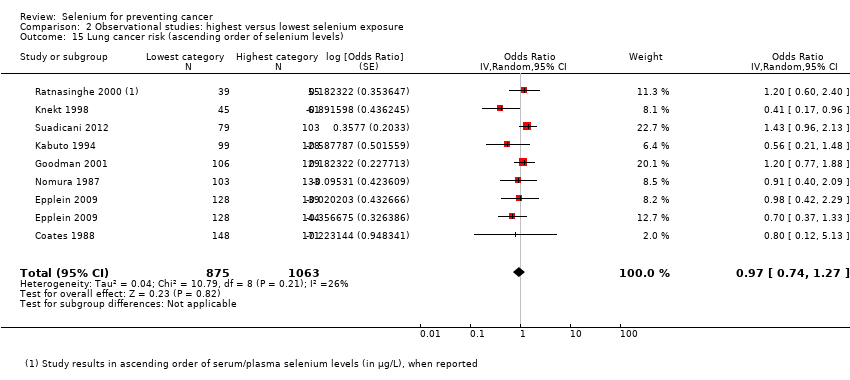 Comparison 2 Observational studies: highest versus lowest selenium exposure, Outcome 15 Lung cancer risk (ascending order of selenium levels). | ||||
| 16 Lung cancer risk (ascending order of differences in selenium levels) Show forest plot | 8 | 188 | Odds Ratio (Random, 95% CI) | 0.97 [0.74, 1.27] |
| Analysis 2.16  Comparison 2 Observational studies: highest versus lowest selenium exposure, Outcome 16 Lung cancer risk (ascending order of differences in selenium levels). | ||||
| 17 Breast cancer risk (women) Show forest plot | 8 | Odds Ratio (Random, 95% CI) | 1.09 [0.87, 1.37] | |
| Analysis 2.17  Comparison 2 Observational studies: highest versus lowest selenium exposure, Outcome 17 Breast cancer risk (women). | ||||
| 18 Bladder cancer risk Show forest plot | 5 | Odds Ratio (Random, 95% CI) | 0.67 [0.46, 0.97] | |
| Analysis 2.18  Comparison 2 Observational studies: highest versus lowest selenium exposure, Outcome 18 Bladder cancer risk. | ||||
| 18.1 All (male + female) | 2 | Odds Ratio (Random, 95% CI) | 0.65 [0.46, 0.92] | |
| 18.2 Male | 3 | Odds Ratio (Random, 95% CI) | 0.82 [0.41, 1.62] | |
| 18.3 Female | 1 | Odds Ratio (Random, 95% CI) | 0.36 [0.14, 0.92] | |
| 19 Prostate cancer risk Show forest plot | 21 | Odds Ratio (Random, 95% CI) | 0.84 [0.75, 0.95] | |
| Analysis 2.19  Comparison 2 Observational studies: highest versus lowest selenium exposure, Outcome 19 Prostate cancer risk. | ||||
| 20 Prostate cancer risk (by exposure assessment) Show forest plot | 21 | Odds Ratio (Random, 95% CI) | 0.84 [0.75, 0.95] | |
| Analysis 2.20  Comparison 2 Observational studies: highest versus lowest selenium exposure, Outcome 20 Prostate cancer risk (by exposure assessment). | ||||
| 20.1 Intake and supplement | 4 | Odds Ratio (Random, 95% CI) | 0.99 [0.85, 1.15] | |
| 20.2 Serum or plasma | 13 | Odds Ratio (Random, 95% CI) | 0.86 [0.75, 0.99] | |
| 20.3 Toenail | 4 | Odds Ratio (Random, 95% CI) | 0.60 [0.44, 0.82] | |
| 21 Prostate cancer risk (ascending order of selenium levels) Show forest plot | 13 | 2816 | Odds Ratio (Random, 95% CI) | 0.86 [0.75, 0.99] |
| Analysis 2.21 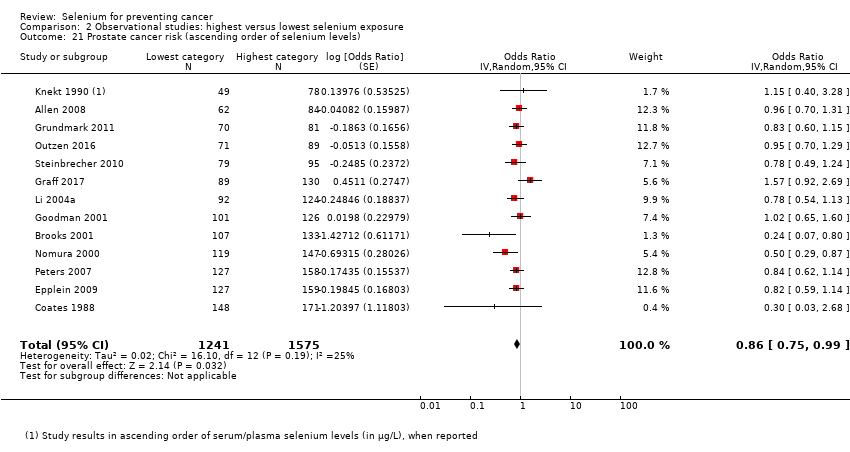 Comparison 2 Observational studies: highest versus lowest selenium exposure, Outcome 21 Prostate cancer risk (ascending order of selenium levels). | ||||
| 22 Prostate cancer risk (ascending order of differences in selenium levels) Show forest plot | 13 | 345 | Odds Ratio (Random, 95% CI) | 0.86 [0.75, 0.99] |
| Analysis 2.22  Comparison 2 Observational studies: highest versus lowest selenium exposure, Outcome 22 Prostate cancer risk (ascending order of differences in selenium levels). | ||||
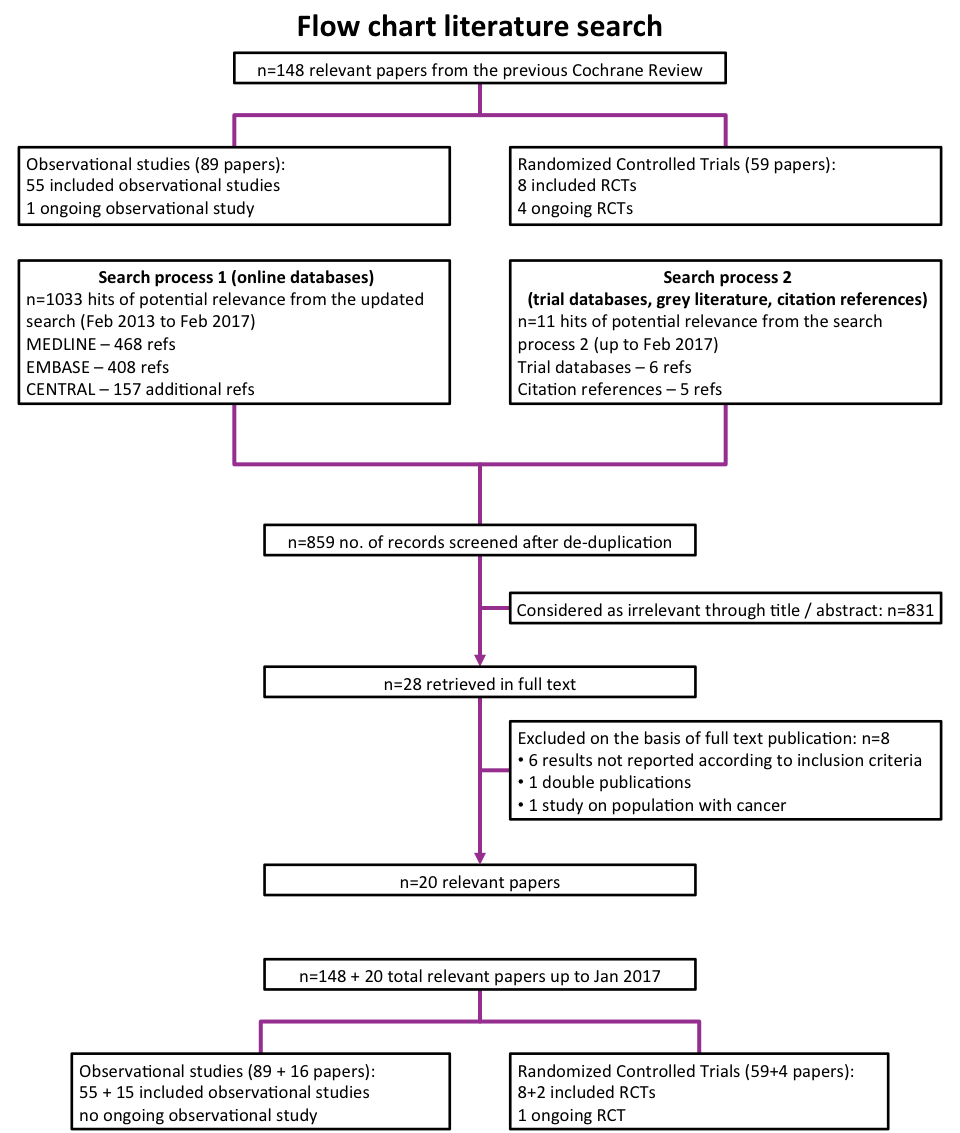

Review authors’ judgements about each risk of bias item presented as percentages across all included RCTs and summary of review authors’ judgements about each risk of bias item for the included RCTs.
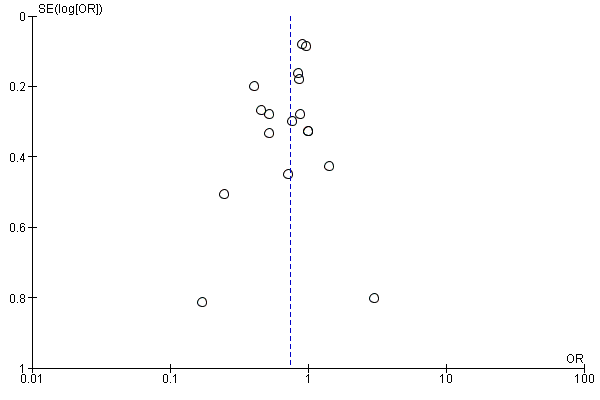
Funnel plot of comparison: 1 Highest versus lowest selenium exposure, outcome: 2.1 Total cancer incidence and mortality.

Funnel plot of comparison: 1 Observational studies: highest versus lowest selenium exposure, outcome: 2.8 Colorectal cancer risk.
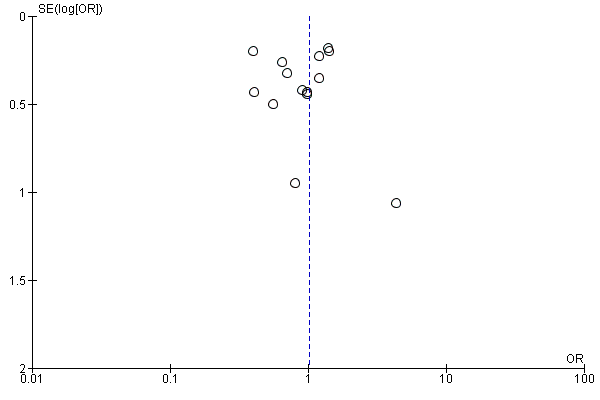
Funnel plot of comparison: 1 Observational studies: highest versus lowest selenium exposure, outcome: 2.12 Lung cancer risk incidence and mortality
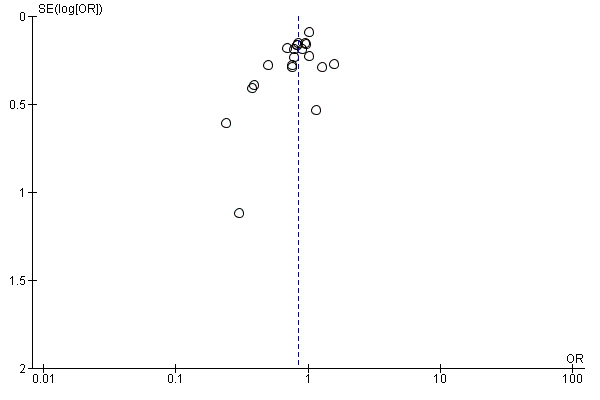
Funnel plot of comparison: 1 Highest versus lowest selenium exposure, outcome: 2.19 Prostate cancer risk.
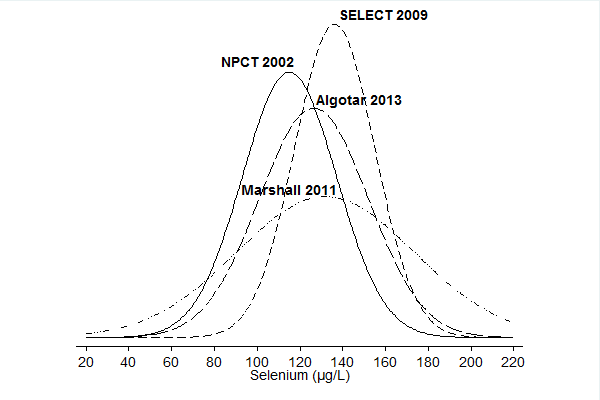
Baseline circulating selenium levels in the NPC trial (Duffield‐Lillico 2003b in: NPCT 2002), the NBT (Algotar 2013), SWOG trial (as plasma selenium) (Marshall 2011), and SELECT (as serum selenium) (Lippman 2009, in: SELECT 2009). When median and interquartile values were reported, we estimated mean and standard deviation according to Cochrane guidelines provided in Higgins 2011a.

Comparison 1 Randomised controlled trials: highest versus lowest selenium exposure, Outcome 1 Any cancer risk.
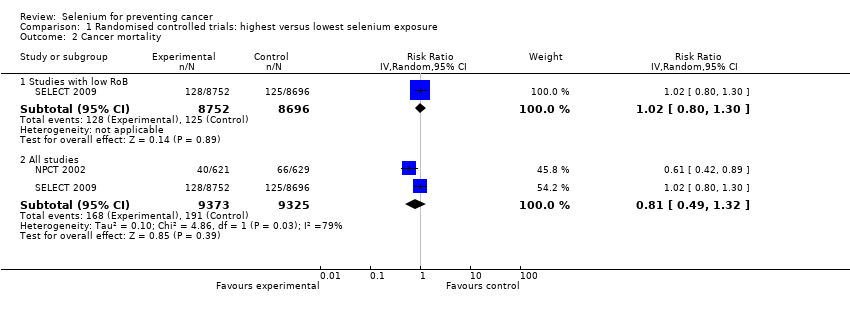
Comparison 1 Randomised controlled trials: highest versus lowest selenium exposure, Outcome 2 Cancer mortality.
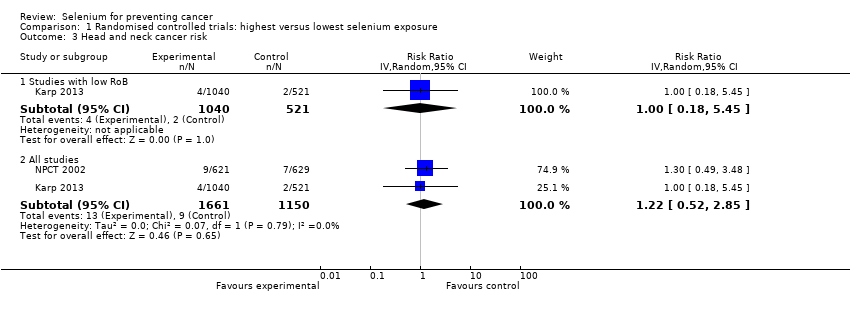
Comparison 1 Randomised controlled trials: highest versus lowest selenium exposure, Outcome 3 Head and neck cancer risk.
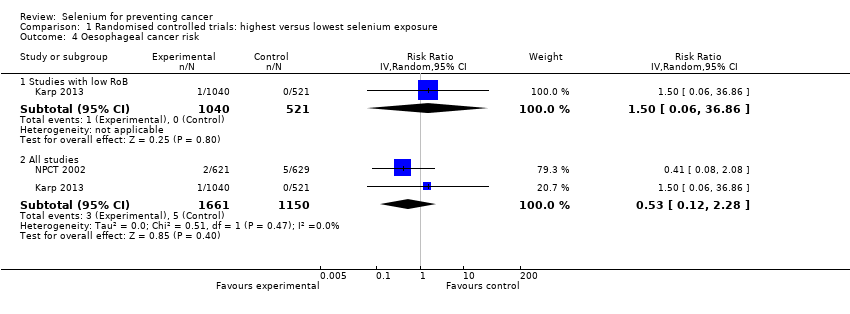
Comparison 1 Randomised controlled trials: highest versus lowest selenium exposure, Outcome 4 Oesophageal cancer risk.

Comparison 1 Randomised controlled trials: highest versus lowest selenium exposure, Outcome 5 Colorectal cancer risk.
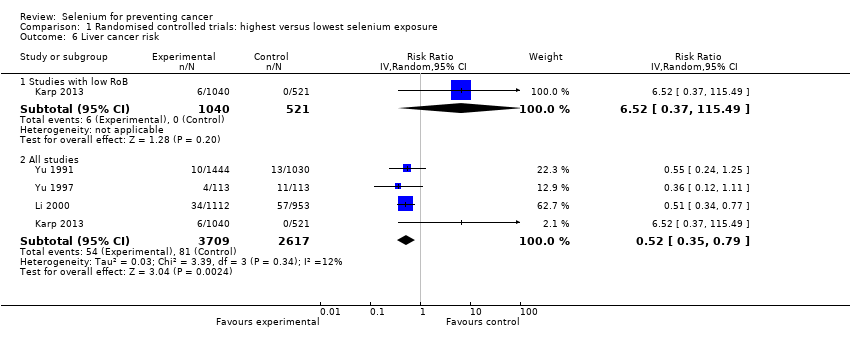
Comparison 1 Randomised controlled trials: highest versus lowest selenium exposure, Outcome 6 Liver cancer risk.

Comparison 1 Randomised controlled trials: highest versus lowest selenium exposure, Outcome 7 Melanoma risk.

Comparison 1 Randomised controlled trials: highest versus lowest selenium exposure, Outcome 8 Non‐melanoma skin cancer risk.

Comparison 1 Randomised controlled trials: highest versus lowest selenium exposure, Outcome 9 Lung cancer risk.
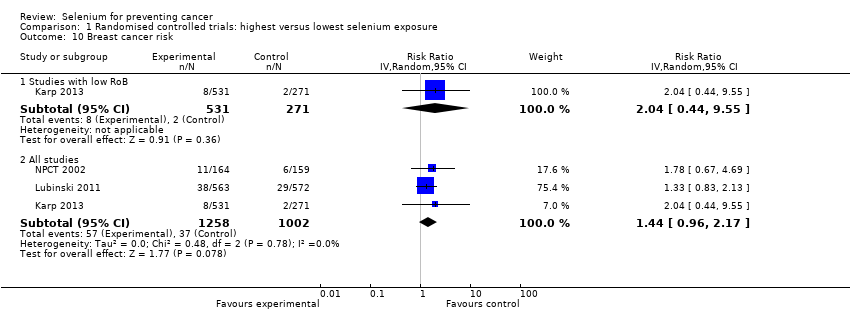
Comparison 1 Randomised controlled trials: highest versus lowest selenium exposure, Outcome 10 Breast cancer risk.

Comparison 1 Randomised controlled trials: highest versus lowest selenium exposure, Outcome 11 Bladder cancer risk.

Comparison 1 Randomised controlled trials: highest versus lowest selenium exposure, Outcome 12 Prostate cancer risk.

Comparison 1 Randomised controlled trials: highest versus lowest selenium exposure, Outcome 13 Leukaemia and lymphoma risk.
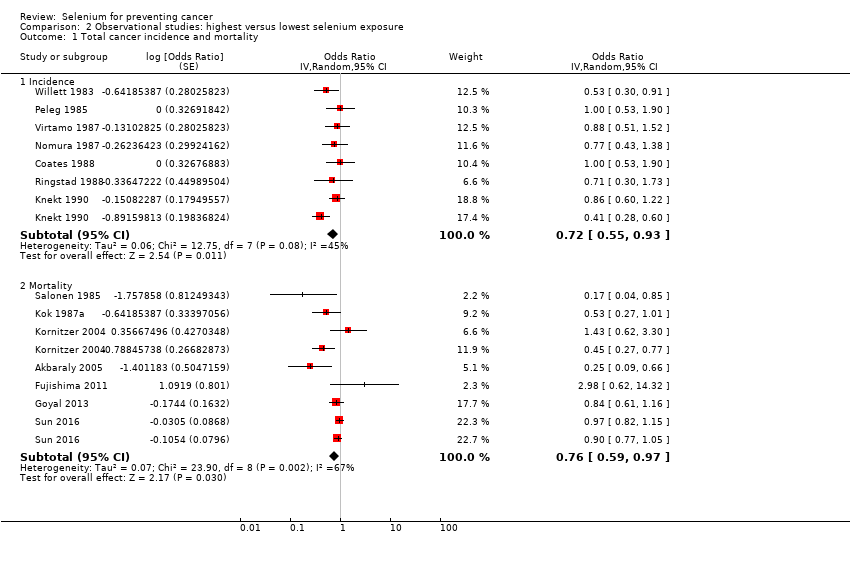
Comparison 2 Observational studies: highest versus lowest selenium exposure, Outcome 1 Total cancer incidence and mortality.

Comparison 2 Observational studies: highest versus lowest selenium exposure, Outcome 2 Total cancer incidence and mortality (men).

Comparison 2 Observational studies: highest versus lowest selenium exposure, Outcome 3 Total cancer incidence and mortality (women).

Comparison 2 Observational studies: highest versus lowest selenium exposure, Outcome 4 Total cancer incidence and mortality (ascending order of selenium levels).

Comparison 2 Observational studies: highest versus lowest selenium exposure, Outcome 5 Total cancer incidence and mortality (ascending order of differences in selenium levels).

Comparison 2 Observational studies: highest versus lowest selenium exposure, Outcome 6 Stomach cancer risk.
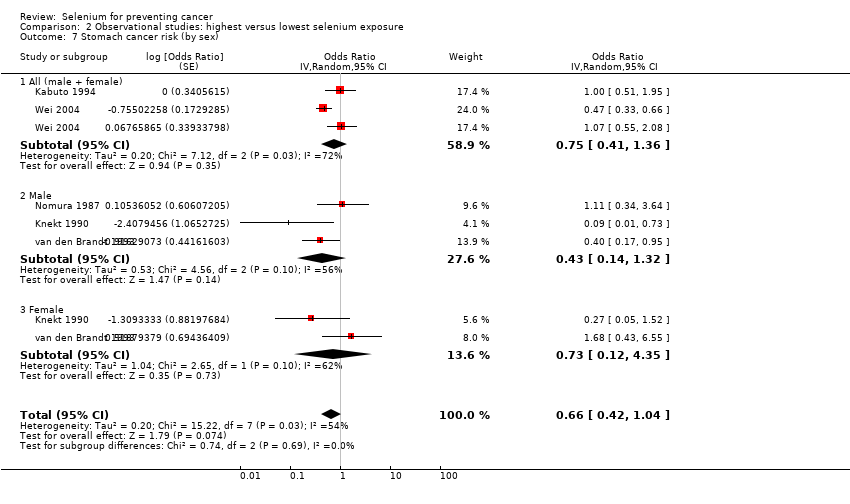
Comparison 2 Observational studies: highest versus lowest selenium exposure, Outcome 7 Stomach cancer risk (by sex).

Comparison 2 Observational studies: highest versus lowest selenium exposure, Outcome 8 Colorectal cancer risk.
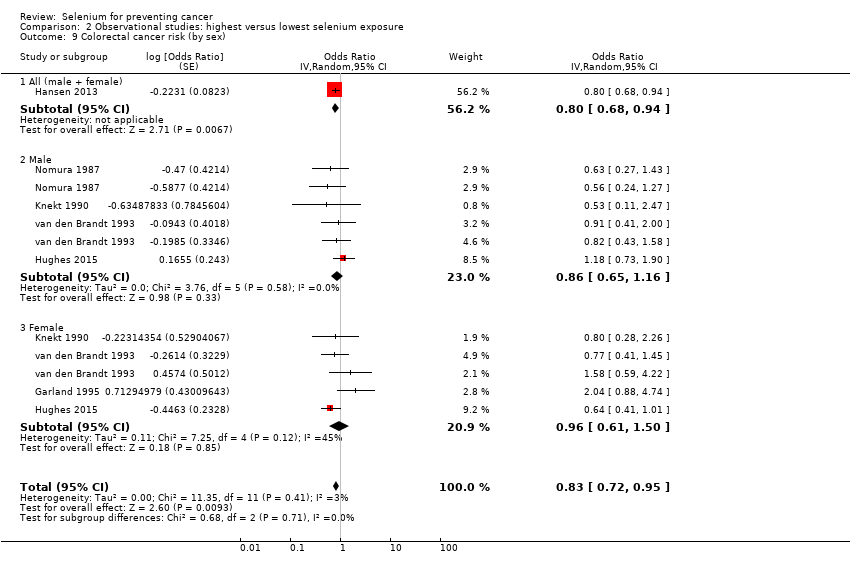
Comparison 2 Observational studies: highest versus lowest selenium exposure, Outcome 9 Colorectal cancer risk (by sex).

Comparison 2 Observational studies: highest versus lowest selenium exposure, Outcome 10 Colon cancer risk.

Comparison 2 Observational studies: highest versus lowest selenium exposure, Outcome 11 Colon cancer risk (by sex).

Comparison 2 Observational studies: highest versus lowest selenium exposure, Outcome 12 Lung cancer incidence and mortality.

Comparison 2 Observational studies: highest versus lowest selenium exposure, Outcome 13 Lung cancer risk (sex‐disaggregated data).

Comparison 2 Observational studies: highest versus lowest selenium exposure, Outcome 14 Lung cancer risk (by exposure assessment).

Comparison 2 Observational studies: highest versus lowest selenium exposure, Outcome 15 Lung cancer risk (ascending order of selenium levels).

Comparison 2 Observational studies: highest versus lowest selenium exposure, Outcome 16 Lung cancer risk (ascending order of differences in selenium levels).
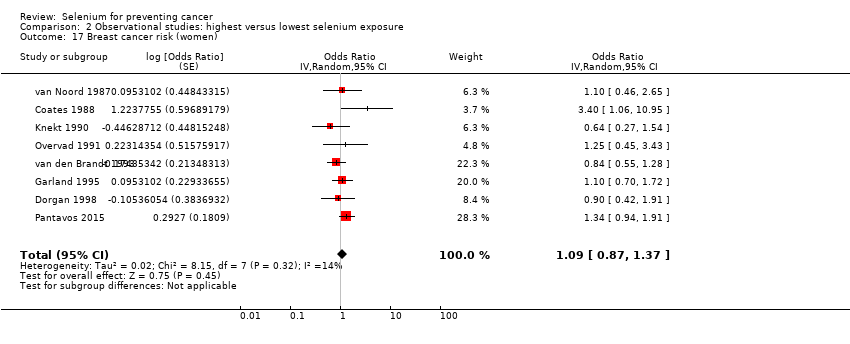
Comparison 2 Observational studies: highest versus lowest selenium exposure, Outcome 17 Breast cancer risk (women).

Comparison 2 Observational studies: highest versus lowest selenium exposure, Outcome 18 Bladder cancer risk.

Comparison 2 Observational studies: highest versus lowest selenium exposure, Outcome 19 Prostate cancer risk.
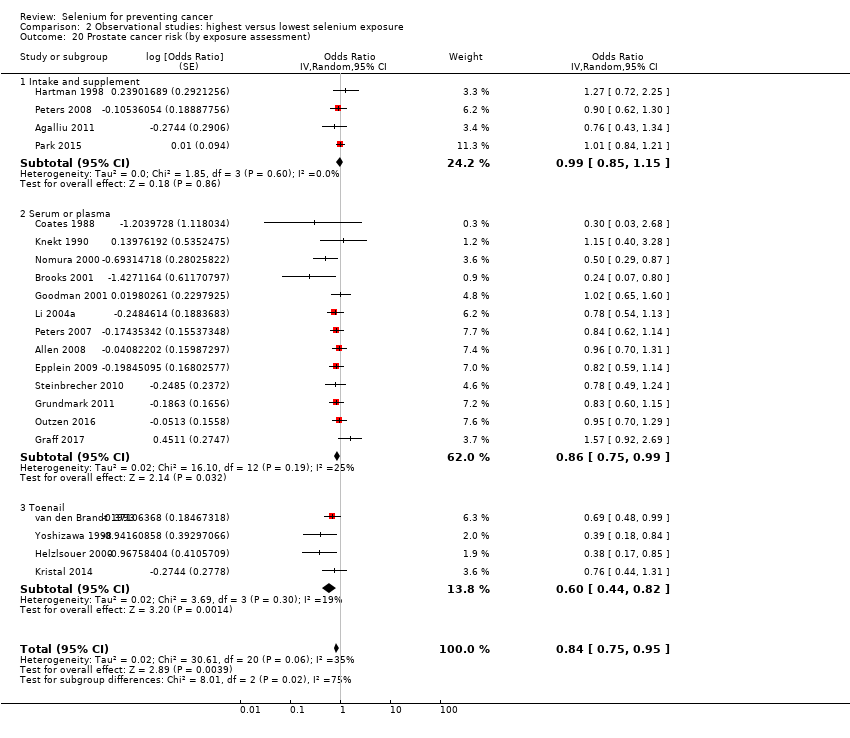
Comparison 2 Observational studies: highest versus lowest selenium exposure, Outcome 20 Prostate cancer risk (by exposure assessment).

Comparison 2 Observational studies: highest versus lowest selenium exposure, Outcome 21 Prostate cancer risk (ascending order of selenium levels).

Comparison 2 Observational studies: highest versus lowest selenium exposure, Outcome 22 Prostate cancer risk (ascending order of differences in selenium levels).
| Highest compared with lowest selenium exposure for preventing cancer in randomised controlled studies with low risk of bias | ||||||
| Patient or population: Participants in trials with low risk of bias | ||||||
| Outcomes | Relative effect | Anticipated absolute effects* (95% CI) | Quality of the evidence | Comments | ||
| Without highest | With highest | Difference | ||||
| Any cancer risk | RR 1.01 | Study population | ⊕⊕⊕⊕ | SELECT study had the strongest influence on the effect estimate. The RR in all RCTs is 0.99 (95% CI 0.86 to 1.14). | ||
| 10.0% | 10.1% | 0.1% more | ||||
| Cancer mortality risk | RR 1.02 | Study population | ⊕⊕⊕⊕ | The effect is led from the study SELECT. The RR in all RCTs is 0.81 (95% CI 0.49 to 1.32). | ||
| 1.4% | 1.5% | 0.0% more | ||||
| Colorectal cancer risk | RR 0.99 | Study population | ⊕⊕⊕⊕ | SELECT study had the strongest influence on the effect estimate. The RR in all RCTs is 0.74 (95% CI 0.41 to 1.33). | ||
| 0.7% | 0.7% | 0.0% fewer | ||||
| Non‐melanoma skin cancer risk | RR 1.16 | Study population | ⊕⊕⊕⊝ | Pooled estimate is imprecise owing to high heterogeneity. The RR in all RCTs is 1.23 (95% CI 0.73 to 2.08). | ||
| 2.9% | 3.4% | 0.5% more | ||||
| Lung cancer risk | RR 1.16 | Study population | ⊕⊕⊕⊕ | The RR in all RCTs is 1.03 (95% CI 0.78 to 1.37). | ||
| 1.0% | 1.2% | 0.2% more | ||||
| Breast cancer risk | RR 2.04 | Study population | ⊕⊕⊕⊝ | The RR in all RCTs is 1.44 (95% CI 0.96 to 2.17). | ||
| 0.7% | 1.5% | 0.8% more | ||||
| Bladder cancer risk | RR 1.07 | Study population | ⊕⊕⊕⊕ | SELECT study had the strongest influence on the effect estimate. The RR in all RCTs is 1.10 (95% CI 0.79 to 1.52). | ||
| 0.6% | 0.7% | 0.0% fewer | ||||
| Prostate cancer risk | RR 1.01 | Study population | ⊕⊕⊕⊕ | SELECT study had the strongest influence on the effect estimate. The RR in all RCTs is 0.91 (95% CI 0.75 to 1.12). | ||
| 5.4% | 5.4% | 0.1% more | ||||
| *The risk in the intervention group (and its 95% confidence interval) is based on the assumed risk in the comparison group and the relative effect of the intervention (and its 95% CI). | ||||||
| GRADE Working Group grades of evidence. | ||||||
| aDowngraded one level for moderate heterogeneity (tau² = 0.69, I² = 72%, P = 0.06) not explained. | ||||||
| Highest compared with lowest selenium exposure for preventing cancer in observational studies | ||
| Patient or population: Participants in non experimental cohort studies on selenium and cancer | ||
| Outcomes | Relative effect | Certainty of the evidence |
| Any cancer risk No. of participants: 76,239 | OR 0.72 | ⊕⊝⊝⊝ |
| Cancer mortality risk No. of participants: 183,863 | OR 0.76 (0.59 to 0.97) | ⊕⊝⊝⊝ |
| Colorectal cancer risk No. of participants: 712,746 | OR 0.82 | ⊕⊝⊝⊝ |
| Lung cancer risk No. of participants: 371,067 | OR 0.82 | ⊕⊝⊝⊝ |
| Breast cancer risk (women) No. of participants: 169,028 | OR 1.09 | ⊕⊝⊝⊝ |
| Bladder cancer risk No. of participants: 279,100 | OR 0.67 | ⊕⊝⊝⊝ |
| Prostate cancer risk No. of participants: 576,667 | OR 0.84 | ⊕⊝⊝⊝ |
| CI: confidence interval; OR: odds ratio. | ||
| GRADE Working Group grades of evidence. | ||
| aDowngraded one level owing to risk of bias, which we deemed as serious because of inability to rule out unmeasured confounding, particularly from lifestyle or nutritional factors that might covary with selenium exposure beyond those factors taken into account in the multi‐variable analyses. | ||
| Organ system | Outcome | Number of studies/case definitions | Meta‐ | Countries | Number of participants | Number of cases | Selenium assessment | Reporting study |
| Any cancer | Any cancer | total: 16 incidence: 7 | ✓ yes | USA China Japan | total: ˜ 276,000 | total: 6488 male: 3196 female: 1541 | serum: 12 plasma: 2 serum + plasma: 1 dietary intake: 1 | Salonen 1985 |
| Gynaecological cancer | Female breast cancer | total: 8 incidence: 8 | ✓ yes | USA | total/female: 169,028 | total/female: 1277 | serum: 2 plasma: 1 serum + plasma: 1 toenail: 3 intake: 1 | |
| Cervical cancer | total: 2 incidence: 2 | ✗ no | USA | total/female: > 15,161 (1 study did not report cohort size by sex) | total/female: 62 | serum: 2 | ||
| Uterine cancer | total: 1 incidence: 1 | ✗ no | USA | total/female: 62,641 | total/female: 91 | toenail: 1 | ||
| Ovarian cancer | total: 4 incidence: 4 | ✗ no | USA | total/female: ˜ 214,000 | total/female: 568 | serum: 2 toenail: 1 supplemental intake: 1 | ||
| Gynaecological cancer (without breast cancer) | total: 1 incidence: 1 | ✗ no | Finland | total/female: 18,096 | total/female: 86 | serum: 1 | ||
| Urological cancers | Renal cancer | total: 1 incidence: 1 | ✗ no | United Kindom | total: 23,658 | total: 65 | dietary intake: 1 | |
| Urinary bladder cancer | total: 6 incidence: 6 | ✓ yes | USA/Hawaii | total: 279,100 female: 130,786 male: 128,009 | total: 1295 female: 175 male 755 | serum: 3 toenail: 3 | ||
| Urinary tract cancer | total: 1 incidence: 1 | ✗ no | Netherlands | total: 38,500 | total: 47 male: 34 female: 13 | serum: 1 | ||
| Respiratory tract cancers | Lung cancer | total: 15 incidence: 13 | ✓ yes | China Denmark | total: 371,067 male: 125,341 female: 181,895 | total: 2223 male: 1384 female: 416 | serum: 9 serum + plasma: 2 toenail: 2 dietary intake: 2 (1 study reported both serum levels and food intake) | Menkes 1986 Knekt 1990 |
| Oral/pharyngeal cancer | total: 1 incidence: 1 | ✗ no | USA | total: 20,305 | total: 28 | serum: 1 | ||
| Andrological cancers | Prostate cancer | total: 21 incidence: 21 | ✓ yes | USA Canada Puerto Rico | total/male: 576,667 | total/male: 14,950 | serum: 8 plasma: 5 toenail: 4 dietary intake: 4 | Coates 1988 Brooks 2001 |
| Gastrointestinal cancers | Oesophageal cancer | total: 2 incidence: 2 | ✗ no | China | total: 29,923 | total: > 959 | serum: 1 supplemental intake: 1 | |
| Oesophageal squamous cell carcinoma | total:2 incidence: 2 | ✗ no | Netherlands Iran | total: 168,257 | total: 265 | toenail: 1 intake: 1 | ||
| Oesophageal adenocarcinoma | total:1 incidence:1 | ✗ no | Netherlands | total: 120,852 | total: 112 | toenail: 1 | ||
| Oesophageal/stomach cancer | total: 1 incidence: 1 | ✗ no | Netherlands | total: 36,265 | total: 86 male: 51 female: 35 | serum: 1 | ||
| Gastric cardia adenocarcinoma | total:1 incidence:1 | ✗ no | Netherlands | total: 120,852 | total:114 | toenail: 1 | ||
| Stomach cancer | total: 5 incidence: 5 | ✓ yes | China | total: ˜ 197,000 male: 86,311 female: 80,669 | total: 955 male: 626 female: 329 | serum: 4 toenail: 1 | ||
| Primary liver cancer | total: 4 incidence: 3 | ✗ no | China Europe Taiwan | total: 701,809 male: 61,470 female: 74,941 | total: 877 male: 567 female: 204 | plasma: 1 serum: 1 toenail: 1 intake: 1 | ||
| Pancreatic cancer | total: 4 incidence: 4 | ✗ no | USA UK | total: 159,062 | total: 311 male: 69 female: 84 | serum: 2 intake: 1 supplemental intake: 1 | ||
| Colorectal cancer | total: 6 incidence: 6 | ✓ yes | USA/Hawaii | total: 712,746 male: 216,272 female: 442,266 | total: 2627 male: 810 female: 797 | serum: 3 toenail: 2 supplement use: 1 | ||
| Colon cancer | total: 5 incidence: 5 | ✓ yes | USA/Hawaii Europe | total: 636,641 male: 195,100 female: 361,529 | total: 1677 male: 525 female: 510 | serum: 3 toenail: 1 supplement use: 1 | ||
| Rectal cancer | total: 4 incidence: 4 | ✗ no | USA/Hawaii | total: 610,837 male: 195,100 female: 361,529 | total: 861 male: 303 female: 210 | serum: 2 toenail: 1 supplement use:1 | ||
| All gastrointestinal cancers | total: 1 incidence: 1 | ✗ no | USA | total: 6,167 | total: 143 | plasma and serum: 1 | ||
| Skin cancer | Melanoma | total: 3 incidence: 3 | ✗ no | USA | total: ˜ 158,000 | total: 547 | serum: 1 toenail: 1 supplemental intake: 1 | |
| Basal cell carcinoma | total: 3 incidence: 3 | ✗ no | Australia | total: > 66,000 | total: 292 | serum: 3 dietary intake: 1 | ||
| Squamous cell carcinoma | total: 4 incidence: 4 | ✗ no | Australia | total: ˜ 30,000 | total: 488 | serum: 2 plasma: 1 dietary intake: 1 | ||
| Total non‐melanoma skin cancer | total: 1 incidence: 1 | ✗ no | USA | total: 117 | total: 19 | plasma: 1 | ||
| Rare and other cancers | Haematological cancers | total: 1 incidence: 1 | ✗ no | USA | total: 6167 | total: 12 | serum + plasma: 1 | |
| Thyroid cancer | total: 2 incidence: 2 | ✗ no | Norway | total: 582,807 male: 287,944 female: 194,863 | total: 635 male: 269 female: 366 | serum: 1 intake:1 | ||
| Other cancers | total: 4 incidence: 3 | ✗ no | China | total: 109,179 male: 21,172 female: 80,737 | total: 512 male: 169 female: 285 | serum: 2 serum + plasma: 1 toenail: 1 | ||
| Some studies did not report the sex of participants or cancer cases; consequently, figures for women and men do not always sum up to the total number of participants or cancer cases. | ||||||||
| Study | Publication | Newcastle‐Ottawa Scale (cohort) | Newcastle‐Ottawa Scale (case‐control) | ||||||
| Selection | Comparability | Outcome | Total | Selection | Comparability | Exposure | Total | ||
| 0‐1‐0‐1 | 1 | 1‐1‐0 | 5 | 0‐1‐0‐1 | 1 | 1‐1‐0 | 5 | ||
| 0‐1‐1‐1 | 2 | 0‐1‐0 | 6 | .‐.‐.‐. | . | .‐.‐. | . | ||
| 1‐1‐1‐1 | 2 | 1‐1‐0 | 8 | 1‐1‐1‐1 | 2 | 1‐1‐1 | 9 | ||
| 1‐1‐1‐1 | 2 | 1‐1‐1 | 9 | 1‐1‐1‐1 | 2 | 1‐1‐1 | 9 | ||
| Barrass 2013 | 1‐1‐1‐1 | 2 | 1‐1‐1 | 9 | 1‐1‐1‐1 | 2 | 1‐1‐1 | 9 | |
| 1‐1‐1‐1 | 2 | 1‐1‐1 | 9 | .‐.‐.‐. | . | .‐.‐. | . | ||
| 1‐1‐1‐1 | 2 | 1‐1‐1 | 9 | .‐.‐.‐. | . | .‐.‐. | . | ||
| 0‐1‐1‐0 | 2 | 1‐0‐0 | 5 | 1‐0‐1‐1 | 2 | 1‐1‐0 | 7 | ||
| 0‐1‐1‐0 | 0 | 0‐0‐0 | 2 | .‐.‐.‐. | . | .‐.‐. | . | ||
| 0‐1‐1‐0 | 1 | 1‐1‐0 | 5 | 1‐0‐1‐0 | 1 | 1‐1‐1 | 6 | ||
| Coates 1987 | .‐.‐.‐. | . | .‐.‐. | . | .‐.‐.‐. | . | .‐.‐. | . | |
| 0‐1‐1‐0 | 2 | 1‐0‐0 | 5 | .‐.‐.‐. | . | .‐.‐. | . | ||
| 0‐1‐1‐0 | 2 | 1‐1‐0 | 6 | 1‐1‐1‐1 | 2 | 1‐1‐1 | 9 | ||
| 1‐1‐1‐1 | 2 | 1‐1‐1 | 9 | .‐.‐.‐. | . | .‐.‐. | . | ||
| 0‐1‐1‐1 | 2 | 0‐1‐0 | 6 | 1‐1‐1‐1 | 2 | 1‐1‐1 | 9 | ||
| 0‐1‐1‐1 | 2 | 1‐1‐0 | 7 | 0‐1‐1‐1 | 2 | 1‐1‐1 | 8 | ||
| Gill 2009 | 0‐1‐1‐1 | 1 | 1‐1‐0 | 6 | 0‐1‐1‐1 | 1 | 1‐1‐1 | 7 | |
| 1‐1‐1‐0 | 2 | 1‐1‐1 | 8 | 1‐0‐1‐1 | 2 | 1‐1‐1 | 8 | ||
| 1‐1‐1‐1 | 2 | 1‐1‐1 | 9 | .‐.‐.‐. | . | .‐.‐. | . | ||
| 0‐1‐1‐1 | 2 | 1‐1‐1 | 8 | 1‐1‐1‐1 | 2 | 1‐1‐1 | 9 | ||
| 0‐1‐1‐1 | 2 | 1‐1‐1 | 8 | 1‐1‐1‐1 | 2 | 1‐1‐1 | 9 | ||
| 0‐1‐1‐0 | 1 | 1‐1‐1 | 6 | 1‐1‐1‐1 | 1 | 1‐1‐1 | 8 | ||
| 0‐1‐1‐0 | 2 | 1‐1‐0 | 6 | 1‐1‐1‐1 | 2 | 1‐1‐1 | 9 | ||
| 0‐1‐1‐1 | 2 | 1‐1‐0 | 7 | 1‐1‐1‐1 | 2 | 1‐1‐1 | 9 | ||
| 1‐1‐1‐1 | 2 | 1‐1‐1 | 9 | .‐.‐.‐. | . | .‐.‐. | . | ||
| 0‐1‐0‐1 | 2 | 1‐1‐0 | 7 | .‐.‐.‐. | . | .‐.‐. | . | ||
| 0‐1‐1‐1 | 1 | 1‐1‐1 | 7 | .‐.‐.‐. | . | .‐.‐. | . | ||
| 1‐1‐0‐1 | 2 | 1‐1‐0 | 7 | .‐.‐.‐. | . | .‐.‐. | . | ||
| 1‐1‐1‐1 | 2 | 1‐1‐1 | 9 | .‐.‐.‐. | . | .‐.‐. | . | ||
| 0‐1‐1‐1 | 1 | 1‐1‐0 | 6 | 1‐1‐1‐1 | 1 | 1‐1‐1 | 8 | ||
| 1‐1‐1‐1 | 2 | 0‐1‐0 | 7 | 0‐1‐1‐1 | 2 | 1‐1‐1 | 8 | ||
| 1‐1‐1‐1 | 2 | 0‐1‐1 | 8 | 0‐1‐1‐1 | 2 | 1‐1‐1 | 8 | ||
| 0‐1‐1‐1 | 2 | 1‐1‐0 | 7 | 0‐1‐1‐1 | 2 | 1‐1‐1 | 8 | ||
| 0‐1‐1‐1 | 2 | 1‐1‐1 | 8 | 1‐1‐1‐1 | 2 | 1‐1‐1 | 9 | ||
| 1‐1‐1‐1 | 2 | 1‐1‐1 | 9 | 0‐1‐1‐1 | 2 | 1‐1‐1 | 8 | ||
| Hakama 1990 | 1‐1‐1‐1 | 2 | 1‐1‐1 | 9 | 0‐1‐1‐1 | 2 | 1‐1‐1 | 8 | |
| Knekt 1988 | 1‐1‐1‐1 | 2 | 1‐1‐1 | 9 | 0‐0‐1‐1 | 2 | 1‐1‐1 | 7 | |
| Knekt 1996 | 1‐1‐1‐1 | 1 | 1‐1‐1 | 8 | 0‐1‐1‐1 | 1 | 1‐1‐1 | 7 | |
| 1‐1‐1‐1 | 2 | 1‐1‐1 | 9 | 0‐1‐1‐1 | 2 | 1‐1‐1 | 8 | ||
| 1‐1‐1‐1 | 2 | 1‐1‐1 | 9 | 0‐1‐1‐1 | 2 | 1‐1‐1 | 8 | ||
| 1‐1‐1‐1 | 2 | 1‐1‐1 | 9 | 1‐0‐1‐1 | 2 | 1‐1‐1 | 8 | ||
| .‐.‐.‐. | . | .‐.‐. | . | .‐.‐.‐. | . | .‐.‐. | . | ||
| 1‐1‐1‐0 | 1 | 1‐1‐1 | 7 | 1‐1‐1‐1 | 1 | 1‐1‐1 | 8 | ||
| 1‐1‐1‐1 | 1 | 1‐1‐1 | 8 | 1‐1‐1‐1 | 1 | 1‐1‐1 | 8 | ||
| 1‐1‐1‐0 | 2 | 1‐1‐1 | 8 | .‐.‐.‐. | . | .‐.‐. | . | ||
| 0‐1‐1‐1 | 2 | 0‐1‐1 | 7 | 1‐1‐1‐1 | 2 | 1‐1‐1 | 9 | ||
| 1‐1‐1‐1 | 2 | 1‐1‐0 | 8 | .‐.‐.‐. | . | .‐.‐. | . | ||
| 1‐1‐1‐1 | 1 | 1‐1‐0 | 7 | 1‐1‐1‐1 | 1 | 1‐1‐1 | 8 | ||
| Heinen 2007 | 1‐1‐1‐1 | 2 | 1‐1‐1 | 9 | .‐.‐.‐. | . | .‐.‐. | . | |
| van der Pols 2009 | 1‐1‐1‐1 | 2 | 1‐1‐0 | 8 | .‐.‐.‐. | . | .‐.‐. | . | |
| 0‐1‐1‐1 | 2 | 1‐1‐0 | 7 | 1‐1‐1‐1 | 2 | 1‐1‐1 | 9 | ||
| Batieha 1993 | 0‐1‐1‐1 | 2 | 1‐1‐0 | 7 | 1‐1‐1‐1 | 2 | 1‐1‐1 | 9 | |
| Breslow 1995 | 0‐1‐1‐1 | 2 | 1‐1‐0 | 7 | 1‐0‐1‐1 | 2 | 1‐1‐1 | 8 | |
| Burney 1989 | 0‐1‐1‐1 | 2 | 1‐1‐0 | 7 | 0‐1‐1‐1 | 2 | 1‐1‐1 | 8 | |
| Helzlsouer 1996 | 0‐1‐1‐1 | 2 | 1‐1‐0 | 7 | 0‐1‐1‐1 | 2 | 1‐1‐1 | 8 | |
| Helzlsouer 1989 | 0‐1‐1‐1 | 2 | 1‐1‐0 | 7 | 1‐1‐1‐1 | 2 | 1‐1‐1 | 9 | |
| Ko 1994 | 0‐1‐1‐0 | 2 | 1‐1‐0 | 6 | 1‐1‐1‐1 | 2 | 1‐1‐1 | 9 | |
| .‐.‐.‐. | . | .‐.‐. | . | .‐.‐.‐. | . | .‐.‐. | . | ||
| Schober 1987 | 0‐1‐1‐1 | 1 | 1‐1‐0 | 6 | 0‐1‐1‐1 | 1 | 1‐1‐1 | 7 | |
| Schober 1986 | .‐.‐.‐. | . | .‐.‐. | . | .‐.‐.‐. | . | .‐.‐. | . | |
| Zheng 1993 | 0‐1‐1‐1 | 2 | 1‐1‐0 | 7 | 0‐1‐1‐1 | 2 | 1‐1‐1 | 8 | |
| 1‐1‐1‐1 | 2 | 1‐1‐0 | 8 | 0‐1‐1‐1 | 2 | 1‐1‐1 | 8 | ||
| 0‐1‐1‐1 | 2 | 0‐1‐0 | 6 | 1‐1‐1‐1 | 2 | 1‐1‐1 | 9 | ||
| 1‐1‐1‐1 | 2 | 1‐1‐1 | 9 | .‐.‐.‐. | . | .‐.‐. | . | ||
| 1‐1‐1‐1 | 2 | 1‐1‐1 | 9 | 1‐1‐1‐1 | 2 | 1‐1‐1 | 9 | ||
| 1‐1‐1‐1 | 2 | 1‐1‐1 | 9 | 1‐1‐1‐1 | 2 | 1‐1‐1 | 9 | ||
| 1‐1‐1‐1 | 2 | 1‐1‐1 | 9 | .‐.‐.‐. | . | .‐.‐. | . | ||
| 1‐1‐1‐1 | 2 | 1‐1‐1 | 9 | 1‐0‐1‐1 | 2 | 1‐1‐1 | 8 | ||
| 1‐1‐1‐0 | 1 | 1‐1‐0 | 6 | .‐.‐.‐. | . | .‐.‐. | . | ||
| 1‐1‐1‐1 | 2 | 1‐1‐1 | 9 | .‐.‐.‐. | . | .‐.‐. | . | ||
| 1‐1‐1‐1 | 2 | 1‐1‐1 | 9 | .‐.‐.‐. | . | .‐.‐. | . | ||
| 1‐1‐1‐1 | 1 | 1‐1‐0 | 7 | 1‐1‐1‐1 | 1 | 1‐1‐1 | 8 | ||
| 0‐1‐1‐1 | 2 | 1‐1‐0 | 7 | 1‐1‐1‐1 | 2 | 1‐1‐1 | 9 | ||
| 0‐1‐1‐1 | 1 | 1‐1‐1 | 7 | .‐.‐.‐. | . | .‐.‐. | . | ||
| Asgari 2009 | 0‐1‐1‐1 | 1 | 1‐1‐0 | 6 | .‐.‐.‐. | . | .‐.‐. | . | |
| 0‐1‐0‐1 | 0 | 1‐1‐1 | 5 | .‐.‐.‐. | . | .‐.‐. | . | ||
| 0‐1‐0‐1 | 2 | 1‐1‐1 | 7 | .‐.‐.‐. | . | .‐.‐. | . | ||
| 1‐1‐1‐1 | 2 | 1‐0‐0 | 7 | 0‐0‐1‐1 | 2 | 1‐1‐1 | 7 | ||
| 1‐1‐1‐1 | 2 | 1‐1‐0 | 8 | 1‐1‐1‐1 | 2 | 1‐1‐1 | 9 | ||
| 0‐1‐1‐1 | 2 | 0‐1‐0 | 6 | .‐.‐.‐. | . | .‐.‐. | . | ||
| 0‐1‐1‐0 | 1 | 1‐1‐0 | 5 | 1‐1‐1‐1 | 1 | 1‐1‐1 | 8 | ||
| 1‐1‐1‐1 | 2 | 1‐1‐1 | 9 | 0‐1‐1‐1 | 2 | 1‐1‐1 | 8 | ||
| 1‐1‐1‐1 | 2 | 1‐1‐1 | 9 | 1‐1‐1‐1 | 2 | 1‐1‐1 | 9 | ||
| 1‐1‐1‐1 | 2 | 0‐1‐0 | 7 | 1‐1‐1‐1 | 2 | 0‐1‐1 | 8 | ||
| 0‐1‐1‐1 | 2 | 1‐1‐1 | 8 | .‐.‐.‐. | . | .‐.‐. | . | ||
| 1‐1‐1‐1 | 2 | 1‐1‐0 | 8 | .‐.‐.‐. | . | .‐.‐. | . | ||
| 1‐1‐1‐1 | 2 | 1‐1‐1 | 9 | .‐.‐.‐. | . | .‐.‐. | . | ||
| van den Brandt 1994 | 1‐1‐1‐1 | 2 | 1‐1‐1 | 9 | .‐.‐.‐. | . | .‐.‐. | . | |
| 1‐1‐1‐1 | 2 | 1‐1‐1 | 9 | .‐.‐.‐. | . | .‐.‐. | . | ||
| van den Brandt 2003 | 1‐1‐1‐1 | 2 | 1‐1‐1 | 9 | .‐.‐.‐. | . | .‐.‐. | . | |
| Zeegers 2002 | 1‐1‐1‐1 | 2 | 1‐1‐1 | 9 | .‐.‐.‐. | . | .‐.‐. | . | |
| 1‐1‐1‐1 | 2 | 1‐1‐1 | 9 | 0‐1‐1‐1 | 2 | 1‐0 | 6 | ||
| 1‐1‐1‐0 | 1 | 1‐0‐1 | 6 | 1‐1‐1‐0 | 1 | 1‐1‐1 | 7 | ||
| 0‐1‐1‐1 | 2 | 1‐1‐1 | 8 | .‐.‐.‐. | . | .‐.‐. | . | ||
| 1‐1‐1‐1 | 1 | 1‐1‐1 | 8 | .‐.‐.‐. | . | .‐.‐. | . | ||
| Mark 2000 | 1‐1‐1‐1 | 1 | 1‐1‐1 | 8 | .‐.‐.‐. | . | .‐.‐. | . | |
| 1‐1‐1‐0 | 2 | 1‐1‐0 | 7 | 1‐1‐1‐1 | 2 | 1‐1‐1 | 9 | ||
| 0‐1‐1‐1 | 2 | 1‐1‐1 | 8 | 1‐0‐1‐1 | 2 | 1‐1‐1 | 8 | ||
| 0‐1‐1‐1 | 2 | 1‐1‐0 | 7 | 1‐1‐1‐1 | 2 | 1‐1‐1 | 9 | ||
| Organ system | Cancer | Case definition | Risk ratio estimate (highest vs lowest exposure category) | 95% CI | Selenium marker | Sex | Study |
| Gynaecological | Cervix | incidence | 0.89 | 0.40 to 2.00 | serum | women | Menkes 1986 (Batieha 1993) |
| 1.10 | n.r. | serum | |||||
| Gynaecological (without breast) | incidence | 0.96 | n.r. | serum | |||
| Ovary | incidence | 0.87 | 0.25 to 5.26 | serum | Knekt 1990 (Knekt 1996) | ||
| 1.22 | 0.44 to 3.38 | toenail | |||||
| 0.58 | 0.2 to 1.7 | serum | Menkes 1986 (Helzlsour 1996) | ||||
| 1.00 | 0.73 to 1.37 | suppl. intake | |||||
| Uterus | incidence | 1.38 | 0.62 to 3.08 | toenail | |||
| Gastrointestinal | Gastrointestinal tract (all) | incidence | 1.00 | n.r. | serum/plasma | both | |
| Oesophageal squamous cell carcinoma | incidence | 0.37 | 0.16 to 0.86 | toenail | both | ||
| 0.67 | 0.53 to 1.30 | intake | both | ||||
| Oesophageal adenocarcinoma | incidence | 0.76 | 0.41 to 1.40 | toenail | both | ||
| Oesophagus | incidence | 0.56 | 0.44 to 0.71 | serum | both | Wei 2004 (Mark 2000) | |
| mortality | 0.62 | 0.44 to 0.89 | serum | ||||
| mortality | 0.35 | 0.16 to 0.81 | serum | both | |||
| incidence | 0.27 | 0.03 to 2.21 | suppl. intake | both | |||
| Gastric cardio adenocarcinoma | incidence | 0.52 | 0.27 to 1.02 | toenail | both | ||
| Oesophagus and stomach | incidence | 0.45 | n.r. | serum | men | Knekt 1990 (Knekt 1988) | |
| incidence | 0.67 | n.r. | serum | women | |||
| Liver | incidence | 0.62 | 0.21 to 1.86 | plasma | men | ||
| 0.41 | 0.23 to 0.72 | serum | both | ||||
| 0.86 | 0.52 to to 1.43 | intake | both | ||||
| 0.95 | 0.51 to 1.76 | men | |||||
| 0.70 | 0.26 to 1.90 | women | |||||
| mortality | 0.50 | 0.28 to 0.90 | toenail | both | |||
| 0.57 | 0.31 to 1.05 | men | |||||
| 0.18 | 0.03 to 1.13 | women | |||||
| Pancreas | incidence | 0.08 | 0.01 to 0.56 | serum | men | Menkes 1986 (Burney 1989) | |
| 0.83 | 0.40 to 1.67 | women | |||||
| 0.58 | n.r. | serum | men | ||||
| 3.49 | n.r. | women | |||||
| 0.72 | 0.36 to 1.43 | intake | both | ||||
| 0.69 | 0.39 to 1.20 | supplemental intake | both | ||||
| Rectum | incidence | 0.625 | n.r. | serum | men | ||
| 1.05 | 0.54 to 2.03 | toenail | both |
| |||
| 0.91 | 0.41 to 2.00 | men | |||||
| 1.58 | 0.59 to 4.22 | women | |||||
| 0.80 | 0.68 to 0.95 | supplement use | both | ||||
| 1.09 | 0.63 to 1.89 | serum | both | ||||
| 1.32 | 0.55 to 3.19 | men | |||||
| 0.76 | 0.32 to 1.80 | women | |||||
| Urological cancers | Renal cancer | incidence | 0.40 | 0.17 to 0.98 | dietary intake | both | |
| Urinary tract (all) | incidence | 0.97 | 0.72 to 1.31 | serum | both | ||
| 0.81 | n.r. | serum | men | ||||
| 4.12 | n.r. | women | |||||
| Respiratory tract | Cavum oris/pharynx | incidence | 5.43 | n.r. | serum | both | Menkes 1986 (Zheng 1993) |
| Skin | Melanoma | incidence | 1.66 | 0.71 to 3.85 | toenail | women | |
| 0.90 | 0.30 to 2.50 | serum | both | Menkes 1986 (Breslow 1995) | |||
| 0.98 | 0.69 to 1.41 | suppl. intake | both | Peters 2008 (Asgari 2009) | |||
| Any non‐melanoma cancer | incidence | 0.77 | n.r. | plasma | both | ||
| Basal cell carcinoma | incidence | 0.54 | n.r. | serum | men | ||
| 1.55 | n.r. | women | |||||
| 0.80 | 0.10 to 4.5 | serum | both | Menkes 1986 (Breslow 1995) | |||
| 0.86 | 0.38 to 1.96 | serum | both | ||||
| 0.95 | 0.59 to 1.50 | intake | |||||
| Squamous cell carcinoma | incidence | 0.69 | 0.51 to 0.92 | plasma | both | ||
| 0.60 | 0.20 to 1.50 | serum | both | Menkes 1986 (Breslow 1995) | |||
| 0.86 | 0.47 to 1.58 | plasma | both | ||||
| 1.30 | 0.77 to 2.3 | intake | both | ||||
| 0.49 | 0.24 to 0.99 | serum | |||||
| Other | Haematological | incidence | 0.60 | n.r. | serum/plasma | both | |
| incidence | 0.95 | 0.75 to 1.20 | suppl. intake | both | |||
| Thyroid | incidence | 0.13 | 0.02 to 0.77 | serum | both | ||
| 0.15 | 0.0 to 5.0 | men | |||||
| 0.12 | 0.01 to 1.11 | women | |||||
| 1.35 | 0.99 to 1.84 | intake | both | ||||
| 1.23 | 0.71 to 2.12 | men | |||||
| 1.14 | 1.65 to 2.02 | women | |||||
| n.r. = not reported. | |||||||
| Outcome or subgroup title | No. of studies | No. of participants | Statistical method | Effect size |
| 1 Any cancer risk Show forest plot | 5 | Risk Ratio (IV, Random, 95% CI) | Subtotals only | |
| 1.1 Studies with low RoB | 3 | 19475 | Risk Ratio (IV, Random, 95% CI) | 1.01 [0.93, 1.10] |
| 1.2 All studies | 5 | 21860 | Risk Ratio (IV, Random, 95% CI) | 0.99 [0.86, 1.14] |
| 2 Cancer mortality Show forest plot | 2 | Risk Ratio (IV, Random, 95% CI) | Subtotals only | |
| 2.1 Studies with low RoB | 1 | 17448 | Risk Ratio (IV, Random, 95% CI) | 1.02 [0.80, 1.30] |
| 2.2 All studies | 2 | 18698 | Risk Ratio (IV, Random, 95% CI) | 0.81 [0.49, 1.32] |
| 3 Head and neck cancer risk Show forest plot | 2 | Risk Ratio (IV, Random, 95% CI) | Subtotals only | |
| 3.1 Studies with low RoB | 1 | 1561 | Risk Ratio (IV, Random, 95% CI) | 1.00 [0.18, 5.45] |
| 3.2 All studies | 2 | 2811 | Risk Ratio (IV, Random, 95% CI) | 1.22 [0.52, 2.85] |
| 4 Oesophageal cancer risk Show forest plot | 2 | Risk Ratio (IV, Random, 95% CI) | Subtotals only | |
| 4.1 Studies with low RoB | 1 | 1561 | Risk Ratio (IV, Random, 95% CI) | 1.50 [0.06, 36.86] |
| 4.2 All studies | 2 | 2811 | Risk Ratio (IV, Random, 95% CI) | 0.53 [0.12, 2.28] |
| 5 Colorectal cancer risk Show forest plot | 3 | Risk Ratio (IV, Random, 95% CI) | Subtotals only | |
| 5.1 Studies with low RoB | 2 | 19009 | Risk Ratio (IV, Random, 95% CI) | 0.99 [0.69, 1.43] |
| 5.2 All studies | 3 | 20259 | Risk Ratio (IV, Random, 95% CI) | 0.74 [0.41, 1.33] |
| 6 Liver cancer risk Show forest plot | 4 | Risk Ratio (IV, Random, 95% CI) | Subtotals only | |
| 6.1 Studies with low RoB | 1 | 1561 | Risk Ratio (IV, Random, 95% CI) | 6.52 [0.37, 115.49] |
| 6.2 All studies | 4 | 6326 | Risk Ratio (IV, Random, 95% CI) | 0.52 [0.35, 0.79] |
| 7 Melanoma risk Show forest plot | 3 | Risk Ratio (IV, Random, 95% CI) | Subtotals only | |
| 7.1 Studies with low RoB | 2 | 2027 | Risk Ratio (IV, Random, 95% CI) | 1.35 [0.41, 4.52] |
| 7.2 All studies | 3 | 3277 | Risk Ratio (IV, Random, 95% CI) | 1.28 [0.63, 2.59] |
| 8 Non‐melanoma skin cancer risk Show forest plot | 4 | Risk Ratio (Random, 95% CI) | Subtotals only | |
| 8.1 Studies with low RoB | 2 | 2027 | Risk Ratio (Random, 95% CI) | 1.16 [0.30, 4.42] |
| 8.2 All studies | 4 | 3461 | Risk Ratio (Random, 95% CI) | 1.23 [0.73, 2.08] |
| 9 Lung cancer risk Show forest plot | 3 | Risk Ratio (IV, Random, 95% CI) | Subtotals only | |
| 9.1 Studies with low RoB | 2 | 19009 | Risk Ratio (IV, Random, 95% CI) | 1.16 [0.89, 1.50] |
| 9.2 All studies | 3 | 20259 | Risk Ratio (IV, Random, 95% CI) | 1.03 [0.78, 1.37] |
| 10 Breast cancer risk Show forest plot | 3 | Risk Ratio (IV, Random, 95% CI) | Subtotals only | |
| 10.1 Studies with low RoB | 1 | 802 | Risk Ratio (IV, Random, 95% CI) | 2.04 [0.44, 9.55] |
| 10.2 All studies | 3 | 2260 | Risk Ratio (IV, Random, 95% CI) | 1.44 [0.96, 2.17] |
| 11 Bladder cancer risk Show forest plot | 3 | Risk Ratio (IV, Random, 95% CI) | Subtotals only | |
| 11.1 Studies with low RoB | 2 | 19009 | Risk Ratio (IV, Random, 95% CI) | 1.07 [0.76, 1.52] |
| 11.2 All studies | 3 | 20259 | Risk Ratio (IV, Random, 95% CI) | 1.10 [0.79, 1.52] |
| 12 Prostate cancer risk Show forest plot | 5 | Risk Ratio (IV, Random, 95% CI) | Subtotals only | |
| 12.1 Studies with low RoB | 4 | 18942 | Risk Ratio (IV, Random, 95% CI) | 1.01 [0.90, 1.14] |
| 12.2 All studies | 5 | 19869 | Risk Ratio (IV, Random, 95% CI) | 0.91 [0.75, 1.12] |
| 13 Leukaemia and lymphoma risk Show forest plot | 2 | Risk Ratio (IV, Random, 95% CI) | Subtotals only | |
| 13.1 Studies with low RoB | 1 | 1561 | Risk Ratio (IV, Random, 95% CI) | 1.00 [0.25, 3.99] |
| 13.2 All studies | 2 | 2811 | Risk Ratio (IV, Random, 95% CI) | 1.21 [0.52, 2.80] |
| Outcome or subgroup title | No. of studies | No. of participants | Statistical method | Effect size |
| 1 Total cancer incidence and mortality Show forest plot | 14 | Odds Ratio (Random, 95% CI) | Subtotals only | |
| 1.1 Incidence | 7 | Odds Ratio (Random, 95% CI) | 0.72 [0.55, 0.93] | |
| 1.2 Mortality | 7 | Odds Ratio (Random, 95% CI) | 0.76 [0.59, 0.97] | |
| 2 Total cancer incidence and mortality (men) Show forest plot | 8 | Odds Ratio (Random, 95% CI) | Subtotals only | |
| 2.1 Incidence | 4 | Odds Ratio (Random, 95% CI) | 0.72 [0.46, 1.14] | |
| 2.2 Mortality | 4 | Odds Ratio (Random, 95% CI) | 0.65 [0.45, 0.94] | |
| 3 Total cancer incidence and mortality (women) Show forest plot | 6 | Odds Ratio (Random, 95% CI) | Subtotals only | |
| 3.1 Incidence | 2 | Odds Ratio (Random, 95% CI) | 0.90 [0.45, 1.77] | |
| 3.2 Mortality | 4 | Odds Ratio (Random, 95% CI) | 0.91 [0.80, 1.03] | |
| 4 Total cancer incidence and mortality (ascending order of selenium levels) Show forest plot | 13 | Odds Ratio (Random, 95% CI) | Subtotals only | |
| 4.1 Incidence | 7 | 1642 | Odds Ratio (Random, 95% CI) | 0.72 [0.55, 0.93] |
| 4.2 Mortality | 6 | 1230 | Odds Ratio (Random, 95% CI) | 0.63 [0.39, 1.01] |
| 5 Total cancer incidence and mortality (ascending order of differences in selenium levels) Show forest plot | 13 | Odds Ratio (Random, 95% CI) | Subtotals only | |
| 5.1 Incidence | 7 | 190 | Odds Ratio (Random, 95% CI) | 0.72 [0.55, 0.93] |
| 5.2 Mortality | 6 | 106 | Odds Ratio (Random, 95% CI) | 0.63 [0.39, 1.01] |
| 6 Stomach cancer risk Show forest plot | 5 | Odds Ratio (Random, 95% CI) | 0.66 [0.43, 1.01] | |
| 7 Stomach cancer risk (by sex) Show forest plot | 5 | Odds Ratio (Random, 95% CI) | 0.66 [0.42, 1.04] | |
| 7.1 All (male + female) | 2 | Odds Ratio (Random, 95% CI) | 0.75 [0.41, 1.36] | |
| 7.2 Male | 3 | Odds Ratio (Random, 95% CI) | 0.43 [0.14, 1.32] | |
| 7.3 Female | 2 | Odds Ratio (Random, 95% CI) | 0.73 [0.12, 4.35] | |
| 8 Colorectal cancer risk Show forest plot | 6 | Odds Ratio (Random, 95% CI) | 0.82 [0.72, 0.94] | |
| 9 Colorectal cancer risk (by sex) Show forest plot | 6 | Odds Ratio (Random, 95% CI) | 0.83 [0.72, 0.95] | |
| 9.1 All (male + female) | 1 | Odds Ratio (Random, 95% CI) | 0.80 [0.68, 0.94] | |
| 9.2 Male | 4 | Odds Ratio (Random, 95% CI) | 0.86 [0.65, 1.16] | |
| 9.3 Female | 4 | Odds Ratio (Random, 95% CI) | 0.96 [0.61, 1.50] | |
| 10 Colon cancer risk Show forest plot | 5 | Odds Ratio (Random, 95% CI) | 0.81 [0.69, 0.96] | |
| 11 Colon cancer risk (by sex) Show forest plot | 5 | Odds Ratio (Random, 95% CI) | 0.81 [0.69, 0.96] | |
| 11.1 All (male + female) | 2 | Odds Ratio (Random, 95% CI) | 0.84 [0.68, 1.03] | |
| 11.2 Male | 3 | Odds Ratio (Random, 95% CI) | 0.84 [0.56, 1.25] | |
| 11.3 Female | 2 | Odds Ratio (Random, 95% CI) | 0.68 [0.44, 1.04] | |
| 12 Lung cancer incidence and mortality Show forest plot | 13 | Odds Ratio (Random, 95% CI) | Subtotals only | |
| 12.1 Incidence | 11 | Odds Ratio (Random, 95% CI) | 0.82 [0.59, 1.14] | |
| 12.2 Mortality | 2 | Odds Ratio (Random, 95% CI) | 1.34 [0.93, 1.93] | |
| 13 Lung cancer risk (sex‐disaggregated data) Show forest plot | 13 | Odds Ratio (Random, 95% CI) | 0.89 [0.69, 1.14] | |
| 13.1 All (male + female) | 5 | Odds Ratio (Random, 95% CI) | 0.74 [0.43, 1.28] | |
| 13.2 Male | 7 | Odds Ratio (Random, 95% CI) | 0.98 [0.68, 1.39] | |
| 13.3 Female | 4 | Odds Ratio (Random, 95% CI) | 0.83 [0.43, 1.61] | |
| 14 Lung cancer risk (by exposure assessment) Show forest plot | 13 | Odds Ratio (Random, 95% CI) | 0.88 [0.65, 1.18] | |
| 14.1 Intake | 2 | Odds Ratio (Random, 95% CI) | 1.32 [0.95, 1.84] | |
| 14.2 Serum or plasma | 9 | Odds Ratio (Random, 95% CI) | 0.91 [0.70, 1.18] | |
| 14.3 Toenail | 2 | Odds Ratio (Random, 95% CI) | 1.05 [0.11, 10.36] | |
| 15 Lung cancer risk (ascending order of selenium levels) Show forest plot | 8 | 1938 | Odds Ratio (Random, 95% CI) | 0.97 [0.74, 1.27] |
| 16 Lung cancer risk (ascending order of differences in selenium levels) Show forest plot | 8 | 188 | Odds Ratio (Random, 95% CI) | 0.97 [0.74, 1.27] |
| 17 Breast cancer risk (women) Show forest plot | 8 | Odds Ratio (Random, 95% CI) | 1.09 [0.87, 1.37] | |
| 18 Bladder cancer risk Show forest plot | 5 | Odds Ratio (Random, 95% CI) | 0.67 [0.46, 0.97] | |
| 18.1 All (male + female) | 2 | Odds Ratio (Random, 95% CI) | 0.65 [0.46, 0.92] | |
| 18.2 Male | 3 | Odds Ratio (Random, 95% CI) | 0.82 [0.41, 1.62] | |
| 18.3 Female | 1 | Odds Ratio (Random, 95% CI) | 0.36 [0.14, 0.92] | |
| 19 Prostate cancer risk Show forest plot | 21 | Odds Ratio (Random, 95% CI) | 0.84 [0.75, 0.95] | |
| 20 Prostate cancer risk (by exposure assessment) Show forest plot | 21 | Odds Ratio (Random, 95% CI) | 0.84 [0.75, 0.95] | |
| 20.1 Intake and supplement | 4 | Odds Ratio (Random, 95% CI) | 0.99 [0.85, 1.15] | |
| 20.2 Serum or plasma | 13 | Odds Ratio (Random, 95% CI) | 0.86 [0.75, 0.99] | |
| 20.3 Toenail | 4 | Odds Ratio (Random, 95% CI) | 0.60 [0.44, 0.82] | |
| 21 Prostate cancer risk (ascending order of selenium levels) Show forest plot | 13 | 2816 | Odds Ratio (Random, 95% CI) | 0.86 [0.75, 0.99] |
| 22 Prostate cancer risk (ascending order of differences in selenium levels) Show forest plot | 13 | 345 | Odds Ratio (Random, 95% CI) | 0.86 [0.75, 0.99] |