Haloperidol más prometazina para la agresión inducida por psicosis
Appendices
Appendix 1. Previous searches
2.1 Search in 2004
We searched the Cochrane Schizophrenia Group's Register (July 2004) using the phrase'*Promethaz* in title, abstract or indexing terms of REFERENCE or *Promethaz* in interventions of STUDY
2.2 Search in 2008
We searched the Cochrane Schizophrenia Group's Register (January 2008) using the phrase
'*Promethaz* in title, abstract or indexing terms of REFERENCE or *Promethaz* in interventions of STUDY
Appendix 2. Methods ‐ as used in the 2009 version
1. Study selection
We (GH and JA) independently inspected the citations identified from the search. We identified potentially relevant abstracts and ordered full papers for reassessment for inclusion and methodological quality. We discussed and reported any disagreements and contacted study authors for further clarification where necessary.
2. Assessment of quality
Again working independently, we allocated trials to three quality categories, as described in the Cochrane Collaboration Handbook (Higgins 2005). Concealment of allocation remains the key aspect of methodology that predicts how susceptible results are to the inclusion of biases. Although adherence to blinding at outcome is also important, it is the ability of everyone involved to predict who will receive the next intervention that most substantially influences results. Category A studies in this review, where good concealment of allocation was made explicit, employed techniques that ensured that researchers and recipients could not have known the next intervention to be used. We considered these studies at low risk of bias. Any plausible biases were felt to be unlikely to seriously affect results. Category B studies assured the reader that studies were randomised but they did not make concealment of allocation explicit. We would have included these studies but these would have been at moderate risk of bias with some doubts about the results. We did not include Category C studies, where the process of allocation is neither described nor implied. These studies are at high risk of bias and the plausible bias seriously weakens confidence in the results.
If disputes had arisen as to which category a trial was to be allocated, again, resolution was to have been attempted by discussion. We included only trials in Category A or B in the review. Other dimensions of quality were not reasons for exclusion.
3. Data management
3.1 Data extraction
We (GH, JA) independently extracted data from included studies. Again, any disagreement was discussed, decisions documented and, if necessary, we contacted the authors of the studies for clarification. We documented justifications for excluding references from the review.
3.2 Intention to treat assumptions
For studies that did not specify the reasons for people leaving the study early, we assumed that these people had no change in clinical outcome variables. We excluded data from outcomes where attrition was greater than 50%.
5. Data analysis
5.1 Binary data
For binary outcomes we calculated a standard estimation of the fixed‐effect risk ratio (RR) and its 95% confidence interval (CI). Where binary results were statistically significant we calculated the number needed to treat/harm statistic (NNT/H), and its 95% confidence interval (CI) using Visual Rx (http://www.nntonline.net/) which takes account of the event rate in the control group.
5.2 Continuous data
5.2.1 Skewed data: continuous data on clinical and social outcomes are often not normally distributed. To avoid the pitfall of applying parametric tests to non‐parametric data, we applied the following standards to all data before inclusion: (a) standard deviations and means were reported in the paper or were obtainable from the authors; (b) when a scale started from the finite number zero, the standard deviation, when multiplied by two, was less than the mean (as otherwise the mean is unlikely to be an appropriate measure of the centre of the distribution, (Altman 1996); (c) if a scale started from a positive value (such as PANSS which can have values from 30 to 210) the calculation described above was modified to take the scale starting point into account. In these cases skew is present if 2SD>(S‐Smin), where S is the mean score and Smin is the minimum score. Endpoint scores on scales often have a finite start and end point and these rules can be applied. When continuous data are presented on a scale which includes a possibility of negative values (such as change data), it is difficult to tell whether data are skewed or not. Skewed data from studies of less than 200 participants would have been entered in additional tables rather than into an analysis. Skewed data pose less of a problem when looking at means if the sample size is large and would have been entered into a synthesis.
5.2.2 Summary statistic: for continuous outcomes we estimated a fixed‐effect weighted mean difference (WMD) between groups.
5.2.3 Valid scales: we included continuous data from rating scales only if the measuring instrument had been described in a peer‐reviewed journal (Marshall 2000) and the instrument was either a self‐report or completed by an independent rater or relative (not the therapist).
5.2.4 Endpoint versus change data: we find it preferable to use scale endpoint data, which typically cannot have negative values and is easier to interpret from a clinical point of view. Change data are often not ordinal and are very problematic to interpret. If endpoint data had not been available, we would have used change data.
5.2.5 Cluster trials: studies increasingly employ 'cluster randomisation' (such as randomisation by clinician or practice) but analysis and pooling of clustered data poses problems. Firstly, authors often fail to account for intraclass correlation in clustered studies, leading to a 'unit of analysis' error (Divine 1992) whereby p values are spuriously low, confidence intervals unduly narrow and statistical significance overestimated. This causes type I errors (Bland 1997, Gulliford 1999).
Where clustering was not accounted for in primary studies, we presented the data in a table, with a (*) symbol to indicate the presence of a probable unit of analysis error. In subsequent versions of this review we will seek to contact first authors of studies to obtain intraclass correlation coefficients of their clustered data and to adjust for this by using accepted methods (Gulliford 1999). Where clustering has been incorporated into the analysis of primary studies, we will also present these data as if from a non‐cluster randomised study, but adjusted for the clustering effect.
We have sought statistical advice and have been advised that the binary data as presented in a report should be divided by a 'design effect'. This is calculated using the mean number of participants per cluster (m) and the intraclass correlation coefficient (ICC) Design effect=1+(m‐1)*ICC (Donner 2002). If the ICC was not reported it was assumed to be 0.1 (Ukoumunne 1999).
If cluster studies had been appropriately analysed taking into account intraclass correlation coefficients and relevant data documented in the report, synthesis with other studies would have been possible using the generic inverse variance technique.
6. Test for heterogeneity
Firstly, we considered all the included studies within any comparison to judge clinical heterogeneity. Then we visually inspected graphs to investigate the possibility of statistical heterogeneity. This was supplemented, primarily, by employing the I‐squared statistic. This provides an estimate of the percentage of inconsistency thought to be due to chance. Where the I‐squared estimate was greater than or equal to 75%, this was interpreted as evidence of high levels of heterogeneity (Higgins 2003). Data were then re‐analysed using a random‐effects model to see if this made a substantial difference. If it did, and results became more consistent, i.e. falling below 75% in the estimate, the studies were added to the main body of trials. If using the random‐effects model did not make a difference and inconsistency remained high, data were not summated, but were presented separately and reasons for heterogeneity investigated.
7. Addressing small study bias
We were to have entered data from all included studies into a funnel graph (trial effect against trial size) in an attempt to investigate the likelihood of overt publication bias (Egger 1997).
8. Sensitivity analyses
If necessary, we analysed the effect of including studies with high attrition rates in a sensitivity analysis. We also included trials in a sensitivity analysis if they were described as 'double blind' but only implied randomisation. If we found no substantive differences within primary outcomes when these high attrition and 'implied randomisation' studies were added to the overall results, we included them in the final analysis. However, if there was a substantive difference we only used clearly randomised trials, and those with attrition lower than 50%.
9. General
Where possible, we entered data in such a way that the area to the left of the line of no effect indicated a favourable outcome for haloperidol plus promethazine.

Haloperidol structure.
Promethazine structure.
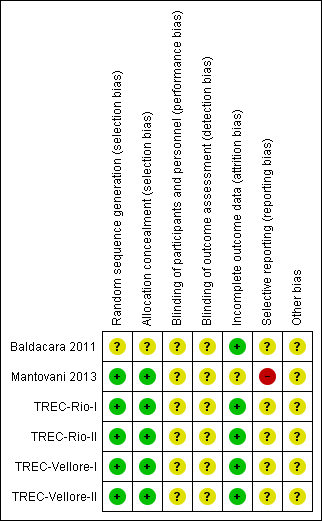
Risk of bias summary: review authors' judgements about each risk of bias item for each included study.
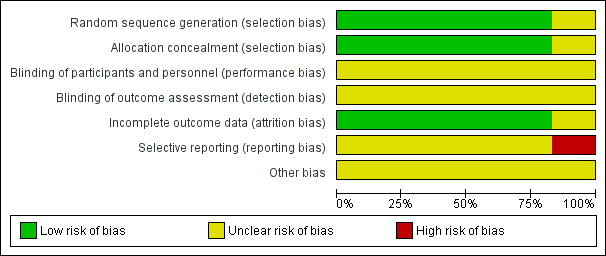
Risk of bias graph: review authors' judgements about each risk of bias item presented as percentages across all included studies.

Study flow diagram 2015 update.
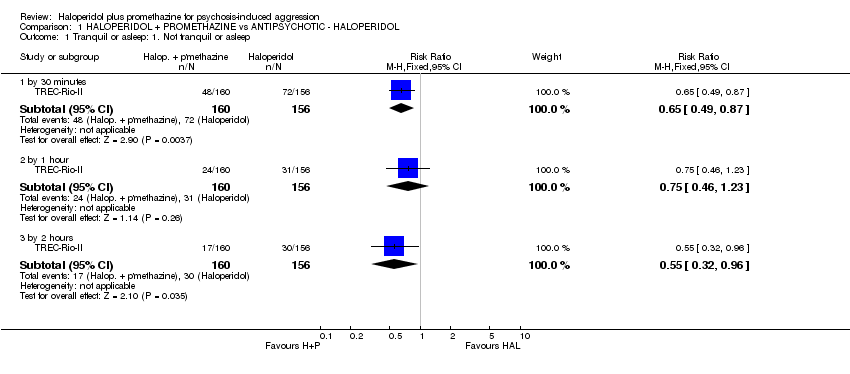
Comparison 1 HALOPERIDOL + PROMETHAZINE vs ANTIPSYCHOTIC ‐ HALOPERIDOL, Outcome 1 Tranquil or asleep: 1. Not tranquil or asleep.
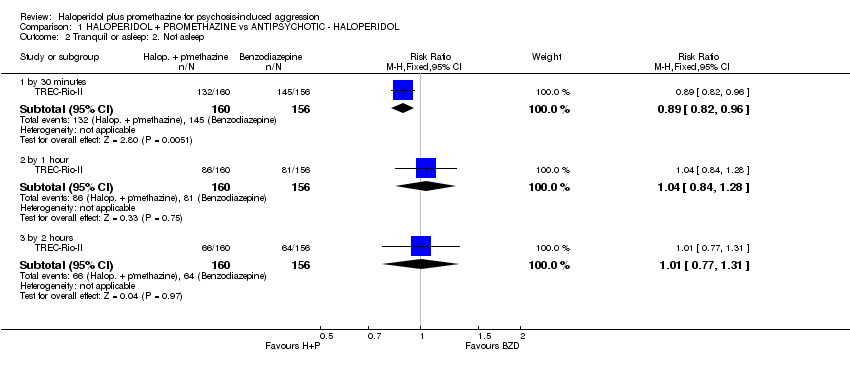
Comparison 1 HALOPERIDOL + PROMETHAZINE vs ANTIPSYCHOTIC ‐ HALOPERIDOL, Outcome 2 Tranquil or asleep: 2. Not asleep.
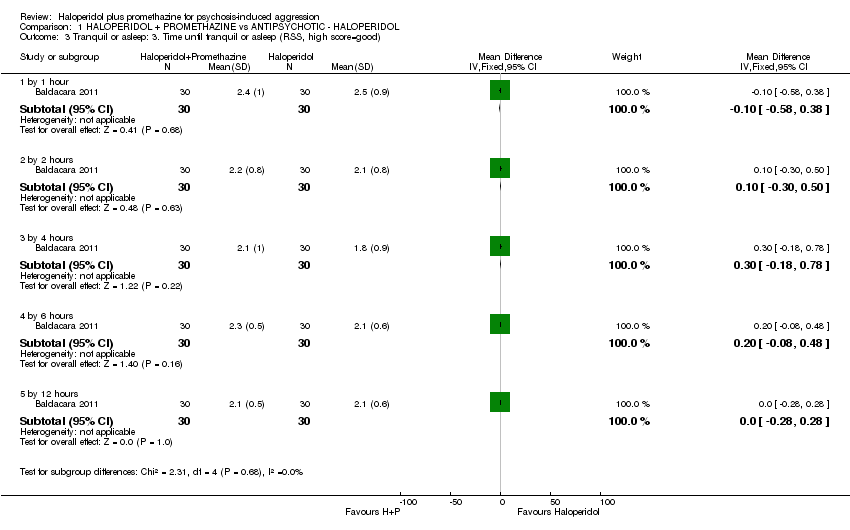
Comparison 1 HALOPERIDOL + PROMETHAZINE vs ANTIPSYCHOTIC ‐ HALOPERIDOL, Outcome 3 Tranquil or asleep: 3. Time until tranquil or asleep (RSS, high score=good).
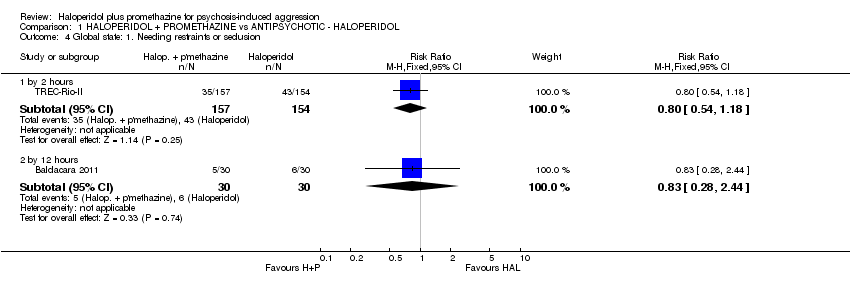
Comparison 1 HALOPERIDOL + PROMETHAZINE vs ANTIPSYCHOTIC ‐ HALOPERIDOL, Outcome 4 Global state: 1. Needing restraints or seclusion.
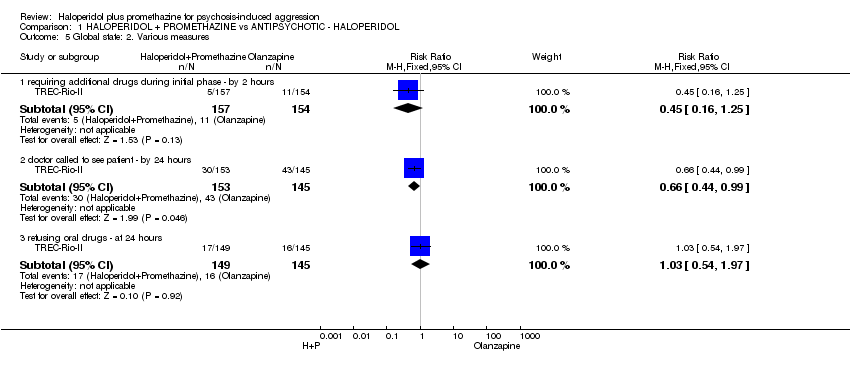
Comparison 1 HALOPERIDOL + PROMETHAZINE vs ANTIPSYCHOTIC ‐ HALOPERIDOL, Outcome 5 Global state: 2. Various measures.
| Study | Intervention | Mean | SD | Total |
| Baldacara 2011 | Haloperidol + Promethazine | 1.10 | 1.03 | 30 |
| Baldacara 2011 | Haloperidol | 1.53 | 1.19 | 30 |
Comparison 1 HALOPERIDOL + PROMETHAZINE vs ANTIPSYCHOTIC ‐ HALOPERIDOL, Outcome 6 Global state: 3. Average value of additional medication ‐ after initial dose (skewed data).
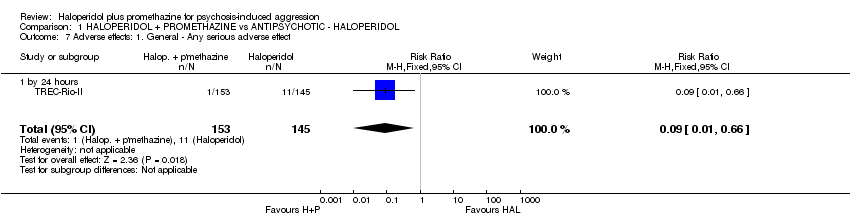
Comparison 1 HALOPERIDOL + PROMETHAZINE vs ANTIPSYCHOTIC ‐ HALOPERIDOL, Outcome 7 Adverse effects: 1. General ‐ Any serious adverse effect.

Comparison 1 HALOPERIDOL + PROMETHAZINE vs ANTIPSYCHOTIC ‐ HALOPERIDOL, Outcome 8 Adverse effects: 2. Specific ‐ a. Cardiovascular ‐ hypotension.

Comparison 1 HALOPERIDOL + PROMETHAZINE vs ANTIPSYCHOTIC ‐ HALOPERIDOL, Outcome 9 Adverse effects: 2. Specific ‐ b. Central Nervous System.

Comparison 1 HALOPERIDOL + PROMETHAZINE vs ANTIPSYCHOTIC ‐ HALOPERIDOL, Outcome 10 Adverse effects: 2. Specific ‐ c. Extrapyramidal problems.
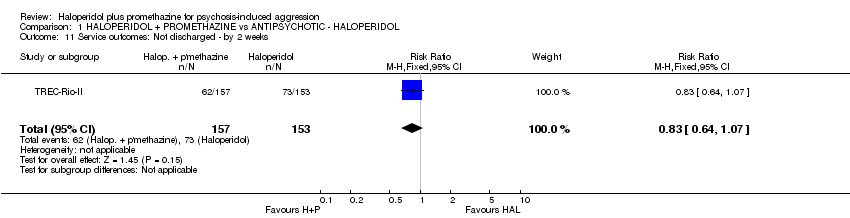
Comparison 1 HALOPERIDOL + PROMETHAZINE vs ANTIPSYCHOTIC ‐ HALOPERIDOL, Outcome 11 Service outcomes: Not discharged ‐ by 2 weeks.

Comparison 1 HALOPERIDOL + PROMETHAZINE vs ANTIPSYCHOTIC ‐ HALOPERIDOL, Outcome 12 Specific behaviour: 1. Aggression ‐ a. Other episode of agression.

Comparison 1 HALOPERIDOL + PROMETHAZINE vs ANTIPSYCHOTIC ‐ HALOPERIDOL, Outcome 13 Specific behaviour: 1. Aggression ‐ b. Average aggression score (OAS ,high score=bad).

Comparison 1 HALOPERIDOL + PROMETHAZINE vs ANTIPSYCHOTIC ‐ HALOPERIDOL, Outcome 14 Specific behaviour: 1. Aggression ‐ c. Average agitation score (OASS, high score=bad).
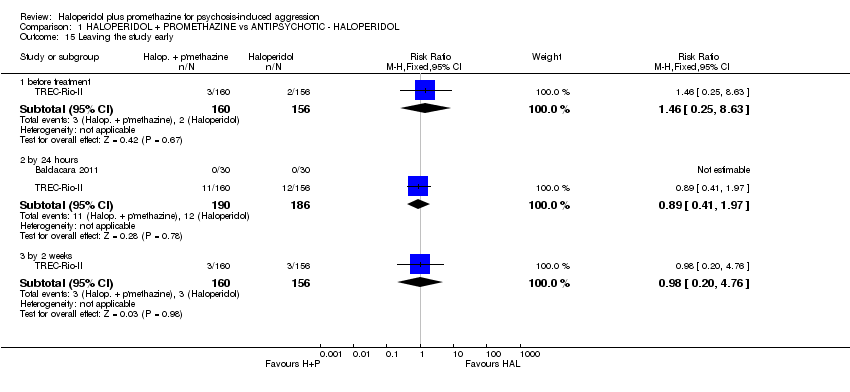
Comparison 1 HALOPERIDOL + PROMETHAZINE vs ANTIPSYCHOTIC ‐ HALOPERIDOL, Outcome 15 Leaving the study early.
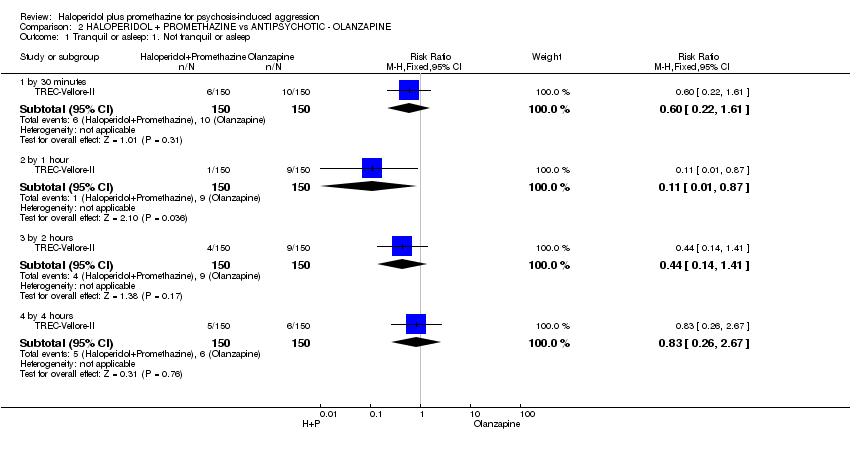
Comparison 2 HALOPERIDOL + PROMETHAZINE vs ANTIPSYCHOTIC ‐ OLANZAPINE, Outcome 1 Tranquil or asleep: 1. Not tranquil or asleep.

Comparison 2 HALOPERIDOL + PROMETHAZINE vs ANTIPSYCHOTIC ‐ OLANZAPINE, Outcome 2 Tranquil or asleep: 2. Not asleep.
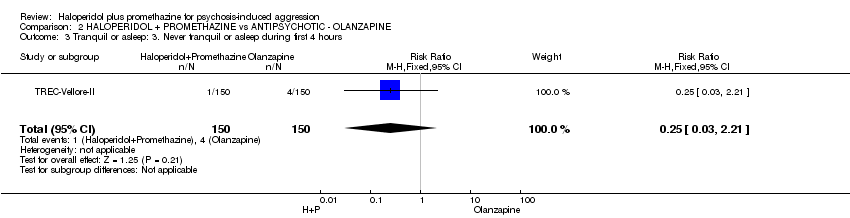
Comparison 2 HALOPERIDOL + PROMETHAZINE vs ANTIPSYCHOTIC ‐ OLANZAPINE, Outcome 3 Tranquil or asleep: 3. Never tranquil or asleep during first 4 hours.
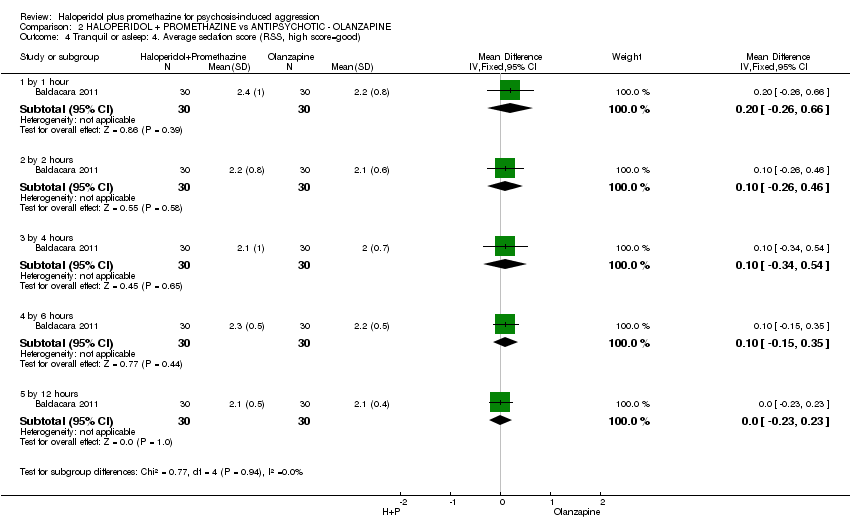
Comparison 2 HALOPERIDOL + PROMETHAZINE vs ANTIPSYCHOTIC ‐ OLANZAPINE, Outcome 4 Tranquil or asleep: 4. Average sedation score (RSS, high score=good).
| Study | Intervention | Mean (mins) | SD | N | Statistical test | p |
| time until tranquil or asleep | ||||||
| TREC‐Vellore‐II | Haloperidol + Promethazine | 12.8 | 16.7 | 150 | Mann‐Whitney U | 0.4 |
| TREC‐Vellore‐II | Olanzapine | 20.5 | 34.5 | 150 | ||
| time until asleep | ||||||
| TREC‐Vellore‐II | Haloperidol + Promethazine | 26.2 | 32.2 | 150 | Mann‐Whitney U | 0.2 |
| TREC‐Vellore‐II | Olanzapine | 34.9 | 42.2 | 150 | ||
Comparison 2 HALOPERIDOL + PROMETHAZINE vs ANTIPSYCHOTIC ‐ OLANZAPINE, Outcome 5 Tranquil or asleep: 5. Time (skewed data).
| Study | Intervention | Mean | SD | N |
| at 30 minutes | ||||
| Mantovani 2013 | Haloperidol + Promethazine | 10.9 | 6.7 | 27 |
| Mantovani 2013 | Olanzapine | 10.1 | 6.4 | 25 |
| at 60 minutes | ||||
| Mantovani 2013 | Haloperidol + Promethazine | 11.1 | 7.6 | 27 |
| Mantovani 2013 | Olanzapine | 8 | 3.8 | 25 |
| at 90 minutes | ||||
| Mantovani 2013 | Haloperidol + Promethazine | 10.7 | 6.7 | 27 |
| Mantovani 2013 | Olanzapine | 9.2 | 5.3 | 25 |
Comparison 2 HALOPERIDOL + PROMETHAZINE vs ANTIPSYCHOTIC ‐ OLANZAPINE, Outcome 6 Tranquil or asleep: 6. Effect of tranquillisation (PANSS‐EC, high=bad) (skewed data).
| Study | Intervention | Mean | SD | Nl |
| at 30 minutes | ||||
| Mantovani 2013 | Haloperidol + Promethazine | 5.2 | 8.1 | 27 |
| Mantovani 2013 | Olanzapine | 5.5 | 7.5 | 25 |
| at 90 minutes | ||||
| Mantovani 2013 | Haloperidol + Promethazine | 5.0 | 10.8 | 27 |
| Mantovani 2013 | Olanzapine | 5.8 | 10 | 25 |
Comparison 2 HALOPERIDOL + PROMETHAZINE vs ANTIPSYCHOTIC ‐ OLANZAPINE, Outcome 7 Tranquil or asleep: 7. Level of tranquillisation / agitation (ACES) (skewed data).
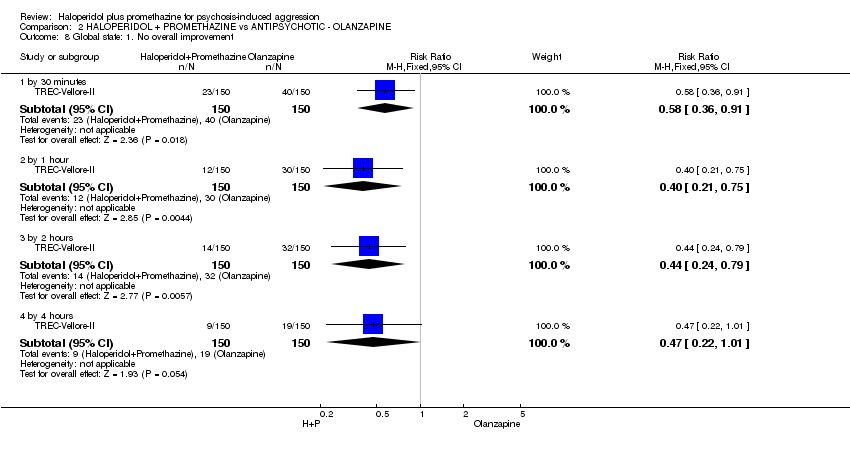
Comparison 2 HALOPERIDOL + PROMETHAZINE vs ANTIPSYCHOTIC ‐ OLANZAPINE, Outcome 8 Global state: 1. No overall improvement.

Comparison 2 HALOPERIDOL + PROMETHAZINE vs ANTIPSYCHOTIC ‐ OLANZAPINE, Outcome 9 Global state: 2. Needing restraints or seclusion.

Comparison 2 HALOPERIDOL + PROMETHAZINE vs ANTIPSYCHOTIC ‐ OLANZAPINE, Outcome 10 Global state: 3. Various measures.
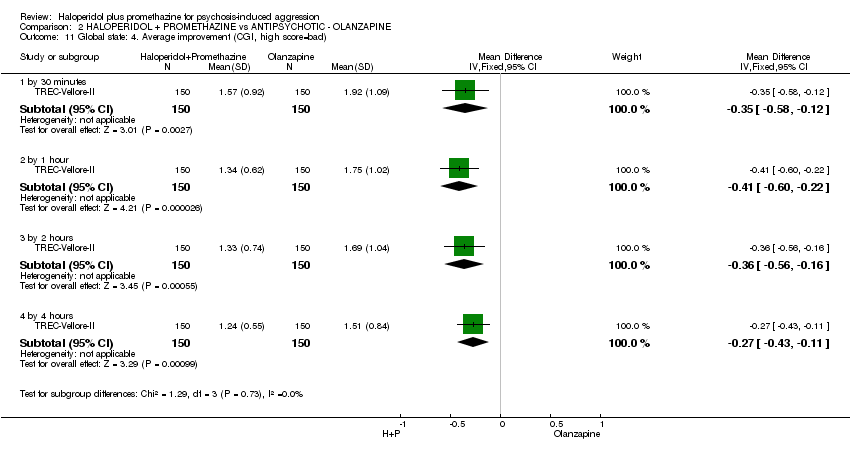
Comparison 2 HALOPERIDOL + PROMETHAZINE vs ANTIPSYCHOTIC ‐ OLANZAPINE, Outcome 11 Global state: 4. Average improvement (CGI, high score=bad).
| Study | Intervention | Mean | SD | N |
| Baldacara 2011 | Haloperidol + Promethazine | 1.10 | 1.03 | 30 |
| Baldacara 2011 | Olanzapine | 0.37 | 0.77 | 30 |
Comparison 2 HALOPERIDOL + PROMETHAZINE vs ANTIPSYCHOTIC ‐ OLANZAPINE, Outcome 12 Global state: 5. Average value of additional medication ‐ after initial dose (skewed data).
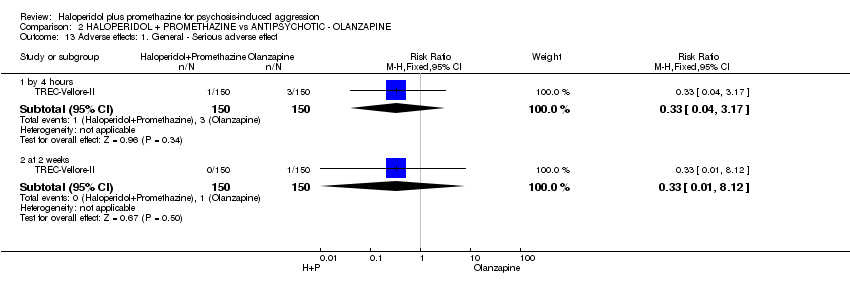
Comparison 2 HALOPERIDOL + PROMETHAZINE vs ANTIPSYCHOTIC ‐ OLANZAPINE, Outcome 13 Adverse effects: 1. General ‐ Serious adverse effect.
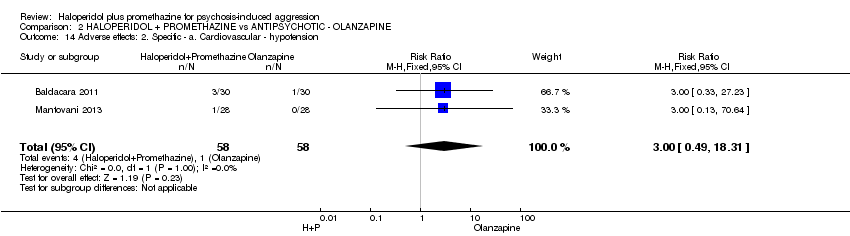
Comparison 2 HALOPERIDOL + PROMETHAZINE vs ANTIPSYCHOTIC ‐ OLANZAPINE, Outcome 14 Adverse effects: 2. Specific ‐ a. Cardiovascular ‐ hypotension.

Comparison 2 HALOPERIDOL + PROMETHAZINE vs ANTIPSYCHOTIC ‐ OLANZAPINE, Outcome 15 Adverse effects: 2. Specific ‐ b. Central Nervous System ‐ sedation ‐ excessive.
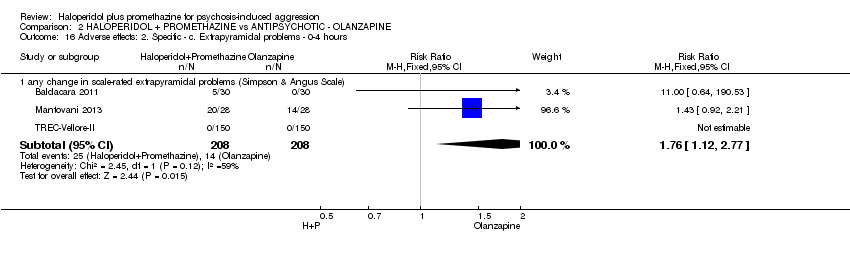
Comparison 2 HALOPERIDOL + PROMETHAZINE vs ANTIPSYCHOTIC ‐ OLANZAPINE, Outcome 16 Adverse effects: 2. Specific ‐ c. Extrapyramidal problems ‐ 0‐4 hours.

Comparison 2 HALOPERIDOL + PROMETHAZINE vs ANTIPSYCHOTIC ‐ OLANZAPINE, Outcome 17 Specific behaviour: 1. Severe agitation.
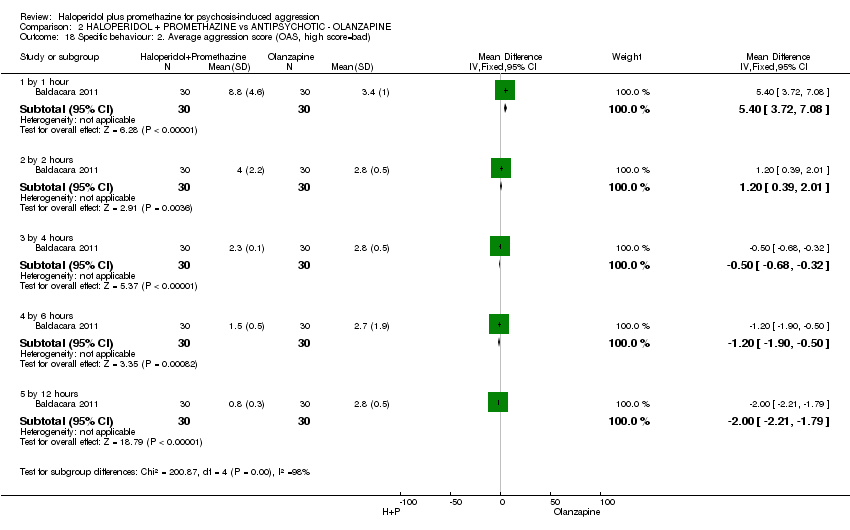
Comparison 2 HALOPERIDOL + PROMETHAZINE vs ANTIPSYCHOTIC ‐ OLANZAPINE, Outcome 18 Specific behaviour: 2. Average aggression score (OAS, high score=bad).

Comparison 2 HALOPERIDOL + PROMETHAZINE vs ANTIPSYCHOTIC ‐ OLANZAPINE, Outcome 19 Specific behaviour: 3. Average agitation score (OASS, high score=bad).

Comparison 2 HALOPERIDOL + PROMETHAZINE vs ANTIPSYCHOTIC ‐ OLANZAPINE, Outcome 20 Service outcomes.

Comparison 2 HALOPERIDOL + PROMETHAZINE vs ANTIPSYCHOTIC ‐ OLANZAPINE, Outcome 21 Leaving the study early.

Comparison 3 HALOPERIDOL + PROMETHAZINE vs ANTIPSYCHOTIC ‐ ZIPRASIDONE, Outcome 1 Tranquil or asleep: 1. Average sedation score (RSS, high score=good).
| Study | Intervention | Mean | SD | N |
| at 30 minutes | ||||
| Mantovani 2013 | Haloperidol + Promethazine | 10.9 | 6.7 | 27 |
| Mantovani 2013 | Ziprasidone | 12.6 | 9.1 | 23 |
| at 60 minutes | ||||
| Mantovani 2013 | Haloperidol + Promethazine | 11.1 | 7.6 | 27 |
| Mantovani 2013 | Ziprasidone | 10.5 | 8 | 23 |
| at 90 minutes | ||||
| Mantovani 2013 | Haloperidol + Promethazine | 10.7 | 9.2 | 27 |
| Mantovani 2013 | Ziprasidone | 11.2 | 8.3 | 23 |
Comparison 3 HALOPERIDOL + PROMETHAZINE vs ANTIPSYCHOTIC ‐ ZIPRASIDONE, Outcome 2 Tranquil or asleep: 2. Effect of tranquilisation (PANSS‐EC, high=bad) (skewed data).
| Study | Intervention | Mean | SD | N |
| at 30 minutes | ||||
| Mantovani 2013 | Haloperidol + Promethazine | 5.2 | 8.1 | 27 |
| Mantovani 2013 | Ziprasidone | 4.8 | 4.6 | 23 |
| at 90 minutes. | ||||
| Mantovani 2013 | Haloperidol + Promethazine | 5.0 | 10.8 | 27 |
| Mantovani 2013 | Ziprasidone | 5.1 | 6.9 | 23 |
Comparison 3 HALOPERIDOL + PROMETHAZINE vs ANTIPSYCHOTIC ‐ ZIPRASIDONE, Outcome 3 Tranquil or asleep: 3. Level of tranquilisation / agitation (ACES) (skewed data).
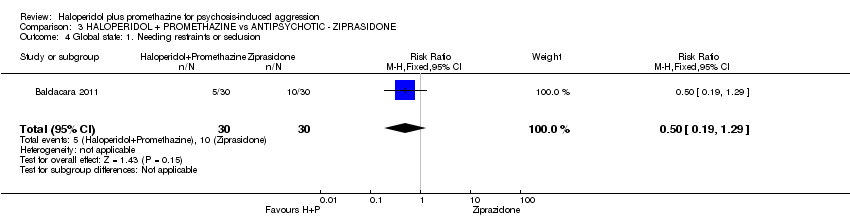
Comparison 3 HALOPERIDOL + PROMETHAZINE vs ANTIPSYCHOTIC ‐ ZIPRASIDONE, Outcome 4 Global state: 1. Needing restraints or seclusion.

Comparison 3 HALOPERIDOL + PROMETHAZINE vs ANTIPSYCHOTIC ‐ ZIPRASIDONE, Outcome 5 Global state: 2. Additional tranquillising drugs.
| Study | Intervention | Mean | SD | N |
| Baldacara 2011 | Haloperidol + Promethazine | 1.10 | 1.03 | 30 |
| Baldacara 2011 | Ziprasidone | 0.77 | 0.98 | 30 |
Comparison 3 HALOPERIDOL + PROMETHAZINE vs ANTIPSYCHOTIC ‐ ZIPRASIDONE, Outcome 6 Global state: 3. Average value of additional medication ‐ after initial dose (skewed data).
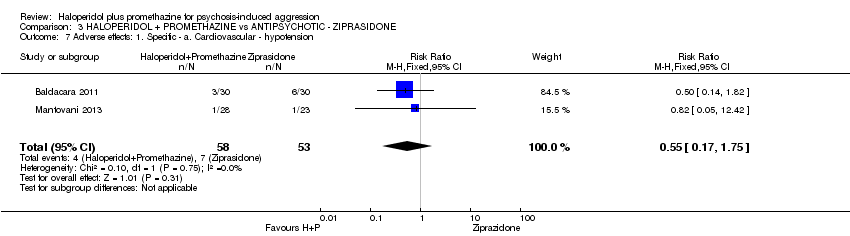
Comparison 3 HALOPERIDOL + PROMETHAZINE vs ANTIPSYCHOTIC ‐ ZIPRASIDONE, Outcome 7 Adverse effects: 1. Specific ‐ a. Cardiovascular ‐ hypotension.
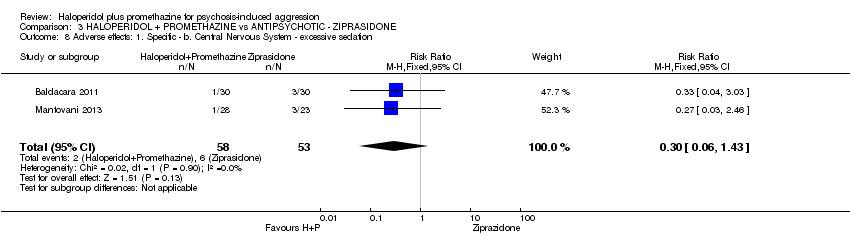
Comparison 3 HALOPERIDOL + PROMETHAZINE vs ANTIPSYCHOTIC ‐ ZIPRASIDONE, Outcome 8 Adverse effects: 1. Specific ‐ b. Central Nervous System ‐ excessive sedation.
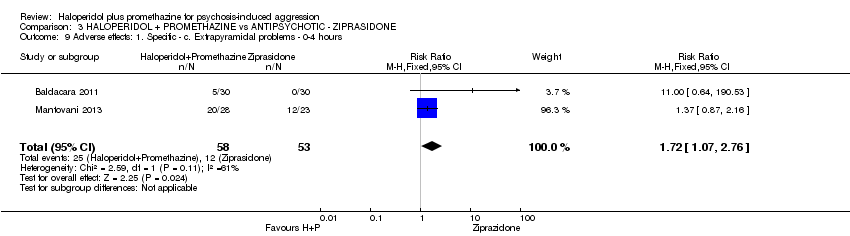
Comparison 3 HALOPERIDOL + PROMETHAZINE vs ANTIPSYCHOTIC ‐ ZIPRASIDONE, Outcome 9 Adverse effects: 1. Specific ‐ c. Extrapyramidal problems ‐ 0‐4 hours.

Comparison 3 HALOPERIDOL + PROMETHAZINE vs ANTIPSYCHOTIC ‐ ZIPRASIDONE, Outcome 10 Specific behaviour: 1. Severe agitation.

Comparison 3 HALOPERIDOL + PROMETHAZINE vs ANTIPSYCHOTIC ‐ ZIPRASIDONE, Outcome 11 Specific behaviour: 2. Average aggression score (OAS, high score=bad).
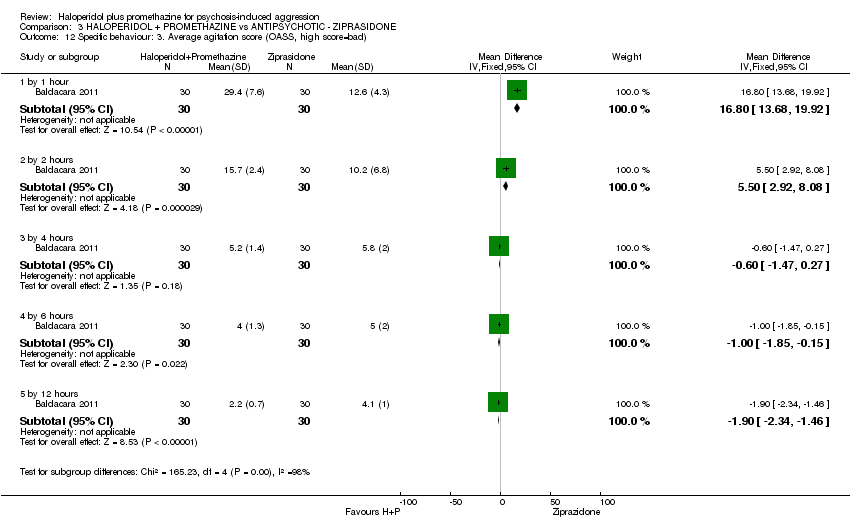
Comparison 3 HALOPERIDOL + PROMETHAZINE vs ANTIPSYCHOTIC ‐ ZIPRASIDONE, Outcome 12 Specific behaviour: 3. Average agitation score (OASS, high score=bad).

Comparison 3 HALOPERIDOL + PROMETHAZINE vs ANTIPSYCHOTIC ‐ ZIPRASIDONE, Outcome 13 Leaving the study early.

Comparison 4 HALOPERIDOL + PROMETHAZINE vs ANTIPSYCHOTIC + BENZODIAZEPINE (HALOPERIDOL + MIDAZOLAM), Outcome 1 Tranquil or asleep: 1. Average sedation score (RSS, high score=good).
| Study | Intervention | Mean | SD | N |
| at 30 minutes | ||||
| Mantovani 2013 | Haloperidol + Promethazine | 10.9 | 6.7 | 27 |
| Mantovani 2013 | Haloperidol + Midazolam | 8.7 | 4.1 | 25 |
| at 60 minutes | ||||
| Mantovani 2013 | Haloperidol + Promethazine | 11.1 | 7.6 | 27 |
| Mantovani 2013 | Haloperidol + Midazolam | 8.8 | 6.1 | 25 |
| at 90 minutes | ||||
| Mantovani 2013 | Haloperidol + Promethazine | 10.7 | 9.2 | 27 |
| Mantovani 2013 | Haloperidol + Midazolam | 9.4 | 9.4 | 25 |
Comparison 4 HALOPERIDOL + PROMETHAZINE vs ANTIPSYCHOTIC + BENZODIAZEPINE (HALOPERIDOL + MIDAZOLAM), Outcome 2 Tranquil or asleep: 2. Effect of tranquilisation (PANSS‐EC, high score=bad) (skewed data).
| Study | Intervention | Mean | SD | N |
| at 30 minutes | ||||
| Mantovani 2013 | Haloperidol + Promethazine | 5.2 | 8.1 | 27 |
| Mantovani 2013 | Haloperidol + Midazolam | 6 | 7.5 | 25 |
| at 90 minutes | ||||
| Mantovani 2013 | Haloperidol + Promethazine | 5.0 | 10.8 | 27 |
| Mantovani 2013 | Haloperidol + Midazolam | 5.8 | 12.5 | 25 |
Comparison 4 HALOPERIDOL + PROMETHAZINE vs ANTIPSYCHOTIC + BENZODIAZEPINE (HALOPERIDOL + MIDAZOLAM), Outcome 3 Tranquil or asleep: 3. Level of tranquilisation / agitation (ACES) (skewed data).

Comparison 4 HALOPERIDOL + PROMETHAZINE vs ANTIPSYCHOTIC + BENZODIAZEPINE (HALOPERIDOL + MIDAZOLAM), Outcome 4 Global state: 1. Needing restraints or seclusion.

Comparison 4 HALOPERIDOL + PROMETHAZINE vs ANTIPSYCHOTIC + BENZODIAZEPINE (HALOPERIDOL + MIDAZOLAM), Outcome 5 Global state: 2. Additional tranquilising drugs.
| Study | Intervention | Mean | SD | N |
| Baldacara 2011 | Haloperidol + Promethazine | 1.10 | 1.03 | 30 |
| Baldacara 2011 | Haloperidol + Midazolam | 1.73 | 0.87 | 30 |
Comparison 4 HALOPERIDOL + PROMETHAZINE vs ANTIPSYCHOTIC + BENZODIAZEPINE (HALOPERIDOL + MIDAZOLAM), Outcome 6 Global state: 3. Average value of additional medication ‐ after initial dose (skewed data).

Comparison 4 HALOPERIDOL + PROMETHAZINE vs ANTIPSYCHOTIC + BENZODIAZEPINE (HALOPERIDOL + MIDAZOLAM), Outcome 7 Adverse effects: 1. Specific ‐ a. Cardiovascular ‐ hypotension.
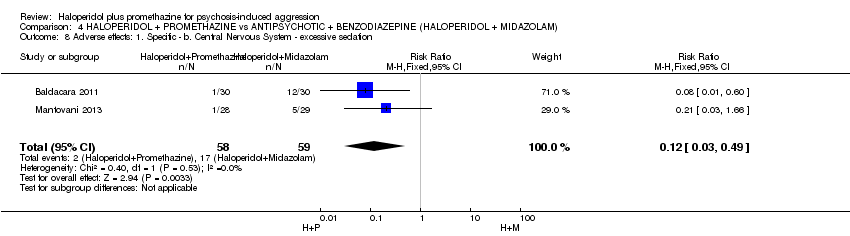
Comparison 4 HALOPERIDOL + PROMETHAZINE vs ANTIPSYCHOTIC + BENZODIAZEPINE (HALOPERIDOL + MIDAZOLAM), Outcome 8 Adverse effects: 1. Specific ‐ b. Central Nervous System ‐ excessive sedation.
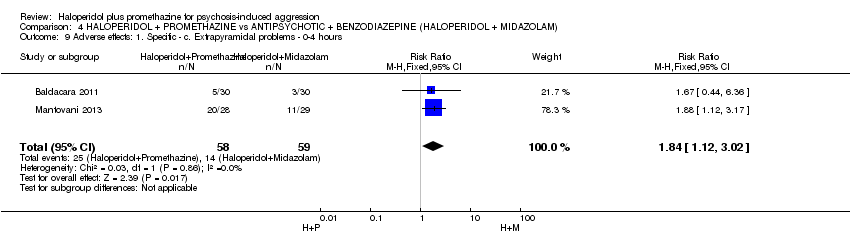
Comparison 4 HALOPERIDOL + PROMETHAZINE vs ANTIPSYCHOTIC + BENZODIAZEPINE (HALOPERIDOL + MIDAZOLAM), Outcome 9 Adverse effects: 1. Specific ‐ c. Extrapyramidal problems ‐ 0‐4 hours.

Comparison 4 HALOPERIDOL + PROMETHAZINE vs ANTIPSYCHOTIC + BENZODIAZEPINE (HALOPERIDOL + MIDAZOLAM), Outcome 10 Specific behaviour: 1. Average aggression score (OAS, high score=bad).

Comparison 4 HALOPERIDOL + PROMETHAZINE vs ANTIPSYCHOTIC + BENZODIAZEPINE (HALOPERIDOL + MIDAZOLAM), Outcome 11 Specific behaviour: 2. Average agitation score (OASS, high score=bad).

Comparison 4 HALOPERIDOL + PROMETHAZINE vs ANTIPSYCHOTIC + BENZODIAZEPINE (HALOPERIDOL + MIDAZOLAM), Outcome 12 Specific behaviour: 3. Severe agitation.

Comparison 4 HALOPERIDOL + PROMETHAZINE vs ANTIPSYCHOTIC + BENZODIAZEPINE (HALOPERIDOL + MIDAZOLAM), Outcome 13 Leaving the study early.

Comparison 5 HALOPERIDOL + PROMETHAZINE vs BENZODIAZEPINES ‐ LORAZEPAM, Outcome 1 Tranquil or asleep: 1. Not tranquil or asleep.

Comparison 5 HALOPERIDOL + PROMETHAZINE vs BENZODIAZEPINES ‐ LORAZEPAM, Outcome 2 Tranquil or asleep: 2. Not asleep.
| Study | Intervention | Mean (mins) | SD | N | Statistical test | p |
| time until tranquil or asleep | ||||||
| TREC‐Vellore‐I | Haloperidol + Promethazine | 29.7 | 35.6 | 100 | Mann‐Whitney U 327.0 | <0.001 |
| TREC‐Vellore‐I | Lorazepam | 47.8 | 46.7 | 100 | ||
| time until asleep | ||||||
| TREC‐Vellore‐I | Haloperidol + Promethazine | 37.4 | 42.9 | 100 | Mann‐Whitney U 1893.5 | <0.001 |
| TREC‐Vellore‐I | Lorazepam | 80.6 | 64.3 | 100 | ||
Comparison 5 HALOPERIDOL + PROMETHAZINE vs BENZODIAZEPINES ‐ LORAZEPAM, Outcome 3 Tranquil or asleep: 3. Time (skewed data).
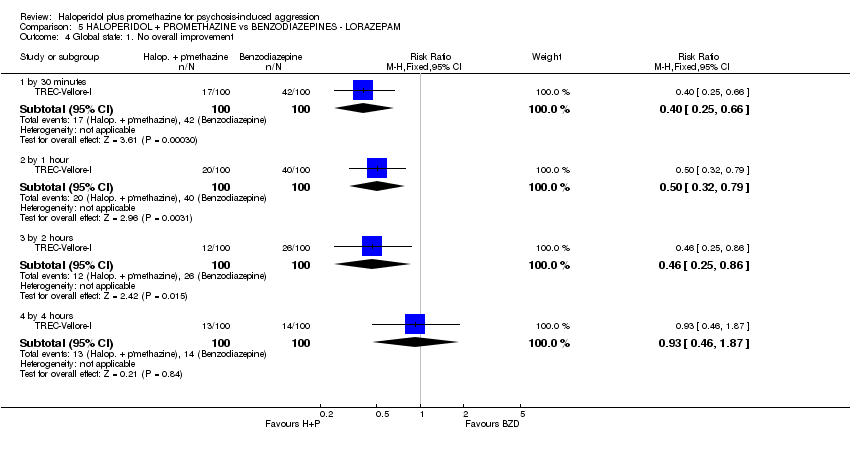
Comparison 5 HALOPERIDOL + PROMETHAZINE vs BENZODIAZEPINES ‐ LORAZEPAM, Outcome 4 Global state: 1. No overall improvement.
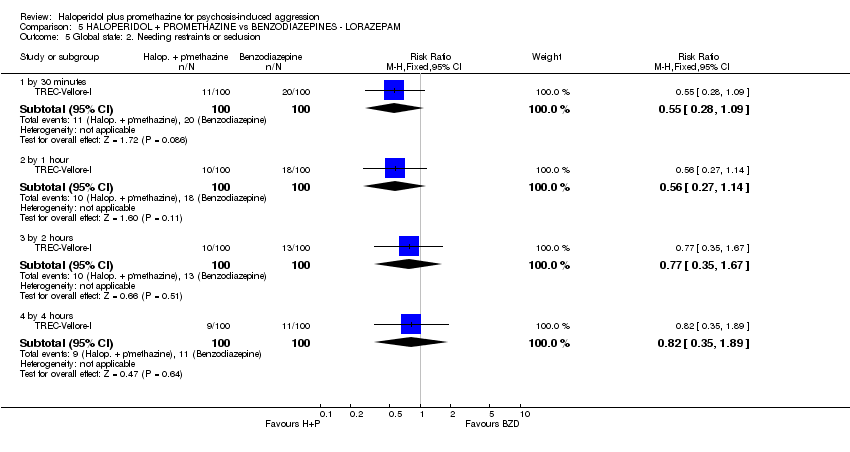
Comparison 5 HALOPERIDOL + PROMETHAZINE vs BENZODIAZEPINES ‐ LORAZEPAM, Outcome 5 Global state: 2. Needing restraints or seclusion.

Comparison 5 HALOPERIDOL + PROMETHAZINE vs BENZODIAZEPINES ‐ LORAZEPAM, Outcome 6 Global state: 3. Additional tranquillising drugs.

Comparison 5 HALOPERIDOL + PROMETHAZINE vs BENZODIAZEPINES ‐ LORAZEPAM, Outcome 7 Global state: 4. Various measures.

Comparison 5 HALOPERIDOL + PROMETHAZINE vs BENZODIAZEPINES ‐ LORAZEPAM, Outcome 8 Global state: 5. Average improvement (CGI, high score=bad) ).
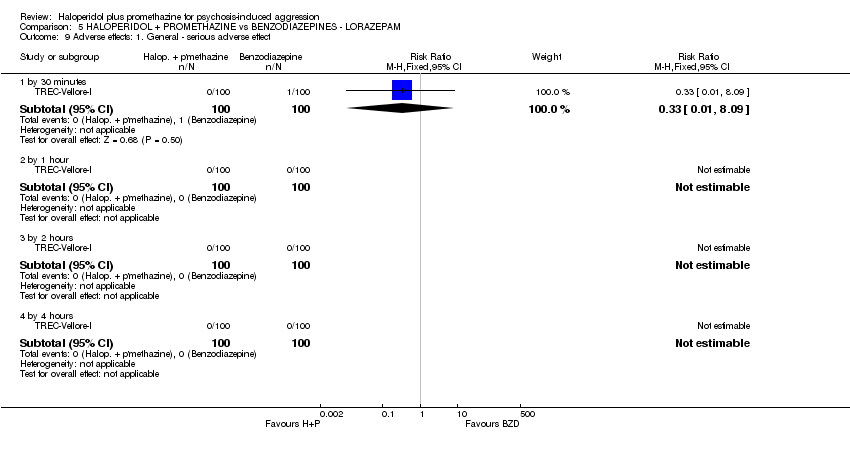
Comparison 5 HALOPERIDOL + PROMETHAZINE vs BENZODIAZEPINES ‐ LORAZEPAM, Outcome 9 Adverse effects: 1. General ‐ serious adverse effect.
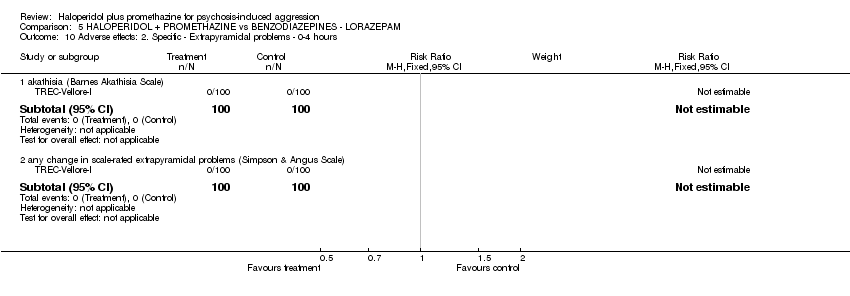
Comparison 5 HALOPERIDOL + PROMETHAZINE vs BENZODIAZEPINES ‐ LORAZEPAM, Outcome 10 Adverse effects: 2. Specific ‐ Extrapyramidal problems ‐ 0‐4 hours.
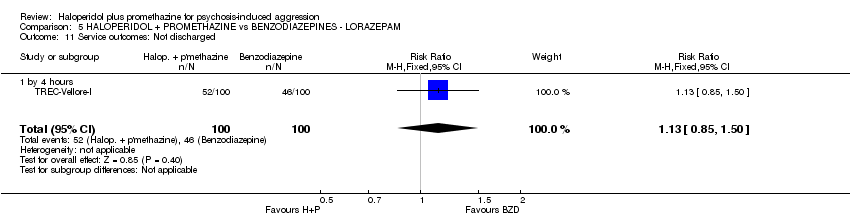
Comparison 5 HALOPERIDOL + PROMETHAZINE vs BENZODIAZEPINES ‐ LORAZEPAM, Outcome 11 Service outcomes: Not discharged.

Comparison 5 HALOPERIDOL + PROMETHAZINE vs BENZODIAZEPINES ‐ LORAZEPAM, Outcome 12 Leaving the study early.
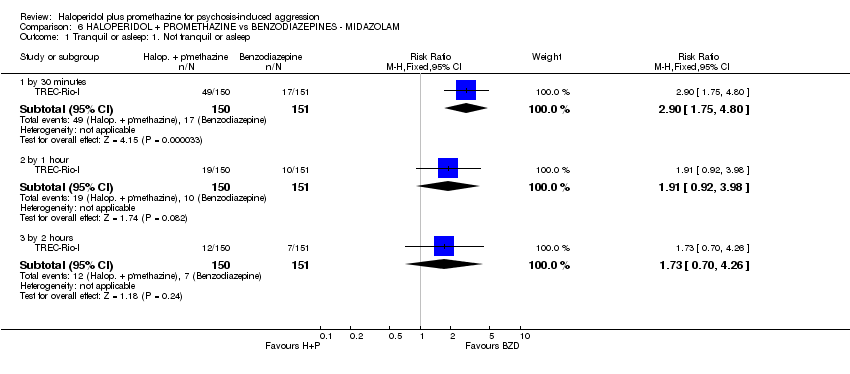
Comparison 6 HALOPERIDOL + PROMETHAZINE vs BENZODIAZEPINES ‐ MIDAZOLAM, Outcome 1 Tranquil or asleep: 1. Not tranquil or asleep.
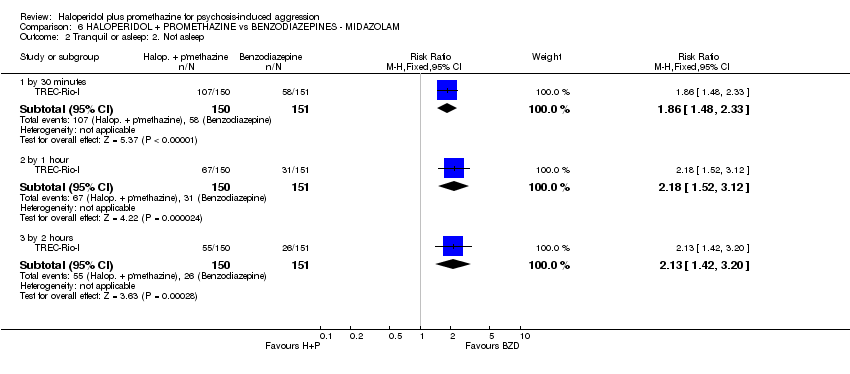
Comparison 6 HALOPERIDOL + PROMETHAZINE vs BENZODIAZEPINES ‐ MIDAZOLAM, Outcome 2 Tranquil or asleep: 2. Not asleep.
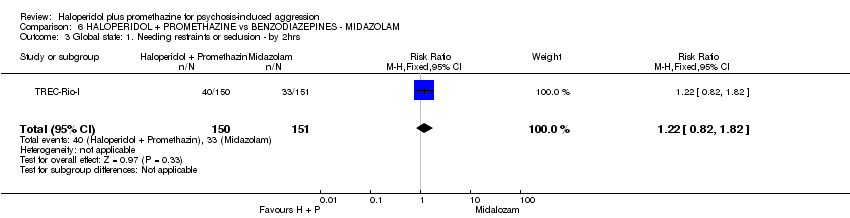
Comparison 6 HALOPERIDOL + PROMETHAZINE vs BENZODIAZEPINES ‐ MIDAZOLAM, Outcome 3 Global state: 1. Needing restraints or seclusion ‐ by 2hrs.
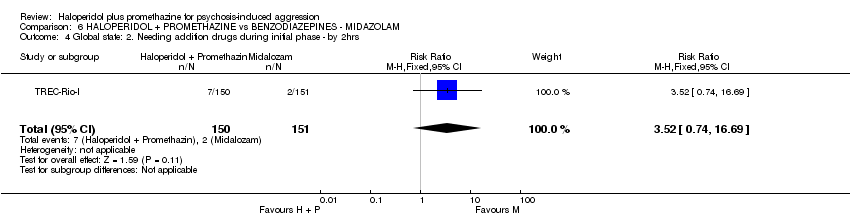
Comparison 6 HALOPERIDOL + PROMETHAZINE vs BENZODIAZEPINES ‐ MIDAZOLAM, Outcome 4 Global state: 2. Needing addition drugs during initial phase ‐ by 2hrs.

Comparison 6 HALOPERIDOL + PROMETHAZINE vs BENZODIAZEPINES ‐ MIDAZOLAM, Outcome 5 Global state: 3. Various measures.

Comparison 6 HALOPERIDOL + PROMETHAZINE vs BENZODIAZEPINES ‐ MIDAZOLAM, Outcome 6 Adverse effects: Serious adverse effect.
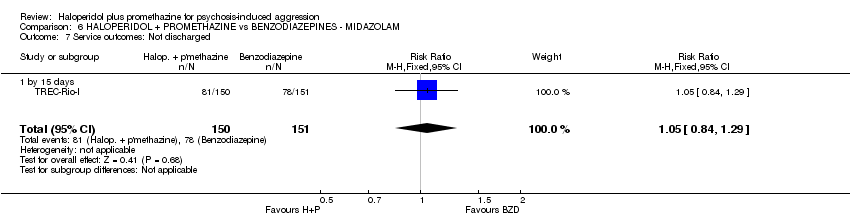
Comparison 6 HALOPERIDOL + PROMETHAZINE vs BENZODIAZEPINES ‐ MIDAZOLAM, Outcome 7 Service outcomes: Not discharged.

Comparison 6 HALOPERIDOL + PROMETHAZINE vs BENZODIAZEPINES ‐ MIDAZOLAM, Outcome 8 Specific Behaviours: 1. Aggression. a ‐ other episode of aggression ‐ by 24 hrs.

Comparison 6 HALOPERIDOL + PROMETHAZINE vs BENZODIAZEPINES ‐ MIDAZOLAM, Outcome 9 Leaving the study early.

Comparison 7 HALOPERIDOL + PROMETHAZINE vs ANTIPSYCHOTIC ‐ HALOPERIDOL ‐ additional 40 minutes data, Outcome 1 Tranquil or asleep: 1. Not tranquil or asleep.

Comparison 7 HALOPERIDOL + PROMETHAZINE vs ANTIPSYCHOTIC ‐ HALOPERIDOL ‐ additional 40 minutes data, Outcome 2 Tranquil or asleep: 2. Not asleep.
| Study tag | Participants ‐ people with schizophrenia | Relevant Cochrane reviews | ||||
| + additional problems | ‐ not specifically aggressive/agitated | ‐ aggressive/agitated | ||||
| Comparison | Comparison | |||||
| Intervention #1 | Intervention #2 | Intervention #1 | Intervention #2 | |||
| + none specified | Not applicable | Haloperidol | Haloperidol + midazolam | |||
| Olanzapine | ||||||
| Ziprasidone | ||||||
| Risperidone + lorazepam | ||||||
| Haloperidol + midazolam | Olanzapine | |||||
| Ziprasidone | ||||||
| Haloperidol + promethazine | Lorazepam | |||||
| Olanzapine | Ziprasidone | |||||
| Chlorpromazine | Phenobarbital | Not applicable | ‐ | |||
| Placebo | ||||||
| Promethazine | ‐ | |||||
| Perazine | Trimipramine | ‐ | ||||
| Phenobarbital | Placebo | ‐ | ||||
| Promethazine | Phenobarbital | ‐ | ||||
| Placebo | ‐ | |||||
| Risperidone (2 mg) | Risperidone (4 mg) | |||||
| Trifluoperazine | Placebo | |||||
| + “mental deficiency" [? learning disability] | Chlorpromazine | Periciazine | ‐ | |||
| + drug‐induced parkinsonism/EPS | Mazaticol hydrochloride | Promethazine | ‐ | |||
| Trihexyphenidyl | ‐ | |||||
| Methixene | Promethazine | ‐ | ||||
| Trihexyphenidyl | ‐ | |||||
| Piroheptine | Promethazine | ‐ | ||||
| Trihexyphenidyl | ‐ | |||||
| Procyclidine | Promethazine | |||||
| Promethazine | Placebo | ‐ | ||||
| + drug‐induced parkinsonism/EPS | Promethazine | Trihexyphenidyl | ‐ | |||
| + tardive dyskinesia | Pimozide | Placebo | ||||
| Promethazine | ‐ | |||||
| EPS: extrapyramidal symptoms | ||||||
| Methods | Allocation: randomised (clearly described). |
| Participants | Diagnosis: anyone whose aggressive behaviour is thought to be due to psychotic illness. N=300. |
| Interventions | 1. Drug intervention of choice. N=150. 2. Drug intervention of choice. N=150. Both drugs should be known to be effective, but the comparative effectiveness is unclear |
| Outcomes | Tranquil/asleep: binary outcomes, time. Behaviour: need for additional medication, additional aggressive episode. Adverse events. Acceptability of treatment. Costs: cost of services, cost of care. Service outcomes: days in hospital, discharged, transfer to secure unit |
| HALOPERIDOL + PROMETHAZINE compared to ANTIPSYCHOTIC ‐ HALOPERIDOL for psychosis‐induced aggression | ||||||
| Patient or population: people with psychosis‐induced aggression | ||||||
| Outcomes | Illustrative comparative risks* (95% CI) | Relative effect | No of Participants | Quality of the evidence | Comments | |
| Assumed risk | Corresponding risk | |||||
| ANTIPSYCHOTIC ‐ HALOPERIDOL | HALOPERIDOL + PROMETHAZINE | |||||
| Tranquil or asleep: Not tranquil or asleep ‐ by 30 minutes | Moderate1 | RR 0.65 | 316 | ⊕⊕⊕⊕ | ||
| 500 per 1000 | 325 per 1000 | |||||
| Global state: | Moderate1 | RR 0.83 | 60 | ⊕⊕⊝⊝ | ||
| 200 per 1000 | 166 per 1000 | |||||
| Adverse effects: Specific and serious adverse effects by 24 hours (not death) | Moderate1 | RR 0.95 | 298 | ⊕⊕⊝⊝ | ||
| 10 per 1000 | 9 per 1000 | |||||
| Adverse effect: Specific and serious ‐ Death | See comment | See comment | Not estimable | 0 | See comment | No study reported this outcome |
| Service outcomes: Not discharged ‐ by 2 weeks | Moderate1 | RR 0.83 | 310 | ⊕⊕⊕⊕ | ||
| 500 per 1000 | 415 per 1000 | |||||
| Specific behaviours: Average aggression score ‐ by 12 hours | The mean specific behaviours: average aggression score in the intervention groups was | 60 | ⊕⊕⊝⊝ | |||
| Economics: Costs of care | See comment | See comment | Not estimable | 0 | See comment | No study reported this outcome |
| *The basis for the assumed risk (e.g. the median control group risk across studies) is provided in footnotes. The corresponding risk (and its 95% confidence interval) is based on the assumed risk in the comparison group and the relative effect of the intervention (and its 95% CI). | ||||||
| GRADE Working Group grades of evidence | ||||||
| 1Moderate control risk approximates to that of the included trial(s). | ||||||
| HALOPERIDOL + PROMETHAZINE compared to ANTIPSYCHOTIC ‐ OLANZAPINE for psychosis‐induced aggression | ||||||
| Patient or population: people with psychosis‐induced aggression | ||||||
| Outcomes | Illustrative comparative risks* (95% CI) | Relative effect | No of Participants | Quality of the evidence | Comments | |
| Assumed risk | Corresponding risk | |||||
| ANTIPSYCHOTIC ‐ OLANZAPINE | HALOPERIDOL + PROMETHAZINE | |||||
| Tranquil or asleep: Not tranquil or asleep ‐ by 30 mins | Moderate1 | RR 0.60 | 300 | ⊕⊕⊕⊕ | ||
| 100 per 1000 | 60 per 1000 | |||||
| Global state: | Moderate | RR 5.00 | 60 | ⊕⊕⊝⊝ | ||
| 50 per 10001 | 250 per 1000 | |||||
| Adverse effects: Specific and serious adverse effects by 24 hours | Moderate | RR 0.67 | 116 | ⊕⊕⊝⊝ | ||
| 100 per 10001 | 64 per 1000 | |||||
| Adverse effect: Specific ‐ Death | See comment | See comment | Not estimable | 0 | See comment | No study reported this outcome |
| Service outcomes: Not discharged ‐ by 4 hours | Moderate | RR 0.94 | 300 | ⊕⊕⊕⊕ | ||
| 600 per 10001 | 564 per 1000 | |||||
| Specific behaviours: Average aggression score ‐ by 12 hours | The mean specific behaviours: average aggression score in the intervention groups was | 60 | ⊕⊕⊝⊝ | |||
| Economics: Costs of care7 | See comment | See comment | Not estimable | 0 | See comment | No study reported this outcome |
| *The basis for the assumed risk (e.g. the median control group risk across studies) is provided in footnotes. The corresponding risk (and its 95% confidence interval) is based on the assumed risk in the comparison group and the relative effect of the intervention (and its 95% CI). | ||||||
| GRADE Working Group grades of evidence | ||||||
| 1Moderate control risk approximates to that of the included trial(s). | ||||||
| HALOPERIDOL + PROMETHAZINE compared to ANTIPSYCHOTIC ‐ ZIPRASIDONE for psychosis‐induced aggression | ||||||
| Patient or population: people with psychosis‐induced aggression | ||||||
| Outcomes | Illustrative comparative risks* (95% CI) | Relative effect | No of Participants | Quality of the evidence | Comments | |
| Assumed risk | Corresponding risk | |||||
| ANTIPSYCHOTIC ‐ ZIPRASIDONE | HALOPERIDOL + PROMETHAZINE | |||||
| Tranquil or asleep: Average sedation score ‐ by 30 minutes | The mean tranquil or asleep: average sedation score in the intervention groups was | 60 | ⊕⊕⊝⊝ | |||
| Global state: Needing restraints or seclusion ‐ by 12 hours | Moderate | RR 0.5 | 60 | ⊕⊕⊕⊝ | ||
| 400 per 10003 | 200 per 1000 | |||||
| Adverse effects: Specific and serious adverse effect ‐ by 24 hours | Moderate | RR 0.30 | 111 | ⊕⊕⊝⊝ | ||
| 150 per 10003 | 47 per 1000 | |||||
| Adverse effect: Specific ‐ Death | See comment | See comment | Not estimable | 0 | See comment | No study reported this outcome |
| Service outcomes: Not discharged ‐ by 2 weeks | See comment | See comment | Not estimable | 0 | See comment | No study reported this outcome |
| Specific behaviours: Average aggression score ‐ by 12 hours | The mean specific behaviours: average aggression score in the intervention groups was | 60 | ⊕⊕⊕⊝ | |||
| Economics: Costs of care | See comment | See comment | Not estimable | 0 | See comment | No study reported this outcome |
| *The basis for the assumed risk (e.g. the median control group risk across studies) is provided in footnotes. The corresponding risk (and its 95% confidence interval) is based on the assumed risk in the comparison group and the relative effect of the intervention (and its 95% CI). | ||||||
| GRADE Working Group grades of evidence | ||||||
| 1Indirectness: rated 'serious' ‐ pre‐stated outcome 'Tranquil or asleep' ‐ proxy outcome used. | ||||||
| HALOPERIDOL + PROMETHAZINE compared to ANTIPSYCHOTIC & BENZODIAZEPINE ‐ HALOPERIDOL + MIDAZOLAM for psychosis‐induced aggression | ||||||
| Patient or population: people with psychosis‐induced aggression | ||||||
| Outcomes | Illustrative comparative risks* (95% CI) | Relative effect | No of Participants | Quality of the evidence | Comments | |
| Assumed risk | Corresponding risk | |||||
| ANTIPSYCHOTIC & BENZODIAZEPINE ‐ HALOPERIDOL + MIDAZOLAM | HALOPERIDOL + PROMETHAZINE | |||||
| Tranquil or asleep: Average sedation score ‐ by 1 hour | The mean tranquil or asleep: average sedation score in the intervention groups was | 60 | ⊕⊕⊝⊝ | |||
| Global state: Needing restraints or seclusion ‐ by 12 hours | Moderate | RR 0.24 | 60 | See comment | ||
| 700 per 10002 | 168 per 1000 | |||||
| Adverse effects: Specific and serious adverse effect ‐ by 24 hours | Moderate | RR 0.12 | 117 | ⊕⊕⊝⊝ | ||
| 300 per 10002 | 33 per 1000 | |||||
| Adverse effect: Specific ‐ Death | See comment | See comment | Not estimable | 0 | See comment | No study reported this outcome |
| Service outcomes: Not discharged ‐ by 2 weeks | See comment | See comment | Not estimable | 0 | See comment | No study reported this outcome |
| Specific behaviours: Average aggression score ‐ by 12 hours | The mean specific behaviours: average aggression score in the intervention groups was | 60 | See comment | |||
| Economics: Costs of care | See comment | See comment | Not estimable | 0 | See comment | No study reported this outcome |
| *The basis for the assumed risk (e.g. the median control group risk across studies) is provided in footnotes. The corresponding risk (and its 95% confidence interval) is based on the assumed risk in the comparison group and the relative effect of the intervention (and its 95% CI). | ||||||
| GRADE Working Group grades of evidence | ||||||
| 1Indirectness: rated 'serious' ‐ pre‐stated outcome 'tranquil or asleep' ‐ proxy outcome used. | ||||||
| HALOPERIDOL + PROMETHAZINE compared to BENZODIAZEPINES ‐ LORAZEPAM for psychosis‐induced aggression | ||||||
| Patient or population: people with psychosis‐induced aggression | ||||||
| Outcomes | Illustrative comparative risks* (95% CI) | Relative effect | No of Participants | Quality of the evidence | Comments | |
| Assumed risk | Corresponding risk | |||||
| BENZODIAZEPINES ‐ LORAZEPAM | HALOPERIDOL + PROMETHAZINE | |||||
| Tranquil or asleep: Not tranquil or asleep ‐ by 30 mins | Moderate | RR 0.26 | 200 | ⊕⊕⊕⊕ | ||
| 200 per 10001 | 52 per 1000 | |||||
| Global state: Needing restraints or seclusion ‐ by 12 hours | Moderate | RR 0.82 | 200 | ⊕⊕⊕⊝ | ||
| 150 per 10001 | 123 per 1000 | |||||
| Adverse effects: Specific and serious adverse effect ‐ by 24 hours | See comment | Not estimable | 0 | See comment | No study reported for this outcome | |
| Adverse effect: Specific ‐ Death | See comment | Not estimable | 0 | See comment | No study reported for this outcome | |
| Service outcomes: Not discharged ‐ by 4 hours | Moderate | RR 1.13 | 200 | ⊕⊕⊕⊕ | ||
| 500 per 10001 | 565 per 1000 | |||||
| Specific behaviours: Average aggression score | See comment | See comment | Not estimable | 0 | See comment | No study reported for this outcome |
| Economics: Costs of care | See comment | See comment | Not estimable | 0 | See comment | No study reported for this outcome |
| *The basis for the assumed risk (e.g. the median control group risk across studies) is provided in footnotes. The corresponding risk (and its 95% confidence interval) is based on the assumed risk in the comparison group and the relative effect of the intervention (and its 95% CI). | ||||||
| GRADE Working Group grades of evidence | ||||||
| 1Moderate control risk approximates to that of the included trial. | ||||||
| HALOPERIDOL + PROMETHAZINE compared to BENZODIAZEPINES ‐ MIDAZOLAM for psychosis‐induced aggression | ||||||
| Patient or population: people with psychosis‐induced aggression | ||||||
| Outcomes | Illustrative comparative risks* (95% CI) | Relative effect | No of Participants | Quality of the evidence | Comments | |
| Assumed risk | Corresponding risk | |||||
| BENZODIAZEPINES ‐ MIDAZOLAM | HALOPERIDOL + PROMETHAZINE | |||||
| Tranquil or asleep: Not tranquil or asleep | Moderate | RR 2.9 | 301 | ⊕⊕⊕⊕ | ||
| 200 per 10001 | 580 per 1000 | |||||
| Global state: Needing restraints or seclusion‐ by 2 hours | Moderate | RR 1.22 | 301 | ⊕⊕⊕⊝ | ||
| 250 per 10001 | 305 per 1000 | |||||
| Adverse effect: Specific ‐ Death | See comment | See comment | Not estimable | 0 | See comment | No study reported for this outcome |
| Service outcomes: Not discharged ‐ | Moderate | RR 1.05 | 301 | ⊕⊕⊕⊕ | ||
| 550 per 10001 | 577 per 1000 | |||||
| Specific behavioursAggression | Moderate | RR 0.89 | 301 | ⊕⊕⊕⊝ | ||
| Economics: Costs of care | See comment | See comment | Not estimable | 0 | See comment | No study reported for this outcome |
| *The basis for the assumed risk (e.g. the median control group risk across studies) is provided in footnotes. The corresponding risk (and its 95% confidence interval) is based on the assumed risk in the comparison group and the relative effect of the intervention (and its 95% CI). | ||||||
| GRADE Working Group grades of evidence | ||||||
| 1Moderate control risk approximates to that of the included trial. | ||||||
| Drug of choice | Frequency of use | mean mg (range) |
| Haloperidol + promethazine | 61% | 5 (2.5 to 10) + 50 (25 to 100) |
| Haloperidol + promethazine + diazepam | 15% | 5 (2.5 to 10) + 50 (25 to 100) + 10 |
| Diazepam | 9% | 10 |
| Haloperidol + promethazine + chlorpromazine | 7% | 5 + 50 + 25 |
| Chlorpromazine + diazepam + promethazine | 1% | 25 + 10 + 50 |
| Chlorpromazine + promethazine | 1% | 25 + 50 |
| Chlorpromazine | 1% | 25 |
| Diazepam + promethazine | 1% | 10 + 50 |
| Haloperidol + diazepam | 1% | 5 + 10 |
| Promethazine | 1% | 50 |
| Focus of review | Reference |
| Completed and maintained reviews | |
| 'As required' medication regimens for seriously mentally ill people in hospital | |
| Benzodiazepines for psychosis‐induced aggression or agitation | |
| Chlorpromazine for psychosis‐induced aggression or agitation | |
| Clotiapine for acute psychotic illnesses | |
| Containment strategies for people with serious mental illness | |
| Droperidol for acute psychosis | |
| Haloperidol for psychosis‐induced aggression or agitation (rapid tranquillisation) | |
| Olanzapine IM or velotab for acutely disturbed/agitated people with suspected serious mental illnesses | |
| Seclusion and restraint for serious mental illnesses | |
| Zuclopenthixol acetate for acute schizophrenia and similar serious mental illnesses | |
| Reviews in the process of being completed | |
| Risperidone for psychosis‐induced aggression or agitation | |
| Haloperidol for long‐term aggression in psychosis | |
| Loxapine inhaler for psychosis‐induced aggression | |
| Clozapine for people with schizophrenia and recurrent physical aggression | |
| Quetiapine for psychosis‐induced aggression or agitation | |
| De‐escalation techniques for psychosis‐induced aggression | |
| Outcome or subgroup title | No. of studies | No. of participants | Statistical method | Effect size |
| 1 Tranquil or asleep: 1. Not tranquil or asleep Show forest plot | 1 | Risk Ratio (M‐H, Fixed, 95% CI) | Subtotals only | |
| 1.1 by 30 minutes | 1 | 316 | Risk Ratio (M‐H, Fixed, 95% CI) | 0.65 [0.49, 0.87] |
| 1.2 by 1 hour | 1 | 316 | Risk Ratio (M‐H, Fixed, 95% CI) | 0.75 [0.46, 1.23] |
| 1.3 by 2 hours | 1 | 316 | Risk Ratio (M‐H, Fixed, 95% CI) | 0.55 [0.32, 0.96] |
| 2 Tranquil or asleep: 2. Not asleep Show forest plot | 1 | Risk Ratio (M‐H, Fixed, 95% CI) | Subtotals only | |
| 2.1 by 30 minutes | 1 | 316 | Risk Ratio (M‐H, Fixed, 95% CI) | 0.89 [0.82, 0.96] |
| 2.2 by 1 hour | 1 | 316 | Risk Ratio (M‐H, Fixed, 95% CI) | 1.04 [0.84, 1.28] |
| 2.3 by 2 hours | 1 | 316 | Risk Ratio (M‐H, Fixed, 95% CI) | 1.01 [0.77, 1.31] |
| 3 Tranquil or asleep: 3. Time until tranquil or asleep (RSS, high score=good) Show forest plot | 1 | Mean Difference (IV, Fixed, 95% CI) | Subtotals only | |
| 3.1 by 1 hour | 1 | 60 | Mean Difference (IV, Fixed, 95% CI) | ‐0.10 [‐0.58, 0.38] |
| 3.2 by 2 hours | 1 | 60 | Mean Difference (IV, Fixed, 95% CI) | 0.10 [‐0.30, 0.50] |
| 3.3 by 4 hours | 1 | 60 | Mean Difference (IV, Fixed, 95% CI) | 0.30 [‐0.18, 0.78] |
| 3.4 by 6 hours | 1 | 60 | Mean Difference (IV, Fixed, 95% CI) | 0.20 [‐0.08, 0.48] |
| 3.5 by 12 hours | 1 | 60 | Mean Difference (IV, Fixed, 95% CI) | 0.0 [‐0.28, 0.28] |
| 4 Global state: 1. Needing restraints or seclusion Show forest plot | 2 | Risk Ratio (M‐H, Fixed, 95% CI) | Subtotals only | |
| 4.1 by 2 hours | 1 | 311 | Risk Ratio (M‐H, Fixed, 95% CI) | 0.80 [0.54, 1.18] |
| 4.2 by 12 hours | 1 | 60 | Risk Ratio (M‐H, Fixed, 95% CI) | 0.83 [0.28, 2.44] |
| 5 Global state: 2. Various measures Show forest plot | 1 | Risk Ratio (M‐H, Fixed, 95% CI) | Subtotals only | |
| 5.1 requiring additional drugs during initial phase ‐ by 2 hours | 1 | 311 | Risk Ratio (M‐H, Fixed, 95% CI) | 0.45 [0.16, 1.25] |
| 5.2 doctor called to see patient ‐ by 24 hours | 1 | 298 | Risk Ratio (M‐H, Fixed, 95% CI) | 0.66 [0.44, 0.99] |
| 5.3 refusing oral drugs ‐ at 24 hours | 1 | 294 | Risk Ratio (M‐H, Fixed, 95% CI) | 1.03 [0.54, 1.97] |
| 6 Global state: 3. Average value of additional medication ‐ after initial dose (skewed data) Show forest plot | Other data | No numeric data | ||
| 7 Adverse effects: 1. General ‐ Any serious adverse effect Show forest plot | 1 | 298 | Risk Ratio (M‐H, Fixed, 95% CI) | 0.09 [0.01, 0.66] |
| 7.1 by 24 hours | 1 | 298 | Risk Ratio (M‐H, Fixed, 95% CI) | 0.09 [0.01, 0.66] |
| 8 Adverse effects: 2. Specific ‐ a. Cardiovascular ‐ hypotension Show forest plot | 1 | 60 | Risk Ratio (M‐H, Fixed, 95% CI) | 7.0 [0.38, 129.93] |
| 9 Adverse effects: 2. Specific ‐ b. Central Nervous System Show forest plot | 2 | Risk Ratio (M‐H, Fixed, 95% CI) | Subtotals only | |
| 9.1 seizure ‐ by 24 hours | 1 | 298 | Risk Ratio (M‐H, Fixed, 95% CI) | 0.95 [0.06, 15.01] |
| 9.2 sedation ‐ excessive | 1 | 60 | Risk Ratio (M‐H, Fixed, 95% CI) | 0.33 [0.04, 3.03] |
| 10 Adverse effects: 2. Specific ‐ c. Extrapyramidal problems Show forest plot | 2 | 358 | Risk Ratio (M‐H, Fixed, 95% CI) | 0.35 [0.14, 0.88] |
| 10.1 acute dystonia ‐ by 24 hours | 1 | 298 | Risk Ratio (M‐H, Fixed, 95% CI) | 0.05 [0.00, 0.76] |
| 10.2 extrapyramidal problems (unspecified) ‐ 0‐4 hours | 1 | 60 | Risk Ratio (M‐H, Fixed, 95% CI) | 1.0 [0.32, 3.10] |
| 11 Service outcomes: Not discharged ‐ by 2 weeks Show forest plot | 1 | 310 | Risk Ratio (M‐H, Fixed, 95% CI) | 0.83 [0.64, 1.07] |
| 12 Specific behaviour: 1. Aggression ‐ a. Other episode of agression Show forest plot | 1 | Risk Ratio (M‐H, Fixed, 95% CI) | Subtotals only | |
| 12.1 other episode of aggression ‐ by 24 hours | 1 | 298 | Risk Ratio (M‐H, Fixed, 95% CI) | 1.17 [0.68, 2.01] |
| 13 Specific behaviour: 1. Aggression ‐ b. Average aggression score (OAS ,high score=bad) Show forest plot | 1 | Mean Difference (IV, Fixed, 95% CI) | Subtotals only | |
| 13.1 by 1 hour | 1 | 60 | Mean Difference (IV, Fixed, 95% CI) | 4.50 [2.72, 6.28] |
| 13.2 by 2 hours | 1 | 60 | Mean Difference (IV, Fixed, 95% CI) | 0.70 [‐0.49, 1.89] |
| 13.3 by 4 hours | 1 | 60 | Mean Difference (IV, Fixed, 95% CI) | ‐0.60 [‐0.71, ‐0.49] |
| 13.4 by 6 hours | 1 | 60 | Mean Difference (IV, Fixed, 95% CI) | ‐1.1 [‐1.29, ‐0.91] |
| 13.5 by 12 hours | 1 | 60 | Mean Difference (IV, Fixed, 95% CI) | ‐1.8 [‐1.93, ‐1.67] |
| 14 Specific behaviour: 1. Aggression ‐ c. Average agitation score (OASS, high score=bad) Show forest plot | 1 | Mean Difference (IV, Fixed, 95% CI) | Subtotals only | |
| 14.1 by 1 hour | 1 | 60 | Mean Difference (IV, Fixed, 95% CI) | 24.5 [21.68, 27.32] |
| 14.2 by 2 hours | 1 | 60 | Mean Difference (IV, Fixed, 95% CI) | 9.40 [8.41, 10.39] |
| 14.3 by 4 hours | 1 | 60 | Mean Difference (IV, Fixed, 95% CI) | 3.80 [3.27, 4.33] |
| 14.4 by 6 hours | 1 | 60 | Mean Difference (IV, Fixed, 95% CI) | 2.6 [2.13, 3.07] |
| 14.5 by 12 hours | 1 | 60 | Mean Difference (IV, Fixed, 95% CI) | 0.80 [0.55, 1.05] |
| 15 Leaving the study early Show forest plot | 2 | Risk Ratio (M‐H, Fixed, 95% CI) | Subtotals only | |
| 15.1 before treatment | 1 | 316 | Risk Ratio (M‐H, Fixed, 95% CI) | 1.46 [0.25, 8.63] |
| 15.2 by 24 hours | 2 | 376 | Risk Ratio (M‐H, Fixed, 95% CI) | 0.89 [0.41, 1.97] |
| 15.3 by 2 weeks | 1 | 316 | Risk Ratio (M‐H, Fixed, 95% CI) | 0.98 [0.20, 4.76] |
| Outcome or subgroup title | No. of studies | No. of participants | Statistical method | Effect size |
| 1 Tranquil or asleep: 1. Not tranquil or asleep Show forest plot | 1 | Risk Ratio (M‐H, Fixed, 95% CI) | Subtotals only | |
| 1.1 by 30 minutes | 1 | 300 | Risk Ratio (M‐H, Fixed, 95% CI) | 0.6 [0.22, 1.61] |
| 1.2 by 1 hour | 1 | 300 | Risk Ratio (M‐H, Fixed, 95% CI) | 0.11 [0.01, 0.87] |
| 1.3 by 2 hours | 1 | 300 | Risk Ratio (M‐H, Fixed, 95% CI) | 0.44 [0.14, 1.41] |
| 1.4 by 4 hours | 1 | 300 | Risk Ratio (M‐H, Fixed, 95% CI) | 0.83 [0.26, 2.67] |
| 2 Tranquil or asleep: 2. Not asleep Show forest plot | 1 | Risk Ratio (M‐H, Fixed, 95% CI) | Subtotals only | |
| 2.1 by 30 minutes | 1 | 300 | Risk Ratio (M‐H, Fixed, 95% CI) | 0.65 [0.46, 0.93] |
| 2.2 by 1 hour | 1 | 300 | Risk Ratio (M‐H, Fixed, 95% CI) | 0.59 [0.40, 0.87] |
| 2.3 by 2 hours | 1 | 300 | Risk Ratio (M‐H, Fixed, 95% CI) | 0.24 [0.14, 0.41] |
| 2.4 by 4 hours | 1 | 300 | Risk Ratio (M‐H, Fixed, 95% CI) | 0.61 [0.44, 0.86] |
| 3 Tranquil or asleep: 3. Never tranquil or asleep during first 4 hours Show forest plot | 1 | 300 | Risk Ratio (M‐H, Fixed, 95% CI) | 0.25 [0.03, 2.21] |
| 4 Tranquil or asleep: 4. Average sedation score (RSS, high score=good) Show forest plot | 1 | Mean Difference (IV, Fixed, 95% CI) | Subtotals only | |
| 4.1 by 1 hour | 1 | 60 | Mean Difference (IV, Fixed, 95% CI) | 0.20 [‐0.26, 0.66] |
| 4.2 by 2 hours | 1 | 60 | Mean Difference (IV, Fixed, 95% CI) | 0.10 [‐0.26, 0.46] |
| 4.3 by 4 hours | 1 | 60 | Mean Difference (IV, Fixed, 95% CI) | 0.10 [‐0.34, 0.54] |
| 4.4 by 6 hours | 1 | 60 | Mean Difference (IV, Fixed, 95% CI) | 0.10 [‐0.15, 0.35] |
| 4.5 by 12 hours | 1 | 60 | Mean Difference (IV, Fixed, 95% CI) | 0.0 [‐0.23, 0.23] |
| 5 Tranquil or asleep: 5. Time (skewed data) Show forest plot | Other data | No numeric data | ||
| 5.1 time until tranquil or asleep | Other data | No numeric data | ||
| 5.2 time until asleep | Other data | No numeric data | ||
| 6 Tranquil or asleep: 6. Effect of tranquillisation (PANSS‐EC, high=bad) (skewed data) Show forest plot | Other data | No numeric data | ||
| 6.1 at 30 minutes | Other data | No numeric data | ||
| 6.2 at 60 minutes | Other data | No numeric data | ||
| 6.3 at 90 minutes | Other data | No numeric data | ||
| 7 Tranquil or asleep: 7. Level of tranquillisation / agitation (ACES) (skewed data) Show forest plot | Other data | No numeric data | ||
| 7.1 at 30 minutes | Other data | No numeric data | ||
| 7.3 at 90 minutes | Other data | No numeric data | ||
| 8 Global state: 1. No overall improvement Show forest plot | 1 | Risk Ratio (M‐H, Fixed, 95% CI) | Subtotals only | |
| 8.1 by 30 minutes | 1 | 300 | Risk Ratio (M‐H, Fixed, 95% CI) | 0.58 [0.36, 0.91] |
| 8.2 by 1 hour | 1 | 300 | Risk Ratio (M‐H, Fixed, 95% CI) | 0.4 [0.21, 0.75] |
| 8.3 by 2 hours | 1 | 300 | Risk Ratio (M‐H, Fixed, 95% CI) | 0.44 [0.24, 0.79] |
| 8.4 by 4 hours | 1 | 300 | Risk Ratio (M‐H, Fixed, 95% CI) | 0.47 [0.22, 1.01] |
| 9 Global state: 2. Needing restraints or seclusion Show forest plot | 2 | Risk Ratio (M‐H, Fixed, 95% CI) | Subtotals only | |
| 9.1 by 30 minutes | 1 | 300 | Risk Ratio (M‐H, Fixed, 95% CI) | 1.02 [0.71, 1.47] |
| 9.2 by 1 hour | 1 | 300 | Risk Ratio (M‐H, Fixed, 95% CI) | 0.97 [0.66, 1.44] |
| 9.3 by 2 hours | 1 | 300 | Risk Ratio (M‐H, Fixed, 95% CI) | 0.79 [0.51, 1.25] |
| 9.4 by 4 hours | 1 | 300 | Risk Ratio (M‐H, Fixed, 95% CI) | 0.63 [0.34, 1.14] |
| 9.5 by 12 hours | 1 | 60 | Risk Ratio (M‐H, Fixed, 95% CI) | 5.0 [0.62, 40.28] |
| 10 Global state: 3. Various measures Show forest plot | 2 | Risk Ratio (M‐H, Fixed, 95% CI) | Subtotals only | |
| 10.1 requiring additional drugs during initial phase ‐ by 4 hours | 2 | 356 | Risk Ratio (M‐H, Fixed, 95% CI) | 0.52 [0.37, 0.74] |
| 10.2 requiring further observation ‐ by 4 hours | 1 | 300 | Risk Ratio (M‐H, Fixed, 95% CI) | 1.17 [0.80, 1.71] |
| 10.3 doctor called to see patient ‐ by 4 hours | 1 | 300 | Risk Ratio (M‐H, Fixed, 95% CI) | 0.47 [0.30, 0.73] |
| 10.4 taking oral drugs ‐ at 2 weeks | 1 | 300 | Risk Ratio (M‐H, Fixed, 95% CI) | 0.96 [0.89, 1.04] |
| 11 Global state: 4. Average improvement (CGI, high score=bad) Show forest plot | 1 | Mean Difference (IV, Fixed, 95% CI) | Subtotals only | |
| 11.1 by 30 minutes | 1 | 300 | Mean Difference (IV, Fixed, 95% CI) | ‐0.35 [‐0.58, ‐0.12] |
| 11.2 by 1 hour | 1 | 300 | Mean Difference (IV, Fixed, 95% CI) | ‐0.41 [‐0.60, ‐0.22] |
| 11.3 by 2 hours | 1 | 300 | Mean Difference (IV, Fixed, 95% CI) | ‐0.36 [‐0.56, ‐0.16] |
| 11.4 by 4 hours | 1 | 300 | Mean Difference (IV, Fixed, 95% CI) | ‐0.27 [‐0.43, ‐0.11] |
| 12 Global state: 5. Average value of additional medication ‐ after initial dose (skewed data) Show forest plot | Other data | No numeric data | ||
| 13 Adverse effects: 1. General ‐ Serious adverse effect Show forest plot | 1 | Risk Ratio (M‐H, Fixed, 95% CI) | Subtotals only | |
| 13.1 by 4 hours | 1 | 300 | Risk Ratio (M‐H, Fixed, 95% CI) | 0.33 [0.04, 3.17] |
| 13.2 at 2 weeks | 1 | 300 | Risk Ratio (M‐H, Fixed, 95% CI) | 0.33 [0.01, 8.12] |
| 14 Adverse effects: 2. Specific ‐ a. Cardiovascular ‐ hypotension Show forest plot | 2 | 116 | Risk Ratio (M‐H, Fixed, 95% CI) | 3.0 [0.49, 18.31] |
| 15 Adverse effects: 2. Specific ‐ b. Central Nervous System ‐ sedation ‐ excessive Show forest plot | 2 | 116 | Risk Ratio (M‐H, Fixed, 95% CI) | 0.67 [0.12, 3.84] |
| 16 Adverse effects: 2. Specific ‐ c. Extrapyramidal problems ‐ 0‐4 hours Show forest plot | 3 | Risk Ratio (M‐H, Fixed, 95% CI) | Subtotals only | |
| 16.1 any change in scale‐rated extrapyramidal problems (Simpson & Angus Scale) | 3 | 416 | Risk Ratio (M‐H, Fixed, 95% CI) | 1.76 [1.12, 2.77] |
| 17 Specific behaviour: 1. Severe agitation Show forest plot | 1 | 56 | Risk Ratio (M‐H, Fixed, 95% CI) | 7.0 [0.38, 129.55] |
| 18 Specific behaviour: 2. Average aggression score (OAS, high score=bad) Show forest plot | 1 | Mean Difference (IV, Fixed, 95% CI) | Subtotals only | |
| 18.1 by 1 hour | 1 | 60 | Mean Difference (IV, Fixed, 95% CI) | 5.4 [3.72, 7.08] |
| 18.2 by 2 hours | 1 | 60 | Mean Difference (IV, Fixed, 95% CI) | 1.20 [0.39, 2.01] |
| 18.3 by 4 hours | 1 | 60 | Mean Difference (IV, Fixed, 95% CI) | ‐0.5 [‐0.68, ‐0.32] |
| 18.4 by 6 hours | 1 | 60 | Mean Difference (IV, Fixed, 95% CI) | ‐1.20 [‐1.90, ‐0.50] |
| 18.5 by 12 hours | 1 | 60 | Mean Difference (IV, Fixed, 95% CI) | 0.00 [‐2.21, ‐1.79] |
| 19 Specific behaviour: 3. Average agitation score (OASS, high score=bad) Show forest plot | 1 | Mean Difference (IV, Fixed, 95% CI) | Subtotals only | |
| 19.1 by 1 hour | 1 | 60 | Mean Difference (IV, Fixed, 95% CI) | 26.5 [23.76, 29.24] |
| 19.2 by 2 hours | 1 | 60 | Mean Difference (IV, Fixed, 95% CI) | 13.6 [12.64, 14.56] |
| 19.3 by 4 hours | 1 | 60 | Mean Difference (IV, Fixed, 95% CI) | 4.0 [3.47, 4.53] |
| 19.4 by 6 hours | 1 | 60 | Mean Difference (IV, Fixed, 95% CI) | 2.8 [2.31, 3.29] |
| 19.5 by 12 hours | 1 | 60 | Mean Difference (IV, Fixed, 95% CI) | 1.70 [1.44, 1.96] |
| 20 Service outcomes Show forest plot | 1 | Risk Ratio (M‐H, Fixed, 95% CI) | Subtotals only | |
| 20.1 admitted ‐ by 4 hours | 1 | 300 | Risk Ratio (M‐H, Fixed, 95% CI) | 0.81 [0.56, 1.16] |
| 20.2 not discharged ‐ by 4 hours | 1 | 300 | Risk Ratio (M‐H, Fixed, 95% CI) | 0.94 [0.77, 1.16] |
| 21 Leaving the study early Show forest plot | 3 | Risk Ratio (M‐H, Fixed, 95% CI) | Subtotals only | |
| 21.1 by 30 minutes | 1 | 300 | Risk Ratio (M‐H, Fixed, 95% CI) | 0.33 [0.01, 8.12] |
| 21.2 by 2 hours | 1 | 300 | Risk Ratio (M‐H, Fixed, 95% CI) | 0.14 [0.01, 2.74] |
| 21.3 by 4 hours | 1 | 300 | Risk Ratio (M‐H, Fixed, 95% CI) | 0.09 [0.01, 1.63] |
| 21.4 by 24 hours | 2 | 116 | Risk Ratio (M‐H, Fixed, 95% CI) | 0.33 [0.04, 3.01] |
| 21.5 by 2 weeks | 1 | 300 | Risk Ratio (M‐H, Fixed, 95% CI) | 0.71 [0.33, 1.56] |
| Outcome or subgroup title | No. of studies | No. of participants | Statistical method | Effect size |
| 1 Tranquil or asleep: 1. Average sedation score (RSS, high score=good) Show forest plot | 1 | Mean Difference (IV, Fixed, 95% CI) | Subtotals only | |
| 1.1 by 1 hour | 1 | 60 | Mean Difference (IV, Fixed, 95% CI) | ‐0.10 [‐0.58, 0.38] |
| 1.2 by 2 hours | 1 | 60 | Mean Difference (IV, Fixed, 95% CI) | 0.10 [‐0.36, 0.56] |
| 1.3 by 4 hours | 1 | 60 | Mean Difference (IV, Fixed, 95% CI) | ‐0.10 [‐0.56, 0.36] |
| 1.4 by 6 hours | 1 | 60 | Mean Difference (IV, Fixed, 95% CI) | 0.10 [‐0.18, 0.38] |
| 1.5 by 12 hours | 1 | 60 | Mean Difference (IV, Fixed, 95% CI) | ‐0.10 [‐0.38, 0.18] |
| 2 Tranquil or asleep: 2. Effect of tranquilisation (PANSS‐EC, high=bad) (skewed data) Show forest plot | Other data | No numeric data | ||
| 2.1 at 30 minutes | Other data | No numeric data | ||
| 2.2 at 60 minutes | Other data | No numeric data | ||
| 2.3 at 90 minutes | Other data | No numeric data | ||
| 3 Tranquil or asleep: 3. Level of tranquilisation / agitation (ACES) (skewed data) Show forest plot | Other data | No numeric data | ||
| 3.1 at 30 minutes | Other data | No numeric data | ||
| 3.2 at 90 minutes. | Other data | No numeric data | ||
| 4 Global state: 1. Needing restraints or seclusion Show forest plot | 1 | 60 | Risk Ratio (M‐H, Fixed, 95% CI) | 0.5 [0.19, 1.29] |
| 5 Global state: 2. Additional tranquillising drugs Show forest plot | 1 | 51 | Risk Ratio (M‐H, Fixed, 95% CI) | 0.51 [0.19, 1.36] |
| 6 Global state: 3. Average value of additional medication ‐ after initial dose (skewed data) Show forest plot | Other data | No numeric data | ||
| 7 Adverse effects: 1. Specific ‐ a. Cardiovascular ‐ hypotension Show forest plot | 2 | 111 | Risk Ratio (M‐H, Fixed, 95% CI) | 0.55 [0.17, 1.75] |
| 8 Adverse effects: 1. Specific ‐ b. Central Nervous System ‐ excessive sedation Show forest plot | 2 | 111 | Risk Ratio (M‐H, Fixed, 95% CI) | 0.30 [0.06, 1.43] |
| 9 Adverse effects: 1. Specific ‐ c. Extrapyramidal problems ‐ 0‐4 hours Show forest plot | 2 | 111 | Risk Ratio (M‐H, Fixed, 95% CI) | 1.72 [1.07, 2.76] |
| 10 Specific behaviour: 1. Severe agitation Show forest plot | 1 | 51 | Risk Ratio (M‐H, Fixed, 95% CI) | 0.82 [0.18, 3.69] |
| 11 Specific behaviour: 2. Average aggression score (OAS, high score=bad) Show forest plot | 1 | Mean Difference (IV, Fixed, 95% CI) | Subtotals only | |
| 11.1 by 1 hour | 1 | 60 | Mean Difference (IV, Fixed, 95% CI) | 4.50 [2.82, 6.18] |
| 11.2 by 2 hours | 1 | 60 | Mean Difference (IV, Fixed, 95% CI) | 1.4 [0.55, 2.25] |
| 11.3 by 4 hours | 1 | 60 | Mean Difference (IV, Fixed, 95% CI) | ‐0.30 [‐0.62, 0.02] |
| 11.4 by 6 hours | 1 | 60 | Mean Difference (IV, Fixed, 95% CI) | ‐0.40 [‐0.59, ‐0.21] |
| 11.5 by 12 hours | 1 | 60 | Mean Difference (IV, Fixed, 95% CI) | ‐1.60 [‐1.75, ‐1.45] |
| 12 Specific behaviour: 3. Average agitation score (OASS, high score=bad) Show forest plot | 1 | Mean Difference (IV, Fixed, 95% CI) | Subtotals only | |
| 12.1 by 1 hour | 1 | 60 | Mean Difference (IV, Fixed, 95% CI) | 16.80 [13.68, 19.92] |
| 12.2 by 2 hours | 1 | 60 | Mean Difference (IV, Fixed, 95% CI) | 5.5 [2.92, 8.08] |
| 12.3 by 4 hours | 1 | 60 | Mean Difference (IV, Fixed, 95% CI) | ‐0.60 [‐1.47, 0.27] |
| 12.4 by 6 hours | 1 | 60 | Mean Difference (IV, Fixed, 95% CI) | ‐1.0 [‐1.85, ‐0.15] |
| 12.5 by 12 hours | 1 | 60 | Mean Difference (IV, Fixed, 95% CI) | ‐1.90 [‐2.34, ‐1.46] |
| 13 Leaving the study early Show forest plot | 2 | 111 | Risk Ratio (M‐H, Fixed, 95% CI) | 2.48 [0.11, 58.20] |
| 13.1 by 24 hours | 2 | 111 | Risk Ratio (M‐H, Fixed, 95% CI) | 2.48 [0.11, 58.20] |
| Outcome or subgroup title | No. of studies | No. of participants | Statistical method | Effect size |
| 1 Tranquil or asleep: 1. Average sedation score (RSS, high score=good) Show forest plot | 1 | Mean Difference (IV, Fixed, 95% CI) | Subtotals only | |
| 1.1 by 1 hour | 1 | 60 | Mean Difference (IV, Fixed, 95% CI) | ‐0.60 [‐1.13, ‐0.07] |
| 1.2 by 2 hours | 1 | 60 | Mean Difference (IV, Fixed, 95% CI) | 0.0 [‐0.46, 0.46] |
| 1.3 by 4 hours | 1 | 60 | Mean Difference (IV, Fixed, 95% CI) | 0.0 [‐0.51, 0.51] |
| 1.4 by 6 hours | 1 | 60 | Mean Difference (IV, Fixed, 95% CI) | 0.10 [‐0.18, 0.38] |
| 1.5 by 12 hours | 1 | 60 | Mean Difference (IV, Fixed, 95% CI) | 0.10 [‐0.24, 0.44] |
| 2 Tranquil or asleep: 2. Effect of tranquilisation (PANSS‐EC, high score=bad) (skewed data) Show forest plot | Other data | No numeric data | ||
| 2.1 at 30 minutes | Other data | No numeric data | ||
| 2.2 at 60 minutes | Other data | No numeric data | ||
| 2.3 at 90 minutes | Other data | No numeric data | ||
| 3 Tranquil or asleep: 3. Level of tranquilisation / agitation (ACES) (skewed data) Show forest plot | Other data | No numeric data | ||
| 3.1 at 30 minutes | Other data | No numeric data | ||
| 3.2 at 90 minutes | Other data | No numeric data | ||
| 4 Global state: 1. Needing restraints or seclusion Show forest plot | 1 | 60 | Risk Ratio (M‐H, Fixed, 95% CI) | 0.24 [0.10, 0.55] |
| 5 Global state: 2. Additional tranquilising drugs Show forest plot | 1 | 57 | Risk Ratio (M‐H, Fixed, 95% CI) | 1.04 [0.34, 3.19] |
| 6 Global state: 3. Average value of additional medication ‐ after initial dose (skewed data) Show forest plot | Other data | No numeric data | ||
| 7 Adverse effects: 1. Specific ‐ a. Cardiovascular ‐ hypotension Show forest plot | 2 | 117 | Risk Ratio (M‐H, Fixed, 95% CI) | 0.51 [0.16, 1.58] |
| 8 Adverse effects: 1. Specific ‐ b. Central Nervous System ‐ excessive sedation Show forest plot | 2 | 117 | Risk Ratio (M‐H, Fixed, 95% CI) | 0.12 [0.03, 0.49] |
| 9 Adverse effects: 1. Specific ‐ c. Extrapyramidal problems ‐ 0‐4 hours Show forest plot | 2 | 117 | Risk Ratio (M‐H, Fixed, 95% CI) | 1.84 [1.12, 3.02] |
| 10 Specific behaviour: 1. Average aggression score (OAS, high score=bad) Show forest plot | 1 | Mean Difference (IV, Fixed, 95% CI) | Subtotals only | |
| 10.1 by 1 hour | 1 | 60 | Mean Difference (IV, Fixed, 95% CI) | 3.30 [1.35, 5.25] |
| 10.2 by 2 hours | 1 | 60 | Mean Difference (IV, Fixed, 95% CI) | ‐1.70 [‐3.46, 0.06] |
| 10.3 by 4 hours | 1 | 60 | Mean Difference (IV, Fixed, 95% CI) | ‐0.70 [‐1.27, ‐0.13] |
| 10.4 by 6 hours | 1 | 60 | Mean Difference (IV, Fixed, 95% CI) | ‐0.70 [‐0.89, ‐0.51] |
| 10.5 by 12 hours | 1 | 60 | Mean Difference (IV, Fixed, 95% CI) | ‐3.7 [‐4.39, ‐3.01] |
| 11 Specific behaviour: 2. Average agitation score (OASS, high score=bad) Show forest plot | 1 | Mean Difference (IV, Fixed, 95% CI) | Subtotals only | |
| 11.1 by 1 hour | 1 | 60 | Mean Difference (IV, Fixed, 95% CI) | 16.00 [13.02, 18.98] |
| 11.2 by 2 hours | 1 | 60 | Mean Difference (IV, Fixed, 95% CI) | 2.70 [1.67, 3.73] |
| 11.3 by 4 hours | 1 | 60 | Mean Difference (IV, Fixed, 95% CI) | ‐1.70 [‐2.79, ‐0.61] |
| 11.4 by 6 hours | 1 | 60 | Mean Difference (IV, Fixed, 95% CI) | ‐1.10 [‐2.08, ‐0.12] |
| 11.5 by 12 hours | 1 | 60 | Mean Difference (IV, Fixed, 95% CI) | ‐10.40 [‐11.47, ‐9.33] |
| 12 Specific behaviour: 3. Severe agitation Show forest plot | 1 | 57 | Risk Ratio (M‐H, Fixed, 95% CI) | 1.55 [0.28, 8.61] |
| 13 Leaving the study early Show forest plot | 2 | 117 | Risk Ratio (M‐H, Fixed, 95% CI) | 0.26 [0.03, 2.18] |
| 13.1 by 24 hours | 2 | 117 | Risk Ratio (M‐H, Fixed, 95% CI) | 0.26 [0.03, 2.18] |
| Outcome or subgroup title | No. of studies | No. of participants | Statistical method | Effect size |
| 1 Tranquil or asleep: 1. Not tranquil or asleep Show forest plot | 1 | Risk Ratio (M‐H, Fixed, 95% CI) | Subtotals only | |
| 1.1 by 30 minutes | 1 | 200 | Risk Ratio (M‐H, Fixed, 95% CI) | 0.26 [0.10, 0.68] |
| 1.2 by 1 hour | 1 | 200 | Risk Ratio (M‐H, Fixed, 95% CI) | 0.2 [0.04, 0.89] |
| 1.3 by 2 hours | 1 | 200 | Risk Ratio (M‐H, Fixed, 95% CI) | 0.25 [0.07, 0.86] |
| 1.4 by 4 hours | 1 | 200 | Risk Ratio (M‐H, Fixed, 95% CI) | 1.0 [0.26, 3.89] |
| 2 Tranquil or asleep: 2. Not asleep Show forest plot | 1 | Risk Ratio (M‐H, Fixed, 95% CI) | Subtotals only | |
| 2.1 by 30 minutes | 1 | 200 | Risk Ratio (M‐H, Fixed, 95% CI) | 0.40 [0.29, 0.54] |
| 2.2 by 1 hour | 1 | 200 | Risk Ratio (M‐H, Fixed, 95% CI) | 0.49 [0.36, 0.66] |
| 2.3 by 2 hours | 1 | 200 | Risk Ratio (M‐H, Fixed, 95% CI) | 0.51 [0.36, 0.71] |
| 2.4 by 4 hours | 1 | 200 | Risk Ratio (M‐H, Fixed, 95% CI) | 0.44 [0.30, 0.65] |
| 3 Tranquil or asleep: 3. Time (skewed data) Show forest plot | Other data | No numeric data | ||
| 3.1 time until tranquil or asleep | Other data | No numeric data | ||
| 3.2 time until asleep | Other data | No numeric data | ||
| 4 Global state: 1. No overall improvement Show forest plot | 1 | Risk Ratio (M‐H, Fixed, 95% CI) | Subtotals only | |
| 4.1 by 30 minutes | 1 | 200 | Risk Ratio (M‐H, Fixed, 95% CI) | 0.40 [0.25, 0.66] |
| 4.2 by 1 hour | 1 | 200 | Risk Ratio (M‐H, Fixed, 95% CI) | 0.5 [0.32, 0.79] |
| 4.3 by 2 hours | 1 | 200 | Risk Ratio (M‐H, Fixed, 95% CI) | 0.46 [0.25, 0.86] |
| 4.4 by 4 hours | 1 | 200 | Risk Ratio (M‐H, Fixed, 95% CI) | 0.93 [0.46, 1.87] |
| 5 Global state: 2. Needing restraints or seclusion Show forest plot | 1 | Risk Ratio (M‐H, Fixed, 95% CI) | Subtotals only | |
| 5.1 by 30 minutes | 1 | 200 | Risk Ratio (M‐H, Fixed, 95% CI) | 0.55 [0.28, 1.09] |
| 5.2 by 1 hour | 1 | 200 | Risk Ratio (M‐H, Fixed, 95% CI) | 0.56 [0.27, 1.14] |
| 5.3 by 2 hours | 1 | 200 | Risk Ratio (M‐H, Fixed, 95% CI) | 0.77 [0.35, 1.67] |
| 5.4 by 4 hours | 1 | 200 | Risk Ratio (M‐H, Fixed, 95% CI) | 0.82 [0.35, 1.89] |
| 6 Global state: 3. Additional tranquillising drugs Show forest plot | 1 | Risk Ratio (M‐H, Fixed, 95% CI) | Subtotals only | |
| 6.1 by 30 minutes | 1 | 200 | Risk Ratio (M‐H, Fixed, 95% CI) | 0.33 [0.01, 8.09] |
| 6.2 by 1 hour | 1 | 200 | Risk Ratio (M‐H, Fixed, 95% CI) | 0.33 [0.04, 3.15] |
| 6.3 by 2 hours | 1 | 200 | Risk Ratio (M‐H, Fixed, 95% CI) | 0.75 [0.17, 3.27] |
| 6.4 by 4 hours | 1 | 200 | Risk Ratio (M‐H, Fixed, 95% CI) | 0.89 [0.36, 2.21] |
| 7 Global state: 4. Various measures Show forest plot | 1 | Risk Ratio (M‐H, Fixed, 95% CI) | Subtotals only | |
| 7.1 doctor called to see patient ‐ by 4 hours | 1 | 200 | Risk Ratio (M‐H, Fixed, 95% CI) | 0.72 [0.37, 1.39] |
| 7.2 refusing oral medication ‐ by 2 weeks | 1 | 200 | Risk Ratio (M‐H, Fixed, 95% CI) | 1.63 [0.70, 3.75] |
| 8 Global state: 5. Average improvement (CGI, high score=bad) ) Show forest plot | 1 | Mean Difference (IV, Fixed, 95% CI) | Subtotals only | |
| 8.1 by 30 minutes | 1 | 200 | Mean Difference (IV, Fixed, 95% CI) | ‐0.60 [‐0.86, ‐0.34] |
| 8.2 by 1 hour | 1 | 200 | Mean Difference (IV, Fixed, 95% CI) | ‐0.33 [‐0.54, ‐0.12] |
| 8.3 by 2 hours | 1 | 200 | Mean Difference (IV, Fixed, 95% CI) | ‐0.23 [‐0.51, 0.05] |
| 8.4 by 4 hours | 1 | 200 | Mean Difference (IV, Fixed, 95% CI) | ‐0.09 [‐0.32, 0.14] |
| 9 Adverse effects: 1. General ‐ serious adverse effect Show forest plot | 1 | Risk Ratio (M‐H, Fixed, 95% CI) | Subtotals only | |
| 9.1 by 30 minutes | 1 | 200 | Risk Ratio (M‐H, Fixed, 95% CI) | 0.33 [0.01, 8.09] |
| 9.2 by 1 hour | 1 | 200 | Risk Ratio (M‐H, Fixed, 95% CI) | 0.0 [0.0, 0.0] |
| 9.3 by 2 hours | 1 | 200 | Risk Ratio (M‐H, Fixed, 95% CI) | 0.0 [0.0, 0.0] |
| 9.4 by 4 hours | 1 | 200 | Risk Ratio (M‐H, Fixed, 95% CI) | 0.0 [0.0, 0.0] |
| 10 Adverse effects: 2. Specific ‐ Extrapyramidal problems ‐ 0‐4 hours Show forest plot | 1 | Risk Ratio (M‐H, Fixed, 95% CI) | Subtotals only | |
| 10.1 akathisia (Barnes Akathisia Scale) | 1 | 200 | Risk Ratio (M‐H, Fixed, 95% CI) | 0.0 [0.0, 0.0] |
| 10.2 any change in scale‐rated extrapyramidal problems (Simpson & Angus Scale) | 1 | 200 | Risk Ratio (M‐H, Fixed, 95% CI) | 0.0 [0.0, 0.0] |
| 11 Service outcomes: Not discharged Show forest plot | 1 | 200 | Risk Ratio (M‐H, Fixed, 95% CI) | 1.13 [0.85, 1.50] |
| 11.1 by 4 hours | 1 | 200 | Risk Ratio (M‐H, Fixed, 95% CI) | 1.13 [0.85, 1.50] |
| 12 Leaving the study early Show forest plot | 1 | Risk Ratio (M‐H, Fixed, 95% CI) | Subtotals only | |
| 12.1 by 4 hours | 1 | 200 | Risk Ratio (M‐H, Fixed, 95% CI) | 3.0 [0.12, 72.77] |
| 12.2 by 2 weeks | 1 | 200 | Risk Ratio (M‐H, Fixed, 95% CI) | 1.25 [0.51, 3.04] |
| Outcome or subgroup title | No. of studies | No. of participants | Statistical method | Effect size |
| 1 Tranquil or asleep: 1. Not tranquil or asleep Show forest plot | 1 | Risk Ratio (M‐H, Fixed, 95% CI) | Subtotals only | |
| 1.1 by 30 minutes | 1 | 301 | Risk Ratio (M‐H, Fixed, 95% CI) | 2.90 [1.75, 4.80] |
| 1.2 by 1 hour | 1 | 301 | Risk Ratio (M‐H, Fixed, 95% CI) | 1.91 [0.92, 3.98] |
| 1.3 by 2 hours | 1 | 301 | Risk Ratio (M‐H, Fixed, 95% CI) | 1.73 [0.70, 4.26] |
| 2 Tranquil or asleep: 2. Not asleep Show forest plot | 1 | Risk Ratio (M‐H, Fixed, 95% CI) | Subtotals only | |
| 2.1 by 30 minutes | 1 | 301 | Risk Ratio (M‐H, Fixed, 95% CI) | 1.86 [1.48, 2.33] |
| 2.2 by 1 hour | 1 | 301 | Risk Ratio (M‐H, Fixed, 95% CI) | 2.18 [1.52, 3.12] |
| 2.3 by 2 hours | 1 | 301 | Risk Ratio (M‐H, Fixed, 95% CI) | 2.13 [1.42, 3.20] |
| 3 Global state: 1. Needing restraints or seclusion ‐ by 2hrs Show forest plot | 1 | 301 | Risk Ratio (M‐H, Fixed, 95% CI) | 1.22 [0.82, 1.82] |
| 4 Global state: 2. Needing addition drugs during initial phase ‐ by 2hrs Show forest plot | 1 | 301 | Risk Ratio (M‐H, Fixed, 95% CI) | 3.52 [0.74, 16.69] |
| 5 Global state: 3. Various measures Show forest plot | 1 | Risk Ratio (M‐H, Fixed, 95% CI) | Subtotals only | |
| 5.1 doctor called to see patient ‐ by 24 hours | 1 | 301 | Risk Ratio (M‐H, Fixed, 95% CI) | 0.85 [0.61, 1.19] |
| 5.2 refusing oral drugs ‐ at 24 hours | 1 | 301 | Risk Ratio (M‐H, Fixed, 95% CI) | 0.69 [0.33, 1.44] |
| 6 Adverse effects: Serious adverse effect Show forest plot | 1 | Risk Ratio (M‐H, Fixed, 95% CI) | Subtotals only | |
| 6.1 by 30 minutes | 1 | 301 | Risk Ratio (M‐H, Fixed, 95% CI) | 1.01 [0.06, 15.95] |
| 6.2 by 1 hour | 1 | 301 | Risk Ratio (M‐H, Fixed, 95% CI) | 0.0 [0.0, 0.0] |
| 6.3 by 2 hours | 1 | 301 | Risk Ratio (M‐H, Fixed, 95% CI) | 0.0 [0.0, 0.0] |
| 7 Service outcomes: Not discharged Show forest plot | 1 | 301 | Risk Ratio (M‐H, Fixed, 95% CI) | 1.05 [0.84, 1.29] |
| 7.1 by 15 days | 1 | 301 | Risk Ratio (M‐H, Fixed, 95% CI) | 1.05 [0.84, 1.29] |
| 8 Specific Behaviours: 1. Aggression. a ‐ other episode of aggression ‐ by 24 hrs Show forest plot | 1 | 301 | Risk Ratio (M‐H, Fixed, 95% CI) | 0.89 [0.62, 1.29] |
| 9 Leaving the study early Show forest plot | 1 | Risk Ratio (M‐H, Fixed, 95% CI) | Subtotals only | |
| 9.1 by 2 hours | 1 | 301 | Risk Ratio (M‐H, Fixed, 95% CI) | 2.01 [0.18, 21.97] |
| 9.2 by 24 hours | 1 | 301 | Risk Ratio (M‐H, Fixed, 95% CI) | 1.01 [0.36, 2.80] |
| 9.3 by 2 weeks | 1 | 301 | Risk Ratio (M‐H, Fixed, 95% CI) | 0.14 [0.01, 2.76] |
| Outcome or subgroup title | No. of studies | No. of participants | Statistical method | Effect size |
| 1 Tranquil or asleep: 1. Not tranquil or asleep Show forest plot | 1 | Risk Ratio (M‐H, Fixed, 95% CI) | Subtotals only | |
| 1.1 by 40 minutes | 1 | 316 | Risk Ratio (M‐H, Fixed, 95% CI) | 0.83 [0.56, 1.24] |
| 2 Tranquil or asleep: 2. Not asleep Show forest plot | 1 | Risk Ratio (M‐H, Fixed, 95% CI) | Subtotals only | |
| 2.1 by 40 minutes | 1 | 316 | Risk Ratio (M‐H, Fixed, 95% CI) | 0.99 [0.85, 1.16] |