Vacunas contra la gripe para la prevención de las enfermedades cardiovasculares
Resumen
Antecedentes
Ésta es una actualización de la revisión original publicada en 2008. El riesgo de resultados cardiovasculares adversos aumenta con la infección tipo gripe y la vacunación contra la gripe puede mejorar los resultados cardiovasculares.
Objetivos
Evaluar el efecto beneficioso potencial de la vacunación contra la gripe para la prevención primaria y secundaria de las enfermedades cardiovasculares.
Métodos de búsqueda
Se hicieron búsquedas en las siguientes bases de datos electrónicas el 18 octubre 2013: The Cochrane Library (incluyendo el Registro Cochrane Central de Ensayos Controlados (Cochrane Central Register of Controlled Trials, CENTRAL), Database of Abstracts of Reviews of Effects (DARE), Economic Evaluation Database (EED) y la Health Technology Assessment database (HTA)), MEDLINE, EMBASE, Science Citation Index Expanded, Conference Proceedings Citation Index – Science and ongoing trials registers (www.controlled‐trials.com/ y www.clinicaltrials.gov). Se examinaron las listas de referencias de estudios primarios y revisiones sistemáticas relevantes. Se realizó una búsqueda limitada en PubMed el 20 de febrero de 2015, justo antes de la publicación.
Criterios de selección
Ensayos controlados aleatorios (ECA) de la vacunación contra la gripe comparada con placebo o ningún tratamiento en participantes con o sin enfermedades cardiovasculares, que evaluaron la muerte cardiovascular o los eventos cardiovasculares no mortales.
Obtención y análisis de los datos
Se utilizaron los procedimientos metodológicos estándar previstos por La Colaboración Cochrane. Solamente se realizaron metanálisis para la muerte cardiovascular, ya que los otros resultados se informaron con muy poca frecuencia. Los tamaños del efecto se expresaron como cocientes de riesgos (CR) y se utilizaron los modelos de efectos aleatorios.
Resultados principales
Se incluyeron ocho ensayos de vacunación contra gripe comparada con placebo o ninguna vacunación; 12 029 participantes recibieron al menos una vacunación o tratamiento control. Se incluyeron seis nuevos estudios (n = 11 251), además de los dos incluidos en la versión anterior de la revisión. Cuatro de estos ensayos (n = 10 347) se centraron en la prevención de la gripe en la población general o de edad avanzada e informaron los resultados cardiovasculares entre sus análisis de seguridad; cuatro ensayos (n = 1682) se centraron en la prevención de los eventos cardiovasculares en pacientes con cardiopatía coronaria establecida. Estas poblaciones se analizaron por separado. El seguimiento se mantuvo entre 42 días y un año. Cinco ECA mostraron déficits en al menos tres de los criterios de riesgo de sesgo evaluados. Cuando se informó (siete estudios), la vacunación proporcionó suficiente inmunogenicidad o protección contra la gripe. La mortalidad cardiovascular se informó en cuatro ensayos de prevención secundaria y se redujo significativamente con la vacunación contra la gripe en general (cociente de riesgos [CR] 0,45; intervalo de confianza [IC] del 95%: 0,26 a 0,76; valor de p = 0,003), sin heterogeneidad significativa entre los estudios, y en tres ensayos que informaron la mortalidad cardiovascular como parte de sus análisis de seguridad cuando la cantidad de eventos fue demasiado pequeña para permitir establecer conclusiones. En los estudios de pacientes con cardiopatía coronaria, los resultados compuestos de los eventos cardiovasculares tendieron a disminuir con la vacunación contra la gripe comparada con placebo. En general no se encontraron diferencias significativas entre los grupos de comparación con respecto a resultados individuales como el infarto de miocardio.
Conclusiones de los autores
En los pacientes con enfermedades cardiovasculares, la vacunación contra la gripe puede reducir la mortalidad cardiovascular y los eventos cardiovasculares combinados. Sin embargo, los estudios tuvieron cierto riesgo de sesgo y los resultados no siempre fueron consistentes, por lo que se necesitan pruebas adicionales de mayor calidad para confirmar estos resultados. No hubo suficientes pruebas disponibles para establecer si la vacunación contra la gripe tiene una función en la prevención primaria de las enfermedades cardiovasculares.
PICO
Resumen en términos sencillos
Vacunas contra la gripe para la prevención de las enfermedades cardiovasculares
La infección por gripe puede hacer que sean más frecuentes las enfermedades cardiovasculares (p.ej. el ataque cardíaco, el accidente cerebrovascular) y la muerte asociada, y la vacunación contra la gripe puede reducir este riesgo. Se incluyeron los estudios aleatorios que compararon personas que recibieron la vacuna contra la gripe con los que no recibieron la vacuna (placebo o ningún tratamiento). Para esta actualización de la revisión, se encontraon ocho ensayos que estudiaban a 12 029 participantes. Cuatro de estos estudios examinaron pacientes con cardiopatía comprobada (1682 participantes) y los otros cuatro se centraron en la población general o en personas de edad avanzada (10 347 participantes). Los estudios en la población general informaron resultados de enfermedades cardiovasculares como parte de sus análisis de seguridad, pero la cantidad de casos fue demasiado pequeña para permitir una valoración de si la vacunación contra la gripe fue protectora en estas poblaciones y no se observaron diferencias entre los grupos. En general, los estudios en los pacientes con cardiopatía indican que la vacunación contra la gripe puede reducir la muerte como resultado de las enfermedades cardiovasculares y puede reducir los eventos combinados de enfermedades cardiovasculares (como los ataques cardíacos, los accidentes cerebrovasculares, la necesidad de operaciones de bypass, etc.). Sin embargo, estos estudios fueron pequeños y tuvieron cierto riesgo de sesgo, por lo que se necesitan estudios más grandes y de mejor calidad para confirmar los resultados.
Authors' conclusions
Background
This is an update of the original review published in 2008.
Description of the condition
Cardiovascular disease (CVD) remains the number one cause of death globally (WHO 2011a). Cardiovascular disease is the result of disorders of the heart and blood vessels and includes cerebrovascular disease, coronary heart disease (CHD) and peripheral arterial disease (PAD) (WHO 2011b). In 2008, an estimated 17.3 million people died from CVD, representing 30% of all global deaths. Of these deaths, an estimated 7.3 million were due to CHD and 6.2 million to stroke (WHO 2011a). More than 80% of CVD deaths occur in low‐ and middle‐income countries, and the number of CVD deaths is expected to increase to 23.3 million by 2030 (Mathers 2006; WHO 2011a). These data demonstrate that new treatment modalities and better preventive strategies are needed.
Description of the intervention
Influenza vaccine is protective against influenza infection in healthy adults (Jefferson 2007), and large cohort studies have shown that influenza vaccination is effective in preventing morbidity and mortality in the community. Influenza vaccination reduces influenza‐like disease, pneumonia and risk of death among elderly persons (Nichol 2007). Furthermore, a possible association has been shown between influenza vaccination and reduced all‐cause death, heart attack and stroke (Nichol 2003). However, given the observational nature of these studies, the results are potentially prone to bias (Nelson 2007; Simonsen 2007).
Generally, influenza vaccine is safe and well tolerated. Local reaction (soreness, redness, tenderness or swelling) at the site of injection is observed in 64% of vaccinated people. Red eyes, fever, runny noise, hoarse voice and cough have occasionally been reported. Rarely, influenza vaccine can cause allergic reactions (immediate hypersensitivity reactions) (Fiore 2010). No clear link to Guillain‐Barré syndrome (GBS) has been observed over many years of vaccine use. However, if any risk should occur, no more than one or two cases per million vaccinations would be expected (ACIP 2012). In the light of all risks and benefits, risk of a serious reaction to influenza vaccine is much less than risk of severe influenza disease, which can be prevented by vaccination. Influenza vaccine is considered a very safe product with many benefits, especially for members of high‐risk groups.
How the intervention might work
Increased risk of cardiovascular disease during influenza infection has been shown in a large case series that used within‐person comparisons (Smeeth 2004). Smeeth et al included 20,486 persons with first myocardial infarction and 19,063 persons with first stroke from the General Practitioner Database. They showed that, although no increase was seen after influenza vaccination, risk of acute cardiovascular events increased fivefold in the first three days after respiratory tract infection. In addition, risk of stroke increased threefold during this period. These findings suggest a causal role for acute infection triggering cardiovascular events. Warren‐Gash 2009 carried out a systematic review of the evidence that influenza infection triggers acute myocardial infection and cardiovascular death. These review authors included 37 observational studies and two randomised controlled trials (RCTs). Observational studies showed a consistent association between influenza infection and myocardial infarction. Evidence of an association with cardiovascular death was weaker. Investigators found similar associations in two subsequent large observational studies from the UK and Hong Kong (Warren‐Gash 2011; Warren‐Gash 2012).
Various mechanisms have been proposed to explain why influenza infection may trigger cardiovascular events (Hebsur 2014; Rogers 2012). Although several infectious agents are thought to increase cardiovascular risk through a cascade of systemic infection and subsequent inflammation, the influenza virus may play a more specific role in triggering acute events by exclusively targeting areas of atherosclerosis and destabilising preexisting plaques. Other potential mechanisms include high‐density lipoprotein, loss of anti‐inflammatory properties, endothelial dysfunction, deposition of immune complexes in atherosclerotic plaques and elevation of macrophage circulation into the arteries.
Several studies have shown that influenza vaccination protects against acute coronary syndromes (Naghavi 2000; Nichol 2003; Siscovick 2000). In a large cohort study, Nichol and co‐workers found that hospitalisation for acute coronary syndromes was reduced among participants who received influenza vaccination (Nichol 2003). During two consecutive seasons, more than 140,000 members of managed care organisations 65 years of age or older were studied. During two consecutive years, influenza vaccination reduced the risk of hospitalisation for cardiac disease by 19% and reduced the risk of hospitalisation for cerebrovascular disease by 16%. Therefore investigators concluded that influenza vaccination was associated with reduced risk of heart disease and cerebrovascular disease during influenza season.
Why it is important to do this review
The observational nature of most studies makes it difficult to draw definitive conclusions, and many questions remain. Observational studies in this area may be prone to the following sources of bias: (1) "healthy user bias", whereby 'healthy’ people have higher vaccine uptake than 'unhealthy’ people and are likely to exhibit a range of healthy behaviours and to have better health outcomes regardless of vaccination; (2) "frailty selection bias", by which more frail people who are closer to death may be less likely to receive influenza vaccine than other people; and (3) apparent protective effects of influenza vaccine against death outside the influenza season, which are shown in some observational studies, suggesting residual biases or mechanisms other than influenza prevention.
In addition, the effectiveness of influenza vaccination is dependent on many factors including the age and immunity of recipients and the effectiveness of the vaccine. Indeed, influenza vaccination is most effective when the inactive influenza strains in the vaccine match the circulating strains in the community. In seasons with a poor match, the reduction in hospitalisation and death is smaller than in seasons with a good match (Nichol 2007).
Because effective influenza vaccines are cheap and widely available, use of influenza vaccination to prevent acute coronary syndromes is an appealing prevention strategy for those at risk. Whether influenza vaccination reduces cardiovascular disease remains not fully established. This systematic review assesses the effects of influenza vaccination in people with and without cardiovascular disease for the prevention of cardiovascular disease.
Objectives
To assess the potential benefits of influenza vaccination for primary and secondary prevention of cardiovascular disease.
Methods
Criteria for considering studies for this review
Types of studies
We included randomised controlled trials (RCTs) comparing influenza vaccination with placebo or no intervention when data on one of the outcomes was reported. We excluded all non‐randomised controlled trials.
Types of participants
We included participants 18 years of age and older of either sex if influenza vaccination was given as a routine influenza prevention programme, as primary prevention of myocardial infarction and as secondary prevention. Participants may (secondary prevention) or may not (primary prevention) have had a history of CVD (stable or unstable angina, myocardial infarction, stroke or PAD). We included participants who were taking medication.
Types of interventions
Influenza vaccination (inactivated whole virus, detergent‐treated split products or purified haemagglutinin and neuraminidase surface antigen formulation of the three influenza virus strains influenza A, B and C) administered by any route, at any dosage. We included studies comparing types, doses or schedules of influenza vaccine if one of the comparison groups received placebo or no intervention. Use of co‐interventions was not an exclusion criterion if the same were used in different comparison groups.
Types of outcome measures
Trials had to report one of the following outcomes.
Primary outcomes
For patients without previous cardiovascular disease, the following were primary outcomes.
-
First‐time myocardial infarction.
-
First‐time unstable angina.
-
Death from cardiovascular causes.
For patients with previous cardiovascular disease, the following were primary outcomes.
-
Myocardial infarction.
-
Unstable angina.
-
Death from cardiovascular causes.
Secondary outcomes
We also considered related outcomes (e.g. composite clinical outcomes). It was noted whether cardiovascular outcomes were reported as primary outcomes and whether the vaccine was shown to be effective in reducing influenza infection.
Search methods for identification of studies
We developed the search strategy for this review in accordance with guidelines of the Cochrane Heart Group. We applied no language restrictions.
Electronic searches
We sought all RCTs of influenza vaccination compared with placebo or no intervention, using the following databases, on 18 October 2013.
-
The Cochrane Central Register of Controlled Trials (CENTRAL) (2013, Issue 9 of 12).
-
MEDLINE (Ovid, 1946 to 2013 October Week 1).
-
MEDLINE (PubMed, 20 February 2015).
-
EMBASE Classic + EMBASE (Ovid, 1947 to 2013 Week 41).
-
The Database of Abstracts of Reviews of Effects (DARE) (2013, Issue 3 of 4).
-
The Economic Evaluation Database (EED) (2013, Issue 3 of 4).
-
Health Technology Assessment (HTA) (2013, Issue 3 of 4).
-
Science Citation Index Expanded (SCI Expanded, 1970 to present) and Conference Proceedings Citation Index – Science (CPCI‐S, 1990 to present) on Web of Science (Thomson Reuters).
-
Websites for ongoing trials: www.controlled‐trials.com and www.clinicaltrials.gov (accessed 15 November 2014).
Search strategies for the specific databases searched in 2013 are listed in Appendix 1. Search strategies from 2008 are provided in Appendix 2. As the review update was broadened to CVD as compared with coronary heart disease, we have revised the search strategies for the update and have run the search without date limits.
The RCT filter for MEDLINE is the Cochrane sensitivity‐maximising RCT filter, and for EMBASE, we applied terms recommended in the Cochrane Handbook for Systematic Reviews of Interventions (Lefebvre 2011). The RCT filter used for Web of Science is an adaptation of the Cochrane MEDLINE RCT filter.
Searching other resources
We searched reference lists of relevant primary studies and systematic reviews for further studies. We contacted the primary authors for additional information if necessary.
Data collection and analysis
Selection of studies
Two review authors (CC, NF) independently and systematically selected potentially eligible trials from the search. We excluded studies when they did not fulfil the inclusion criteria. If eligibility was unclear from the title/abstract of the record, we consulted the full‐text article. We resolved discrepancies in selection between the two review authors by discussion.
Data extraction and management
Two review authors (CC, ZO) independently extracted data using a predefined review form. We extracted the following data systematically.
-
Trial characteristics: design, duration, country, setting.
-
Intervention: type and method of vaccination, control intervention.
-
Participants: inclusion and exclusion criteria, total number and numbers in comparison groups, baseline characteristics (age, sex, cardiovascular risk factors, cardiovascular medication), similarity of groups at baseline, withdrawals, losses to follow‐up.
-
Outcomes: primary and secondary outcomes as per trial, myocardial infarction or reinfarction, unstable angina, death from cardiovascular causes and related outcomes.
We resolved discrepancies in data extraction by discussion.
Assessment of risk of bias in included studies
We assessed risk of bias in trials by using the Cochrane 'Risk of bias' tool, assessing the following criteria.
-
Random sequence generation (adequacy of method).
-
Allocation concealment.
-
Blinding of participants and personnel.
-
Handling of incomplete outcome data.
-
Dropouts/losses to follow‐up.
-
Intention‐to‐treat analysis.
-
Selective reporting.
-
Similarity at baseline.
-
Any other bias noted.
Two review authors (CC, ZO) independently assessed risk of bias, and we resolved discrepancies by discussion.
Measures of treatment effect
All outcomes of interest were dichotomous outcomes and were presented as risk ratios (RRs) at the last reported follow‐up.
Dealing with missing data
When substantial information was missing (e.g. trial information available only in abstract form), we contacted study authors to ask for further information.
Assessment of heterogeneity
We assessed heterogeneity by using the I2 statistic and the Chi2 statistic with significance levels set at P value = 0.1.
Data synthesis
We summarised data on cardiovascular death in a meta‐analysis using the method of Mantel‐Haenzel and a random‐effects model. We plotted data on other cardiovascular outcomes for graphical representation, but we applied no summary statistics, as heterogeneity between studies was significant.
Subgroup analysis and investigation of heterogeneity
Potentially relevant subgroup analyses include the following.
-
Age (participants < 65 years or ≥ 65 years).
-
Sex (male vs female).
-
General population versus population with established CVD.
-
Among participants with established heart disease, participants with acute coronary syndrome versus those with stable angina/elective percutaneous coronary intervention.
-
Studies reporting effective protection of the vaccination against influenza versus studies reporting less effective protection against influenza.
Results
Description of studies
Results of the search
The Preferred Reporting Items for Systematic Reviews and Meta‐Analyses (PRISMA) study flow diagram of the search for the updated and extended review is shown in Figure 1. Electronic searches identified 966 records. On the basis of titles and abstracts, we excluded 550 records and we assessed 109 full‐text records for eligibility.

Study flow diagram.
Of 109 records examined in full, we considered 13 to be eligible for inclusion, and we found two additional studies by searching the reference sections of relevant reviews and by updating our search of databases of ongoing trials. These 15 records represented nine independent studies (De Villiers 2009; FLUCAD 2008; FLUVACS 2002; Govaert 1994; IVCAD 2009; Langley 2011a; NCT01945268; Phrommintikul 2011; Wu 2010) (some of the 15 records were conference abstracts and have not been listed in the reference section). One of the trials was available in abstract form only (IVCAD 2009), but we obtained additional information by contacting the study author. Six of these trials reported cardiovascular death (FLUCAD 2008; FLUVACS 2002; Govaert 1994; IVCAD 2009; Langley 2011a; Phrommintikul 2011) and could be included in a meta‐analysis of this outcome. Two had already been included in the previous version of the review (FLUCAD 2008; FLUVACS 2002), and the remainder were newly added.
Included studies
For details of the study characteristics of individual studies, see Characteristics of included studies.
Study design
All included RCTs were parallel trials using individual randomisation. Four were multi‐centre trials (De Villiers 2009; FLUVACS 2002; Govaert 1994; Langley 2011a). Trials were carried out in Argentina (FLUVACS 2002), China (Wu 2010), Iran (IVCAD 2009), North America (Langley 2011a), Poland (FLUCAD 2008), South Africa (De Villiers 2009), Thailand (Phrommintikul 2011) and the Netherlands (Govaert 1994). Follow‐up was provided between 42 days and one year after vaccination.
Participants
Study participants fell within three main groups (n = 12,029 in total). The first group of studies (n = 5267 participants) comprised two RCTs including healthy adults over 18 years of age (Langley 2011a) or between 18 and 60 years of age (Wu 2010). In the study by Langley 2011a, adults with controlled chronic disease were eligible, but no information was provided as to what proportion of participants had chronic disease. Wu 2010 excluded participants with chronic disease. Participants in the study by Langley 2011a were between 18 and 91 years of age (mean age of participants younger than 65 years was around 39 years, and 72 years for participants 65 years of age or older), and mean age was around 42 years in the study by Wu 2010. Between 40% and 47% of participants were men.
The second group of two studies (n = 5080) included participants of 60 years of age or older (De Villiers 2009; Govaert 1994) with controlled chronic conditions. Participants were between 60 and 98 years of age, mean age was around 70 years in the study by De Villiers 2009 and most participants were between 60 and 74 years old in the study by Govaert 1994. Between 39% and 49% of participants were men. Between 13.5% and 16% had cardiac disease (undefined), and 2% to 9% had diabetes mellitus. In the study by De Villiers 2009, 50.5% of participants had hypertension.
The third group comprised four studies (n = 1682) including participants with known coronary artery disease (FLUCAD 2008; FLUVACS 2002; IVCAD 2009; Phrommintikul 2011) with variable age cutoffs (older than 21 to older than 50 years). FLUCAD 2008 and FLUVACS 2002 reported outcomes for subgroups of participants with acute myocardial infarction (MI) and those undergoing coronary revascularisation procedures. IVCAD 2009 also included these two groups of participants without distinguishing between subgroups, and the study by Phrommintikul 2011 included participants admitted to hospital with an acute coronary syndrome. Mean age of participants was between 58 and 67 years, and between 52% and 74% were men. Studies included participants with acute MI (with ST or non‐ST segment MI) as well as those with coronary stenosis or angina and those undergoing revascularisation procedures. Details of the type of coronary artery disease, of cardiovascular comorbidities and of pharmacological therapy for cardiovascular conditions can be found in the Characteristics of included studies.
Interventions
Details of the vaccines received can be found in Characteristics of included studies. Six trials gave single injections of influenza vaccine, and two trials gave a second dose after 21 days (Langley 2011a; Wu 2010). Most trials compared one intervention group with a control group, and only Wu 2010 included six intervention groups with different doses of whole or split virion vaccines with or without aluminium hydroxide adjuvant. In most trials, the control group received placebo injections; one trial had a 'no intervention' control group (Phrommintikul 2011).
Outcome measures
For half of the trials, the primary focus was on prevention of influenza infection (influenza/influenza‐like illness or immunogenicity) and cardiovascular outcomes were reported among the safety analyses (De Villiers 2009; Govaert 1994; Langley 2011a; Wu 2010); for the other half, the focus was on secondary cardiovascular prevention (FLUCAD 2008; FLUVACS 2002; IVCAD 2009; Phrommintikul 2011).
Cardiovascular outcomes reported in safety analyses included cardiovascular death, stroke and angina.
Three of the secondary prevention studies included cardiovascular death in their primary outcomes. Other outcomes were composite outcomes (major adverse coronary event (MACE ‐ composite of cardiovascular death, acute MI, coronary revascularisation); coronary ischaemic event (MACE or hospitalisation for myocardial ischaemia); double or triple endpoint of cardiovascular death, nonfatal MI or severe recurrent ischaemia; acute coronary syndrome (acute MI or unstable angina)), acute MI, stroke, heart failure and unstable angina or coronary revascularisation (percutaneous cardiac intervention (PCI) or coronary artery bypass graft (CABG)).
Protection against influenza
If cardiovascular adverse events are associated with influenza infection, it is important to show that the vaccines were really effective in preventing infection. Four studies reported that influenza infections were significantly reduced by the vaccination (De Villiers 2009; FLUCAD 2008; Govaert 1994; IVCAD 2009); three studies reported that the vaccines produced adequate seroprotection (IVCAD 2009; Langley 2011a; Wu 2010); one study reported that no cases of influenza were seen over the initial six‐month follow‐up in the intervention or the comparison group (FLUVACS 2002); and one study did not report on the effectiveness of the vaccination against influenza (Phrommintikul 2011).
Funding
All trials reported their source of funding. One trial was funded by industry (De Villiers 2009), three had mixed industrial and non‐industrial funding (FLUCAD 2008; Langley 2011a; Wu 2010) and four reported only non‐industrial funding (FLUVACS 2002; Govaert 1994; IVCAD 2009; Phrommintikul 2011).
Ongoing studies
The ongoing trial (NCT01945268) is a double‐blind secondary prevention RCT carried out in Canada (see Characteristics of ongoing studies). Around 600 participants with heart disease (New York Heart Association functional class II, III and IV) are included, and the effects of influenza vaccination on major adverse vascular events are evaluated.
Excluded studies
We excluded 95 records for the following reasons: The study was not an RCT (n = 59), eligible outcomes were not reported (n = 20) or the study did not have a placebo or 'no intervention' group (n = 14). One record could not be obtained (but was unlikely to be an RCT) and one ongoing trial was identified (MacIntyre 2007), but contact with study authors suggested that the trial was abandoned and replaced by a case‐control study.
Risk of bias in included studies
The overall risk of bias of included studies is shown in Figure 2. Risk of bias for each individual study is shown in Figure 3. None of the studies fulfilled all of the specified criteria. The three studies of highest quality had small deficits in one or two of the criteria (De Villiers 2009; FLUCAD 2008; Wu 2010), three studies had deficits in three or four of the criteria (Govaert 1994; Langley 2011a; Phrommintikul 2011) and two studies had deficits in more than half of the risk of bias criteria (FLUVACS 2002; IVCAD 2009).
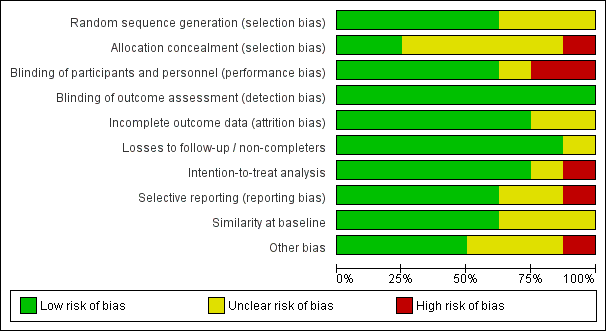
Risk of bias graph: review authors' judgements about each risk of bias item presented as percentages across all included studies.
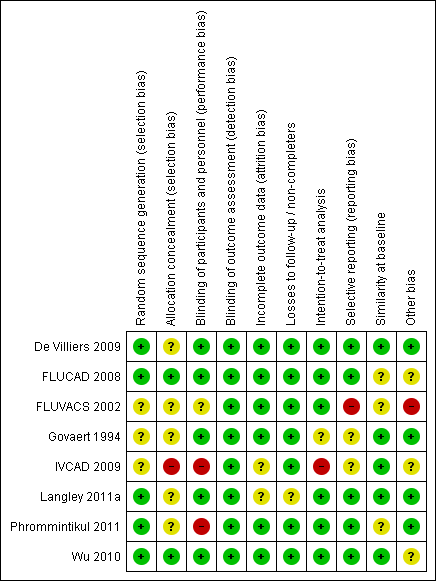
Risk of bias summary: review authors' judgements about each risk of bias item for each included study.
Allocation
The randomisation process was clearly reported and adequate in five studies (De Villiers 2009; FLUCAD 2008; Langley 2011a; Phrommintikul 2011; Wu 2010); the others were unclear about method of randomisation. Only two studies had clearly adequate allocation concealment (FLUCAD 2008; Wu 2010).
Blinding
All of the studies reported blinding of outcome assessment. Participants and personnel were blinded in five trials (De Villiers 2009; FLUCAD 2008; Govaert 1994; Langley 2011a; Wu 2010). One trial did not clearly describe whether participants and personnel were blinded (FLUVACS 2002); in the IVCAD 2009 study, only participants were blinded; and in another study (Phrommintikul 2011), blinding was not possible as the control was 'no intervention'.
Incomplete outcome data
Attrition bias was adequately addressed in most trials, and two studies did not provide a clear description (IVCAD 2009; Langley 2011a). Dropouts and losses to follow‐up were generally well balanced between comparison groups. The proportion of participants who completed the study ranged between 89% and 100% (over 95% for most studies). All but two studies (Govaert 1994; IVCAD 2009) clearly used intention‐to‐treat analysis.
Selective reporting
Most studies reported outcomes as outlined in the Methods section of the respective paper. The FLUVACS 2002 study reported on certain composite outcomes that were subsequently not reported, and some of the outcomes were only selectively reported in the subgroups assessed. Information on the IVCAD 2009 study was available only in abstract form and from information provided by the study author, so whether outcomes were reported as originally planned could not be assessed.
Other potential sources of bias
Most studies reported that comparison groups were balanced at baseline with respect to the most important characteristics. A difference in the proportion of participants taking calcium channel blockers at baseline may have been seen in the FLUCAD 2008 study (significance not reported). The authors of the FLUVACS 2002 study stated that groups were balanced with respect to age, sex and signs of necrosis (undefined), but some of the other parameters reported look less well balanced (e.g. hypertension, distribution of types of MI). In the study by Phrommintikul 2011, a small significant difference was observed in participants taking angiotensin‐converting enzyme (ACE) inhibitors/angiotensin II receptor blockers at baseline. Wu 2010 reported a limited number of baseline characteristics.
A power analysis was carried out and power was adequate in the following studies: De Villiers 2009; FLUCAD 2008; Langley 2011a; Phrommintikul 2011. A power analysis was carried out in the FLUVACS 2002 study, but the actual number of participants suggests that the study was underpowered for measuring the primary outcome.
Effects of interventions
Cardiovascular death
Cardiovascular death was reported by all secondary prevention studies and by three of the studies reporting mortality as part of their safety analyses. Overall analyses for cardiovascular death are shown in Analysis 1.2.
In the secondary prevention studies, significantly fewer cardiovascular deaths occurred in the vaccine group than in the control group (risk ratio (RR) 0.45, 95% confidence interval (CI) 0.26 to 0.76, P value 0.003) with no significant heterogeneity between studies. Cardiovascular death occurred in 2.3% of participants in the vaccine groups and in 5.1% of those in the control groups. Among individual studies, only FLUVACS 2002 reported a significantly lower cardiovascular death rate in the vaccine group than in the placebo group (6.2% vs 17.7%, P value 0.002) at one year; this was not maintained at two‐year follow‐up (P value 0.14). Among subgroups of participants with acute coronary syndromes/MI and those with stable angina/percutaneous cardiac interventions in the FLUCAD 2008 and FLUVACS 2002 studies, no significant difference in cardiovascular death was seen in either of the subgroups overall.
In studies reporting cardiovascular death as part of their safety analyses, no significant difference in cardiovascular death was observed between vaccine and placebo groups. Cardiovascular death occurred in 0.7% of participants in the vaccine groups and in 0.8% of participants in the placebo groups.
The outcome reported by De Villiers 2009 was death from all causes; the distribution of causes of death was not given for the comparison groups, but study authors stated that the most frequent causes of death were MI, cardiac failure and cerebrovascular disorders, and that these occurred in statistically similar proportions of vaccine and placebo recipients (all P values ≥ 0.422; Analysis 1.1).
Other cardiovascular outcomes
Analysis 1.4 to Analysis 1.14 show results for other cardiovascular events as reported by study investigators.
Studies targeting a reduction in cardiovascular events reported a range of cardiovascular outcomes.
In the FLUCAD 2008 study, no significant differences in major adverse coronary events (MACE ‐ cardiovascular death, MI or coronary revascularisation) over 12 months were reported in the vaccine group compared with the placebo group (3.00% vs 5.87%, P value 0.13; Analysis 1.3). However, the rate of coronary ischaemic events (MACE or hospitalisation for myocardial ischaemia) over 12 months was significantly lower in the vaccine group than in the placebo group (6.02% vs 9.97%, P value 0.047; Analysis 1.4). This applied to the participant population overall and to the subgroup with an acute coronary syndrome, but no significant difference in coronary ischaemic events was noted in the subgroup with stable angina. No significant difference was reported between groups in terms of individual cardiac events, namely, cardiovascular death, MI (ST segment elevation MI (STEMI) or non‐ST segment elevation MI (NSTEMI)), coronary revascularisation or hospitalisation for myocardial ischaemia (see Analysis 1.15; Analysis 1.10; Analysis 1.14). This applied to the participant population overall and to both subgroups (those with an acute coronary syndrome and those with stable angina). Multi‐variate analyses identified female sex (hazard ratio (HR) 2.15, 95% CI 1.11 to 4.15%, P value 0.024) and recent acute coronary syndrome (HR 2.93, 95% CI 1.52 to 5.65, P value 0.001) as predictors of coronary ischaemic events, and influenza vaccination was found to be protective (HR 0.38, 95% CI 0.19 to 0.78, P value 0.009). No effects were seen for age, smoking, hypertension, elevated low‐density lipoprotein (LDL)‐cholesterol, low high‐density lipoprotein (HDL)‐cholesterol or presence of diabetes mellitus.
In the FLUVACS 2002 study (see Analysis 1.5; Analysis 1.6; Analysis 1.15; Analysis 1.10; Analysis 1.14), the triple endpoint (acute MI, rehospitalisation for recurrent angina, death) was seen less frequently in the vaccine group than in the placebo group for the whole population (RR 0.50, 95% CI 0.29 to 0.85, P value 0.009) and in the subgroup with acute MI (RR 0.42, 95% CI 0.21 to 0.83, P value 0.008) but not for the PCI stenting subgroup at six months. No significant difference in MI was reported in either subgroup. Also no significant differences in cardiac revascularisation were noted in the PCI stenting group. Among participants with acute MI, significantly fewer were rehospitalised for ischaemia in the vaccine group (RR 0.33, 95% CI 0.11 to 1.0, P value 0.03), and significantly fewer participants had a double endpoint (of reinfarction, hospitalisation for ischaemia and death) (RR 0.30, 95% CI 0.22 to 1.28, P value 0.03). These results were largely maintained at one‐year follow‐up. In the whole study group, 22% of participants had a triple endpoint in the vaccine group and 37% in the placebo group (RR 0.59, 95% CI 0.4 to 0.86, P value 0.004). The difference was also significant in the subgroup with acute MI at one year (19% vs 42%, RR 0.44, 95% CI 0.27 to 0.71, P value 0.0003) but not in the PCI stenting group. Significant benefit of the vaccination for occurrence of the double endpoint was seen only in the MI subgroup (10% vs 28%, RR 0.37, 95% CI 0.19 to 0.72, P value 0.002), not in the whole study population. No significant difference in MI or rehospitalisation for ischaemia was seen. Cox regression analyses were done for the combined triple endpoint at one year for the following subgroups: participants older or younger than 65 years, those with ST segment elevation or non‐ST segment elevation MI, participants with elevation or no elevation of enzymes at entry, those with diabetes or no diabetes, participants with a history or no history of smoking, those with thrombolysis in myocardial infarction (TIMI) risk score below or above 6 and participants with a history or no history of revascularisation. Significantly greater benefit with influenza vaccination was seen among participants with non‐ST segment elevation MI (RR 0.13, 95% CI 0.03 to 0.52, P value 0.004), those older than 65 years (RR 0.36, 95% CI 0.14 to 0.92, P value not given), non‐smokers (RR 0.18, 95% CI 0.05 to 0.57, P value not given) and those at high risk for future ischaemic episodes (TIMI risk score > 6) (RR 0.22, 95% CI 0.06 to 0.87, P value not given).
The IVCAD 2009 study reported no significant differences between the vaccination group and the placebo group in individual cardiovascular outcomes over one year (CABG, PCI, MI, episodes of unstable angina, cardiovascular death; see Analysis 1.8; Analysis 1.9; Analysis 1.10; Analysis 1.13). Significantly more participants with at least one cardiac adverse event (acute coronary syndrome, coronary revascularisation, cardiovascular death) were reported in the placebo group than in the vaccine group at six months, but this finding was not maintained at one‐year follow‐up (29% in the intervention group vs 26% in the placebo group, P value 0.6; Analysis 1.7). Study authors also reported that angina severity scores were more improved in the vaccine group than in the placebo group.
In the study by Phrommintikul 2011 (see Analysis 1.3; Analysis 1.11; Analysis 1.12; Analysis 1.14), participants in the vaccine group had significantly fewer major adverse coronary events (MACE, composite of cardiovascular death or hospitalisation for acute coronary syndrome, heart failure or stroke) at 12 months than did participants in the placebo group (9.5% vs 19.3%, unadjusted HR 0.70, 95% CI 0.57 to 0.86, P value 0.004). The rate of hospitalisation for acute coronary syndrome was also significantly lower in the vaccine group than in the placebo group (4.5% vs 10.6%, unadjusted HR 0.73, 95% CI 0.55 to 0.91, P value 0.032). Effects for these two outcomes remained significant with adjustments for age, sex, serum creatinine, ACE inhibitor treatment and coronary revascularisation. No significant difference was reported for cardiovascular death, hospitalisation for heart failure or hospitalisation for stroke. No significant difference in effects for MACE was observed for the following subgroups: participants younger than 65 years or older than 65 years, male or female participants, those with or without diabetes mellitus, participants with ST segment elevation or non‐ST segment elevation MI, those with serum creatinine levels less than 1.1 mg/dL or greater than 1.1. mg/dL and participants with or without revascularisation.
Limited information on non‐fatal cardiovascular adverse events was reported by studies that included cardiovascular events in their safety analyses. Govaert 1994 reported three cases of ‘intercurrent illness (undefined), cerebrovascular accident’ ‐ two in the placebo group (0.2%) and one in the vaccine group (0.1%) (RR 0.49, 95% CI 0.04 to 5.41). Wu 2010 reported five cases of angina in the intervention groups (0.8%) and none in the placebo groups (RR 1.83, 95% CI 0.1 to 32.85).
Adverse events
De Villiers 2009 reported that more reactogenicity events (including runny nose/nasal congestion, cough, sore throat, headache, muscle aches, tiredness and decreased appetite) occurred in the vaccine group 11 days after vaccination (P value 0.042). No significant differences in serious adverse events were observed between vaccination and placebo groups over four weeks (1% vs 1.5%, P value 0.27) or eight months (10.1% vs 8.6%) post vaccination.
In the study by Langley 2011a, no significant differences were observed between vaccine and placebo groups over one year in reporting of one or more serious adverse events (3.2% vs 4.0%) or reporting of one or more medically attended events (30% vs 30.4%).
Wu 2010 reported the following rates of adverse events for the different intervention groups over 42 days: whole virion + Al 5 µg 12.9%, whole virion + Al 10 µg 19.6%, split virion + Al 7.5 µg 14.9%, split virion + Al 15 µg 12.0%, split virion 15 µg 7.9%, split virion 30 µg 11.9% and placebo 7.0%. The highest rate was seen with whole virion + Al 10 µg vaccine (P value 0.016 vs whole virion + Al 15 µg), but no significant association with dosage, presence of aluminium adjuvant or type of vaccine (whole virion vs split virion) was described. The rate of mild adverse events ranged between 5.0% and 17.6%, that of moderate adverse events between 0 and 2.0% and that of severe adverse events between 0 and 1%.
No adverse events beyond the cardiovascular outcomes already summarised were reported in the following studies: FLUCAD 2008, Govaert 1994, IVCAD 2009 and Phrommintikul 2011.
Discussion
Summary of main results
We included eight trials of influenza vaccination compared with placebo or no vaccination, with 12,029 participants receiving at least one vaccination or control treatment. Four of these trials (n = 10,347) focused on prevention of influenza in general or elderly populations and reported cardiovascular outcomes among their safety analyses, and four trials (n = 1682) focused on prevention of cardiovascular events among participants with established coronary heart disease. Follow‐up was between 42 days and one year. When reported (seven studies), vaccination provided adequate immunogenicity or protection against influenza. Cardiovascular mortality was reported by four secondary prevention trials and was significantly reduced by influenza vaccination (risk ratio (RR) 0.45, 95% confidence interval (CI) 0.26 to 0.76, P value 0.003) with no significant heterogeneity between studies. In three trials reporting cardiovascular mortality as part of their safety analyses, no differences were found between study groups, but numbers of events were too small to permit conclusions. Among studies of participants with coronary heart disease, composite outcomes of cardiovascular events also tended to be decreased with influenza vaccination compared with placebo. Generally no significant difference was observed between comparison groups regarding individual outcomes such as myocardial infarction.
Overall completeness and applicability of evidence
As the main focus of the general population studies including cardiovascular events in their safety analyses was not cardiovascular prevention, these studies were most likely underpowered for assessing cardiovascular events. Often reporting of cardiovascular death and of details on non‐fatal cardiovascular events was very limited. Studies of participants with coronary heart disease generally included small sample sizes (around 100 to 150 participants per comparison group in most), often without power analyses or with clear evidence that they were underpowered.
Quality of the evidence
Moderate risk of bias was seen, with five RCTs showing deficits in at least three of the risk of bias criteria assessed. This included three studies of participants with coronary artery disease, and only one of these studies was rated as having low risk of bias (FLUCAD 2008).
Potential biases in the review process
This review included only randomised controlled trials (RCTs) conducted to assess effects of influenza vaccination on cardiovascular events. Given that these events are rare, especially in primary prevention trials, future updates of the review may benefit from more detailed examination of observational data on the association between influenza vaccination and prevention of cardiovascular events.
Agreements and disagreements with other studies or reviews
We identified two other systematic reviews of the association between influenza vaccination and cardiovascular outcomes (Loomba 2012; Udell 2013). Loomba 2012 summarised three RCTs and two observational studies including a total of 292,383 participants. Included studies examined participants with cardiovascular disease and mixed populations with and without cardiovascular disease. Overall, their meta‐analyses showed a significant reduction in all‐cause mortality (odds ratio (OR) 0.61, 95% CI 0.57 to 0.64), MI (OR 0.73, 95% CI 0.57 to 0.93) and major adverse cardiovascular events (OR 0.47, 95% CI 0.29 to 0.74). The review had some quality deficits, and results should be viewed with caution.
The systematic review by Udell 2013 was of higher quality. The review authors included RCTs (sample size of at least 50) of adults comparing experimental or commercially approved influenza vaccinations with placebo, no vaccination or another vaccination strategy. The same four trials of participants with coronary artery disease examining cardiovascular outcomes were included as in the present review (FLUCAD 2008; FLUVACS 2002; IVCAD 2009; Phrommintikul 2011), along with two of the studies including cardiovascular events in their safety analyses (De Villiers 2009; Govaert 1994), as well as safety analyses of six RCTs comparing different vaccine formulations. A meta‐analysis of five RCTs (three of participants with coronary artery disease and two with cardiovascular events in their safety analyses) showed a significant reduction in composite cardiovascular events with influenza vaccination compared with control (2.9% vs 4.7%, RR 0.64, 95% CI 0.48 to 0.86, P value 0.003). When cardiovascular mortality was examined in the same five trials, no significant effect was seen overall (RR 0.81, 95% CI 0.36 to 1.83, P value 0.61). The greatest effects of the vaccine were seen among participants at highest risk with more active coronary disease. These results are consistent with those of the present review.
Findings of this review are in line with international recommendations for practice. Patients with chronic heart disease are generally believed to be at high risk for influenza infection, and different guidelines highly recommend use of influenza vaccine in these groups.
The current influenza vaccination guideline in the UK recommends annual influenza vaccination for patients with chronic heart disease, including those with congenital heart disease, hypertension with cardiac complications or chronic heart failure, and for individuals requiring regular medication and/or follow‐up for ischaemic heart disease (UK Dept of Health 2014/15). Both the European Centre for Disease Prevention and Control (ECDPC) and the US Centers for Disease Control and Prevention (CDC) recommend influenza vaccination for individuals with chronic cardiovascular diseases such as congenital heart disease, congestive heart failure and coronary artery disease (CDC Europe 2014/15; CDC USA 2015).
The World Health Organization (WHO) categorises patients with cardiac diseases (atherosclerotic heart disease, cardiomyopathy/chronic congestive heart failure and congenital heart disease) in the high‐risk group and recommends annual influenza vaccination in accordance with resources available in each country (WHO 2012).

Study flow diagram.

Risk of bias graph: review authors' judgements about each risk of bias item presented as percentages across all included studies.

Risk of bias summary: review authors' judgements about each risk of bias item for each included study.

Comparison 1 Vaccine versus placebo, Outcome 1 All‐cause mortality.

Comparison 1 Vaccine versus placebo, Outcome 2 Cardiovascular death.

Comparison 1 Vaccine versus placebo, Outcome 3 Major adverse coronary events (MACE).

Comparison 1 Vaccine versus placebo, Outcome 4 Coronary ischaemic event (MACE or hospitalisation for myocardial ischaemia).

Comparison 1 Vaccine versus placebo, Outcome 5 Double endpoint (CV death, non‐fatal MI or severe recurrent ischaemia).

Comparison 1 Vaccine versus placebo, Outcome 6 Triple endpoint (CV death, non‐fatal MI or severe recurrent ischaemia).

Comparison 1 Vaccine versus placebo, Outcome 7 At least 1 cardiovascular event.

Comparison 1 Vaccine versus placebo, Outcome 8 Coronary artery bypass graft (CABG).

Comparison 1 Vaccine versus placebo, Outcome 9 Percutaneous coronary intervention (PCI).

Comparison 1 Vaccine versus placebo, Outcome 10 Myocardial infarction.

Comparison 1 Vaccine versus placebo, Outcome 11 Stroke/hospitalisation for acute stroke.

Comparison 1 Vaccine versus placebo, Outcome 12 Hospitalisation for heart failure.

Comparison 1 Vaccine versus placebo, Outcome 13 Angina/unstable angina.

Comparison 1 Vaccine versus placebo, Outcome 14 Hospitalisation for acute coronary syndrome/myocardial ischaemia.

Comparison 1 Vaccine versus placebo, Outcome 15 Coronary revascularisation (PCI/CABG).
| Outcome or subgroup title | No. of studies | No. of participants | Statistical method | Effect size |
| 1 All‐cause mortality Show forest plot | 1 | Risk Ratio (M‐H, Random, 95% CI) | Totals not selected | |
| 1.1 Safety analysis studies including cardiovascular outcomes | 1 | Risk Ratio (M‐H, Random, 95% CI) | 0.0 [0.0, 0.0] | |
| 2 Cardiovascular death Show forest plot | 6 | Risk Ratio (M‐H, Random, 95% CI) | Subtotals only | |
| 2.1 Secondary prevention studies | 4 | 1667 | Risk Ratio (M‐H, Random, 95% CI) | 0.44 [0.26, 0.76] |
| 2.2 Secondary prevention studies ‐ participants with stable angina/PCI | 2 | 602 | Risk Ratio (M‐H, Random, 95% CI) | 0.35 [0.07, 1.73] |
| 2.3 Secondary prevention studies ‐ participants with acute coronary symptoms/MI | 2 | 350 | Risk Ratio (M‐H, Random, 95% CI) | 0.46 [0.04, 5.20] |
| 2.4 Safety analysis studies including cardiovascular outcomes | 2 | 6399 | Risk Ratio (M‐H, Random, 95% CI) | 0.70 [0.06, 7.62] |
| 3 Major adverse coronary events (MACE) Show forest plot | 2 | Risk Ratio (M‐H, Random, 95% CI) | Totals not selected | |
| 3.1 All | 2 | Risk Ratio (M‐H, Random, 95% CI) | 0.0 [0.0, 0.0] | |
| 3.2 Participants with acute coronary symptoms | 1 | Risk Ratio (M‐H, Random, 95% CI) | 0.0 [0.0, 0.0] | |
| 3.3 Participants with stable angina | 1 | Risk Ratio (M‐H, Random, 95% CI) | 0.0 [0.0, 0.0] | |
| 4 Coronary ischaemic event (MACE or hospitalisation for myocardial ischaemia) Show forest plot | 1 | Risk Ratio (M‐H, Random, 95% CI) | Totals not selected | |
| 4.1 All | 1 | Risk Ratio (M‐H, Random, 95% CI) | 0.0 [0.0, 0.0] | |
| 4.2 Participants with acute coronary symptoms | 1 | Risk Ratio (M‐H, Random, 95% CI) | 0.0 [0.0, 0.0] | |
| 4.3 Participants with stable angina | 1 | Risk Ratio (M‐H, Random, 95% CI) | 0.0 [0.0, 0.0] | |
| 5 Double endpoint (CV death, non‐fatal MI or severe recurrent ischaemia) Show forest plot | 1 | Risk Ratio (M‐H, Random, 95% CI) | Totals not selected | |
| 5.1 All | 1 | Risk Ratio (M‐H, Random, 95% CI) | 0.0 [0.0, 0.0] | |
| 5.2 Myocardial infarction | 1 | Risk Ratio (M‐H, Random, 95% CI) | 0.0 [0.0, 0.0] | |
| 6 Triple endpoint (CV death, non‐fatal MI or severe recurrent ischaemia) Show forest plot | 1 | Risk Ratio (M‐H, Random, 95% CI) | Totals not selected | |
| 6.1 All | 1 | Risk Ratio (M‐H, Random, 95% CI) | 0.0 [0.0, 0.0] | |
| 6.2 Myocardial infarction | 1 | Risk Ratio (M‐H, Random, 95% CI) | 0.0 [0.0, 0.0] | |
| 6.3 PCI | 1 | Risk Ratio (M‐H, Random, 95% CI) | 0.0 [0.0, 0.0] | |
| 7 At least 1 cardiovascular event Show forest plot | 1 | Risk Ratio (M‐H, Random, 95% CI) | Totals not selected | |
| 8 Coronary artery bypass graft (CABG) Show forest plot | 1 | Risk Ratio (M‐H, Random, 95% CI) | Totals not selected | |
| 9 Percutaneous coronary intervention (PCI) Show forest plot | 1 | Risk Ratio (M‐H, Random, 95% CI) | Totals not selected | |
| 10 Myocardial infarction Show forest plot | 3 | Risk Ratio (M‐H, Random, 95% CI) | Totals not selected | |
| 10.1 All | 2 | Risk Ratio (M‐H, Random, 95% CI) | 0.0 [0.0, 0.0] | |
| 10.2 Participants with acute coronary symptoms/MI | 2 | Risk Ratio (M‐H, Random, 95% CI) | 0.0 [0.0, 0.0] | |
| 10.3 Participants with stable angina/PCI | 2 | Risk Ratio (M‐H, Random, 95% CI) | 0.0 [0.0, 0.0] | |
| 11 Stroke/hospitalisation for acute stroke Show forest plot | 1 | Risk Ratio (M‐H, Random, 95% CI) | Totals not selected | |
| 12 Hospitalisation for heart failure Show forest plot | 1 | Risk Ratio (M‐H, Random, 95% CI) | Totals not selected | |
| 13 Angina/unstable angina Show forest plot | 1 | Risk Ratio (M‐H, Random, 95% CI) | Totals not selected | |
| 14 Hospitalisation for acute coronary syndrome/myocardial ischaemia Show forest plot | 3 | Risk Ratio (M‐H, Random, 95% CI) | Totals not selected | |
| 14.1 All | 2 | Risk Ratio (M‐H, Random, 95% CI) | 0.0 [0.0, 0.0] | |
| 14.2 Participants with acute coronary symptoms | 2 | Risk Ratio (M‐H, Random, 95% CI) | 0.0 [0.0, 0.0] | |
| 14.3 Participants with stable angina | 1 | Risk Ratio (M‐H, Random, 95% CI) | 0.0 [0.0, 0.0] | |
| 15 Coronary revascularisation (PCI/CABG) Show forest plot | 2 | Risk Ratio (M‐H, Random, 95% CI) | Totals not selected | |
| 15.1 All | 1 | Risk Ratio (M‐H, Random, 95% CI) | 0.0 [0.0, 0.0] | |
| 15.2 Participants with acute coronary symptoms | 1 | Risk Ratio (M‐H, Random, 95% CI) | 0.0 [0.0, 0.0] | |
| 15.3 Participants with stable angina | 2 | Risk Ratio (M‐H, Random, 95% CI) | 0.0 [0.0, 0.0] | |