Different dosage schedules for reducing cardiotoxicity in people with cancer receiving anthracycline chemotherapy
Abstract
Background
This review update has been managed by both the Childhood Cancer and Cochrane Gynaecological, Neuro-oncology and Orphan Cancer Groups.
The use of anthracycline chemotherapy is limited by the occurrence of cardiotoxicity. To prevent this cardiotoxicity, different anthracycline dosage schedules have been studied.
Objectives
To determine the occurrence of cardiotoxicity with the use of different anthracycline dosage schedules (that is peak doses and infusion durations) in people with cancer.
Search methods
We searched the databases of the Cochrane Register of Controlled Trials (CENTRAL) (the Cochrane Library, Issue 11, 2015), MEDLINE (1966 to December 2015), and EMBASE (1980 to December 2015). We also searched reference lists of relevant articles, conference proceedings, experts in the field, and ongoing trials databases.
Selection criteria
Randomised controlled trials (RCTs) in which different anthracycline dosage schedules were compared in people with cancer (children and adults).
Data collection and analysis
Two review authors independently performed the study selection, the 'Risk of bias' assessment, and data extraction. We performed analyses according to the guidelines of the Cochrane Handbook for Systematic Reviews of Interventions.
Main results
We identified 11 studies: 7 evaluated different infusion durations (803 participants), and 4 evaluated different peak doses (5280 participants). Seven studies were RCTs addressing different anthracycline infusion durations; we identified long‐term follow‐up data for one of the trials in this update. The meta‐analysis showed a statistically significant lower rate of clinical heart failure with an infusion duration of six hours or longer as compared to a shorter infusion duration (risk ratio (RR) 0.27; 95% confidence interval 0.09 to 0.81; 5 studies; 557 participants). The majority of participants included in these studies were adults with different solid tumours. For different anthracycline peak doses, we identified two RCTs addressing a doxorubicin peak dose of less than 60 mg/m2 versus 60 mg/m2 or more, one RCT addressing a liposomal doxorubicin peak dose of 25 mg/m2 versus 50 mg/m2, and one RCT addressing an epirubicin peak dose of 83 mg/m2 versus 110 mg/m2. A significant difference in the occurrence of clinical heart failure was identified in none of the studies. The participants included in these studies were adults with different solid tumours. High or unclear 'Risk of bias' issues were present in all studies.
Authors' conclusions
An anthracycline infusion duration of six hours or longer reduces the risk of clinical heart failure, and it seems to reduce the risk of subclinical cardiac damage. Since there is only a small amount of data for children and data obtained in adults cannot be extrapolated to children, different anthracycline infusion durations should be evaluated further in children.
We identified no significant difference in the occurrence of clinical heart failure in participants treated with a doxorubicin peak dose of less than 60 mg/m2 or 60 mg/m2 or more. Only one RCT was available for the other identified peak doses, so we can make no definitive conclusions about the occurrence of cardiotoxicity. More high‐quality research is needed, both in children and adults and in leukaemias and solid tumours.
PICO
Plain language summary
Different dosage schedules for reducing damage to the heart in people with cancer receiving anthracycline chemotherapy
Review question
We reviewed the evidence of different anthracycline dosage schedules to cause damage to the heart in people with cancer of all ages receiving anthracycline chemotherapy. We also looked at tumour response, participant survival, adverse effects other than damage to the heart, and quality of life.
Background
Anthracyclines are one of the most effective treatments for various types of cancer. Unfortunately, there is a risk of heart damage depending on the total dose a patient has received. In an effort to prevent heart damage, different anthracycline dosage schedules such as different infusion durations or different individual peak doses (the maximal dose received in one week) are being used.
Study characteristics
The evidence is current to December 2015.
We found 11 studies: 7 evaluated different infusion durations (803 participants), and 4 evaluated different peak doses (5280 participants). Participants had different types of cancer.
Key results
For the use of different anthracycline infusion durations, the authors found that an anthracycline infusion duration of six hours or longer reduces the risk of clinical heart failure (for example shortness of breath or leg oedema), and it seems to reduce the risk of subclinical heart failure (that is heart damage diagnosed for example by an echocardiography in people without symptoms). Only a small amount of data was available for children and individuals with leukaemia, since most studies evaluating different anthracycline infusion durations were performed in adults with solid tumours.
Based on the currently available evidence, we are not able to favour either a doxorubicin peak dose of less than 60 mg/m2 or 60 mg/m2 or more. There was not enough high‐quality evidence available for the use of other anthracycline peak doses to be able to draw conclusions. No data were available for children and individuals with leukaemia.
Further high‐quality research is needed.
Quality of the evidence
All studies had problems relating to quality of the evidence.
Authors' conclusions
Background
Anthracyclines are among the most effective drugs used in chemotherapy for people with cancer and are widely used to treat both solid tumours and leukaemia in both adults and children. However, their use is limited because they often cause damage to the heart, especially if given high doses (Bonadonna 1969; Lefrak 1973; Van Dalen 2006b; Van der Pal 2012).
Heart damage after anthracycline therapy can be divided into early and late cardiotoxicity according to the time of presentation: early cardiotoxicity refers to heart damage that develops during anthracycline therapy or in the first year after its completion, and late cardiotoxicity manifests itself at least one year after the completion of anthracycline therapy (Shan 1996). The risk of developing heart failure remains a lifelong threat, especially for children and young adults, who have a long life expectancy after successful treatment for cancer. The risk of developing clinical heart failure 20 years after anthracycline therapy for childhood cancer is estimated to be approximately 5.5%, and 9.8% if treated with doses of 300 mg/m2 or more (Van Dalen 2006b).
Heart damage can occur as either subclinical cardiotoxicity or clinical cardiotoxicity. The term subclinical cardiotoxicity is used to describe various cardiac abnormalities, diagnosed with different diagnostic methods in patients without symptoms. Examples are histological abnormalities according to the Billingham score (Billingham 1978), or abnormalities in cardiac function measured by echocardiography or radionuclide ventriculography. Clinical cardiotoxicity is defined on the basis of symptoms of clinical heart failure and confirmed by an abnormal diagnostic test. In end‐stage clinical heart failure, heart transplantation is the only remaining option to avoid cardiac death.
The reported frequency of both clinical and subclinical cardiotoxicity after anthracycline therapy varies widely. In children, the prevalence of subclinical cardiac damage has been reported to be more than 57% at a median of 6.4 years after treatment (Kremer 2002a), and the incidence of clinical heart failure as high as 16% 0.9 to 4.8 years after treatment (Kremer 2002b). In adults, the prevalence of subclinical cardiac damage has been reported to be 36% during anthracycline therapy (Nousiainen 2002), and the incidence of clinical heart failure 30% at a median of 37 months after treatment (Meinardi 2002). However, we did not perform systematic reviews on the frequency of anthracycline‐induced cardiotoxicity in adults. Part of this variation can be explained by the type of anthracycline used, the total anthracycline dose, and the presence of additional risk factors for developing heart damage, such as radiation therapy involving the heart region, type of tumour, exposure to cyclophosphamide, mitoxantrone, iphosphamide, amsacrine, trastuzumab or taxanes, or the presence of pre‐existing heart disease. There also seems to be a higher risk for females, children, and elderly people (Kremer 2002b; Ng 2006; Simbre 2005; Van Dalen 2004).
Clinicians confront a clinical dilemma as they balance the anti‐tumour efficacy of anthracyclines against the associated cardiotoxicity. In an effort to prevent or reduce this toxicity, extensive research has been devoted to the identification of methods or drugs capable of ameliorating this toxicity, such as different anthracycline derivates (for example doxorubicin, daunorubicin, epirubicin, and liposomal preparations) (Batist 2001; Muggia 1991; Van Dalen 2010), cardioprotective agents (for example dexrazoxane) (Van Dalen 2011), or omitting anthracyclines altogether (Van Dalen 2014). A different approach is the use of less cardiotoxic dosage schedules for anthracycline chemotherapy, that is peak anthracycline doses and duration of infusion of anthracycline therapy (Legha 1982; Lipshultz 2002).
An important question regarding any anthracycline dosage schedule is whether it has a lower cardiotoxic effect without reducing the anti‐tumour efficacy and without negative effects on toxicities other than cardiac damage, such as alopecia, nausea, vomiting, stomatitis, diarrhoea, fatigue, anaemia, leukopenia, and thrombocytopenia.
This is the second update of the first systematic review on the cardiotoxicity of different anthracycline dosage schedules (Van Dalen 2006; Van Dalen 2009). Since we performed the first update, long‐term follow‐up data on the use of different anthracycline infusion durations in children with acute lymphoblastic leukaemia have become available. We have included all new evidence in this update.
Objectives
To determine the occurrence of cardiotoxicity with the use of different anthracycline dosage schedules (that is peak doses and infusion durations) in people with cancer.
Methods
Criteria for considering studies for this review
Types of studies
Randomised controlled trials comparing the occurrence of heart damage with the use of any type of dosage schedule of anthracycline chemotherapy with another type of dosage schedule.
Types of participants
People with cancer (both adults and children) who received anthracycline chemotherapy.
Types of interventions
The same anthracycline derivative with the same (cumulative) anthracycline dose but with different types of dosage schedules, that is different peak dose (defined as the maximal dose received in one week) or different infusion duration. For the same cumulative anthracycline dose, we used the following definition: in the design of the study it should have been the intention to treat both the intervention and control group with the same cumulative anthracycline dose, and the difference in the actually received median or mean cumulative anthracycline dose between both treatment groups should not differ by more than 100 mg/m2 of body surface area. Chemotherapy other than anthracyclines and radiotherapy involving the heart region should be the same in both treatment groups.
Types of outcome measures
Primary outcomes
Heart failure, that is clinical heart failure or subclinical cardiac damage, or both (definitions: clinical heart failure as defined by the authors; subclinical cardiac damage defined as either histological abnormalities according to the Billingham score on myocardial biopsy (Billingham 1978), or abnormalities in cardiac function measured by echocardiography or radionuclide ventriculography). If possible, we assessed both early and late cardiotoxicity (early cardiotoxicity refers to heart damage that develops during anthracycline therapy or in the first year after its completion, and late cardiotoxicity manifests itself at least one year after the completion of anthracycline therapy).
Secondary outcomes
Potential adverse effects of the different types of anthracycline dosage schedules on:
-
tumour response;
-
participant survival (progression‐free survival and overall survival);
-
toxicities other than cardiac damage;
-
quality of life.
Search methods for identification of studies
Electronic searches
We searched the electronic databases of the Cochrane Central Register of Controlled Trials (CENTRAL) (Cochrane Library, Issue 11, 2015), MEDLINE/PubMed (from 1966 to 9 December 2015), and EMBASE/Ovid (from 1980 to 9 December 2015). The search strategies for the different databases (using a combination of subject headings and text word terms) are stated in Appendix 1, Appendix 1, and Appendix 2. For the updates of this review (the current one and the first one in November 2008), we adapted the search strategies used in the original search (until June 2004). The exact changes are stated in the Appendices.
Searching other resources
We located information about trials not registered in CENTRAL, MEDLINE, or EMBASE, either published or unpublished, by searching the reference lists of relevant articles and reviews. In addition, we also searched the conference proceedings of the International Society of Paediatric Oncology (SIOP) and the American Society of Clinical Oncology (ASCO) from 2000 to 2015. We searched for ongoing trials by scanning the ISRCTN register and ClinicalTrials.gov (both screened 27 December 2015). We asked experts in the field for potentially relevant articles. We imposed no language restriction.
Data collection and analysis
Selection of studies
Two review authors (EvD, HvdP), after performing the search strategy described previously, independently undertook identification of studies meeting the inclusion criteria. We resolved any discrepancies by consensus. We did not require any third‐party arbitration. Any study seemingly meeting the inclusion criteria on grounds of the title or abstract, or both, was obtained in full for closer inspection.
Data extraction and management
Two review authors (EvD, HvdP) independently extracted the data using standardised forms. We extracted data of the characteristics of participants (such as age, sex, type of malignancy), interventions (such as cumulative anthracycline dose, peak dose, infusion duration), outcome measures, and length of follow‐up. We resolved any discrepancies by consensus. We did not require any third‐party arbitration.
Assessment of risk of bias in included studies
Two review authors (EvD, HvdP, LK) independently assessed the risk of bias in included studies. We assessed the risk of bias as described in the module of Cochrane Childhood Cancer (Kremer 2014), which is based on the Cochrane Handbook for Systematic Reviews of Interventions (Higgins 2011). We assessed the following items:
-
random sequence generation (selection bias);
-
allocation concealment (selection bias);
-
blinding of participants and personnel (performance bias);
-
blinding of outcome assessment (detection bias; for each outcome separately);
-
incomplete outcome data (attrition bias; for each outcome separately);
-
selective reporting (reporting bias); and
-
other potential sources of bias.
We resolved any discrepancies by consensus. We did not require any third‐party arbitration.
Data synthesis
We entered data into Review Manager 2014 and analysed the data according to the guidelines in the Cochrane Handbook for Systematic Reviews of Interventions (Higgins 2008). Dichotomous variables were related to risk using the risk ratio. If possible, we extracted data by allocation intervention, irrespective of compliance with the allocated intervention, in order to allow an intention‐to‐treat analysis. If this was not possible, we stated this. We assessed heterogeneity by both visual inspection of the forest plots and by a formal statistical test for heterogeneity, that is the I2 statistic (I2 greater than 50% was considered substantial heterogeneity). If there was evidence of substantial heterogeneity, we reported this. We used a random‐effects model throughout the review. We presented all the results with the corresponding 95% confidence interval. For survival, we used the generic inverse variance function of Review Manager 2014 to combine logs of the hazard ratios (HRs). Where necessary, we used Parmar's method to extract the log of the HR and its standard error (Parmar 1998). We otherwise summarised survival qualitatively. For different anthracycline infusion durations, we used six hours as a cut‐off point (that is greater than or equal to six hours versus less than six hours). In the protocol we stated that we would analyse different anthracycline peak doses as high (greater than or equal to 50 mg/m2) versus low doses (less than 50 mg/m2) received in one week. However, if we would have applied this definition to the included studies, pooling would not have been possible. Therefore, keeping in mind that any cut‐off point would be arbitrary, we decided to define a low peak dose as less than 60 mg/m2 of the same anthracycline derivative in one week and a high peak dose as greater than or equal to 60 mg/m2 of the same anthracycline derivative in one week. Outcomes for which we could extract data from only one trial were summarised qualitatively. We took into account the risk of bias of included studies in the analyses and interpretation of the results of the review. For all outcomes for which pooling was possible, we performed sensitivity analyses for all 'Risk of bias' criteria separately. We excluded the low‐quality studies and the studies for which the quality was unclear and compared the results of the good‐quality studies with the results of all available studies. It was our intention to perform subgroup analyses for children and adults and leukaemias and solid tumours, but unfortunately this was not possible (see Results for reasons).
Results
Description of studies
Results of the search
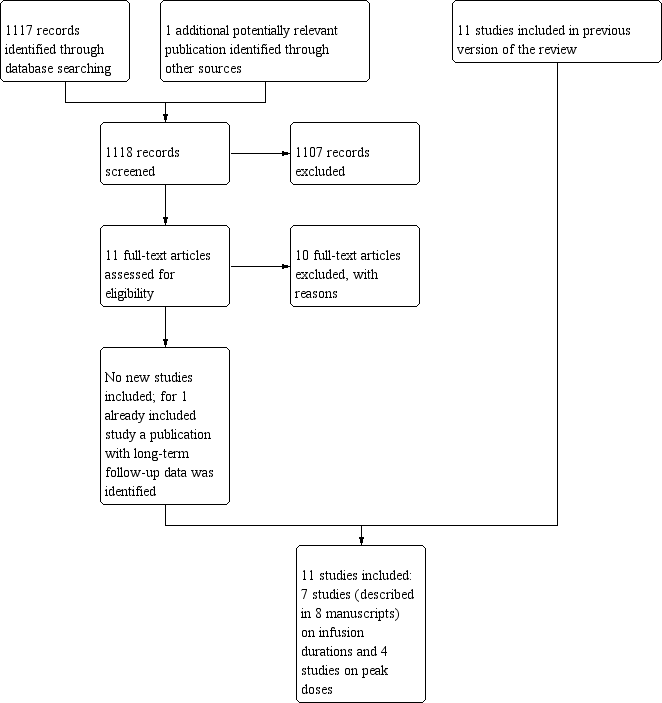
After searching the electronic databases CENTRAL, MEDLINE/PubMed, and EMBASE/Ovid (4200 references, of which 1117 were identified in the current update), we included a total of nine articles that fulfilled all the criteria for considering studies for this review (one of these articles we identified in the current update and provided long‐term follow‐up data of an earlier included RCT (Lipshultz 2002), so the total number of included studies identified in the electronic database search was eight; one of these studies was included after receiving additional information from the first author (Heidenreich 2004)).
We excluded 44 articles for reasons described in the Characteristics of excluded studies table. We excluded one conference abstract after identification of the full‐text manuscript (Advani 2014; Advani 2015), making the total number of excluded articles 45. We excluded the remaining 4147 articles since they were not randomised controlled trials (RCTs), were laboratory studies, were animal studies, did not include people with cancer, did not describe anthracycline therapy with different dosage schedules, the cumulative anthracycline doses differed between intervention and control group, chemotherapy other than anthracyclines and/or radiotherapy involving the heart region differed between treatment groups, and/or did not have heart failure as an outcome measure.
We scanned reference lists of relevant articles and reviews and identified an additional 11 studies (none new in the current update), of which three fulfilled all criteria for considering studies for this review, whereas the other eight did not (see Characteristics of excluded studies table).
We scanned conference proceedings and ongoing‐trials databases and identified an additional four studies (none new in the current update). However, three did not fulfil all criteria for considering studies for this review, and we therefore added them to the Characteristics of excluded studies table. We identified one study that has not been published and is awaiting further assessment (Ruiz 2006; see Characteristics of studies awaiting classification table).
We contacted experts in the field, who provided us with two additional studies (none new in the current update), which did not fulfil all criteria for considering studies for this review, and we added them to the Characteristics of excluded studies table.
The total number of identified RCTs was therefore 11 (described in 12 manuscripts; see Figure 1). Seven trials addressed different anthracycline infusion durations, and four trials addressed different anthracycline peak doses (see Characteristics of included studies).

Study flow diagram.
Included studies
Description of studies addressing different anthracycline infusion durations
Seven trials with a total of 803 participants addressed different anthracycline infusion durations (Casper 1991; Escherich 2007; Hortobagyi 1989; Lipshultz 2002; Shapira 1990; Steinherz 1993; Zalupski 1991). For 779 participants, it was clear to which treatment group they were randomised: 384 participants were randomised to an infusion duration of less than six hours, whereas 395 participants were randomised to an infusion duration of six hours or more. It was not documented to which group the other 24 participants were randomised (from the primary study of Lipshultz 2002). Three studies included children (Escherich 2007; Lipshultz 2002; Steinherz 1993), three studies included adults (Casper 1991; Hortobagyi 1989; Zalupski 1991), and the remaining study did not mention the age of the participants (Shapira 1990). However, since participants in this study had either breast or ovarian cancer, it is likely that they were adults. In four studies, participants were treated with doxorubicin (Casper 1991; Lipshultz 2002; Shapira 1990; Zalupski 1991), in two studies with daunorubicin (Escherich 2007; Steinherz 1993), and in one study with epirubicin (Hortobagyi 1989). There were no important differences in cumulative anthracycline doses received in both treatment arms of the different RCTs. In three studies, participants were diagnosed with leukaemia (Escherich 2007; Lipshultz 2002; Steinherz 1993), in two studies with soft tissue sarcoma (Casper 1991; Zalupski 1991), in one study with breast cancer (Hortobagyi 1989), and in one study with either breast cancer or ovarian cancer (Shapira 1990). In two studies, the follow‐up of at least part of the included participants was more than one year (Lipshultz 2002; Steinherz 1993); it is therefore possible that these studies included cases of both early and late cardiotoxicity. In one study, the follow‐up was only seven days; after the first daunorubicin administration, all children received additional daunorubicin with an infusion duration of one hour, so only data for the first seven days were eligible for this review, and only early acute cardiotoxicity could be evaluated in this study (Escherich 2007). In the other studies, the length of follow‐up was not documented, and as a result we do not know if the cases of cardiotoxicity in these studies are early or late. However, given that most people included in these trials had advanced or metastatic disease and the associated effect on survival duration, we presumed that cases of heart failure in these trials were early cardiotoxicity.
It should be noted that in Lipshultz 2012, the long‐term follow‐up study of Lipshultz 2002, it was stated that the bolus infusion was given within 15 minutes, instead of the 1‐hour infusion duration documented in the primary publication of this study. The authors provided the following clarification: "all infusions were less than 1 hour and basically this was less than 15 minutes".
Description of studies addressing different anthracycline peak doses
Two trials with a total of 4146 adult participants with breast cancer compared a doxorubicin peak dose of less than 60 mg/m2 (2103 participants) with a doxorubicin peak dose of 60 mg/m2 or more (2043 participants) (Budman 1998; Linden 2007). There were no important differences in cumulative anthracycline doses received in both treatment arms of the different RCTs. In one of the trials, the length of follow‐up was more than one year for all participants (Budman 1998); it is therefore possible that this study included cases of both early and late cardiotoxicity. In the other trial, the length of follow‐up was not documented, and as a result we do not know if the cases of cardiotoxicity in this study are early or late (Linden 2007). However, given that the median follow‐up of participants still alive at the time of analysis was 7.2 years, it is possible that this study included cases of both early and late cardiotoxicity.
One trial including 48 adults with prostate cancer compared liposomal doxorubicin (Caelyx) peak doses of 25 mg/m2 (22 participants) and 50 mg/m2 (26 participants) (Heidenreich 2004). There were no important differences in cumulative anthracycline doses received in both treatment arms. The mean follow‐up was 42 months; it is therefore possible that this study included cases of both early and late cardiotoxicity.
One trial including 1086 adults with breast cancer compared epirubicin peak doses of 83 mg/m2 (535 participants) and 110 mg/m2 (551 participants) (Fountzilas 2008). There were no important differences in cumulative anthracycline doses received in both treatment arms. The median follow‐up was 40 months; it is therefore possible that this study included cases of both early and late cardiotoxicity.
Risk of bias in included studies
See the 'Risk of bias' section of the Characteristics of included studies table and Figure 2 for the exact scores and the support for the judgements per included study.

Risk of bias summary: review authors' judgements about each risk of bias item for each included study.
Allocation
For evaluating selection bias, we have assessed the random sequence generation and the allocation concealment.
Of the seven studies addressing different anthracycline infusion durations, two studies had a concealed treatment allocation, while the presence of random sequence generation was unclear (Lipshultz 2002; Zalupski 1991), in one study both random sequence generation and allocation concealment were incorrectly performed (Shapira 1990), and four studies did not specify the random sequence generation and the allocation concealment (Casper 1991; Escherich 2007; Hortobagyi 1989; Steinherz 1993).
Four studies addressed different anthracycline peak doses. Two studies compared a doxorubicin peak dose of less than 60 mg/m2 with a doxorubicin peak dose of 60 mg/m2 or more (Budman 1998; Linden 2007). Both trials did not specify the random sequence generation and the allocation concealment. One trial compared liposomal doxorubicin (Caelyx) peak doses of 25 mg/m2 and 50 mg/m2 (Heidenreich 2004). It did not specify the random sequence generation and the allocation concealment. One trial compared epirubicin peak doses of 83 mg/m2 and 110 mg/m2 (Fountzilas 2008). This trial had a concealed treatment allocation, but the presence of random sequence generation was unclear.
Blinding
Performance bias
For evaluating performance bias, we assessed the blinding of participants and personnel.
Of the seven studies addressing different anthracycline infusion durations, in one study participants and treating physicians were not blinded (Lipshultz 2002). In the other six studies this was unclear (Casper 1991; Escherich 2007; Hortobagyi 1989; Shapira 1990; Steinherz 1993; Zalupski 1991), however, since participants in both treatment groups received their anthracycline therapy with different infusion durations and with different catheters or pump devices, participants and personnel were probably not blinded.
Four studies addressed different anthracycline peak doses. Two studies compared a doxorubicin peak dose of less than 60 mg/m2 with a doxorubicin peak dose of 60 mg/m2 or more (Budman 1998; Linden 2007). In both trials it was unclear if participants and personnel were blinded to treatment. However, since participants in both treatment groups received their anthracycline therapy with different peak doses, and as a result different treatment durations, this was most likely not the case. The same was true for the trial comparing liposomal doxorubicin (Caelyx) peak doses of 25 mg/m2 and 50 mg/m2 (Heidenreich 2004), and the trial comparing epirubicin peak doses of 83 mg/m2 and 110 mg/m2 (Fountzilas 2008).
Detection bias
For evaluating detection bias, we assessed the blinding of outcome assessors for all separate outcomes.
Of the seven studies addressing different anthracycline infusion durations, six studies evaluated clinical heart failure; in all six studies it was unclear if the outcome assessors were blinded to treatment (Casper 1991; Escherich 2007; Hortobagyi 1989; Lipshultz 2002; Shapira 1990; Zalupski 1991). All seven studies evaluated subclinical heart failure (as a dichotomous or continuous outcome, or both); in one study outcome assessors were blinded to treatment (Lipshultz 2002), while in the other six studies this was unclear (Casper 1991; Escherich 2007; Hortobagyi 1989; Shapira 1990; Steinherz 1993; Zalupski 1991). For the assessment of response rate, it was unclear if the outcome assessor was blinded to treatment in all three studies evaluating this outcome (Escherich 2007; Hortobagyi 1989; Zalupski 1991). The same was true for all three studies evaluating overall survival, but since this item is not applicable for overall survival, we judged this as a low risk of bias (Casper 1991; Hortobagyi 1989; Zalupski 1991). For the assessment of adverse effects other than cardiac damage, it was unclear if the outcome assessor was blinded to treatment in the one study evaluating this outcome (Shapira 1990). None of the studies evaluated PFS and quality of life.
Four studies addressed different anthracycline peak doses. Two studies compared a doxorubicin peak dose of less than 60 mg/m2 with a doxorubicin peak dose of 60 mg/m2 or more (Budman 1998; Linden 2007). For clinical heart failure and adverse effects other than cardiac damage, it was unclear if the outcome assessor was blinded to treatment in both trials. The same was true for overall survival, but since this item is not applicable for OS, we judged this as a low risk of bias. Other outcomes were not addressed. One trial compared liposomal doxorubicin (Caelyx) peak doses of 25 mg/m2 and 50 mg/m2 (Heidenreich 2004). For all outcomes (that is clinical heart failure, subclinical heart failure, response rate, adverse effects other than cardiac damage, and QoL) it was unclear if the outcome assessor was blinded to treatment. Other outcomes were not addressed. One trial compared epirubicin peak doses of 83 mg/m2 and 110 mg/m2 (Fountzilas 2008). For both clinical heart failure and adverse effects other than cardiac damage, it was unclear if the outcome assessor was blinded to treatment. Other outcomes were not addressed.
Incomplete outcome data
For evaluating attrition bias, we assessed incomplete outcome data for all separate outcomes.
Of the seven studies addressing different anthracycline infusion durations, six studies evaluated clinical heart failure: in three studies the risk of attrition bias was low (Hortobagyi 1989; Shapira 1990; Zalupski 1991), in two the risk of attrition bias was high (Escherich 2007; Lipshultz 2002), and in the other study this was unclear (Casper 1991). All seven studies evaluated subclinical heart failure (as a dichotomous or continuous outcome, or both); in four studies the risk of attrition bias was low (Hortobagyi 1989; Shapira 1990; Steinherz 1993; Zalupski 1991), while in three studies the risk of attrition bias was high (Casper 1991; Escherich 2007; Lipshultz 2002). Three studies evaluated response rate, of which two had a low risk of attrition bias (Hortobagyi 1989; Zalupski 1991), and one had a high risk of attrition bias (Escherich 2007). Three studies evaluated OS, and in all of them the risk of attrition bias was low (Casper 1991; Hortobagyi 1989; Zalupski 1991). For the assessment of adverse effects other than cardiac damage, in the one study evaluating this outcome the risk of attrition bias was low (Shapira 1990). None of the studies evaluated PFS and quality of life.
Four studies addressed different anthracycline peak doses. Two studies compared a doxorubicin peak dose of less than 60 mg/m2 with a doxorubicin peak dose of 60 mg/m2 or more (Budman 1998; Linden 2007). For clinical heart failure the risk of attrition bias was low in both trials. For adverse effects other than cardiac damage the risk of attrition bias was low in one trial (Linden 2007), whereas in the other trial this was unclear (Budman 1998). For OS the risk of attrition bias was unclear in both trials. Other outcomes were not addressed. One trial compared liposomal doxorubicin (Caelyx) peak doses of 25 mg/m2 and 50 mg/m2 (Heidenreich 2004). For clinical heart failure, subclinical heart failure, response rate and adverse effects other than cardiac damage the risk of attrition bias was low, whereas for QoL this was unclear. Other outcomes were not addressed. One trial compared epirubicin peak doses of 83 mg/m2 and 110 mg/m2 (Fountzilas 2008). For both clinical heart failure and adverse effects other than cardiac damage the risk of attrition bias was unclear. Other outcomes were not addressed.
Selective reporting
For evaluating reporting bias, we assessed selective reporting.
Of the seven studies addressing different anthracycline infusion durations, in three studies we judged the risk of reporting bias to be low (Casper 1991; Hortobagyi 1989; Zalupski 1991), while in four we judged it to be high (Escherich 2007; Lipshultz 2002; Shapira 1990; Steinherz 1993).
Four studies addressed different anthracycline peak doses. Two studies compared a doxorubicin peak dose of less than 60 mg/m2 with a doxorubicin peak dose of 60 mg/m2 or more (Budman 1998; Linden 2007). In both trials the risk of reporting bias was low. The risk of reporting bias was high in both the trial comparing liposomal doxorubicin (Caelyx) peak doses of 25 mg/m2 and 50 mg/m2 (Heidenreich 2004), and the trial comparing epirubicin peak doses of 83 mg/m2 and 110 mg/m2 (Fountzilas 2008).
Other potential sources of bias
For evaluating other potential sources of bias, we assessed the following items: baseline imbalance between treatment arms related to outcome (prior cardiotoxic treatment, age, sex, and/or prior cardiac dysfunction) and difference in length of follow‐up between treatment arms.
Of the seven studies addressing different anthracycline infusion durations, in one the risk of other bias was high (Hortobagyi 1989), while in the six other studies this was unclear (Casper 1991; Escherich 2007; Lipshultz 2002; Shapira 1990; Steinherz 1993; Zalupski 1991). For a more detailed description of all different items, see the 'Risk of bias' section of the Characteristics of included studies table.
Four studies addressed different anthracycline peak doses. Two studies compared a doxorubicin peak dose of less than 60 mg/m2 with a doxorubicin peak dose of 60 mg/m2 or more (Budman 1998; Linden 2007), one trial compared liposomal doxorubicin (Caelyx) peak doses of 25 mg/m2 and 50 mg/m2 (Heidenreich 2004), and one trial compared epirubicin peak doses of 83 mg/m2 and 110 mg/m2 (Fountzilas 2008). In all trials the risk of other bias was unclear. For a more detailed description of all different items, see the 'Risk of bias' section of the Characteristics of included studies table.
Effects of interventions
Different anthracycline infusion durations (i.e. greater than or equal to six hours versus less than six hours)
Not all articles allowed data extraction for all outcomes (see Characteristics of included studies for a more detailed description of the extractable outcomes of each study).
Clinical heart failure
We could collect data on clinical heart failure from 6 trials with a total of 735 participants (Casper 1991; Escherich 2007; Hortobagyi 1989; Lipshultz 2002; Shapira 1990; Zalupski 1991). However, since the eligible follow‐up in the study of Escherich 2007 was very short (that is only seven days), we felt it was inappropriate to include the data on clinical heart failure from this study in the pooled analyses. We therefore provide only descriptive results from this study: none of the participants included in Escherich 2007 developed clinical heart failure within seven days after the start of treatment.
The other five trials included a total of 557 participants. There were 19 cases of clinical heart failure among 277 participants randomised to an infusion duration of less than 6 hours and 4 cases among 280 participants randomised to an infusion duration of 6 hours or more. In one study there were no cases of clinical heart failure in both treatment groups (Lipshultz 2002), therefore the results of this study are not estimable for the meta‐analysis of the RR. The meta‐analysis showed a statistically significant lower rate of clinical heart failure with an infusion duration of six hours or longer as compared to a shorter infusion duration (RR 0.27, 95% confidence interval (CI) 0.09 to 0.81; P = 0.02) (Analysis 1.1). We detected no substantial heterogeneity (I2 = 2%).
Please note that for the study of Lipshultz 2002 it was not possible to perform an intention‐to‐treat analysis (see Characteristics of included studies). Participants included in the meta‐analysis were all adults diagnosed with a solid tumour. As the length of follow‐up was not documented, we do not know if the cases of clinical heart failure included in the meta‐analysis were early or late. However, given that most people included in these trials had advanced or metastatic disease and the associated effect on survival duration, we presume that the cases of clinical heart failure in this meta‐analysis were early cardiotoxicity.
We excluded the study of Steinherz 1993 from this analysis, since it did not report clinical heart failure.
Long‐term follow‐up data of Lipshultz 2002 have been published on 92 of the 240 participants (N = 43 in the bolus group and N = 49 in the continuous infusion group) (Lipshultz 2012). The median length of follow‐up was 8 years with a range of 3 to 13 years (8.3 years in the bolus group and 8.2 years in the continuous infusion group). Again, there were no cases of clinical heart failure in both treatment groups.
Clinical and subclinical heart failure combined
We could extract data on clinical and subclinical heart failure combined from five trials, however we did not pool results because the definitions of subclinical heart failure used in the different trials were too diverse (see Characteristics of included studies: Casper 1991; Escherich 2007; Hortobagyi 1989; Shapira 1990; Zalupski 1991). We therefore provide descriptive results for these studies.
In four of the five studies, participants were adults diagnosed with a solid tumour (Casper 1991; Hortobagyi 1989; Shapira 1990; Zalupski 1991). As the length of follow‐up was not documented, we do not know if the cases of heart failure included in the analyses were early or late. However, given that most participants included in these trials had advanced or metastatic disease and the associated effect on survival duration, we presume that the cases of heart failure in the analyses were early cardiotoxicity. In one of the five studies, participants were children with leukaemia (Escherich 2007). As the eligible follow‐up duration of this study was seven days, we could only evaluate early cardiotoxicity.
In two out of five studies, a statistically significant difference in favour of participants randomised to an infusion duration of six hours or more was identified (Shapira 1990; Zalupski 1991), while in the other studies no significant differences were found (Analysis 1.2). Since in the study of Escherich 2007 no participants developed clinical or subclinical heart failure, we did not include a figure for this study.
We excluded the study of Lipshultz 2002 from this analysis (both the original study and the long‐term follow‐up study), as the number of participants that developed subclinical heart failure was not provided, and only cases of clinical heart failure were thus included in the results. We excluded the study of Steinherz 1993 because clinical heart failure was not evaluated, and therefore the results only included cases of subclinical heart failure.
For all studies, it should be noted that participants who suffered from clinical heart failure are also included in the meta‐analysis of clinical heart failure as mentioned above.
Subclinical heart failure described as a continuous outcome
We could collect data on subclinical heart failure described as a continuous outcome from three trials (Lipshultz 2002; Shapira 1990; Steinherz 1993), however we did not pool results because the definitions of subclinical heart failure used in the different trials were too diverse (see Characteristics of included studies). We therefore provide descriptive results of these studies. Two studies evaluated children diagnosed with leukaemia (Lipshultz 2002; Steinherz 1993), whereas the third study evaluated adults with a solid tumour.
Lipshultz 2002 provided the median Z score of different echocardiographic parameters (bolus group versus continuous infusion group): diastolic dimension (‐0.12 versus ‐0.23), wall thickness (‐0.32 versus ‐0.28), systolic dimension (0.85 versus 0.38), left ventricular shortening fraction (LVSF) (‐2.34 versus ‐1.77), and mass (‐0.65 versus ‐0.47). None of the differences were significant. Please note that only a small percentage of the randomised participants were evaluated for this outcome (21% to 26%). Long‐term follow‐up data of Lipshultz 2002 have been published on 92 of the 240 participants (N = 43 in the bolus group and N = 49 in the continuous infusion group) (Lipshultz 2012). The median length of follow‐up was 8 years with a range of 3 to 13 years (8.3 years in the bolus group and 8.2 years in the continuous infusion group). Again no significant differences were identified for different echocardiographic parameters at three, six, and eight years after tumour diagnosis: LVSF, left ventricular end diastolic posterior wall thickness, left ventricular mass, left ventricular end systolic dimension, and left ventricular end diastolic dimension. Not all participants were assessed at all three time points.
Shapira 1990 provided the mean fall in left ventricular ejection fraction (LVEF), which was 17% in the bolus group versus 4% in the continuous infusion group at a cumulative anthracycline dose of 300 mg/m2, and 21% in the bolus group versus 6% in the continuous infusion group at a cumulative anthracycline dose of 400 mg/m2. This difference between both groups is highly significant for both doses (P < 0.001).
Steinherz 1993 provided the median change in LVSF, which was ‐6.5 for the bolus group and +1 for the continuous infusion group. It was not stated if this is a significant difference.
Response rate
We could extract data on response rate from 2 trials with a total of 292 adult participants with a solid tumour (Hortobagyi 1989; Zalupski 1991). These trials used comparable criteria to assess tumour response (see Characteristics of included studies). There were 23 complete or partial responses among 143 participants randomised to an infusion duration of less than 6 hours, and 28 among 149 participants randomised to an infusion duration of 6 hours or more. The meta‐analysis showed no significant difference in the response rate between both treatment groups (RR 1.20, 95% CI 0.65 to 2.22; P = 0.56) (Analysis 1.3). We detected no substantial heterogeneity (I2 = 16%). None of the studies documented that the response rate was determined by at least two observers.
The study of Escherich 2007 (178 children with leukaemia) did report the number of good and poor responses at day 7. As the definition of response rate was not comparable with the above studies, and also due to the short eligible follow‐up duration (that is seven days), we did not include the results of this study in the meta‐analysis. However, no statistically significant difference in response rate between both treatment groups was identified (RR 1.23, 95% CI 0.91 to 1.66; P = 0.18) (Analysis 1.3). It was not documented if the response rate was determined by at least two observers.
We excluded the studies of Casper 1991, Lipshultz 2002 (both the original study and the long‐term follow‐up study), Shapira 1990, and Steinherz 1993 from this analysis because none of these studies documented the response rate per treatment group.
Please note that due to the nature of this measurement (that is the number of participants with a remission), a high event rate is favourable; therefore, in the graph of this analysis (Analysis 1.3), 'favours less than six hours' is on the left, and 'favours greater than or equal to six hours' is on the right, as opposed to the graphs of the other analyses.
Survival
None of the seven included studies evaluated PFS of participants randomised to different infusion durations (only data from the first seven treatment days for the study of Escherich 2007 were eligible for this review; see Characteristics of included studies table).
We could extract data on OS from 2 trials with a total of 322 adults with a solid tumour (Casper 1991; Zalupski 1991). One study presented the hazard ratio (HR) with 95% CI (Zalupski 1991), and the other study provided a survival curve (Casper 1991). The meta‐analysis showed no significant difference between the treatment groups (HR 1.42, 95% CI 0.61 to 3.30; P = 0.42) (Analysis 1.4). However, we detected unexplained heterogeneity (I2 = 75.0%).
Please note that for the study of Casper 1991, it was not possible to perform an intention‐to‐treat analysis because the survival data were presented with a participant randomised to bolus therapy who actually received the drug by continuous infusion in the continuous infusion group.
We excluded the studies of Lipshultz 2002 (both the original study and the long‐term follow‐up study), Shapira 1990, and Steinherz 1993 from this analysis because none of these studies documented OS per treatment group. Lipshultz 2002 did mention the five‐year event‐free survival (EFS) for the different treatment groups, and no significant difference was identified (89% EFS in the short infusion group and 87.3% in the continuous infusion group; P = 0.50). Long‐term follow‐up data of Lipshultz 2002 have been published on 92 of the 240 participants (N = 43 in the bolus group and N = 49 in the continuous infusion group) (Lipshultz 2012). The median length of follow‐up was 8 years with a range of 3 to 13 years (8.3 years in the bolus group and 8.2 years in the continuous infusion group). Again, no significant difference in EFS between both treatment groups was identified (10‐year EFS 79% in the bolus group versus 83% in the continuous infusion group; P = 0.24).
We excluded the study of Hortobagyi 1989 from this analysis because we were not able to reliably extract data needed to use Parmar's method for the assessment of survival for this study. However, in the Hortobagyi 1989 study participants randomised to an infusion duration of less than 6 hours had a median survival of 7 months (range 1 to 19+ months), and participants randomised to an infusion duration of 6 hours or more had a median survival of 9 months (range 1 to 21 months). Escherich 2007 did not report overall survival.
Adverse effects other than cardiac damage
Since only one study including adults with a solid tumour provided adequate data on adverse effects other than cardiac damage (Shapira 1990), pooling of results was not possible. We therefore provide descriptive results for this study. All analyses were performed in Review Manager 2014 with the random‐effects model. Given that all participants receiving anthracycline chemotherapy will suffer from side effects, we decided to analyse only the severe and life‐threatening effects. We defined this as grade 3 or 4 toxicity. We could only evaluate fatal sepsis. One participant randomised to an infusion duration of less than six hours died as the result of a sepsis. No statistically significant difference was identified between the treatment arms (RR 3.00, 95% CI 0.13 to 70.92, P = 0.50).
Quality of life
None of the studies evaluated QoL.
Subgroup analyses
We did not perform subgroup analyses for children versus adults and leukaemias versus solid tumours. Only in the meta‐analysis of clinical heart failure was a study evaluating children with leukaemia included, but as none of the participants developed clinical heart failure, this study could not be included in the calculation of RR.
Sensitivity analyses for the used 'Risk of bias' criteria
The results of the sensitivity analyses for the 'Risk of bias' criteria were consistent among the trials and did not differ from the overall analyses.
Different anthracycline peak doses
Doxorubicin peak dose less than 60 mg/m2 versus greater than or equal to 60 mg/m2
Not all articles allowed data extraction for all outcomes (see Characteristics of included studies for a more detailed description of the extractable outcomes of each study).
Clinical heart failure
We could collect data on clinical heart failure from 2 trials with a total of 4146 adults diagnosed with breast cancer (Budman 1998; Linden 2007). There were 12 cases of clinical heart failure among 2103 participants randomised to a peak dose of less than 60 mg/m2 and 20 cases among 2043 participants randomised to a peak dose of 60 mg/m2 or more. The meta‐analysis showed no significant difference in the occurrence of clinical heart failure between both treatment groups (RR 0.65, 95% CI 0.23 to 1.88; P = 0.43) (Analysis 2.1). However, we detected unexplained heterogeneity (I2 = 47%).
Please note that in one of the trials the length of follow‐up was more than one year in all participants (Budman 1998). It is therefore possible that this study included cases of both early and late clinical heart failure. In the other trial, the length of follow‐up was not documented, and as a result we do not know if the cases of clinical heart failure in this study are early or late (Linden 2007). However, given that the median follow‐up of participants still alive at the time of analysis was 7.2 years, it is possible that this study included cases of both early and late clinical heart failure.
Clinical and subclinical heart failure combined
In both trials, no information on subclinical heart failure was provided.
Subclinical heart failure described as a continuous outcome
In both trials, no information on subclinical heart failure was provided.
Response rate
In both trials, no information on response rate was provided.
Survival
In both trials, no information on PFS was provided.
We could extract data on OS from 2 trials with a total of 4146 adults diagnosed with breast cancer (Budman 1998; Linden 2007). One study provided the P value, the number of events on each treatment arm, and the randomisation ratio was 1:1 (Budman 1998); the other study provided the HR with 95% CI. The meta‐analysis showed no significant differences in overall survival between the treatment groups (HR 1.06, 95% CI 0.93 to 1.22; P = 0.39) (Analysis 2.2). We detected no heterogeneity (I2 = 0%).
Adverse effects other than cardiac damage
Given that all people receiving anthracycline chemotherapy will suffer from side effects, we decided to analyse only the severe and life‐threatening effects. We defined this as grade 3 or 4 toxicity. We evaluated the following adverse effects: treatment‐related death, granulocytopenia (grade 4), leukopenia (grade 4), thrombocytopenia (grade 4), diarrhoea (grade 3 or 4), dyspnoea (grade 3 or 4), infection (grade 3 or 4), malaise/fatigue/lethargy (grade 3 or 4), nausea (grade 3 or 4), stomatitis (grade 3 or 4), vomiting (grade 3 or 4), pharynx/esophagitis (grade 3 or 4), phlebitis/thrombosis/embolism (grade 3 or 4), fever without infection (grade 3 or 4), oedema (grade 3 or 4), and hypotension (grade 3 or 4) (Linden 2007), leukopenia grade 3 or 4 (i.e. fewer than 1900 cells/µl) and death attributable to chemotherapy (Budman 1998). However, since the trials did not use comparable definitions, it was not possible to perform a meta‐analysis. We therefore provide descriptive results (Analysis 2.3).
For leukopenia grade 4 (RR 0.58, 95% CI 0.53 to 0.64; P < 0.00001), leukopenia grade 3 or 4 (RR 0.26, 95% CI 0.21 to 0.31; P < 0.00001), granulocytopenia (RR 0.67, 95% CI 0.61 to 0.73; P < 0.00001), thrombocytopenia (RR 0.45, 95% CI 0.34 to 0.59; P < 0.00001), diarrhoea (RR 0.34, 95% CI 0.19 to 0.60; P = 0.0002), dyspnoea (RR 0.51, 95% CI 0.28 to 0.93; P = 0.03), infection (RR 0.61, 95% CI 0.42 to 0.86; P = 0.006), malaise/fatigue/lethargy (RR 0.66, 95% CI 0.49 to 0.91; P = 0.01), and stomatitis (RR 0.40, 95% CI 0.27 to 0.61; P < 0.0001) a statistically significant difference in favour of participants treated with a peak dose of less than 60 mg/m2 was identified.
For vomiting (RR 1.31, 95% CI 1.07 to 1.59; P = 0.008) a statistically significant difference in favour of participants treated with a peak dose of 60 mg/m2 or more was identified.
For treatment‐related death (RR 0.19, 95% CI 0.01 to 3.99; P = 0.29), death attributable to chemotherapy (RR 0.34, 95% CI 0.01 to 8.26; P = 0.51), and nausea (RR 1.19, 95% CI 0.98 to 1.44; P = 0.08), no significant differences between the treatment groups were identified.
Due to insufficient data, we could not include pharynx/oesophagitis, phlebitis/thrombosis/embolism, fever without infection, oedema, and hypotension in the analyses. However, the article did not document if there was a statistically significant difference between both treatment groups for oedema and hypotension, while it identified a statistically significant difference in favour of participants treated with a peak dose of less than 60 mg/m2 for the other adverse effects.
Quality of life
No information on QoL was provided.
Subgroup analyses
As all participants included in the analyses were adults with a solid tumour, it was not possible to perform subgroup analyses for children versus adults and leukaemias versus solid tumours.
Sensitivity analyses for the used 'Risk of bias' criteria
The results of the sensitivity analyses for the 'Risk of bias' criteria were consistent among the trials and did not differ from the overall analyses.
Liposomal doxorubicin (Caelyx) peak dose 25 mg/m2 versus 50 mg/m2
One trial compared liposomal doxorubicin (Caelyx) peak doses of 25 mg/m2 and 50 mg/m2 (Heidenreich 2004). All 48 participants were adults with prostate cancer. Since there was only one trial, subgroup analyses and sensitivity analyses for the used 'Risk of bias' criteria were not applicable. See Characteristics of included studies for a more detailed description of the extractable outcomes.
Clinical heart failure
No participants in either treatment group developed clinical heart failure. The mean follow‐up was 42 months, therefore this study evaluated both early and late cardiotoxicity.
Clinical and subclinical heart failure combined
No participants in either treatment group developed clinical or subclinical heart failure. Again, since the mean follow‐up was 42 months, this study evaluated both early and late cardiotoxicity.
Subclinical heart failure described as a continuous outcome
Subclinical heart failure was not evaluated as a continuous outcome in this study.
Response rate
There were no objective palliative tumour responses (defined as a decrease in prostate‐specific antigen (PSA) levels of greater than or equal to 50%) among 22 participants randomised to a peak dose of 25 mg/m2, and there were 8 objective palliative tumour responses among 26 participants randomised to a peak dose of 50 mg/m2. The analysis showed a borderline significant difference in favour of participants treated with a peak dose of 50 mg/m2 (RR 0.07, 95% CI 0.00 to 1.13; P = 0.06) (Analysis 3.1). It was not documented if the response was determined by at least two observers.
Please note that due to the nature of this measurement (that is the number of participants with an objective palliative tumour response), a high event rate is favourable; therefore, in the graph of this analysis (Analysis 3.1), 'favours 50 mg/m2' is on the left and 'favours 25 mg/m2' is on the right, as opposed to the graphs of the other analyses.
Survival
No information on PFS and OS was provided.
Adverse effects other than cardiac damage
Given that all participants receiving anthracycline chemotherapy will suffer from side effects, we decided to analyse only the severe and life‐threatening effects. We defined this as grade 3 or 4 toxicity. This study evaluated the following adverse effects: gastrointestinal toxicity (grade 3 or 4), tachycardia (grade 3 or 4), arrhythmia (grade 3 or 4), dyspnoea (grade 3 or 4), palmar‐plantar erythrodysesthesia (grade 3 or 4), hepatic toxicity (grade 3 or 4), leukopenia (grade 3 or 4), thrombocytopenia (grade 3 or 4), haemoglobin‐related toxicity (grade 3 or 4), biochemical toxicities (grade 4), and neurological toxicities (grade 3 or 4) (Analysis 3.2).
For hepatic toxicity (RR 0.20, 95% CI 0.05 to 0.79; P = 0.02) a statistically significant difference in favour of participants treated with a peak dose of 25 mg/m2 was identified.
For tachycardia (RR 0.06, 95% CI 0.00 to 1.00; P = 0.05) and haemoglobin‐related toxicity (RR 0.07, 95% CI 0.00 to 1.13; P = 0.06) a borderline‐significant difference in favour of participants treated with a peak dose of 25 mg/m2 was identified.
For palmar‐plantar erythrodysesthesia (RR 5.91, 95% CI 1.45 to 24.16; P = 0.01) a statistically significant difference in favour of participants treated with a peak dose of 50 mg/m2 was identified.
For gastrointestinal toxicity (RR 0.17, 95% CI 0.01 to 3.08; P = 0.23), arrhythmia (RR 0.39, 95% CI 0.04 to 3.52; P = 0.40), dyspnoea (RR 0.47, 95% CI 0.10 to 2.20; P = 0.34), leukopenia (RR 0.24, 95% CI 0.03 to 1.87; P = 0.17), thrombocytopenia (RR 0.39, 95% CI 0.02 to 9.15; P = 0.56), biochemical toxicities (no participants in either treatment group), and neurological toxicities (no participants in either treatment group) no significant differences between the treatment groups were identified.
Quality of life
No significant differences between the treatment groups in QoLquality of life were identified (no further data available).
Epirubicin peak dose 110 mg/m2 versus 83 mg/m2
One trial compared epirubicin peak doses of 83 mg/m2 and 110 mg/m2 (Fountzilas 2008). All 1086 participants were adults with breast cancer. As there was only one trial, subgroup analyses and sensitivity analyses for the used 'Risk of bias' criteria were not applicable. See Characteristics of included studies for a more detailed description of the extractable outcomes.
Clinical heart failure
There was one case of clinical heart failure in both treatment groups. The analysis showed no significant difference between both treatment groups (RR 0.97, 95% CI 0.06 to 15.48; P = 0.98) (Analysis 4.1). The median follow‐up was 40 months, therefore it is possible that this study included cases of both early and late cardiotoxicity.
Clinical and subclinical heart failure combined
No information on subclinical heart failure was provided.
Subclinical heart failure described as a continuous outcome
No information on subclinical heart failure was provided.
Response rate
No information on response rate was provided.
Survival
No information on PFS and OS was provided.
Adverse effects other than cardiac damage
Given that all participants receiving anthracycline chemotherapy will suffer from side effects, we decided to analyse only the severe and life‐threatening effects. We defined this as grade 3 or 4 toxicity. This study evaluated the following adverse effects: anaemia (grade 3 or 4), leukopenia (grade 3 or 4), neutropenia (grade 3 or 4), febrile neutropenia (grade 3 or 4), thrombocytopenia (grade 3 or 4), nausea/vomiting (grade 3 or 4), fatigue (grade 3 or 4), infection (grade 3 or 4), central nervous system (grade 3 or 4), pulmonary (grade 3 or 4), peripheral neuropathy (grade 3 or 4), hepatotoxicity (grade 3 or 4), hypersensitivity reactions (grade 3 or 4), mucositis (grade 3 or 4), pain (grade 3 or 4), arthralgias/myalgias (grade 3 or 4), and treatment‐related death (Analysis 4.2).
For peripheral neuropathy (RR 4.50, 95% CI 2.37 to 8.54; P < 0.00001), hypersensitivity reactions (RR 3.88, 95% CI 1.71 to 8.82; P = 0.001), and arthralgias/myalgias (RR 3.88, 95% CI 1.31 to 11.54; P = 0.01) a statistically significant difference in favour of participants treated with a peak dose of 83 mg/m2 was identified.
For anaemia (RR 2.91, 95% CI 0.79 to 10.70; P = 0.11), leukopenia (RR 1.06, 95% CI 0.75 to 1.49; P = 0.75), neutropenia (RR 1.05, 95% CI 0.84 to 1.31; P = 0.68), febrile neutropenia (RR 0.78, 95% CI 0.47 to 1.31; P = 0.35), thrombocytopenia (RR 12.62, 95% CI 0.71 to 223.52; P = 0.08), nausea/vomiting (RR 0.91, 95% CI 0.45 to 1.82; P = 0.79), fatigue (RR 0.32, 95% CI 0.07 to 1.60; P = 0.17), infection (RR 0.79, 95% CI 0.48 to 1.31; P = 0.36), central nervous system (RR 2.91, 95% CI 0.12 to 71.35; P = 0.51), pulmonary (RR 2.91, 95% CI 0.12 to 71.35; P = 0.51), hepatotoxicity (RR 1.70, 95% CI 0.50 to 5.77; P = 0.40), mucositis (RR 1.05, 95% CI 0.48 to 2.28; P = 0.90), pain (RR 0.32, 95% CI 0.01 to 7.93; P = 0.49), and treatment‐related death (RR 2.91, 95% CI 0.12 to 71.35; P = 0.51) no significant differences between the treatment groups were identified.
Quality of life
No information on QoL was provided.
Discussion
Heart damage due to anthracycline chemotherapy is a considerable and serious problem. It reduces QoL and can even cause premature death. Also, when heart damage occurs during therapy, the maximum cumulative dose of anthracyclines needs to be limited resulting in reduced efficacy of anthracycline chemotherapy.
This is the second update of the first systematic review evaluating the existing evidence on different anthracycline dosage schedules (that is different infusion durations and different peak doses) for reducing cardiotoxicity. We included only RCTs as it is widely recognised that only this study design can obtain unbiased evidence on the use of anthracyclines, provided that the design and execution are adequate.
Different anthracycline infusion durations
We identified seven trials for different anthracycline infusion durations. These trials all compared a bolus infusion (up to a maximum of 1 hour; for the Lipshultz 2002 study the exact duration of bolus infusion was not clear, as in one publication it was stated to be 1 hour, while in another publication it was stated to be within 15 minutes; the authors provided the following clarification: "all infusions were less than 1 hour and basically this was less than 15 minutes") with a longer infusion duration (varying from 6 to 96 hours). Our meta‐analysis of five trials showed a statistically significant lower rate of clinical heart failure with an infusion duration of six hours or longer as compared to a shorter infusion duration (RR 0.27, 95% CI 0.09 to 0.81). This finding is supported by two out of five individual studies evaluating clinical and subclinical heart failure combined, which also showed a statistically significant lower rate of clinical and subclinical heart failure combined in participants randomised to an infusion duration of six hours or longer as compared to participants randomised to a shorter infusion duration. Also, one of the two individual studies evaluating the significance of the difference in subclinical heart failure as a continuous outcome between both treatment groups showed a significant difference in the mean fall of the left ventricular ejection fraction in favour of the infusion duration of six hours or longer. Another study did not mention the significance of the difference.
However, an important question regarding any cardioprotective intervention during anthracycline therapy is whether the intervention could selectively decrease the heart damage by anthracyclines without reducing the antitumour efficacy (that is tumour response and patient survival) and without negative effects on QoL and toxicities other than cardiac damage. Our meta‐analysis of two trials for response rate showed no significant difference between both treatment groups. One study evaluated the number of good responses at day seven and identified no significant difference between the treatment groups. Also no statistically significant difference in OS was found between the treatment groups in our meta‐analysis of two trials, but please note that there was unexplained heterogeneity. No data on PFS was available. This review does not allow for any conclusions regarding adverse effects other than cardiac damage and QoL in participants treated with different anthracycline infusion durations.
It should be kept in mind that the inclusion of studies for this systematic review was limited to RCTs describing cardiotoxicity, and as a result, the analyses of response rate, survival, adverse effects other than cardiac damage, and QoL were possibly based on only a subgroup of trials comparing different anthracycline infusion durations.
It should be noted that 'no evidence of effect', as identified in this review, is not the same as 'evidence of no effect'. The reason that some studies did not identify a significant difference between both study groups could be due to the fact that the number of participants included in these studies was too small to detect a difference between the treatment groups (that is low power). Furthermore, the length of follow‐up could have been too short to detect a significant difference between the treatment groups. This is especially true for the study by Escherich 2007, in which the eligible follow‐up was only seven days.
It should be emphasised that the majority of participants included in these studies were adults with different solid tumours. Subgroup analyses for children versus adults and leukaemias versus solid tumours were not possible. We could not include children with leukaemia in the performed meta‐analyses, but included them in the descriptive results of non‐pooled studies. Two studies with children diagnosed with leukaemia evaluated clinical heart failure (Escherich 2007; Lipshultz 2002), and identified no differences (however, as mentioned above, one of these studies had a very short follow‐up of only seven days). Long‐term follow‐up data (median length of follow‐up 8 years with a range of 3 to 13 years) of Lipshultz 2002 showed the same result. Three studies with children diagnosed with leukaemia evaluated subclinical heart failure, of which two studies assessed the significance of the difference between both treatment groups (Escherich 2007; Lipshultz 2002). Again, no differences were identified; the long‐term follow‐up data of Lipshultz 2002 did not change these results. The third study suggested a decrease in left ventricular shortening fraction in children treated with bolus infusion (Steinherz 1993). One study with children diagnosed with leukaemia evaluated response rate (Escherich 2007). This study identified no difference in response, but it should be noted that the follow‐up was only seven days. We could obtain no information regarding PFS and OS, adverse effects other than cardiac damage, and QoL for paediatric participants. However, Lipshultz 2002 did mention the five‐year event‐free survival for the different treatment groups, and no significant difference was identified (89% event‐free survival in the short infusion group and 87.3% in the continuous infusion group; P = 0.50). The same was true for the long‐term follow‐up data: 10‐year event‐free survival 79% in the bolus group versus 83% in the continuous infusion group; P = 0.24.
Regarding early and late cardiotoxicity, we must conclude the following. Only two studies in children documented that the follow‐up of at least part of the included participants was more than one year (Lipshultz 2002; Steinherz 1993). It is therefore possible that these studies included cases of both early and late cardiotoxicity. One study in children had a follow‐up of only seven days, so in this study we could evaluate only acute cardiotoxicity (Escherich 2007). All participants in the long‐term follow‐up study of Lipshultz 2002 had a follow‐up of at least three years, so in this study we could evaluate late cardiotoxicity. The other studies did not document the length of follow‐up, and as a result we do not know if the cases of cardiotoxicity were early or late. However, given that most participants included in these trials had advanced or metastatic disease and the associated effect on survival duration, we presume that cases of heart failure in these trials were early cardiotoxicity.
As described earlier, the risk of bias in the included studies varied; in many studies we could not rule out bias due to lack of reporting. However, currently this is the best available evidence of RCTs evaluating different anthracycline infusion durations.
Furthermore, the included RCTs used three different anthracycline derivatives (doxorubicin, epirubicin, and daunorubicin), and we assumed that they all behaved similarly. We therefore combined them in the meta‐analyses.
Different anthracycline peak doses
We identified two trials for different doxorubicin peak doses. These trials compared a doxorubicin peak dose of less than 60 mg/m2 with a doxorubicin peak dose of 60 mg/m2 or more (that is 40 versus 60 mg/m2 or 54 versus 81 mg/m2). Our meta‐analysis showed no significant difference in the occurrence of clinical heart failure between the treatment groups, but please note that there was unexplained heterogeneity. No information on subclinical heart failure was provided, and therefore no conclusions can be made regarding this outcome. Again, an important question regarding any cardioprotective intervention during anthracycline therapy is whether the intervention could selectively decrease the heart damage by anthracyclines without reducing the antitumour efficacy and without negative effects on QoL and toxicities other than cardiac damage. Our meta‐analysis showed no significant difference in OS between the treatment groups. With regard to adverse effects other than cardiac damage, pooling of results was not possible. In the individual studies the results were not unambiguous: for most evaluated adverse effects a significant difference in favour of participants treated with a peak dose of less than 60 mg/m2 was identified, but for others either no difference between the treatment groups was identified or there was a significant difference in favour of participants treated with a peak dose of 60 mg/m2 or more. No information on response rate, PFS and QoL was provided, and therefore no conclusions can be made regarding these outcomes.
In the study evaluating 25 mg/m2 versus 50 mg/m2 liposomal doxorubicin (Caelyx), no significant difference between the treatment groups was identified for both clinical and subclinical heart failure. Again, an important question regarding any cardioprotective intervention during anthracycline therapy is whether the intervention could selectively decrease the heart damage by anthracyclines without reducing the antitumour efficacy and without negative effects on QoL and toxicities other than cardiac damage. For response rate (defined as a reduction in serum prostate‐specific antigen (PSA) levels by greater than or equal to 50% relative to baseline, with this reduction persisting for greater than or equal to four weeks and being accompanied by stabilisation or improvement in the participant's performance status) a borderline‐significant difference in favour of participants treated with a peak dose of 50 mg/m2 was identified (RR 0.07, 95% CI 0.00 to 1.13; P = 0.05). However, the significance of PSA reduction as a surrogate marker for response and survival must be considered with caution. The clinical relevance of decreased PSA levels remains subject to debate (Millikan 2003; Verbel 2002). With regard to adverse effects other than cardiac damage, the results were not unambiguous: for most evaluated adverse effects no significant difference between both treatment groups was identified, but for others either a significant difference in favour of participants treated with a peak dose of 25 mg/m2 or 50 mg/m2 was shown. No significant difference in the QoL between the treatment groups was identified. No information on PFS and OS was provided, and therefore no conclusions can be made regarding these outcomes.
In the study evaluating 83 mg/m2 versus 110 mg/m2 epirubicin, no significant difference between the treatment groups was identified for clinical heart failure. No information on subclinical heart failure was provided, and therefore no conclusions can be made regarding this outcome. Again, an important question regarding any cardioprotective intervention during anthracycline therapy is whether the intervention could selectively decrease the heart damage by anthracyclines without reducing the antitumour efficacy and without negative effects on QoL and toxicities other than cardiac damage. With regard to adverse effects other than cardiac damage, the results were not unambiguous: for most evaluated adverse effects no significant difference between the treatment groups was identified, whereas for some a significant difference in favour of participants treated with a peak dose of 83 mg/m2 was identified. No information on response rate, PFS and OS and QoL was provided, and therefore no conclusions can be made regarding these outcomes.
It should be kept in mind that the inclusion of studies for this systematic review was limited to RCTs describing cardiotoxicity, and as a result, the analyses of response rate, survival, adverse effects other than cardiac damage, and QoL were possibly based on only a subgroup of trials comparing different anthracycline peak doses.
It should be noted that 'no evidence of effect', as identified in this review, is not the same as 'evidence of no effect'. The reason that some studies did not identify a significant difference between both study groups could be due to the fact that the number of participants included in these studies was too small to detect a difference between the treatment groups (that is low power). Furthermore, the length of follow‐up could have been too short to detect a significant difference between the treatment groups.
It should be emphasised that all participants included in the studies evaluating different anthracycline peak doses were adults with different solid tumours. As a result, subgroup analyses for children versus adults and leukaemia versus solid tumours were not possible.
Regarding early and late cardiotoxicity, we must conclude the following. In three studies, the follow‐up of at least part of the included participants was more than one year (Budman 1998; Fountzilas 2008; Heidenreich 2004). It is therefore possible that these studies included cases of both early and late cardiotoxicity. The fourth study did not mention the length of follow‐up, and as a result we do not know if the cases of cardiotoxicity in this studies were early or late (Linden 2007). However, given that the median follow‐up of participants still alive at the time of analysis was 7.2 years, it is possible that this study included cases of both early and late cardiotoxicity.
As described earlier, the risk of bias in the included studies varied; in many studies we could not rule out bias due to lack of reporting. However, currently this is the best available evidence of RCTs evaluating different anthracycline peak doses.
We identified eligible RCTs for only for a limited number of anthracycline peak doses. We found no appropriate studies for other combinations, and therefore can make no conclusions regarding the use of these combinations in preventing anthracycline‐induced heart failure in participants treated with anthracyclines.
Also, more definitions of anthracycline peak doses than the one we used in this systematic review (that is the maximal anthracycline dose received in one week) are possible, for example single‐dose infusion versus consecutive divided daily doses. To evaluate all the available evidence on the exact role of other kinds of peak doses on the occurrence of anthracycline‐induced cardiotoxicity in adults and children, one or more new (Cochrane) systematic reviews can be initiated. These systematic reviews should focus not only on anthracycline‐induced cardiotoxicity, but also on antitumour efficacy, adverse effects other than cardiac damage, and QoL.
We are awaiting the full‐text publication of the trial currently awaiting assessment (Ruiz 2006); from the currently available data it is unclear if this study is eligible for inclusion in this review.
Study flow diagram.

Risk of bias summary: review authors' judgements about each risk of bias item for each included study.

Comparison 1: Infusion duration less than 6 hours versus infusion duration 6 hours or more, Outcome 1: Clinical heart failure

Comparison 1: Infusion duration less than 6 hours versus infusion duration 6 hours or more, Outcome 2: (Sub)clinical heart failure combined

Comparison 1: Infusion duration less than 6 hours versus infusion duration 6 hours or more, Outcome 3: Response rate

Comparison 1: Infusion duration less than 6 hours versus infusion duration 6 hours or more, Outcome 4: Overall survival

Comparison 2: Doxorubicin peak dose less than 60 mg/m2 versus 60 mg/m2 or more, Outcome 1: Clinical heart failure

Comparison 2: Doxorubicin peak dose less than 60 mg/m2 versus 60 mg/m2 or more, Outcome 2: Overall survival

Comparison 2: Doxorubicin peak dose less than 60 mg/m2 versus 60 mg/m2 or more, Outcome 3: Adverse effects other than cardiac damage

Comparison 3: Liposomal doxorubicin (Caelyx) peak dose 25 mg/m2 versus 50 mg/m2, Outcome 1: Response rate (defined as objective palliative tumour response (i.e. decrease in PSA levels of >= 50%))

Comparison 3: Liposomal doxorubicin (Caelyx) peak dose 25 mg/m2 versus 50 mg/m2, Outcome 2: Adverse effects other than cardiac damage

Comparison 4: Epirubicin peak dose 110 mg/m2 versus 83 mg/m2, Outcome 1: Clinical heart failure

Comparison 4: Epirubicin peak dose 110 mg/m2 versus 83 mg/m2, Outcome 2: Adverse effects other than cardiac damage
| Outcome or subgroup title | No. of studies | No. of participants | Statistical method | Effect size |
| 1.1 Clinical heart failure Show forest plot | 5 | 557 | Risk Ratio (M‐H, Random, 95% CI) | 0.27 [0.09, 0.81] |
| 1.2 (Sub)clinical heart failure combined Show forest plot | 4 | Risk Ratio (M‐H, Random, 95% CI) | Subtotals only | |
| 1.2.1 (Sub)clinical heart failure combined (subclinical defined as >=10% decrease in LVEF) | 1 | 82 | Risk Ratio (M‐H, Random, 95% CI) | 0.76 [0.46, 1.26] |
| 1.2.2 (Sub)clinical heart failure combined (subclinical defined as >=15% decrease in LVEF) | 1 | 52 | Risk Ratio (M‐H, Random, 95% CI) | 0.31 [0.03, 2.78] |
| 1.2.3 (Sub)clinical heart failure combined (subclinical defined as a fall in LVEF of > 20%) | 1 | 62 | Risk Ratio (M‐H, Random, 95% CI) | 0.04 [0.00, 0.60] |
| 1.2.4 (Sub)clinical heart failure combined (subclinical defined as a decrease in LVEF) | 1 | 240 | Risk Ratio (M‐H, Random, 95% CI) | 0.36 [0.15, 0.90] |
| 1.3 Response rate Show forest plot | 3 | Risk Ratio (M‐H, Random, 95% CI) | Subtotals only | |
| 1.3.1 Response rate (defined as complete or partial remission) | 2 | 292 | Risk Ratio (M‐H, Random, 95% CI) | 1.20 [0.65, 2.22] |
| 1.3.2 Response rate (defined as good response) | 1 | 178 | Risk Ratio (M‐H, Random, 95% CI) | 1.23 [0.91, 1.66] |
| 1.4 Overall survival Show forest plot | 2 | 322 | Hazard Ratio (IV, Random, 95% CI) | 1.42 [0.61, 3.30] |
| Outcome or subgroup title | No. of studies | No. of participants | Statistical method | Effect size |
| 2.1 Clinical heart failure Show forest plot | 2 | 4146 | Risk Ratio (M‐H, Random, 95% CI) | 0.65 [0.23, 1.88] |
| 2.2 Overall survival Show forest plot | 2 | 4146 | Hazard Ratio (IV, Random, 95% CI) | 1.06 [0.93, 1.22] |
| 2.3 Adverse effects other than cardiac damage Show forest plot | 2 | Risk Ratio (M‐H, Random, 95% CI) | Subtotals only | |
| 2.3.1 Treatment‐related death | 1 | 3114 | Risk Ratio (M‐H, Random, 95% CI) | 0.19 [0.01, 3.99] |
| 2.3.2 Death attributable to chemotherapy | 1 | 1032 | Risk Ratio (M‐H, Random, 95% CI) | 0.34 [0.01, 8.26] |
| 2.3.3 Leukopenia grade 4 | 1 | 3114 | Risk Ratio (M‐H, Random, 95% CI) | 0.58 [0.53, 0.64] |
| 2.3.4 Leukopenia grade 3 or 4 | 1 | 1032 | Risk Ratio (M‐H, Random, 95% CI) | 0.26 [0.21, 0.31] |
| 2.3.5 Granulocytopenia grade 4 | 1 | 3114 | Risk Ratio (M‐H, Random, 95% CI) | 0.67 [0.61, 0.73] |
| 2.3.6 Thrombocytopenia grade 4 | 1 | 3114 | Risk Ratio (M‐H, Random, 95% CI) | 0.45 [0.34, 0.59] |
| 2.3.7 Diarrhoea grade 3 or 4 | 1 | 3114 | Risk Ratio (M‐H, Random, 95% CI) | 0.34 [0.19, 0.60] |
| 2.3.8 Dyspnoea grade 3 or 4 | 1 | 3114 | Risk Ratio (M‐H, Random, 95% CI) | 0.51 [0.28, 0.93] |
| 2.3.9 Infection grade 3 or 4 | 1 | 3114 | Risk Ratio (M‐H, Random, 95% CI) | 0.61 [0.42, 0.86] |
| 2.3.10 Malaise/fatigue/lethargy grade 3 or 4 | 1 | 3114 | Risk Ratio (M‐H, Random, 95% CI) | 0.66 [0.49, 0.91] |
| 2.3.11 Nausea grade 3 or 4 | 1 | 3114 | Risk Ratio (M‐H, Random, 95% CI) | 1.19 [0.98, 1.44] |
| 2.3.12 Stomatitis grade 3 or 4 | 1 | 3114 | Risk Ratio (M‐H, Random, 95% CI) | 0.40 [0.27, 0.61] |
| 2.3.13 Vomiting grade 3 or 4 | 1 | 3114 | Risk Ratio (M‐H, Random, 95% CI) | 1.31 [1.07, 1.59] |
| Outcome or subgroup title | No. of studies | No. of participants | Statistical method | Effect size |
| 3.1 Response rate (defined as objective palliative tumour response (i.e. decrease in PSA levels of >= 50%)) Show forest plot | 1 | 48 | Risk Ratio (M‐H, Random, 95% CI) | 0.07 [0.00, 1.13] |
| 3.2 Adverse effects other than cardiac damage Show forest plot | 1 | Risk Ratio (M‐H, Random, 95% CI) | Subtotals only | |
| 3.2.1 Gastrointestinal toxicity grade 3 or 4 | 1 | 48 | Risk Ratio (M‐H, Random, 95% CI) | 0.17 [0.01, 3.08] |
| 3.2.2 Tachycardia grade 3 or 4 | 1 | 48 | Risk Ratio (M‐H, Random, 95% CI) | 0.06 [0.00, 1.00] |
| 3.2.3 Arrhythmia grade 3 or 4 | 1 | 48 | Risk Ratio (M‐H, Random, 95% CI) | 0.39 [0.04, 3.52] |
| 3.2.4 Dyspnoea grade 3 or 4 | 1 | 48 | Risk Ratio (M‐H, Random, 95% CI) | 0.47 [0.10, 2.20] |
| 3.2.5 Palmar‐plantar erythrodysesthesia grade 3 or 4 | 1 | 48 | Risk Ratio (M‐H, Random, 95% CI) | 5.91 [1.45, 24.16] |
| 3.2.6 Hepatic toxicity grade 3 or 4 | 1 | 48 | Risk Ratio (M‐H, Random, 95% CI) | 0.20 [0.05, 0.79] |
| 3.2.7 Leukopenia grade 3 or 4 | 1 | 48 | Risk Ratio (M‐H, Random, 95% CI) | 0.24 [0.03, 1.87] |
| 3.2.8 Thrombocytopenia grade 3 or 4 | 1 | 48 | Risk Ratio (M‐H, Random, 95% CI) | 0.39 [0.02, 9.15] |
| 3.2.9 Haemoglobin‐related toxicity grade 3 or 4 | 1 | 48 | Risk Ratio (M‐H, Random, 95% CI) | 0.07 [0.00, 1.13] |
| Outcome or subgroup title | No. of studies | No. of participants | Statistical method | Effect size |
| 4.1 Clinical heart failure Show forest plot | 1 | 1086 | Risk Ratio (M‐H, Random, 95% CI) | 0.97 [0.06, 15.48] |
| 4.2 Adverse effects other than cardiac damage Show forest plot | 1 | Risk Ratio (M‐H, Random, 95% CI) | Subtotals only | |
| 4.2.1 Anaemia grade 3 or 4 | 1 | 1086 | Risk Ratio (M‐H, Random, 95% CI) | 2.91 [0.79, 10.70] |
| 4.2.2 Leukopenia grade 3 or 4 | 1 | 1086 | Risk Ratio (M‐H, Random, 95% CI) | 1.06 [0.75, 1.49] |
| 4.2.3 Neutropenia grade 3 or 4 | 1 | 1086 | Risk Ratio (M‐H, Random, 95% CI) | 1.05 [0.84, 1.31] |
| 4.2.4 Febrile neutropenia grade 3 or 4 | 1 | 1086 | Risk Ratio (M‐H, Random, 95% CI) | 0.78 [0.47, 1.31] |
| 4.2.5 Thrombocytopenia grade 3 or 4 | 1 | 1086 | Risk Ratio (M‐H, Random, 95% CI) | 12.62 [0.71, 223.52] |
| 4.2.6 Nausea/vomiting grade 3 or 4 | 1 | 1086 | Risk Ratio (M‐H, Random, 95% CI) | 0.91 [0.45, 1.82] |
| 4.2.7 Fatigue grade 3 or 4 | 1 | 1086 | Risk Ratio (M‐H, Random, 95% CI) | 0.32 [0.07, 1.60] |
| 4.2.8 Infection grade 3 or 4 | 1 | 1086 | Risk Ratio (M‐H, Random, 95% CI) | 0.79 [0.48, 1.31] |
| 4.2.9 Central nervous system grade 3 or 4 | 1 | 1086 | Risk Ratio (M‐H, Random, 95% CI) | 2.91 [0.12, 71.35] |
| 4.2.10 Pulmonary grade 3 or 4 | 1 | 1086 | Risk Ratio (M‐H, Random, 95% CI) | 2.91 [0.12, 71.35] |
| 4.2.11 Peripheral neuropathy grade 3 or 4 | 1 | 1086 | Risk Ratio (M‐H, Random, 95% CI) | 4.50 [2.37, 8.54] |
| 4.2.12 Hepatotoxicity grade 3 or 4 | 1 | 1086 | Risk Ratio (M‐H, Random, 95% CI) | 1.70 [0.50, 5.77] |
| 4.2.13 Hypersensitivity reactions grade 3 or 4 | 1 | 1086 | Risk Ratio (M‐H, Random, 95% CI) | 3.88 [1.71, 8.82] |
| 4.2.14 Mucositis grade 3 or 4 | 1 | 1086 | Risk Ratio (M‐H, Random, 95% CI) | 1.05 [0.48, 2.28] |
| 4.2.15 Pain grade 3 or 4 | 1 | 1086 | Risk Ratio (M‐H, Random, 95% CI) | 0.32 [0.01, 7.93] |
| 4.2.16 Arthralgias/myalgias grade 3 or 4 | 1 | 1086 | Risk Ratio (M‐H, Random, 95% CI) | 3.88 [1.31, 11.54] |
| 4.2.17 Treatment‐related death | 1 | 1086 | Risk Ratio (M‐H, Random, 95% CI) | 2.91 [0.12, 71.35] |