Hyperbaric oxygen therapy for acute coronary syndrome
Abstract
Background
Acute coronary syndrome (ACS), includes acute myocardial infarction and unstable angina, is common and may prove fatal. Hyperbaric oxygen therapy (HBOT) will improve oxygen supply to the threatened heart and may reduce the volume of heart muscle that perishes. The addition of HBOT to standard treatment may reduce death rate and other major adverse outcomes.
This an update of a review previously published in May 2004 and June 2010.
Objectives
The aim of this review was to assess the evidence for the effects of adjunctive HBOT in the treatment of ACS. We compared treatment regimens including adjunctive HBOT against similar regimens excluding HBOT. Where regimens differed significantly between studies this is clearly stated and the implications discussed. All comparisons were made using an intention to treat analysis where this was possible. Efficacy was estimated from randomised trial comparisons but no attempt was made to evaluate the likely effectiveness that might be achieved in routine clinical practice. Specifically, we addressed:
Does the adjunctive administration of HBOT to people with acute coronary syndrome (unstable angina or infarction) result in a reduction in the risk of death?
Does the adjunctive administration of HBOT to people with acute coronary syndrome result in a reduction in the risk of major adverse cardiac events (MACE), that is: cardiac death, myocardial infarction, and target vessel revascularization by operative or percutaneous intervention?
Is the administration of HBOT safe in both the short and long term?
Search methods
We updated the search of the following sources in September 2014, but found no additional relevant citations since the previous search in June 2010 (CENTRAL), MEDLINE, EMBASE, CINAHL and DORCTHIM. Relevant journals were handsearched and researchers in the field contacted. We applied no language restrictions.
Selection criteria
Randomised studies comparing the effect on ACS of regimens that include HBOT with those that exclude HBOT.
Data collection and analysis
Three authors independently evaluated the quality of trials using the guidelines of the Cochrane Handbook and extracted data from included trials. Binary outcomes were analysed using risk ratios (RR) and continuous outcomes using the mean difference (MD) and both are presented with 95% confidence intervals. We assessed the quality of the evidence using the GRADE approach.
Main results
No new trials were located in our most recent search in September 2014. Six trials with 665 participants contributed to this review. These trials were small and subject to potential bias. Only two reported randomisation procedures in detail and in only one trial was allocation concealed. While only modest numbers of participants were lost to follow‐up, in general there is little information on the longer‐term outcome for participants. Patients with acute coronary syndrome allocated to HBOT were associated with a reduction in the risk of death by around 42% (RR: 0.58, (95% CI 0.36 to 0.92), 5 trials, 614 participants; low quality evidence).
In general, HBOT was well‐tolerated. No patients were reported as suffering neurological oxygen toxicity and only a single patient was reported to have significant barotrauma to the tympanic membrane. One trial suggested a significant incidence of claustrophobia in single occupancy chambers of 15% (RR of claustrophobia with HBOT 31.6, 95% CI 1.92 to 521).
Authors' conclusions
For people with ACS, there is some evidence from small trials to suggest that HBOT is associated with a reduction in the risk of death, the volume of damaged muscle, the risk of MACE and time to relief from ischaemic pain. In view of the modest number of patients, methodological shortcomings and poor reporting, this result should be interpreted cautiously, and an appropriately powered trial of high methodological rigour is justified to define those patients (if any) who can be expected to derive most benefit from HBOT. The routine application of HBOT to these patients cannot be justified from this review.
PICO
Plain language summary
Does hyperbaric oxygen therapy improve outcome after heart attack?
Background
Acute heart attacks and severe angina (heart pain) are usually due to blockages in the arteries supplying the heart (coronary arteries). These problems are collectively referred to as 'acute coronary syndrome' (ACS). ACS is very common and may lead to severe complications including death. Hyperbaric oxygen therapy (HBOT) involves people breathing pure oxygen at high pressures in a specially designed chamber. It is sometimes used as a treatment to increase the supply of oxygen to the damaged heart in an attempt to reduce the area of the heart that is at risk of dying.
We searched the medical literature for any studies that reported the outcome of patients with ACS when treated with HBOT.
Studies found
We first searched the literature in 2004 and most recently in September 2014, finding 6 studies in total. All studies included patients with heart attack and some also included patients with severe angina. The dose of hyperbaric oxygen was similar in most studies.
Key results
Overall, we found some evidence that people with ACS are less likely to die or to have major adverse events, and to have more rapid relief from their pain if they receive hyperbaric oxygen therapy as part of their treatment. However, our conclusions are based on relatively small randomised trials. Our confidence in these findings is further reduced because in most of these studies both the patients and researchers were aware of who was receiving HBOT and it is possible a 'placebo effect' has biased the result in favour of HBOT. HBOT was generally well‐tolerated. Some patients complained of claustrophobia when treated in small (single person) chambers and there was no evidence of important toxicity from oxygen breathing in any subject. One individual suffered damage to the eardrum from pressurisation.
Conclusions
While HBOT may reduce the risk of dying, time to pain relief and the chance of adverse heart events in people with heart attack and unstable angina, more work is needed to be sure that HBOT should be recommended.
Authors' conclusions
Summary of findings
| hyperbaric oxygen therapy for acute coronary syndrome | ||||||
| Patient or population: patients with acute coronary syndrome | ||||||
| Outcomes | Illustrative comparative risks* (95% CI) | Relative effect | No of Participants | Quality of the evidence | Comments | |
|---|---|---|---|---|---|---|
| Assumed risk | Corresponding risk | |||||
| Control | hyperbaric oxygen therapy | |||||
| Death at any time | Study population | RR 0.58 | 614 | ⊕⊕⊝⊝ | ||
| 116 per 1000 | 67 per 1000 | |||||
| Medium risk population | ||||||
| 102 per 1000 | 59 per 1000 | |||||
| *The basis for the assumed risk (e.g. the median control group risk across studies) is provided in footnotes. The corresponding risk (and its 95% confidence interval) is based on the assumed risk in the comparison group and the relative effect of the intervention (and its 95% CI). | ||||||
| GRADE Working Group grades of evidence | ||||||
| 1 Critical outcome | ||||||
| hyperbaric oxygen therapy for acute coronary syndrome | ||||||
| Patient or population: patients with acute coronary syndrome | ||||||
| Outcomes | Illustrative comparative risks* (95% CI) | Relative effect | No of Participants | Quality of the evidence | Comments | |
|---|---|---|---|---|---|---|
| Assumed risk | Corresponding risk | |||||
| Control | hyperbaric oxygen therapy | |||||
| 12 hour Plasma Creatine Phosphokinase | The mean 12 hour Plasma Creatine Phosphokinase in the intervention groups was | 84 | ⊕⊕⊕⊝ | |||
| 24 hour Plasma Creatine Phosphate | The mean 24 hour Plasma Creatine Phosphate in the intervention groups was | 72 | ⊕⊕⊕⊝ | |||
| Maximum Plasma Creatine Phosphate | The mean Maximum Plasma Creatine Phosphate in the intervention groups was | 184 | ⊕⊕⊕⊕ | |||
| *The basis for the assumed risk (e.g. the median control group risk across studies) is provided in footnotes. The corresponding risk (and its 95% confidence interval) is based on the assumed risk in the comparison group and the relative effect of the intervention (and its 95% CI). | ||||||
| GRADE Working Group grades of evidence | ||||||
| 1 Single trial only | ||||||
Background
Description of the condition
Cardiovascular disease (CVD) is the leading cause of death in the world, accounting for 30% of all deaths, of which 42% are due to coronary heart disease (CHD) (WHO 2013). In the United Kingdom, CVD is the most common cause of premature death, causing just over 159,000 deaths, approximately 25% of all deaths episodes in 2011 (BHF 2012). Of these deaths, nearly 74,000 were due to CHD at a community cost of around GBP 1.8 billion in 2009 (Nichols 2012). Since myocardial infarction (the presence of two out of three of: chest pain, ECG changes and cardiac enzyme rise) is not always diagnosable during an acute event, unstable or persisting ischaemic heart pain (angina) with or without infarction are together described as acute coronary syndrome (ACS). The main underlying problems in coronary heart disease is atherosclerosis, a degenerative process characterised by the formation of plaques comprised of platelets, cells, matrix fibres, lipids, and tissue debris in the vessel lumen. While such plaques are often complicated by ulceration of the vessel wall with obstruction to blood flow, such ulceration is not necessary for plaques to be problematic (Naghavi 2003). An unstable plaque (coronary atheroma vulnerable to rupture and fissure, and associated with thrombus formation) can lead to an acute coronary syndrome without the artery being totally occluded and infarction may follow (Heistad 2003). A significant proportion of patients admitted with acute myocardial infarction (AMI) will suffer major morbidity or mortality, even when thrombolysis or angioplasty is used to relieve the obstruction, although there is some evidence that the rate of inhospital events and six‐month readmissions are falling with increasing adherence to evidence‐based guidelines (Kalla 2006; Aliprandi‐Costa 2011).
Description of the intervention
Hyperbaric oxygen therapy (HBOT) is an adjunctive therapy that has been proposed to improve outcome following ACS. HBOT is the therapeutic administration of 100% oxygen at environmental pressures greater than one atmosphere absolute (ATA), and involves placing the patient in an airtight vessel, increasing the pressure within that vessel, and administering 100% oxygen for respiration. In this way, it is possible to deliver a greatly increased partial pressure of oxygen to the tissues. At 2 ATA, for example, patients with reasonable cardiopulmonary function will have an arterial oxygen tension of over 1000 mmHg, and a muscle oxygen tension around 221mmHg (Sheffield 1988; Wells 1977). In comparison, muscle oxygen tension on air at 1ATA is about 29 mmHg and 59mmHg breathing 100% oxygen at 1ATA. Indeed, at 3ATA on 100% oxygen, there are more than 6 mls of oxygen dissolved in every 100 mls of plasma, enough to sustain basal metabolic requirements without any oxygen transport by haemoglobin (Boerema 1960; Hammarlund 1999; Leach 1998). However 3ATA of 100% oxygen becomes rapidly toxic in the brain, manifested in epileptiform grand mal seizures. Therefore in practice, treatments involve pressurisation to between 1.5 and 2.8 ATA for periods between 60 and 120 minutes once or more daily.
HBOT for ACS was first reported in a canine experimental model in 1958 (Smith 1958) and in a human subject in 1964 (Moon 1964). Several uncontrolled human studies have been published since that time, generally with indications of benefit measured as a reduction in mortality or improvements in haemodynamic or metabolic parameters (Ashfield 1969; Kline 1970). As far as the authors are aware, however, HBOT is not in routine use anywhere for patients presenting with ACS.
How the intervention might work
The administration of HBOT is based on the argument that the myocardium is hypoxic, and that HBOT can reverse that hypoxia in areas that are marginally perfused. This effect is achieved by greatly increasing the diffusion gradient down which oxygen moves from the blood to the myocyte. Improved oxygen availability may also improve outcome through the effects of oxygen as a modulator of tissue repair. Oxygen has been shown to increase the expression of antioxidant enzymes in both tissues and plasma through an increase in glutathione levels (Harabin 1990; Speit 2000), to reduce the degree of lipid peroxidation (Thom 1991) and to prevent the activation of neutrophils in response to endothelial damage, thus modifying ischaemia‐reperfusion injury (Jones 2010; Tjarnstrom 1999). HBOT also mobilises stem cells from the bone marrow in a dose‐dependent manner and may be important in neovascularisation of healing tissue (Heyboer 2014). The induction of protective mechanisms via a degree of oxidative stress is probably the common factor for many of these beneficial effects (Thom 2009). However despite more than 40 years of interest in the delivery of HBOT relatively little clinical evidence exists for the assertion that such an intervention improves outcome.
Why it is important to do this review
To our knowledge, there are no other systematic reviews of the clinical use of HBOT for ACS, and it is important to clearly assess both the risks and benefits of this treatment. While HBOT may produce benefit for the myocardium via the mechanisms outlined above, HBOT is associated with some risk of adverse effects including damage to the ears, sinuses and lungs from the effects of pressure (Shupak 2008), temporary worsening of short‐sightedness (Khan 2003), claustrophobia and oxygen poisoning (Butler 2008; Leach 1998). Reported rates vary widely but, for example, about 20% of patients will experience some degree of middle ear barotrauma, and 60% to 70% a measurable worsening of short‐sightedness (Khan 2003; Shupak 2008). Oxygen poisoning may occur acutely in the form of grand mal seizures while exposed to hyperbaric oxygen (acute neurological toxicity), or develop over the course of treatment, resulting in a reversible reduction in vital capacity and other respiratory indices (pulmonary oxygen toxicity) (Clark 2008). In addition, the occurrence of significant post‐infarction events such as malignant arrhythmia, might be associated with a worse prognosis if they arise while the patient is confined in a hyperbaric chamber. Although serious adverse events are rare, HBOT cannot be regarded as an entirely benign intervention (Leach 1998). For a number of reasons, therefore, the administration of HBOT for acute coronary syndrome patients remains controversial.
Objectives
The aim of this review was to assess the evidence for the effects of adjunctive HBOT in the treatment of ACS. We compared treatment regimens including adjunctive HBOT against similar regimens excluding HBOT. Where regimens differed significantly between studies this is clearly stated and the implications discussed. All comparisons were made using an intention to treat analysis where this was possible. Efficacy was estimated from randomised trial comparisons but no attempt was made to evaluate the likely effectiveness that might be achieved in routine clinical practice. Specifically, we addressed:
-
Does the adjunctive administration of HBOT to people with acute coronary syndrome (unstable angina or infarction) result in a reduction in the risk of death?
-
Does the adjunctive administration of HBOT to people with acute coronary syndrome result in a reduction in the risk of major adverse cardiac events (MACE), that is: cardiac death, myocardial infarction, and target vessel revascularization by operative or percutaneous intervention?
-
Is the administration of HBOT safe in both the short and long term?
Methods
Criteria for considering studies for this review
Types of studies
Randomised controlled trials that compare the effect of treatment for ACS (including thrombolysis) where HBOT administration is included, with the effect of similar treatment in the absence of HBOT. Studies were considered irrespective of the use of a sham therapy, allocation concealment or blinding status.
Types of participants
Any adult with an acute coronary syndrome, with or without S‐T segment elevation.
Types of interventions
HBOT administered in a compression chamber between pressures of 1.3ATA and 3.0ATA and treatment times between 30 minutes and 120 minutes on at least one occasion, were eligible. We accepted any standard treatment regimen designed to maximise recovery, and where the same regimen is delivered in both arms of any single trial. Subgroup analysis was intended to evaluate the impact of different comparator strategies.
Types of outcome measures
Studies were eligible for inclusion if they reported any of the following outcome measures at any time.
Primary outcomes
-
Death rate at any time following presentation;
-
Rate of Major Adverse Cardiac Events (MACE), this includes death, recurrent MI, urgent revascularization (CABG or PTCA).
Secondary outcomes
-
Rate of significant cardiac events including dysrhythmia, onset of cardiac failure, haemodynamic change;
-
Time to relief of cardiac pain;
-
Size of infarct area;
-
Magnitude of cardiac enzyme changes;
-
Left ventricular function;
-
Length of stay in either a specialist cardiac unit or general hospital ward;
-
Myocardial perfusion measured by whatever means;
-
Quality of life (QOL);
-
Rate of re‐admission;
-
Costs for the delivery of care;
-
Adverse events associated with HBOT including damage to the ears, sinuses and lungs from the effects of pressure, worsening of myopia, claustrophobia and oxygen poisoning. Any other adverse events reported in either arm will also be recorded.
Search methods for identification of studies
It was our intention to capture both published and unpublished studies. We applied no language restrictions.
Electronic searches
Initial searches were made in May 2004 (Appendix 1) and repeated with some modifications in strategy in June 2007 (Appendix 2), June 2010 (Appendix 3) and September 2014 (Appendix 4).
We searched: the Cochrane Central Register of Controlled Trials (CENTRAL, Issue 8, September 2014) on the Cochrane Library, OVID MEDLINE (1966 to September 2014), OVID EMBASE (1980 to September 2014), EBSCO CINAHL (1982 to September 2014), LILACS on Bireme (1980 to September 2014) and an additional database developed in our Hyperbaric facility, DORCTHIM (The Database of Randomised Trials in Hyperbaric Medicine, Bennett 2002 ‐ searched September 2014. The LILACS and DORCTIHM searches were by the keywords 'coronary or cardiac or heart or myocard$' and 'hyperbaric oxygen$'.
Searching other resources
In addition we undertook a systematic search for relevant controlled trials in specific hyperbaric literature sources up to September 2014:
-
Experts in the field and leading hyperbaric therapy centres (as identified by personal communication and searching the Internet) were contacted and asked for additional relevant data in terms of published or unpublished randomised trials;
-
Handsearching of relevant hyperbaric textbooks (Jain 2009; Kindwall 2008; Mathieu 2006), journals (Undersea and Hyperbaric Medicine, Hyperbaric Medicine Review, South Pacific Underwater Medicine Society (SPUMS) Journal, European Journal of Hyperbaric Medicine and Aviation, Space and Environmental Medicine Journal) and conference proceedings (Undersea and Hyperbaric Medical Society, SPUMS, European Undersea and Baromedical Society, International Congress of Hyperbaric Medicine) published since 1980;
-
Contact with authors of relevant studies to request details of unpublished or ongoing investigations.
-
We also searched for ongoing relevant trials in the registry ClinicalTrias.gov using the term 'hyperbaric oxygen'.
Authors were contacted if there was any ambiguity about the published data.
Data collection and analysis
Selection of studies
One author (MB) was responsible for handsearching and identification of appropriate studies for consideration. Two authors (MB and NJ) examined the electronic search results and identified studies that were possibly relevant. All studies considered possibly relevant by at least one author were entered into a bibliographic software package (Reference Manager). All comparative clinical trials identified were retrieved in full and reviewed independently by three authors, two with content expertise with HBOT and one with content expertise in treating ACS. In addition one of the authors (MB) has expertise in clinical epidemiology.
Data extraction and management
Using a data extraction form developed for this review, each author extracted relevant data. Any disagreements were resolved by consensus and communication with the authors of the original trials as appropriate. All data extracted reflected original allocation group where possible to allow an intention to treat analysis. Withdrawals were identified where this information was given.
Assessment of risk of bias in included studies
We followed the guidelines of the Cochrane Handbook for Systematic Reviews of Interventions for assessing the risk of bias in included studies (Higgins 2008). Two authors (MB and JL) independently assessed the quality of the studies with respect to sequence generation, allocation concealment, blinding, incomplete outcome data, selective outcome reporting and other potential threats to validity. We assessed the quality factors of each study separately and have presented them in a Risk of Bias table for each study.
Any differences of opinion were resolved by discussion and consensus.
Dealing with missing data
We employed sensitivity analyses using different approaches to impute missing data. The best‐case scenario assumed that none of the originally enrolled patients missing from the primary analysis in the treatment group had the negative outcome of interest whilst all those missing from the control group did. The worst‐case scenario was the reverse.
Assessment of heterogeneity
For dichotomous outcomes relative risk (RR) was used. We used a fixed‐effect model where there was no evidence of significant heterogeneity between studies, and a random‐effects model where inter‐study heterogeneity was likely (see below under subgroups).
Data synthesis
Primary outcomes
-
Risk of death (time of outcome was determined by trial data). The RR for survival with HBOT was established using the intention to treat data of the HBOT versus the control group. Where there were withdrawals without an indication as to group allocation, we divided them in the proportions intended by randomisation. Analyses were performed with RevMan 5.0.23 software. As an estimate of the statistical significance of a difference between experimental interventions and control interventions we calculated RR, with 95% confidence intervals (CI), for survival using HBOT. A statistically significant difference between experimental intervention and control intervention was assumed if the 95% CI of the RR did not include the value 1.0. As an estimate of the clinical relevance of any difference between experimental intervention and control intervention we calculated the number‐needed‐to‐treat (NNT) with 95% CI as appropriate;
-
Risk of suffering Major Adverse Cardiac Event (MACE ‐ includes death, recurrent MI and urgent revascularization (CABG or PTCA)). The RR for MACE with and without HBOT was calculated using the methods described in (1) above;
Secondary outcomes
-
Risk of suffering significant cardiac events (dysrhythmia requiring intervention, haemodynamic disturbance requiring intervention or cardiac failure). The RR for cardiac event with and without HBOT was calculated using the methods described in (1) above;
-
Time to relief of cardiac pain: the weighted mean differences (WMD) in time to relief between HBOT and control groups was compared using RevMan 4.2. A statistically significant difference was defined as existing if the 95% CI did not include a zero WMD;
-
Infarct area: the WMD in infarct area was to be compared using the methods described in (4) above;
-
Rise in cardiac enzymes: the WMD between groups for the maximum enzyme level was compared as for (4) above;
-
Left ventricular function: the WMD of ejection fraction or other measure of left ventricular function was compared as for (4) above;
-
Length of Stay: the WMD in length of stay in both intensive care area/coronary care area and general hospital ward was calculated in a way analogous to that described in (4) above;
-
Myocardial perfusion: the WMD in measures designed to assess myocardial perfusion were to be compared as for (4) above;
-
Quality of life: WMD in QOL measures and/or activities of daily living were to be compared as for (4) above;
-
Risk of re‐admission following treatment for acute coronary syndrome: the RR for re‐admission following HBOT and comparator was to be compared using the methods described in (1) above;
-
Cost: the WMD in costs between treatment arms was to be compared as for (4) above;
-
Dichotomous data were considered for adverse events (number of patients with adverse events versus number of patients without them in both groups) in the HBOT groups of the included studies. We tabulated any recorded adverse events and pooled as appropriate.
Subgroup analysis and investigation of heterogeneity
We considered, but excluded, subgroup analysis based on:
-
Inclusion or otherwise of thrombolysis in both arms of the trial;
-
Nature of comparator treatment modalities;
-
Dose of oxygen received (pressure, time and length of treatment course);
-
Presence or absence of cardiac failure;
-
Site of infarct;
-
Infarcted subjects versus pre‐infarction subjects.
Subgroup analysis by sex and age was not considered in this analysis because we did not intend to seek individual patient data. Clinical and statistical heterogeneity was explored and subgroup analyses would have been performed if appropriate. Clinically we considered differences in patient groups, the timing and nature of all therapies and other aspects of the clinical setting. Statistically, the forest plots generated were examined and the presence or absence of overlap in the confidence intervals noted (lack of overlap of confidence intervals may indicate heterogeneity). Statistical heterogeneity was to be assumed if the I2 value exceeded 30%, and consideration would have been given to the appropriateness of pooling and meta‐analysis.
Sensitivity analysis
We intended to perform sensitivity analyses for missing data and study quality where appropriate data existed.
Results
Description of studies
Results of the search
Our previous searches from May 2004 to June 2010 produced a total of 158 records. After removal of duplicates, 44 records remained. On the basis of screening the titles and abstracts, we excluded 28 records, leaving 16 records that were examined in full. Of these, we included 11 reports of six trials. Our most recent search in September 2014 retrieved a further 66 records. After removal of duplicates, 38 records remained. After screening the titles and abstracts, we excluded all these records. This latest search has therefore uncovered no further trials that contribute to either the qualitative or quantitative review.
The results of all four searches are combined and summarised in Figure 1. In total we have included eleven reports of six trials (Dekleva 2004; Dotsenko 2007; Hot MI 1998; Sharifi 2004; Swift 1992; Thurston 1973).
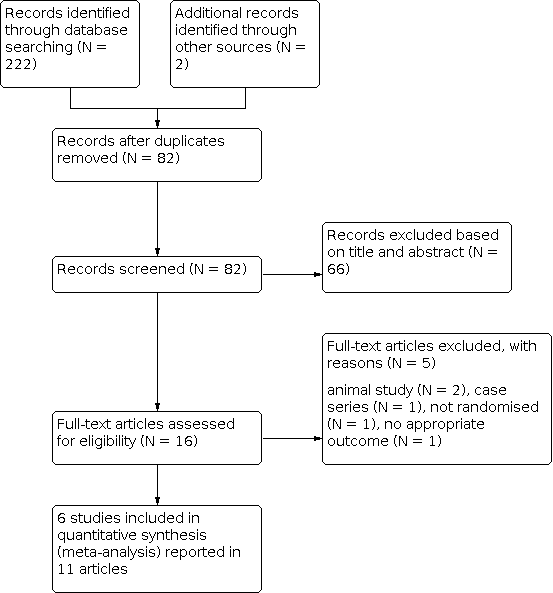
Study flow diagram
Included studies
This review includes eleven reports of six trials (Dekleva 2004; Dotsenko 2007; Hot MI 1998; Sharifi 2004; Swift 1992; Thurston 1973). The secondary citations for these studies are listed in Included studies. The six included trials were published between 1973 and 2007 and from a wide range of geographical locations (USA: Long Beach California Hot MI 1998 and Cleveland Ohio Sharifi 2004; Russia: Minsk Dotsenko 2007; The Balkans: Belgrade, Serbia and Montenegro Dekleva 2004; England: London Thurston 1973 and Australia: Fremantle Swift 1992). None of the trials declared any industry funding, although Thurston 1973 declared the chamber manufacturer loaned his group the hyperbaric chambers used. The authors of this review are unaware of any ongoing RCTs in the area. In total, the six trials enrolled 665 participants, 337 receiving HBOT and 328 control. The largest trial (Thurston 1973) accounts for 33% of cases. (See Characteristics of included studies).
All studies involved the administration of 100% oxygen at between 2ATA and 3ATA for between 30 and 120 minutes, however the total number of treatment sessions varied between studies. The lowest number administered was a single session (Dekleva 2004; Hot MI 1998; Swift 1992), while the highest was a maximum of 16 treatments within 48 hours (Thurston 1973).
All trials included participants with acute myocardial infarction and Sharifi 2004 also included individuals presenting with unstable angina. All trials included patients with similar age and sex distribution (see Characteristics of included studies). Only Swift 1992 described allocation concealment and blinded subjects to allocation with a sham HBOT session. The time from presentation to enrolment varied from "up to ten days" (Dotsenko 2007), "within one week" (Swift 1992) to "within 24 hours" (Thurston 1973) and "within six hours" (Hot MI 1998). The mean time to treatment with HBOT was 13 hours in Dekleva 2004, whilst Sharifi 2004 did not state any time. The primary purpose of five of these reports was the treatment of AMI with HBOT (Dotsenko 2007 was aimed at the prevention of further AMI rather than acute treatment), while for Swift 1992 it was the use of HBOT in AMI patients to identify myocardial segments capable of functional improvement, and for Sharifi 2004 the effect of HBOT on re‐stenosis following percutaneous coronary interventions. Specific exclusion criteria varied between trials. All trials excluded those unfit for HBOT, but in addition Hot MI 1998 and Dekleva 2004 excluded subjects who were not suitable for thrombolysis (e.g. recent stroke), those with previous AMI and those in cardiogenic shock, while Swift 1992 excluded those with uncontrolled heart failure and/or significant ongoing angina. Thurston 1973 excluded subjects over 70 years and those presenting when there was no HBOT chamber available. Dekleva 2004 also excluded patients over 70 or with heart failure, significant dysrhythmia or no definitive diagnosis of AMI. Sharifi 2004 excluded those who continued to show evidence of ischaemia after 30 minutes of medical treatment. Dotsenko 2007 only enrolled patients more than three days after AMI.
Comparator therapies also varied between trials. All trials employed HBOT as an adjunctive procedure to "standard" care: Hot MI 1998 and Dotsenko 2007 used thrombolysis, aspirin, heparin and intravenous nitroglycerine in suitable patients, Sharifi 2004 employed stenting and a regimen using aspirin, heparin and clopidogrel, Dekleva 2004 used thrombolysis, while Thurston 1973 used "full orthodox care" and Swift 1992 used "customary care".
The follow‐up periods varied between the period immediately following HBOT (Swift 1992), to three weeks (Thurston 1973), six weeks (Dekleva 2004) eight months (Sharifi 2004) and two years (Dotsenko 2007). Hot MI 1998 reported mortality to discharge from hospital. All included studies reported at least one clinical outcome of interest. Of the outcomes identified above, these trials reported data on both primary outcomes (mortality and MACE), but only length of stay, time to pain relief, magnitude of cardiac enzyme changes, left ventricular function and adverse events from the secondary outcomes of interest.
Other outcomes reported included: angiographic re‐stenosis and recurrence of angina (Sharifi 2004), left ventricular wall motion score index, diastolic filling and left ventricular end diastolic and systolic volumes (Dekleva 2004), and left ventricular ejection fraction and resolution of ST segment abnormality (Hot MI 1998).
Excluded studies
A total of five studies were excluded after review of the full report. Details are given in the table Characteristics of excluded studies. Two were reports of animal experiments (Ciocatto 1965; Thomas 1990), one was a case series (Cameron 1965), one was a non‐random comparative trial (Dai 1995) and one was an RCT which included patients with both stable angina and ACS, and for which the results of those with ACS could not be separately identified (Markarian 1991).
There were no ongoing studies of relevance at the registry ClinicalTrials.gov.
Risk of bias in included studies
Details of the quality assessment are given in the Characteristics of included studies table. The significance of variations in quality detailed below is unclear and given that few analyses could be pooled, study quality was not used as a basis for sensitivity analysis.
Randomisation
Randomisation procedures were described in Hot MI 1998 and Dotsenko 2007 (random number tables and computer‐generated sequence respectively) but not in the other studies. Allocation concealment was adequately described only by Swift 1992. For none of the remaining studies is there a clear indication that the investigators were unable to predict the prospective group to which a participant would be allocated.
Patient baseline characteristics
All patients required a clinical diagnosis of AMI for enrolment in these studies except Sharifi 2004, who also enrolled subjects with unstable angina. In general, there were no potentially important differences in baseline characteristics between groups within each study with the exception of Dekleva 2004. In that study, there were more diabetic patients in the hyperbaric group (22% versus 5%) Three studies defined entry criteria as those patients with a clinical diagnosis of AMI, Dekleva 2004 within the time frame for thrombolysis, Hot MI 1998 within six hours,Thurston 1973 within 24 hours and Dotsenko 2007 from three to seven days after the event. Swift 1992 enrolled patients with AMI and abnormal left ventricular wall motion between three and seven days post‐infarct. All patients in the Sharifi 2004 study had presumed coronary arterial lesions where a percutaneous stent was indicated and so were a more highly selected subset of ACS patients. Hot MI 1998, Dekleva 2004 and Swift 1992 indicated that patients who were unstable or in gross left ventricular failure were excluded.
Blinding
Only Swift 1992 described the use of a sham therapy to blind participants as to treatment group allocation. This paper also described a blinded and randomised method for outcome assessment, including the measurement of concordance between multiple assessors. The echocardiographers were blinded in Dekleva 2004.
Patients lost to follow‐up
The percentage of patients lost to follow up in the six trials ranged from 0% to 13%. Swift 1992 and Dekleva 2004 reported no losses to follow‐up or any violation of treatment protocol. Hot MI 1998 reported 16 subjects (12%) withdrawn from analysis after allocation to groups (four became unstable, four generated incomplete data, three were enrolled after six hours in violation of inclusion criteria, two showed no cardiac enzyme rise, two received an incorrect treatment protocol and one refused to have HBOT). Thurston 1973 similarly did not report data on 13 subjects (6%) who were withdrawn for misdiagnosis or being aged more than 70 years in violation of inclusion criteria. The group allocation was not indicated for any of the withdrawn patients in either of these studies. Sharifi 2004 excluded nine subjects (13%) allocated to HBOT from the analysis, five of which were crossed over to the control arm after declining to receive HBOT. The other four required coronary artery bypass grafting or did not have a lesion suitable for stenting, while there were also four subjects excluded from the control group for the same reasons. Dotsenko 2007 reported seven individuals in each group who withdrew early in the treatment phase and at final follow‐up had lost a total of 14 participants (11%). Sensitivity analysis in this review has made best and worse case analyses (with the assumption of equal distribution of withdrawals) to examine potentially important effects on outcome where these studies contributed patients.
Intention‐to‐treat analysis
None of the included studies specifically indicated an intention to treat approach, and such an approach was not possible for Sharifi 2004 as five subjects crossed from HBOT to control for analysis. Swift 1992 reported full follow‐up and did not report any protocol violation.
Effects of interventions
See: Summary of findings 1 hyperbaric oxygen therapy for acute coronary syndrome; Summary of findings 2 hyperbaric oxygen therapy for acute coronary syndrome
Primary outcomes
1. Death at any time after enrolment (Analysis 1.1)
Figure 2
Five trials reported this outcome (Dekleva 2004; Dotsenko 2007; Hot MI 1998; Sharifi 2004; Thurston 1973), involving 614 subjects (92% of the total subjects in this review), with 287 (47%) allocated to standard treatment plus HBOT and 327 (53%) to standard therapy alone. Thurston 1973 contributed 36% of the subjects to this analysis: 21 subjects (7.3%) died in the HBOT group versus 38 (11.6%) in the control group. There was a statistically significant reduction in the risk of death following HBOT (the RR of death with HBOT was 0.58, 95% CI 0.36 to 0.92, P = 0.02). This result, was however sensitive to the allocation of withdrawals (best case RR of death with HBOT is 0.37, 95% CI 0.23 to 0.58, P < 0.001, worst case RR 1.34, 95% CI 0.91 to 1.96, P = 0.14). Subgroup analysis suggested no significant difference between treatment groups for those in cardiogenic shock (RR with cardiogenic shock 0.61 95% CI 0.32 to 1.18, P = 0.15, but a benefit in those without cardiogenic shock (RR 0.57, 95% CI 0.33 to 0.98, P = 0.0.04). There was no indication of significant heterogeneity between trials (I2 = 0%). Despite the result of the pooled analysis, the absolute risk difference (by simple Х2 analysis) of 4.3% between control and HBOT is not statistically significant (P = 0.07), with an NNT to avoid one extra death of 24, (95% CI 259 in favour of control to 12 in favour of HBOT).

Forest plot of comparison: 1 Death, outcome: 1.1 Death at any time.
2. Major Adverse Coronary Events (MACE) (Analysis 2.1)
Only one trial reported this outcome (Sharifi 2004), involving 61 patients (9% of the total subjects in this review), with 24 (39%) analysed as receiving standard therapy with HBOT, and 37 (61%) standard therapy alone. One subject (4.2%) suffered with a MACE following HBOT versus 13 subjects (35.1%) in the control group. There was a statistically significant reduction in the risk of MACE following HBOT (RR 0.12, 95% CI 0.02 to 0.85, P = 0.03). This result was however, sensitive to the allocation of withdrawals (best case RR of death with HBOT is 0.09, 95% CI 0.01 to 0.61, P = 0.01, worst case RR 0.56, 95% CI 0.23 to 1.40, P = 0.22). The absolute risk difference of 30.9% between sham and HBOT is significant (P=0.005), with an NNT to avoid one extra MACE of 4, (95% CI 3 to 10).
One trial reported the incidence of recurrent acute myocardial infarction (RAMI) at two years rather than MACE (Dotsenko 2007), and it was not clear if this included all those who died during the study period. We have therefore reported this outcome separately. This trial included 129 patients (19% of the total subjects in this review), with 65 (50.4%) allocated to control and 64 (49.6%) to HBOT. Three subjects (4.7%) suffered with a RAMI following HBOT versus 11 subjects (16.9%) in the control group.There was a statistically significant reduction in the risk of RAMI following HBOT (RR 0.28, 95% CI 0.08 to 0.95, P = 0.04). This result was however, sensitive to the allocation of withdrawals (best case RR of death with HBOT is 0.17, 95% CI 0.05 to 0.55, P = 0.0003, worst case RR 0.92, 95% CI 0.42 to 2.02, P = 0.84). The absolute risk difference of 12.2% between sham and HBOT is significant (P = 0.03), with an NNT to avoid one extra MACE of 8, (95% CI 4 to 61).
Secondary outcomes
3. Significant cardiac events (only significant dysrhythmias were reported) (Analysis 3.1)
Only one trial reported this outcome (Thurston 1973) involving 208 patients (31% of the total subjects in this review), with 103 randomised to receive HBOT and 105 in the control arm. Of the events recorded, three dysrhythmias were accepted as 'significant cardiac events' ‐ complete heart block, ventricular fibrillation and asystole. It is not clear if the numbers reported reflect individuals who suffered these events, or the number of events in total. Overall there were 25 such events reported in the patients receiving HBOT versus 43 such events in the control group, and patients receiving HBOT were significantly less likely to suffer one of these dysrhythmias (RR 0.59, 95% CI 0.39 to 0.89, P = 0.01). The absolute risk reduction of 17% corresponds to an NNT to avoid one event of 6, 95% CI 3 to 24. This result was however sensitive to the allocation of withdrawals, best case RR of significant event with HBOT is 0.51, 95%CI 0.34 to 0.77, P = 0.001, worst case RR 0.73, 95%CI 0.50 to 1.06, P = 0.10).
Separate analyses for each of the three dysrhythmias suggested HBOT patients were significantly less likely to suffer with complete heart block (RR 0.32, 95% CI 0.12 to 0.84, P = 0.02), but not ventricular fibrillation (RR 0.78, 95% CI 0.36 to 1.71, P = 0.54) or asystole (RR 0.73, 95% CI 0.34 to 1.56, P = 0.42).
4. Time to relief of cardiac pain (Analysis 4.1)
Only one trial contributed results to this outcome (Hot MI 1998) involving 81 subjects (12% of the total), 40 randomised to HBOT and 41 to control: 57 other subjects enrolled did not contribute data to this analysis, our best estimate is that these were 29 in the standard care plus HBOT group and 28 receiving standard care alone. The mean time to pain relief in the HBOT group was 261 minutes versus 614 minutes in the control group and this difference was statistically significant (WMD 353 minutes, 95% CI 219 to 488, P < 0.0001).
5. Size of infarct area
No trial reported any data on this outcome.
6. Magnitude of cardiac enzyme rise (Analysis 5.2, 5.2, 5.3)
Two trials contributed results to this outcome (Dekleva 2004 (as reported in Vlahovic 2004); Hot MI 1998) involving 184 subjects (28% of the total), 90 randomised to HBOT and 94 to control: 28 other subjects enrolled in Hot MI 1998 did not contribute data to this analysis, 16 in the standard care plus HBOT group and 12 receiving standard care alone. The Hot MI 1998 study reported serum creatine phosphokinase (CPK) levels at 12‐hours post‐treatment and 24‐hours post‐treatment, and both Hot MI 1998 and Dekleva 2004 reported the maximum level recorded. The levels at 12 and 24 hours were lower in the Hot MI 1998 patients receiving HBOT, but not statistically significantly so (12hrs‐ MD 138 international units [IU] lower with HBOT, 95% CI 843 lower to 568 higher, P = 0.70; 24 hrs MD 65 IU lower with HBOT, 95% CI 531lower to 401higher, P = 0.78). The maximum level recorded was significantly lower following HBOT (MD 493 IU lower, 95% CI 839 to 148, P = 0.005).
7. Left ventricular function (Analysis 6.1 and 6.2)
Three trials reported on improvements in LV function (Dekleva 2004; Hot MI 1998; Swift 1992). Swift 1992 reported the number of individuals in whom improved function could be demonstrated on echocardiography following HBOT, while the other two reported LV ejection fraction (LVEF) at discharge (Hot MI 1998), day two and three weeks (Dekleva 2004). Dekleva 2004 also reported several other measures of cardiac function. Swift 1992 involved 34 subjects (5% of the total), 24 randomised to HBOT and 10 to control. 12 subjects showed improved contraction in at least one segment in the HBOT group versus zero in the control group. This difference was not, however, statistically significant (RR of improvement without HBOT 0.09, 95% CI 0.01 to 1.4, P = 0.09). Hot MI 1998 and Dekleva 2004 together involved 190 subjects (29% of the total), 94 randomised to HBOT and 96 to control. LVEF was significantly improved in those patients who received HBOT (MD 5.5% better, 95% CI 2.2% to 8.8%, P = 0.001). One control patient in Dekleva 2004 did not contribute to the analysis, while 21 subjects enrolled in the Hot MI 1998 study did not contribute data either, 12 in the HBOT group and 9 in the control.
8. Length of stay (Analysis 7.1)
Participants who were given HBOT had a mean stay in hospital of 7.4 days versus 9.2 days for those receiving the control treatment. This difference was not statistically significant (WMD 1.8 days, 95% CI 3.7 to ‐0.1, P = 0.06). Data were from 64 participants in the pilot phase of the Hot MI 1998 study (31 randomised to HBOT and 33 to control) 18 other participants did not contribute data to this analysis (10 from the HBOT arm and 8 from the control arm ).
9. Myocardial perfusion
No trials reported any data on this outcome.
10. Quality of life
No trials reported any data on this outcome.
11. Rate of readmission
No trials reported any data on this outcome.
12. Costs of treatment
No trials attempted to estimate the cost‐effectiveness of therapy.
Adverse effects
13. Tympanic membrane rupture (TMR), neurological oxygen toxicity and claustrophobia (Analysis 8.1)
Two trials reported on the incidence of tympanic membrane rupture due to barotrauma (Sharifi 2004; Thurston 1973) involving 269 subjects (41% of the total), 127 (47%) randomised to HBOT and 142 (53%) randomised to control. One subject suffered TMR in the HBOT group versus none of the controls. This difference was not statistically significant (RR of TMR with HBOT 4.56, 95% CI 0.19 to 107.54, P = 0.35).
Three trials (Hot MI 1998 (pilot phase); Sharifi 2004; Thurston 1973) involving 274 subjects reported a zero incidence of neurological oxygen toxicity in all arms. No trial reported on any adverse effects in relation to standard therapeutic measures.
One trial reported on claustrophobia (Thurston 1973) involving 208 subjects (31% of the total), 103 (50%) randomised to HBOT and 105 (50%) to control. There were 15 subjects (15%) with claustrophobia requiring cessation of therapy in the HBOT group versus none in the control group. This difference is statistically significant (RR of claustrophobia with HBOT 31.6, 95% CI 1.92 to 521, P = 0.02).
Discussion
Summary of main results
This review has included data from six trials investigating the treatment of ACS with HBOT, and we believe these represent all randomised human trials in this area, both published and unpublished, at the time of searching. One trial included subjects with ACS, while five included only subjects with confirmed myocardial infarction.
Pooled data for clinical outcomes of interest were performed with respect to the risk of death, cardiac enzyme peak levels, left ventricular function and adverse effects. CPK rose significantly less following HBOT (MD 493 IU, P = 0.005), implying a smaller volume of infarction, and LVEF was better following HBOT (MD 5.5%, P = 0.001) . The clinical and functional significance of these differences is not clear. The risk of dying was significantly better following HBOT, (RR 0.58, P = 0.02) and the absolute risk difference of 4.3% suggested an NNT of around 24 patients in order to avoid one death by the addition of HBOT. Only one trial (Thurston 1973) reported the fate of those presenting in cardiogenic shock, and while there was no statistically significant difference between groups in this small sample, it is worth noting that all survivors were from the HBOT group (three from seven subjects versus none from five). The one small study that reported MACE rather than death alone (Sharifi 2004) also suggested better outcome with the use of HBOT (RR 0.12, P = 0.03) with a risk difference of 31% and an NNT of 4. Similarly, Dotsenko 2007 reported a significant reduction in the chance of re‐infarction with the administration of HBOT (RR 0.28, P = 0.04) with a risk difference of 12..2% and an NNT of 8. These possible treatment effects would be of great clinical importance and deserve further investigation.
Overall completeness and applicability of evidence
Only six trials with 665 participants were available for evaluation using our planned comparisons, and meta‐analysis was not appropriate or possible for a number of these. The evidence is therefore very incomplete and cannot be applied directly to routine clinical care for patients with acute coronary syndrome.
These trials were published over a 24‐year period up to 2007, and from a wide geographical area. We had planned to perform subgroup analyses with respect to inclusion or otherwise of thrombolysis, the nature of comparator treatments, dose of oxygen received (pressure, time and length of treatment course), the presence or absence of cardiac failure, the site of infarct, and to compare those with established versus pre‐infarct subjects. However, the paucity of eligible trials and poor reporting suggested these analyses would not be informative. Patient inclusion criteria were not standard, and poorly reported in some trials. Only Hot MI 1998, Swift 1992 and Dotsenko 2007 clearly indicated the time at which the inclusion criteria were applied. There was significant variation both in oxygen dose during an individual treatment session, and in the number of sessions administered to each patient. While all trials used some form of 'standard' cardiac therapy in a dedicated unit designed to maximise outcome, these comparator therapies were generally poorly described and could not form the basis for a meaningful subgroup analysis.
Quality of the evidence
As well as carrying little statistical power, other problems for this review were the variable methodological quality of many of these trials, differences in entry criteria and the nature and timing of outcomes, and poor reporting of both outcomes and methodology. In particular, there is a possibility of bias due to different anatomical locations and extent of myocardial damage on entry to these small trials, as well as from non‐blinded management decisions in all except Swift 1992. Further, we could only pool the data for two of our outcomes of interest given little commonality between the outcomes reported in these trials.
For the primary outcomes, only a single trial clearly recorded all major adverse copronary events (MACE) and we were unable to calculate a pooled estimate of the effect of allocation to receive HBOT. For the risk of death following acute cortonary syndrome, our estmate is that patients allocated to HBOT were associated with a reduction in the risk of death by around 42% (RR: 0.58, (95% CI 0.36 to 0.92). This estimate was derived from only five trials including 614 subjects and the GRADE approach rates this evidence as of low quality following downgrading because this critical outcome had a low incidence in this small group of patients.
For our secondary outcomes, we could pool only the maximum plasma creatine phosphate (CPK) for two trials. Using the GRADE approach, the evidence for lower CPK associated with patients who received HBOT was rated as high.
As is common with small trials, the incidence of adverse effects was poorly assessed by the studies included in this review. No trial reported any neurological or pulmonary oxygen toxicity in any group, while there was only one reported case of severe ear barotrauma as a consequence of compression. Thurston 1973 reported 15 individuals who needed to be removed from a single occupancy hyperbaric chamber because of claustrophobia, a rate of 15%. While this is a clinically significant problem in that trial, it is unlikely this rate would be sustained when using larger compression chambers designed for multiple occupancy. There are a number of more minor complications that may occur commonly. Visual disturbance, usually reduction in visual acuity secondary to conformational changes in the lens, is very commonly reported ‐ perhaps as many as 50% of those having a course of 30 treatments (Khan 2003). While the great majority of patients recover spontaneously over a period of days to weeks, a small proportion of patients continue to require correction to restore sight to pre‐treatment levels. None of the trials included in this review reported visual changes. The second most common adverse effect associated with HBOT is middle‐ear barotrauma. Barotrauma can affect any air‐filled cavity in the body (including the middle ear, lungs and respiratory sinuses) and occurs as a direct result of compression. Ear barotrauma is by far the most common as the middle ear air space is small, largely surrounded by bone and the sensitive tympanic membrane, and usually requires active effort by the patient in order to inflate the middle ear through the eustachian tube on each side. Barotrauma is thus not a consequence of HBOT directly, but rather of the physical conditions required to administer it. Most episodes of barotrauma are mild, easily treated or recover spontaneously and do not require the therapy to be abandoned.
Potential biases in the review process
The authors of this review have no conflict of interest to declare and none are authors of any literature contributing to this review. We believe we have conducted this review without bias. All of these findings are, however, subject to a potential publication bias. While we have made every effort to locate further unpublished data, it remains possible that this review is subject to a positive publication bias, with generally favourable trials more likely to achieve reporting. With regard to any effect on the quality of life for these patients, we have located no relevant data.
Agreements and disagreements with other studies or reviews
Although there has been relatively little clinical literature on this subject, these encouraging findings are in general agreement with opinion in the literature Ellestad 2009. We are not aware of any other formal systematic reviews of the literature.

Study flow diagram

Forest plot of comparison: 1 Death, outcome: 1.1 Death at any time.

Comparison 1: Death, Outcome 1: Death at any time

Comparison 1: Death, Outcome 2: Death ‐ best case scenario

Comparison 1: Death, Outcome 3: Death ‐ worst case scenario

Comparison 2: Major Adverse Cardiac Events, Outcome 1: Major Adverse Cardiac Events

Comparison 2: Major Adverse Cardiac Events, Outcome 2: MACE ‐ Best case scenario

Comparison 2: Major Adverse Cardiac Events, Outcome 3: MACE ‐ worst case scenario

Comparison 2: Major Adverse Cardiac Events, Outcome 4: Recurrent acute myocardial infarction (AMI)

Comparison 2: Major Adverse Cardiac Events, Outcome 5: Recurrent AMI ‐ best case scenario

Comparison 2: Major Adverse Cardiac Events, Outcome 6: Recurrent AMI ‐ Worst case scenario

Comparison 3: Significant dysrhythmias (complete heart block, ventricular fibrillation, asystole), Outcome 1: Overall (CHB, VF and asystole combined)

Comparison 3: Significant dysrhythmias (complete heart block, ventricular fibrillation, asystole), Outcome 2: Significant dysrrythmias (complete heart block, ventricular fibrillation or asystole)

Comparison 3: Significant dysrhythmias (complete heart block, ventricular fibrillation, asystole), Outcome 3: Overall best case

Comparison 3: Significant dysrhythmias (complete heart block, ventricular fibrillation, asystole), Outcome 4: Overall worst case

Comparison 4: Time to pain relief, Outcome 1: Time to relief of pain

Comparison 5: Magnitude of cardiac enzyme changes, Outcome 1: 12 hour Plasma Creatine Phosphokinase

Comparison 5: Magnitude of cardiac enzyme changes, Outcome 2: 24 hour Plasma Creatine Phosphate

Comparison 5: Magnitude of cardiac enzyme changes, Outcome 3: Maximum Plasma Creatine Phosphate

Comparison 6: Improvement in left ventricular function, Outcome 1: Improved contraction in at least one segment (post‐HBOT echo)

Comparison 6: Improvement in left ventricular function, Outcome 2: Left Ventricular Ejection Fraction‐ % (final estimate)

Comparison 7: Length of Stay, Outcome 1: Overall length of stay (days)

Comparison 8: Adverse events of therapy, Outcome 1: Total adverse events
| hyperbaric oxygen therapy for acute coronary syndrome | ||||||
| Patient or population: patients with acute coronary syndrome | ||||||
| Outcomes | Illustrative comparative risks* (95% CI) | Relative effect | No of Participants | Quality of the evidence | Comments | |
|---|---|---|---|---|---|---|
| Assumed risk | Corresponding risk | |||||
| Control | hyperbaric oxygen therapy | |||||
| Death at any time | Study population | RR 0.58 | 614 | ⊕⊕⊝⊝ | ||
| 116 per 1000 | 67 per 1000 | |||||
| Medium risk population | ||||||
| 102 per 1000 | 59 per 1000 | |||||
| *The basis for the assumed risk (e.g. the median control group risk across studies) is provided in footnotes. The corresponding risk (and its 95% confidence interval) is based on the assumed risk in the comparison group and the relative effect of the intervention (and its 95% CI). | ||||||
| GRADE Working Group grades of evidence | ||||||
| 1 Critical outcome | ||||||
| hyperbaric oxygen therapy for acute coronary syndrome | ||||||
| Patient or population: patients with acute coronary syndrome | ||||||
| Outcomes | Illustrative comparative risks* (95% CI) | Relative effect | No of Participants | Quality of the evidence | Comments | |
|---|---|---|---|---|---|---|
| Assumed risk | Corresponding risk | |||||
| Control | hyperbaric oxygen therapy | |||||
| 12 hour Plasma Creatine Phosphokinase | The mean 12 hour Plasma Creatine Phosphokinase in the intervention groups was | 84 | ⊕⊕⊕⊝ | |||
| 24 hour Plasma Creatine Phosphate | The mean 24 hour Plasma Creatine Phosphate in the intervention groups was | 72 | ⊕⊕⊕⊝ | |||
| Maximum Plasma Creatine Phosphate | The mean Maximum Plasma Creatine Phosphate in the intervention groups was | 184 | ⊕⊕⊕⊕ | |||
| *The basis for the assumed risk (e.g. the median control group risk across studies) is provided in footnotes. The corresponding risk (and its 95% confidence interval) is based on the assumed risk in the comparison group and the relative effect of the intervention (and its 95% CI). | ||||||
| GRADE Working Group grades of evidence | ||||||
| 1 Single trial only | ||||||
| Outcome or subgroup title | No. of studies | No. of participants | Statistical method | Effect size |
| 1.1 Death at any time Show forest plot | 5 | 614 | Risk Ratio (M‐H, Fixed, 95% CI) | 0.58 [0.36, 0.92] |
| 1.1.1 Subjects presenting in cardiogenic shock | 1 | 12 | Risk Ratio (M‐H, Fixed, 95% CI) | 0.61 [0.32, 1.18] |
| 1.1.2 Subjects presenting without cardiogenic shock | 5 | 602 | Risk Ratio (M‐H, Fixed, 95% CI) | 0.57 [0.33, 0.98] |
| 1.2 Death ‐ best case scenario Show forest plot | 5 | 617 | Risk Ratio (M‐H, Fixed, 95% CI) | 0.37 [0.23, 0.58] |
| 1.3 Death ‐ worst case scenario Show forest plot | 5 | 617 | Risk Ratio (M‐H, Fixed, 95% CI) | 1.34 [0.91, 1.96] |
| Outcome or subgroup title | No. of studies | No. of participants | Statistical method | Effect size |
| 2.1 Major Adverse Cardiac Events Show forest plot | 1 | 61 | Risk Ratio (M‐H, Fixed, 95% CI) | 0.12 [0.02, 0.85] |
| 2.2 MACE ‐ Best case scenario Show forest plot | 1 | 69 | Risk Ratio (M‐H, Fixed, 95% CI) | 0.09 [0.01, 0.61] |
| 2.3 MACE ‐ worst case scenario Show forest plot | 1 | 69 | Risk Ratio (M‐H, Fixed, 95% CI) | 0.56 [0.23, 1.40] |
| 2.4 Recurrent acute myocardial infarction (AMI) Show forest plot | 1 | 129 | Risk Ratio (M‐H, Fixed, 95% CI) | 0.28 [0.08, 0.95] |
| 2.5 Recurrent AMI ‐ best case scenario Show forest plot | 1 | 129 | Risk Ratio (M‐H, Fixed, 95% CI) | 0.17 [0.05, 0.55] |
| 2.6 Recurrent AMI ‐ Worst case scenario Show forest plot | 1 | 129 | Risk Ratio (M‐H, Fixed, 95% CI) | 0.92 [0.42, 2.02] |
| Outcome or subgroup title | No. of studies | No. of participants | Statistical method | Effect size |
| 3.1 Overall (CHB, VF and asystole combined) Show forest plot | 1 | 208 | Risk Ratio (M‐H, Fixed, 95% CI) | 0.59 [0.39, 0.89] |
| 3.2 Significant dysrrythmias (complete heart block, ventricular fibrillation or asystole) Show forest plot | 1 | Risk Ratio (M‐H, Fixed, 95% CI) | Subtotals only | |
| 3.2.1 Complete heart block | 1 | 208 | Risk Ratio (M‐H, Fixed, 95% CI) | 0.32 [0.12, 0.84] |
| 3.2.2 Ventricular fibrillation | 1 | 208 | Risk Ratio (M‐H, Fixed, 95% CI) | 0.78 [0.36, 1.71] |
| 3.2.3 Asystole | 1 | 208 | Risk Ratio (M‐H, Fixed, 95% CI) | 0.73 [0.34, 1.56] |
| 3.3 Overall best case Show forest plot | 1 | 221 | Risk Ratio (M‐H, Fixed, 95% CI) | 0.51 [0.34, 0.77] |
| 3.4 Overall worst case Show forest plot | 1 | 221 | Risk Ratio (M‐H, Fixed, 95% CI) | 0.73 [0.50, 1.06] |
| Outcome or subgroup title | No. of studies | No. of participants | Statistical method | Effect size |
| 4.1 Time to relief of pain Show forest plot | 1 | 81 | Mean Difference (IV, Fixed, 95% CI) | ‐353.00 [‐487.55, ‐218.45] |
| Outcome or subgroup title | No. of studies | No. of participants | Statistical method | Effect size |
| 5.1 12 hour Plasma Creatine Phosphokinase Show forest plot | 1 | 84 | Mean Difference (IV, Fixed, 95% CI) | ‐138.00 [‐843.83, 567.83] |
| 5.2 24 hour Plasma Creatine Phosphate Show forest plot | 1 | 72 | Mean Difference (IV, Fixed, 95% CI) | ‐65.00 [‐530.96, 400.96] |
| 5.3 Maximum Plasma Creatine Phosphate Show forest plot | 2 | 184 | Mean Difference (IV, Fixed, 95% CI) | ‐493.16 [‐838.74, ‐147.58] |
| Outcome or subgroup title | No. of studies | No. of participants | Statistical method | Effect size |
| 6.1 Improved contraction in at least one segment (post‐HBOT echo) Show forest plot | 1 | 34 | Risk Ratio (M‐H, Fixed, 95% CI) | 0.09 [0.01, 1.40] |
| 6.2 Left Ventricular Ejection Fraction‐ % (final estimate) Show forest plot | 2 | 190 | Mean Difference (IV, Random, 95% CI) | 5.47 [2.19, 8.75] |
| Outcome or subgroup title | No. of studies | No. of participants | Statistical method | Effect size |
| 7.1 Overall length of stay (days) Show forest plot | 1 | 64 | Mean Difference (IV, Fixed, 95% CI) | ‐1.80 [‐3.70, 0.10] |
| Outcome or subgroup title | No. of studies | No. of participants | Statistical method | Effect size |
| 8.1 Total adverse events Show forest plot | 3 | Risk Ratio (M‐H, Fixed, 95% CI) | Subtotals only | |
| 8.1.1 Tympanic membrane rupture | 2 | 269 | Risk Ratio (M‐H, Fixed, 95% CI) | 4.56 [0.19, 107.54] |
| 8.1.2 Acute neurological oxygen toxicity | 2 | 274 | Risk Ratio (M‐H, Fixed, 95% CI) | Not estimable |
| 8.1.3 Claustrophobia | 1 | 208 | Risk Ratio (M‐H, Fixed, 95% CI) | 31.60 [1.92, 521.22] |