| 1 Death Show forest plot | 2 | | Risk Ratio (M‐H, Fixed, 95% CI) | Subtotals only |
|
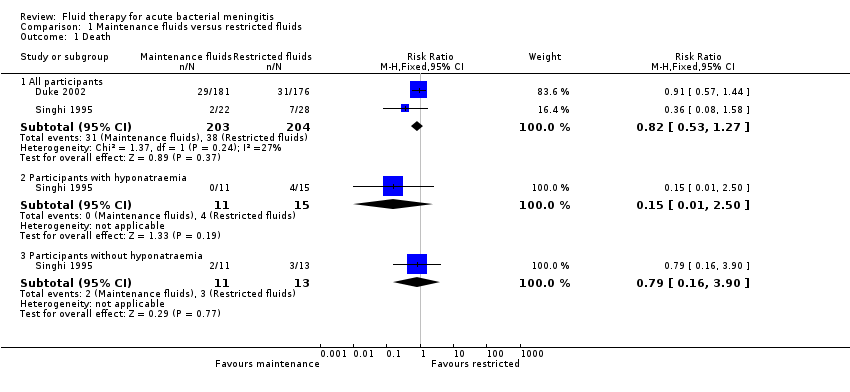
| 1.1 All participants | 2 | 407 | Risk Ratio (M‐H, Fixed, 95% CI) | 0.82 [0.53, 1.27] |
| 1.2 Participants with hyponatraemia | 1 | 26 | Risk Ratio (M‐H, Fixed, 95% CI) | 0.15 [0.01, 2.50] |
| 1.3 Participants without hyponatraemia | 1 | 24 | Risk Ratio (M‐H, Fixed, 95% CI) | 0.79 [0.16, 3.90] |
| 2 Severe neurological sequelae Show forest plot | 2 | | Risk Ratio (M‐H, Fixed, 95% CI) | Subtotals only |
|
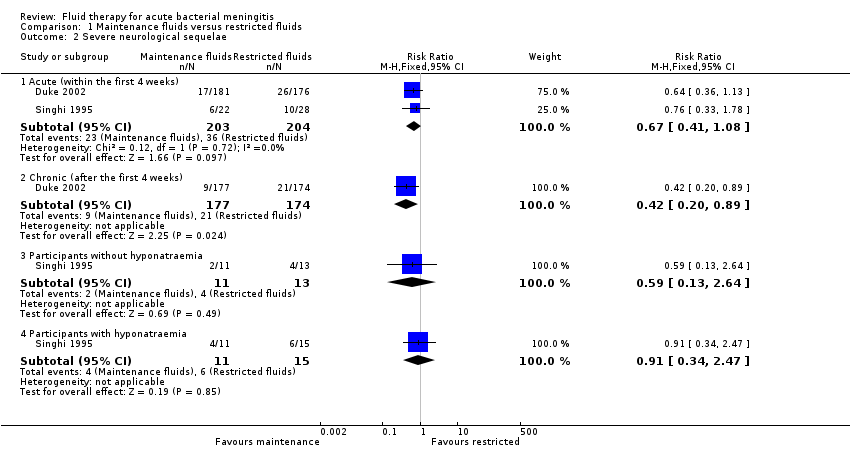
| 2.1 Acute (within the first 4 weeks) | 2 | 407 | Risk Ratio (M‐H, Fixed, 95% CI) | 0.67 [0.41, 1.08] |
| 2.2 Chronic (after the first 4 weeks) | 1 | 351 | Risk Ratio (M‐H, Fixed, 95% CI) | 0.42 [0.20, 0.89] |
| 2.3 Participants without hyponatraemia | 1 | 24 | Risk Ratio (M‐H, Fixed, 95% CI) | 0.59 [0.13, 2.64] |
| 2.4 Participants with hyponatraemia | 1 | 26 | Risk Ratio (M‐H, Fixed, 95% CI) | 0.91 [0.34, 2.47] |
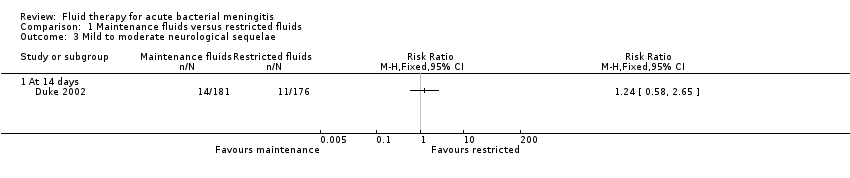
| 3 Mild to moderate neurological sequelae Show forest plot | 1 | | Risk Ratio (M‐H, Fixed, 95% CI) | Totals not selected |
|
| 3.1 At 14 days | 1 | | Risk Ratio (M‐H, Fixed, 95% CI) | 0.0 [0.0, 0.0] |
| 4 Hemiparesis/hemiplegia Show forest plot | 1 | | Risk Ratio (M‐H, Fixed, 95% CI) | Totals not selected |
|
| 4.1 At 14 days | 1 | | Risk Ratio (M‐H, Fixed, 95% CI) | 0.0 [0.0, 0.0] |
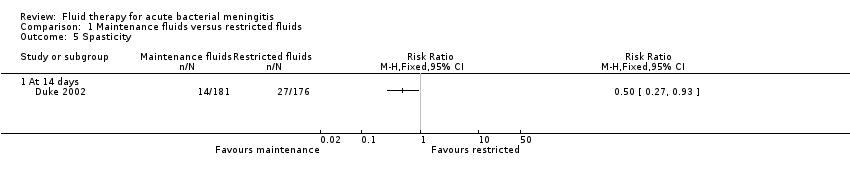
| 5 Spasticity Show forest plot | 1 | | Risk Ratio (M‐H, Fixed, 95% CI) | Totals not selected |
|
| 5.1 At 14 days | 1 | | Risk Ratio (M‐H, Fixed, 95% CI) | 0.0 [0.0, 0.0] |
| 6 Seizures Show forest plot | 1 | | Risk Ratio (M‐H, Fixed, 95% CI) | Totals not selected |
|
| 6.1 Within the first 72 hours | 1 | | Risk Ratio (M‐H, Fixed, 95% CI) | 0.0 [0.0, 0.0] |
| 6.2 At 14 days | 1 | | Risk Ratio (M‐H, Fixed, 95% CI) | 0.0 [0.0, 0.0] |
| 7 Visual impairment Show forest plot | 1 | | Risk Ratio (M‐H, Fixed, 95% CI) | Totals not selected |
|
| 7.1 At 14 days | 1 | | Risk Ratio (M‐H, Fixed, 95% CI) | 0.0 [0.0, 0.0] |
| 8 No response to sound Show forest plot | 1 | | Risk Ratio (M‐H, Fixed, 95% CI) | Totals not selected |
|
| 8.1 At 14 days | 1 | | Risk Ratio (M‐H, Fixed, 95% CI) | 0.0 [0.0, 0.0] |
| 9 Oedema Show forest plot | 1 | | Risk Ratio (M‐H, Fixed, 95% CI) | Totals not selected |
|
| 9.1 Acute facial oedema | 1 | | Risk Ratio (M‐H, Fixed, 95% CI) | 0.0 [0.0, 0.0] |
| 9.2 Acute pulmonary oedema | 1 | | Risk Ratio (M‐H, Fixed, 95% CI) | 0.0 [0.0, 0.0] |
| 9.3 Acute hydrocephalus | 1 | | Risk Ratio (M‐H, Fixed, 95% CI) | 0.0 [0.0, 0.0] |
| 10 Total body water ‐ fall after 48 hours Show forest plot | 1 | | Mean Difference (IV, Fixed, 95% CI) | Totals not selected |
|
| 10.1 Participants without hyponatraemia | 1 | | Mean Difference (IV, Fixed, 95% CI) | 0.0 [0.0, 0.0] |
| 10.2 Participants with hyponatraemia | 1 | | Mean Difference (IV, Fixed, 95% CI) | 0.0 [0.0, 0.0] |
| 11 Extracellular water ‐ fall after 48 hours Show forest plot | 1 | | Mean Difference (IV, Fixed, 95% CI) | Totals not selected |
|
| 11.1 Participants without hyponatraemia | 1 | | Mean Difference (IV, Fixed, 95% CI) | 0.0 [0.0, 0.0] |
| 11.2 Participants with hyponatraemia | 1 | | Mean Difference (IV, Fixed, 95% CI) | 0.0 [0.0, 0.0] |
| 12 Serum sodium Show forest plot | 2 | | Mean Difference (IV, Fixed, 95% CI) | Totals not selected |
|
| 12.1 All participants (24 hours) | 1 | | Mean Difference (IV, Fixed, 95% CI) | 0.0 [0.0, 0.0] |
| 12.2 Participants with hyponatraemia (48 hours) | 1 | | Mean Difference (IV, Fixed, 95% CI) | 0.0 [0.0, 0.0] |
| 12.3 Participants without hyponatraemia (48 hours) | 1 | | Mean Difference (IV, Fixed, 95% CI) | 0.0 [0.0, 0.0] |
| 12.4 Change from baseline at 48 hours ‐ without hyponatraemia | 1 | | Mean Difference (IV, Fixed, 95% CI) | 0.0 [0.0, 0.0] |
| 12.5 Change from baseline at 48 hours ‐ with hyponatraemia | 1 | | Mean Difference (IV, Fixed, 95% CI) | 0.0 [0.0, 0.0] |
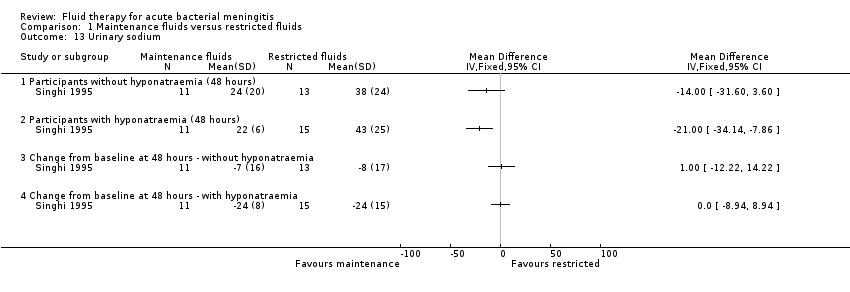
| 13 Urinary sodium Show forest plot | 1 | | Mean Difference (IV, Fixed, 95% CI) | Totals not selected |
|
| 13.1 Participants without hyponatraemia (48 hours) | 1 | | Mean Difference (IV, Fixed, 95% CI) | 0.0 [0.0, 0.0] |
| 13.2 Participants with hyponatraemia (48 hours) | 1 | | Mean Difference (IV, Fixed, 95% CI) | 0.0 [0.0, 0.0] |
| 13.3 Change from baseline at 48 hours ‐ without hyponatraemia | 1 | | Mean Difference (IV, Fixed, 95% CI) | 0.0 [0.0, 0.0] |
| 13.4 Change from baseline at 48 hours ‐ with hyponatraemia | 1 | | Mean Difference (IV, Fixed, 95% CI) | 0.0 [0.0, 0.0] |
| 14 Plasma osmolality ‐ change after 48 hours Show forest plot | 1 | | Mean Difference (IV, Fixed, 95% CI) | Totals not selected |
|
| 14.1 Participants without hyponatraemia | 1 | | Mean Difference (IV, Fixed, 95% CI) | 0.0 [0.0, 0.0] |
| 14.2 Participants with hyponatraemia | 1 | | Mean Difference (IV, Fixed, 95% CI) | 0.0 [0.0, 0.0] |