Intervenciones para el tratamiento de la incontinencia urinaria después del accidente cerebrovascular en pacientes adultos
Resumen
Antecedentes
La incontinencia urinaria puede afectar a entre un 40% y un 60% de los pacientes que ingresan en el hospital debido a un accidente cerebrovascular; el 25% presenta este problema en el momento del alta y el 15% sigue con incontinencia después de un año.
Ésta es una actualización de una revisión publicada por primera vez en 2005 y actualizada en 2008.
Objetivos
Evaluar los efectos de las intervenciones para el tratamiento de la incontinencia urinaria después del accidente cerebrovascular en adultos al menos un mes después del accidente cerebrovascular.
Métodos de búsqueda
Se hicieron búsquedas en los registros especializados de los Grupos Cochrane de Incontinencia y de Accidentes Cerebrales Vasculares (Cochrane Incontinence and Cochrane Stroke Specialised Registers) (búsqueda 30 octubre 2017 y el 1 noviembre 2017 respectivamente), que contiene ensayos identificados en el Registro Cochrane Central de Ensayos Controlados (Cochrane Central Register of Controlled Trials) (CENTRAL), MEDLINE, MEDLINE In‐Process, MEDLINE Epub Ahead of Print, CINAHL, ClinicalTrials.gov, WHO ICTRP y se hicieron búsquedas manuales en revistas y actas de congresos.
Criterios de selección
Se incluyeron los ensayos controlados aleatorios y cuasialeatorios.
Obtención y análisis de los datos
Dos autores de revisión realizaron la extracción de datos, llevaron a cabo la evaluación del riesgo de sesgo y aplicaron los criterios GRADE de forma independiente.
Resultados principales
Se incluyeron 20 ensayos (se informaron 21 comparaciones) con 1338 participantes. No hubo datos disponibles para los resultados predeterminados excepto los que se informan a continuación.
Intervención versus ninguna intervención/atención convencional
Intervenciones conductuales: La evidencia de baja calidad indica que las intervenciones conductuales pueden reducir el número medio de episodios de incontinencia en 24 horas (diferencia de medias [DM] –1,00; intervalo de confianza [IC] del 95%: –2,74 a 0,74; un ensayo; 18 participantes; P = 0,26). Además, la evidencia de baja calidad de dos ensayos indica que las intervenciones conductuales pueden lograr poco o ningún cambio en la calidad de vida (DME ‐0,99; IC del 95%: ‐2,83 a 0,86; 55 participantes).
Intervenciones con participación de profesionales especialistas: Un ensayo de calidad moderada sugirió que la evaluación y el tratamiento estructurados administrados por una enfermera profesional especializada en continencia probablemente lograron poco o ningún cambio en el número de personas continentes tres meses después del tratamiento (cociente de riesgos [CR] 1,28; IC del 95%: 0,81 a 2,02; 121 participantes; equivalente a un aumento de 354 a 453 por 1000; IC del 95%: 287 a 715).
Tratamiento complementario: Cinco ensayos evaluaron el tratamiento complementario con acupuntura tradicional, electroacupuntura y moxibustión con jengibre y sal más acupuntura habitual. La evidencia de baja calidad de cinco ensayos indicó que el tratamiento complementario puede aumentar la cantidad de participantes continentes después del tratamiento; los participantes en el grupo de tratamiento tuvieron tres veces más probabilidades de ser continentes (CR 2,82; IC del 95%: 1,57 a 5,07; 524 participantes; equivalente a un aumento de 193 a 544 por 1000; IC del 95%: 303 a 978). Los eventos adversos se informaron de manera narrativa en un estudio de la electroacupuntura y se informó equimosis y dolor abdominal posacupuntura en el grupo de intervención.
Terapia física: Dos ensayos que informaron sobre tres comparaciones sugieren que la fisioterapia con neuroestimulación eléctrica transcutánea (ENET) puede reducir el número medio de episodios de incontinencia en 24 horas (DM –4,76; IC de 95%: –8,10 a –1,41; 142 participantes; evidencia de baja calidad). Un ensayo de la ENET que informó sobre dos comparaciones halló que la intervención probablemente mejora la capacidad funcional general (DM 8,97; IC del 95%: 1,27 a 16,68; 81 participantes; evidencia de calidad moderada).
Intervención versus placebo
Terapia física: Un ensayo de la fisioterapia sugiere que la ETNTP puede lograr poco o ningún cambio en el número de participantes continentes después del tratamiento (CR 0,75; IC del 95%: 0,19 a 3,04; 54 participantes) o en la cantidad de episodios de incontinencia (DM –1,10; IC del 95%: –3,99 a 1,79; 39 participantes). Un ensayo indicó una mejoría en el grupo de ETNTP a las 26 semanas (OR 0,04; IC del 95%: 0,004 a 0,41) aunque no hubo evidencia de una diferencia en la afección vesical percibida a las seis semanas (OR 2,33; IC del 95%: 0,63 a 8,65) o a las 12 semanas (OR 1,22; IC del 95%: 0,29 a 5,17). Los datos de un ensayo no aportaron evidencia de que la ETNTP lograra un cambio en la calidad de vida medida con el ICIQLUTSqol (DM 3,90; IC del 95%: –4,25 a 12,05; 30 participantes). Los eventos adversos menores, como la irritación menor de la piel y los calambres del tobillo, se informaron en un estudio.
Intervenciones de farmacoterapia: En un estudio no hubo evidencia de que el tratamiento con estrógeno lograra un cambio en el número medio de episodios de incontinencia por semana en la incontinencia leve (muestras pareadas, DM –1,71; IC del 95%: –3,51 a –0,09) o la incontinencia grave (muestras pareadas, DM –6,40; IC del 95%: –9,47 a –3,33). Un estudio informó que no hubo efectos adversos.
Intervención específica versus otra intervención
Intervenciones conductuales: Un ensayo que comparó una intervención conductual (vaciamiento intermitente) con una intervención de farmacoterapia (oxibutinina) no contuvo datos utilizables.
Tratamiento complementario: Un ensayo que comparó diferentes agujas de acupuntura y profundidad de la inserción de las agujas para evaluar el efecto sobre la incontinencia informó que, después de cuatro tratamientos, un 78,1% de los participantes del grupo de agujas alargadas no tuvieron ningún episodio de incontinencia versus un 40% en el grupo de agujas filiformes (57 participantes). Este ensayo se evaluó como en riesgo poco claro o alto para todos los tipos de sesgo aparte de los datos de resultado incompletos.
Intervención combinada versus intervención única
Un ensayo comparó una intervención combinada (biorretroalimentación motora sensorial más vaciamiento intermitente a la orden) versus una única intervención (vaciamiento intermitente). La intervención combinada puede lograr poco o ningún cambio en el número de participantes continentes después del tratamiento (CR 0,55; IC del 95%: 0,06 a 5,21; 23 participantes; equivalente a una disminución de 167 a 92 por 1000; IC del 95%: 10 a 868) o en el número de episodios de incontinencia (DM 2,20; IC del 95%: 0,12 a 4,28; 23 participantes).
Intervención específica versus control con atención
Intervenciones con fisioterapia: Un estudio encontró que la ETNTP puede lograr poco o ningún cambio en el número de participantes continentes después del tratamiento en comparación con un grupo de control de atención que realizó ejercicios de estiramiento (CR 1,33; IC del 95%: 0,38 a 4,72; 24 participantes; equivalente a un aumento de 250 a 333 por 1000; IC del 95%: 95 a 1000).
Conclusiones de los autores
Hay evidencia insuficiente para guiar la atención de la continencia en adultos en la fase de rehabilitación posterior al accidente cerebrovascular. Debido a que pocos ensayos examinaron la misma intervención, las conclusiones se extraen por lo general de pocos ensayos pequeños. Los IC fueron amplios, lo cual dificulta la evaluación de si hubo diferencias clínicamente importantes. Sólo cuatro ensayos tuvieron una ocultación adecuada de la asignación y muchos fueron limitados por el informe deficiente, lo cual dio lugar a que fuese imposible juzgar el grado en que fueron propensos al sesgo. Se necesitan más ensayos multicéntricos con el poder estadístico apropiado de las intervenciones con objeto de aportar evidencia consistente de las intervenciones para mejorar la incontinencia urinaria después del accidente cerebrovascular.
PICO
Resumen en términos sencillos
Tratamiento de la incontinencia urinaria después del accidente cerebrovascular en pacientes adultos
Pregunta de la revisión
Se deseaba evaluar la efectividad de las intervenciones dirigidas a ayudar a adultos con incontinencia urinaria que sufrieron un accidente cerebrovascular hace más de un mes.
Antecedentes
La mitad de los pacientes que ingresan al hospital con un accidente cerebrovascular presentan incontinencia urinaria. Además de la pérdida involuntaria de orina, los síntomas de la incontinencia urinaria incluyen el deseo urgente de orinar (incontinencia de urgencia) o pérdidas de orina al reírse o estornudar (incontinencia de esfuerzo). Estos síntomas son más graves en los supervivientes de accidente cerebrovascular que en otras personas con incontinencia urinaria. Causan vergüenza y aflicción y afectan la capacidad del paciente de participar en la rehabilitación. La incontinencia urinaria reduce los sentimientos de autoestima y la depresión es frecuente. También tiene una repercusión importante sobre las familias y puede afectar el retorno de los pacientes al hogar.
Fecha de la búsqueda
La búsqueda está actualizada hasta 1 noviembre 2017.
Características de los estudios
Se identificaron 20 estudios que identificaron 21 comparaciones e involucraron a 1338 pacientes. Estos estudios incluían diversas terapias conductuales (p.ej. entrenamiento muscular del piso pelviano), tratamientos complementarios (p.ej. acupuntura manual o electroacupuntura) y fisioterapias (p.ej. estimulación nerviosa eléctrica transcutánea, ENET), así como medicación (p.ej. oxibutinina, estrógeno). Un ensayo investigó el efecto de la evaluación y el tratamiento por parte de enfermeras profesionales especializadas en continencia. Los grupos de control fueron en general "atención habitual" o ningún tratamiento.
Resultados clave
Se halló que las intervenciones conductuales pueden reducir el número medio de episodios de incontinencia en 24 horas aunque pueden lograr poco o ningún cambio en la calidad de vida. Sin embargo, la intervención administrada por una enfermera profesional especializada en continencia probablemente logró poco o ningún cambio en el número de personas continentes tres meses después del tratamiento. Los tratamientos complementarios como la acupuntura pueden aumentar la cantidad de participantes continentes después del tratamiento. Las fisioterapias, como la neuroestimulación eléctrica transcutánea, pueden reducir el número promedio de episodios de incontinencia en 24 horas y probablemente mejoran la capacidad funcional.
Calidad de la evidencia
La calidad de la evidencia fue limitada debido al informe deficiente de los detalles del estudio (en particular en los estudios anteriores) y el número pequeño de participantes del estudio en la mayoría de las comparaciones. Más de la mitad de los estudios no proporcionaron información sobre los efectos secundarios.
Conclusiones de los autores
Se necesitan ensayos de alta calidad que comparen diferentes tratamientos con la atención habitual o ningún tratamiento y que incluyan a un gran número de participantes.
Conclusiones de los autores
Summary of findings
| Behavioural interventions compared with usual care or no treatment for treating urinary incontinence after stroke | ||||||
| Patient or population: people with stroke and urinary incontinence Settings: hospital, clinic or home Intervention: behavioural interventions Comparison: no treatment/usual care | ||||||
| Outcomes | Illustrative comparative risks* (95% CI) | Relative effect | No of participants | Quality of the evidence | Comments | |
| Assumed risk | Corresponding risk | |||||
| Control | Intervention | |||||
| Number of participants continent after treatment | Study population | — | — | — | Not reported | |
| — | — | |||||
| Number of incontinent episodes | The mean number of incontinent episodes in the control group was 1.2 | The mean number of incontinent episodes in the intervention group was 0.2 | MD –1.00 (–2.74 to 0.74) | 18 participants (1) | ⊕⊕⊝⊝ | Outcome reported descriptively for Tibaek 2017: the reported number of UI episodes per 24 hours was very small (intervention 0 at post‐test and 1 at follow‐up; control 0 at post‐test, 0 at follow‐up). |
| Perception of improvement or cure | — | — | — | — | — | Not reported |
| Health status and quality of life | The mean quality of life score ranged across control groups from 39.08 to 47 | The mean quality of life score in the intervention groups was | SMD –0.91 (–1.50 to –0.32) | 55 participants (2) | ⊕⊕⊝⊝ | — |
| Functional ability | — | — | — | — | — | Not reported |
| Adverse events | — | — | — | — | — | Not reported. |
| *The basis for the assumed risk (e.g. the median control group risk across studies) is provided in footnotes. The corresponding risk (and its 95% confidence interval) is based on the assumed risk in the comparison group and the relative effect of the intervention (and its 95% CI). CI: confidence interval; MD: mean difference; SMD: standardised mean difference; UI: urinary incontinence. | ||||||
| GRADE Working Group grades of evidence | ||||||
| aDowngraded by one level for study design (allocation concealment unclear), and by one level for imprecision: fewer than 100 participants. bDowngraded by one level for study design (allocation concealment unclear in 2/2 trials in the meta‐analysis), and by one level for imprecision: fewer than 100 participants in both studies. | ||||||
| Specialised professional input interventions compared with usual care or no treatment for treating urinary incontinence after stroke | ||||||
| Patient or population: people with stroke and urinary incontinence Settings: hospital, clinic or home Intervention: specialised professional input Comparison: no treatment/usual care | ||||||
| Outcomes | Illustrative comparative risks* (95% CI) | Relative effect | No of participants | Quality of the evidence | Comments | |
| Assumed risk | Corresponding risk | |||||
| Control | Intervention | |||||
| Number of participants continent after treatment ‐ three months | 354 per 1000 | 453 per 1000 | RR 1.28 (0.81 to 2.02) | 121 participants (1) | ⊕⊕⊕⊝ | — |
| Number of incontinent episodes | — | — | — | — | — | Not reported |
| Perception of improvement or cure | — | — | — | — | — | Not reported |
| Health status and quality of life | — | — | — | — | — | Not reported |
| Functional ability | — | — | — | — | — | Not reported |
| Adverse events | — | — | — | — | — | Not reported. |
| *The basis for the assumed risk (e.g. the median control group risk across studies) is provided in footnotes. The corresponding risk (and its 95% confidence interval) is based on the assumed risk in the comparison group and the relative effect of the intervention (and its 95% CI). CI: confidence interval; RR: risk ratio. | ||||||
| GRADE Working Group grades of evidence | ||||||
| aDowngraded by one level for study design (allocation concealment unclear). | ||||||
| Complementary therapy interventions compared with usual care or no treatment for treating urinary incontinence after stroke | ||||||
| Patient or population: people with stroke and urinary incontinence Settings: hospital, clinic or home Intervention: complementary therapy Comparison: no treatment/usual care | ||||||
| Outcomes | Illustrative comparative risks* (95% CI) | Relative effect | No of participants | Quality of the evidence | Comments | |
| Assumed risk | Corresponding risk | |||||
| Control | Intervention | |||||
| Number of participants continent after treatment | Study population | RR 2.82 (1.57 to 5.07) | 524 participants (5) | ⊕⊕⊝⊝ | — | |
| 193 per 1000 | 544 per 1000 | |||||
| Number of incontinent episodes | — | — | — | — | — | Not reported |
| Perception of improvement or cure | — | — | — | — | — | Not reported |
| Health status and quality of life | — | — | — | — | — | Not reported |
| Functional ability | — | — | — | — | — | Not reported |
| Adverse events | — | — | — | — | See comment | Song 2013: 45/136 (33%) in the intervention group had bruises on arms and torso with full recovery; 17/136 (13%) had abdominal pain post‐acupuncture with resolution after warm compress; no other adverse effects noted. Chu 1997; Liu 2006; Zhang 2002; Zhou 1999: unclear |
| *The basis for the assumed risk (e.g. the median control group risk across studies) is provided in footnotes. The corresponding risk (and its 95% confidence interval) is based on the assumed risk in the comparison group and the relative effect of the intervention (and its 95% CI). CI: confidence interval; RR: risk ratio. | ||||||
| GRADE Working Group grades of evidence | ||||||
| aDowngraded one level for study design (random sequence generation unclear in 3/5 trials in the meta‐analysis; allocation concealment unclear in 5/5 trials), and by one level for imprecision: 3/5 studies fewer than 100 participants. | ||||||
| Physical therapy interventions compared with usual care or no treatment for treating urinary incontinence after stroke | ||||||
| Patient or population: people with stroke and urinary incontinence Settings: hospital, clinic or home Intervention: physical therapy Comparison: no treatment/usual care | ||||||
| Outcomes | Illustrative comparative risks* (95% CI) | Relative effect | No of participants | Quality of the evidence | Comments | |
| Assumed risk | Corresponding risk | |||||
| Control | Intervention | |||||
| Number of participants continent after treatment | — | — | — | — | — | Not reported |
| Number of incontinent episodes | The mean number of incontinent episodes ranged across control groups from 0.74 to 3.51 | The mean number of incontinent episodes in the intervention groups was 1.61 to 4.69 | MD –4.76 (–8.10 to –1.41) | 142 participants (2 studies (1 3‐arm study)) | ⊕⊕⊝⊝ | — |
| Perception of improvement or cure | — | — | — | — | — | Not reported |
| Health status and quality of life | — | — | — | — | — | Not reported |
| Functional ability: mean Barthel score (continuous variables) | The mean Barthel score was 52.5 in the control groups | The mean Barthel score in the intervention groups was 57.9 to 65.8 | MD 8.97 (1.27 to 16.68) | 81 participants (1 × 3‐arm study) | ⊕⊕⊕⊝ | — |
| Adverse events | — | — | — | — | — | Not reported |
| *The basis for the assumed risk (e.g. the median control group risk across studies) is provided in footnotes. The corresponding risk (and its 95% confidence interval) is based on the assumed risk in the comparison group and the relative effect of the intervention (and its 95% CI). CI: confidence interval; MD: mean difference. | ||||||
| GRADE Working Group grades of evidence | ||||||
| aDowngraded one level for study design (random sequence generation unclear in 1/2 trials in the meta‐analysis; allocation concealment unclear in 1/2 trials), and one level for imprecision: 2/2 studies fewer than 100 participants. bDowngraded one level for imprecision: fewer than 100 participants. | ||||||
Antecedentes
La incontinencia urinaria puede afectar a alrededor de la mitad de los supervivientes de accidente cerebrovascular en la fase aguda de la recuperación del accidente cerebrovascular (durante el primer mes). Una proporción significativa de supervivientes de accidente cerebrovascular, poco menos de la mitad, todavía presentará incontinencia tres meses más tarde y poco más de un tercio de los supervivientes de accidente cerebrovascular seguirán presentando incontinencia a los 12 meses después del accidente cerebrovascular. Esta revisión se centró en las intervenciones para la incontinencia urinaria en los supervivientes de accidente cerebrovascular al menos un mes después del accidente cerebrovascular y considerados en la fase de rehabilitación de la recuperación del accidente cerebrovascular. Se planifica una revisión de las intervenciones para los supervivientes de accidente cerebrovascular con incontinencia urinaria en el primer mes después del accidente cerebrovascular y considerados en la fase aguda de la recuperación del accidente cerebrovascular.
Descripción de la afección
La incontinencia urinaria se define como cualquier pérdida involuntaria de orina (Abrams 2002). Hasta un 53% de los supervivientes de accidente cerebrovascular informan incontinencia urinaria a las cuatro semanas después del accidente cerebrovascular (Kolominsky‐Rabas 2003). Hasta un 44% de los supervivientes de accidente cerebrovascular presentan incontinencia a los tres meses después del accidente cerebrovascular y un 38% un año más tarde después del accidente cerebrovascular (Williams 2012). La incontinencia urinaria a menudo se presenta como un problema nuevo después del accidente cerebrovascular o, si existía de forma previa, empeora significativamente, lo cual se agrega a la discapacidad y a la impotencia causada por los déficits neurológicos (Brittain 2000a). Cuanto más grave es el accidente cerebrovascular, mayor es la probabilidad de incontinencia urinaria (Brittain 1998b; Burney 1996a). Otros factores de riesgo para la incontinencia urinaria incluyen mayor edad, sexo femenino, dificultades del habla, debilidad motora, defectos del campo visual o trastorno cognitivo (Barrett 2002).
Varios estudios han identificado el daño al lóbulo frontal, un área que se considera responsable del control de la micturición, como asociado con la disfunción urinaria después del accidente cerebrovascular. Sin embargo, la evidencia sugiere que el tamaño de la lesión, en lugar de su ubicación, tiene mayor probabilidad de predecir la incontinencia urinaria (Brittain 1999). No está claro si la incontinencia es una consecuencia directa (es decir, del lugar de lesión cerebral) o indirecta (p.ej. problemas motores, visuales o del habla que hacen que la tarea de acceder al baño sea un reto) del accidente cerebrovascular. Otros factores no neurológicos que pueden causar incontinencia urinaria, incluido el estado de continencia premórbida, insuficiencia del esfínter y poliuria (Barrett 2002), se consideran prevalentes en la población de pacientes que sufrieron un accidente cerebrovascular (Brittain 1998b).
Los problemas experimentados pueden variar desde la retención urinaria hasta la incontinencia absoluta. El patrón más probable de incontinencia es la polaquiuria, la urgencia (una necesidad repentina e imperiosa de orinar que es difícil de postergar) y la incontinencia por urgencia (pérdida involuntaria de orina) (Marinkovic 2001). En general, es el resultado de la hiperactividad del detrusor (Talwar 1993), aunque puede depender del sitio de la lesión ocasionada por el accidente cerebrovascular (Burney 1996b).
Es importante estudiar la incontinencia urinaria en esta población debido a que los síntomas son más graves y tienen más de un efecto en comparación con otros grupos de personas (Brittain 2000a). La incontinencia no es un problema físico solo sino que repercute en las actividades y los sentimientos de las personas (Williams 1993). La depresión es dos veces más común en los supervivientes de accidente cerebrovascular que son incontinentes en comparación con los que son continentes (Brittain 1998a; Limampai 2017). No se pueden pasar por alto las consecuencias sociales negativas para los supervivientes y los cuidadores; ambos pueden ser aislados y marginados (Brittain 2007).
La incontinencia persistente está asociada con un mal resultado para el superviviente de un accidente cerebrovascular así como para los cuidadores (Arkan 2018; Nakayama 1997; Pettersen 2006; Tseng 2015). Por el contrario, el resultado del accidente cerebrovascular es mejor en aquellos supervivientes que mantienen la continencia o que la recuperan (Barer 1989). La mejoría es frecuente con el transcurso del tiempo (Marinkovic 2001), lo que sugiere que los problemas de continencia pueden ser transitorios en algunos supervivientes de un accidente cerebrovascular, los que pueden ser tratados con una intervención o ambos. Los factores que predicen la mejoría temprana de la continencia son una menor severidad al ingreso y la localización de la lesión cerebrovascular (Ween 1996). Los factores asociados con una recuperación deficiente de la continencia incluyen el tipo de accidente cerebrovascular y poseer 75 años de edad o más (Patel 2001).
La incontinencia es una variable predictiva sólida del resultado funcional del accidente cerebrovascular (Meijer 2003). A pesar de que existen dificultades para atribuir un mejor resultado del accidente cerebrovascular a la mejoría de la continencia, es posible que la recuperación de la incontinencia pueda mejorar la moral y la autoestima y, por consiguiente, acelerar la recuperación general del accidente cerebrovascular (Barer 1989; Patel 2001).
Descripción de la intervención
Las guías actuales para el manejo de la incontinencia urinaria recomiendan una evaluación para guiar el tratamiento (Intercollegiate Stroke Working Party 2016). Éste comienza con una evaluación física y de los antecedentes, incluida la identificación de problemas urológicos antes del accidente cerebrovascular, obstrucción del sitio de salida vesical o incontinencia de esfuerzo en las mujeres. La elección del método para promover la continencia dependerá de los antecedentes y el tipo de incontinencia. Las intervenciones conductuales se recomiendan como tratamiento de primera línea para el control de la incontinencia urinaria (NICE 2012). Las mismas incluyen intervenciones diseñadas para promover la continencia, por ejemplo el entrenamiento vesical (apropiado para la incontinencia de urgencia) y el entrenamiento muscular del piso pelviano (apropiado para la incontinencia de esfuerzo [Hay‐Smith 2011]), y los programas de asistencia para el uso del baño como el vaciamiento a la orden o intermitente o el readiestramiento de los hábitos. Las mismas están diseñadas para disminuir los episodios de incontinencia y son apropiadas para los pacientes que experimentan problemas después del accidente cerebrovascular como pérdida de la memoria o restricción del movimiento (Eustice 2000; Ostaszkiewicz 2004a; Ostaszkiewicz 2004b; Roe 2007).
Otras técnicas de tratamiento incluyen: intervenciones con participación de profesionales (p.ej. consejeros especialistas en continencia); intervenciones terapéuticas complementarias (p.ej. acupuntura; Lim 2015); homeopatía; farmacoterapias (p.ej. anticolinérgicos; Nabi 2006); fisioterapias (p.ej. estimulación eléctrica); ayudas físicas (p.ej. pesarios) y medidas de tipo ambiental o del estilo de vida (p.ej. dieta y control de líquidos).
De qué manera podría funcionar la intervención
Intervenciones conductuales
Las intervenciones conductuales se recomiendan como un tratamiento de primera línea para el control de la incontinencia urinaria (NICE 2012). El entrenamiento vesical procura ayudar a los pacientes a recuperar el control vesical y la continencia mediante regímenes individualizados de vaciamiento diseñados para restaurar los modelos regulares y normales de vaciamiento al alargar de manera progresiva el intervalo entre evacuaciones. La EMPP incluye la contracción de los músculos del piso pelviano, levantando la posición de los músculos elevadores del ano mediante el aumento del volumen y la rigidez muscular, y, a través de lo anterior, la provisión de más apoyo al cuello vesical y la uretra proximal (Ayeleke 2015). No se conoce la duración, el número ni la intensidad de las contracciones del músculo del piso pelviano requeridas para tratar con éxito la incontinencia urinaria. El vaciamiento intermitente, el vaciamiento a la orden y el readiestramiento de los hábitos (modelos individualizados de uso del baño) son ejemplos de otras intervenciones conductuales (International Continence Society 2015).
Intervenciones con participación de profesionales especialistas
Las intervenciones con participación de profesionales pueden incluir servicios de continencia proporcionados por enfermeras o equipos de continencia especialistas en un contexto comunitario u hospitalario. Los profesionales pueden incluir personal variado como médicos generales (MG), enfermeras profesionales especializadas en continencia (EPEC), consejeros de continencia, fisioterapeutas o terapeutas ocupacionales. Las vías de atención individualizadas se implementan después de la evaluación holística y a fondo, que puede incluir investigaciones urodinámicas. Las intervenciones pueden incluir educación o componentes conductuales.
Intervenciones terapéuticas complementarias
Las intervenciones terapéuticas complementarias incluyen acupuntura u homeopatía. Tradicionalmente, la acupuntura se ha usado en el tratamiento relacionado con la analgesia (Paik 2013); este método de tratamiento ahora se usa para la incontinencia urinaria (Song 2011). En la práctica clínica, la acupuntura manual tradicional o la electroacupuntura son las técnicas usadas con más frecuencia (Ju 2017), que incluyen la estimulación de puntos específicos de acupuntura en la piel mediante el uso de agujas delgadas desechables (VanderPloeg 2009). En el tratamiento para el sistema urinario, la acupuntura ejerce una influencia en los sistemas nerviosos tanto autonómicos como somáticos que controlan los músculos usados en la micturición y controlan la incontinencia urinaria (Paik 2013). El músculo detrusor se relaja mediante la estimulación simpática que se origina en la región de la médula espinal lumbar (T11–L2) y se contrae mediante la estimulación parasimpática de la región de la médula espinal del sacro (S2–4) (Paik 2013). El esfínter uretral externo está bajo control somático (Shefchyk 2001). Los terapeutas informan la estimulación de puntos de acupuntura múltiples en el tratamiento de la incontinencia urinaria (región sacra, abdominal o de las pierna del cuerpo) aunque hay inconsistencia en la profundidad de la acupuntura (Paik 2013).
Intervenciones de farmacoterapia
Las intervenciones de farmacoterapia pueden incluir anticolinérgicos (agentes antimuscarínicos), adrenérgicos o tratamiento hormonal. Los fármacos anticolinérgicos tratan los síntomas de la vejiga hiperactiva, incluida la incontinencia, y actúan mediante la reducción de los espasmos musculares espontáneos de la vejiga (Kuteesa 2006). Los agonistas adrenérgicos (alfa y beta) pueden ser beneficiosos debido a que promueven la continencia en las vías urinarias inferiores al ejercer efectos sobre la fuerza de contracción del cuello vesical y el músculo del esfínter uretral (alfa). Los betadrenérgicos pueden promover la continencia mediante los efectos de la relajación del músculo detrusor, con o sin contracción del esfínter uretral (Alhasso 2005). El tratamiento hormonal (estrógeno) administrado de forma local o sistémica, puede ser prescrito para las pacientes posmenopáusicas y puede ayudar a mantener la vejiga y la uretra saludables y funcionando de manera adecuada (Cody 2012). La crema de estrógeno puede ayudar a algunas mujeres con incontinencia urinaria a revertir la vaginitis atrófica y la uretritis. El efecto de los tratamientos hormonales en los pacientes luego de un accidente cerebrovascular no está claro.
Intervenciones con fisioterapia
Las intervenciones de fisioterapia incluyen estimulación eléctrica o biorretroalimentación. La neuromodulación del nervio plexo sacro mediante la estimulación eléctrica es un tratamiento efectivo para aliviar la vejiga hiperactiva y la incontinencia urinaria de urgencia (Staskin 2012). Sin embargo, dicho enfoque no se ha examinado previamente en la población con accidente cerebrovascular. La estimulación eléctrica del nervio sacro plexo neuromodula las raíces nerviosas L4–S3 que controlan la función vesical y la actividad del esfínter uretral para eliminar las contracciones inapropiadas del detrusor mientras el reflejo de micturición permanece intacto. La estimulación transcutánea del nervio tibial posterior (ETNTP) es una técnica de estimulación eléctrica retrógrada no invasiva del plexo sacro a través del nervio ciático. Se accede al nervio tibial posterior, un tributario del nervio ciático, mediante electrodos superficiales aplicados al área maleolar medial.
Ayudas físicas
Las ayudas físicas se usan para detener o controlar la pérdida urinaria e incluyen dispositivos intravaginales (pesarios). Los pesarios se usan en la incontinencia urinaria de esfuerzo para sostener el cuello vesical. Algunos dispositivos incluyen una perilla que comprime la uretra contra el hueso púbico para prevenir la pérdida cuando aumenta la presión intra‐abdominal (Al‐Shaikh 2018).
Medidas de tipo ambiental o del estilo de vida
Los mecanismos nutricionales y metabólicos pueden afectar las vías urinarias. Las modificaciones del estilo de vida (p.ej. ingesta de líquido y cafeína, abandono del hábito de fumar, pérdida de peso) pueden reducir la incontinencia urinaria. Por ejemplo, la pérdida de peso puede reducir la mayor presión intra‐abdominal asociada con la obesidad mediante el fortalecimiento de las estructuras de apoyo del piso pelviano (Imamura 2015).
Por qué es importante realizar esta revisión
Esta revisión procuró evaluar los efectos de un rango de intervenciones diseñadas para mejorar la incontinencia urinaria al menos un mes después del accidente cerebrovascular al evaluar la evidencia disponible de los ensayos controlados aleatorios y cuasialeatorios. Las guías clínicas actuales se basan en gran parte en el consenso de expertos (Intercollegiate Stroke Working Party 2016); hay poca evidencia de la efectividad de las intervenciones recomendadas (p.ej. vaciamiento intermitente, vaciamiento a la orden, entrenamiento vesical) en la población con accidente cerebrovascular.
Objetivos
Evaluar los efectos de las intervenciones para el tratamiento de la incontinencia urinaria después del accidente cerebrovascular en adultos al menos un mes después del accidente cerebrovascular.
Métodos
Criterios de inclusión de estudios para esta revisión
Tipos de estudios
Se incluyeron ensayos aleatorios y cuasialeatorios que evaluaran los efectos de intervenciones para promover la continencia en pacientes que han sufrido un accidente cerebrovascular. Los métodos cuasialeatorios incluyen la asignación según la fecha de nacimiento, el día de la semana o el mes del año, por el número de historia clínica o simplemente la asignación alternada de cada paciente.
Tipos de participantes
Adultos (es decir, a partir de los 18 años de edad) con un diagnóstico de accidente cerebrovascular, incluidos los pacientes con incontinencia que sufrieron un accidente cerebrovascular identificado como un subgrupo dentro de un grupo mayor para los que se informaron datos relevantes.
Tipos de intervenciones
Un grupo del estudio debió incluir una intervención para promover la continencia urinaria. Se incluyeron ensayos que evaluaban cualquiera de los siguientes ítems en esta revisión:
-
intervenciones conductuales, por ejemplo, vaciamiento a la orden o programado, entrenamiento vesical, reentrenamiento de hábitos (es decir, identificación del patrón de vaciamiento y desarrollo de un esquema individualizado del uso del baño), EMPP u otros programas de terapia conductual;
-
intervenciones con participación de profesionales especialistas, por ejemplo, información o educación, programas de evaluación, programas genéricos de rehabilitación multidisciplinaria, consejeros en continencia, programas de apoyo domiciliario, enfermeras profesionales;
-
intervenciones terapéuticas complementarias, por ejemplo homeopatía, acupuntura (acupuntura manual tradicional o electroacupuntura);
-
intervenciones de farmacoterapia, por ejemplo anticolinérgicos, adrenérgicos, tratamiento hormonal;
-
intervenciones de fisioterapia, por ejemplo estimulación eléctrica, biorretroalimentación;
-
ayudas físicas, por ejemplo pesarios, otros aparatos; e
-
intervenciones ambientales o del estilo de vida, por ejemplo posición de vaciamiento, dieta y control de líquidos.
Las intervenciones de control aceptables fueron la atención habitual, ningún tratamiento, placebo o control de atención (atención clínica en forma de una intervención que inducía una expectativa de beneficio terapéutico; Freedland 2011). Se cree que la comparación de interés particular para los pacientes y los profesionales en esta revisión es la intervención versus ninguna intervención / atención habitual.
Se excluyeron los ensayos relacionados exclusivamente a intervenciones quirúrgicas o físicas para los problemas de continencia preexistentes no asociados con un accidente cerebrovascular (p.ej., resección transuretral de la próstata), a menos que se tratara de una cointervención en un ensayo mayor en que se estudió un método incluido de promoción de la continencia. Se excluyeron los ensayos relacionados con el diagnóstico urológico, o con el tratamiento de la incontinencia o la retención de orina en la fase aguda del accidente cerebrovascular (definido como hasta un mes luego del accidente cerebrovascular). También se excluyeron los ensayos cuando la continencia no se midió a través del informe de los síntomas de los participantes o a través de una medida física (p.ej. una prueba con protector).
Tipos de medida de resultado
Resultados primarios
-
Continencia, medida de acuerdo a lo siguiente:
-
Número de pacientes continentes después del tratamiento
-
Número de episodios de incontinencia (indicado en los registros de la vejiga, número total y medio de episodios)
-
Percepción de mejoría o curación (según informó el paciente o el cuidador)
-
Resultados secundarios
-
Síntomas urinarios, como polaquiuria, urgencia, nocturia
-
Medidas físicas (p.ej. pruebas con protectores de la pérdida cuantificada, retención de orina luego del vaciamiento, volumen de vaciamiento, medidas urodinámicas)
-
Estado de salud y calidad de vida (repercusión de la incontinencia p.ej. Incontinence Impact Questionnaire (IIQ), 36‐Item Short Form Health Survey Questionnaire (SF‐36), Bristol Female Urinary Symptoms Questionnaire, conocimiento, calidad de vida)
-
Capacidad funcional (actividades cotidianas p.ej. Índice de Barthel)
-
Satisfacción del participante
-
Eventos adversos.
Tablas "Resumen de los hallazgos"
Se utilizó GRADE para interpretar los resultados y crear tablas de “Resumen de resultados” para la comparación principal (intervención versus ninguna intervención / atención habitual) mediante los resultados enumerados más abajo para las intervenciones conductuales, la participación de profesionales especialistas, el tratamiento complementario y la fisioterapia:
-
número de pacientes continentes después del tratamiento;
-
número de episodios de incontinencia en 24 horas;
-
percepción de mejoría o curación;
-
estado de salud y calidad de vida;
-
habilidad funcional; y
-
eventos adversos.
Se eligieron los resultados para las tablas de “resumen de resultados” basado en los resultados primarios, los resultados de importancia clínica y los resultados de mayor importancia para los pacientes.
Métodos de búsqueda para la identificación de los estudios
We imposed no language or other restrictions on any of the searches.
Búsquedas electrónicas
We used the search strategies developed for both Cochrane Incontinence and Cochrane Stroke. We initially identified relevant trials from the Groups' Specialised Registers of controlled trials.
For more details of the search methods used to build the Cochrane Incontinence Specialised Register, see the Group's webpages where details of the Register's development (from inception) and the most recent searches performed to populate the Register can be found. For more details of the search methods used to build the Cochrane Stroke Specialised Register, see the Cochrane Stroke webpages.
To summarise, both Registers contain trials identified from the Cochrane Central Register of Controlled Trials (CENTRAL), MEDLINE, MEDLINE In‐Process, MEDLINE Epub Ahead of Print, CINAHL, ClinicalTrials.gov, WHO ICTRP, UK Clinical Research Network Portfolio, and handsearching of journals and conference proceedings. The Cochrane Stroke Specialised Register includes searches of many other sources of trials. Many of the trials in the Cochrane Incontinence and Cochrane Stroke Specialised Registers are also contained in CENTRAL. The dates of the most recent searches of the Specialised Registers for this review update were: 30 October 2017 (Cochrane Stroke Register) and 1 November 2017 (Cochrane Incontinence Register).
The terms used to search the Cochrane Incontinence and Cochrane Stroke Specialised Registers are given in Appendix 1.
For the first two versions of this review, extra specific searches were performed (Thomas 2005; Thomas 2008). For more details, including the search terms used, see Appendix 2.
Búsqueda de otros recursos
We searched the reference lists of all relevant reviews and trial reports to identify further relevant studies.
Obtención y análisis de los datos
Selección de los estudios
Two review authors (of LT, JC and LC) independently screened titles and abstracts for potentially eligible studies. We resolved any disagreements regarding the inclusion or exclusion of individual studies by discussion or, if necessary, by consulting the third review author. We contacted authors of identified articles where there were missing or unclear data in order to inform study selection decisions. There was no masking of the source and authorship of the trial reports.
Extracción y manejo de los datos
Pairs of review authors (of LT, JC and LC) performed independent data extraction of the included trials using a piloted data collection form. The data collected included information on study design, study population, interventions, outcomes measurement and results. We resolved any discrepancies in data extraction either by discussion between the two authors or with involvement of the third review author. Two review authors (LT and JC) entered data into Review Manager 5 (Review Manager 2014).
Evaluación del riesgo de sesgo de los estudios incluidos
Two review authors (LT and JC) independently assessed the risk of bias of included studies using Cochrane's 'Risk of bias' tool (Higgins 2011). The tool covers the domains of random sequence generation, allocation concealment, blinding of participants and personnel, blinding of outcome assessment, incomplete outcome data, selective outcome reporting and other bias. We classified each domain as either low risk, high risk or unclear risk of bias.
Medidas del efecto del tratamiento
We based analyses on available data from all included trials relevant to the comparisons and outcomes of interest. We summarised effect estimates for continuous outcomes using mean difference (MD) and we summarised dichotomous outcomes using risk ratio (RR). For continuous outcome data, we used MD of post‐treatment scores unless changes from baseline data were available.
Cuestiones relativas a la unidad de análisis
For cross‐over trials, we analysed the data using a paired samples mean and SE test. We analysed multi‐arm trials comparing two interventions arms with one control group using methods described by Higgins 2011 (section 16.5.4). To prevent inappropriate double‐counting of individuals, we analysed each treatment arm separately against the common control group but divided the sample size of the common comparator group proportionately across each intervention comparison.
Manejo de los datos faltantes
We attempted to obtain missing data, as well as data collected but not reported, by contacting trialists. We contacted study authors of trials which included a subgroup of people with stroke to obtain stroke subgroup data. If no response was received from study authors after one contact, we made a second request to obtain the required data.
Evaluación de la heterogeneidad
We only combined and pooled data from trials if the types of interventions were similar enough to do so. We investigated differences between trials if heterogeneity (I²) was greater than 50%. If heterogeneity could not be explained, we considered using a random‐effects model.
We described the statistical heterogeneity of the intervention effects by calculating the I² statistic and using the Chi² test. We interpreted heterogeneity as follows.
-
0% to 40%: represents low heterogeneity.
-
30% to 60%: may represent moderate heterogeneity.
-
50% to 90%: may represent substantial heterogeneity.
-
75% to 100%: represents considerable heterogeneity.
We used both random‐effects and fixed‐effect meta‐analysis with 95% CI using Review Manager (Review Manager 2014). We pooled outcomes such as quality of life measured with different instruments using the standardised mean difference (SMD).
Evaluación de los sesgos de notificación
We searched clinical trial registers to assist in reducing publication bias. We also investigated selective outcome reporting though the comparison of the methods section of papers with the results reported.
Síntesis de los datos
Dichotomous outcomes reported as favourable events were the number of people continent after treatment and participant satisfaction. Outcomes reported as unfavourable events were number of incontinence episodes in 24 hours, urinary symptoms (including frequency, urgency, nocturia) and adverse events.
We summarised effect estimates for continuous outcomes using MD or SMD and we summarised dichotomous outcomes using RR. Where deemed appropriate, we pooled effects across similar studies using fixed‐ or random‐effects meta‐analysis techniques with 95% confidence intervals (CIs). We used random‐effects meta‐analysis (DerSimonian 1986) if the studies showed heterogeneity (defined by the studies' effects having an I² statistic of greater than 50%); otherwise, we used a fixed‐effect analysis (Mantel‐Haenszel method) for dichotomous and inverse variance for continuous data (Mantel 1959). For continuous outcome data, we used change from baseline data if available; otherwise, we used the raw outcome data.
Análisis de subgrupos e investigación de la heterogeneidad
Where data were available, we planned subgroup analyses for the effect of urological diagnosis (i.e. detrusor overactivity versus other) and time from stroke onset to recruitment to trial.
Análisis de sensibilidad
Where data allowed, we planned to explore the effects of including studies assessed as having a high risk of bias using sensitivity analyses.
'Summary of findings' tables
We prepared 'Summary of findings' tables for the main comparison. To ensure clarity, we created individual 'Summary of findings' tables for specific clinically important interventions within the main comparison.
Three review authors (LT, JC, LC) assessed and documented the quality of evidence for the prespecified outcomes outlined in the Types of outcome measures based on the GRADE approach (Guyatt 2008). We downgraded the evidence from high‐quality by one level for serious (or by two levels for very serious) study limitations:
-
risk of bias due to flawed design or conduct of studies (random sequence generation, allocation concealment, blinding of participants and personnel, blinding of outcome assessment, and incomplete outcome data). We reassessed all studies from the original review (Thomas 2008) using the updated 'Risk of bias' tool (Higgins 2011);
-
imprecision (e.g. when CIs for treatment effect were wide);
-
inconsistency (e.g. when point estimates varied widely, the I² was large);
-
indirectness (e.g. variations in participants, interventions, comparisons and outcomes); and
-
publication bias (may be explored with the use of funnel plots and classed as not suspected, suspected, strongly suspected or very strongly suspected).
Results
Description of studies
Results of the search
Search for the 2019 review update
The previous version of this review included 12 studies (Thomas 2008). The search for the 2019 version identified a further 10 studies (Booth 2016; Chu 2011; Guo 2014; Liu 2013; Liu 2016a; Liu 2016b; Monteiro 2014; Shin 2016a; Song 2013; Tibaek 2017; Zhang 1996; seeFigure 1). One review author (AT) translated studies published in Chinese. Two studies were reported in the same conference abstract (Gelber 1997a; Gelber 1997b). Two trials originally included in the 2008 version were removed from this update as they were found not to be eligible (Wikander 1998; Zhu 2003). Two studies previously classified as awaiting assessment were excluded in this version as stroke subgroup data were not available (Engberg 2002; McDowell 1999). We identified two potentially relevant studies that are still ongoing (NCT02568774; Shin 2016b). We classified three studies as awaiting further assessment (ACTRN12617000162314; ChiCTR‐INR‐16010239; Wang 2014).

PRISMA study flow diagram (2019 review update).
Therefore, the review has 20 included studies (reporting 21 comparisons), 27 excluded studies, two ongoing studies and three studies awaiting classification.
Appendix 3 shows the results of the search for the previous versions of this review (Thomas 2005; Thomas 2008).
Included studies
For details about the included studies, please see the Characteristics of included studies. Please note: Liu 2016a and Liu 2016b are two arms of a multi‐arm RCT reporting on two separate comparisons. Henceforth, they are listed below as "Liu 2016a and Liu 2016b" to highlight their relation to one another.
Design
Of the 20 included trials, all were randomised controlled trials with the exception of Booth 2016, which was a randomised controlled feasibility trial and Judge 1969, which was a cross‐over trial. The trial by Liu was a three‐arm trial (Liu 2016a and Liu 2016b). All trials were single‐centre with the exception of Booth 2016 and Song 2013.
Study funding sources
Twelve studies did not publish a funding statement (Chu 1997; Chu 2011; Gelber 1997a; Gelber 1997b; Guo 2014; Lewis 1990; Liu 2006; Monteiro 2014; Song 2013; Zhang 1996; Zhang 2002; Zhou 1999). Two studies reporting three comparisons reported that they received no funding grants (Liu 2016a and Liu 2016b; Shin 2016a). Six studies reported funding sources (Booth 2016; Brittain 2000b; Judge 1969; Liu 2013; Tibaek 2005; Tibaek 2017).
Study dates
Publication dates of the trials ranged from 1969 to 2016. Six studies did not report information on the period when participants were recruited to the trials or the dates the studies were conducted (Gelber 1997a; Gelber 1997b; Judge 1969; Lewis 1990; Shin 2016a; Zhang 1996). Five trials reported the study period as occurring between 1992 and 2001 (Brittain 2000b; Chu 1997; Tibaek 2005; Zhang 2002; Zhou 1999). One trial was conducted between 2004 and 2006 (Liu 2006). Four trials were conducted between 2007 and 2012 (Liu 2013; Monteiro 2014; Song 2013; Tibaek 2017). One trial was conducted between 2014 and 2016 (Booth 2016). One trial reported recruitment from hospital inpatients during the period 2007 to 2010 (Chu 2011). One trial reported hospitalisation dates of participants between 2010 and 2011 (Guo 2014). Liu 2016a and Liu 2016b reported that participants were in hospital between 2011 and 2013.
Sample sizes
Three trials included fewer than 25 participants (Judge 1969; Lewis 1990; Monteiro 2014). Five trials included between 26 and 49 participants (Gelber 1997a; Gelber 1997b; Shin 2016a; Tibaek 2005; Tibaek 2017). Eleven trials, including one trial that reported two comparisons, had 50 or more participants (Booth 2016; Brittain 2000b; Chu 1997; Chu 2011; Guo 2014; Liu 2006; Liu 2013; Liu 2016a and Liu 2016b; Zhang 1996; Zhang 2002; Zhou 1999).
Setting
Of the 20 trials, 10 were carried out in China, including one trial that reported two comparisons (Chu 1997; Chu 2011; Guo 2014; Liu 2006; Liu 2013; Liu 2016a and Liu 2016b; Song 2013; Zhang 1996; Zhang 2002; Zhou 1999), one in England (Brittain 2000b), two in Scotland (Booth 2016; Judge 1969), three in the USA (Gelber 1997a; Gelber 1997b; Lewis 1990), one in Brazil (Monteiro 2014), one in Korea (Shin 2016a), and two in Denmark (Tibaek 2005; Tibaek 2017).
Six trials took place in an outpatient setting (Guo 2014; Liu 2013; Monteiro 2014; Shin 2016a; Tibaek 2005; Tibaek 2017). One trial took place in a long‐stay inpatient setting for elderly people (Judge 1969). Two trials took place in an inpatient setting (Liu 2006; Zhang 1996), and two trials, including one trial that reported two comparisons, were conducted in both an inpatient and outpatient setting (Liu 2016a and Liu 2016b; Song 2013). Two trials took place in participants' homes in the community (Booth 2016; Brittain 2000b). The remaining trials did not specify the location of care (Chu 1997; Chu 2011; Gelber 1997a; Gelber 1997b; Lewis 1990; Zhang 2002; Zhou 1999).
Participants
The 20 trials included 1338 participants. The numbers of participants in the individual trials ranged from 12 to 232. Twelve trials, including one trial reporting two comparisons, included both genders (Booth 2016; Brittain 2000b; Chu 1997; Chu 2011; Guo 2014; Liu 2006; Liu 2013; Liu 2016a and Liu 2016b; Song 2013; Zhang 1996; Zhang 2002; Zhou 1999). Five trials included only women (Judge 1969; Shin 2016a; Tibaek 2005), or only men (Monteiro 2014; Tibaek 2017). Three trials did not report gender characteristics (Gelber 1997a; Gelber 1997b; Lewis 1990).
Three trials did not report the age of the participants (Gelber 1997a; Gelber 1997b; Lewis 1990). Six trials reported an age range of participants (Brittain 2000b: 40 to 96 years; Chu 1997: 45 to 71 years; Judge 1969: 66 to 92 years; Zhang 1996: 52 to 78 years; Zhang 2002: 42 to 62 years; Zhou 1999: 52 to 85 years). Eleven trials reported the mean and standard deviation (SD) of the ages of the participants in both the intervention and control groups. Of these, eight had a mean age in the intervention group of 62 to 68 years, including one trial that reported two different comparisons (Booth 2016; Chu 2011; Guo 2014; Liu 2006; Liu 2016a and Liu 2016b; Monteiro 2014; Shin 2016a; Tibaek 2017). Two trials reported a lower mean age in the intervention group: Liu 2013 (mean age 39 years) and Song 2013 (mean age 55 years). One trial reported a median age of 60 years (interquartile range (IQR) 56 to 74 years) (Tibaek 2005).
Eleven trials reported both inclusion and exclusion criteria, including one trial that reported two different comparisons (Booth 2016; Brittain 2000b; Guo 2014; Liu 2006; Liu 2013; Liu 2016a and Liu 2016b; Monteiro 2014; Shin 2016a; Song 2013; Tibaek 2005; Tibaek 2017). Seven trials did not report any inclusion and exclusion criteria (Chu 1997; Gelber 1997a; Gelber 1997b; Lewis 1990; Zhang 1996; Zhang 2002; Zhou 1999). One trial reported exclusion criteria only (Judge 1969), while one trial reported inclusion criteria only (Chu 2011).
Six trials, including one trial reporting two comparisons, included participants with either a first or recurrent stroke (i.e. only including participants after a first stroke was not mentioned in either inclusion or exclusion criteria) (Booth 2016; Guo 2014; Liu 2016a and Liu 2016b; Monteiro 2014; Shin 2016a; Tibaek 2017). With the exception of Tibaek 2005, it was not possible to determine whether only participants with a first stroke were included in the remaining trials.
Interventions
The trials tested the following interventions.
Behavioural interventions (five trials):
-
timed voiding versus void on request (Gelber 1997a);
-
timed voiding versus oxybutynin (Gelber 1997b);
-
PFMT versus usual care (Shin 2016a; Tibaek 2005; Tibaek 2017).
Specialised professional input interventions (one trial):
-
care from a CNP versus usual care provided by the GP (Brittain 2000b).
Complementary therapy interventions (eight trials):
-
scalp acupuncture versus no scalp acupuncture (Chu 1997);
-
eye acupuncture and scalp electroacupuncture versus herbal medication therapy (Zhou 1999);
-
traditional acupuncture (knee and inside of ankle) versus usual care (Zhang 2002);
-
pelvic plexus acupuncture versus filiform needle (Zhang 1996);
-
ginger‐salt‐partitioned moxibustion (involving filling the navel with salt, adding a piece of ginger and a taper and setting the taper alight) plus routine acupuncture versus routine acupuncture (Liu 2006);
-
electroacupuncture (lumbar and sacral region) versus standard medical therapy and scalp and body acupuncture (Chu 2011);
-
electroacupuncture combined with traditional acupuncture (sacral region) versus sham acupuncture (sacral region) (Liu 2013);
-
electroacupuncture (multiple points on arms, legs and torso) versus indwelling catheter with bladder training (Song 2013).
Pharmacotherapy interventions (one trial):
-
oestrogen versus placebo (Judge 1969).
Physical therapy interventions (five trials reporting six comparisons):
-
sensory‐motor biofeedback device (Uristop) combined with timed voiding against timed voiding alone (Lewis 1990);
-
transcutaneous posterior tibial nerve stimulation (TPTNS) versus sham (Booth 2016), or versus attention control (Monteiro 2014);
-
transcutaneous electrical nerve stimulation (TENS) versus usual care (Guo 2014), no treatment control or a different frequency of stimulation (Liu 2016a and Liu 2016b).
We found no trials evaluating interventions that included physical aids, or environmental or lifestyle interventions.
Intervention comparisons
The effects of the included intervention types (behavioural, specialised professional input, complementary, pharmacotherapy and physical therapy) were considered within the following five comparison categories:
-
intervention versus no intervention/usual care;
-
intervention versus placebo;
-
specific intervention versus another intervention;
-
combined intervention versus single intervention;
-
specific intervention versus attention control.
Intervention versus no intervention/usual care
Twelve trials tested an intervention versus no intervention or usual care, including one trial reporting two comparisons (Brittain 2000b; Chu 1997; Gelber 1997a; Guo 2014; Liu 2006; Liu 2016a and Liu 2016b; Shin 2016a; Song 2013; Tibaek 2005; Tibaek 2017; Zhang 2002; Zhou 1999).
Behavioural interventions
One trial tested a behavioural intervention comprising timed voiding versus void on request for participants with normal urodynamic studies (Gelber 1997a). Normal urodynamic studies were not defined and no further details were given of the intervention. Two trials tested an intensive PFMT programme, comprising individual and group exercises and feedback to participants, compared with normal rehabilitation with no specific treatment of UI (Tibaek 2005; Tibaek 2017). One trial evaluated PFMT in addition to general rehabilitation training compared with general rehabilitation training alone (Shin 2016a).
Specialised professional input interventions
One trial tested a specialised professional input intervention comparing care given by a CNP versus usual care provided by a GP and existing specialised services for the management of continence (Brittain 2000b).
Complementary therapy interventions
Five trials tested complementary interventions: Chu 1997 tested scalp acupuncture plus usual care versus usual care; Zhang 2002 tested acupuncture versus general treatment; and Zhou 1999 tested eye and scalp electroacupuncture versus herbal medication therapy only, which we classed as usual care. Liu 2006 tested ginger‐salt‐partitioned moxibustion plus routine acupuncture versus routine acupuncture. Song 2013 compared electroacupuncture versus indwelling catheter.
Physical therapy interventions
Two trials tested transcutaneous electrical nerve stimulation. In one trial, the comparison group received "basic therapy" (Guo 2014). The other trial, reporting two comparisons, compared different electrical frequencies against no treatment (Liu 2016a and Liu 2016b).
Intervention versus placebo
One cross‐over trial tested a pharmacotherapy intervention (oestrogen) versus placebo (Judge 1969).
One feasibility trial compared TPTNS versus a sham intervention with electrodes positioned to avoid the tibial nerve (Booth 2016). One trial compared electroacupuncture trial combined with traditional acupuncture with sham acupuncture (Liu 2013).
Specific intervention versus another intervention
Gelber 1997b tested a specific intervention against another intervention, comparing the anticholinergic oxybutynin versus timed voiding in participants with bladder hyper‐reflexia. Zhang 1996 tested acupuncture with an elongated needle compared with a filiform needle.
Combined intervention versus single intervention
One trial tested a combined intervention (sensory‐motor biofeedback device combined with timed voiding) versus a single intervention (timed voiding alone) (Lewis 1990).
Specific intervention versus attention control
Monteiro 2014 compared 12 sessions of electrical stimulation of the posterior tibialis nerve versus an attention control group. Participants in the attention control group undertook a task involving 12 sessions of muscle‐stretching training exercises of the lower limb.
Diagnosis
Pre‐stroke continence status
Only 11 trials, reporting 12 comparisons, included participants who were continent prior to the stroke (Booth 2016; Chu 2011; Guo 2014; Liu 2006; Liu 2013; Liu 2016a and Liu 2016b; Monteiro 2014; Shin 2016a; Song 2013; Tibaek 2005; Tibaek 2017). Nine trials did not specify whether UI was subsequent to the occurrence of stroke (Brittain 2000b; Chu 1997; Gelber 1997a; Gelber 1997b; Judge 1969; Lewis 1990; Zhang 1996; Zhang 2002; Zhou 1999), although Lewis 1990 described participants as having "post‐stroke urinary urge incontinence."
Further information on the continence status of participants prior to stroke as defined by study authors can be found in Table 1.
| Study IDs | Continent prior to stroke | Diagnostic criteria for assessment of incontinence as reported by study authors | Description of participant incontinence by study authors |
| Yes | Not reported | At least once weekly | |
| Unclear | Yes (structured 1‐hour assessment by continence nurse practitioner) | Self‐reported clinical symptoms of leakage several times per month or more, frequency every ≥ 30 minutes, nocturia, urgency | |
| Unclear | Not reported | Not reported | |
| Yes | Yes (according to "neurological disease syndrome") | According to "neurological disease syndrome" neurogenic bladder with incontinence | |
| Unclear | Not reported | Normal urodynamic studies with incontinence | |
| Unclear | Not reported | Bladder hyper‐reflexia | |
| Yes | Yes (OABSS) | Post‐stroke urinary incontinence | |
| Unclear | Not reported | Mild or severe incontinence | |
| Unclear | Not reported | Post‐stroke urge urinary incontinence | |
| Yes | Yes (Barthel Index – continence item) | Completely incontinent, partially incontinent and self‐controlling | |
| Yes | Yes (urodynamic assessment) | Post‐stroke detrusor overactivity | |
| Yes | Yes (OABSS) | Post‐stroke urinary incontinence | |
| Yes | Yes (OABSS) | Post‐stroke urinary incontinence | |
| Yes | Yes (Barthel Index – Bladder item) | Post‐stroke neurogenic overactive bladder | |
| Yes | Yes (Bristol Female Urinary Symptoms Questionnaire) | Post‐stroke stress urinary incontinence | |
| Yes | Not reported | Post‐stroke urinary incontinence | |
| Yes | Yes (ICS definition) | Post‐stroke urinary incontinence | |
| Yes | Yes (ICS definition) | Lower urinary tract symptoms | |
| Unclear | Not reported | Post‐stroke urinary incontinence | |
| Unclear | Not reported | Post‐stroke urinary incontinence | |
| Unclear | Not reported | Post‐stroke urinary incontinence |
ICS: International Continence Society; OABSS: Overactive Bladder Symptom Score.
Diagnostic criteria for urinary incontinence used by study authors
Eight trials reporting nine comparisons gave diagnostic criteria for incontinence (Brittain 2000b; Chu 2011; Guo 2014; Liu 2013; Liu 2016a and Liu 2016b; Shin 2016a; Tibaek 2005; Tibaek 2017). Four trials specified a urological diagnosis: normal urodynamic studies (Gelber 1997a); bladder hyper‐reflexia (Gelber 1997b); urge incontinence (Lewis 1990); and urge, stress and mixed stress/urge incontinence (Tibaek 2005). Judge 1969 reported data for two groups of participants defined as mildly or severely incontinent. Booth 2016 reported data on post‐stroke participants who reported incontinence at least once per week. Liu 2006 reported data for three groups of participants, classified according to the Barthel continence item: completely incontinent, partially incontinent and independent. Liu 2006 and Monteiro 2014 reported data using the Barthel Index (bladder item). Chu 1997 included participants who had "urinary frequency or urinary incontinence" but did not define urinary frequency further. One trial reported participants met the "urological criteria for incontinence" with no further details available in the translation (Song 2013). Three trials did not include a urological diagnosis for participants or group them by type or severity of incontinence (Zhang 1996; Zhang 2002; Zhou 1999).
For further information on the diagnostic criteria for incontinence and the description of incontinence by study authors, see Table 1.
Diagnostic criteria for stroke used by study authors
Booth 2016, Tibaek 2005 and Tibaek 2017 diagnosed stroke according to the World Health Organization's clinical definition, which includes confirmation by computed tomography (CT) or magnetic resonance imaging (MRI) scan (WHO 1989). Similarly, in Liu 2013 and Zhang 1996, a physician diagnosed stroke and observed cerebral haemorrhage or infarction on cranial CT or MRI. Tibaek 2005 included only first‐ever ischaemic strokes. All participants in the intervention arm of Tibaek 2017 had no previous history of stroke. Song 2013 diagnosed stroke according to 1995 National Meeting on Cerebrovascular Accidents diagnostic criteria. Chu 2011 included participants diagnosed with first or repeated episode of stroke according to the Fourth National Conference on Cerebrovascular Disease. Monteiro 2014 assessed participants with clinical and neuroimaging evaluations according to established criteria from the Brazilian Cerebrovascular Disease Society. Eleven trials reporting 12 comparisons did not report stroke diagnostic criteria (Chu 1997; Gelber 1997a; Gelber 1997b; Guo 2014; Judge 1969; Lewis 1990; Liu 2006; Liu 2016a and Liu 2016b; Shin 2016a; Zhang 2002; Zhou 1999).
Participants in 10 trials reporting 11 comparisons included those with cerebral infarction and haemorrhage (Booth 2016; Chu 2011; Guo 2014; Lewis 1990; Liu 2006; Liu 2013; Liu 2016a and Liu 2016b; Song 2013; Zhang 1996; Zhou 1999). Two trials included only participants with infarction (Tibaek 2005; Zhang 2002). In Zhang 2002, almost half of the participants had multiple cerebral infarctions. Judge 1969 included participants with cerebrovascular accident or "multiple little strokes." Two trials reported that strokes were unilateral (Gelber 1997a; Gelber 1997b), while one trial reported the stroke type as multi‐focal infarction (Chu 1997). Brittain 2000b included participants who self‐reported that they had had a stroke, subarachnoid haemorrhage or transient ischaemic attack on a screening questionnaire.
Participants in Liu 2006 were 70.74 (SD 35.26) days post‐stroke. Three trials reporting four comparisons similarly recruited participants between seven and 10 weeks post‐stroke (Guo 2014; Liu 2016a and Liu 2016b; Tibaek 2017). Zhou 1999 presented findings for participants who were less than or more than three months post‐stroke. Shin 2016a reported participants were more than three months post‐stroke. Participants in three trials were also less likely to be in the early rehabilitation phase, as they were either occupying long‐stay geriatric hospital beds or living at home (Brittain 2000b; Judge 1969; Tibaek 2005). Booth 2016 recruited people between zero and more than five years after stroke. Of these, 12.2% (8 participants) were between zero and three months, and 30.6% (15 participants) were more than five years post‐stroke. It was difficult to identify the phase of stroke recovery for participants in the other trials (Chu 1997; Gelber 1997a; Gelber 1997b; Lewis 1990; Liu 2013; Monteiro 2014; Zhang 1996; Zhang 2002).
Please see Table 2 for further information on the participants' stroke history, stroke diagnostic information and stroke description.
| Study IDs | Stroke history of participants (any previous stroke) | Stroke diagnostic information provided by study authors | Stroke description of study participants |
| Not reported | According to WHO 1989 criteria | Ischaemic (87.8%) Haemorrhagic (10.2%) Other (2%) | |
| Not reported | Postal screening questionnaire – self‐report | Not reported | |
| Not reported | Not reported | Multi‐focal cerebral infarction | |
| First or repeated episode of stroke | According to the Fourth National Conference on Cerebrovascular Disease | Ischaemic (73%) Haemorrhagic (27%) | |
| Not reported | Not reported | Unilateral stroke | |
| Not reported | Not reported | Unilateral stroke | |
| Not reported | Not reported | Ischaemic (77%) Haemorrhagic (23%) | |
| Not reported | Not reported | Cerebrovascular accidents | |
| Not reported | Not reported | Ischaemic (78.2%) Haemorrhagic (21.8%) | |
| Not reported | Not reported | Ischaemic (80%) Haemorrhagic (20%) | |
| Not reported | Confirmation by CT or MRI scan | Ischaemic (45.5%) Haemorrhagic (54.5%) | |
| Not reported | Not reported | Ischaemic (72.8%) Haemorrhagic (27.2%) | |
| Not reported | Not reported | Ischaemic (72.8%) Haemorrhagic (27.2%) | |
| Not reported | Clinical and neuroimaging evaluation according to established criteria of Brazilian Cerebrovascular Disease Society | Ischaemic (100%) | |
| Not reported | Not reported | Not reported | |
| Not reported | According 1995 National Meeting on Cerebrovascular Accidents | Ischaemic (49.5%) Haemorrhagic (50.5%) | |
| First ever stroke | According to WHO 1989 criteria | Ischaemic (100%) | |
| 16.7% had 1 previous stroke | According to WHO 1989 criteria | Not reported | |
| Not reported | Confirmation by CT or MRI scan | Ischaemic and Haemorrhagic, figures not reported. | |
| Not reported | Not reported | Ischaemic (100%) | |
| Not reported | According to criteria from Chinese Diagnostic Guidelines | Ischaemic (66.3%) Haemorrhagic (33.7%) |
CT: computed tomography; MRI: magnetic resonance imaging.
Description of outcomes
Fifteen of the 20 trials clearly stated the primary outcome(s) of interest in the trial. In six trials, this was the number of people with UI (Brittain 2000b; Chu 1997; Chu 2011; Zhang 1996; Zhang 2002; Zhou 1999); in nine trials it was number of incontinent episodes (Booth 2016; Gelber 1997a; Gelber 1997b; Judge 1969; Lewis 1990; Liu 2006; Liu 2013; Tibaek 2005; Tibaek 2017). Four trials had an additional primary outcome of urinary symptoms (Liu 2006; Liu 2013; Tibaek 2005; Tibaek 2017). Five trials reporting six comparisons did not report a primary outcome (Guo 2014; Liu 2016a and Liu 2016b; Monteiro 2014; Shin 2016a; Song 2013).
Please see Table 3 for further information on primary and secondary outcomes as described by study authors.
| Study IDs | Primary outcome(s) | Measured by | Secondary outcome(s) | Measured by |
| Number of incontinent episodes | ICIQ‐UI‐SF | Severity | ICIQ‐UI‐SF | |
| Urinary symptoms | AUASI* | |||
| Urgency perception scores | Bladder diary | |||
| Postvoid residual volume | Bladder scan | |||
| Quality of life | EQ‐5D‐5L ICIQLUTSqol | |||
| Adverse events | Participant reports | |||
| ADL | Barthel Index | |||
| Number of people incontinent | Nurse assessment and self‐report | Urinary symptoms Satisfaction with service | Nurse assessment and self‐report | |
| Number regaining continence | Not reported | None reported | — | |
| Number of people incontinent | Urinary Continence Status Grading (4 categories) | Severity | Urinary Continence Status Grading (4 categories) Participant reports | |
| Urinary symptoms | Clinical aggregate score | |||
| Adverse events | Not reported | |||
| Number of incontinent episodes per day for each month of treatment for 1 year | Not reported | None reported | — | |
| Number of incontinent episodes per day for each month of treatment for 1 year | Not reported | None reported | — | |
| Primary outcome not stated | — | Urinary symptoms | OABSS | |
| ADL | Barthel Index | |||
| Number of incontinent episodes per week | Not reported | None reported | — | |
| Number of incontinent episodes | Not reported | — | — | |
| Number of incontinent episodes daytime and night‐time, urinary symptoms | Barthel Index – continence item | — | — | |
| Maximum cystometric capacity, bladder compliance, detrusor leak point pressure. Number of incontinence episodes per day, urinary symptoms | Urodynamic assessment according to AUA/SUFU guidelines | None reported | — | |
| Primary outcome not stated | — | Number of incontinent episodes, urodynamic assessment, voiding diary | OABSS | |
| ADL | Barthel Index | |||
| Primary outcome not stated | — | Number of incontinent episodes, urodynamic assessment, voiding diary | OABSS | |
| ADL | Barthel Index | |||
| Primary outcome not stated | — | Urinary symptoms | Barthel Index (Bladder item) | |
| Primary outcome not stated | — | Contractility and muscle activity of the pelvic floor muscle | Perineometer and pelvic floor electromyography | |
| Urinary symptoms | Bristol Female Lower Urinary Tract Symptoms Questionnaire | |||
| Primary outcome not stated | — | Urinary symptoms | Scoring of urinary symptoms control score (0 = totally controlled, 1 = partial control, 2 = fully no control) | |
| Postvoid residual urine | Bladder scan | |||
| Number of incontinent episodes, number of pads used, frequency 24‐hour home pad test | 3‐day voiding diary | Vaginal palpation of PFM | Physical examination | |
| Urinary symptoms, frequency and severity | DAN‐PSS‐1 questionnaire | Digital anal palpation of PFM | Physical examination | |
| Frequency, number of incontinence episodes, number of pads used | 3‐day voiding diary | Health status | SF‐36 | |
| 24‐hour pad test | Pad test | |||
| Number of people with urinary incontinence | Not reported | — | — | |
| Number of people with urinary incontinence | Not reported | — | — | |
| Number of people with urinary incontinence | Not reported | — | — |
ADL: activities of daily living; AUASI: American Urological Association Symptom Index; AUA/SUFU: American Urological Association/Society of Urodynamics, Female Pelvic Medicine and Urogenital Reconstruction guidelines; DAN‐PSS‐1: Danish Prostatic Symptom Score; EQ‐5D‐5L: EuroQol Five‐Dimensional Questionnaire; ICIQLUTSqol: International Consultation on Incontinence Questionnaire ‐ Lower Urinary Tract Symptoms Quality of Life; ICIQ‐UI‐SF: International Consultation on Incontinence Questionnaire‐Urinary Incontinence‐Short Form; OABSS: Overactive Bladder Symptom Score; PFM: pelvic floor muscle; SF‐36: 36‐Item Short Form Survey.
Excluded studies
We excluded 27 studies. Reasons for exclusion can be found in the Characteristics of excluded studies but are summarised below.
-
Four studies did not include a measure of continence (Cook 1998; Gross 1990; Humphreys 2014; Moon 2012).
-
Five studies recruited participants in the acute phase of stroke (Gong 2013; Thomas 2011; Wikander 1998; Yun 2007; Zhu 2003); in addition to recruitment in the acute phase, Yun 2007 did not include a measure of continence.
-
Six studies had stroke participants as a subgroup within their overall participants but data for these participants were not available or reported (Engberg 2002; Kuo 2007; McDowell 1999; NCT00213577; Sakakibara 2008; Stohrer 2013).
-
Six studies did not include participants with stroke (EUCTR2009‐009216‐53‐PT; Gousse 2007; Kim 2003; Madersbacher 2004; Madersbacher 2005; Vinsnes 2010).
-
Three studies were terminated due to poor recruitment and reported no data (Byles 2006; NCT01275261; Shin 2016c).
-
We were unable to trace the author for further publications or information for two studies (ISRCTN97151578; Smilskalne 2009).
-
One study did not directly test a method of promoting continence (Tekeoglu 1998).
Studies awaiting classification
We classified three studies as awaiting further assessment (ACTRN12617000162314; ChiCTR‐INR‐16010239; Wang 2014). Please see the Characteristics of studies awaiting classification for details.
Ongoing studies
We identified two potentially eligible studies that are still ongoing (NCT02568774; Shin 2016b). For more information, please see the Characteristics of ongoing studies.
Risk of bias in included studies
The risk of bias judgements are summarised in Figure 2 and Figure 3, and described in the 'Risk of bias' tables in the Characteristics of included studies.

Risk of bias graph: review authors' judgements about each risk of bias item presented as percentages across all included studies.

Risk of bias summary: review authors' judgements about each risk of bias item for each included study.
Allocation
Random sequence generation
Nine trials reporting 10 comparisons were at low risk of bias for random sequence generation (Booth 2016; Brittain 2000b; Chu 2011; Judge 1969; Liu 2016a and Liu 2016b; Shin 2016a; Song 2013; Tibaek 2005; Tibaek 2017). The remaining trials were at unclear risk of bias.
Allocation (selection bias)
Three trials reporting four comparisons were at low risk of bias for allocation concealment (Booth 2016; Judge 1969; Liu 2016a and Liu 2016b). The remaining trials were at unclear risk of bias.
Blinding
Blinding of participants and personnel (performance bias)
Eight trials reporting nine comparisons were at low risk of bias for blinding of participants or personnel, or both (Booth 2016; Brittain 2000b; Judge 1969; Liu 2013; Liu 2016a and Liu 2016b; Shin 2016a; Tibaek 2005; Tibaek 2017). The remaining trials were at unclear risk of bias.
Blinding of outcome assessment (detection bias)
Six trials reporting seven comparisons were at low risk of bias for blinding of outcome assessors (Booth 2016; Brittain 2000b; Liu 2013; Liu 2016a and Liu 2016b; Shin 2016a; Tibaek 2017). The remaining trials were at unclear risk of bias.
Incomplete outcome data
Eight trials reporting nine comparisons were at low risk of bias in relation to incomplete outcome data (Chu 2011; Judge 1969; Liu 2006; Liu 2016a and Liu 2016b; Tibaek 2017; Zhang 1996; Zhang 2002; Zhou 1999). Two trials were at high risk of bias due to the large amount of attrition (Brittain 2000b), and lack of prespecification of outcomes (Chu 1997). The remaining trials were at unclear risk of bias.
Selective reporting
One study was at low risk of reporting bias as it had a published protocol (Booth 2016). The remaining studies were at unclear risk of bias as there were no study protocols available.
Other potential sources of bias
Eleven trials reporting 12 comparisons were free from other sources of bias (Booth 2016; Brittain 2000b; Chu 2011; Guo 2014; Liu 2006; Liu 2013; Liu 2016a and Liu 2016b; Monteiro 2014; Shin 2016a; Tibaek 2005; Tibaek 2017). Two trials were at high risk of other bias due to insufficient description of care received by the comparison group and no assessment of participant characteristics at baseline respectively (Chu 1997; Zhang 1996). The remaining trials were at unclear risk of bias.
None of the trials reported power calculations, with the exception of Tibaek 2017. Booth 2016 explicitly did not use a power calculation as this was a feasibility trial.
Effects of interventions
See: Summary of findings for the main comparison Behavioural interventions compared with usual care or no treatment for treating urinary incontinence after stroke; Summary of findings 2 Specialised professional input interventions compared with usual care or no treatment for treating urinary incontinence after stroke; Summary of findings 3 Complementary therapy interventions compared with usual care or no treatment for treating urinary incontinence after stroke; Summary of findings 4 Physical therapy interventions compared with usual care or no treatment for treating urinary incontinence after stroke
For information relating to the quality of evidence for behavioural, specialised professional input, complementary therapy and physical therapy interventions for the main comparison (intervention versus no intervention/usual care), please refer to summary of findings Table for the main comparison, summary of findings Table 2, summary of findings Table 3 and summary of findings Table 4.
Data for prespecified outcomes were not available for each comparison except where reported below.
Intervention versus no intervention/usual care (comparison 1)
Twelve trials reporting 13 comparisons with 986 participants compared an intervention to promote urinary continence against no intervention or usual care (Brittain 2000b; Chu 1997; Gelber 1997a; Guo 2014; Liu 2006; Liu 2016a and Liu 2016b; Shin 2016a; Song 2013; Tibaek 2005; Tibaek 2017; Zhang 2002; Zhou 1999). The interventions included:
-
behavioural interventions
-
timed voiding versus void on request (usual care) (Gelber 1997a)
-
PFMT versus usual care (Shin 2016a; Tibaek 2005; Tibaek 2017)
-
-
specialised professional input interventions
-
care from a CNP versus usual care provided by a GP (Brittain 2000b)
-
-
complementary therapy interventions
-
scalp acupuncture versus no scalp acupuncture (Chu 1997)
-
eye acupuncture and scalp electroacupuncture versus no acupuncture (Zhou 1999)
-
knee and ankle acupuncture versus usual care (Zhang 2002)
-
ginger‐salt‐partitioned moxibustion plus routine acupuncture (multiple points) versus routine acupuncture (Liu 2006)
-
electroacupuncture (multiple points) versus indwelling catheter (Song 2013)
-
-
physical therapy interventions
No data were available for the other interventions.
Primary outcomes
Number of participants continent after treatment
Six trials (including 766 people) reported the number of participants who were continent after treatment (Brittain 2000b; Chu 2011; Liu 2006; Song 2013; Zhang 2002; Zhou 1999). Random‐effects models were used for the meta‐analysis because of heterogeneity. The six trials included one specialised professional input intervention (Brittain 2000b); and five complementary therapy interventions (Chu 2011; Liu 2006; Song 2013; Zhang 2002; Zhou 1999).
Specialised professional input interventions
Based on one trial of moderate‐quality, specialist professional input interventions in the form of structured assessment and management probably made little or no difference to the number of people continent at three months after treatment (RR 1.28, 95% CI 0.81 to 2.02; Brittain 2000b; Analysis 1.1.1; summary of findings Table 2). At six months, the CNP intervention may have made little or no difference to the number of people continent after treatment (16/91 (17.5%) in the treatment group versus 8/55 (14.6%) in the control group; RR 0.96, 95% CI 0.83 to 1.11; analysis not shown; Brittain 2000b).
Complementary therapy interventions
Acupuncture and ginger‐salt‐partitioned moxibustion may have increased the number of participants continent after treatment (RR 2.82, 95% CI 1.57 to 5.07; 524 participants; low‐quality evidence; Chu 2011; Liu 2006; Song 2013; Zhang 2002; Zhou 1999; Analysis 1.1.2; summary of findings Table 3). Studies were heterogeneous (I² = 78%) but favoured complementary therapy using the random‐effects model. Visual inspection of the forest plot suggested there was a larger effect size in Chu 2011 and Zhang 2002. It is difficult to suggest a possible explanation for this difference in treatment effect. However, Chu 2011 was the only trial to use electroacupuncture rather than acupuncture and Zhang 2002 included younger participants, ranging from 42 to 62 years.
Number of incontinent episodes
Behavioural interventions
One trial measured the mean number of incontinent episodes in 24 hours (Tibaek 2005). Behavioural interventions may have made little or no difference to the number of incontinent episodes (MD –1.00, 95% CI –2.74 to 0.74; 26 participants; P = 0.26; low‐quality evidence; Analysis 1.2.1; summary of findings Table for the main comparison). Tibaek 2017 reported the number of incontinent episodes in 24 hours post‐intervention was very small, with no episodes in either the intervention or control group.
One trial compared timed voiding versus void on request, which was interpreted as usual care (Gelber 1997a). The data reported were too few even for tentative conclusions and we obtained no further data from the investigators. This study was reported as ongoing in a conference abstract.
Physical therapy interventions
TENS may have reduced the mean number of incontinent episodes in 24 hours (MD –4.76, 95% CI –8.10 to –1.41; 142 participants; low‐quality evidence; Guo 2014; Liu 2016a and Liu 2016b; Analysis 1.2.2; summary of findings Table 4). There was a high level of heterogeneity (I² = 94%) but findings favoured TENS using the random‐effects model. Visual inspection of the forest plot suggested there was a larger effect size in Liu 2016a and Liu 2016b. A possible explanation for this difference in treatment effect may come from the number of days patients received TENS (Guo 2014: mean number of days 48.7 (SD 10.5); Liu 2016a: mean number of days 65.96 (SD 9.39); Liu 2016b: mean number of days 71.01 (SD 14.86)).
Perception of improvement or cure
None of the trials reported perception of improvement or cure.
Secondary outcomes
Urinary symptoms – overall urinary symptoms, mean number of symptoms and leakage scores
Specialised professional input interventions
In Brittain 2000b, the CNP intervention may have slightly improved the proportion cured of all four urinary symptoms (frequency, nocturia, urgency and urinary incontinence) at three months. The number of participants cured of all four urinary symptoms was 24.7% in the treatment group versus 17.9% in the control group (147 participants).
At six months, Brittain 2000b found a larger proportion of people were cured of all four urinary symptoms in the treatment group (41/89; 46.1%) compared with the control group (16/54; 29.6%) (RR 1.55, 95% CI 0.97 to 2.48, Analysis 1.3.1).
There were no data suitable for analysis in relation to changes in daytime and night‐time leakage scores. However, the study teams reported that the CNP intervention possibly improved the daytime severity of leakage at three months (P = 0.038).
There were no data suitable for analysis in relation to changes in the mean number of symptoms. However, the CNP intervention may have slightly reduced the total number of symptoms experienced at three months (P < 0.01). The intervention may have made little or no difference to the total number of overall symptoms at six months (P = 0.06; Brittain 2000b).
Urinary symptoms – frequency
Behavioural interventions
Data from two trials (48 participants) suggests that PFMT may have slightly improved mean daytime voiding frequency (MD –1.71, 95% CI –3.02 to –0.40; 48 participants; Tibaek 2005; Tibaek 2017; Analysis 1.4.1). There was no heterogeneity (I² = 0%).
Tibaek 2017 followed up participants for six months. We are uncertain whether PFMT reduced voiding frequency: mean daytime frequency was 6.8 (SD 3.2) in the treatment group and 8 (SD 3) in the control group; mean night‐time frequency was 2.1 (SD 1.7) in the treatment group and 2.2 (SD 1.6) in the control group (19 participants).
Specialised professional input interventions
In Brittain 2000b, there was no evidence that the CNP intervention made any difference to urinary frequency at three months (98/120 (82%) in the treatment group versus 59/67 (88%) in the control group; RR 0.93, 95% CI 0.82 to 1.05; 187 participants; Analysis 1.5.1).
At six months, the CNP intervention may have made little or no difference to urinary frequency (73/89 (82%) in the treatment group versus 47/54 (87%) in the control group; RR 0.94, 95% CI 0.82 to 1.09).
Complementary therapy interventions
One small trial suggested ginger‐salt‐partitioned moxibustion plus routine acupuncture may have reduced mean daytime voiding frequency (Liu 2006). The mean frequency of episodes was 7.03 in the intervention group compared with 12.6 in the control group (MD –5.57, 95% CI –7.00 to –4.14; 62 participants; Analysis 1.4.2).
There were no data suitable for analysis in the trial of scalp acupuncture versus no scalp acupuncture (Chu 1997). After two weeks and two courses of treatment, the investigators reported a reduction in urinary frequency or incontinence of 90.3% in the intervention group, with two people not regaining "normal urine," 12 people partly regaining "normal urine" and 16 people regaining "normal urine". The authors reported a significant difference between the experimental and control groups as "p (0.05˜0.001)." There were no reported results for the control group. The study authors provided no further data.
Physical therapy interventions
Based on two trials, one reporting two comparisons, TENS may have made no difference to daytime frequency (MD –2.83, 95% CI –5.75 to 0.09; 142 participants; Guo 2014; Liu 2016a and Liu 2016b; Analysis 1.4.3). The trials were heterogeneous (I² = 93%). Visual inspection of the forest plot suggested there was a larger effect size in Liu 2016a and Liu 2016b. As we describe above in relation to Analysis 1.2.2, a possible explanation for this difference in treatment effect may come from the number of days patients received TENS (Guo 2014: mean number of days 48.7 (SD 10.5) days; Liu 2016a: mean number of days 65.96 (SD 9.39) days; Liu 2016b: mean number of days 71.01 (SD 14.86)).
Urinary symptoms – urgency
Specialised professional input interventions
In Brittain 2000b, there was no evidence that the CNP intervention made a difference to urgency at three months. The number of people reporting urgency was 95/121 (79%) in the treatment group compared with 50/67 (75%) in the control group (RR 1.05, 95% CI 0.89 to 1.24; 188 participants; Analysis 1.6.1).
At six months, the CNP intervention may have made little or no difference to urinary urgency (65/91 (71.4%) in the treatment group versus 40/54 (74%) in the control group; RR 0.96, 95% CI 0.79 to 1.18).
Urinary symptoms – nocturia
Behavioural interventions
Two trials suggested PFMT may have made little or no difference in reducing nocturia (MD –0.38, 95% CI –1.06 to 0.29; 48 participants; P = 0.26, I² = 25%; Tibaek 2005; Tibaek 2017; Analysis 1.7.1). This analysis used a random‐effects model as it was not readily possible to switch a subgroup analysis to a fixed‐effect model.
Specialised professional input interventions
One trial suggested the CNP intervention may have made little or no difference to nocturia (Brittain 2000b). The number of people reporting nocturia at three months was 102/119 (86%) in the treatment group versus 60/67 (90%) in the control group (RR 0.96, 95% CI 0.86 to 1.07; Analysis 1.8.1).
At six months, the CNP intervention may also have made little or no difference to nocturia (77/89 (87%) in the treatment group versus 46/53 (87%) in the control group; RR 1.00, 95% CI 0.87 to 1.14).
Complementary therapy interventions
Two trials looking at ginger‐salt‐partitioned moxibustion and electroacupuncture respectively suggested that complementary therapies may have made little or no difference in reducing nocturia (MD –1.76, 95% CI –4.49 to 0.96; 256 participants; P = 0.20; Liu 2006; Song 2013; Analysis 1.7.2). The trials were heterogeneous (I² = 98%). Visual inspection of the forest plot suggested there was a larger effect size in Liu 2006. A possible explanation for this difference in treatment effect could relate to the sample size: Liu 2006 had 62 participants included in the analysis, whereas Song 2013 had 194. Furthermore, the control group in Song 2013 had an indwelling catheter inserted: this is usually only justified if there are specific clinical reasons for insertion (for example when fluid balance is critical) given the high risk of urinary tract infection (ISWP 2016).
Physical therapy interventions
One trial suggested TENS may have improved nocturia (MD –1.52, 95% CI –1.73 to –1.31; 61 participants; Analysis 1.7.3; Guo 2014).
Physical measures
Behavioural interventions
One trial suggested PFMT may have made little or no difference to the mean function of the pelvic floor muscle (MD 0.10, 95% CI –0.48 to 0.68; 23 participants; Tibaek 2005; Analysis 1.9.1).
One trial reported median pelvic floor muscle strength post‐intervention of 5 (IQR 4 to 6) in the treatment group versus 4 (IQR 4 to 5) in the control group; 30 participants; P = 0.07; Tibaek 2017).
One trial followed up participants for six months. We were uncertain whether PFMT improved pelvic floor muscle strength (median 5 (IQR 4 to 6) in the treatment group versus 4 (IQR 3 to 5) in the control group; 24 participants; P = 0.15; Tibaek 2017.
Health status and quality of life
Behavioural interventions
There was no evidence from one trial that PFMT made a difference to the mean total score of the SF‐36 (MD –28.00, 95% CI –169.66 to 113.66; 24 participants; Tibaek 2005; Analysis 1.10).
One trial measured quality of life using the mean total score on the IIQ (Tibaek 2005), and one trial used the Bristol Female Lower Urinary Tract Symptoms Questionnaire (quality of life items) (Shin 2016a). Data from these two trials provided no evidence of a difference to quality of life (SMD –0.99, 95% CI –2.83 to 0.86; 55 participants; low‐quality evidence; Shin 2016a; Tibaek 2005; Analysis 1.11.1; summary of findings Table for the main comparison). The trials were heterogeneous (I² = 90%). Visual inspection of the forest plot suggested there was a larger effect size in Shin 2016a . It is difficult to suggest a possible explanation for this difference in treatment effect, however Shin 2016a included participants around six months post‐stroke whereas Tibaek 2005 included participants around 12 months post‐stroke.
One trial measured health status using the SF‐36 pre‐ and post‐intervention (Tibaek 2017). There were no significant differences reported and data were unsuitable for pooling.
One trial followed up participants for six months (Tibaek 2005). We were uncertain whether PFMT improved health status. Total scores on the SF‐36 were 550 (SD 170) in the treatment group (12 participants) and 596 (SD 124) in the control group (12 participants) (P = 0.6; Tibaek 2005). Higher scores on the SF‐36 indicate a more favourable health status. There was no evidence that PFMT changed quality of life at six months: scores on the IIQ were 43 (SD 76) in the treatment group (12 participants) and 47 (SD 50) in the control group (11 participants) (P = 0.45).
One trial followed up participants for six months (Tibaek 2017). We were uncertain whether PFMT improved health status measured by the SF‐36 (30 participants).
Functional ability
Physical therapy interventions
Two comparators of one three‐arm trial (81 participants) measured function using the Barthel Index (Liu 2016a and Liu 2016b). TENS (Liu 2016a: 20 Hz; Liu 2016b: 75 Hz frequencies) probably improved overall functional ability (MD 8.97, 95% CI 1.27 to 16.68; moderate‐quality evidence; Analysis 1.12).
Participant satisfaction
Specialised professional input interventions
One trial measured participant satisfaction with the service (Brittain 2000b). The CNP intervention may have improved participant satisfaction at three months (dissatisfaction: 13/109 (12%) in the treatment group versus 17/45 (38%) in the control group; RR 0.32, 95% CI 0.17 to 0.59; Analysis 1.13).
Adverse events
In Song 2013, 45/136 (33%) of participants in the intervention group reported bruising on arms and torso with full recovery; 17/136 (13%) had abdominal pain postacupuncture with resolution after warm compress. There were no other adverse effects.
Three trials reporting four comparisons reported no adverse events (Guo 2014; Liu 2016a and Liu 2016b; Tibaek 2017). Four trials reported no information on adverse events (Brittain 2000b; Gelber 1997a; Shin 2016a; Tibaek 2005). In four trials, it was unclear if any adverse events occurred (Chu 1997; Liu 2006; Zhang 2002; Zhou 1999).
Intervention versus placebo (comparison 2)
Three trials with 137 participants compared an intervention to promote urinary continence against placebo (Booth 2016; Judge 1969; Liu 2013). One reported on a physical therapy intervention (Booth 2016), one reported on pharmacotherapy in the form of oestrogen (Judge 1969), and the other reported on complementary therapy (Liu 2013).
Primary outcomes
Number of participants continent after treatment
Physical therapy interventions
Data from one trial provided no evidence that transcutaneous posterior nerve stimulation made a difference to the number of participants continent at 12 weeks (Booth 2016). The trial reported that 3/27 (11.1%) participants in the treatment group were continent compared with 4/27 (14.8%) in the sham intervention group (RR 0.75, 95% CI 0.19 to 3.04; Analysis 2.1).
Number of incontinent episodes
Physical therapy interventions
Data from one trial provided no evidence that TPTNS made a difference to the number of incontinence episodes (MD –1.10, 95% CI –3.99 to 1.79; 39 participants; Booth 2016; Analysis 2.2).
One trial followed up participants for six months (Booth 2016). It is uncertain whether TPTNS reduced the number of UI episodes at follow‐up (odds ratio (OR) 1.43, 95% CI 0.38 to 5.32).
Pharmacotherapy interventions
One small cross‐over trial compared an intervention designed to promote urinary continence (oestrogen) against placebo in a long‐term care setting in 12 women with a history of stroke (Judge 1969). The trial reported results separately for participants with mild or severe incontinence and in view of the significant heterogeneity between the two groups, we used a random‐effects model.
There was no evidence that oestrogen therapy made a difference to the mean number of incontinent episodes per week in mild incontinence (paired samples for mild incontinence, MD –1.71, 95% CI –3.51 to 0.09; Analysis 2.3.1) or severe incontinence (paired samples, MD –6.40, 95% CI –9.47 to –3.33; Analysis 2.3.2).
Perception of improvement or cure
Physical therapy interventions
One trial reported that a single Patient Perception of Bladder Condition question suggested improvement in the TPTNS group at the 26‐week time point (OR 0.04, 95% CI 0.004 to 0.41; Booth 2016). There was no evidence of a difference in perceived bladder condition at six weeks (OR 2.33, 95% CI 0.63 to 8.65) and 12 weeks (OR 1.22, 95% CI 0.29 to 5.17).
Secondary outcomes
Urinary symptoms
Complementary therapy interventions
One trial (71 participants) found that acupuncture may have reduced the frequency of urination and UI (Liu 2013). The frequency of urination and UI were lower after electroacupuncture than before treatment (urination: P = 0.03; UI P = 0.01); these differences were not observed in the control group (urination: P = 0.71; UI: P = 0.68). The frequency of urination and UI were lower in the electroacupuncture group than in the control group immediately after intervention (urination: P = 0.03; UI: P = 0.03). These differences remained after at least five months (intervention: urination: P = 0.04; UI: P = 0.01; control: urination P = 0.03; UI: P = 0.01); with differences lasting up to at least five months (P < 0.05 for all outcomes). Formal comparisons were not conducted as suitable data were not received from study authors.
Physical therapy interventions
Booth 2016 reported no evidence of a difference in urgency between groups at weeks 12 and 26 (week 12: OR 0.49, 95% CI 0.13 to 1.87; week 26: OR 0.68, 95% CI 0.18 to 2.59). The trial also reported no evidence of a difference in frequency between groups at weeks 12 and 26 (week 12: OR 0.45, 95% CI 0.11 to 1.84; week 26: OR 0.41, 95% CI 0.12 to 1.44). There was no evidence of an effect for nocturia at weeks 12 or 26 (week 12: OR 1.07, 95% CI 0.22 to 5.05; week 26: OR 0.73, 95% CI 0.16 to 3.32).
Physical measures
Complementary therapy interventions
One trial (66 participants) measured detrusor overactivity using maximum cystometric capacity and bladder compliance and detrusor leak point pressure (Liu 2013). However, data were reported as change from baseline in the intervention arm only and was not comparative. Therefore, the data were unusable.
Health status and quality of life
Physical therapy interventions
Data from one trial provided no evidence that transcutaneous posterior nerve stimulation made a difference to quality of life measured with the International Consultation on Incontinence Questionnaire – Lower Urinary Tract Symptoms Quality of Life questionnaire (ICIQLUTSqol) (MD 3.90, 95% CI –4.25 to 12.05; 30 participants; Booth 2016; Analysis 2.4).
One trial reported quality of life using the EQ‐5D‐5L (Booth 2016). The EQ‐5D‐5L means were calculated as the average of the utilities at each time point of the trial. The calculation was done separately for each trial arm. Every participant's EQ‐5D‐5L response was translated into a utility score using the UK tariff and the mean utility was calculated across participants for each trial arm. The maximum possible score for a utility was 1 for a perfect health response in each of the five dimensions, the minimum was a negative number around –0.4 as reported in the UK tariff. There was no evidence of a difference between groups; both groups improved over time with a mean improvement of around 23%. Baseline scores were 0.435 (SD 0.331) in the treatment group and 0.500 (SD 0.273) in the control group.
Functional ability
None of the trials reported functional ability.
Participant satisfaction
None of the trials reported participant satisfaction.
Adverse events
In Booth 2016, one (3.7%) participant in the intervention group and one (3.7%) participant in the sham group had residual urine volume of more than 150 mL at the six‐week bladder scan. One participant (group unclear) had minor skin irritation and one participant (group unclear) reported ankle cramping. One trial reported no adverse events (Judge 1969). One trial reported no information on adverse events (Liu 2013).
Specific intervention versus another intervention (comparison 3)
Two trials with 76 participants compared a specific intervention with another intervention (Gelber 1997b; Zhang 1996).
Zhang 1996 reported on complementary therapy. Gelber 1997b compared a behavioural intervention (timed voiding) with a pharmacotherapy intervention (oxybutynin). However, the data were too few for useful analysis and no further data could be obtained from the investigators. This study was reported as ongoing in a conference abstract.
Primary outcomes
Number of participants continent after treatment
Complementary therapy interventions
One trial compared different acupuncture needles and depth of needle insertion to assess the effect on incontinence in 57 participants (Zhang 1996). The elongated needle was inserted to a depth of five Cun (Chinese inches; one of which is equivalent to the width of a thumb) and compared with a filiform needle inserted to a depth of 1.5 Cun. The study authors reported that, after four courses of treatment, 25 (78.1%) participants in the elongated needle group were 'cured' (no incontinent episodes) versus 10 (40%) in the filiform needle group.
Number of incontinent episodes
None of the trials reported the number of incontinent episodes.
Perception of improvement or cure
None of the trials reported perception of improvement or cure.
Secondary outcomes
Urinary symptoms
None of the trials reported urinary symptoms.
Physical measures
None of the trials reported physical measures.
Health status and quality of life
None of the trials reported health status or quality of life.
Functional ability
None of the trials reported functional ability.
Participant satisfaction
None of the trials reported participant satisfaction.
Adverse events
None of the trials reported information on adverse events.
Combined intervention versus single intervention (comparison 4)
One trial (23 participants) compared a combined intervention (sensory motor biofeedback plus timed prompted voiding) designed to promote urinary continence against a single intervention (timed voiding) (Lewis 1990).
Primary outcomes
Number of participants continent after treatment
One trial compared a combined intervention (sensory motor biofeedback plus timed prompted voiding) designed to promote urinary continence against a single intervention (timed voiding) (Lewis 1990). There was no evidence that the combined intervention made a difference to the number of participants continent (1/11 (9%) in the combined intervention group versus 2/12 (16.7%) in the control group; RR 0.55, 95% CI 0.06 to 5.21; Analysis 4.1.1).
Number of incontinent episodes
The combined intervention tested (sensory motor biofeedback plus timed prompted voiding versus timed prompted voiding) may have made a difference to the mean number of incontinent episodes; the control group reported fewer episodes of incontinence (3.5) compared with 5.7 in the combined group (MD 2.20, 95% CI 0.12 to 4.28; Lewis 1990; Analysis 4.2.1).
Perception of improvement or cure
The trial did not report perception of improvement or cure.
Secondary outcomes
Urinary symptoms
The trial did not report urinary symptoms.
Physical measures
The trial did not report physical measures.
Health status and quality of life
The trial did not report health status or quality of life.
Functional ability
The trial did not report functional ability.
Participant satisfaction
The trial did not report participant satisfaction.
Adverse events
The trial did not report any information on adverse events.
Specific intervention versus attention control (comparison 5)
One trial with 24 participants compared a specific intervention (TPTNS) with attention control (stretching exercises) (Monteiro 2014).
Primary outcomes
Number of participants continent after treatment
Data from one trial (24 participants) found no evidence that TPTNS made a difference to the number of participants continent after treatment compared to an attention control group undertaking stretching exercises (Monteiro 2014). The trial reported 4/12 (33.3%) participants in the intervention group were continent on completion of the 45‐day intervention period compared with 3/12 (25%) participants in the attention control group (RR 1.33, 95% CI 0.38 to 4.72; Analysis 5.1.1).
One trial (24 participants) followed up participants for 12 months (Monteiro 2014). We were uncertain whether electrical stimulation of the posterior tibialis nerve improved urge incontinence: three (25%) participants in the electrical stimulation group reported no urge incontinence compared with four (33%) participants in the placebo group (P = 0.67).
Number of incontinent episodes
The trial did not report number of incontinent episodes.
Perception of improvement or cure
The trial did not report perception of improvement or cure post‐intervention (Monteiro 2014).
One study followed up participants for 12 months (Monteiro 2014). Electrical stimulation of the posterior tibial nerve may have made a difference to subjective improvement in symptoms (12 (100%) participants in the electrical stimulation group versus three (25%) participants in the placebo group; P = 0.001).
Secondary outcomes
Urinary symptoms
Post‐intervention, one study found seven (58%) participants reported urinary urgency in the treatment group compared with 10 (83%) participants in the attention control group (P = 0.18; Monteiro 2014). Five (42%) participants in the treatment group had nocturia post‐intervention compared with nine (75%) participants in the attention control group (P = 0.09).
One study (24 participants) followed up participants for 12 months (Monteiro 2014). We are uncertain whether electrical stimulation of the posterior tibialis nerve improved urinary urgency: six (50%) participants in the electrical stimulation group reported urgency compared with nine (75%) participants in the placebo group (P = 0.20). Electrical stimulation of the posterior tibial nerve may have made a difference to nocturia at 12 months: one (8%) participant in the TPTNS group had nocturia compared with six (50%) participants in the attention control group (P = 0.02).
Physical measures
The trial did not report physical measures.
Health status and quality of life
The trial did not report health status or quality of life.
Functional ability
The trial did not report functional ability.
Participant satisfaction
The trial did not report participant satisfaction.
Adverse events
The trial did not report any information on adverse events.
Subgroup analysis
It was not possible to conduct planned subgroup analyses of the effect of urological diagnosis or time from stroke onset to recruitment to the trial due to lack of available data.
Discusión
Resumen de los resultados principales
Debido a que hay muchas razones por las que las intervenciones de incontinencia urinaria podrían funcionar de otro modo en los pacientes con accidente cerebrovascular en comparación con la población en general, la revisión procuró considerar los efectos (beneficiosos y perjudiciales) de todas las intervenciones diseñadas para tratar la incontinencia urinaria después del accidente cerebrovascular en adultos. Los estudios experimentales examinaron una gama amplia de tipos de intervención. Las intervenciones también fueron variables dentro de las categorías de intervención, por ejemplo los tipos de acupuntura (tradicional o electroacupuntura) y las áreas del cuerpo usadas para la inserción de agujas.
Intervenciones conductuales
Cinco ensayos evaluaron las intervenciones conductuales como el vaciamiento intermitente y la EMPP. Todos los ensayos tuvieron tamaños de la muestra muy pequeños (menos de 50 participantes) y los datos publicados limitados para el resultado principal del número de personas continentes después del tratamiento no permitieron el metanálisis. Hubo evidencia de un ensayo de que las intervenciones conductuales pueden reducir el número medio de episodios de incontinencia en 24 horas (Tibaek 2005), mientras que dos ensayos indican que la EMPP puede mejorar levemente la frecuencia miccional diurna media (Tibaek 2005; Tibaek 2017). Sin embargo, las intervenciones conductuales pueden lograr poco o ningún cambio en el estado de salud y la calidad de vida (Shin 2016a; Tibaek 2005; evidencia de baja calidad), los síntomas urinarios (frecuencia miccional nocturna) (Tibaek 2005; Tibaek 2017), o las medidas físicas (función del músculo del piso pelviano) en comparación con la atención habitual (Tibaek 2005).
Intervenciones con participación de profesionales especialistas
No existe evidencia de que la intervención administrada por enfermeras profesionales lograra un cambio en la polaquiuria o la urgencia tres meses más tarde. La intervención puede haber mejorado la satisfacción del participante con el servicio a los tres meses y la cantidad de personas continentes a los seis meses en comparación con la atención habitual (Brittain 2000b; evidencia de calidad moderada). La proporción de participantes para los que hubo resultados disponibles a los seis meses fue muy baja (63%) y algunos de los datos no pudieron analizarse.
Intervenciones terapéuticas complementarias
Lo tratamientos complementarios que emplean acupuntura, electroacupuntura y moxibustión con jengibre y sal pueden aumentar la cantidad de participantes continentes después del tratamiento en comparación con la atención habitual (Chu 2011; Liu 2006; Zhang 2002; Zhou 1999; evidencia de baja calidad), o el placebo (Liu 2013) y pueden reducir la media de la frecuencia miccional diurna en comparación con la atención habitual (Liu 2006). Sin embargo, no existe evidencia de una diferencia en la media de la frecuencia miccional nocturna (Liu 2006; Song 2013).
Estos ensayos informaron de detalles metodológicos escasos y es probable que la calidad fuera deficiente. Está poco claro si, y cómo, estas intervenciones son transferibles a los servicios sanitarios de otros países. Además, los estudios más nuevos informaron el uso de electroacupuntura mientras que los estudios anteriores usaron acupuntura tradicional. Hubo una amplia variación dentro de las intervenciones de acupuntura en cuanto al punto de acupuntura proyectado.
Intervenciones de farmacoterapia
En el ensayo cruzado (cross‐over) pequeño que examinó el estrógeno oral versus placebo, hubo menos episodios de incontinencia por semana durante el tratamiento con estrógeno en las pacientes con incontinencia grave (Judge 1969). Sin embargo, sólo se conoce que los participantes tenían el antecedente de un accidente cerebrovascular. La media de edad elevada de los participantes del ensayo, la presencia de confusión y falta de movilidad y el ámbito en que se realizó el ensayo (dos hospitales de geriatría) sugieren que los problemas de continencia pueden haber sido secundarios a otros trastornos además del accidente cerebrovascular. Por este motivo, es problemático generalizar estos resultados a todas mujeres después de un accidente cerebrovascular. Además, la dosis prescrita no estuvo de acuerdo con las recomendaciones actuales. El tratamiento de reemplazo hormonal ahora se considera ampliamente contraindicado en las pacientes que han sufrido, o están en riesgo de, un accidente cerebrovascular y hay evidencia de que el estrógeno aumenta la incontinencia en las mujeres posmenopáusicas (Hendrix 2005).
Falta evidencia acerca de si las muchas otras formas de intervención que han demostrado tener cierta utilidad en la población general serían también pertinentes para los pacientes que sufren un accidente cerebrovascular. En particular, no existen resultados utilizables de los ensayos que analizan el uso de relajantes vesicales como los anticolinérgicos o los programas de vaciamiento intermitente o de entrenamiento vesical, las ayudas físicas y las intervenciones del estilo de vida o ambientales.
Intervenciones con fisioterapia
En comparación con la atención habitual, la fisioterapia con neuroestimulación eléctrica transcutánea puede reducir el número medio de episodios de incontinencia en 24 horas (Guo 2014; Liu 2016a and Liu 2016b; evidencia de baja calidad), reducir la nocturia (Guo 2014) y probablemente mejorar la capacidad funcional (Liu 2016a and Liu 2016b; evidencia de calidad moderada). Sin embargo, las intervenciones de fisioterapia pueden lograr poco o ningún cambio en la frecuencia miccional diurna (Guo 2014; Liu 2016a and Liu 2016b).
En comparación con placebo, la fisioterapia logra poco o ningún cambio en el estado de salud, la calidad de vida o la cantidad de episodios de incontinencia (Booth 2016). Booth 2016 fue un ensayo de factibilidad con 54 participantes y no estuvo diseñado para evaluar la efectividad.
Compleción y aplicabilidad general de las pruebas
El tema principal de interés en los estudios incluidos es la mezcla de categorías de intervención, incluidas las terapias físicas, conductuales y complementarias, los fármacos y las intervenciones con participación de profesionales, como el uso de personal entrenado y métodos específicos de administrar la atención. Sin embargo, dentro de las categorías a menudo no fue posible combinar los estudios debido a que los datos no estaban en el formato apropiado. No se realizaron análisis de sensibilidad debido a que muy pocos estudios informaron los resultados de interés para cada tipo de comparación. No fue posible realizar el análisis de sensibilidad de acuerdo al riesgo bajo o alto de sesgo debido a que todos excepto uno de los estudios se clasificaron en riesgo poco claro de sesgo para el dominio del informe de resultado selectivo. La mayoría de los estudios estuvo en riesgo poco claro de sesgo en los dominios restantes del riesgo de sesgo.
Calidad de la evidencia
En términos generales, la evidencia fue de calidad moderada o baja (ver Resumen de resultados, tabla 1; "Resumen de resultados", tabla 2; "Resumen de resultados", tabla 3; "Resumen de resultados", tabla 4). Las razones más frecuentes para disminuir la calidad de la evidencia fueron:
-
el riesgo de sesgo de selección debido al informe insuficiente de la generación de la secuencia aleatoria y la ocultación de la asignación; y
-
la imprecisión debido al tamaño de la muestra pequeño.
Sólo tres ensayos tuvieron una muestra de 100 participantes o más (Brittain 2000b; Chu 2011; Song 2013); ocho tuvieron menos de 50 participantes (Gelber 1997a; Gelber 1997b; Judge 1969; Lewis 1990; Monteiro 2014; Shin 2016a; Tibaek 2005; Tibaek 2017). Los tamaños de la muestra pequeños dieron lugar a que los IC fueran amplios, lo cual dificultó la evaluación de si hubo alguna diferencia clínica o estadísticamente importante entre los grupos. La evidencia también puede estar sujeta al sesgo de estudio pequeño. Sólo cuatro ensayos (que informaron sobre cinco comparaciones) tuvieron una ocultación adecuada de la asignación (Booth 2016; Brittain 2000b; Judge 1969; Liu 2016a and Liu 2016b); muchos fueron limitados por el informe deficiente. En la mayoría fue imposible juzgar el grado en que quizá fueran proclives al sesgo. La revisión también estaba limitada por la falta de datos completos de cinco ensayos (Brittain 2000b; Chu 1997; Gelber 1997a; Gelber 1997b; Lewis 1990).
Sesgos potenciales en el proceso de revisión
El método de división del tamaño de la muestra a través de las comparaciones con más de un brazo de tratamiento puede no corregir los errores de unidad de análisis (Liu 2016a and Liu 2016b). Aunque esta técnica está de acuerdo con la descrita en el Manual Cochrane para las Revisiones Sistemáticas de Intervenciones, el uso de un método diferente (combinación de datos de brazos de tratamiento activo múltiples en un único brazo) puede haber tenido una repercusión sobre el Análisis 1.4.3 y el Análisis 1.12.1; aunque la cantidad general de datos disponibles fue pequeña.
El protocolo original para esta revisión especificó en los criterios de inclusión que los participantes debían haber tenido un accidente cerebrovascular en los 12 meses anteriores. Sin embargo, esta definición resultó inviable debido a que la mayoría de los ensayos no informó el tiempo desde el accidente cerebrovascular. El tiempo desde el accidente cerebrovascular fue de menos de tres meses en cinco estudios que informaron sobre seis comparaciones (Chu 2011; Guo 2014; Liu 2016a and Liu 2016b; Song 2013; Tibaek 2017). Un estudio informó que el tiempo desde el accidente cerebrovascular fue de aproximadamente seis meses (Shin 2016a). Booth 2016 tuvo un tiempo variable desde el accidente cerebrovascular hasta el reclutamiento (un 12,2% [seis] se reclutó en el plazo de tres meses desde el accidente cerebrovascular; un 20,4% [10] entre tres y seis meses después del accidente cerebrovascular; un 12,2% [seis] entre seis y 12 meses después del accidente cerebrovascular y un 55,1% [27] se reclutó más de 12 meses después del accidente cerebrovascular). También faltaba claridad acerca de si la incontinencia urinaria era posterior al accidente cerebrovascular; sólo 12 ensayos especificaron que los problemas de continencia urinaria fueron posteriores al accidente cerebrovascular.
Hubo datos muy limitados disponibles para el seguimiento a más largo plazo después del final del período de intervención. Cuando estuvieron disponibles, los períodos de seguimiento variaron de tres a 12 meses. Seis ensayos informaron los resultados más allá del período posintervención: Chu 2011; Guo 2014; Liu 2016a y Liu 2016b, Song 2013; Tibaek 2017 y Booth 2016 informaron los resultados a los tres y seis meses. Liu 2013 no informó los datos de los tres meses en un formato apropiado para la inclusión en la revisión. Tibaek 2005; Tibaek 2017 y Brittain 2000b informaron el seguimiento a los seis meses (en los últimos, hubo datos de seguimiento faltantes para 85 [37%] participantes) y Monteiro 2014 a los 12 meses.
La duración de la intervención también fue variable. La duración de la EMPP versus atención habitual varió de una intervención de seis semanas que constó de tres sesiones de 50 minutos por semana (Shin 2016a), a una intervención con una duración de 12 semanas (Tibaek 2005; Tibaek 2017). La duración de las intervenciones terapéuticas complementarias varió desde una semana (Chu 1997; Zhang 2002) a cuatro semanas (Song 2013; Zhou 1999).
No se conoce el grado en que los resultados pueden generalizarse a los pacientes con problemas de continencia exclusivamente como resultado del accidente cerebrovascular. Además, la información con respecto a la gravedad de la incontinencia en el momento del reclutamiento estaba poco clara en los ensayos. Es muy probable que haya habido diferencias en la gravedad de la incontinencia de los participantes basado en la evaluación de los criterios de inclusión de los ensayos para la “incontinencia” Los detalles de los criterios de inclusión para la incontinencia variaron desde participantes con “incontinencia urinaria” (Guo 2014); “episodios que ocurrieron por lo menos una vez a la semana” (Booth 2016); pérdida varias veces al mes o incontinencia de esfuerzo casi siempre, frecuencia cada media hora/hora, nocturia tres veces por noche o más y urgencia casi siempre (Brittain 2000b).
Acuerdos y desacuerdos con otros estudios o revisiones
Según lo que se conoce, no hay ningún otro estudio ni revisión comparable que administre intervenciones diseñadas para mejorar la continencia después del accidente cerebrovascular en la fase de rehabilitación de la recuperación del accidente cerebrovascular.
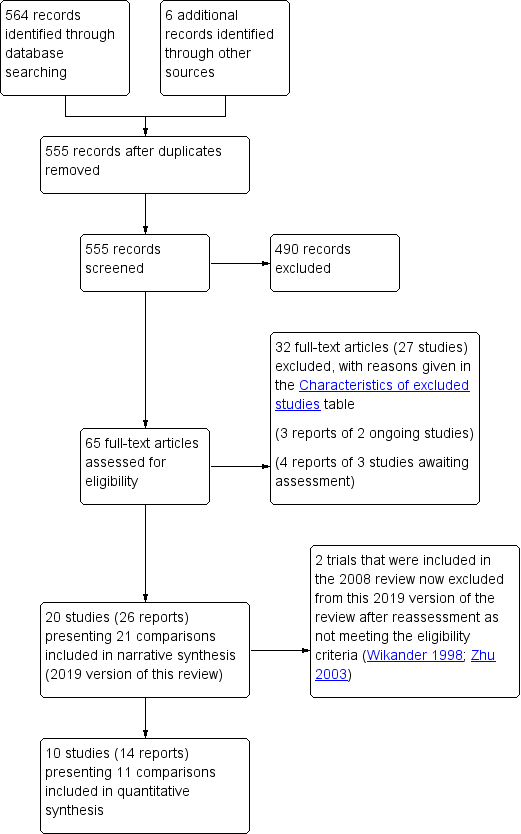
PRISMA study flow diagram (2019 review update).

Risk of bias graph: review authors' judgements about each risk of bias item presented as percentages across all included studies.

Risk of bias summary: review authors' judgements about each risk of bias item for each included study.
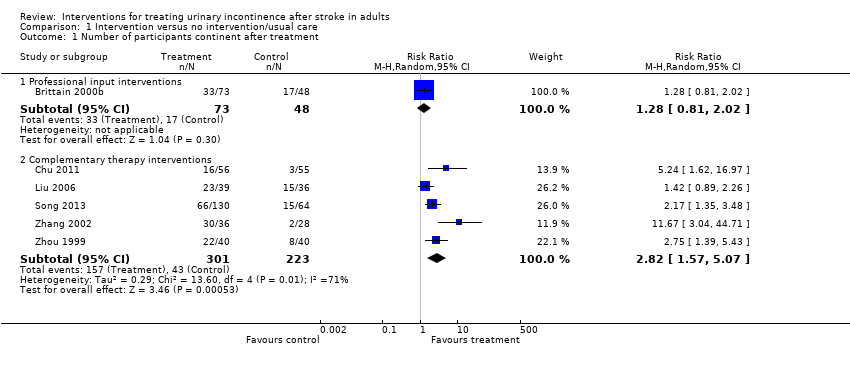
Comparison 1 Intervention versus no intervention/usual care, Outcome 1 Number of participants continent after treatment.

Comparison 1 Intervention versus no intervention/usual care, Outcome 2 Number of incontinent episodes in 24 hours (mean).

Comparison 1 Intervention versus no intervention/usual care, Outcome 3 Number of participants cured of all four urinary symptoms.

Comparison 1 Intervention versus no intervention/usual care, Outcome 4 Urinary symptoms – frequency (continuous variables).

Comparison 1 Intervention versus no intervention/usual care, Outcome 5 Urinary symptoms – frequency (dichotomous variables).

Comparison 1 Intervention versus no intervention/usual care, Outcome 6 Urinary symptoms – urgency.

Comparison 1 Intervention versus no intervention/usual care, Outcome 7 Urinary symptoms – nocturia (continuous variables).

Comparison 1 Intervention versus no intervention/usual care, Outcome 8 Urinary symptoms – nocturia (dichotomous variables).

Comparison 1 Intervention versus no intervention/usual care, Outcome 9 Physical measures: mean function of the pelvic floor muscle.

Comparison 1 Intervention versus no intervention/usual care, Outcome 10 Health status and quality of life – health status, mean total score 36‐Item Short Form.

Comparison 1 Intervention versus no intervention/usual care, Outcome 11 Health status and quality of life – quality of life.

Comparison 1 Intervention versus no intervention/usual care, Outcome 12 Functional ability – mean Barthel score (continuous variables).

Comparison 1 Intervention versus no intervention/usual care, Outcome 13 Participant satisfaction ‐ numbers who were dissatisfied.
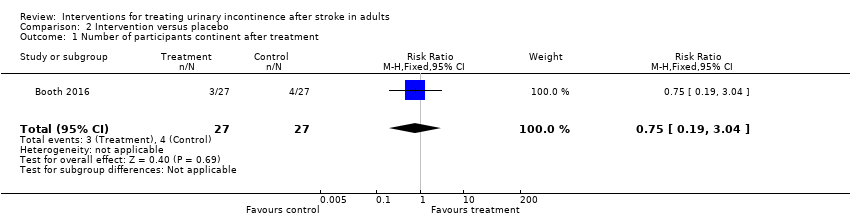
Comparison 2 Intervention versus placebo, Outcome 1 Number of participants continent after treatment.

Comparison 2 Intervention versus placebo, Outcome 2 Number of incontinent episodes – mean per day.

Comparison 2 Intervention versus placebo, Outcome 3 Number of incontinent episodes – mean per week.

Comparison 2 Intervention versus placebo, Outcome 4 Health status and quality of life – quality of life.

Comparison 4 Combined intervention versus single intervention, Outcome 1 Number of participants continent after treatment.

Comparison 4 Combined intervention versus single intervention, Outcome 2 Number of incontinent episodes – mean.

Comparison 5 Specific intervention versus attention control, Outcome 1 Number of participants continent after treatment.
| Behavioural interventions compared with usual care or no treatment for treating urinary incontinence after stroke | ||||||
| Patient or population: people with stroke and urinary incontinence Settings: hospital, clinic or home Intervention: behavioural interventions Comparison: no treatment/usual care | ||||||
| Outcomes | Illustrative comparative risks* (95% CI) | Relative effect | No of participants | Quality of the evidence | Comments | |
| Assumed risk | Corresponding risk | |||||
| Control | Intervention | |||||
| Number of participants continent after treatment | Study population | — | — | — | Not reported | |
| — | — | |||||
| Number of incontinent episodes | The mean number of incontinent episodes in the control group was 1.2 | The mean number of incontinent episodes in the intervention group was 0.2 | MD –1.00 (–2.74 to 0.74) | 18 participants (1) | ⊕⊕⊝⊝ | Outcome reported descriptively for Tibaek 2017: the reported number of UI episodes per 24 hours was very small (intervention 0 at post‐test and 1 at follow‐up; control 0 at post‐test, 0 at follow‐up). |
| Perception of improvement or cure | — | — | — | — | — | Not reported |
| Health status and quality of life | The mean quality of life score ranged across control groups from 39.08 to 47 | The mean quality of life score in the intervention groups was | SMD –0.91 (–1.50 to –0.32) | 55 participants (2) | ⊕⊕⊝⊝ | — |
| Functional ability | — | — | — | — | — | Not reported |
| Adverse events | — | — | — | — | — | Not reported. |
| *The basis for the assumed risk (e.g. the median control group risk across studies) is provided in footnotes. The corresponding risk (and its 95% confidence interval) is based on the assumed risk in the comparison group and the relative effect of the intervention (and its 95% CI). CI: confidence interval; MD: mean difference; SMD: standardised mean difference; UI: urinary incontinence. | ||||||
| GRADE Working Group grades of evidence | ||||||
| aDowngraded by one level for study design (allocation concealment unclear), and by one level for imprecision: fewer than 100 participants. bDowngraded by one level for study design (allocation concealment unclear in 2/2 trials in the meta‐analysis), and by one level for imprecision: fewer than 100 participants in both studies. | ||||||
| Specialised professional input interventions compared with usual care or no treatment for treating urinary incontinence after stroke | ||||||
| Patient or population: people with stroke and urinary incontinence Settings: hospital, clinic or home Intervention: specialised professional input Comparison: no treatment/usual care | ||||||
| Outcomes | Illustrative comparative risks* (95% CI) | Relative effect | No of participants | Quality of the evidence | Comments | |
| Assumed risk | Corresponding risk | |||||
| Control | Intervention | |||||
| Number of participants continent after treatment ‐ three months | 354 per 1000 | 453 per 1000 | RR 1.28 (0.81 to 2.02) | 121 participants (1) | ⊕⊕⊕⊝ | — |
| Number of incontinent episodes | — | — | — | — | — | Not reported |
| Perception of improvement or cure | — | — | — | — | — | Not reported |
| Health status and quality of life | — | — | — | — | — | Not reported |
| Functional ability | — | — | — | — | — | Not reported |
| Adverse events | — | — | — | — | — | Not reported. |
| *The basis for the assumed risk (e.g. the median control group risk across studies) is provided in footnotes. The corresponding risk (and its 95% confidence interval) is based on the assumed risk in the comparison group and the relative effect of the intervention (and its 95% CI). CI: confidence interval; RR: risk ratio. | ||||||
| GRADE Working Group grades of evidence | ||||||
| aDowngraded by one level for study design (allocation concealment unclear). | ||||||
| Complementary therapy interventions compared with usual care or no treatment for treating urinary incontinence after stroke | ||||||
| Patient or population: people with stroke and urinary incontinence Settings: hospital, clinic or home Intervention: complementary therapy Comparison: no treatment/usual care | ||||||
| Outcomes | Illustrative comparative risks* (95% CI) | Relative effect | No of participants | Quality of the evidence | Comments | |
| Assumed risk | Corresponding risk | |||||
| Control | Intervention | |||||
| Number of participants continent after treatment | Study population | RR 2.82 (1.57 to 5.07) | 524 participants (5) | ⊕⊕⊝⊝ | — | |
| 193 per 1000 | 544 per 1000 | |||||
| Number of incontinent episodes | — | — | — | — | — | Not reported |
| Perception of improvement or cure | — | — | — | — | — | Not reported |
| Health status and quality of life | — | — | — | — | — | Not reported |
| Functional ability | — | — | — | — | — | Not reported |
| Adverse events | — | — | — | — | See comment | Song 2013: 45/136 (33%) in the intervention group had bruises on arms and torso with full recovery; 17/136 (13%) had abdominal pain post‐acupuncture with resolution after warm compress; no other adverse effects noted. Chu 1997; Liu 2006; Zhang 2002; Zhou 1999: unclear |
| *The basis for the assumed risk (e.g. the median control group risk across studies) is provided in footnotes. The corresponding risk (and its 95% confidence interval) is based on the assumed risk in the comparison group and the relative effect of the intervention (and its 95% CI). CI: confidence interval; RR: risk ratio. | ||||||
| GRADE Working Group grades of evidence | ||||||
| aDowngraded one level for study design (random sequence generation unclear in 3/5 trials in the meta‐analysis; allocation concealment unclear in 5/5 trials), and by one level for imprecision: 3/5 studies fewer than 100 participants. | ||||||
| Physical therapy interventions compared with usual care or no treatment for treating urinary incontinence after stroke | ||||||
| Patient or population: people with stroke and urinary incontinence Settings: hospital, clinic or home Intervention: physical therapy Comparison: no treatment/usual care | ||||||
| Outcomes | Illustrative comparative risks* (95% CI) | Relative effect | No of participants | Quality of the evidence | Comments | |
| Assumed risk | Corresponding risk | |||||
| Control | Intervention | |||||
| Number of participants continent after treatment | — | — | — | — | — | Not reported |
| Number of incontinent episodes | The mean number of incontinent episodes ranged across control groups from 0.74 to 3.51 | The mean number of incontinent episodes in the intervention groups was 1.61 to 4.69 | MD –4.76 (–8.10 to –1.41) | 142 participants (2 studies (1 3‐arm study)) | ⊕⊕⊝⊝ | — |
| Perception of improvement or cure | — | — | — | — | — | Not reported |
| Health status and quality of life | — | — | — | — | — | Not reported |
| Functional ability: mean Barthel score (continuous variables) | The mean Barthel score was 52.5 in the control groups | The mean Barthel score in the intervention groups was 57.9 to 65.8 | MD 8.97 (1.27 to 16.68) | 81 participants (1 × 3‐arm study) | ⊕⊕⊕⊝ | — |
| Adverse events | — | — | — | — | — | Not reported |
| *The basis for the assumed risk (e.g. the median control group risk across studies) is provided in footnotes. The corresponding risk (and its 95% confidence interval) is based on the assumed risk in the comparison group and the relative effect of the intervention (and its 95% CI). CI: confidence interval; MD: mean difference. | ||||||
| GRADE Working Group grades of evidence | ||||||
| aDowngraded one level for study design (random sequence generation unclear in 1/2 trials in the meta‐analysis; allocation concealment unclear in 1/2 trials), and one level for imprecision: 2/2 studies fewer than 100 participants. bDowngraded one level for imprecision: fewer than 100 participants. | ||||||
| Study IDs | Continent prior to stroke | Diagnostic criteria for assessment of incontinence as reported by study authors | Description of participant incontinence by study authors |
| Yes | Not reported | At least once weekly | |
| Unclear | Yes (structured 1‐hour assessment by continence nurse practitioner) | Self‐reported clinical symptoms of leakage several times per month or more, frequency every ≥ 30 minutes, nocturia, urgency | |
| Unclear | Not reported | Not reported | |
| Yes | Yes (according to "neurological disease syndrome") | According to "neurological disease syndrome" neurogenic bladder with incontinence | |
| Unclear | Not reported | Normal urodynamic studies with incontinence | |
| Unclear | Not reported | Bladder hyper‐reflexia | |
| Yes | Yes (OABSS) | Post‐stroke urinary incontinence | |
| Unclear | Not reported | Mild or severe incontinence | |
| Unclear | Not reported | Post‐stroke urge urinary incontinence | |
| Yes | Yes (Barthel Index – continence item) | Completely incontinent, partially incontinent and self‐controlling | |
| Yes | Yes (urodynamic assessment) | Post‐stroke detrusor overactivity | |
| Yes | Yes (OABSS) | Post‐stroke urinary incontinence | |
| Yes | Yes (OABSS) | Post‐stroke urinary incontinence | |
| Yes | Yes (Barthel Index – Bladder item) | Post‐stroke neurogenic overactive bladder | |
| Yes | Yes (Bristol Female Urinary Symptoms Questionnaire) | Post‐stroke stress urinary incontinence | |
| Yes | Not reported | Post‐stroke urinary incontinence | |
| Yes | Yes (ICS definition) | Post‐stroke urinary incontinence | |
| Yes | Yes (ICS definition) | Lower urinary tract symptoms | |
| Unclear | Not reported | Post‐stroke urinary incontinence | |
| Unclear | Not reported | Post‐stroke urinary incontinence | |
| Unclear | Not reported | Post‐stroke urinary incontinence | |
| ICS: International Continence Society; OABSS: Overactive Bladder Symptom Score. | |||
| Study IDs | Stroke history of participants (any previous stroke) | Stroke diagnostic information provided by study authors | Stroke description of study participants |
| Not reported | According to WHO 1989 criteria | Ischaemic (87.8%) Haemorrhagic (10.2%) Other (2%) | |
| Not reported | Postal screening questionnaire – self‐report | Not reported | |
| Not reported | Not reported | Multi‐focal cerebral infarction | |
| First or repeated episode of stroke | According to the Fourth National Conference on Cerebrovascular Disease | Ischaemic (73%) Haemorrhagic (27%) | |
| Not reported | Not reported | Unilateral stroke | |
| Not reported | Not reported | Unilateral stroke | |
| Not reported | Not reported | Ischaemic (77%) Haemorrhagic (23%) | |
| Not reported | Not reported | Cerebrovascular accidents | |
| Not reported | Not reported | Ischaemic (78.2%) Haemorrhagic (21.8%) | |
| Not reported | Not reported | Ischaemic (80%) Haemorrhagic (20%) | |
| Not reported | Confirmation by CT or MRI scan | Ischaemic (45.5%) Haemorrhagic (54.5%) | |
| Not reported | Not reported | Ischaemic (72.8%) Haemorrhagic (27.2%) | |
| Not reported | Not reported | Ischaemic (72.8%) Haemorrhagic (27.2%) | |
| Not reported | Clinical and neuroimaging evaluation according to established criteria of Brazilian Cerebrovascular Disease Society | Ischaemic (100%) | |
| Not reported | Not reported | Not reported | |
| Not reported | According 1995 National Meeting on Cerebrovascular Accidents | Ischaemic (49.5%) Haemorrhagic (50.5%) | |
| First ever stroke | According to WHO 1989 criteria | Ischaemic (100%) | |
| 16.7% had 1 previous stroke | According to WHO 1989 criteria | Not reported | |
| Not reported | Confirmation by CT or MRI scan | Ischaemic and Haemorrhagic, figures not reported. | |
| Not reported | Not reported | Ischaemic (100%) | |
| Not reported | According to criteria from Chinese Diagnostic Guidelines | Ischaemic (66.3%) Haemorrhagic (33.7%) | |
| CT: computed tomography; MRI: magnetic resonance imaging. | |||
| Study IDs | Primary outcome(s) | Measured by | Secondary outcome(s) | Measured by |
| Number of incontinent episodes | ICIQ‐UI‐SF | Severity | ICIQ‐UI‐SF | |
| Urinary symptoms | AUASI* | |||
| Urgency perception scores | Bladder diary | |||
| Postvoid residual volume | Bladder scan | |||
| Quality of life | EQ‐5D‐5L ICIQLUTSqol | |||
| Adverse events | Participant reports | |||
| ADL | Barthel Index | |||
| Number of people incontinent | Nurse assessment and self‐report | Urinary symptoms Satisfaction with service | Nurse assessment and self‐report | |
| Number regaining continence | Not reported | None reported | — | |
| Number of people incontinent | Urinary Continence Status Grading (4 categories) | Severity | Urinary Continence Status Grading (4 categories) Participant reports | |
| Urinary symptoms | Clinical aggregate score | |||
| Adverse events | Not reported | |||
| Number of incontinent episodes per day for each month of treatment for 1 year | Not reported | None reported | — | |
| Number of incontinent episodes per day for each month of treatment for 1 year | Not reported | None reported | — | |
| Primary outcome not stated | — | Urinary symptoms | OABSS | |
| ADL | Barthel Index | |||
| Number of incontinent episodes per week | Not reported | None reported | — | |
| Number of incontinent episodes | Not reported | — | — | |
| Number of incontinent episodes daytime and night‐time, urinary symptoms | Barthel Index – continence item | — | — | |
| Maximum cystometric capacity, bladder compliance, detrusor leak point pressure. Number of incontinence episodes per day, urinary symptoms | Urodynamic assessment according to AUA/SUFU guidelines | None reported | — | |
| Primary outcome not stated | — | Number of incontinent episodes, urodynamic assessment, voiding diary | OABSS | |
| ADL | Barthel Index | |||
| Primary outcome not stated | — | Number of incontinent episodes, urodynamic assessment, voiding diary | OABSS | |
| ADL | Barthel Index | |||
| Primary outcome not stated | — | Urinary symptoms | Barthel Index (Bladder item) | |
| Primary outcome not stated | — | Contractility and muscle activity of the pelvic floor muscle | Perineometer and pelvic floor electromyography | |
| Urinary symptoms | Bristol Female Lower Urinary Tract Symptoms Questionnaire | |||
| Primary outcome not stated | — | Urinary symptoms | Scoring of urinary symptoms control score (0 = totally controlled, 1 = partial control, 2 = fully no control) | |
| Postvoid residual urine | Bladder scan | |||
| Number of incontinent episodes, number of pads used, frequency 24‐hour home pad test | 3‐day voiding diary | Vaginal palpation of PFM | Physical examination | |
| Urinary symptoms, frequency and severity | DAN‐PSS‐1 questionnaire | Digital anal palpation of PFM | Physical examination | |
| Frequency, number of incontinence episodes, number of pads used | 3‐day voiding diary | Health status | SF‐36 | |
| 24‐hour pad test | Pad test | |||
| Number of people with urinary incontinence | Not reported | — | — | |
| Number of people with urinary incontinence | Not reported | — | — | |
| Number of people with urinary incontinence | Not reported | — | — | |
| ADL: activities of daily living; AUASI: American Urological Association Symptom Index; AUA/SUFU: American Urological Association/Society of Urodynamics, Female Pelvic Medicine and Urogenital Reconstruction guidelines; DAN‐PSS‐1: Danish Prostatic Symptom Score; EQ‐5D‐5L: EuroQol Five‐Dimensional Questionnaire; ICIQLUTSqol: International Consultation on Incontinence Questionnaire ‐ Lower Urinary Tract Symptoms Quality of Life; ICIQ‐UI‐SF: International Consultation on Incontinence Questionnaire‐Urinary Incontinence‐Short Form; OABSS: Overactive Bladder Symptom Score; PFM: pelvic floor muscle; SF‐36: 36‐Item Short Form Survey. | ||||
| Outcome or subgroup title | No. of studies | No. of participants | Statistical method | Effect size |
| 1 Number of participants continent after treatment Show forest plot | 6 | Risk Ratio (M‐H, Random, 95% CI) | Subtotals only | |
| 1.1 Professional input interventions | 1 | 121 | Risk Ratio (M‐H, Random, 95% CI) | 1.28 [0.81, 2.02] |
| 1.2 Complementary therapy interventions | 5 | 524 | Risk Ratio (M‐H, Random, 95% CI) | 2.82 [1.57, 5.07] |
| 2 Number of incontinent episodes in 24 hours (mean) Show forest plot | 4 | Mean Difference (IV, Random, 95% CI) | Subtotals only | |
| 2.1 Behavioural interventions | 1 | 18 | Mean Difference (IV, Random, 95% CI) | ‐1.0 [‐2.74, 0.74] |
| 2.2 Physical therapy interventions | 3 | 142 | Mean Difference (IV, Random, 95% CI) | ‐4.76 [‐8.10, ‐1.41] |
| 3 Number of participants cured of all four urinary symptoms Show forest plot | 1 | Risk Ratio (M‐H, Fixed, 95% CI) | Subtotals only | |
| 3.1 Specialised professional input interventions | 1 | 143 | Risk Ratio (M‐H, Fixed, 95% CI) | 1.55 [0.97, 2.48] |
| 4 Urinary symptoms – frequency (continuous variables) Show forest plot | 6 | Mean Difference (IV, Random, 95% CI) | Subtotals only | |
| 4.1 Behavioural interventions | 2 | 48 | Mean Difference (IV, Random, 95% CI) | ‐1.71 [‐3.02, ‐0.40] |
| 4.2 Complementary therapy interventions | 1 | 62 | Mean Difference (IV, Random, 95% CI) | ‐5.57 [‐7.00, ‐4.14] |
| 4.3 Physical therapy interventions | 3 | 142 | Mean Difference (IV, Random, 95% CI) | ‐2.83 [‐5.75, 0.09] |
| 5 Urinary symptoms – frequency (dichotomous variables) Show forest plot | 1 | Risk Ratio (M‐H, Fixed, 95% CI) | Subtotals only | |
| 5.1 Specialised professional input interventions | 1 | 187 | Risk Ratio (M‐H, Fixed, 95% CI) | 0.93 [0.82, 1.05] |
| 6 Urinary symptoms – urgency Show forest plot | 1 | Risk Ratio (M‐H, Fixed, 95% CI) | Subtotals only | |
| 6.1 Specialised professional input interventions | 1 | 188 | Risk Ratio (M‐H, Fixed, 95% CI) | 1.05 [0.89, 1.24] |
| 7 Urinary symptoms – nocturia (continuous variables) Show forest plot | 5 | Mean Difference (IV, Random, 95% CI) | Subtotals only | |
| 7.1 Behavioural interventions | 2 | 48 | Mean Difference (IV, Random, 95% CI) | ‐0.38 [‐1.06, 0.29] |
| 7.2 Complementary therapy interventions | 2 | 256 | Mean Difference (IV, Random, 95% CI) | ‐1.76 [‐4.49, 0.96] |
| 7.3 Physical therapy interventions | 1 | 61 | Mean Difference (IV, Random, 95% CI) | ‐1.52 [‐1.73, ‐1.31] |
| 8 Urinary symptoms – nocturia (dichotomous variables) Show forest plot | 1 | Risk Ratio (M‐H, Fixed, 95% CI) | Subtotals only | |
| 8.1 Specialised professional input interventions | 1 | 186 | Risk Ratio (M‐H, Fixed, 95% CI) | 0.96 [0.86, 1.07] |
| 9 Physical measures: mean function of the pelvic floor muscle Show forest plot | 1 | Mean Difference (IV, Fixed, 95% CI) | Subtotals only | |
| 9.1 Behavioural interventions | 1 | 23 | Mean Difference (IV, Fixed, 95% CI) | 0.10 [‐0.48, 0.68] |
| 10 Health status and quality of life – health status, mean total score 36‐Item Short Form Show forest plot | 1 | Mean Difference (IV, Fixed, 95% CI) | Subtotals only | |
| 10.1 Behavioural interventions | 1 | 24 | Mean Difference (IV, Fixed, 95% CI) | ‐28.0 [‐169.66, 113.66] |
| 11 Health status and quality of life – quality of life Show forest plot | 2 | Std. Mean Difference (IV, Random, 95% CI) | Subtotals only | |
| 11.1 Behavioural interventions | 2 | 55 | Std. Mean Difference (IV, Random, 95% CI) | ‐0.99 [‐2.83, 0.86] |
| 12 Functional ability – mean Barthel score (continuous variables) Show forest plot | 2 | Mean Difference (IV, Random, 95% CI) | Subtotals only | |
| 12.1 Physical therapy interventions | 2 | 81 | Mean Difference (IV, Random, 95% CI) | 8.97 [1.27, 16.68] |
| 13 Participant satisfaction ‐ numbers who were dissatisfied Show forest plot | 1 | Risk Ratio (M‐H, Fixed, 95% CI) | Subtotals only | |
| 13.1 Specialised professional input interventions | 1 | 154 | Risk Ratio (M‐H, Fixed, 95% CI) | 0.32 [0.17, 0.59] |
| Outcome or subgroup title | No. of studies | No. of participants | Statistical method | Effect size |
| 1 Number of participants continent after treatment Show forest plot | 1 | 54 | Risk Ratio (M‐H, Fixed, 95% CI) | 0.75 [0.19, 3.04] |
| 2 Number of incontinent episodes – mean per day Show forest plot | 1 | 39 | Mean Difference (IV, Fixed, 95% CI) | ‐1.10 [‐3.99, 1.79] |
| 3 Number of incontinent episodes – mean per week Show forest plot | 1 | Paired samples mean (Random, 95% CI) | ‐3.88 [‐8.47, 0.70] | |
| 3.1 Oestrogen vs placebo (mild incontinence) | 1 | Paired samples mean (Random, 95% CI) | ‐1.71 [‐3.51, 0.09] | |
| 3.2 Oestrogen vs placebo (severe incontinence) | 1 | Paired samples mean (Random, 95% CI) | ‐6.4 [‐9.47, ‐3.33] | |
| 4 Health status and quality of life – quality of life Show forest plot | 1 | 30 | Mean Difference (IV, Fixed, 95% CI) | 3.90 [‐4.25, 12.05] |
| Outcome or subgroup title | No. of studies | No. of participants | Statistical method | Effect size |
| 1 Number of participants continent after treatment Show forest plot | 1 | Risk Ratio (M‐H, Fixed, 95% CI) | Subtotals only | |
| 1.1 Sensory‐motor biofeedback device + timed voiding vs timed voiding alone | 1 | 23 | Risk Ratio (M‐H, Fixed, 95% CI) | 0.55 [0.06, 5.21] |
| 2 Number of incontinent episodes – mean Show forest plot | 1 | Mean Difference (IV, Fixed, 95% CI) | Subtotals only | |
| 2.1 Sensory‐motor biofeedback device + timed voiding vs timed voiding alone | 1 | 23 | Mean Difference (IV, Fixed, 95% CI) | 2.2 [0.12, 4.28] |
| Outcome or subgroup title | No. of studies | No. of participants | Statistical method | Effect size |
| 1 Number of participants continent after treatment Show forest plot | 1 | Risk Ratio (M‐H, Fixed, 95% CI) | Subtotals only | |
| 1.1 TPTNS versus stretching exercises | 1 | 24 | Risk Ratio (M‐H, Fixed, 95% CI) | 1.33 [0.38, 4.72] |