Mesilato de deferoxamina para el tratamiento de la sobrecarga transfusional de hierro en pacientes con talasemia dependiente de transfusiones
Resumen
Antecedentes
La talasemia mayor es una enfermedad genética que se caracteriza por una disminución de la capacidad para producir hemoglobina. El tratamiento de la anemia resultante es mediante transfusiones de glóbulos rojos.
La repetición de las transfusiones da lugar a una acumulación excesiva de hierro en el cuerpo (sobrecarga de hierro), que se logra extraer mediante el tratamiento de quelación del hierro. El mesilato de deferoxamina (desferrioxamina) es uno de los quelantes de hierro más utilizados. Datos importantes han demostrado los efectos beneficiosos de la deferoxamina, aunque el cumplimiento con el tratamiento es un desafío. Actualmente se utilizan con frecuencia los quelantes alternativos del hierro por vía oral deferiprone y deferasirox. Existen preguntas importantes sobre si la deferoxamina, como monoterapia o en combinación con un quelante de hierro oral, es el mejor tratamiento para el tratamiento de quelación del hierro.
Objetivos
Determinar la efectividad (dosis y método de administración) de la deferoxamina en los pacientes con talasemia que dependen de transfusiones.
Resumir los datos de los ensayos sobre la eficacia clínica y la seguridad de la deferoxamina para la talasemia, y compararlos con la deferiprona y el deferasirox.
Métodos de búsqueda
Se realizaron búsquedas en el Registro de Ensayos de Hemoglobinopatías del Grupo Cochrane de Fibrosis Quística y Enfermedades Genéticas (Cochrane Cystic Fibrosis and Genetic Disorders Group). También se hicieron búsquedas en MEDLINE, EMBASE, CENTRAL (The Cochrane Library), LILACS y otras bases de datos médicas internacionales, además de los registros de ensayos en curso y la Transfusion Evidence Library (www.transfusionevidencelibrary.com). Todas las búsquedas se actualizaron hasta el 5 de marzo 2013.
Criterios de selección
Ensayos controlados aleatorizados que compararon deferoxamina con placebo, con otro quelante de hierro, o que compararon dos regímenes de deferoxamina, en pacientes con talasemia dependientes de transfusiones.
Obtención y análisis de los datos
Cuatro autores de la revisión de forma independiente participaron en la evaluación de la calidad del ensayo y la extracción de los datos. En un ensayo, los investigadores proporcionaron datos adicionales cuando se les solicitaron.
Resultados principales
Se incluyeron 22 ensayos con 2187 participantes (entre 11 y 586 pacientes). Estos ensayos incluyeron ocho comparaciones entre deferoxamina sola y deferiprona sola; cinco comparaciones entre deferoxamina combinada con deferiprona y deferiprona sola; ocho comparaciones entre deferoxamina sola y deferoxamina combinada con deferiprona; dos comparaciones de deferoxamina con deferasirox; y dos comparaciones de diferentes vías de administración de la deferoxamina (bolo versus infusión continua). En general, pocos ensayos midieron los mismos resultados o resultados a largo plazo. Siete ensayos informaron sobre la función cardíaca o la fibrosis hepática como medidas del daño a los órganos finales; ninguno incluyó una comparación con el deferasirox.
En cinco ensayos se informaron siete muertes, tres en pacientes que solo recibieron deferoxamina, dos en pacientes que recibieron deferoxamina y deferiprona. Otra muerte ocurrió en un paciente que recibió deferiprona y en otro que solo recibió deferasirox. Un ensayo informó de otras cinco muertes en pacientes que se retiraron del tratamiento aleatorizado (deferiprona con o sin deferoxamina) y se cambiaron a deferoxamina sola.
En un ensayo se planificó un seguimiento de cinco años, pero se interrumpió antes de tiempo debido a los efectos beneficiosos de una reducción de los niveles de ferritina sérica en los pacientes que recibieron tratamiento combinado con deferoxamina y deferiprona, en comparación con la deferiprona sola. Los resultados de este y otros tres ensayos indican una ventaja del tratamiento combinado con deferoxamina y deferiprona sobre la monoterapia para reducir las reservas de hierro, según las mediciones de la ferritina sérica. Sin embargo, no hay evidencia de que la eficacia del tratamiento combinado de deferoxamina y deferiprona mejore con respecto a la monoterapia, a partir de medidas directas o indirectas del hierro hepático.
Los ensayos más antiguos que midieron indirectamente la carga de hierro cardíaco al medir la señal T2* de resonancia magnética, habían indicado que la deferiprona podía reducir el hierro cardíaco más rápidamente que la deferoxamina. Sin embargo, el metanálisis de dos ensayos mostró una fracción de eyección del ventrículo izquierdo significativamente más baja en los pacientes que recibieron solo deferoxamina, en comparación con los que recibieron un tratamiento combinado de deferoxamina con deferiprona.
Se registraron eventos adversos en 18 ensayos. Ocurrieron con todos los tratamientos, pero fue significativamente menos probable con la deferoxamina que con la deferiprona en un ensayo, riesgo relativo 0,45 (intervalo de confianza del 95%: 0,24 a 0,84) y significativamente menos probable con la deferoxamina sola que con la deferoxamina combinada con la deferiprona en otros dos ensayos, riesgo relativo 0,33 (intervalo de confianza del 95%: 0,13 a 0,84). En particular, cuatro estudios informaron la retirada permanente del tratamiento debido a los efectos adversos de la deferiprona; sólo uno de ellos informó retiradas permanentes asociadas con la deferoxamina. En un ensayo, los eventos adversos también se produjeron con mayor frecuencia en los pacientes que recibieron deferasirox, en comparación con desferrioxamina. Ocho ensayos informaron de reacciones adversas locales en el lugar de la infusión de deferoxamina, entre ellas dolor e hinchazón. Los eventos adversos asociados con deferiprona incluyeron dolor articular, trastornos gastrointestinales, aumento de las enzimas hepáticas y neutropenia; los eventos adversos asociados con deferasirox incluyeron aumento de las enzimas hepáticas y deterioro renal. Se ha recomendado la monitorización regular de los recuentos de glóbulos blancos para la deferiprona, y la monitorización de la función hepática y renal para el deferasirox.
En resumen, la deferoxamina y los quelantes orales de hierro deferiprona y deferasirox producen reducciones significativas de las reservas de hierro en los pacientes dependientes de transfusiones con sobrecarga de hierro. No hay evidencia de ensayos clínicos aleatorizados que indique que alguno de ellos se asocie con una mayor reducción de los daños clínicamente significativos en los órganos diana, aunque en dos ensayos el tratamiento combinado con deferoxamina y deferiprona mostró una mayor mejora en la fracción de eyección del ventrículo izquierdo que la deferoxamina sola.
Conclusiones de los autores
La deferoxamina es el tratamiento de primera línea recomendado para la sobrecarga de hierro en los pacientes con talasemia mayor, y la deferiprona o el deferasirox están indicados para tratar la sobrecarga de hierro cuando la deferoxamina está contraindicada o no es adecuada. El uso del deferasirox por vía oral se ha autorizado en niños mayores de seis años que reciben transfusiones de sangre frecuentes, así como en niños de dos a cinco años que reciben transfusiones de sangre poco frecuentes. A falta de ensayos controlados aleatorizados con seguimiento a largo plazo, no hay evidencia convincente para cambiar esta conclusión.
El empeoramiento de los depósitos de hierro en el miocardio de los pacientes que reciben deferoxamina sola indicaría un cambio de tratamiento mediante la intensificación del tratamiento con deferoxamina, o la administración de la combinación de deferoxamina y deferiprona.
Los eventos adversos aumentan en los pacientes tratados con deferiprona en comparación con deferoxamina y en los pacientes tratados con deferiprona y deferoxamina combinadas, en comparación con la deferoxamina sola. Los pacientes tratados con todos los quelantes se deben mantener bajo una estrecha supervisión médica y el tratamiento con deferiprona o deferasirox requiere la monitorización regular del recuento de neutrófilos o de la función renal, respectivamente. Existe una necesidad urgente de realizar ensayos de alta calidad, con el poder estadístico adecuado, que comparen la eficacia clínica general y los resultados a largo plazo de la deferiprona, el deferasirox y la deferoxamina.
Resumen en términos sencillos
Mesilato de deferoxamina (desferrioxamina) para tratar los niveles excesivos de hierro en la sangre de los pacientes con talasemia que dependen de las transfusiones de sangre
La hemoglobina transporta el oxígeno en la sangre. En la talasemia, una enfermedad genética, en ocasiones el cuerpo no puede producir suficiente hemoglobina. Lo anterior se puede tratar mediante transfusiones regulares de sangre, pero puede dar lugar a un exceso de hierro en el cuerpo que se debe eliminar para evitar daños en los órganos.
El hierro se elimina a través del tratamiento de quelación de hierro, mediante una sustancia llamada quelante de hierro. Funciona al adherirse al exceso de moléculas de hierro en el cuerpo. Cuando los pacientes van al baño, este exceso de hierro sale del cuerpo.
De manera habitual se utilizan tres quelantes de hierro. Una (desferrioxamina) se inyecta y dos (deferiprona y deferasirox) se toman por vía oral. Deferasirox está autorizado para su uso en niños. La deferoxamina es poco conveniente y costosa; lo que motivó a los investigadores a encontrar quelantes de hierro orales seguros y efectivos.
Se encontraron 22 ensayos controlados aleatorizados que compararon los quelantes del hierro. Estos estudios no proporcionan suficiente información sobre la muerte o los daños en los órganos. Sin embargo, mostraron que los tres quelantes funcionaron igualmente bien en la eliminación del exceso de hierro. Varios ensayos encontraron que la combinación de deferoxamina y deferiprona eliminó más exceso de hierro que un solo quelante de hierro.
Los ensayos que muestran efectos secundarios se deben ser considerados con cuidado. Los efectos secundarios de la deferoxamina incluyeron dolor o reacciones cutáneas en el lugar de la inyección y dolor articular. Los efectos secundarios de la deferiprona incluyen dolor articular, náuseas, malestares estomacales y bajo recuento de glóbulos blancos. Los efectos secundarios del deferasirox incluyen erupciones cutáneas, aumento de las enzimas hepáticas y reducción de la función renal. El bajo recuento de glóbulos blancos y la reducción de la función renal son efectos secundarios importantes, y en los pacientes que reciben deferiprona o deferasirox se deben monitorizar de manera regular. Los pacientes tuvieron tres veces más probabilidades de experimentar un efecto secundario cuando se combinaron la deferiprona y la deferoxamina, en comparación con la deferoxamina sola. Tres estudios mostraron que los pacientes que recibieron deferiprona tuvieron dos veces y media más probabilidades de sufrir dolores articulares, en comparación con la deferoxamina sola.
No se ha encontrado evidencia para modificar las recomendaciones de tratamiento actuales, que establecen que la deferiprona o el deferasirox se deben utilizar para eliminar el exceso de hierro cuando no es posible, o no es adecuado, administrar deferoxamina. La Food and Drug Administration de los EE.UU. ha aprobado la deferiprona solo como "tratamiento de último recurso para la sobrecarga de hierro en la talasemia".
Se necesitan ensayos controlados aleatorizados más grandes del tratamiento de quelación del hierro, que utilicen medidas acordadas y estandarizadas de los niveles de hierro y el daño a los órganos, para permitir la comparación de estos valiosos tratamientos.
Authors' conclusions
Background
Description of the condition
Thalassaemia major is one of the most prevalent diseases in the world caused by an abnormality in a single gene (monogenic) (Weatherall 2001a). It is becoming a more significant public health problem as demographics have reduced childhood mortality from infectious diseases and malnutrition. At present, it is estimated that there are over two million transfusion‐dependent people with thalassaemia major throughout the world, with the majority of cases in South‐East Asia (Weatherall 2001a).
The common underlying pathology of the thalassaemia is an imbalance in the rate of synthesis of the alpha‐ and beta‐globin chains of haemoglobin in red blood cells. The clinical spectrum of thalassaemia ranges from death in utero, through severe transfusion‐dependent anaemia to asymptomatic anaemia (Weatherall 2001a; Weatherall 2001b). Anaemia is a reduction in the quantity of the oxygen‐carrying component (haemoglobin) of the blood.
The thalassaemias are diagnosed by their clinical manifestations, by morphological changes in red blood cells, by characterising haemoglobin alpha‐ and beta‐globin chains using electrophoresis or chromatography and by molecular detection of specific genetic mutations. Children with thalassaemia major or thalassaemia intermedia usually become symptomatic between six and 12 months of age with symptoms of anaemia and enlargement of the liver and spleen due to extramedullary hematopoiesis (Olivieri 1999).
In children affected by severe thalassaemia major, blood transfusions are the mainstay of management to achieve a haemoglobin concentration high enough to suppress red cell production. Without blood transfusions, people with thalassaemia major may develop massive bone marrow or extra‐medullary haematopoiesis, or both, resulting in severe pathology including deformities of the facial bones, spinal cord compression and pathological fractures (Olivieri 1999; Weatherall 2001a). The second major component of management is iron chelation therapy.
Description of the intervention
Iron overload and chelation
Increased iron absorption from dietary iron in the gut in people with thalassaemia not receiving transfusions increases total body iron by between 2 g and 5 g per year (Pippard 1979; Pootrakul 1988). Regular iron cell transfusions may increase this iron load by up to 10 g per year. Without iron chelation, iron‐mediated free radical damage may cause liver fibrosis, myocardial damage, skin pigmentation and endocrine failure including diabetes mellitus, growth failure and delayed onset of puberty (Kushner 2001; Olivieri 1999).
Iron overload may be prevented or treated with a chelating agent that complexes iron and allows excretion of chelator‐iron complexes from the body. The most widely used chelating agent is desferrioxamine mesylate (desferrioxamine, DFO) administered subcutaneously or intravenously (Olivieri 1997b). In earlier studies DFO was administered as an intramuscular injection up to seven times a week. Oral iron chelation agents are being developed of which deferiprone (L1) is licensed in the UK, Europe and India (Aydinok 1999; Berdoukas 2000; Cohen 2000; Del Vecchio 2000; Hershko 1998; Hoffbrand 1998; Kushner 2001; Mazza 1998; Olivieri 1995a; Olivieri 1998; Pippard 2000; Tondury 1998; Wanless 2002; Wonke 1998). The role of deferiprone in the management of people with iron overload remains to be established, and a separate Cochrane review of deferiprone use in thalassaemia (Fisher 2013) is being updated alongside this current update which specifically address the use of this agent in thalassaemia. Deferasirox is another oral iron chelator and can be given once daily as an oral suspension. The significant side effects of deferasirox include skin rashes and gastrointestinal disturbance and notably impairment of liver and renal function (BNF 2012). Deferasirox has been licensed for use in children aged over six years who receive frequent blood transfusions and in children aged two to five years of age who receive infrequent blood transfusions. Its short‐term efficacy has been assessed as similar to that of DFO in another Cochrane systematic review (Meehpohl 2012).
Subcutaneous or intravenous iron chelator: desferrioxamine (DFO)
The widespread clinical use of DFO is based on a series of well‐documented comparative studies of morbidity and mortality of children with thalassaemia major born before the introduction of DFO (Aldouri 1990; BorgnaPignatti 1998a; Brittenham 1988; Ehlers 1991; Gabutti 1996; Modell 2000; Olivieri 1994; Pippard 1978a; Propper 1976; Propper 1977; Richardson 1993; Wolfe 1985; Zurlo 1989). Maintaining hepatic iron stores less than 15 mg/g dry weight has been associated with reduced mortality from cardiac disease in thalassaemia (Brittenham 1994). Other studies have shown that regular chelation therapy with DFO is associated with a reduction in hepatic fibrosis, reduced prevalence of endocrine problems and a decreased risk of cardiac disease (Brittenham 1994; Gabutti 1996; Olivieri 1994; Olivieri 1999).
One problem of DFO is maintaining adherence of people with thalassaemia with the injections and the demanding schedule of overnight subcutaneous or intravenous infusions (Olivieri 1997b; Weatherall 2001a). Other regimens, including continuous intravenous DFO and intermittent subcutaneous DFO, have been successful in those thalassaemia patients severely affected by iron overload (BorgnaPignatti 1998b; Davis 2000; Franchini 2000). It has also been suggested that regimens combining DFO and vitamin C are more effective than DFO alone (Nienhuis 1976; O'Brien 1974; Propper 1977; Wapnick 1969).
A second problem concerns the toxicity of DFO, particularly at doses of greater than 40 mg/kg/day (Kushner 2001; Robins‐Browne 1985). Toxicity as a result of DFO includes retinal toxicity (optic neuropathy and retinal pigmentation and dysfunction) (Bacon 1983; De Sanctis 1996; Richardson 1993), local skin reactions (Kushner 2001) and high frequency sensorineural hearing loss (De Sanctis 1996; Robins‐Browne 1985). Other systemic side effects of DFO include growth retardation (Bousquet 1983; De Sanctis 1996; Koren 1989; Koren 1991), increased susceptibility to Yersinia infection and, less frequently, renal impairment, pulmonary fibrosis and anaphylaxis (Bousquet 1983; Freedman 1990; Koren 1989; Koren 1991; Miller 1981; Robins‐Browne 1985; Tenenbein 1992).
The final problem is the cost and availability of DFO. The cost of a year's course of DFO with consumables for standard therapy is approximately GBP 6000 to GBP 12,000 (BNF 2012) and so the availability of this treatment is limited by cost in many countries where the disease is prevalent.
Oral iron chelators: deferiprone
Two oral iron chelators, deferiprone and deferasirox, have been developed and licensed for chronic iron overload when DFO is contraindicated or inadequate. The drug 1,2‐dimethyl‐3‐hydroxypyroid‐4‐one, or deferiprone was the first oral iron chelator to be clinically evaluated and is pharmacologically efficacious in achieving iron excretion (Agarwal 1992; Kontoghiorghes 1990; Tondury 1990). Since these early studies, a large number of centres have reported their experience with deferiprone (Cohen 2003; Del Vecchio 2000; Fischer 2003; Lucas 2002; Olivieri 1995b; Olivieri 1997a; Rombos 2000) and it has been suggested that deferiprone may be particularly effective in decreasing cardiac iron deposition.
As with DFO, adverse events have been reported in people with thalassaemia taking deferiprone. These include gastrointestinal disturbances (Ceci 2002; Cohen 2003; Taher 2001), arthropathy (Cohen 2003; Hoffbrand 1998; Lucas 2002; Mazza 1998; Taher 2001), raised liver enzymes (Ceci 2002; Cohen 2003), neutropenia and agranulocytosis (Cohen 2003; Pati 1999). Progression of liver fibrosis during treatment with deferiprone is of great concern and controversy by some (Berdoukas 2000; Olivieri 1998; Tondury 1998), but not others (Wanless 2002); with ensuing correspondence (Brittenham 2003a). Recent studies have not reported progressive liver fibrosis in patients taking deferiprone. However, neutropenia has remained a concern for patients taking this drug.
Oral iron chelators: deferasirox
Deferasirox is an oral iron‐chelator that binds iron in a 2:1 ratio and is excreted faecally. It can be given once a day as an oral suspension at a dose of 10 to 30 mg/kg. The significant side effects of deferasirox include skin rashes and gastrointestinal disturbance and notably impairment of liver and renal function (BNF 2012).
As an oral agent, deferasirox may improve adherence to therapy compared with DFO given by infusions. As for deferiprone, deferasirox may be useful to treat iron‐overloaded patients intolerant of DFO. It is licensed in Europe for the treatment of chronic iron overload due to frequent blood transfusions in patients with beta‐thalassemia major aged six years and older and the treatment of chronic iron overload due to blood transfusions when DFO therapy is contraindicated or inadequate in the following patient groups: patients with other anaemias; patients aged two to five years; and patients with beta‐thalassemia major with iron overload due to infrequent blood transfusions (less than 7 ml/kg/month of packed red blood cells) (European Medicines Agency 2012).
There are currently no national guidelines for the use of deferasirox. However, a systematic review and economic assessment of deferasirox concluded that the data from the available short‐term trials showed that there was little clinical difference between any of the three chelators in terms of removing iron from the blood and liver (McLeod 2009). The economic analysis at that time suggested that deferasirox may be cost‐effective compared with DFO in patients with haemoglobinopathies but it is unlikely to be cost‐effective compared with deferiprone (McLeod 2009). More recently, a Cochrane systematic review evaluating the use of deferasirox also concluded that the short‐term efficacy of deferasirox and DFO were similar but that the long‐term safety and efficacy of deferasirox remained to be established (Meehpohl 2012).
Why it is important to do this review
There is, therefore, a pressing need to establish the most efficacious and cost‐effective regimens for iron chelation. Although a formal health economic analysis of iron chelation is beyond the scope of this review, the measurement of cost by any trial will be included and commented on in the review.
Objectives
The aims of this systematic review are to summarise data from trials on the efficacy and safety of DFO as an iron‐chelating agent in people with transfusion‐dependent thalassaemia and to compare the safety and effectiveness of DFO for thalassaemia with alternative iron chelators.
Methods
Criteria for considering studies for this review
Types of studies
Randomised controlled trials (RCTs) and quasi‐randomised controlled trials.
Types of participants
People of any age with transfusion‐dependent thalassaemia, from any setting worldwide.
Types of interventions
For DFO (all doses and methods of administration), the following comparisons were considered:
-
DFO compared with placebo or no placebo;
-
DFO compared with another iron‐chelating treatment schedule;
-
DFO schedule A (either subcutaneous method of administration or dose A) compared with DFO schedule B (either intravenous method of administration or dose B).
No trials comparing DFO with placebo were identified. The remaining comparisons constitute separate groups and were analysed separately.
Types of outcome measures
Primary outcomes
-
Mortality
Secondary outcomes
-
Evidence of reduced end‐organ damage
-
cardiac failure
-
endocrine disease
-
surrogate markers of end‐organ damage
-
histological evidence of hepatic fibrosis
-
-
Measures of iron overload (hepatic or non‐invasive) ‐ including serum ferritin, assessment of liver and other tissue iron levels by biopsy with biochemical measurement by SQUID (superconducting quantum interference device) or by MRI (magnetic resonance imaging).
-
Adverse events or toxicity due to treatment with DFO or alternative iron chelators, including ocular damage, ototoxicity and non‐endocrine growth failure which is felt to be due to direct toxicity of DFO on vertebral height growth.
-
Participant compliance with iron chelation treatment
-
Cost of intervention
Where possible, outcome data were grouped into those measured at six‐monthly intervals (i.e. six months, one year, etc.).
Search methods for identification of studies
Electronic searches
Relevant trials were identified from the Cochrane Cystic Fibrosis and Genetic Disorders Group's Haemoglobinopathies Trials Register using the terms: thalassaemia AND (desferrioxamine OR deferoxamine).
The Haemoglobinopathies Register is compiled from electronic searches of the Cochrane Central Register of Controlled Trials (CENTRAL) (updated each new issue of The Cochrane Library) and quarterly searches of MEDLINE. Unpublished work is identified by searching the abstract books of five major conferences: the European Haematology Association annual conference; the American Society of Hematology annual conference; the British Society for Haematology Annual Scientific Meeting; the Caribbean Health Research Council Meetings; and the National Sickle Cell Disease Program Annual Meeting. For full details of all searching activities for the Haemoglobinopathies Trials Register, please see the relevant section of the Cochrane Cystic Fibrosis and Genetic Disorders Review Group Module.
Date of the last search of the Haemoglobinopathies Trials Register: 5 March 2013.
In addition, the following databases were searched for the review update in March 2013.
-
CENTRAL (The Cochrane Library 2013, Issue 1) (Appendix 1)
-
PubMed (epublications only) (5 March 2013) (Appendix 2)
-
MEDLINE (1948 to 5 March 2013) (Appendix 3)
-
EMBASE (1980 to 5 March 2013) (Appendix 4)
-
UKBTS/SRI Transfusion Evidence Library (www.transfusionevidencelibrary.com) (1980 to 5 March 2013) (Appendix 5)
-
LILACS (1982 to 5 March 2013) (Appendix 5)
-
KoreaMed (1997 to 5 March 2013) (Appendix 6)
-
IndMed (1986 to 5 March 2013) (Appendix 6)
-
PakMediNet (1995 to 5 March 2013) (Appendix 6)
-
Databases of ongoing trials (all years to 5 March 2013): Novartis Clinical Trial Results database (www.novartisclinicaltrials.com); ClinicalTrials.gov; WHO International Clinical Trials Registry Platform (ICTRP); ISRCTN Register; Hong Kong Clinical Trials Register (Appendix 5 and Appendix 6)
Search strategies were designed to search for all iron chelators and no language restrictions were placed upon any of the searches. The original search strategies (April 2004) can be found in Appendix 7.
Searching other resources
For the original review, abstract books for the conferences 'World Congress on Iron Metabolism' (2001) and the 13th International Conference on Iron Chelation (2003) were searched to identify any other relevant trials.
The review authors checked the reference lists of all identified trials, relevant review articles and current treatment guidelines for further literature, but limited these searches to the ’first generation’ reference lists.
Contact was made with the manufacturer of desferrioxamine B (Novartis) and other iron chelators (Biomedical Frontiers, CIPLA, Lipomed, Apotex) requesting details of unpublished trials that involve desferrioxamine for the original review but not for the update.
Data collection and analysis
Selection of studies
Trials included in the original review were identified from the Cystic Fibrosis and Genetic Disorders Group's Haemoglobinopathies Trials Register as described above. For this update, additional electronic searches for potentially relevant papers were undertaken by an Information Specialist (CD). From the papers identified, the Information Specialist (CD) removed references that were duplicates, clearly irrelevant and/or previously screened. One author (SJB or SAF) screened all remaining titles and abstracts of papers for relevancy. All trials were assessed using the criteria indicated above by two authors working independently: for the original review (SJB and DJR); for the update (SJB or SAF and CD). Agreement between the authors was good, any disagreements related to the interpretation of 'quasi‐randomised controlled trial' and clinical characteristics. All disagreements were easily resolved between the two authors.
The reasons for the exclusion of trials that did not meet the review's eligibility criteria were recorded. Trials where important information was lacking were clearly categorised and are included in the Studies awaiting classification section of the review.
Data extraction and management
Aside from details relating to the risk of bias of the included trials, the authors extracted two groups of data.
-
Trial characteristics ‐ place and date publication, population characteristics, setting, detailed nature of intervention, of comparator and of outcomes. A key purpose of these data was to define unexpected clinical heterogeneity in included trials independently from analysis of results.
-
Results of included trials ‐ results for each of the main outcomes indicated in the review question. Authors carefully recorded reasons why an included trial did not contribute data on a particular outcome and considered the possibility of selective reporting of results on particular outcomes. For dichotomous outcomes the authors recorded the numbers of outcomes in treatment and control groups. For continuous outcomes, the authors recorded, where possible, mean and standard deviation (SD) at baseline, end of treatment and change from baseline. In both cases the 'denominators' were the numbers randomly allocated to treatment and control groups. However, several of the included trials did not report outcome data by numbers randomised. For these trials the 'denominators' are the number of participants for whom outcome data were reported.
For the original review four review authors (DJR, JH, DRees, SB) extracted data independently; and for the update, two authors completed this task (SJB and either SAF or a clinical colleague (either Dr Oni Chowdhry or Dr Sarah Gooding)). They extracted data onto trial‐specific data extraction forms, created and piloted by two authors (DJR, SJB). They undertook necessary minor adjustments to the layout. Once the authors had resolved disagreements, they recorded the consensus data onto a third data extraction form. Two review authors (SJB, SAF) transcribed this into the computer software Review Manager 5.1 (Review Manager 2011).
Assessment of risk of bias in included studies
The same authors who undertook the data extraction also assessed the risk of bias for all included trials (original and trials identified in the update), using the criteria outlined in the Cochrane Handbook for Systematic Reviews of Interventions (Higgins 2011) and summarised below. They resolved any disagreements by discussion or by involving a third review author (DJR).
-
Generation of random sequence.
-
Concealment of treatment allocation schedule.
-
Blinding of clinician (person delivering the treatment), participant and outcome assessors to treatment allocation.
-
Completeness of the outcome data, checking for possible attrition bias through withdrawals, loss to follow‐up and protocol violations.
-
Selective reporting bias, checking that all of a trial's pre‐specified outcomes and all expected outcomes of interest to the review have been reported.
-
Other sources of bias in the included trials.
-
An overall risk of bias assessment was made based on the items above.
The authors made an explicit judgement about whether trials are at high risk of bias according to criteria given in the Cochrane Handbook for Systematic Reviews of Interventions (Higgins 2011).They assessed the likely magnitude and direction of the bias with reference to items 1 to 6 above, with particular emphasis on the likely impact of bias on the findings.
The authors rated the above criteria as low, high, or unclear risk of bias. They recorded these ratings in the 'Risk of Bias' tables. In addition, they provided a narrative summary of the findings of this assessment alongside the individual ratings. They reported the overall risk of bias assessment in the results section of this review.
The authors anticipated that the issue of blinding would be a challenge in the identified trials, given the different routes of administration of the iron chelators currently available (deferiprone: oral; desferrioxamine: predominantly subcutaneous infusion over 8 hours to 12 hours). It would have been very difficult to blind either the clinician or the participant to the trial treatments. However, blinding of the outcome assessor to the treatment allocation would have been possible for these trials and has been given particular attention.
Measures of treatment effect
The main method of analysis was quantitative but the authors made an overall interpretation from a balanced assessment of the patterns of results identified across the included trials. Due to the disparity in methods of reporting results between trials, and in order to formally assess as many trials as possible, the authors analysed outcomes using both end of trial data and mean change from baseline data where appropriate. Where the SD for the mean change from baseline was not reported and the trial did not report sufficient data to enable SD calculation (i.e. a correlation coefficient), the authors did not want to make the necessary assumptions about unknown statistical distributions (Higgins 2011) and in this case, used end of trial data to analyse reported outcomes.
The authors presented results for binary data as a risk ratio (RR) and for continuous data as a mean difference (MD). They analysed all participants in the treatment groups to which they had been randomised, with the exception of one trial (Gomber 2004). In this trial, the authors analysed the end of trial data according to the treatment received rather than the treatment group to which the participants were randomised.
To facilitate comparison of results between trials, where SDs were not explicitly stated, the authors converted the standard error (SE) of the mean to the SD. Within this review, unless otherwise stated, the authors present data as mean and SD. Further, the authors have changed the units of serum ferritin concentration from µg/L or pmol/L to ng/ml and the units of liver iron concentration from mg/g to µg/g to facilitate the pooling, analysis and plotting of outcome data. Where results of individual trials were displayed graphically and the authors considered estimation to be reasonable, they estimated values visually from the graphs and stated these as such within tabulated results.
In one trial the investigators used the ratio of geometric means to describe the difference in change between treatment arms and reported exact P values (Pennell 2006). The review authors calculated the SE from the exact P value using methods described in the Cochrane Handbook for Systematic Reviews of Interventions (Higgins 2011). In a second paper, investigators reported the ratio of geometric means for baseline and end of trial measurements; however, exact P values were not available for all treatment arms and therefore the review authors could not calculate the difference in mean change (Tanner 2007).
One trial reported results for serum ferritin concentration, liver iron concentration and total iron excretion separately for different doses of DFO or deferasirox, or both (Cappellini 2006). In this case, the review authors combined data for different subgroups (doses) into a single group within each treatment arm using the formulae provided in the Cochrane Handbook for Systematic Reviews of Interventions (Higgins 2011).
The authors had intended to group the outcomes into those measured at six monthly intervals, but this proved impossible due to the limited amount of outcome data reported in the included trials. Please refer to the results section to determine how outcome measures were grouped.
The authors present individual trial results for each outcome in an additional table (Table 1).
| Trial details | Endpoint (treatment duration) | Intervention | Serum ferritin:start | Serum ferritin: end | Urinary iron:start | Urinary iron: end | Liver iron: start | Liver iron: end | Myocardial T2*:start | Myocardial T2*: end |
| 12 months | DFO | 4250 (1500) ng/ml | 1200 (850) ng/ml | 0.35 (0.12) mg/kg/24h | 0.53 (0.21) mg/kg/24h | not reported | not reported | not measured | not measured | |
| DFO + Deferiprone | 4500 (1250) ng/ml | 1250 (750) ng/ml | 0.41 (0.27) mg/kg/24h | 0.76 (0.49) mg/kg/24h | not reported | not reported | not measured | not measured | ||
| not reported | DFO | not measured | not measured | See Table 3 | See Table 3 | not measured | not measured | not measured | not measured | |
| DFO + Deferiprone | not measured | not measured | See Table 3 | See Table 3 | not reported | not reported | not measured | not measured | ||
| Deferiprone | not measured | not measured | See Table 3 | See Table 3 | not measured | not measured | not measured | not measured | ||
| 12 months | DFO + Deferiprone | 4350 (3342) µg/L
| 2954 (2765) µg/L | 0.88 (0.32) mg/kg/day (mean on days of therapy) | not measured | 26.6 (5.4) mg/g d/w | 18.1 (11.6) mg/g d/w | not measured | not measured | |
| Deferiprone | 4070 (3223) µg/L | 3209 (2279) µg/L | 0.38 (0.22) mg/kg/day (mean on days of therapy) | not measured | 30.7 (10.6) mg/g d/w | 28.6 12.8) mg/g d/w | not measured | not measured | ||
| 48 hours | DFO (bolus injection) | not measured | not measured | not reported | 36.5 (23.1) mg | not measured | not measured | not measured | not measured | |
| DFO (continuous infusion) | not measured | not measured | not reported | 36.4 (22.9) mg | not measured | not measured | not measured | not measured | ||
| DFO | not measured | not measured | not measured | not measured | not measured | not measured | not measured | not measured | ||
| Deferasirox | not measured | not measured | not measured | not measured | not measured | not measured | not measured | not measured | ||
| 12 months | DFO | 2597 (1835) µg/La | not reported | not measured | not measured | 13.5 (9.55) mg/g d/wa | not reported | not measured | not measured | |
| Deferasirox | 2765 (1897) µg/La | not reported | not measured | not measured | 14.2 (10.95) mg/g d/wa | not reported | not measured | not measured | ||
| DFO | not reported | not reported | not reported | not reported | not reported | not reported | 4.3b | 4.41b | ||
| Deferasirox | not reported | not reported | not reported | not reported | not reported | not reported | 4.29b | 4.21b | ||
| 54 weeks | DFO | 2838 (967) µg/L | approx. 1700 µg/L (value estimated from graph) | not reported | 0.18 (0.10)c mg/24h | 22.5 (10.1) mg/g dw | approx. 11.5 (6.3) mg/g d/w (value estimated from graph) | not measured | not measured | |
| DFO + Deferiprone | 2865 (983) µg/L | approx. 1050 µg/L (value estimated from graph) | not reported | 0.45 (0.26)c mg/24h | 17.1 (9.1) mg/g dw | approx. 6.5 (3.2) mg/g d/w (value estimated from graph) | not measured | not measured | ||
| Deferiprone | 2926 (1107) µg/L | approx. 900 µg/L (value estimated from graph) | not reported | 0.38 (0.23)c mg/24h | 15.8 (7.1) mg/g dw | approx. 7.5 (3.6) mg/g d/w (value estimated from graph) | not measured | not measured | ||
| 12 months | DFO | 2257 (748) µg/L | 1850 µg/L (value estimated from graph) | not measured | not measured | 1629 (642) µg/g w/w | not reported | not measured | not measured | |
| DFO + Deferiprone | 2048 (685) µg/L | 1750 µg/L (value estimated from graph) | not measured | not measured | 1629 (744) µg/g w/w | not reported | not measured | not measured | ||
| 6 months | DFO | 5077 (1715) ng/ml | 3718 (738) ng/ml | not measured | 7.96 (5.05) mg/day | not measured | not measured | not measured | not measured | |
| DFO + Deferiprone | 3348 (1526) ng/ml | 3377 (1222) ng/ml | not measured | 7.14 (4.99) mg/day | not measured | not measured | not measured | not measured | ||
| Deferiprone | 2673 (886) ng/ml | 3423 (1581) ng/ml | not measured | 4.78 (2.12) mg/day | not measured | not measured | not measured | not measured | ||
| up to 20 months (trial terminated early) | DFO | not reported | not reported | not measured | not measured | not reported | not reported | not measured | not measured | |
| DFO + Deferiprone | not reported | not reported | not measured | not measured | not reported | not reported | not measured | not measured | ||
| up to 20 months (trial terminated early) | DFO | not reported | not reported | not measured | not measured | not reported | not reported | not measured | not measured | |
| Deferiprone | not reported | not reported | not measured | not measured | not reported | not reported | not measured | not measured | ||
| 12 months | DFO | 2019 (678) ng/ml | 1787 (893) ng/ml | 15.7 (12.8) mg/24h | 19.9 (13.6) mg/24h | 3516 (2974) µg/g d/w | 3166 (2519) µg/g d/w | not measured | not measured | |
| Deferiprone | 2283 (754) ng/ml | 2061 (853) ng/ml | 11.4 (8.5) mg/24h | 15.8 (10.9) mg/24h | 3363 (5490) µg/g d/w | 2341 (2197) µg/g d/w | not measured | not measured | ||
| up to 5 years (trial terminated early) | DFO + Deferiprone | 1787 (735) ng/ml | 12 months: 1400 (770) ng/ml 5 years: 1369 (816) ng/mld | not measured | not measured | Liver T2* 4.0 (2.9) mse | Liver T2* 4.4 (3.4) mse | 20.1 (11.9) mse | 21.8 (12.6) mse | |
| Deferiprone | 1890 (816) ng/ml | 12 months: 1633 (841) ng/ml 5 years: 1588 (1217) ng/mld | not measured | not measured | Liver T2* 4.0 (5.9) mse | Liver T2* 3.5 (4.3) mse | 25.0 (11.3) mse | 26.0 (11.8) mse | ||
| 12 months | DFO | 5506 (2375) µg/L | 6 months: 4856 (2615) µg/L 12 months: 3998 (2409) µg/L | not measured | not measured | not measured | not measured | not measured | not measured | |
| DFO + Deferiprone | 4153 (1715) µg/L | 6 months: 3005 (1303) µg/L 12 months: 2805 (1084) µg/L | not measured | 22.9 (19.2) mg/kg/24h | not measured | not measured | not measured | not measured | ||
| 6 days | DFO | not measured | not measured | not measured | 18.2 (15.3) mg/kg/day | not measured | not measured | not measured | not measured | |
| Deferiprone | not measured | not measured | not measured | 12.3 (6.7) mg/kg/day | not measured | not measured | not measured | not measured | ||
| 24 months | DFO | not measured | not measured | not reported | not reported | 6.9 (3.82) mg/g d/w | 7.9 (5.52) mg/g d/w | not measured | not measured | |
| Deferiprone | not measured | not measured | not reported | not reported | 8.9 (5.23) mg/g d/w | 13.7 (5.23) mg/g d/w | not measured | not measured | ||
| 12 months | DFO | 2795 (2441) µg/L | 2329 (2078.7) µg/L
| not measured | not measured | 6.32 (5.8) mg/g d/w | not reported | 13.3 ms (30%)d | 15.0 ms (+13%, CV 39%)d | |
| Deferiprone | 1791 (1029) µg/L
| 1610 (980.91) µg/L
| not measured | not measured | 6.16 (6.0) mg/g d/w | not reported | 13.0 ms (32%)d | 16.5 ms (+27%, CV 38%)d | ||
| 48 weeks | DFO | data reported graphically | data reported graphically | not reported | not reported | 18 months: 7.8 (2.18) mg/g d/w | 18 months: 6.5 (20.2) mg/g d/w | not measured | not measured | |
| Deferasirox (10mg/day) | data reported graphically | data reported graphically | not reported | not reported | 18 months: 9.1 (2.98) mg/g d/w | 18 months: 9.4 (4.45) mg/g d/w | not measured | not measured | ||
| Deferasirox (20mg/day) | data reported graphically | data reported graphically | not reported | not reported | 18 months: 9.3 (2.91) mg/g dw | 18 months: 8.1 (2.81) mg/g d/w | not measured | not measured | ||
| 12 months | DFO | 2945 (591) ng/ml | 6 months: 2702 (242) ng/ml 12 months: 2451 (352) ng/ml | not measured | not measured | not reported | not reported | not measured | not measured | |
| DFO + Deferiprone | 2986 (612) ng/ml | 6 months: 2453 (318) ng/ml 12 months: 2082 (221) ng/ml | not measured | not measured | not reported | not reported | not measured | not measured | ||
| 12 months | DFO + placebo | 1379 (CV 10) µg/Lf | 1146 (CV 11) µg/Lf | not measured | not measured | Liver T2* 4.2 (CV 0.62) ms [>19]f | 5.0 msf | 12.4 (CV 0.11) ms [>20]d | 15.7 msf | |
| DFO + Deferiprone | 1574 (CV 11) µg/Lf | 598 (CV 14) µg/Lf | not measured | not measured | Liver T2* 4.9 (CV 0.52) ms (>19)f | 10.7 msf | 11.7 (CV 0.08) ms (>20)d | 17.7 msf | ||
| 12 months | DFO (bolus injection) | 3003 (949) units? | 2287 (831) | 10.6 (4.3) mg Fe/24hrs | not reported | 7.559 (3.508) mg Fe/ d/w | 6.328 (3.114) mg Fe/ d/w | not measured | not measured | |
| DFO (continuous infusion) | 3239 (1134) | 2513 (775) | 10.8 (4.3) mg Fe/24hrs | not reported | 6.774 (3.430) mg Fe/ d/w | 5.470 (0.775) mg Fe/ d/w | not measured | not measured |
DFO: desferrioxamine; d/w = dry weight liver; Fe: iron; SD: standard deviation; w/w = wet weight liver.
aCappellini 2006 ‐ baseline LIC values are calculated from combining groups for different doses of DFO and deferasirox. Dose‐specific values are shown in Table 12.
bChristoforidis: natural logarithm of the mean signal intensity of tissue to air ratio.
cHepatic iron only, measured as [excretion = iron transfused + [(LIC t=o ‐LIC t=54 weeks) x 10.6 x wt/kg)]/no of days between biopsies]; fecal iron excretion not accounted for in calculations.
dSerum ferritin measures were given annually for up to five years of follow‐up. Only values for the first twelve months (for consistency with reporting from other trials) and for five years are reported in this table.
eThe mean (SD) duration from entry into trial to time of T2* MRI basal assessment was 17 (18) months in the combined treatment group and 18 (17) in the deferiprone alone treatment group. Final evaluation was performed after a further 16 (5) months and 14 (6) months respectively. Global left ventricle heart T2* are reported here; paper also reports septum heart T2* values at baseline and endpoint.
fGeometric mean (CV; coefficient of variation).
Unit of analysis issues
The authors took care to record the method of data analysis used in the included cross‐over trials. Neither of the two cross‐over trials which presented outcome data did so in a way that would have helped in the undertaking of a meta‐analysis (paired‐samples analysis) (Elbourne 2002). However, this was not the reason why the authors analysed data from these two cross‐over trials qualitatively. Differences in the interventions being compared and the clinical setting of the trials precluded data from the cross‐over trials being pooled in a meta‐analysis with data from the parallel group trials.
There were no unit of analysis issues in the update.
Dealing with missing data
For the original review, the authors requested (and obtained) data that were missing or required clarification from the original investigators for one trial (Olivieri 1997). In addition, during the analysis of the results, the review authors contacted (by email) three trial investigators from four trials requesting the individual patient data from their trial (Borgna‐Pignatti 1997; Ha (i) 2006; Ha (ii) 2006; Maggio 2002). All three trial investigators responded to the initial e‐mail but were unwilling or unable to provide their individual patient data.
At the 2013 update the review authors did not contact any trial investigators for missing data due to time constraints and resource limitations.
Assessment of heterogeneity
The authors assessed statistical heterogeneity of treatment effects between trials using a chi‐squared test with a significant level at P < 0.1. The authors used the I2 statistic to quantify the amount of possible heterogeneity (30% to 75% moderate heterogeneity; over 75% considerable heterogeneity) (Higgins 2002; Higgins 2003). The number of trials included did not allow further exploration of heterogeneity by sensitivity and subgroup analysis in any of the meta‐analyses undertaken.
Assessment of reporting biases
Although authors did not undertake any quantitative assessment of publication bias, they did make an attempt to minimise the likelihood of publication bias by the use of a comprehensive search strategy, the handsearching of relevant conference abstract books and contacting the manufacturers of desferrioxamine and other iron chelators.
Data synthesis
Authors performed meta‐analyses using Review Manager 5.1 (Review Manager 2011). They used a fixed‐effect model for combining data in the first instance. Where considerable heterogeneity was identified in a fixed‐effect meta‐analysis, they repeated the analysis using a random‐effects model. For many outcomes, meta‐analysis was not possible due to diversity in the method or timing of the outcome measurement across trials. The authors did not undertake meta‐analysis where differences in clinical outcome baseline levels occurred and they deemed the risk of selection bias to be unclear or high. Authors based their conclusions on inferences drawn from clearly tabulated results from included trials as well as qualitative and quantitative summary measures. They considered both direction and magnitude of effects. Authors present individual trial results in additional tables.
Analyses based on means are not appropriate for heavily skewed data. Where data were known to be skewed, the authors undertook analyses on a log scale and presented these data as the ratio of geometric means.
For analyses of adverse events, authors only pooled trials reporting the same adverse event in a meta‐analysis if: both arms of the trial reported occurrences of adverse events; or if the absence of an adverse event in either (but not both) treatment arm was specifically reported or could be clearly inferred without ambiguity. The authors only undertook a meta‐analysis of dose reduction or temporary or permanent withdrawal when the total number of adverse events was clearly stated.
The authors grouped outcome data into the outcomes listed earlier and analysed outcome data from different time points separately in this review.
Subgroup analysis and investigation of heterogeneity
Although intended, due to an insufficient number of trials, the authors were unable to perform subgroup analysis for any of the outcome measures. If sufficient trials become available in future updates of this review, the authors plan to undertake a subgroup analysis of pre‐defined measures of iron overload or end organ damage.
Sensitivity analysis
The authors did not undertake any sensitivity analyses due to the paucity of trials included in the meta‐analyses.
Results
Description of studies
Results of the search
In total, the searches identified 3067 references by March 2013. Whilst most of these were from electronic sources, the authors identified two trials from correspondence with the drug company Lipomed, four from correspondence with Novartis, two on the web‐based database: Current Controlled Trials and eight trials from the citation lists of relevant publications and review articles.
Initial screening and de‐duplication of the citations and trials for relevance by one author excluded 2178 papers. Two authors then independently screened the titles and abstracts of 889 references and excluded 755 for not meeting the review's eligibility criteria. The authors assessed the remaining 134 papers on the basis of their full text for inclusion or exclusion using the criteria indicated above. Of these, the authors subsequently included a total of 51 papers (22 trials) and excluded 62 references (57 independent trials), and listed 21 references (13 independent studies) as 'Studies awaiting classification'. See Figure 1 for PRISMA study flow diagram. In particular, the authors have listed nine potentially relevant trials identified from the final search period (September 2011 to March 2013) which appear to meet the review's eligibility criteria have been included as 'Studies awaiting classification'.
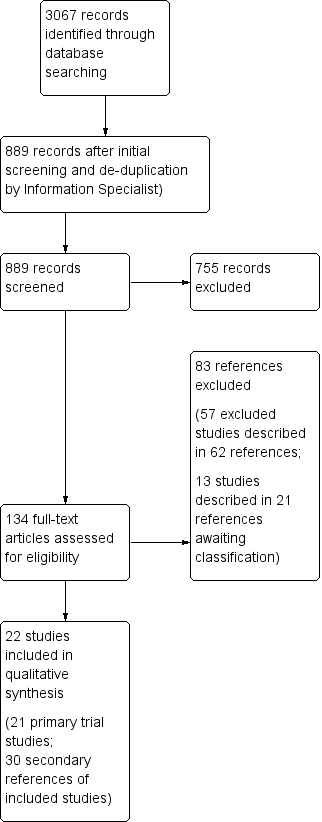
PRISMA study flow diagram.
Included studies
The 22 included trials comprised 2187 participants (range 11 to 586 per trial). One paper presented data for two separate trials which the authors also present separately in the review (Ha (i) 2006; Ha (ii) 2006). The primary author of one trial published in abstract form indicated that additional information was published on the US Food and Drug Administration website by the trial sponsors and these data have been included in this review (Olivieri 1997) .
Twenty trials were parallel RCTs and two were cross‐over trials (Borgna‐Pignatti 1997; Olivieri 1990). Four trials were presented as an abstract (Aydinok 2005; Brissot 2005; Christoforidis 2006; Olivieri 1997) and the remaining 18 as full journal articles. Four trials were three‐arm comparisons (Aydinok 2005; El‐Beshlawy 2008; Gomber 2004; Piga 2006).Three of these trials compared deferiprone alone, deferiprone and DFO in combination and DFO alone (Aydinok 2005; El‐Beshlawy 2008; Gomber 2004). The authors subdivided these three trials by intervention arms for outcome analysis within this review. The fourth trial compared DFO with two different doses of deferasirox (Piga 2006).
Sixteen trials involved a comparison of deferiprone alone with DFO alone, or either DFO or deferiprone as monotherapy compared with combined deferiprone and DFO. These included eight comparisons between DFO alone and deferiprone alone (Aydinok 2005; El‐Beshlawy 2008; Gomber 2004; Ha (ii) 2006; Maggio 2002; Olivieri 1990; Olivieri 1997; Pennell 2006), five comparisons between DFO and deferiprone in combination with deferiprone alone (Aydinok 2005; Aydinok 2007; El‐Beshlawy 2008; Gomber 2004; Maggio 2009) and nine comparisons between DFO alone and DFO and deferiprone in combination (Abdelrazik 2007; Aydinok 2005; El‐Beshlawy 2008; Galanello 2006; Gomber 2004; Ha (i) 2006; Mourad 2003; Tamaddoni 2010; Tanner 2007). Four trials compared DFO with deferasirox (Brissot 2005; Cappellini 2006; Christoforidis 2006; Piga 2006); the latter of these being a comparison with two different dose of deferasirox. Two trials compared route of DFO administration (bolus verses continuous infusion) (Borgna‐Pignatti 1997; Yarali 2006).
All trials were published between 1978 and 2010 and conducted internationally. Five trials were conducted in Italy, three in Turkey, two in Canada, two in Egypt, two in Italy and Greece, two in Hong Kong, one each in Greece, India, Iran and the Lebanon. One large multicentre trial was conducted worldwide including Argentina, Belgium, Brazil, Canada, France, Germany, Greece, Italy, Tunisia, Turkey, UK, USA (Cappellini 2006); one European trial did not give any further details about where the trial was conducted (Brissot 2005).
Interventions
(A) DFO alone compared with deferiprone alone
There were eight comparisons between DFO alone and deferiprone alone (Aydinok 2005; El‐Beshlawy 2008; Gomber 2004; Ha (ii) 2006; Maggio 2002; Olivieri 1990; Olivieri 1997; Pennell 2006).
In six of the eight trials, DFO was administered subcutaneously at a dose of between 23 and 60 mg/kg/day over between five and seven days per week (Aydinok 2005; El‐Beshlawy 2008; Gomber 2004; Ha (ii) 2006; Maggio 2002; Pennell 2006). One cross‐over trial, which was designed to compare excretion of iron induced in urine and stool, administered DFO subcutaneously over 12 hours per day for three days (Olivieri 1990). The details of the dose or schedule of administration for DFO was not reported in the eighth trial (Olivieri 1997).
In seven of these deferiprone was given daily at 50 to 100mg/kg/day in two or three oral divided doses; DFO was given as a subcutaneous injection at a dose of 20 to 60 mg/kg/day for 8 to 12 hours and for 5 to 7 days a week (Aydinok 2005; El‐Beshlawy 2008; Gomber 2004; Ha (ii) 2006; Maggio 2002; Olivieri 1990; Pennell 2006). In an eighth trial the intended dose of chelators given was not reported as the trial was stopped prematurely by the sponsoring pharmaceutical company (Apotex) (Olivieri 1997). However, the mean (SD) dose received was reported as 36.7 (2.8) mg/kg/night.
The duration of trial treatment was six months in one trial (Gomber 2004); one year in three trials (El‐Beshlawy 2008; Maggio 2002; Pennell 2006); and two years in a further trial (Olivieri 1997). The intended duration of treatment in one trial was 18 months (Ha (ii) 2006). However, this trial was stopped early: treatment duration ranged from 1 to 20 months (median duration 18 months) although only participants who had received at least six months of treatment were included in the assessment of efficacy. In the cross‐over trial, the duration of treatment was three days per treatment arm with each participant receiving treatment over six days; there was a gap of three to four weeks between each treatment arm (Olivieri 1990). Duration of treatment was not stated in the remaining trial (Aydinok 2005).
Participants in four trials had had prior exposure to DFO (Aydinok 2005; Maggio 2002; Olivieri 1990; Pennell 2006). In one trial, administration of DFO (dose unreported) had ceased 72 hours preceding the start of the trial (Olivieri 1990). Prior to enrolment in two trials, participants had received DFO at a dose of 50 mg/kg as a subcutaneous infusion over 12 hours per night, five times a week (Maggio 2002) or at a mean dose of 39 (SD 8) mg/kg/day for five to seven days per week (Pennell 2006). The dose of DFO treatment prior to enrolment was not reported in the fourth trial (Aydinok 2005).
(B) DFO and deferiprone in combination compared with deferiprone alone
There were five comparisons of DFO and deferiprone combined versus deferiprone alone (Aydinok 2005; Aydinok 2007; El‐Beshlawy 2008; Gomber 2004; Maggio 2009).
In four trials, DFO was administered subcutaneously at a dose of 20 to 50 mg/kg/day for two days per week (Aydinok 2005; Aydinok 2007; El‐Beshlawy 2008; Gomber 2004) and in one trial for three days per week (Maggio 2009). When taken in combination with DFO, deferiprone was administered orally at a dose of 75 mg/kg/day (Aydinok 2005; Aydinok 2007; Gomber 2004; Maggio 2009) or 60 to 83 mg/kg/day (El‐Beshlawy 2008) daily, or for four days per week (Maggio 2009) in oral divided doses. As a single treatment, deferiprone was given at the same doses as above but daily in all five trials.
The duration of treatment was six months in one trial (Gomber 2004); 12 months in two trials (Aydinok 2007; El‐Beshlawy 2008) and up to five years in a further trial, which was terminated early due to the beneficial effects in terms of serum ferritin reduction observed after interim analysis before the planned five years of treatment was completed for all patients (Maggio 2009). The duration of treatment was not reported in the fifth trial (Aydinok 2005).
Exposure to iron chelation therapy prior to enrolment in the trial was reported in three trials (Aydinok 2005; Aydinok 2007; Maggio 2009). Both Aydinok trials reported prior treatment with DFO; but neither reported the dose or duration (Aydinok 2005; Aydinok 2007). One of these trials did, however, report a washout period of two weeks with no iron chelation before initiating trial treatment (Aydinok 2007). In the third trial, participants received either DFO (50 mg/kg/day for five days per week) or deferiprone (75 mg/kg/day daily) prior to enrolment in the trial, although the duration of prior treatment was not reported (Maggio 2009).
(C) DFO alone compared with DFO and deferiprone in combination
There were nine comparisons between DFO alone and DFO and deferiprone in combination (Abdelrazik 2007; Aydinok 2005; El‐Beshlawy 2008; Galanello 2006; Gomber 2004; Ha (i) 2006; Mourad 2003; Tamaddoni 2010; Tanner 2007).
When DFO was given as a monotherapy it was administered subcutaneously at a dose of 40 mg/kg/day (Abdelrazik 2007; Gomber 2004), 40 to 50 mg/kg/day (Aydinok 2005; Mourad 2003; Tamaddoni 2010; Tanner 2007), 23 to 50 mg/kg/day (El‐Beshlawy 2008), 20 to 60 mg/kg/day (Galanello 2006) or 30 to 60 mg/kg/day (Ha (i) 2006) for five days per week (Aydinok 2005; El‐Beshlawy 2008; Gomber 2004; Tamaddoni 2010; Tanner 2007) or five to seven days per week (Abdelrazik 2007; Galanello 2006; Ha (i) 2006; Mourad 2003). One trial also administered an oral placebo; no further details are reported (Tanner 2007).
When given in combination with deferiprone, DFO was given twice weekly in all nine trials, at a daily dose of between 23 to 60 mg/kg/day (Abdelrazik 2007; Aydinok 2005; El‐Beshlawy 2008; Galanello 2006; Gomber 2004; Ha (i) 2006; Tamaddoni 2010; Tanner 2007) or 2 g (Mourad 2003).
Deferiprone was given orally at a dose of 25 mg/kg/day (Galanello 2006), 75 mg/kg/day (Aydinok 2005; Abdelrazik 2007; Gomber 2004; Ha (i) 2006; Mourad 2003; Tamaddoni 2010; Tanner 2007), or 60 to 83 mg/kg/day (El‐Beshlawy 2008) daily (Aydinok 2005; El‐Beshlawy 2008; Gomber 2004; Ha (i) 2006; Mourad 2003; Tanner 2007), five days per week (Galanello 2006; Tamaddoni 2010) or for four days per week (Abdelrazik 2007) in oral divided doses.
The duration of treatment was six months in one trial (Gomber 2004); 12 months in six trials (Abdelrazik 2007; El‐Beshlawy 2008; Galanello 2006; Mourad 2003; Tamaddoni 2010; Tanner 2007); and between one and 20 months in one trial (Ha (i) 2006). Although in the latter trial, only participants who had received at least six months of treatment were included in the assessment of efficacy (Ha (i) 2006). One trial did not report treatment duration (Aydinok 2005).
Six of the nine trials reported prior exposure to iron chelation therapy (Abdelrazik 2007; Aydinok 2005; Galanello 2006; Mourad 2003; Tamaddoni 2010; Tanner 2007); although only two reported the dose and schedule of prior treatment received (Abdelrazik 2007; Tanner 2007). In one trial, patients received DFO at a dose of 40 mg/kg/day for five to seven nights per week for "several years" (Abdelrazik 2007). The second trial reported prior exposure to DFO at a mean (SD) dose of 36.4 (11.1) mg/kg/day for 5.5 days per week, but treatment duration was not reported (Tanner 2007). In this trial, participants were excluded from the trial if they had previously received deferiprone. One of the six trials reported prior exposure to DFO less than four times per week but the dose and duration was not reported (Mourad 2003).
(D) DFO compared with deferasirox
Four trials compared DFO with deferasirox (Brissot 2005; Cappellini 2006; Christoforidis 2006; Piga 2006); two of these trials compared DFO to different doses of deferasirox (Cappellini 2006; Piga 2006).
In three of the four trials, patients were randomised to receive DFO or deferasirox; the dose of either DFO or deferasirox was determined according to baseline liver iron concentration levels (Brissot 2005; Cappellini 2006; Christoforidis 2006). Liver iron concentration criteria for dose allocation in the Cappellini trial are presented in Characteristics of included studies (Cappellini 2006). In the fourth trial, patients were randomised to receive one of three treatments: DFO or deferasirox dose 1 or deferasirox dose 2 (Piga 2006).
The DFO doses were less than 25 to over 50 mg/kg/day in one trial (Brissot 2005), from 20 to over 50 mg/kg/day in two trials (Cappellini 2006; Piga 2006) and from 35 to 50 mg/kg/day in the remaining trial (Christoforidis 2006). The DFO treatment was administered between three and seven days per week (Cappellini 2006) or on five consecutive days per week (Piga 2006); in the remaining two trials the schedule of administration was not documented (Brissot 2005; Christoforidis 2006).
Deferasirox was administered at a dose of between 5 and 30 mg/kg/day (Brissot 2005; Cappellini 2006) or between 10 and 30 mg/kg/day (Christoforidis 2006). In the Piga trial, deferasirox was administered initially at either 10 mg/kg/day or 20 mg/kg/day although the dose was allowed to increase or decrease by 5 mg/kg or 10 mg/kg respectively according to change in liver iron concentration at three consecutive determinations, to between 5 and 40 mg/kg/day across both comparator groups (Piga 2006).
Treatment duration was 48 weeks in one trial (Piga 2006) and 12 months in the remaining three trials (Brissot 2005; Cappellini 2006; Christoforidis 2006). One trial reported prior iron chelation therapy (Cappellini 2006); in this trial 97% of participants in the DFO treatment arm and 98% in the deferasirox treatment arm received DFO prior to entry into the trial, although no details were given about the dose, schedule or duration of previous treatment. Prior exposure to iron chelation was also reported in a second trial in which all patients received DFO at a dose of at least 30 mg/kg for five days per week for at least four weeks prior to recruitment into the trial (Piga 2006). This was adjusted to 40 mg/kg/day for five consecutive days each week for two weeks followed by a five‐day washout period prior to randomisation.
(E) DFO schedule A (either method of administration or dose A) compared with DFO schedule B (either method of administration or dose B)
Two trials compared the route of DFO administration (bolus verses continuous infusion) (Borgna‐Pignatti 1997; Yarali 2006).
In the first of the trials comparing the route of DFO administration, DFO administered as a bolus subcutaneous injection twice daily was compared with DFO administered as a 9 to 12 hours continuous infusion (Borgna‐Pignatti 1997). In both arms, DFO was administered at a dose of 37 to 64 mg/kg/day over a period of 48 hours. In this cross‐over trial, all participants received DFO by both routes of administration. No details were recorded as to whether there was a break between the two routes of administration. In the second trial, DFO administered subcutaneously at a dose of 45 mg/kg/day was compared with the same dose of DFO administered as a continuous infusion over 10 hours per day for five days per week, with a total treatment duration of 12 months (Yarali 2006).
Both of the above trials reported that participants had received subcutaneous infusions of DFO prior to trial entry; all treatment had ceased 24 hours (Borgna‐Pignatti 1997) or 48 hours (Yarali 2006) prior to trial entry.
Excluded studies
Following full text eligibility assessment, 57 trials described in 62 references (including secondary publications) were excluded from the review (seeCharacteristics of excluded studies). Two papers were commentaries (Brittenham 2003b; Tsakok 2004); one paper described a series of case reports (Davies 1983); one trial did not report data by intervention group (Eleftheriou 2006); one trial included non‐thalassaemic patients and did not report data separately for patients with thalassaemia (Piga 2007); one cross‐sectional study compared treatment costs (Keshtkaran 2013); one study was published in abstract form only with insufficient information for inclusion and no additional papers in the succeeding years (Galanello 1999). The remaining 50 trials were not randomised controlled trials (Characteristics of excluded studies).
Note: Included within the information above are two trials included in the original review which have now been excluded in this update (Barry 1974; Graziano 1978). One was excluded following further exploration of the methods of the trial and the realisation that it was not a RCT (Barry 1974); and one which was dose‐response cross‐over trial which has no separate outcome data reported for each randomised group (Graziano 1978). One trial, previously listed as awaiting assessment has been translated from German and has now been excluded as it was not a RCT (Andres 1980).
Studies awaiting classification
Sixteen trials described in 21 references and three clinical trials database reports were included in the 'Studies awaiting classification' section of the review. In three of these trials we have been unable to identify any resulting publications (NCT00004982; NCT00115349; N0277104959). In one trial, the method of treatment allocation is unclear and we have been unable to obtain clarification from the authors as to whether treatment allocation was randomised in this trial (Canatan 1999). Two trials published in abstract form only have been listed under 'Studies awaiting classification' as no further publications relating to these trials have been identified and the trial details contained in these abstracts were deemed insufficient for inclusion (Badawi 2010; Unal 2009). A further study could not be conclusively identified as randomised; this study requires translation to further investigate the validity of the methods used before inclusion in the review (Kompany 2009). Nine trials identified from the final search period (June 2011 to March 2013) are also potentially relevant and have also been listed as 'Studies awaiting classification' although these have not been fully evaluated for eligibility (Alpendurada 2012; Aydinok 2012; Evans 2011; Jain 2011; Maggio 2012; Mirbehbahani 2012; Pantalone 2011; Pennell 2010; Pepe 2013).
Risk of bias in included studies
The risk of bias across all included trials is summarised in Figure 2 and detailed below.
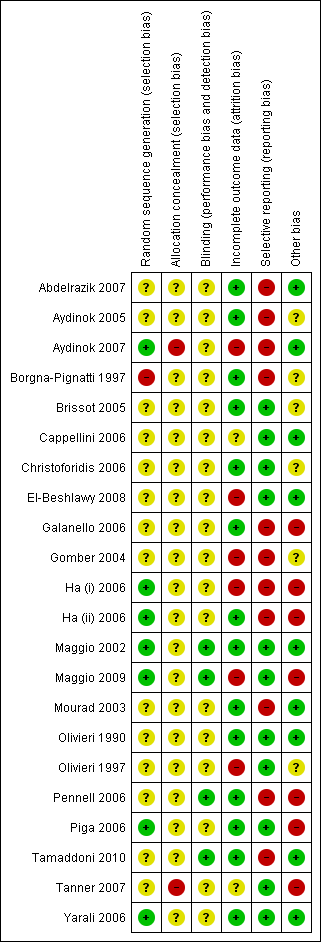
Risk of bias summary: review authors' judgements about each risk of bias item for each included study.
Allocation
Eight trials provided details as to the generation of the randomisation sequence (Aydinok 2007; Borgna‐Pignatti 1997; Ha (i) 2006; Ha (ii) 2006; Maggio 2002; Maggio 2009; Piga 2006; Yarali 2006) which was deemed as low risk in all but one of these trials (Borgna‐Pignatti 1997). In this trial, an alternation method was used for the generation of a random sequence which was considered inadequate with a high risk of bias. Permuted block randomisation was reported in four of these trials (Ha (i) 2006, Ha (ii) 2006; Maggio 2002; Maggio 2009); the remaining trials used a validated system that generates an automated random assignment of numbers to treatment groups (Piga 2006), computer‐generated random numbers (Yarali 2006) or randomisation codes generated and maintained at a site external to the trial site (Aydinok 2007).
The generation of the randomisation sequence was defined as unclear in 14 trials (Abdelrazik 2007; Aydinok 2005; Brissot 2005; Cappellini 2006; Christoforidis 2006; El‐Beshlawy 2008; Galanello 2006; Gomber 2004; Mourad 2003; Olivieri 1990; Olivieri 1997; Pennell 2006; Tamaddoni 2010; Tanner 2007). No description was given in these papers as to which methods were used to generate the random sequence.
Two trials reported that the randomisation sequence was not concealed prior to allocation and the concealment of allocation was therefore deemed inadequate with a high risk of bias (Aydinok 2007; Tanner 2007). The risk of bias associated with concealment of treatment allocation was defined as unclear in the remaining 20 trials as no description was given of the methods used to conceal the allocation of treatment from the clinicians.
Blinding
In 16 trials the use of blinding of participants, clinicians and outcome assessors was not reported and the risk of bias in these trials was unclear (Aydinok 2005; Aydinok 2007; Borgna‐Pignatti 1997; Brissot 2005; Cappellini 2006; Christoforidis 2006; El‐Beshlawy 2008; Galanello 2006; Gomber 2004; Ha (i) 2006; Ha (ii) 2006; Mourad 2003; Olivieri 1990; Olivieri 1997; Tanner 2007; Yarali 2006). Another trial with an unclear risk of bias was reported as an open‐label study although the authors argued that this design "was considered appropriate in view of the differences in the treatment regimes and the fact that any potential bias would be counteracted by the objective nature of the efficacy parameters employed" (Piga 2006). Blinding of participants and clinicians was also unclear in one other trial although the authors of this trial did state that cardiac treatment was undertaken by a clinician blinded to treatment allocation (Abdelrazik 2007).
The blinding of participants and clinicians was not undertaken in four trials, but this is unsurprising given the difference in the methods of administration between treatment arms (Maggio 2002; Maggio 2009; Pennell 2006; Tamaddoni 2010). However, in all four of these trials, outcome assessors were blinded to treatment allocation which was deemed adequate and these trials were therefore considered to have a low risk of bias.
Incomplete outcome data
All but one of the included trials lost fewer than 20% of the randomised participants by the time of statistical analysis of the trial data (Olivieri 1997). This trial only reported outcome data for participants who had completed two years on treatment (Olivieri 1997).
All participants were analysed in the treatment groups to which they had been randomised, with the exception of one trial (Gomber 2004).
Six trials were considered to have a high risk of bias due to incomplete data (Aydinok 2007; El‐Beshlawy 2008; Gomber 2004; Ha (i) 2006; Maggio 2009; Olivieri 1997). The risk of bias was deemed to be unclear in two other trials (Cappellini 2006; Tanner 2007).
An imbalance in missing data across the treatment arms was noted in two trials (Aydinok 2007; Gomber 2004). In the first of these trials four withdrawals were reported; these all occurred in the DFO group (Aydinok 2007). Three withdrawals from the DFO group were also reported in the second trial (Gomber 2004). In this trial, three (30%) of the 10 randomised participants in the DFO alone group were lost to follow up: two participants were excluded and one participant changed treatment groups. No reasons were given as to why two participants were excluded from the trial. Follow‐up data were not presented for the two excluded participants. End‐of‐trial data were analysed according to the treatment received rather than the treatment group to which the participants were randomised. Data from this trial were included in a meta‐analysis within this review as it was clear to the authors which data were missing and what data analysis had been undertaken within the trial. However, given these noted concerns, the results from the meta‐analysis need to be interpreted with caution. A further trial with a high risk of bias reported variable numbers of participants included in the analysis for each outcome (El‐Beshlawy 2008). Whilst the number of withdrawals and reasons were reported, the number of participants withdrawn from the trial conflicts with the number included in each analysis.
One trial lost 46% of randomised participants (Olivieri 1997). Outcome data were presented for 54% of randomised participants.This trial collected and reported outcome data for participants who had completed two years of treatment. Of 71 participants entering the trial, 13 (18%) had withdrawn and 20 (28%) had not completed two years of follow‐up. Outcome data were presented for 54% of randomised participants. This trial was stopped prematurely by the sponsoring pharmaceutical company (Apotex) when concerns were raised about the safety and effectiveness of deferiprone and the company made, as yet unproven allegations, over the conduct of the trial (Nathan 2002; Viens 2004).
Two further trials were prematurely stopped after 18 months (Ha (i) 2006; Ha (ii) 2006). In one trial an unexpected sudden death of a participant in the deferiprone arm prompted the termination of the trial (Ha (i) 2006). The second trial sought to demonstrate an equivalence of treatment, with 80% power and a 0.2 chance of committing a Type 1 error. The trial investigators stated that to achieve this, 26 participants were needed, but to account for a large dropout rate, a total of 60 participants would be required (Ha (ii) 2006). A further trial was stopped early before the planned five years of treatment were completed for all patients due to observed beneficial effects of a reduction of serum ferritin levels in one of the treatment arms (Maggio 2009).
The risk of attrition bias was deemed to be unclear in two other trials (Cappellini 2006; Tanner 2007). In on trial, although the proportion of participants who discontinued treatment was similar in both treatment groups, the number of participants included in each outcome analysis varied and the reasons for this variation were not provided (Cappellini 2006). In a second trial, seven participants (four in the treatment group and three in the comparator group) withdrew from the trial, but the number of participants included in the final outcome assessment was not reported and the risk of bias due to incomplete outcome data was therefore unclear (Tanner 2007).
The remaining 14 trials were deemed to have a low risk of bias for this domain (Abdelrazik 2007; Aydinok 2005; Borgna‐Pignatti 1997; Brissot 2005; Christoforidis 2006; Galanello 2006; Ha (ii) 2006; Maggio 2002; Mourad 2003; Olivieri 1990; Pennell 2006; Piga 2006; Tamaddoni 2010; Yarali 2006).
Selective reporting
Eleven of the included trials were considered to have some risk of bias due to selective reporting (Abdelrazik 2007; Aydinok 2005; Aydinok 2007; Borgna‐Pignatti 1997; Galanello 2006; Gomber 2004; Ha (i) 2006; Ha (ii) 2006; Mourad 2003; Pennell 2006; Tamaddoni 2010). In three of these trials mortality was reported but was not pre‐specified as an outcome (Aydinok 2007; Ha (i) 2006; Ha (ii) 2006).
The remaining eight trials failed to report pre‐specified outcomes. Outcome measures which were pre‐specified in individual trials but not subsequently reported included liver iron concentration (Abdelrazik 2007; Aydinok 2005), total iron binding capacity (Abdelrazik 2007), serum ferritin concentrations (Abdelrazik 2007; Borgna‐Pignatti 1997), iron excretion (Mourad 2003), liver function tests (Gomber 2004; Tamaddoni 2010), hepatic markers (Gomber 2004), monthly or weekly blood counts (Gomber 2004), renal function (Mourad 2003; Tamaddoni 2010), absolute neutrophil count (Pennell 2006; Tamaddoni 2010), alanine aminotransferase (ALT) (Pennell 2006), serum zinc and creatine levels (Pennell 2006). In addition, compliance was pre‐specified as an outcome in two trials (Galanello 2006; Tamaddoni 2010) but no compliance data were reported.
The remaining 11 trials had a low risk of bias due to selective reporting (Brissot 2005; Cappellini 2006; Christoforidis 2006; El‐Beshlawy 2008; Maggio 2002; Maggio 2009; Olivieri 1990; Olivieri 1997; Piga 2006; Tanner 2007; Yarali 2006). All but one reported all pre‐specified outcomes with a low risk of bias due to selective reporting (Yarali 2006). In this trial, inflammation indices were identified as a pre‐specified outcome but were not reported; however, this was considered unlikely to adversely affect the overall conclusions of the trial and therefore this trial was also deemed to have a low risk of selective reporting bias (Yarali 2006).
Other potential sources of bias
Support and sponsorship
Sources of funding were documented by 11 trials (Cappellini 2006; Galanello 2006; Ha (i) 2006; Ha (ii) 2006; Maggio 2002; Mourad 2003; Olivieri 1990; Pennell 2006; Piga 2006; Tamaddoni 2010; Tanner 2007). Two trials received funding from a governmental agency: Medical Research Council of Canada (Olivieri 1990); and a European Community grant (Maggio 2002). One trial was supported by university funds (Tamaddoni 2010) and four received funding from different thalassaemia societies: Children's Thalassaemia Foundation in Hong Kong (Ha (i) 2006; Ha (ii) 2006); Sicilian Thalassaemic Association (Maggio 2002); Cooley's Anemia Foundation (Tanner 2007); UK Thalassaemia Society (Tanner 2007). The Tanner trial also acknowledged funding from CORDA as well as other charitable organisations (Tanner 2007).
Three trials documented sponsorship by the manufacturer of deferiprone (Apotex) (Galanello 2006; Pennell 2006; Tanner 2007). Four trials reported the supplier of the trial treatment deferiprone (Lipomed, Switzerland) (Aydinok 2007; Ha (i) 2006; Ha (ii) 2006; Mourad 2003). Two trials reported the supplier of DFO (Novartis, Basel, Switzerland) (Ha (i) 2006; Ha (ii) 2006); funding from Novartis Pharma was also reported in two other trials (Cappellini 2006; Piga 2006).
One trial was reported as "conducted without the influence of the non‐commercial sponsor"; no further sponsorship details were provided (Maggio 2009).
Power calculations
Seven trials documented power calculations (Cappellini 2006; Ha (i) 2006; Ha (ii) 2006; Maggio 2002; Maggio 2009; Pennell 2006; Tanner 2007). All but one of these trials calculated sample sizes required to obtain 80% power to detect an effect; one trial used a power threshold of 90% (Cappellini 2006). One trial based statistical power calculations on liver iron concentration "to demonstrate noninferiority at a two‐sided alpha level of 5% if the success rates of deferasirox and DFO were 50%" (Cappellini 2006); one trial calculated power based on a 30 ng/ml difference in mean serum ferritin concentration after one year of DFO therapy (Maggio 2002); and two trials based power calculations on a difference in myocardial T2* of 5% (Pennell 2006) or a change of 0.75 SDs (Tanner 2007). All of these trials achieved their target sample sizes. One trial calculated sample sizes based on repeated measure analyses; this trial achieved the target recruitment sample sizes but not all participants completed five years of treatment due to early termination of the trial (Maggio 2009). Two trials calculated power based on liver iron content of participants in earlier pilot studies (Ha (i) 2006; Ha (ii) 2006). Neither of these trials achieved their target recruitment sample sizes due to the trials being stopped early.
Effects of interventions
Details of the baseline and end of trial values for serum ferritin concentration, urinary iron excretion, liver iron concentration and myocardial iron concentration reported by the included trials are presented in an additional table (Table 1).
Results are presented for each comparison. Where there is disparity in the method of outcome data reporting between trials which prohibits the calculation of mean change from baseline in all trials, outcome results are reported as both end of trial data and mean change from baseline. Outcome data in the three multi‐arm trials (three arms) of deferiprone and DFO have been represented in the results sections (A to C) due to the nature of the interventions in these trials (Aydinok 2005; El‐Beshlawy 2008; Gomber 2004). A fourth three‐arm trial of DFO and deferasirox is described in the results section D (Piga 2006).
Most biochemical measures have a set of values known as 'normal ranges'. These are used to determine whether the result measure is acceptable and will be of no harm to an individual (within the normal range) or whether it is unacceptable, and possibly harmful to an individual (outside the normal range). The current normal range for serum ferritin is 17 ng/ml to 30 ng/ml (or mc/gl).
(A) DFO alone compared with deferiprone alone
There were eight comparisons between DFO alone and deferiprone alone (Aydinok 2005; El‐Beshlawy 2008; Gomber 2004; Ha (ii) 2006; Maggio 2002; Olivieri 1990; Olivieri 1997; Pennell 2006).
Primary Outcome
1. Mortality
Only one trial reported mortality as an outcome (Ha (ii) 2006). One death occurred in the deferiprone treatment arm after six months of treatment; this death was attributed to cardiac complications and thought not to be related to deferiprone treatment.
Secondary Outcomes
1. Evidence of reduced end organ damage
Four trials reported cardiac function as an outcome (El‐Beshlawy 2008; Maggio 2002; Olivieri 1997; Pennell 2006). One trial did not report data, only that "there was no significant difference in cardiac function" between treatment arms (El‐Beshlawy 2008). In the Maggio trial, cardiac function was measured by sonography to determine left ventricular ejection fraction (LVEF) (Maggio 2002). In the Pennell trial, cardiac function was assessed using cardiovascular magnetic resonance to measure left ventricular (LV) and right ventricular (RV) end‐systolic and end‐diastolic volume (ESV, EDV) and ejection fraction (EF) (Pennell 2006). In the remaining trial, the method of measurement was not reported, but unpublished data for LVEF were obtained from the original investigators of the Olivieri trial (Olivieri 1997).
Only one trial reported data at six months; Pennell showed no significant difference in mean change of LVEF from baseline between treatment arms, MD ‐1.48% (95% CI ‐3.04 to 0.08) (Pennell 2006) (Analysis 1.1). However, at 12 months, meta‐analysis from the results of three trials showed a significant difference in mean change from baseline for LVEF between treatment arms in favour of deferiprone, MD ‐1.60% (95% CI ‐2.97 to ‐0.24) (Maggio 2002; Olivieri 1997; Pennell 2006) (Analysis 1.1). Considerable heterogeneity was observed between these three trials (I2 = 75%) and the MD using a random‐effects model was no longer significant between treatment arms, MD ‐1.76% (95% CI ‐4.93 to 1.42). No clear clinical differences between the trials were identified which could account for this heterogeneity, although baseline LVEF values were lower (62% and 63%) in the Maggio 2002 trial than those in the Pennell 2006 trial (68.4% and 69.7%). No significant difference in mean change in LVEF was observed between treatment groups at 24 months as reported by one trial, MD 7.60% (95% CI ‐0.65 to 15.85) (Olivieri 1997) (Analysis 1.1).
Data to calculate mean change from baseline were not available for right ventricular ejection fraction (RVEF); however no significant differences were observed in mean RVEF at six months, MD ‐0.60% (95% CI ‐3.08 to 1.88) or 12 months, MD ‐2.30% (95% CI ‐4.82 to 0.22) (Pennell 2006) (Analysis 1.2).
Two trials reported liver fibrosis as an outcome although the first of these did not report results separately for each treatment arm (Ha (ii) 2006; Maggio 2002). In the second trial, liver fibrosis was scored according to the Ishak scoring system (Maggio 2002). There was no significant difference in the mean of fibrosis Ishak scores between treatment arms after 12 months, MD 0.10 (95% CI ‐0.78 to 0.98) (Maggio 2002) (Analysis 1.3).
Evidence of reduced end organ damage as an outcome was not reported by any of the remaining trials.
2. Measures of iron overload
The aim of iron chelation therapy is to reduce serum ferritin and liver iron concentration and increase urinary iron excretion and myocardial T2* measures.
a. Serum ferritin concentration
Six trials reported serum ferritin concentration as an outcome (El‐Beshlawy 2008; Gomber 2004; Ha (ii) 2006; Maggio 2002; Olivieri 1997; Pennell 2006). Data to calculate mean change in serum ferritin concentration from baseline to end of trial were available in all six trials, although in one trial data were presented graphically and the mean change has been estimated from the graph; SDs were not reported in this trial (El‐Beshlawy 2008). Individual trial data for serum ferritin concentration are presented in an additional table (Table 1); mean change from baseline data are shown in a further table (Table 2). Trial results were not pooled due to the pronounced baseline differences between the treatment arms in two trials (Gomber 2004; Pennell 2006) and the variation in treatment duration: six months (Gomber 2004; Ha (ii) 2006; Pennell 2006); 12 months (Maggio 2002; Pennell 2006); and 24 months (Olivieri 1997).
| Trial | No. DFO/deferiprone | DFO: baseline | DFO: end of trial | Absolute change | % change | Deferiprone: baseline | Deferiprone: end of trial | Absolute change | % change |
| 20/18 | 2838 (967) µg/L | approx. 1650 µg/L (estimated from graph) | reduction of approx. 1188 µg/L
| not available | 2926 (1107) µg/L | approx. 900 µg/L (estimated from graph) | reduction of approx. 2026 µg/L
| not available | |
| 7/11 | 5077.2 (1715.0) ng/ml | 3718.3 (738.4) ng/ml | reduction of 1358.9 (1374.14) ng/ml | reduction of 27% | 2672.9 (886.4) ng/ml | 3422.7 (1581.0) ng/ml | increase of 749.8 (1155.8) ng/ml | increase of 28% | |
| 7/6 | not reported | not reported | reduction of 74.2 (1629) mmol/L | not available | not reported | not reported | increase of 398.4 (1073) mmol/L | not available | |
| 73/71 | 2019 (678) ng/ml | 1787 (893) ng/ml | reduction of 232 (619) ng/ml | reduction of 11.4% | 2283 (754) ng/ml | 2061 (853) ng/ml | reduction of 222 (783) ng/ml | reduction of 9.7% | |
| 32/29 | 2795 (2441) µg/L | 2329 (2078.7) µg/L | reduction of 466 (739) µg/L | reduction of 16.7% | 1791 (1029) µg/L | 1610 (980.91) µg/L | reduction of 181 (826) µg/L | reduction of 10.1% |
DFO: desferrioxamine
SD: standard deviation
At six months, two trials showed a statistically significant difference in mean change in serum ferritin concentration from baseline in favour of DFO, MD ‐2108.62 ng/ml (95% CI ‐3334.48 to ‐882.76) (Gomber 2004) and MD ‐465.00 ng/ml (95% CI ‐876.30 to ‐53.70) (Pennell 2006). In a third trial, the mean change in serum ferritin concentration was not significantly different between the two treatment arms, MD 324.20 ng/ml (95% CI ‐1156.81 to 1805.21) (Ha (ii) 2006) (Analysis 1.4).
At 12 months, neither trial showed a significant difference in mean change in serum ferritin concentration between treatment arms, MD ‐10.00 ng/ml (95% CI ‐240.94 to 220.94) (Maggio 2002) and MD ‐285.00 ng/ml (95% CI ‐679.89 to 109.89) (Pennell 2006) (Analysis 1.4).
At 24 months, there was no significant difference in mean change in serum ferritin concentration between treatment arms, MD 185.00 ng/ml (95% CI ‐270.52 to 640.52) (Olivieri 1997) (Analysis 1.4).
b. Urinary iron excretion
Six trials measured urinary iron excretion (Aydinok 2005; El‐Beshlawy 2008; Gomber 2004; Maggio 2002; Olivieri 1990; Olivieri 1997), but only one of these trials presented data to calculate mean change in urinary iron excretion (Maggio 2002). Of the remaining five trials, three reported mean urinary iron excretion after treatment but did not report baseline values (El‐Beshlawy 2008; Gomber 2004; Olivieri 1990). One trial reported mean percentage urinary iron excretion over the period of study, calculated as mean urinary iron excretion divided by total iron excretion (Aydinok 2005). The fifth trial reported only that "the change in urinary iron excretion from baseline to month 24 was not different between DFO and deferiprone subjects" (Olivieri 1997). Individual trial data are presented in additional tables (Table 1; Table 3).
| Treatment regimen | Total iron excretion | Plasma NTBI change | Chelation efficiency | Urinary iron excretion |
| DFO | 0.77 (0.25) mg/kg/day | 0.72 (0.45) mM* | 23.1 (10.7) % | 28 (10.3) % |
| Deferiprone + DFO | 0.69 (0.09) mg/kg/day | 0.84 (0.87) mM* | 7.34 (0.91) % | 84 (10.6) % |
| Deferiprone | 0.56 (0.09) mg/kg/day | 3.00 (0.53) mM* | 6.65 (0.99) % | 98 (14.8) % |
| Comment | Mean value from across 5 measurement points: weeks 1, 12, 26, 38, 54. Calculated as [iron transfused/year (mg) + (LIC at time 0 ‐ LIC at time 1 year) x 10.6 x body weight in kg]/ number of days of treatment. | Plasma non‐transferrin bound iron (NTBI) was measured by HPLC at baseline and at weeks 1, 12, 26 and 54. Data were not reported for the outcome measurements at these time points. | Chelation efficiency calculated as [iron excretion / chelator dose] multiplied by [molecular weight of the respective chelator /56] x n x 100, where 56 is the molecular weight of iron and n is 3 or 1 with deferiprone and DFO respectively. | Urine iron (%) mean over study calculated from mean urine iron excretion / total iron excretion. |
DFO: desferrioxamine
HPLC: high performance liquid chromatography
LIC: liver iron concentration
mM: millimolar (*denotes a concentration of 1 micromole per litre)
SD: standard deviation
i. At end of trial
In two trials there were statistically significant differences in mean urinary iron excretion between the treatment arms, favouring deferiprone in one trial, MD ‐0.20 mg/24h (95% CI ‐0.32 to ‐0.08) (El‐Beshlawy 2008) and favouring DFO in the other trial, MD 4.10 mg/24h (95% CI 0.08 to 8.12) (Maggio 2002). There was no statistically significant difference in mean urinary iron excretion between the treatment arms in the other two trials, MD 3.18 mg/24h (95% CI ‐0.77 to 7.13) (Gomber 2004) and MD 5.90 mg/24h (95% CI ‐1.42 to 13.22) (Olivieri 1990) (Analysis 1.5). In one trial there was a significant difference in mean percentage urinary iron excretion over the trial period, MD ‐70.00% (95% CI ‐82.31 to ‐57.69) (Aydinok 2005) (Analysis 1.6).
Data for this outcome were not pooled overall in a meta‐analysis because the time points for the measurement of urinary iron excretion varied (12 months (Maggio 2002), early after starting treatment (Gomber 2004), 24 hours after starting treatment (Olivieri 1990)) and because of variation in means of measurement (mg/24 hours (Gomber 2004; Olivieri 1990), as a mean of quarterly readings (El‐Beshlawy 2008) and percentage mean urinary iron excretion over the trial (Aydinok 2005)).
ii. Change from baseline
In the trial reporting data to analyse mean change from baseline, there was no statistically significant difference in mean change between the treatment arms, MD ‐0.20 mg/24h (95% CI ‐4.40 to 4.00) (Maggio 2002) (Analysis 1.7).
c. Liver iron concentration
Liver iron concentration was reported as an outcome in five trials (El‐Beshlawy 2008; Ha (ii) 2006; Maggio 2002; Olivieri 1997; Pennell 2006). In one trial, data were presented graphically; baseline and endpoint values are estimated from the graph (El‐Beshlawy 2008). Individual trial data are presented in an additional table (Table 1); mean change from baseline data are also presented in an additional table (Table 4). Liver iron concentration was also measured in one additional trial but individual outcome data were not reported (Aydinok 2005). Liver iron concentration was measured by magnetic spectrometry (SQUID) in one trial (Pennell 2006), by a combination of SQUID and biopsy analysis in one trial (Olivieri 1997) and by atomic spectrophotometry in two trials (Ha (ii) 2006; Maggio 2002). In one trial the method used to assess liver biopsy was not reported (El‐Beshlawy 2008). One trial measured liver iron concentration in a subset of participants (Maggio 2002). The subset comprised participants from both treatment groups who agreed to undergo a liver biopsy; the baseline characteristics of the subset were very similar to the baseline characteristics of the trial participants overall.
| Trial | No. DFO/deferiprone | DFO: baseline | DFO: end of trial | Absolute change | % change | Deferiprone: baseline | Deferiprone: end of trial | Absolute change | % change |
| 15/17 | 22.5 (10.1) mg/g d/w | approx. 11.5 (6.3) mg/g d/w (estimated from graph) | reduction of approx. 11 mg/g d/w | not reported | 15.8 (7.1) mg/g d/w | approx. 7.5 (3.6) mg/g d/w (estimated from graph) | reduction of approx. 8.5mg/g d/w | not reported | |
| 7/6 | not reported | not reported | increase of 2.90 (1.27) mg/g d/w | not available | not reported | not reported | increase of 5.63 (4.24) mg/g d/w | not available | |
| 15/21 | 3516 (2974) µg/g d/w | 3166 (2519) µg/g d/w (end of trial = median 30 months) | reduction of 350 (524) µg/g d/w | reduction of 9.95% | 3363 (5490) µg/g d/w | 2341 (2197) µg/g d/w (end of trial = median 30 months) | reduction of 1022 (3511) µg /g/ d/w | reduction of 30.4% | |
| Olivieiri 1997 | 18/19 | 6.90 (3.82) mg/g d/w liver (end of trial = mean 33 months) | 7.90 (5.52) mg/g d/w | increase of 1.0 mg/g d/w | increase of 14.5% | 8.90 (5.23) mg/g d/w liver | 13.70 (5.23) mg/g d/w liver (end of trial = mean 33 months) | increase of 4.8 mg/g d/w | increase of 53.9% |
| 30/27 | 6.32 (5.8) µg/L | not reported | reduction of 1.54 (2.5) mg/g d/w | reduction of 24.4% | 6.16 (6.0) µg/L | not reported | reduction of 0.93 (2.9) mg/g d/w (‐10% from baseline) | reduction of 10.1%a |
DFO: desferrioxamine
d/w: dry weight liver
SD: standard deviation
aPennell 2006 reports a reduction of 10.1%, although note that this figure is not equal to % of absolute change over baseline value.
i. At end of trial
Liver iron concentration at the end of the trial was reported in three trials (El‐Beshlawy 2008; Maggio 2002; Olivieri 1997). Analysis of these three trials was carried out on a log scale due to the apparent skewing of the data in one of the trials (Maggio 2002).
One trial reported liver iron concentration (mg/kg dry liver weight (d/w)) at 12 months (El‐Beshlawy 2008). At the end of the trial, the mean (SD) liver iron concentration was approximately 11.5 (6.3) mg/g d/w for DFO and 7.5 (3.6) mg/g d/w for deferiprone (Table 1); values of liver iron concentration in the DFO treated patients were 1.5 times higher than in patients treated with deferiprone, ratio of geometric means 1.49 (95% CI 1.06 to 2.09), favouring deferiprone (Analysis 1.8).
One trial reported liver iron concentration (mg/g d/w) at 24 months (Olivieri 1997). The mean (SD) liver iron concentration values at 24 months were 8.90 (2.83) for deferiprone and 7.78 (4.68) for DFO, ratio of geometric means, 1.27 (95% CI 0.90 to 1.80).
Two trials reported end of trial measurements for this outcome at between 30 and 34 months from the start of the trial; the mean (SD) time to end of trial was 34.6 (6.7) months for DFO and 30 (2.4) months for deferiprone (Maggio 2002) and 33 (6.1) months (Olivieri 1997). At the end of the trial, mean liver iron concentration for DFO was 0.51 times that for deferiprone in one trial, ratio of geometric means 0.51 (95% CI 0.36 to 0.71) (Olivieri 1997). In the second trial, mean liver iron concentration in patients who received deferiprone was 1.45 times that in patients who received DFO but this did not reach statistical significance, ratio of geometric means 1.45 (95% CI 0.89 to 2.37) (Maggio 2002) (Analysis 1.8). The results from these two trials were not pooled due to the presence of hepatitis C in 86% of participants in one trial (Maggio 2002) with no details of hepatitis C levels in participants in other trials and the different techniques used to assess liver iron concentration between the trials.
ii. Change from baseline
Five trials reported change from baseline in liver iron concentration (El‐Beshlawy 2008; Ha (ii) 2006; Maggio 2002; Olivieri 1997; Pennell 2006). Liver iron concentration decreased from baseline to the end of the trial in both treatment groups in three trials (El‐Beshlawy 2008; Maggio 2002; Pennell 2006) (Table 4). In these trials, the greatest decrease was observed in the DFO group in two trials (El‐Beshlawy 2008; Pennell 2006) and in the deferiprone group in one trial (Maggio 2002). In two other trials, liver iron concentration had increased at the end of the trial in both treatment groups (Ha (ii) 2006; Olivieri 1997); the increase was greatest in the deferiprone treated group in both trials, favouring DFO.
Four trials reported SDs for mean change from baseline (Ha (ii) 2006; Maggio 2002; Olivieri 1997; Pennell 2006), although the data were skewed in one of these trials and data from this trial were therefore excluded from analysis of mean change from baseline (Maggio 2002). For the remaining three trials, the difference in mean change from baseline between treatment groups was calculated. There was no statistically significant difference in mean change in liver iron concentration in any trial: MD ‐2.73 mg/g d/w at six months (95% CI ‐6.25 to 0.79) (Ha (ii) 2006); MD ‐0.61 mg/g d/w at 12 months (95% CI ‐2.02 to 0.80) (Pennell 2006); and MD ‐0.33 mg/g d/w at 24 months (95% CI ‐3.56 to 2.90) (Olivieri 1997) (Analysis 1.9). Data from these trials were not pooled due to variation in time points for outcome measurements.
d. Myocardial iron concentration
Myocardial T2* was reported as an outcome measure in one trial (Pennell 2006). Results were reported on a log scale as geometric means; baseline and endpoint data are reported in an additional table (Table 1). Low T2* values were an entry criteria in this trial. T2* values increased at six and 12 months in both treatment arms; the increase was two‐fold higher at 12 months in patients who received deferiprone (26.9% increase from baseline) compared with those who received DFO (12.8%). There was a small statistically significant difference between treatment arms in myocardial T2* levels, favouring deferiprone. The geometric mean value of myocardial T2* in patients who received DFO was approximately 10% lower than in patients who received deferiprone after six months, ratio of geometric means 0.92 (95% CI 0.85 to 0.99) and at the end of the trial (12 months), ratio of geometric means 0.90 (95% CI 0.82 to 0.98), favouring deferiprone (Analysis 1.10).
e. Chelation efficiency
Mean chelation efficiency over the trial was reported in one trial (Aydinok 2005) (Table 3). Chelation efficiency was calculated as [Iron excretion (mg/kg/day) / chelator dose (mg/kg/day)] x [molecular weight of the respective chelator /56] x n x 100, where 56 is the molecular weight of iron and n = 3 with deferiprone and n = 1 with DFO. There was a statistically significant difference in mean chelation efficiency in favour of DFO for this treatment comparison, MD 16.45% (95% CI 7.05 to 25.85) (Analysis 1.11).
f. Plasma non‐transferrin bound iron (NTBI)
Plasma NTBI (mM) was measured by one trial (Aydinok 2005) (Table 3). Mean results at the end of treatment (time point not defined) were reported. There was a statistically significant difference in mean plasma NTBI at the end of treatment in favour of the DFO treatment arm, MD ‐2.28 millimolar (mM) (95%CI ‐2.78 to ‐1.78) (Analysis 1.12).
g. Total iron excretion
Total iron excretion (mg/kg/day) at the end of the trial was reported in one trial (Aydinok 2005) (Table 3). Total iron excretion per day was calculated as [iron transfused/year (mg) + (liver iron concentration at time 0 ‐ liver iron concentration at time 1 year) x 10.6 x body weight in kg] / number of days of treatment. There was no statistically significant difference in mean total iron excretion between the treatment arms, MD 0.21 mg/kg/day (95% CI ‐0.01 to 0.43) (Analysis 1.13).
3. Adverse events
Adverse events were reported as an outcome in six trials (El‐Beshlawy 2008; Gomber 2004; Ha (ii) 2006; Maggio 2002; Olivieri 1997; Pennell 2006). However, in one trial the number of adverse events per treatment arm were not reported and data from this trial have therefore not been reported within this review (Ha (ii) 2006). In a further trial, the authors did not differentiate adverse events between the two treatment arms, deferiprone alone and deferiprone in combination with DFO and therefore no data were available for this comparison in the review (Gomber 2004). See an additional table for details of adverse events reported in individual trials (Table 5).
| Trial Name | Prior iron chelation therapy | Intervention | Total Adverse Events | Adverse Event Details | Dose Reduction | Temporary Withdrawal | Permanent Withdrawal |
|
| Prior DFO received at a daily dose of 40 mg/kg/day by sc infusion pump over 8 ‐ 10h, 5 ‐ 7 nights a week for "several years" | DFO | 3/30 | none noteda | none reported | none reported | 0 |
| DFO + Deferiprone | 8/30 | 1/30 (mild arthropathy); 1/30 (vomiting); 2/30 (abdominal pain); 1/30 (diarrhoea)a | none reported | none reported | 0 | ||
|
| Previous DFO therapy. All patients had washout period of 2 weeks with no iron chelation therapy prior to initiating trial treatment | DFO + Deferiprone | not reported | 1/9 (neutropenia wk 4/10 with subsequent agranulocytosis wk 14); 1/9 (arthralgia grade 2); “mild, local reactions observed in several patients treated with DFO”b | none reported | none reported | 1 (agranulocytosis at week 14) |
| Deferiprone | not reported | 1/12 (neutropenia); 1/12 (aseptic meningitis at wk 45); 1/12 (acute cerebellar syndrome with dizziness, tinitus, truncal ataxia)b | none reported | none reported | 1 (acute cerebellar syndrome) | ||
| Prior DFO therapy received by (most 97.4%) participants | DFO | not reported | 7 (deafness/neurosensory deafness/ hypoacusis); 2 (cataracts/lenticular opacities). | Dose interruptions and adjustments: 33.1% | Dose interruptions and adjustments: 33.1% | 12 | |
| Deferasirox | not reported | 15.2% (gastrointestinal symptoms); 10.8% (skin rash); 8 (deafness/ neurosensory deafness/ hypoacusis); 2 (cataracts/lenticular opacities). 2 (transient increase in ALT <2 times normal limit) | Dose interruptions and adjustments: 36.8% (dose reduction of 33 ‐ 50% according to age and creatine levels) | Dose interruptions and adjustments: 36.8% (dose reduction of 33‐50% according to age and creatine levels) | 17 | ||
| not reported | DFO | not reported | 1/23 (neutropenia); 1/23 (jaundice/very high liver enzymes); 5/23 (skin reactions/allergy, swelling); 1/23 (systemic allergy); 1/23 (arthropathy) | 0 | none reported | 0 | |
| DFO + Deferiprone | not reported | 1 /22 (neutropenia); 2/22 (jaundice/very high liver enzymes); 3/22 (skin reactions/allergy, swelling); 6/22 (arthropathy); 3/22 (musculoskeletal pain); 4/22 (nausea/vomiting); 2/22 (weakness, fever); 1/22 (insomnia); 5/22 (anorexia) | 2 (to 50 mg/kg due to arthropathy) | none reported | 1 (jaundice/very high liver enzymes) | ||
| Deferiprone | not reported | 1/21 (agranulocytosis); 1/21 (jaundice/very high liver enzymes); 8/21 (arthropathy); 7/21 (nausea/vomiting); 2/21 (anorexia) | 2 (to 50 mg/kg due to arthropathy) | none reported | 2 (1 agranulocytosis; 1 jaundice/very high liver enzymes) | ||
| Prior iron chelation therapy received: DFO treatment inferred but not explicitly stated | DFO | 2/30 | 1/30 (abscess at site of infusion); 1/30 (allergic reaction); 1/30 (neutropenia); 1/14 (transient increase in ALT three times of upper limit). | none reported | none reported | 0 | |
| DFO + Deferiprone | 7/29 | 5/29 (vomiting); 3/29 (abdominal pain); 1/29 (diarrhoea); 5/12 (transient increase in ALT three times of upper limit) | none reported | none reported | 1 (neutropenia on day two after receiving DFO therapy only) | ||
| not reported | DFO | not reported | no adverse effects observed | 0 | 0 | 0 | |
| Deferiprone (with or without DFO in combination) | not reported | 2/21 (arthropathy of large joints) | 0 | 2 (arthropathy of large joints) | 0 | ||
| All participants had received DFO prior to trial enrolment | DFO | 11/73 | 6/73 (pain/erythema at injection site); 2/73 (ototoxicity); 2/73 (infection); 1/73 (hypertransaminasaemia) | 7 (6 pain and erythema at the injection site; 1 transient hypertransaminasemia). Dose and duration of reduction were not reported | 4 (2 infection (Yersinia enterocolitiica); 2 ototoxicity). Dose and duration of withdrawal were not reported | 0 | |
| Deferiprone | 24/71 | 16/71 (hypertransaminasaemia); 3/71 (nausea); 2/71 (leucopenia); 2/71 (mild joint pain); 1/71 (infection) | 3 (nausea). Dose and duration of reduction were not reported. | 4 (3 transient hypertransaminasemia; 1 infection). Dose and duration of withdrawal were not reported. | 5 (3 recurrence of hypertransaminaesima; 2 leukocytopenia). Timepoint for withdrawal was not reported | ||
| All patients treated with either DFO or deferiprone prior to trial with 1‐week washout period | DFO + Deferiprone | not reported | 15/65 (neutropenia); 5/65 (arthralgia); 7/65 (gastrointestinal problems); 22/65 (>2‐fold increase in ALT) | Dose reduction reported in 25/51 (49%) patients. Dose and duration of reduction were not reported | Number of temporary withdrawals not reported, but "no statistically significant difference in temporary and definitive discontinuation of treatment between the groups" | 12 | |
| Deferiprone | not reported | 3/88 (agranulocytosis); 11/88 (neutropenia); 6/88 (arthralgia); 16/88 (gastrointestinal problems); 23/88 (>2‐fold increase in ALT | Dose reduction reported in 26/46 (56.5%) patients. Dose and duration of reduction were not reported. | Number of temporary withdrawals not reported, but "no statistically significant difference in temporary and definitive discontinuation of treatment between the groups" | 21 | ||
| All participants had received DFO prior to trial enrolmente | DFO | not reported | 12/14 (problems at site of injection: pain, itching, erythema, swelling and induration) | none reported | 0 | 0 | |
| DFO + Deferiprone | not reported | 5/11 (nausea); 3/11 (joint pain/swelling/stiffness) | none reported | 0 | 0 | ||
| not reported | Deferiprone | not reported | 2/27 (agranulocytosis) | none reported | none reported | 2 (2 x agranulocytosis) | |
| DFO | not reported | 0/30 (agranulocytosis) | none reported | none reported | 0 | ||
| All participants had received DFO prior to trial enrolment. | DFO | not reported | 12/31 (local reactions at infusion site); 6/31 (pain/swelling in joints) | none reported | none reported | none reported | |
| Deferiprone | not reported | 19/29 (gastrointestinal disturbance); 9/29 (increased appetite); 8/29 (pain/ swelling in joints); 1/29 (neutropenia) | 0 | 0 | 0 | ||
| All participants had received DFO at a mean daily dose of >30 mg/kg 5 days/week for at least 4 weeks prior to 5‐day washout period | DFO | 21/23 | 3/23 (arthralgia); 8/23 (abdominal pain); 2/23 (nausea); 2/23 (vomiting); 8/23 (back pain); 4/23 (cough); 6/23 (pyrexia); 6/23 (rhinitis); 4/23 (asthenia); 4/23 (headache); 8/23 (pharyngitis); 6/23 (diarrhoea); 6/23 (pharyngolaryngeal pain); 5/23 (influenza); 2/23 (dyspepsia); 4/23 (influenza‐like); 3/23 (vertigo); 1/23 (urinary tract infection); 1/23 (bronchitis)* | Dose reduction reported in 4/23 (17.4%) patients. Dose and duration of reduction were not reported. | 5 (due to adverse events) | 2 | |
| Deferasirox 10mg/kg/day | 24/24 | 4/24 (arthralgia); 14/24 (abdominal pain); 2/24 (nausea); 8/24 (back pain); 5/24 (cough); 7/24 (pyrexia); 7/24 (rhinitis); 3/24 (asthenia); 9/24 (headache); 10/24 (pharyngitis); 7/24 (diarrhoea); 5/24 (pharyngolaryngeal pain); 1/24 (influenza); 1/24 (dyspepsia); 7/24 (influenza‐like); 5/24 (vertigo); 4/24 (urinary tract infection); 5/24 (bronchitis)* | Dose reduction reported in 13/24 (54.2%) patients. Dose and duration of reduction were not reported. | 5 (due to adverse events) | 0 | ||
| Deferasirox 20mg/kg/day | 23/24 | 2/24 (arthralgia); 9/24 (abdominal pain); 8/24 (nausea); 8/24 (vomiting); 10/24 (back pain); 10/24 (cough); 10/24 (pyrexia); 9/24 (rhinitis); 7/24 (asthenia); 7/24 (headache); 7/24 (pharyngitis); 6/24 (diahorrea); 6/24 (pharyngolaryngeal pain); 5/24 (influenza); 4/24 (dyspepsia); 3/24 (influenza‐like); 2/24 (vertigo); 1/24 (urinary tract infection); 4/24 (allergic conjunctivitis)* | Dose reduction reported in 14/24 (58.3%) patients. Dose and duration of reduction were not reported. | 11 (due to adverse events) | 2 | ||
| All participants had received DFO prior to trial enrolment. | DFO | not reported | 1/40 (abscess at site of infusion); 11/40 (skin allergic reactions) | None reported | 0 | 0 | |
| DFO + Deferiprone | not reported | 3/40 (nausea); 3/40 (nausea with abdominal pain); 2/40 (diarrhoea); 2/40 (arthralgia); 8/40 (transient fluctuations in serum alanine ALT levels) | Temporary deferiprone dose reduction reported in "some" patients with gastrointestinal disturbances | 0 | 0 | ||
| Prior DFO received: mean (SD) dose 36.4 (11.1) mg/kg per day for 5.5 day/week (equivalent to 40.5 mg/kg for 5 days/week). No prior deferiprone received | DFO + placebo | not reported | 24% (gastrointestinal symptoms – generally mild); 6% (reactions at infusion site); 18% (joint pain/swelling) | none reported | none reported | 3 (1 x artrial fibrillation; 2 x personal reasons) | |
| DFO + Deferiprone | not reported | 38% (gastrointestinal symptoms – generally mild); 3% (reactions at infusion site); 9% (joint pain/swelling); 1/28 (agranulocytosis; 2/28 (neutropenia) | none reported | none reported | 4 (1 x agranulocytosis; 1 x reduction of myocardial T2* to <8ms; 1 x gastrointestinal symptoms; 1 x personal reasons) | ||
| All participants had received DFO 40 ‐ 50 mg/kg/day over 10 hours prior to study | DFO (bolus injection) | not reported | 30% (mild pain during injection); 70% (slight redness and painless swelling) | none reported | none reported | none reported | |
| DFO (continuous infusion) | not reported | 60% (painless swelling); 20% (hyperemia) | none reported | none reported | none reported |
ALT: alanine aminotransferase
DFO: desferrioxamine
sc: subcutaneously
SD: standard deviation
aAbdelrazik 2007: 2 participants reported taste disorders and 1 patient reported transient dizziness and fatigue but type of therapy received by these participants was not reported in these patients.
bAydinok 2007: 5 participants developed nausea but type of therapy received by these participants was not reported.
cGomber 2004: Results for all participants receiving deferiprone alone or in combination were reported together in the paper.
dMaggio 2009: the period of observation for adverse effects was 307.98 person‐years for combined deferiprone and DFO and 274.52 person‐years for deferiprone only.
eMourad 2003: Other reported adverse events were fatigue (1); loss of appetite (1); headache (3); transient skin rash (2); abdominal discomfort (2). Treatment group was not reported for these adverse events which did not result in discontinuation of therapy.
fTanner 2007: 28 participants completed combination treatment but actual sample sizes in which adverse events reported is unclear.
*Piga 2006 ‐ only adverse events that occurred in 4 or more patients were reported
One trial reported data that enabled a comparison of the risk of experiencing any adverse event (Maggio 2002). In this trial, the risk of experiencing an adverse event in participants receiving DFO was lower compared with those receiving deferiprone, this result was statistically significant, RR 0.45 (95% CI 0.24 to 0.84) (Analysis 1.14; Figure 3). The remaining trials did not provide enough data to allow for an analysis of the risk of experiencing cumulative adverse events between the treatment arms.
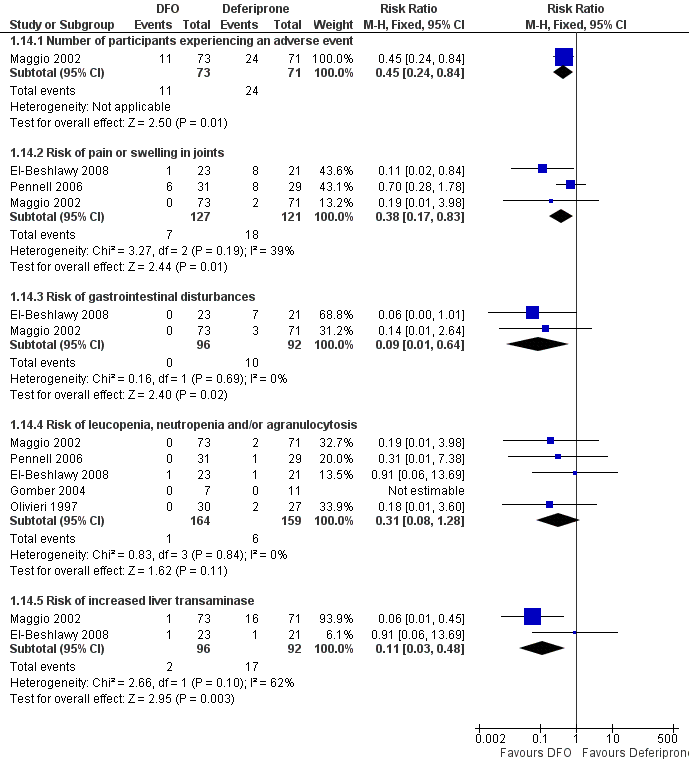
Forest plot of comparison: 1 DFO alone versus deferiprone alone, outcome: 1.14 Adverse events.
Permanent treatment withdrawal due to adverse events was reported in two trials (El‐Beshlawy 2008; Maggio 2002). All of the permanent treatment withdrawals in both trials occurred in patients who received deferiprone. Only one trial reported temporary treatment withdrawals which occurred in four participants in each treatment arm (Maggio 2002).
Two trials reported dose reduction due to adverse events (El‐Beshlawy 2008; Maggio 2002); both trials reported dose reduction in the deferiprone treatment arm, due to arthropathy (El‐Beshlawy 2008) and nausea (Maggio 2002). Only one of these trials reported details of the reduction in deferiprone: the dose was reduced to 50 mg/kg (El‐Beshlawy 2008). The Maggio trial also reported dose reduction in patients receiving DFO alone, due to pain or erythema or transient hypertransaminaemia (Maggio 2002).
Joint pain or arthralgia was reported as an adverse event in four of the five trials; two of these documented joint pain in both treatment arms (El‐Beshlawy 2008; Pennell 2006), whereas in a third trial joint pain was only reported in patients who received deferiprone (Maggio 2002). The fourth trial reported joint pain in patients who received deferiprone (with or without DFO in combination) but no joint pain was reported in patients receiving DFO alone (Gomber 2004). Meta‐analysis of data from the three trials showed a significantly lower risk of joint pain or arthralgia associated with DFO, RR 0.38 (95% CI 0.17 to 0.83) (El‐Beshlawy 2008; Maggio 2002; Pennell 2006) (Analysis 1.14).
Three trials reported gastrointestinal symptoms in the form of nausea or vomiting in patients receiving deferiprone (El‐Beshlawy 2008; Maggio 2002; Pennell 2006). No cases of nausea or vomiting were reported in the DFO treatment arm although in one trial an absence of gastrointestinal symptoms in participants receiving DFO could not be clearly inferred (Pennell 2006). A meta‐analysis of two trials showed a significantly lower risk of nausea or vomiting, or both, associated with DFO, RR 0.09 (95% CI 0.01 to 0.64) (El‐Beshlawy 2008; Maggio 2002) (Analysis 1.14).
Five trials reported incidence of neutropenia or leucopenia, or both (El‐Beshlawy 2008; Gomber 2004; Maggio 2002; Olivieri 1997; Pennell 2006). In two of these trials, one case of neutropenia (Maggio 2002) and two cases of leucopenia (Pennell 2006) were reported only in patients who received deferiprone. Three cases of agranulocytosis were observed in a third trial, all of which occurred in patients who received deferiprone (Olivieri 1997). The fourth trial reported one case of neutropenia which occurred in a patient treated with DFO and one case of agranulocytosis in a patient who received deferiprone (El‐Beshlawy 2008). No cases of neutropenia or leucopenia were observed in the Gomber trial (Gomber 2004). When data were pooled across trials, neither treatment arm showed a significantly increased risk of neutropenia, leucopenia or agranulocytosis (or a combination of these), RR 0.31 (95% CI 0.08 to 1.28) (Analysis 1.14).
Two trials observed increased liver transaminase in patients receiving either deferiprone or DFO, reported as: hypertransaminaemia (Maggio 2002); or jaundice and very high liver enzymes (El‐Beshlawy 2008). Maggio reported only one case of hypertransaminaemia in patients who received DFO compared with over 20% of patients who received deferiprone, RR 0.06 (95% CI 0.01 to 0.45) (Maggio 2002) (Analysis 1.14). The second trial reported two patients (one in each treatment group) with jaundice or very high liver enzymes, RR 0.91 (95% CI 0.06 to 13.69) (El‐Beshlawy 2008). The combined risk of increased liver transaminase was significantly lower in patients treated with DFO than deferiprone, RR 0.11 (95% CI 0.03 to 0.48) (Analysis 1.14). One other trial reported that the difference between the DFO and deferiprone treated groups in change of ALT at 12 months was not significant (Pennell 2006).
Three trials reported adverse events specifically related to the administration of DFO, including skin reactions or swelling (5 out of 23, 21.7%) and systemic allergy (1 out of 23, 4.3%) (El‐Beshlawy 2008); pain or erythema at site of injection (6 out of 73) (Maggio 2002); and local reactions at infusion site (12 out of 31, 38.7%) (Pennell 2006).
Other adverse events reported in patients receiving deferiprone included infection (Maggio 2002) and anorexia (El‐Beshlawy 2008).
4. Participant compliance
Participant compliance with iron chelation was measured in four trials (El‐Beshlawy 2008; Ha (ii) 2006; Olivieri 1997; Pennell 2006); see an additional table for individual trial data (Table 6). Two of these trials did not provide data for this outcome (El‐Beshlawy 2008; Ha (ii) 2006). Although the first of these reported "excellent compliance during the study period" and documented four patients who were excluded from the trial due to lack of compliance, all of whom were randomised to the DFO treatment arm (El‐Beshlawy 2008). At 12 months, there was no significant difference in participant compliance between treatment groups, MD ‐1.00% (95% CI ‐4.88 to 2.88) (Analysis 1.15). However, in one trial at three years, there was a statistically significant difference in participant compliance in favour of deferiprone, MD ‐23.30% (95%CI ‐25.08 to ‐21.52) (Olivieri 1997) (Analysis 1.15).
| Study | Intervention | How measured? | Compliance Rate |
| DFO | Audit | No results reported | |
| DFO + Deferiprone | Audit | No results reported | |
| DFO + Deferiprone | Drug accounting at each visit ‐ counting the used vials of DFO and study‐specific questionnaire completed by patient or legal guardian at quaterly intervals | “Generally excellent during the entire study period” – no further details provided | |
| Deferiprone | Drug accounting at each visit ‐ counting returned empty blisters of deferiprone and study‐specific questionnaire completed by patient or legal guardian at quarterly intervals | “Generally excellent during the entire study period”. Only 1 patient who missed more than 1 chelation dose per week due to problems with swallowing | |
| DFO | Drug accounting at each visit: counting returned used vials of DFO | "Compliance excellent during study period". 4 patients were excluded due to lack of compliance (time point not stated) | |
| DFO + Deferiprone | Drug accounting at each visit; counting returned empty blisters of deferiprone and used vials of DFO | "Compliance excellent during study period". 80% patients complained about difficulties in the parenteral use of DFO or problems inserting the needle. 1 patient dropped out for reasons of non‐compliance | |
| Deferiprone | Drug accounting at each visit; counting returned empty blisters of deferiprone | "Compliance excellent during study period". 76% patients complained about difficulties in the parenteral use of DFO or problems inserting the needle | |
| DFO | Diary cards, weekly physical exam of infusion sites & by the Crono infusion pump that recorded the number of completed infusions | 95.7 (5.7)% | |
| DFO + Deferiprone | DFO: diary cards, weekly physical exam of infusion sites & by the Crono infusion pump that recorded the number of completed infusions Deferiprone: pill counts, diary cards & an electronic cap that recorded the time & date of each opening of the tablet container | 96.1 (5.0)% (compliance with DFO) | |
| DFO | By reviewing the diaries maintained by the patients or their parents at each visit | No results reported | |
| DFO + Deferiprone | By reviewing the diaries maintained by the patients or their parents at each visit | No results reported | |
| DFO | By reviewing the diaries maintained by the patients or their parents at each visit | No results reported | |
| Deferiprone | By reviewing the diaries maintained by the patients or their parents at each visit | No results reported | |
| DFO | Not reported | Compliance was not reported as an outcome in this trial. However the authors do note that 7/73 participants (10%) took a reduce dose of DFO due to low compliance. The dosage, duration and outcome of this change were not reported | |
| Deferiprone | Not reported | Compliance was not reported as an outcome in this trial. However the authors do note that 4/71 participants (6%) took a reduce dose of deferiprone due to low compliance. The dosage, duration and outcome of this change were not reported | |
| DFO + Deferiprone | By counting pills in each returned bag of deferiprone and assessing the number of infusions of DFO registered on the electronic pump | Deferiprone mean (SD): 92.7 (15.2)% (range 27% ‐ 100%); DFO: 70.6 (24.1)% (range 25 ‐ 100%) | |
| Deferiprone | By counting pills in each returned bag of deferiprone | Deferiprone mean (SD): 93.6 (9.7)% (range 56% ‐ 100%) | |
| DFO | By counting the number of vials of DFO used. Trial does not report what constituted "adequate levels of adherence", but rates compliance as 'excellent' or 'good' | Excellent (taking >90% of recommended dose): 11 participants | |
| DFO + Deferiprone | By counting the number of vials of DFO or tablets of deferiprone used. Trial does not report what constituted "adequate levels of adherence", but rates compliance as 'excellent' or 'good'. | Excellent (taking >90% of recommended dose): 10 participants | |
| DFO | Ambulatory pumps. Trial does not report what constituted "adequate levels of adherence" | DFO mean (SD): 71.6 (22.5)% | |
| Deferiprone | Computerised bottles. Trial does not report what constituted "adequate levels of adherence" | Deferiprone mean (SD): 94.9 (6.69)% | |
| DFO | Calculated as the percent of completed infusions, as determined by the Crono pumps, divided by the number of infusions prescribed. Trial does not report what constituted "adequate levels of adherence" | DFO mean (SD): 93 (9.7)% | |
| Deferiprone | Using the medication event monitoring system device and calculated as the % of openings with an interval >4 hours recorded, divided by the number of doses prescribed. Trial does not report what constituted "adequate levels of adherence" | Deferiprone mean (SD): 94 (5.3)% | |
| DFO | % complete infusions divided by prescribed infusions | DFO mean (SD): 92.6 (12.7)% | |
| DFO + Deferiprone | Pill counting at bimonthly visits; % of complete DFO infusions divided by prescribed infusions. | DFO mean (SD): 91.4 (12.7)%; deferiprone mean (SD): 82.4 (18.1)% |
DFO: desferrioxamine
SD: standard deviation
5. Cost of treatment
The cost of treatment was reported in one trial (Gomber 2004). Full details are presented in an additional table (Table 7).
| Variables | DFO | DFO + deferiprone | Deferiprone |
| Cost of drug | 180 = Rs.150 for vial of 500 mg + Rs. 30 for needle and syringe | Rs. 198 | Rs. 18 = Rs. 6 per 250 mg capsule, 3 capsules daily |
| Cost of treatment per week | Rs. 900 | Rs. 486 | Rs. 126 |
| Cost of treatment for 6 months | Rs. 21600 | Rs. 11664 | Rs. 3024 |
DFO: desferrioxamine
Rs ‐ Rupees
As this trial was undertaken in India, cost is presented in rupees. In a comparison of the costs of treatment per week of deferiprone versus DFO; deferiprone was the cheaper treatment: 126 rupees with deferiprone and 900 rupees with DFO. Costs were based on a participant weighing 10 kg.
(B) DFO and deferiprone in combination compared with deferiprone alone
There were five comparisons between DFO and deferiprone in combination with deferiprone alone (Aydinok 2005; Aydinok 2007; El‐Beshlawy 2008; Gomber 2004; Maggio 2009).
Primary Outcome
1. Mortality
Mortality was reported in two trials (Aydinok 2007; Maggio 2009). In the first trial, one individual who was randomised to receive deferiprone and DFO in combination, died at the start of the trial due to arrhythmia‐induced congestive heart failure (Aydinok 2007). One death due to arrhythmia whilst receiving deferiprone and DFO in combination was also reported in the second trial (Maggio 2009). In this latter trial, a further five deaths were reported in patients in whom the randomised treatment was withdrawn and treatment changed to DFO alone due to adverse events; mortality occurred 11 to 60 months after withdrawal of the randomised treatment.
Secondary Outcomes
1. Evidence of reduced end organ damage
Two trials reported evidence of reduced end organ damage as an outcome, although El‐Beshlawy reported only that "there was no significant difference in cardiac function" between treatment arms (Aydinok 2007; El‐Beshlawy 2008). In the Aydinok trial, cardiac function was measured by echocardiogram to determine LVEF (%) (Aydinok 2007). In this trial, the mean LVEF after 12 months was not significantly different between the two treatment arms, MD 5.20% (95% CI ‐1.99 to 12.39) (Analysis 2.1).
One trial reported liver fibrosis as an outcome, scored according to the Ishak scoring system (Aydinok 2007). In this trial, results were presented graphically; the trial authors reported that the fibrosis score "did not change significantly after one year in patients in any of the treatment arms".
2. Measures of iron overload
a. Serum ferritin concentration
Four trials reported serum ferritin concentration as an outcome; individual trial data are shown in an additional table (Aydinok 2007; El‐Beshlawy 2008; Gomber 2004; Maggio 2009) (Table 1); mean change from baseline data are reported in a further table (Table 8). One trial presented data graphically and the mean change has been estimated from the graph; SDs were not reported in this trial (El‐Beshlawy 2008).
| Trial | No. | DFO with deferiprone: baseline | DFO with deferiprone: end of trial | Absolute change | % change | Deferiprone: baseline | Deferiprone: end of trial | Absolute change | % change |
| 12/8 | 4070 (3223) µg/L | 3209 (2279) µg/L | reduction of 861 µg/L (SD not reported) | reduction of 32% | 4350 (3342) µg/L | 2954 (2765) µg/L | reduction of 1396 µg/L (SD not reported) | reduction of 32% | |
| 20/18 | 2865 (983) µg/L | approx. 1050 µg/L (estimated from graph) | reduction of approx. 1815 µg/L | not available | 2926 (1107) µg/L | approx. 900 µg/L (estimated from graph) | reduction of approx. 2026 µg/L | not available | |
| 10/11 | 3347.78 (1526.46) ng/ml | 3376.57 (1222.41) ng/ml | increase of 28.79 (915.86) ng/ml | increase of 0.9% | 2672.90 (886.44) ng/ml | 3422.66 (1581.01) ng/ml | increase of 749.75 (1155.77) ng/ml | increase of 28% | |
| 78/74 (12 months); 32/26 (5 years) | 1787 (735) ng/ml | 12 months: 1400 (770) ng/ml 5 years: 1369 (816) ng/mla | 12 months: reduction of 417 (589) ng/ml 5 years: reduction of 396 (894) ng/mla | not availablea | 1890 (816) ng/ml | 12 months: 1633 (+/‐ 841) ng/ml 5 years: 1588 (+/‐ 1217) ng/mla | 12 months: reduction of 132 (724) ng/ml 5 years: reduction of 115 (1009) ng/mla | not availablea |
DFO: desferrioxamine
anot all patients completed follow up due to the trial being stopped early. Baseline values are shown for all randomised patients whereas endpoint values are given only for patients who completed follow‐up
i. At end of trial
Of the three trials which reported SDs for end of trial data (Aydinok 2007; Gomber 2004; Maggio 2009), none showed a significant difference between treatment arms in serum ferritin concentration after six months, MD ‐46.10 ng/ml (95% CI ‐1248.98 to 1156.78) (Gomber 2004) or after 12 months, MD 255.00 ng/ml (95% CI ‐2054.49 to 2564.49) (Aydinok 2007); and MD ‐233.00 ng/ml (95% CI ‐489.74 to 23.74) (Maggio 2009) (Analysis 2.2). The latter trial reported data for each year over five years of follow up; these results are described as change from baseline below.
ii. Change from baseline
Data to calculate mean change in serum ferritin from baseline to end of trial were available in two trials (Gomber 2004; Maggio 2009). In the Gomber trial there was no statistically significant difference in mean change in serum ferritin concentration between the two treatment arms, MD ‐720.96 ng/ml (95% CI ‐1609.06 to 167.14) (Gomber 2004) (Analysis 2.3). Mean serum ferritin concentration increased from baseline to six month end of trial in both treatment arms, the greater increase was observed in the deferiprone arm.
The Maggio trial reported results for up to five years of follow up (Maggio 2009). After one year of follow up, both arms of the trial reported a reduction in serum ferritin concentration with a significantly greater reduction in patients receiving deferiprone in combination with DFO, MD ‐285.00 ng/ml (95% CI ‐495.47 to ‐74.53) (Analysis 2.3). A reduction in serum ferritin concentration was maintained across the five years of follow up in the combined treatment arm. In patients receiving deferiprone only, a reduction in mean serum ferritin concentration from baseline values was observed at two and five years of follow up although an increase was reported at three and four years of follow up. A significant difference in mean change of serum ferritin concentration in patients receiving deferiprone in combination with DFO was maintained over four years of follow up. At four years, MD ‐579.00 ng/ml (95% CI ‐1041.89 to ‐116.11) (Analysis 2.3). At five years, there was no significant difference in mean change of serum ferritin concentration between the two treatment arms, MD ‐281.00 ng/ml (95% CI ‐777.35 to 215.35) (Analysis 2.3) although the number of patients in each treatment arm was considerably reduced after five years of follow up due to early termination of the trial.
b. Urinary Iron excretion
Urinary iron excretion at the end of the trial was reported in two trials; as a percentage mean over the trial (Aydinok 2005) and as a mean of quarterly readings in the second trial (El‐Beshlawy 2008). In a third trial, 24‐hour urinary iron excretion was measured soon after starting the first dose of iron chelation therapy (Gomber 2004). None of these trials presented data to calculate mean change in urinary iron excretion. Individual trial data are presented in an additional table (Table 1).
In one trial, there was a statistically significant difference in mean urinary iron excretion over the period of study between treatment arms, favouring deferiprone monotherapy, MD ‐14.00% (95% CI ‐27.13 to ‐0.87) (Aydinok 2005) (Analysis 2.4). There was no statistically significant difference in mean urinary iron excretion between treatment arms in the remaining two trials, MD 2.36 mg/24 h (95% CI ‐0.98 to 5.70) (Gomber 2004) and MD 0.07 mg/24 h (95% CI ‐0.10 to 0.24) (El‐Beshlawy 2008) (Analysis 2.5). Data for mean urinary iron excretion after treatment was not pooled overall in a meta‐analysis because of variation in the methods of measurement.
c. Liver iron concentration
Five trials measured liver iron concentration (Aydinok 2005; Aydinok 2007; El‐Beshlawy 2008; Gomber 2004; Maggio 2009). However, in the Gomber trial, liver iron concentration, although measured, was not reported as an outcome (Gomber 2004). Liver iron concentration was measured by atomic emission spectrophotometry in one trial (Aydinok 2007). A second trial measured liver iron content by T2* MRI in a subset of patients with a mean (SD) duration from entry into the trial until the final MRI scan of 16 (5) months in the combined deferiprone and DFO group and 14 (6) months in patients receiving deferiprone alone (Maggio 2009). The method used for liver biopsy assessment was not reported in two trials (Aydinok 2005; El‐Beshlawy 2008).
In the 2005 Aydinok trial, liver iron concentration was measured but data were not individually reported (Aydinok 2005). In addition, one trial presented data graphically and the mean change was estimated from the graph (El‐Beshlawy 2008). Data to calculate mean change in liver iron concentration from baseline to end of trial were available in two trials, although SDs could not be calculated (Aydinok 2007; Maggio 2009 (Table 9). Data to calculate the mean liver iron concentration (mg/g dry weight) at the end of the trial was reported in all three trials (El‐Beshlawy 2008; Aydinok 2007; Maggio 2009).
In the two trials reporting liver iron concentration after 12 months of treatment, the combined mean difference from meta‐analysis of these two trials was not significant: 1.45 mg/g d/w (95% CI ‐0.91 to 3.82) (Aydinok 2007; El‐Beshlawy 2008) (Analysis 2.6). The trial measuring liver iron concentration by T2* MRI showed a reduction in liver T2* with deferiprone alone compared with an increase in liver T2* with combined chelation therapy (Maggio 2009) (Table 9). The differences in follow‐up time across this subset of patients prohibited calculation of the mean change in liver iron concentration; however the trial reported no significant differences in the T2* signals of the liver between the two treatment groups (Maggio 2009).
d. Myocardial iron concentration
Myocardial T2* was reported as an outcome in one trial (Maggio 2009); baseline and endpoint data for this trial are shown in an additional table (Table 1). In this trial, myocardial iron concentration was measured by T2* MRI in a subset of patients with a mean (SD) duration from entry into the trial until the final MRI scan of 16 (5) months in the combined deferiprone and DFO group and 14 (6) months in patients receiving deferiprone alone. The differences in duration of follow up across this subset of patients prohibited calculation of the mean change in myocardial iron concentration; however the trial reported no significant differences in the T2* signals of the heart between the two treatment groups.
e. Chelation efficiency
Chelation efficiency (%) was reported by one trial (as described in the previous comparison) (Aydinok 2005) (Table 3). There was no statistically significant difference in chelation efficiency between the treatment arms, MD 0.69% (95%CI ‐0.15 to 1.53) (Analysis 2.7).
f. Plasma non‐transferrin bound iron (NTBI)
Plasma NTBI was measured in one trial as change in concentration from baseline (Aydinok 2005) (Table 3). Concentration was measured as millimolar (mM). Mean results at the end of treatment (time point not defined) were reported. There was a statistically significant difference in mean plasma NTBI in at the end of treatment in favour of deferiprone and DFO, MD ‐2.16 mM (95% CI ‐2.83 to ‐1.49) (Analysis 2.8).
g. Total iron excretion
Two trials reported total iron excretion (Aydinok 2005; Aydinok 2007). In both trials, total iron excretion per day was calculated as:
[iron transfused/year (mg) + (liver iron concentration at time 0 ‐ liver iron concentration at time 1 year) x 106 x body weight in kg] / number of days of treatment.
In the first trial total iron excretion was reported at the end of the trial (Aydinok 2005) (Table 3). There was a statistically significant difference in mean total iron excretion in favour of deferiprone combined with DFO, MD 0.13 mg/kg/day (95% CI 0.05 to 0.21) (Analysis 2.9). In the second trial, mean change in total iron excretion from baseline was reported (Aydinok 2007). In this trial, the difference in mean change in total iron excretion in favour of deferiprone and DFO compared with deferiprone alone was also significant, MD 0.21 mg/kg/day (95% CI 0.03 to 0.39) (Analysis 2.9).
3. Adverse events
Adverse events were reported as an outcome in four trials (Aydinok 2007; El‐Beshlawy 2008; Gomber 2004; Maggio 2009). The Gomber trial did not report adverse events per treatment arm, i.e. between patients who received deferiprone alone or deferiprone with DFO, and therefore adverse events in this trial could not be incorporated into the meta‐analyses (Gomber 2004). See an additional table for details of adverse events reported in the individual trials (Table 5).
None of the trials reporting adverse events provided sufficient data to allow an analysis of the risk of experiencing cumulative adverse events between the treatment arms.
Permanent treatment withdrawal due to adverse events was observed in three trials (Aydinok 2007; El‐Beshlawy 2008; Maggio 2009); this occurred in patients who received deferiprone alone and deferiprone with DFO in all three trials. Temporary treatment withdrawal was reported in one trial in participants receiving deferiprone (with or without DFO) due to arthropathy (Gomber 2004). Additionally, Maggio reported temporary treatment withdrawals, stating "no statistically significant difference in temporary and definitive discontinuation of treatment between the groups", but no further data were provided (Maggio 2009).
Two trials reported dose reduction (El‐Beshlawy 2008; Maggio 2009). In the first of these trials, the dose of deferiprone was reduced to 50 mg/kg due to arthropathy; this was reported in four patients (two in each treatment arm) (El‐Beshlawy 2008). In the latter trial, dose reduction was reported in 49% (deferiprone alone) and 56.5% (deferiprone with DFO) of participants; no further details were given (Maggio 2009).
Joint pain was observed in three trials (Aydinok 2007; El‐Beshlawy 2008; Maggio 2009). In one trial, joint pain or arthralgia occurred in over 30% of all patients who received deferiprone (with or without DFO) (El‐Beshlawy 2008). The combined risk of joint pain was not significantly higher for either treatment group, RR 0.97 (95% CI 0.50 to 1.90) (Analysis 2.10).
Two trials reported gastrointestinal disturbance or nausea or vomiting in both treatment arms, although neither treatment arm was associated with an increased risk, RR 0.58 (95 % CI 0.30 to 1.11) (El‐Beshlawy 2008; Maggio 2009) (Analysis 2.10). The third trial also reported nausea and vomiting, but for both treatment arms combined and therefore, results could not be combined in a meta‐analysis (Aydinok 2007).
Leucopenia or neutropenia, or both, were reported in three trials, in patients who received deferiprone alone and in patients who received deferiprone in combination with DFO (Aydinok 2007; El‐Beshlawy 2008; Maggio 2009). One patient in the combined treatment group with neutropenia reported in the Aydinok trial subsequently developed agranulocytosis (Aydinok 2007). Agranulocytosis was also observed in a total of four patients who received deferiprone alone (El‐Beshlawy 2008; Maggio 2009). No significant increased risk of leucopenia, neutropenia or agranulocytosis (or a combination of these) was associated with either treatment group, RR 1.41 (95% CI 0.76 to 2.61) (Analysis 2.10).
Two trials observed increased liver transaminase in patients receiving either deferiprone or the combined therapy, reported as at least two‐fold increase in ALT (Maggio 2009) or jaundice or very high liver enzymes (El‐Beshlawy 2008). Meta‐analysis of these two trials showed that neither treatment arm was associated with a significantly increased risk of high liver transaminase, RR 1.37 (95% CI 0.85 to 2.21) (Analysis 2.10). A third trial reported "transient fluctuations" in ALT levels in patients who received DFO with deferiprone but no change in ALT levels in those who were treated with DFO alone (Aydinok 2007).
Two trials reported adverse events specifically related to the administration of DFO (Aydinok 2007; El‐Beshlawy 2008). The first of these reported "mild local reactions observed in several patients treated with DFO" (Aydinok 2007), whilst the second reported the occurrence of skin reactions or swelling (3 out of 22, 13.6%) (El‐Beshlawy 2008).
Other adverse events reported in both treatment arms included anorexia (El‐Beshlawy 2008). Musculoskeletal pain was also reported in patients receiving the combined therapy (El‐Beshlawy 2008).
4. Participant compliance
Three trials measured participant compliance (Aydinok 2007; El‐Beshlawy 2008; Maggio 2009) (Table 6). Neither of the first two trials reported data for this outcome, although the first trial described overall compliance for the two treatment arms as "generally excellent during the entire study period" and noted one patient who missed more than one chelation dose per week due to problems with swallowing (Aydinok 2007). The second trial reported "excellent compliance during the study period" (El‐Beshlawy 2008). In the third trial, mean compliance with deferiprone was reported as over 90% in both treatment arms, whereas mean compliance with DFO was 70.6% (Maggio 2009).
5. Cost of treatment
The cost of treatment was reported in one trial (Gomber 2004); full details are presented in an additional table (Table 7). As this trial was undertaken in India, costs are presented in rupees. In a comparison of the costs of treatment per week of deferiprone versus deferiprone and DFO, deferiprone was the cheaper treatment: 126 rupees with deferiprone and 486 rupees with deferiprone and DFO. Costs were based on a participant weighing 10 kg.
(C) DFO alone compared with DFO and deferiprone in combination
There were nine comparisons between DFO alone and DFO and deferiprone in combination (Abdelrazik 2007; Aydinok 2005; El‐Beshlawy 2008; Galanello 2006; Gomber 2004; Ha (i) 2006; Mourad 2003; Tamaddoni 2010; Tanner 2007).
Primary Outcome
1. Mortality
None of the trials reported on mortality.
Secondary Outcomes
1. Evidence of reduced end organ damage
Three trials reported evidence of reduced end organ damage as an outcome (Abdelrazik 2007; El‐Beshlawy 2008; Tanner 2007). The El‐Beshlawy trial reported only that "there was no significant difference in cardiac function" between treatment arms (El‐Beshlawy 2008). The remaining two trials reported cardiac function by LVEF (%), measured by echocardiogram (Abdelrazik 2007) or cardiac magnetic resonance (Tanner 2007). Neither trial reported sufficient data to calculate mean change in LVEF from baseline (Abdelrazik 2007; Tanner 2007). However, both trials showed a significant difference in mean LVEF (%) at 12 months and when combined in a meta‐analysis, LVEF was shown to be significantly reduced in patients who received DFO alone compared with deferiprone in combination with DFO, MD ‐6.22% (95% CI ‐8.12 to ‐4.32) (Analysis 3.1). Considerable heterogeneity was observed between these two trials (I2 = 89%); the difference between treatment arms remained significant under a random‐effects model, MD ‐6.08% (95% CI ‐11.88 to ‐0.28). No clear clinical differences between these two trials were identified which could account for this heterogeneity.
One trial reported liver fibrosis as an outcome, but results were not reported separately for each treatment arm and therefore are not presented here (Ha (ii) 2006).
2. Measures of iron overload
a. Serum ferritin concentration
Serum ferritin concentration was reported as an outcome in eight trials (Abdelrazik 2007; El‐Beshlawy 2008; Galanello 2006; Gomber 2004; Ha (i) 2006; Mourad 2003; Tamaddoni 2010; Tanner 2007); one trial presented data graphically and the mean change is estimated from the graph (El‐Beshlawy 2008). Individual trial data are presented in an additional table (Table 1); mean change from baseline data are shown in a further table (Table 9). One trial reported serum ferritin levels at baseline and end of trial as geometric means with coefficient of variation (Tanner 2007). In a second trial, data were observed as skewed (Mourad 2003); the skewed nature of these data was only observed because data were presented as individual patient data (IPD); such data were not available in the remaining trials.
| Trial | No. | DFO: baseline | DFO: end of trial | Absolute change | % change | DFO with deferiprone: baseline | DFO with deferiprone: end of trial | Absolute change | % change |
| 30/30 | 4250 (1500) ng/ml | 1200 (850) ng/ml | reduction of 3050 ng/ml (SD not reported) | reduction of 72% | 4500 (1250) ng/ml | 1250 (750) ng/ml | reduction of 3250 ng/ml (SD not reported) | reduction of 72% | |
| 20/18 | 2838 (967) µg/L | approx. 1650 µg/L (estimated from graph) | reduction of approx. 1188 µg/L | Not available | 2865 (983) µg/L | approx. 1050 µg/L (estimated from graph) | reduction of approx. 1815 µg/L
| not available | |
| 30/29 | 2257 (748) µg/L | approx. 1850 µg/L (estimated from graph) | reduction of 349 (573) ug/L | reduction of 15.4% | 2048 (685) µg/L | approx. 1750 µg/L (estimated from graph) | reduction of 248 (791) ug/L | reduction of 12.1% | |
| 7/10 | 5077.18 (1714.99) ng/ml | 3718 (738.39) ng/ml | reduction of 1358.87 (1374.14) ng/ml | reduction of 26.8% | 3347.78 (+/‐ 1526.46) ng/ml | 3376.57 (1222.41) ng/ml | increase of 28.79 (915.86) ng/ml | increase of 0.9% | |
| 14/17 | not reported | not reported | increase of 1059 (2285) mmol/L | not available | not reported | not reported | reduction of 987.0 (2984) mmol/L | not available | |
| 14/11 | 5506 (2375) µg/L | 6 mths: 4856 (2615) µg/L 12 mths: 3998 (2409) µg/L | 6 months: reduction of 650 µg/L 12 months: reduction of 1508 µg/L | 6 months: reduction of 11.8% 12 months: reduction of 27.4% | 4153 (1715) µg/L | 6 months: 3005 (1303) µg/L months: 2805 (1084) µg/L | 6 months: reduction of 1148 µg/L 12 months: reduction of 1348 µg/L | 6 months: reduction of 27.6% 12 months: reduction of 32.5% | |
| 40/40 | 2945 (591) ng/ml | 6 months: 2702 (242) ng/ml 12 months: 2451 (352) ng/ml | 6 months: reduction of 243 ng/ml 12 months: 494 ng/ml | 6 months: reduction of 8.3% 12 months: reduction of 16.8% | 2986 (612) ng/ml | 6 months: 2453 (318) ng/ml 12 months: 2082 (221) ng/ml | 6 months: reduction of 533 ng/ml 12 months: reduction of 904 ng/ml | 6 months: reduction of 17.8% 12 months: reduction of 30.3% | |
| 30/28a | 1379 (CV 10) µg/Lb | 1146 (CV 11) µg/Lb | reduction of 233 µg/L | reduction of 16.9% | 1574 (11) µg/Lb | 598 (CV 14) µg/Lb | reduction of 976 µg/L | reduction of 62% |
DFO: desferrioxamine
SD: standard deviation
a28/32 patients completed treatment – actual sample size values for serum ferritin not given.
bvalues given are geometric mean (CV, coefficient of variation).
i. At end of trial
In view of the skewed data observed in the Mourad trial and the form of reporting of results in the Tanner trial, serum ferritin concentration at endpoint was analysed on a log scale as ratio of geometric means (Mourad 2003; Tanner 2007).
Three trials reported serum ferritin at six months follow up; all three trials showed a significant difference between treatment arms in favour of the combined treatment of DFO with deferiprone (Gomber 2004; Mourad 2003; Tamaddoni 2010), ratio of geometric means 1.52 ng/ml (95% CI 1.09 to 2.10) (Gomber 2004); ratio of geometric means 1.55 ng/ml (95% CI 1.08 to 2.22) (Mourad 2003); ratio of geometric means 1.11 ng/ml (95% CI 1.05 to 1.16) (Tamaddoni 2010) (Analysis 3.2). Results at six months were not pooled in a meta‐analysis due to pronounced baseline differences between the treatment arms in one trial (Gomber 2004).
At 12‐months follow up, combined evidence from meta‐analysis of three trials showed a significant difference between treatment arms, favouring deferiprone combined with DFO (Abdelrazik 2007; Mourad 2003; Tamaddoni 2010). The mean value in patients who received combination therapy was 1.17 times that in patients who received DFO alone, ratio of geometric means 1.17 (95% CI 1.10 to 1.23) (Analysis 3.3).
ii. Change from baseline
Data to calculate mean change in serum ferritin from baseline to end of trial were available in eight trials (Abdelrazik 2007; El‐Beshlawy 2008; Galanello 2006; Gomber 2004; Ha (i) 2006; Mourad 2003; Tamaddoni 2010; Tanner 2007), although only three trials reported SDs or sufficient data to allow calculation of the SD (Galanello 2006; Gomber 2004; Ha (i) 2006). There were statistically significant differences in mean change in serum ferritin concentration at six months in two trials (Gomber 2004; Ha (i) 2006). In one trial, mean change favoured combined deferiprone and DFO, MD 2046.00 micromol/l (95%CI 190.00 to 3902.00) (Ha (i) 2006). In the second trial, mean change favoured DFO, MD ‐1387.66 ng/ml (95% CI ‐2553.19 to ‐222.13) (Gomber 2004). The CIs were wide suggesting considerable variation in the results for individual participants (Table 9), which may have arisen from the pronounced baseline differences in this trial (Gomber 2004). The trial with mean change in serum ferritin concentration data at 12 months showed no significant difference in mean change, MD ‐101.00 ng/ml (95% CI ‐454.44 to 252.44) (Galanello 2006) (Analysis 3.4).
In the remaining trials which reported data for serum ferritin concentration, the mean change was a reduction in serum ferritin concentration for both treatment arms at six months (Mourad 2003; Tamaddoni 2010) and 12 months (Abdelrazik 2007; El‐Beshlawy 2008; Mourad 2003; Tamaddoni 2010; Tanner 2007) (Table 9). The mean difference was not calculated in these trials due to the absence of SDs or sufficient data (i.e. a correlation coefficient) to enable calculation of the SD.
b. Urinary iron excretion
Urinary iron excretion was measured in five trials (Abdelrazik 2007; Aydinok 2005; El‐Beshlawy 2008; Gomber 2004; Mourad 2003). Individual trial data are reported in Table 1. In one of these trials, outcome data were only reported for one treatment arm and will not be addressed further in these results (Mourad 2003). Of the remaining four trials, three did not present baseline data for this outcome, thus not enabling mean change from baseline to the end of the trial to be calculated (Aydinok 2005; El‐Beshlawy 2008; Gomber 2004).
In the trial reporting data at six months, mean urinary iron excretion at the end of the trial was not significantly different between the treatment arms, MD 0.82 mg/24h (95% CI ‐4.03 to 5.67) (Gomber 2004) (Analysis 3.5). Two trials showed a statistically significant difference in urinary iron excretion measurement after treatment, both in favour of combined DFO with deferiprone: one after 12 months, MD ‐0.23 mg/24h (95% CI ‐0.42 to ‐0.04) (Abdelrazik 2007); and one as a mean of quarterly readings, MD ‐0.27 mg/24h (95% CI ‐0.41 to ‐0.13) (El‐Beshlawy 2008) (Analysis 3.5). Aydinok reported mean % urinary iron excretion over the trial and showed a statistically significant difference between treatment arms in favour of combined deferiprone with DFO, MD ‐56.00% (95% CI ‐69.56 to ‐42.44) (Aydinok 2005) (Analysis 3.6). Data for mean urinary iron excretion at the end of the trial were not pooled overall in a meta‐analysis because the time points for the measurement of urinary iron excretion varied (six months (Gomber 2004) and 12 months (Abdelrazik 2007)) and because of variation in the methods of measurement (mg/24 hours (Gomber 2004), as a mean of quarterly readings (El‐Beshlawy 2008) and as a % mean urinary iron excretion (Aydinok 2005)).
c. Liver iron concentration
Liver iron concentration was reported as an outcome measure in four trials (El‐Beshlawy 2008; Galanello 2006; Ha (i) 2006; Tanner 2007). The mean change in liver iron concentration from baseline to end of trial was reported in two of these trials (Galanello 2006; Ha (i) 2006). The third trial reported liver iron concentration as a geometric mean of liver T2* (Tanner 2007). One trial presented data graphically and the mean change is estimated from the graph (El‐Beshlawy 2008). Individual trial data are presented in an additional table (Table 1); mean change from baseline data are shown in a further table (Table 10).
| Trial | No. | DFO: baseline | DFO: end | Absolute change | % change | Deferiprone + DFO: baseline | Deferiprone + DFO: end | Absolute change | % change |
| 15/16 | 22.5 (10.1) mg/g d/w | approx. 11.5 (6.3) mg/g d/w (estimated from graph) | reduction of approx. 11mg/g d/w | not reported | 17.1 (9.1) mg/g d/w | approx. 6.5 (3.5) mg/g d/w (estimated from graph) | reduction of approx. 10.6 mg/g d/w | not reported | |
| 30/29 | 1625 (642) µg/g w/w | not reported | reduction of 239 (474) µg FE/g liver | reduction of 14.7% | 1629 (744) µg/g w/w | not reported | reduction of 65 (615) µg FE/g liver | reduction of 4.0% | |
| 14/17 | not reported | not reported | increase of 0.82 (8.25) mg/g d/w | not available | not reported | not reported | increase of 0.95 (15.49) mg/g d/w | not available | |
| 32/28 | 4.2 (CV 0.62) msa | 5.0 msa | increase of 0.8 msa | increase of 20.0% | 4.9 (CV 0.52) msa | 10.7 msa | increase of 5.8 msa | increase of 18.4% |
DFO: desferrioxamine
d/w = dry weight liver
Fe: iron
SD: standard deviation
w/w = wet weight liver.
a values given are geometric mean of liver T2* (CV, coefficient of variation).
Liver iron concentration was measured by atomic absorption spectrophotometry in one trial (Ha (i) 2006) and by magnetic spectrometry (SQUID) in a second trial (Galanello 2006). One trial used liver T2* measured by cardiovascular magnetic resonance (CMR) to quantify liver iron concentration (Tanner 2007). The method of liver biopsy assessment was not reported in one trial (El‐Beshlawy 2008).
The two trials reporting mean change in liver iron concentration were not pooled in a meta‐analysis due to variation in treatment duration: six months (Ha (i) 2006); and 12 months (Galanello 2006). Mean change in liver iron concentration was not significantly different between the treatment arms in either of these two trials: MD ‐0.13 mg/g d/w (95%CI ‐8.67 to 8.41) (Ha (i) 2006); and MD ‐0.17 mg/g wet weight (95% CI ‐0.45 to 0.11) Galanello 2006) (Analysis 3.7). In the Tanner trial, the geometric mean of liver T2* was reported at baseline and after treatment (Tanner 2007). Exact P values were not available for all trial arms and therefore SDs could not be calculated. However, this trial reported a between‐group difference in geometric means of 39% (95% CI 20% to 61%) in favour of the combined treatment group.
d. Myocardial iron concentration
One trial reported myocardial T2* as an outcome measure (Tanner 2007) (Table 1). In this trial, the between‐group difference in geometric means of myocardial T2* was reported as significantly in favour of the combined treatment group, with an estimated 10% (95% CI 2% to 19%) increase in the combined group compared with the DFO group.
e. Chelation efficiency
Chelation efficiency (%) was reported in one trial as described above (Aydinok 2005) (Table 3). There was a statistically significant difference in mean chelation efficiency in favour of DFO, MD 15.76% (95%CI 6.36 to 25.16) (Analysis 3.8).
f. Plasma non‐transferrin bound iron (NTBI)
Plasma NTBI was measured by one trial (Aydinok 2005) (Table 3). Mean results at the end of treatment (time point not defined) were reported. There was no statistically significant difference in mean plasma NTBI at the end of treatment between the treatment arms, MD ‐0.12 mM (95% CI ‐0.84 to 0.60) (Analysis 3.9).
g. Total iron excretion
In one trial, total iron excretion (mg/kg/day) was reported at the end of the trial (Aydinok 2005) (Table 3). Total iron excretion per day was calculated as:
[iron transfused/year (mg) + (liver iron concentration at time 0 ‐ liver iron concentration at time 1 year) x 10.6 x body weight in kg] / number of days of treatment.
There was no statistically significant difference in total iron excretion between the treatment arms, MD 0.08 mg/kg/day (95%CI ‐0.15 to 0.31) (Analysis 3.10). See additional table for actual trial data (Table 11).
| Trial | No. | DFO with deferiprone: baseline | DFO with deferiprone: end of trial | Absolute change | % change | Deferiprone: baseline | Deferiprone: end of trial | Absolute change | % change |
| 8/12 | 26.6 (5.4) mg/g d/w | 18.1 (11.6) mg/g d/w | reduction of 8.5 mg/g d/w | reduction of 32.0% | 30.7 (10.6) mg/g d/w | 28.6 (12.8) mg/g d/w | reduction of 2.1 mg/g d/w | reduction of 6.8% | |
| 16/17 | 17.1 (9.1) mg/g d/w | approx. 6.5 (3.5) mg/g d/w (estimated from graph) | reduction of approx. 10.6 mg/g d/w | not reported | 15.8 (7.1) mg/g d/w | approx. 7.5 (3.6) mg/g d/w (estimated from graph) | reduction of approx. 8.3 mg/g d/w | not reported | |
| 34/20 | 4.0 (2.9) msa | 4.4 (3.4) msa | increase of 0.4 ms | not reported | 4.0 (5.9) msa | 3.5 (4.3) msa | reduction of 0.4 ms | not reported |
DFO: desferrioxamine
d/w = dry weight liver
SD: standard deviation
aLiver iron content was measured using MRI T2*. The mean (SD) duration from entry into trial to time of liver T2* MRI basal assessment was 17 (18) months in the combined treatment group and 18 (17) in the deferiprone alone treatment group. Final evaluation was performed after a further 16 (5) months and 14 (6) months respectively.
3. Adverse events
Adverse events were measured as an outcome in eight trials (Abdelrazik 2007; El‐Beshlawy 2008; Galanello 2006; Gomber 2004; Ha (i) 2006; Mourad 2003; Tamaddoni 2010; Tanner 2007); although one trial with three treatment arms did not differentiate adverse events between patients who received deferiprone alone or deferiprone with DFO and therefore this trial could not be included in meta‐analyses (Gomber 2004). See an additional table for details of the adverse events experienced in each trial (Table 5). A further trial did not report adverse event incidences per treatment arm and adverse event data for this trial have not been reported in this review (Ha (i) 2006).
Two trials reported data that enabled a comparison of the risk of experiencing any adverse event (Abdelrazik 2007; Galanello 2006). Both trials observed fewer adverse events in patients receiving DFO alone than in those receiving DFO with deferiprone. When data were pooled into a meta‐analysis, there was a lower risk of experiencing an adverse event in participants receiving DFO alone compared with those receiving DFO with deferiprone, which was statistically significant, RR 0.33 (95% CI 0.13 to 0.84) (Analysis 3.11; Figure 4). The remaining trials did not provide enough data to allow for an analysis of the risk of experiencing cumulative adverse events between the treatment arms.
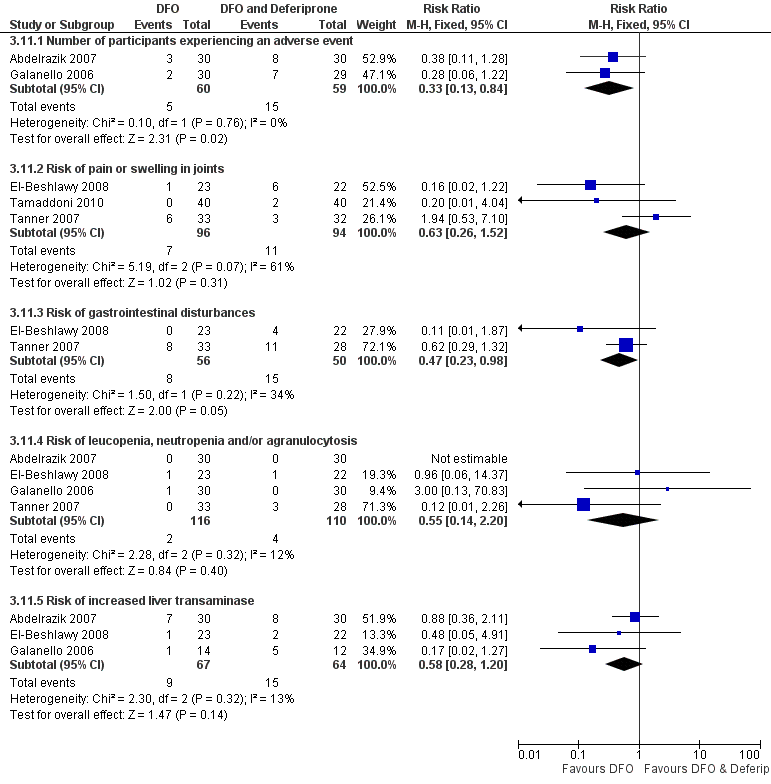
Forest plot of comparison: 3 DFO alone versus DFO and deferiprone in combination, outcome: 3.11 Adverse events.
Three trials each reported permanent treatment withdrawals due to adverse events (El‐Beshlawy 2008; Galanello 2006; Tanner 2007); only the latter trial reported permanent treatment withdrawals in the DFO only treatment arm. Two further trials did not observe any permanent withdrawals throughout the trial (Mourad 2003; Tamaddoni 2010).
A reduction in deferiprone dose was reported in two trials (El‐Beshlawy 2008; Tamaddoni 2010). In the first of these, the deferiprone dose was reduced to 50 mg/kg in two participants due to arthropathy (El‐Beshlawy 2008). The second trial reported temporary dose reduction in "some" patients with gastrointestinal disturbances; no further details were given (Tamaddoni 2010).
Joint pain or arthralgia was reported as an adverse event in five trials (Abdelrazik 2007; El‐Beshlawy 2008; Mourad 2003; Tamaddoni 2010; Tanner 2007). Two of these reported patients with joint pain in both treatment arms (El‐Beshlawy 2008; Tanner 2007); a further trial observed arthralgia only in patients receiving the combined therapy (Tamaddoni 2010). Incidences of joint pain were also reported in the combined deferiprone with DFO treatment arm in the two other trials (Abdelrazik 2007; Mourad 2003), although the absence of joint pain in patients receiving DFO alone could not be clearly inferred and these trials could not be included in a meta‐analysis. A meta‐analysis of the first three trials showed no significant increased risk of joint pain or arthralgia for either treatment, RR 0.63 (95 % CI 0.26 to 1.52) (Analysis 3.11; Figure 4).
Six trials reported gastrointestinal disturbance or nausea and vomiting (Abdelrazik 2007; El‐Beshlawy 2008; Galanello 2006; Mourad 2003; Tamaddoni 2010; Tanner 2007). One trial reported gastrointestinal disturbance in both treatment arms (Tanner 2007), whilst the remaining five trials only observed gastrointestinal disturbance in patients receiving deferiprone combined with DFO (Abdelrazik 2007; El‐Beshlawy 2008; Galanello 2006; Mourad 2003; Tamaddoni 2010). In three of these trials incidence of gastrointestinal disturbance in patients receiving DFO alone could not be clearly inferred without ambiguity (Abdelrazik 2007; Mourad 2003; Tamaddoni 2010). Additionally, in three trials the number of affected patients was reported separately for nausea or vomiting (or both), diarrhoea and abdominal pain; any overlap between the number of patients reported in each of these groups could not be ruled out (Abdelrazik 2007; Galanello 2006; Tamaddoni 2010). Meta‐analysis of the two trials with sufficient data showed a significantly lower risk of gastrointestinal disturbance associated with DFO alone, RR 0.47 (95 % CI 0.23 to 0.98) (El‐Beshlawy 2008; Tanner 2007) (Analysis 3.11; Figure 4).
Cases of neutropenia or leucopenia, or both, were reported in three trials (El‐Beshlawy 2008; Galanello 2006; Tanner 2007). Two of these trials reported incidences of neutropenia in a total of three patients receiving deferiprone in combination with DFO (El‐Beshlawy 2008; Tanner 2007), and one case of agranulocytosis in a patient in the combined therapy arm. One trial also reported neutropenia in one patient who received DFO alone (El‐Beshlawy 2008). A further case of neutropenia in a patient receiving DFO alone was reported by a third trial (Galanello 2006). No cases of neutropenia or leucopenia were observed in the Abdelrazik trial. When data from these trials were pooled in a meta‐analysis, no significant increased risk of neutropenia, leucopenia or agranylocytosis (or a combination of these) was observed for either treatment arm, RR 0.58 (95% CI 0.28 to 1.20) (El‐Beshlawy 2008; Galanello 2006; Tanner 2007) (Analysis 3.11; Figure 4).
Three trials observed patients with increased liver transaminase occurring in both treatment arms, reported as: elevated ALT at least two‐fold above normal values (Abdelrazik 2007); a transient increase in ALT three times the normal upper limit in HCV‐positive patients (Galanello 2006); and as jaundice or very high liver enzymes (El‐Beshlawy 2008). When combined, no significantly increased risk of increased liver transaminase was observed in either treatment group, RR 0.58 (95% CI 0.28 to 1.20) (Analysis 3.11; Figure 4). A fourth trial reported transient fluctuations in serum alanine ALT levels in patients receiving combined deferiprone and DFO treatment but not in patients receiving DFO alone (Tamaddoni 2010). A fifth trial reported that no significant change in ALT was observed over the trial period in either treatment group (Tanner 2007).
Adverse events specifically related to the administration of DFO were reported in five trials (El‐Beshlawy 2008; Galanello 2006; Mourad 2003; Tamaddoni 2010; Tanner 2007). Skin allergic reactions occurred in 8 out 45 (17.8%) (El‐Beshlawy 2008), 11 out of 40 (27.5%) (Tamaddoni 2010) and 12 out of 14 (85.7%) (Mourad 2003) of all patients, and in 6% and 3% in the DFO and combined treatment arms respectively (Tanner 2007). Abscess at the site of infusion was also reported by two trials, in 1 out of 30 (3.3%) patients (Galanello 2006) and 1 out of 40 (2.5%) patients (Tamaddoni 2010).
Other adverse events in patients receiving deferiprone with DFO were reported in one trial and included musculoskeletal pain, anorexia, and insomnia (El‐Beshlawy 2008).
4. Participant compliance
Participant compliance with DFO was measured in six trials (Abdelrazik 2007; El‐Beshlawy 2008; Galanello 2006; Ha (i) 2006; Mourad 2003; Tanner 2007); see an additional table for individual trial data (Table 6). Two trials reported compliance rates with DFO (Galanello 2006; Tanner 2007) which in the first trial was 96.1% in the combined treatment arm and 95.7% for DFO alone (Galanello 2006), and in the second trial was 91.4% in the combined treatment arm and 92.6% for DFO alone (Tanner 2007). The latter trial also reported a compliance rate of 82.4% for deferiprone; deferiprone compliance was not reported in the other trial.
Two further trials did not provide compliance rates, but reported compliance descriptively. In one trial, compliance was rated as "excellent" in 91% of participants in the deferiprone and DFO arm and 79% of participants in the DFO arm; and as "good" in 9% of participants in the deferiprone and DFO arm and 21% of participants in the DFO arm (Mourad 2003). The final trial reported "excellent compliance during the study period" and documented four patients who were excluded from the trial due to lack of compliance, all of whom received DFO alone (El‐Beshlawy 2008).
Although reported as measured, the remaining two trials did not report the results for this outcome (Abdelrazik 2007; Ha (i) 2006).
5. Cost of treatment
The cost of treatment was reported in one trial (Gomber 2004). Full details are presented in an additional table (Table 7). As this trial was undertaken in India, cost is presented in rupees. In a comparison of the costs of treatment per week of deferiprone and DFO versus DFO, deferiprone and DFO was the cheaper treatment, 486 rupees with deferiprone and DFO and 900 rupees with DFO. Costs were based on a participant weighing 10 kg.
(D) DFO compared with deferasirox
Four trials compared DFO with deferasirox (Brissot 2005; Cappellini 2006; Christoforidis 2006; Piga 2006). One of these trials was a three‐arm trial comparing DFO with two different doses of deferasirox (Piga 2006); the remaining three trials compared DFO with deferasirox, although in the Cappelllini trial, serum ferritin and liver iron concentration data for deferasirox were presented separately for different doses (Cappellini 2006) (Table 12). For this trial, mean and SD values for the combined group are calculated from dose‐specific values as described in the methods section (Measures of treatment effect).
| Dose | Serum ferritin concentration | Liver iron concentration | ||||
| N | Baseline* | Mean (SD) change from baseline | N | Baseline | Mean (SD) change from baseline | |
| DFO 20 ‐ 30 mg/kg/day | 13 | not reported | increase: 211(459) ug/L | 13 | 2.7 (0.28) | increase: 0.5 (1.11) |
| DFO 25 ‐ 35 mg/kg/day | 77 | not reported | increase: 32 (585) ug/L | 75 | 5.2 (1.22) | no change: 0.0 (2.36) |
| DFO 35 ‐ 50 mg/kg/day | 89 | not reported | reduction: ‐364 (614) ug/L | 87 | 10.6 (2.03) | reduction: ‐1.9 (2.93) |
| DFO <50 mg/kg/day | 101 | not reported | reduction: ‐1003 (1428) ug/L | 98 | 23.9 (8.06) | reduction: ‐6.4 (6.93) |
| Deferasirox 5 mg/kg/day | 15 | not reported | increase: 1189(700) ug/L | 15 | 2.5 (0.21) | increase: 4.8 (3.77) |
| Deferasirox 10 mg/kg/day | 73 | not reported | increase: 833 (817) ug/L | 68 | 4.9 (1.08) | increase: 3.8 (3.85) |
| Deferasirox 20 mg/kg/day | 80 | not reported | reduction: ‐36 (721) ug/L | 77 | 10.6 (2.08) | reduction: ‐0.4 (4.7) |
| Deferasirox 30 mg/kg/day | 115 | not reported | reduction: ‐926 (1416) ug/L | 108 | 24.2 (7.82) | reduction: ‐8.9 (8.07) |
DFO: desferrioxamine
SD: standard deviation
*Baseline serum ferritin levels are only reported for the combined group across different doses: 2597 (1835) µg/L (DFO) and 2765 (1897) µg/L (deferasirox)
Primary Outcome
1. Mortality
Mortality was reported by two trials (Cappellini 2006; Piga 2006). In one trial one unexplained death occurred in the deferasirox group and three deaths occurred in the DFO group (Cappellini 2006). Of these three deaths, one occurred due to convulsions, one due to intraventricular thrombus and one due to sepsis. The second trial reported that no deaths were observed in any of the treatment groups (Piga 2006).
Secondary Outcomes
1. Evidence of reduced end‐organ damage
None of the four trials reported evidence for reduced end‐organ damage.
2. Measures of iron overload
a. Serum ferritin concentration
Two trials reported serum ferritin concentration (Cappellini 2006; Piga 2006). In one trial, for the two lower doses of each treatment (dose A: DFO 20 to 30 mg/day versus deferasirox 5 mg/kg/day; dose B: DFO 25 to 35 mg/day versus deferasirox 10 mg/kg/day) mean serum ferritin concentration increased from baseline over the duration of the trial (12 months) in both treatment arms, although the increase was significantly less for DFO than for deferasirox, MD ‐978.00 ng/ml (95% CI ‐1411.29 to ‐544.71) (dose A), MD ‐801.00 ng/ml (95% CI ‐1029.47 to ‐572.53) (dose B), favouring treatment with DFO (Cappellini 2006) (Analysis 4.1). For the higher doses (dose C: DFO 35 to 50 mg/day versus deferasirox 20 mg/kg/day; dose D: DFO >50 mg/day versus deferasirox 30 mg/kg/day), serum ferritin concentration was reduced by the end of the trial in both treatment arms, although the difference was only statistically significant for dose C in favour of DFO, MD ‐328.00 ng/ml (95% CI ‐531.06 to ‐124.94) (Table 12) (Analysis 4.1). The trial shows that higher doses of DFO or deferasirox can reduce in iron stores as measured by serum ferritin.
When data were pooled across different doses, the mean change in serum ferritin concentration was significantly lower in patients who received DFO than those who received deferasirox, MD ‐350.33 ng/ml (95% CI ‐548.94 to ‐151.72) (Analysis 4.1).
In the second trial, mean serum ferritin levels were reported graphically and the extraction of these data was not possible (Piga 2006). However, it was reported that "mean serum ferritin levels remained stable in the deferasirox 20 mg/kg/day and DFO groups whereas there was a tendency for ferritin values to increase modestly over time in patients randomised to deferasirox 10 mg/kg/day".
b. Urinary Iron excretion
None of the four trials reported urinary iron excretion.
c. Liver iron concentration
Two trials reported liver iron concentration (Cappellini 2006; Piga 2006). In the first of these, for the two lower doses of each treatment (dose A and dose B, as described above), liver iron concentration increased from baseline over the duration of the trial (12 months) in both treatment arms (Cappellini 2006). The increase was significantly lower for DFO than deferasirox, MD ‐4.30 mg/g d/w (95% CI ‐6.30 to ‐2.30), MD ‐3.80 mg/g d/w (95% CI ‐4.86 to ‐2.74). For the higher doses (dose C and dose D, as described above), liver iron concentration was significantly reduced by the end of the trial in both treatment arms. For dose C, the difference was in favour of DFO, MD ‐1.50 mg/g d/w (95% CI ‐2.72 to ‐0.28), whereas for dose D deferasirox, the difference was in favour of deferasirox, MD 2.50 mg/g d/w (95% CI 0.45 to 4.55) (Analysis 4.2). When data were pooled across different doses in this trial, there was no significant difference in mean change in liver iron concentration between treatment arms, MD ‐0.42 mg/g d/w (95% CI ‐1.59 to 0.75) (Analysis 4.2).
In the second trial, the mean change in liver iron concentration from baseline at 18 months follow up was lower in patients receiving DFO than deferasirox (at either 10 mg/kg/day or 20 mg/kg/day dosage) but the difference between treatment arms was not significant, MD ‐1.60 mg/g d/w (95% CI ‐3.39 to 0.19) (deferasirox 10 mg/kg/day); MD ‐0.10 mg/g d/w (95% CI ‐1.53 to 1.33) (deferasirox 20 mg/kg/day) (Piga 2006) (Analysis 4.2). Liver iron concentration values at baseline and after 12, 24, 36 and 48 weeks were reported graphically and extraction of these data was not possible. However, the trial reported "average decreases in liver iron concentration of similar magnitude in the deferasirox 20 mg/kg/day and DFO groups (‐2.1 and ‐2.0 mg Fe/g dw respectively), when compared to the values at baseline..... in comparison, deferasirox 10 mg/kg/day resulted in only a minimal fall in liver iron concentration of ‐0.4 mg Fe/g dry weight".
d. Myocardial iron concentration
No trials reported myocardial T2*. However, one trial estimated myocardial iron by the natural logarithm of the mean signal intensity of myocardial tissue to air ratio measured by MRI (Christoforidis 2006) (Table 1). Although baseline and end‐point values were reported, no SDs were available for either measure and therefore the difference could not be formally evaluated. The trial did report that there was "no statistically significant difference" in heart MRI values between the two treatment groups.
e. Chelation efficiency
Chelation efficiency (%) was not reported in any of the four trials.
f. Plasma non‐transferrin bound iron (NTBI)
Plasma NTBI was not reported in any of the four trials.
g. Total Iron excretion
One trial reported total iron excretion as the average intake per kg of body weight during the one‐year period of the trial, calculated as follows, where total body iron is extrapolated from liver iron concentration (Cappellini 2006):
[(total amount of RBCs transfused x 1.08) + (total body iron at time 0 ‐ total body iron at time 1 year)] / number of days of treatment.
Mean values were significantly higher for patients receiving DFO than deferasirox for the two lowest doses of deferasirox, MD 0.37 mg/kg/day (95% CI 0.20 to 0.54) (5 mg/kg) and MD 0.31 mg/kg/day (95% CI 0.21 to 0.41) (10 mg/kg). The mean value for patients receiving DFO was also higher than those receiving 20 mg/kg deferasirox and was marginally statistically significant, MD 0.11 mg/kg/day (95% CI 0.01 to 0.21). However, values were significantly lower in patients receiving DFO than in those receiving deferasirox at a dose of 30 mg/kg, MD ‐0.23 mg/kg/day (95% CI ‐0.41 to ‐0.05) (Analysis 4.3).
When data were pooled across different doses, there was no significant difference in mean change in liver iron concentration between treatment arms, MD 0.02 mg/kg/day (95% CI ‐0.49 to 0.53) (Analysis 4.3).
3. Adverse events
Adverse events were measured in all four trials (Brissot 2005; Cappellini 2006; Christoforidis 2006; Piga 2006). See an additional table for details of the adverse events experienced in each trial (Table 5).
One trial reported occurrence of any adverse event (Piga 2006). In this trial, adverse events were reported in all but one patient who received deferasirox at 20 mg/kg and in all but two patients who received DFO. A further trial reported that "all patients completed the study with no major adverse events" (Christoforidis 2006). Two trials reported permanent treatment withdrawals due to adverse events which occurred in patients who received DFO and deferasirox (Cappellini 2006; Piga 2006). No temporary treatment withdrawals were reported.
Two trials reported dose reductions (Cappellini 2006; Piga 2006). In the first of these, dose adjustments and interruptions were reported in 33.1% of patients who received DFO and 36.8% of those who received deferasirox (Cappellini 2006). In the second trial, dose reductions were reported in 17.4% of patients who received DFO, 54.2% of those who received deferasirox 10 mg/kg and 58.3% of those who received deferasirox 20 mg/kg (Piga 2006).
Gastrointestinal disturbances were reported in patients who received deferasirox in two trials (Cappellini 2006; Piga 2006). The first of these reported gastrointestinal disturbances in 15.2% of patients who received deferasirox, but did not report any incidence of such adverse events in patients who received DFO (Cappellini 2006). Gastrointestinal symptoms including abdominal pain, nausea, vomiting, diarrhoea and dyspepsia were reported in both treatment arms in the second trial (Piga 2006) (Table 5). These characteristics of gastrointestinal disturbances were reported individually and not cumulatively and therefore an assessment of the relative risk of gastrointestinal symptoms between treatment arms could not be evaluated.
Two trials observed patients with increased liver transaminase in patients who received deferasirox, reported as a mean (SD) change from baseline of 5.19 (59.4) at 12 months (Brissot 2005), and elevated ALT values more than twice the normal upper limit in two patients (Cappellini 2006). The mean change from baseline in patients who received DFO was a reduction, mean (SD) ‐7.69 (30.6) in one trial (Brissot 2005). A third trial reported that "no patient developed consistent or progressive elevations in transaminase levels" (Piga 2006).
One trial reported the occurrence of both aural (deafness, neurosensory deafness, hypoacusis) and visual (cataracts, lenticular opacities) disturbances in both arms of the trial (Cappellini 2006). Other adverse events reported in one trial which occurred in both deferasirox and DFO treatment arms included arthralgia, back pain, cough, pyrexia, rhinitis, asthenia, headache, pharyngitis, pharyngolaryngial pain, influenza, vertigo, urinary tract infection and bronchitis (Piga 2006) (Table 5). One trial noted the absence of agranulocytosis in both treatment arms (Cappellini 2006).
No adverse events specifically related to the administration of DFO were reported; however, one trial reported that 10.8% of patients who received deferasirox experienced skin rashes (Cappellini 2006).
4. Participant compliance
Participant compliance was not reported in any of the four trials.
5. Cost of treatment
The cost of treatment was not reported in any of the four trials.
(E) DFO schedule A (either method of administration or dose A) compared with DFO schedule B (either method of administration or dose B)
Two trials compared the method of administration of DFO, both of these trials compared administration of DFO by subcutaneous infusion and bolus injection (Borgna‐Pignatti 1997; Yarali 2006). Neither of the included trials compared different doses of DFO.
Primary outcome
1. Mortality
Mortality was not recorded in either of these trials.
Secondary outcomes
1. Evidence of reduced end‐organ damage
Evidence of reduced end‐organ damage was not reported in either trial.
2. Measures of iron overload
a. Serum ferritin concentration
One trial reported serum ferritin concentration (Yarali 2006). Serum ferritin concentration values were reduced from baseline by the end of the trial (12 months) in patients receiving DFO by bolus injection and by continuous infusion. There was no significant difference in the mean values between treatment arms, MD ‐226.00 ng/ml (95% CI ‐930.28 to 478.28) (Analysis 5.1).
b. Urinary iron excretion
This outcome was reported in one trial only (Borgna‐Pignatti 1997). Mean (SD) urinary iron excretion at 48 hours for administration with bolus injection was 36.50 (23.10) mg (range 7.6 mg to 107.8 mg) and for continuous infusion: 36.40 (22.90) mg (range 7.7 mg to 88.5 mg); the MD between groups was not significant, MD ‐0.10 mg/24h (95% CI ‐20.35 to 20.15) (Analysis 5.2).
The second trial measured urinary iron excretion as an outcome but no end‐point or mean change values were reported and results are not reported further in this review (Yarali 2006).
c. Liver iron concentration
Liver iron concentration was reported in one trial (Yarali 2006). Liver iron concentration values were reduced from baseline by the end of the trial (12 months) in patients receiving DFO by bolus injection and by continuous infusion. There was no significant difference in the mean values between treatment arms, MD 0.86 mg/g d/w (95% CI ‐1.67 to 3.39) (Analysis 5.3).
d. Myocardial iron concentration
Myocardial iron was not reported in either trial.
e. Chelation efficiency
Chelation efficiency was not reported in either trial.
f. Plasma non‐transferrin bound iron (NTBI)
Plasma non‐transferrin bound iron was not reported in either trial.
g. Total Iron excretion
Total iron excretion was not reported in either trial.
3. Adverse events
Adverse events were reported in one trial (Yarali 2006). In this trial, "Mild pain during injection developed in 30% of the patients who received DFO by SC injection, but it disappeared by reducing the rate of injection in all patients. In 70% of the patients, slight redness and painless swelling were noted, which disappeared within 15 to 20 minutes. Painless swelling and hyperemia were noted in 60% and 20% of the patients in the continuous infusion group, respectively". This trial also reported no significant change in mean ALT and AST levels between baseline and follow up in either group.
4. Participant compliance
Participant compliance was not reported in either trial.
5. Cost of treatment
Cost of treatment was not reported in either trial.
Discussion
The aim of this systematic review was to determine the effectiveness of both dose and method of administration of the iron chelating agent DFO in people with transfusion‐dependent thalassaemia. However, the ability to fulfil this original aim was limited due to the design of the available trials and clinical diversity across trials. This systematic review has therefore sought to evaluate the efficacy and safety of DFO as an iron chelating agent and compared the efficacy and safety of DFO with iron chelators in transfusion‐dependent thalassaemia major.
This updated review complements a concurrent systematic review of iron chelation 'Oral deferiprone for iron chelation in people with thalassaemia', which we previously undertook and which we have now also updated (Fisher 2013). All trials in the current review which include a comparison with deferiprone (as monotherapy or in combination with DFO) are also presented in the concurrent review of deferiprone. A recent Cochrane systematic review has assessed the use of deferasirox in transfusion‐dependent thalassaemia (Meehpohl 2012).
Analysis of RCTs of DFO and other iron chelators
A total of 22 RCTs were eligible for analysis in this review. There was little opportunity for meta‐analysis for the majority of outcomes; analysis of data was principally a commentary on the findings from each included trial. Few trials measured long‐term outcomes, mortality was only measured in five trials and evidence of reduced end‐organ damage was measured in six trials. Although measures of iron overload were reported in all but one trial, meta‐analysis was often prohibited by different methods of assessment and measurement of outcomes used, variation in time points and a lack of sufficient data. Trials aimed at evaluating iron chelators may benefit from the development and application of agreed standardised sets of outcomes to be collected and reported, ideally through the Core Outcome Measures in Effectiveness Trials (COMET) initiative (www.comet‐initiative.org), which will better enable results of trials to be compared, contrasted and combined as appropriate (see also 'Implications for research' below).
Mortality
In five trials which reported mortality, a total of seven deaths occurred. Three of these deaths occurred in patients who received DFO alone and two in patients who received DFO in combination with deferiprone; one further death occurred in a patient who received deferiprone alone and one in a patient receiving deferasirox. One trial reported five further deaths in patients who withdrew from randomised treatment (deferiprone with or without DFO) and switched to DFO alone; these deaths were due to liver cancer in a patient randomised to combination therapy and due to pancreatic cancer, heart failure, stroke and myocarditis in four patients randomised to deferiprone alone (Maggio 2009). While none of these deaths were thought to have been caused by the iron chelator, more long‐term follow up is required for further assessment of the safety of these drugs.
End organ damage
Reporting of long‐term outcomes was limited and inconclusive. The effect of DFO and deferiprone on reduced end‐organ damage has attracted some interest since the measurement of the MRI T2* signal suggested that deferiprone may reduce cardiac iron more quickly than DFO. In a direct measurement of the MRI T2* signal, that becomes lower when iron is present, a comparison of patients with low T2* (high cardiac iron) receiving DFO or deferiprone showed that T2* values increased in both treatment arms; the increase was twice as high at 12 months in patients who received deferiprone (26.9% increase from baseline) compared with those who received DFO (12.8%) (Pennell 2006). Left ventricular ejection fraction (LVEF) measures the fraction of blood that is pumped from the final heart chamber ‐ the left ventricle ‐ in each cycle. In the comparison of DFO versus deferiprone monotherapy, meta‐analysis of three trials which reported LVEF as a measure of cardiac function showed a significant difference in mean change from baseline in favour of deferiprone (Maggio 2002; Olivieri 1997; Pennell 2006). In a meta‐analysis of two trials which compared LVEF between patients who received combined DFO with deferiprone and those who received DFO alone, LVEF was shown to be significantly reduced in patients who received DFO alone compared with combination therapy (Abdelrazik 2007; Tanner 2007).
The significance of differences in improvements in LVEF and MRI T2* to be translated into an ability to prevent cardiac disease is unclear without longer follow‐up (Neufeld 2006). Several MRI studies have shown that iron loading in the liver, heart and endocrine glands are poorly correlated with each other (Argyropoulou 2003; Kolnagou 2009) and regular follow up should include serial MRI estimates of iron deposition in different organs by MRI measurement of the T2* signal. Therefore, serum ferritin measurements do not necessarily predict iron loading in the myocardium or pancreas of individual patients. It is clear from retrospective and prospective clinical studies that intensified DFO treatment by either subcutaneous or intravenous route can reverse cardiac dysfunction because of iron overload, and increase survival in thalassaemia‐major patients with early onset or overt cardiomyopathy (Maggio 2007). The data from trials also suggest that combined DFO with deferiprone therapy may improve cardiac function (Abdelrazik 2007; Tanner 2007).
Markers of iron overload
In the absence of long‐term follow up in all but one trial (Maggio 2009) and with limited data on mortality or end organ damage, data on the effects of chelation therapy rely on markers of iron overload or measurements of iron loading or excretion.
In the direct comparison of DFO and deferiprone, after six months, a statistically significant difference in mean change in serum ferritin concentration in favour of DFO was observed in two trials (Gomber 2004) (Pennell 2006); a third trial found no significant difference between treatment arms (Ha (ii) 2006). However, at 12 months, neither of two trials showed a significant difference in mean change in serum ferritin concentration between treatment arms (Maggio 2002; Pennell 2006), and there was also no significant difference at 24 months (Olivieri 1997).
In a single large trial with four years of follow up, there was significant difference in mean change of serum ferritin concentration in patients receiving the use of DFO in combination with deferiprone compared to deferiprone alone, favouring combined therapy, MD ‐579.00 ng/ml (95% CI ‐1041.89 to ‐116.11) (Maggio 2009). Furthermore, in three trials comparing DFO against DFO and deferiprone, meta‐analysis showed a showed a significant difference favouring combined therapy, ratio of geometric means 1.17 (95% CI 1.10, 1.23) (Abdelrazik 2007; Mourad 2003; Tamaddoni 2010).
These results suggest an advantage of combined therapy with DFO and deferiprone over monotherapy to reduce iron stores as measured by serum ferritin. Can such advantages for combination therapy be supported by other measurements of iron fluxes or stores, or both? Measures of urinary iron excretion are difficult to interpret as comparative measures of efficacy, as they do not include biliary iron excretion and so would underestimate the total iron excretion for DFO. Hence no real conclusion can be made by examining measurements of urinary iron excretion in five trials comparing deferiprone with DFO (Aydinok 2005; El‐Beshlawy 2008; Gomber 2004; Maggio 2002; Olivieri 1990).
Liver iron concentration
Liver iron concentration is a valuable measure of stored iron. Indeed, direct measurement of liver iron is the gold standard by which other assays are validated. Five trials which compared DFO with deferiprone reported liver iron concentration. However, conflicting results were observed between trials. Liver iron concentration at the end of the trial was significantly lower in the deferiprone treatment group in one trial (El‐Beshlawy 2008), significantly lower in the DFO treatment group in another trial (Olivieri 1997) and showed a non‐significant difference in favour of DFO in a third trial (Maggio 2002). None of three trials reporting mean change from baseline found significant differences between treatment groups (Ha (ii) 2006; Olivieri 1997; Pennell 2006).
Neither trial which reported liver iron concentration for the comparison of DFO combined with deferiprone versus deferiprone alone found significant differences in liver iron concentration at the end of the trial (Aydinok 2007; El‐Beshlawy 2008). Similarly, in the comparison of DFO with deferiprone versus DFO alone, neither trial reporting this outcome found significant differences in mean change from baseline between treatment arms (Ha (i) 2006; Galanello 2006). There is, therefore, no conclusive or consistent evidence for the improved efficacy of combined deferiprone and DFO therapy against monotherapy from direct or indirect measures of liver iron.
Four trials compared DFO with the alternative iron chelator, deferasirox (Brissot 2005; Cappellini 2006; Christoforidis 2006; Piga 2006). However, only one trial reported data on mean change in serum ferritin concentration from baseline, which was significantly lower for DFO than deferasirox when data for each dose were pooled (Cappellini 2006). Results stratified by dose showed a reduction in serum ferritin concentration only for higher doses of either treatment; lower doses of either treatment resulted in an increase in serum ferritin. A second trial displayed serum ferritin results graphically but reported "stable" mean serum ferritin levels for all treatment groups except the lower dose of deferasirox (10 mg/kg/day) (Piga 2006). Liver iron concentration also increased in patients who received lower doses of either treatment, but a reduction in liver iron concentration was observed in both groups for higher doses. There were no significant differences in liver iron concentration between patients who received DFO and those who received deferasirox when data were pooled across different doses.
Only two trials compared different methods of administration of DFO (bolus injection versus continuous infusion) (Borgna‐Pignatti 1997; Yarali 2006). No significant differences between treatment arms were reported for any of the measures of overload reported by each trial.
Safety, compliance and cost of chelation therapy
Given the apparently similar efficacy of DFO, deferiprone and deferasirox, the safety, compliance and cost of these drugs are of special interest. Indeed the safety of chelation therapy has been somewhat controversial. Given that DFO has been in clinical usage for some 20 years longer than deferiprone, adverse events as a result of DFO therapy have been observed, with epidemiological data suggesting that these may be dose related (Porter 1989; Porter 2002). The longer‐term safety profile is much less certain for deferiprone than for DFO, although in the late 1990s liver fibrosis appeared to be associated with deferiprone during a clinical trial (Olivieri 1998). There have been no consistent data in subsequent trials that have highlighted this particular problem.
Adverse event data were reported in 18 trials, but differences in how adverse events were measured (number of events or events per person), the time points for measurement and the lack of standard reporting of the severity of reactions precluded pooling of data across the trials in many instances.
In a direct comparison of DFO against deferiprone, meta‐analysis showed an increased risk of gastrointestinal side effects associated with deferiprone, RR 11.71 (95% CI 1.57 to 87.31) (El‐Beshlawy 2008; Maggio 2002), increased liver transaminase levels, RR 8.90 (95% CI 2.08 to 38.11) in two trials (El‐Beshlawy 2008; Maggio 2002) and increased risk of joint pain or arthralgia in three trials, RR 2.64 (95% CI 1.21 to 5.77) (El‐Beshlawy 2008; Maggio 2002; Pennell 2006).
Local adverse events specifically related to the administration of DFO are well described: local reactions at infusion sites occurred in 8 out of 45 (17.8%) patients (El‐Beshlawy 2008), 11 out of 40 (27.5%) patients (Tamaddoni 2010), 12 out of 14 (85.7%) patients (Mourad 2003) and 12 out of 31 (38.7%) patients (Pennell 2006); local abscesses at the site of infusion occurred in 1 out of 30 (3.3%) patients (Galanello 2006) and 1 out of 40 (2.5%) patients (Tamaddoni 2010); and systemic allergy occurred in 1 out of 23 (4.3%) patients (El‐Beshlawy 2008).
Three trials reported data that enabled a comparison of the risk of experiencing any adverse event. In a comparison of DFO against deferiprone, there was a statistically significant increased risk of experiencing an adverse event in participants receiving deferiprone compared with those receiving DFO, RR 2.24 (95% CI 1.19 to 4.23) Maggio 2002). Furthermore, two trials observed a greater proportion of adverse events in patients receiving deferiprone with DFO than those receiving DFO alone and in a meta‐analysis, the increased risk of experiencing an adverse event in participants receiving deferiprone with DFO compared with those receiving DFO alone was significantly greater, RR 3.04 (95% CI 1.18 to 7.83) (Abdelrazik 2007; Galanello 2006).
The limited data from the four trials comparing DFO with deferasirox also suggest that adverse events are more frequently observed for deferasirox treatment than DFO, particularly gastrointestinal disturbances and increased liver transaminase although one trial (Piga 2006) reported an extensive range of symptoms observed in both treatment arms (Table 5). Dose‐dependent reduction in renal function is a well described side effect with deferasirox and monthly monitoring of renal function is recommended (BNF 2012).
These conclusions must be viewed with some caution; RCTs are not designed to measure the adverse effects of an intervention and thus data from RCTs do not represent a formal comparison of adverse events caused by iron chelation therapy. A complete review of adverse events would have to be the subject of a separate, formal analysis incorporating data from non‐RCTs and observational studies.
On the other hand, the major concern of prescribing DFO is compliance. It has been suggested that participants given an oral iron chelator may be more compliant with treatment than those given a continuous subcutaneous infusion of DFO. Eleven trials reported compliance, with this suggestion being supported in two trials (Maggio 2009; Olivieri 1997), although reporting of compliance in other trials was often purely descriptive. The observed differences may be medically important, especially as the difference in compliance associated with these two iron chelators may become greater outside the rigours and discipline of a formal RCT setting. Thus, objective assessment of safety and compliance with these chelating agents will require studies with long‐term follow up in a variety of settings.
Difficulties performing meta‐analyses
Several factors have contributed to the disappointing absence of meta‐analyses of trial results. Trials included participants with substantial clinical and demographic diversity, which was not always fully defined. In particular, there were differences in the measurement of outcomes across trials, notably the different techniques used to assess liver iron concentration between trials (magnetic spectrometry (SQUID), atomic spectrophotometry, liver T2*), the presence of hepatitis C in participants in one trial (Maggio 2002), the skewed nature of the data in two trials (Maggio 2002; Mourad 2003) and the undermining of the randomisation process (Gomber 2004). Some trials failed to report baseline data, making valid comparisons impossible between trials. Moreover, where reported, baseline values for serum ferritin and liver iron concentration differed substantially between trials, and in two trials between treatment arms (Gomber 2004; Pennell 2006). The impact of these differences on any overall results is difficult to evaluate due to the limited number of trials and the small sample sizes of the included trials. The skewed nature of the data in two trials gives rise to concerns of the likely skewing of the data in the remaining trials. Without obtaining the individual patient data from all trials, this issue could not be confirmed.
Variation in the time points used for outcome measurement was also a factor that precluded meta‐analysis. While very short‐term outcome measurement was the appropriate objective of the two iron balance trials and measures of iron overload can be assessed over a six or twelve month period, much longer follow up is needed to examine the effect of iron chelation on mortality and reduced end‐organ damage or other toxicity.
The validity of the data is a third issue to note. With the exception of four trials (Brissot 2005; Cappellini 2006; Maggio 2002; Maggio 2009), the sample sizes of the included trials were small with 40 or fewer participants in each treatment arm. Only seven trials presented information on sample sizes required to power the trial around a main outcome, whilst several trials failed to clearly state the primary end point for analysis. Data were presented in abstract form for three trials, presumably with a lack of peer review, therefore limiting the amount of data that could be reported.
The risk of bias of the included trials was difficult to assess given the general absence of information on randomisation and blinding to treatment allocation. As such, the influence of potential risks of bias of the included trials was not explored with respect to the robustness of any results. With the interventions in these trials, blinding to treatment allocation would be impossible for clinicians and participants. However, blinding of outcome assessors would be desirable as a means of minimising bias, particularly where subjective measurements such as functional status and histological results are concerned.
Although no quantitative assessment of publication bias was undertaken, attempts were made to minimise the likelihood of publication bias by the use of a comprehensive search strategy, the handsearching of relevant conference abstract books and by contacting the manufacturers of iron chelators.
This review has highlighted the difficulty of undertaking an analysis in such intervention comparisons, not least the limited ability to pool and meta‐analyse crucial aspects of measures of iron stores and chelation across the trials. These difficulties seem to be inherent in the population being studied. Children with thalassaemia may enter trials at different points in their clinical course, after variable amounts of blood transfusion, with variable endogenous iron loading, with different prior treatment and with differing biochemical levels as a result of past treatment and their thalassaemia. It seems unlikely that any one particular methodology could overcome these problems in future trials. It would therefore be important that each RCT comparing iron chelators or different schedules, doses or methods of administration of iron chelators should provide extensive details of baseline measures, collect follow‐up data at times appropriate to the outcomes of interest and be sufficiently powered to provide a significant comparison within the trial.
These difficulties highlight the importance not only in designing trials to optimise subsequent meta‐analysis, but of ensuring individual patient data are made available to the scientific community. Perhaps deposition of the individual patient data for an RCT will ultimately become a requirement for publication in the same way as molecular data for experimental data is deposited in public databases now. Moreover, consensus on the appropriate methods and sampling to measure iron overload would greatly help data from future trials to be combined. Finally, accurate recording of compliance and adverse events for different schedules of iron chelation should be an essential feature of future trials.
In summary, the available data provide limited evidence to compare the efficacy and safety of desferrioxamine with other iron chelating agents. However, the review does support the clinical use of DFO as first‐line therapy in people with transfusion‐dependent thalassaemia. Desferrioxamine and the oral iron chelators deferiprone and deferasirox produce significant reductions in iron stores in transfusion‐dependent, iron‐overloaded people although these reductions are dependent on achieving an adequate dose of chelator. There is no evidence from RCTs to suggest that any one chelator has a greater reduction in clinically significant end‐organ damage, although combination therapy with DFO and deferiprone showed a greater improvement in LVEF than DFO used alone in two trials. Furthermore, one trial of combination therapy with DFO and deferiprone showed a greater improvement in serum ferritin but not liver iron stores than DFO used alone. These potential benefits, the degree of organ‐specific iron loading, the increased side effects of combination therapy with DFO and deferiprone or deferasirox alone compared to DFO alone, and the convenience of oral therapy against infusion of DFO have to be weighed up carefully for each patient.
Intensified DFO treatment (by either subcutaneous or intravenous route) or the use of other oral iron chelators, or both, remains the established treatment to reverse cardiac dysfunction because of iron overload. Indeed, the U.S Food and Drug Administration (FDA) have approved deferiprone only as "last resort treatment of iron overload in thalassemia" (FDA 2011) and combination therapy with DFO and deferiprone has been used in spite of the lack of RCT‐data in specific clinical situations, particularly where there is evidence of myocardial iron deposition, or where compliance with continuous DFO is a severe problem, or both.
Factors are suggested that should be considered in further trials to improve the efficacy and applicability of desferrioxamine in people with iron overload.

PRISMA study flow diagram.

Risk of bias summary: review authors' judgements about each risk of bias item for each included study.

Forest plot of comparison: 1 DFO alone versus deferiprone alone, outcome: 1.14 Adverse events.

Forest plot of comparison: 3 DFO alone versus DFO and deferiprone in combination, outcome: 3.11 Adverse events.

Comparison 1 DFO alone versus deferiprone alone, Outcome 1 Left ventricular ejection fraction: mean change from baseline (%).

Comparison 1 DFO alone versus deferiprone alone, Outcome 2 Right ventricular ejection fraction: mean at endpoint (%).

Comparison 1 DFO alone versus deferiprone alone, Outcome 3 Liver fibrosis Ishak score: mean at endpoint.

Comparison 1 DFO alone versus deferiprone alone, Outcome 4 Serum ferritin concentration: mean change from baseline (ng/ml).

Comparison 1 DFO alone versus deferiprone alone, Outcome 5 Urinary iron excretion: mean at endpoint (mg/24h).

Comparison 1 DFO alone versus deferiprone alone, Outcome 6 Urinary iron excretion: mean over study (%).

Comparison 1 DFO alone versus deferiprone alone, Outcome 7 Urinary iron excretion: mean change from baseline (mg/24h).

Comparison 1 DFO alone versus deferiprone alone, Outcome 8 Liver iron concentration: ratio of geometric means at endpoint (mg/g dry weight).

Comparison 1 DFO alone versus deferiprone alone, Outcome 9 Liver iron concentration: mean change from baseline (mg/g dry weight).

Comparison 1 DFO alone versus deferiprone alone, Outcome 10 Myocardial T2*: ratio of geometric means of change from baseline.

Comparison 1 DFO alone versus deferiprone alone, Outcome 11 Chelation efficiency (%).

Comparison 1 DFO alone versus deferiprone alone, Outcome 12 Plasma NTBI: mean change from baseline (mM).

Comparison 1 DFO alone versus deferiprone alone, Outcome 13 Total iron excretion: mean at endpoint (mg/kg/day).

Comparison 1 DFO alone versus deferiprone alone, Outcome 14 Adverse events.

Comparison 1 DFO alone versus deferiprone alone, Outcome 15 Participant compliance (%).

Comparison 2 DFO and deferiprone in combination compared with deferiprone alone, Outcome 1 Left ventricular ejection fraction: mean at endpoint (%).

Comparison 2 DFO and deferiprone in combination compared with deferiprone alone, Outcome 2 Serum ferritin concentration: mean at endpoint (ng/ml).
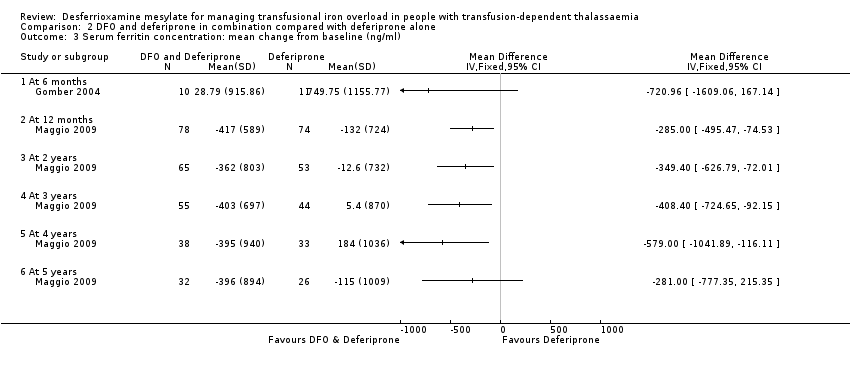
Comparison 2 DFO and deferiprone in combination compared with deferiprone alone, Outcome 3 Serum ferritin concentration: mean change from baseline (ng/ml).

Comparison 2 DFO and deferiprone in combination compared with deferiprone alone, Outcome 4 Urinary iron excretion: mean over study (%).

Comparison 2 DFO and deferiprone in combination compared with deferiprone alone, Outcome 5 Urinary iron excretion: mean at endpoint (mg/24h).

Comparison 2 DFO and deferiprone in combination compared with deferiprone alone, Outcome 6 Liver iron concentration: mean at endpoint (mg/g dry weight).

Comparison 2 DFO and deferiprone in combination compared with deferiprone alone, Outcome 7 Chelation efficiency (%).

Comparison 2 DFO and deferiprone in combination compared with deferiprone alone, Outcome 8 Plasma NTBI: mean change from baseline (mM).

Comparison 2 DFO and deferiprone in combination compared with deferiprone alone, Outcome 9 Total Iron excretion: mean at endpoint (mg/kg/day).

Comparison 2 DFO and deferiprone in combination compared with deferiprone alone, Outcome 10 Adverse Events.
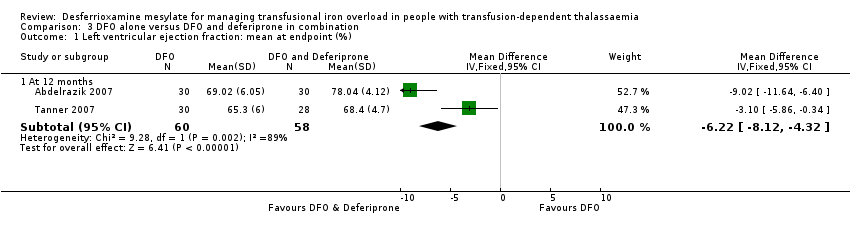
Comparison 3 DFO alone versus DFO and deferiprone in combination, Outcome 1 Left ventricular ejection fraction: mean at endpoint (%).

Comparison 3 DFO alone versus DFO and deferiprone in combination, Outcome 2 Serum ferritin concentration: ratio of geometric means at endpoint (ng/ml).

Comparison 3 DFO alone versus DFO and deferiprone in combination, Outcome 3 Serum ferritin concentration: ratio of geometric means at endpoint (ng/ml).

Comparison 3 DFO alone versus DFO and deferiprone in combination, Outcome 4 Serum ferritin concentration: mean change from baseline (ng/ml).

Comparison 3 DFO alone versus DFO and deferiprone in combination, Outcome 5 Urinary iron excretion: mean at endpoint (mg/24h).

Comparison 3 DFO alone versus DFO and deferiprone in combination, Outcome 6 Urinary iron excretion: mean over study (%).

Comparison 3 DFO alone versus DFO and deferiprone in combination, Outcome 7 Liver iron concentration: mean change from baseline.

Comparison 3 DFO alone versus DFO and deferiprone in combination, Outcome 8 Chelation efficency (%).

Comparison 3 DFO alone versus DFO and deferiprone in combination, Outcome 9 Plasma NBTI: mean change from baseline (mM).

Comparison 3 DFO alone versus DFO and deferiprone in combination, Outcome 10 Total iron excretion: mean at endpoint (mg/kg/day).

Comparison 3 DFO alone versus DFO and deferiprone in combination, Outcome 11 Adverse events.

Comparison 4 DFO compared with Deferasirox, Outcome 1 Serum ferritin concentration: mean change from baseline (ng/ml).

Comparison 4 DFO compared with Deferasirox, Outcome 2 Liver iron concentration: mean change from baseline (mg/g dry weight).

Comparison 4 DFO compared with Deferasirox, Outcome 3 Total iron excretion: ratio of iron excretion to iron intake (mg/kg/day).

Comparison 5 DFO schedule A (either method of administration or dose A) compared with DFO schedule B (either method of administration or dose B), Outcome 1 Serum ferritin concentration: mean at endpoint (ng/ml).

Comparison 5 DFO schedule A (either method of administration or dose A) compared with DFO schedule B (either method of administration or dose B), Outcome 2 Urinary iron excretion (mg/24h).

Comparison 5 DFO schedule A (either method of administration or dose A) compared with DFO schedule B (either method of administration or dose B), Outcome 3 Liver iron concentration: mean at endpoint (mg/g dry weight).
| Trial details | Endpoint (treatment duration) | Intervention | Serum ferritin:start | Serum ferritin: end | Urinary iron:start | Urinary iron: end | Liver iron: start | Liver iron: end | Myocardial T2*:start | Myocardial T2*: end |
| 12 months | DFO | 4250 (1500) ng/ml | 1200 (850) ng/ml | 0.35 (0.12) mg/kg/24h | 0.53 (0.21) mg/kg/24h | not reported | not reported | not measured | not measured | |
| DFO + Deferiprone | 4500 (1250) ng/ml | 1250 (750) ng/ml | 0.41 (0.27) mg/kg/24h | 0.76 (0.49) mg/kg/24h | not reported | not reported | not measured | not measured | ||
| not reported | DFO | not measured | not measured | See Table 3 | See Table 3 | not measured | not measured | not measured | not measured | |
| DFO + Deferiprone | not measured | not measured | See Table 3 | See Table 3 | not reported | not reported | not measured | not measured | ||
| Deferiprone | not measured | not measured | See Table 3 | See Table 3 | not measured | not measured | not measured | not measured | ||
| 12 months | DFO + Deferiprone | 4350 (3342) µg/L
| 2954 (2765) µg/L | 0.88 (0.32) mg/kg/day (mean on days of therapy) | not measured | 26.6 (5.4) mg/g d/w | 18.1 (11.6) mg/g d/w | not measured | not measured | |
| Deferiprone | 4070 (3223) µg/L | 3209 (2279) µg/L | 0.38 (0.22) mg/kg/day (mean on days of therapy) | not measured | 30.7 (10.6) mg/g d/w | 28.6 12.8) mg/g d/w | not measured | not measured | ||
| 48 hours | DFO (bolus injection) | not measured | not measured | not reported | 36.5 (23.1) mg | not measured | not measured | not measured | not measured | |
| DFO (continuous infusion) | not measured | not measured | not reported | 36.4 (22.9) mg | not measured | not measured | not measured | not measured | ||
| DFO | not measured | not measured | not measured | not measured | not measured | not measured | not measured | not measured | ||
| Deferasirox | not measured | not measured | not measured | not measured | not measured | not measured | not measured | not measured | ||
| 12 months | DFO | 2597 (1835) µg/La | not reported | not measured | not measured | 13.5 (9.55) mg/g d/wa | not reported | not measured | not measured | |
| Deferasirox | 2765 (1897) µg/La | not reported | not measured | not measured | 14.2 (10.95) mg/g d/wa | not reported | not measured | not measured | ||
| DFO | not reported | not reported | not reported | not reported | not reported | not reported | 4.3b | 4.41b | ||
| Deferasirox | not reported | not reported | not reported | not reported | not reported | not reported | 4.29b | 4.21b | ||
| 54 weeks | DFO | 2838 (967) µg/L | approx. 1700 µg/L (value estimated from graph) | not reported | 0.18 (0.10)c mg/24h | 22.5 (10.1) mg/g dw | approx. 11.5 (6.3) mg/g d/w (value estimated from graph) | not measured | not measured | |
| DFO + Deferiprone | 2865 (983) µg/L | approx. 1050 µg/L (value estimated from graph) | not reported | 0.45 (0.26)c mg/24h | 17.1 (9.1) mg/g dw | approx. 6.5 (3.2) mg/g d/w (value estimated from graph) | not measured | not measured | ||
| Deferiprone | 2926 (1107) µg/L | approx. 900 µg/L (value estimated from graph) | not reported | 0.38 (0.23)c mg/24h | 15.8 (7.1) mg/g dw | approx. 7.5 (3.6) mg/g d/w (value estimated from graph) | not measured | not measured | ||
| 12 months | DFO | 2257 (748) µg/L | 1850 µg/L (value estimated from graph) | not measured | not measured | 1629 (642) µg/g w/w | not reported | not measured | not measured | |
| DFO + Deferiprone | 2048 (685) µg/L | 1750 µg/L (value estimated from graph) | not measured | not measured | 1629 (744) µg/g w/w | not reported | not measured | not measured | ||
| 6 months | DFO | 5077 (1715) ng/ml | 3718 (738) ng/ml | not measured | 7.96 (5.05) mg/day | not measured | not measured | not measured | not measured | |
| DFO + Deferiprone | 3348 (1526) ng/ml | 3377 (1222) ng/ml | not measured | 7.14 (4.99) mg/day | not measured | not measured | not measured | not measured | ||
| Deferiprone | 2673 (886) ng/ml | 3423 (1581) ng/ml | not measured | 4.78 (2.12) mg/day | not measured | not measured | not measured | not measured | ||
| up to 20 months (trial terminated early) | DFO | not reported | not reported | not measured | not measured | not reported | not reported | not measured | not measured | |
| DFO + Deferiprone | not reported | not reported | not measured | not measured | not reported | not reported | not measured | not measured | ||
| up to 20 months (trial terminated early) | DFO | not reported | not reported | not measured | not measured | not reported | not reported | not measured | not measured | |
| Deferiprone | not reported | not reported | not measured | not measured | not reported | not reported | not measured | not measured | ||
| 12 months | DFO | 2019 (678) ng/ml | 1787 (893) ng/ml | 15.7 (12.8) mg/24h | 19.9 (13.6) mg/24h | 3516 (2974) µg/g d/w | 3166 (2519) µg/g d/w | not measured | not measured | |
| Deferiprone | 2283 (754) ng/ml | 2061 (853) ng/ml | 11.4 (8.5) mg/24h | 15.8 (10.9) mg/24h | 3363 (5490) µg/g d/w | 2341 (2197) µg/g d/w | not measured | not measured | ||
| up to 5 years (trial terminated early) | DFO + Deferiprone | 1787 (735) ng/ml | 12 months: 1400 (770) ng/ml 5 years: 1369 (816) ng/mld | not measured | not measured | Liver T2* 4.0 (2.9) mse | Liver T2* 4.4 (3.4) mse | 20.1 (11.9) mse | 21.8 (12.6) mse | |
| Deferiprone | 1890 (816) ng/ml | 12 months: 1633 (841) ng/ml 5 years: 1588 (1217) ng/mld | not measured | not measured | Liver T2* 4.0 (5.9) mse | Liver T2* 3.5 (4.3) mse | 25.0 (11.3) mse | 26.0 (11.8) mse | ||
| 12 months | DFO | 5506 (2375) µg/L | 6 months: 4856 (2615) µg/L 12 months: 3998 (2409) µg/L | not measured | not measured | not measured | not measured | not measured | not measured | |
| DFO + Deferiprone | 4153 (1715) µg/L | 6 months: 3005 (1303) µg/L 12 months: 2805 (1084) µg/L | not measured | 22.9 (19.2) mg/kg/24h | not measured | not measured | not measured | not measured | ||
| 6 days | DFO | not measured | not measured | not measured | 18.2 (15.3) mg/kg/day | not measured | not measured | not measured | not measured | |
| Deferiprone | not measured | not measured | not measured | 12.3 (6.7) mg/kg/day | not measured | not measured | not measured | not measured | ||
| 24 months | DFO | not measured | not measured | not reported | not reported | 6.9 (3.82) mg/g d/w | 7.9 (5.52) mg/g d/w | not measured | not measured | |
| Deferiprone | not measured | not measured | not reported | not reported | 8.9 (5.23) mg/g d/w | 13.7 (5.23) mg/g d/w | not measured | not measured | ||
| 12 months | DFO | 2795 (2441) µg/L | 2329 (2078.7) µg/L
| not measured | not measured | 6.32 (5.8) mg/g d/w | not reported | 13.3 ms (30%)d | 15.0 ms (+13%, CV 39%)d | |
| Deferiprone | 1791 (1029) µg/L
| 1610 (980.91) µg/L
| not measured | not measured | 6.16 (6.0) mg/g d/w | not reported | 13.0 ms (32%)d | 16.5 ms (+27%, CV 38%)d | ||
| 48 weeks | DFO | data reported graphically | data reported graphically | not reported | not reported | 18 months: 7.8 (2.18) mg/g d/w | 18 months: 6.5 (20.2) mg/g d/w | not measured | not measured | |
| Deferasirox (10mg/day) | data reported graphically | data reported graphically | not reported | not reported | 18 months: 9.1 (2.98) mg/g d/w | 18 months: 9.4 (4.45) mg/g d/w | not measured | not measured | ||
| Deferasirox (20mg/day) | data reported graphically | data reported graphically | not reported | not reported | 18 months: 9.3 (2.91) mg/g dw | 18 months: 8.1 (2.81) mg/g d/w | not measured | not measured | ||
| 12 months | DFO | 2945 (591) ng/ml | 6 months: 2702 (242) ng/ml 12 months: 2451 (352) ng/ml | not measured | not measured | not reported | not reported | not measured | not measured | |
| DFO + Deferiprone | 2986 (612) ng/ml | 6 months: 2453 (318) ng/ml 12 months: 2082 (221) ng/ml | not measured | not measured | not reported | not reported | not measured | not measured | ||
| 12 months | DFO + placebo | 1379 (CV 10) µg/Lf | 1146 (CV 11) µg/Lf | not measured | not measured | Liver T2* 4.2 (CV 0.62) ms [>19]f | 5.0 msf | 12.4 (CV 0.11) ms [>20]d | 15.7 msf | |
| DFO + Deferiprone | 1574 (CV 11) µg/Lf | 598 (CV 14) µg/Lf | not measured | not measured | Liver T2* 4.9 (CV 0.52) ms (>19)f | 10.7 msf | 11.7 (CV 0.08) ms (>20)d | 17.7 msf | ||
| 12 months | DFO (bolus injection) | 3003 (949) units? | 2287 (831) | 10.6 (4.3) mg Fe/24hrs | not reported | 7.559 (3.508) mg Fe/ d/w | 6.328 (3.114) mg Fe/ d/w | not measured | not measured | |
| DFO (continuous infusion) | 3239 (1134) | 2513 (775) | 10.8 (4.3) mg Fe/24hrs | not reported | 6.774 (3.430) mg Fe/ d/w | 5.470 (0.775) mg Fe/ d/w | not measured | not measured | ||
| DFO: desferrioxamine; d/w = dry weight liver; Fe: iron; SD: standard deviation; w/w = wet weight liver. aCappellini 2006 ‐ baseline LIC values are calculated from combining groups for different doses of DFO and deferasirox. Dose‐specific values are shown in Table 12. bChristoforidis: natural logarithm of the mean signal intensity of tissue to air ratio. cHepatic iron only, measured as [excretion = iron transfused + [(LIC t=o ‐LIC t=54 weeks) x 10.6 x wt/kg)]/no of days between biopsies]; fecal iron excretion not accounted for in calculations. | ||||||||||
| Trial | No. DFO/deferiprone | DFO: baseline | DFO: end of trial | Absolute change | % change | Deferiprone: baseline | Deferiprone: end of trial | Absolute change | % change |
| 20/18 | 2838 (967) µg/L | approx. 1650 µg/L (estimated from graph) | reduction of approx. 1188 µg/L
| not available | 2926 (1107) µg/L | approx. 900 µg/L (estimated from graph) | reduction of approx. 2026 µg/L
| not available | |
| 7/11 | 5077.2 (1715.0) ng/ml | 3718.3 (738.4) ng/ml | reduction of 1358.9 (1374.14) ng/ml | reduction of 27% | 2672.9 (886.4) ng/ml | 3422.7 (1581.0) ng/ml | increase of 749.8 (1155.8) ng/ml | increase of 28% | |
| 7/6 | not reported | not reported | reduction of 74.2 (1629) mmol/L | not available | not reported | not reported | increase of 398.4 (1073) mmol/L | not available | |
| 73/71 | 2019 (678) ng/ml | 1787 (893) ng/ml | reduction of 232 (619) ng/ml | reduction of 11.4% | 2283 (754) ng/ml | 2061 (853) ng/ml | reduction of 222 (783) ng/ml | reduction of 9.7% | |
| 32/29 | 2795 (2441) µg/L | 2329 (2078.7) µg/L | reduction of 466 (739) µg/L | reduction of 16.7% | 1791 (1029) µg/L | 1610 (980.91) µg/L | reduction of 181 (826) µg/L | reduction of 10.1% | |
| DFO: desferrioxamine | |||||||||
| Treatment regimen | Total iron excretion | Plasma NTBI change | Chelation efficiency | Urinary iron excretion |
| DFO | 0.77 (0.25) mg/kg/day | 0.72 (0.45) mM* | 23.1 (10.7) % | 28 (10.3) % |
| Deferiprone + DFO | 0.69 (0.09) mg/kg/day | 0.84 (0.87) mM* | 7.34 (0.91) % | 84 (10.6) % |
| Deferiprone | 0.56 (0.09) mg/kg/day | 3.00 (0.53) mM* | 6.65 (0.99) % | 98 (14.8) % |
| Comment | Mean value from across 5 measurement points: weeks 1, 12, 26, 38, 54. Calculated as [iron transfused/year (mg) + (LIC at time 0 ‐ LIC at time 1 year) x 10.6 x body weight in kg]/ number of days of treatment. | Plasma non‐transferrin bound iron (NTBI) was measured by HPLC at baseline and at weeks 1, 12, 26 and 54. Data were not reported for the outcome measurements at these time points. | Chelation efficiency calculated as [iron excretion / chelator dose] multiplied by [molecular weight of the respective chelator /56] x n x 100, where 56 is the molecular weight of iron and n is 3 or 1 with deferiprone and DFO respectively. | Urine iron (%) mean over study calculated from mean urine iron excretion / total iron excretion. |
| DFO: desferrioxamine | ||||
| Trial | No. DFO/deferiprone | DFO: baseline | DFO: end of trial | Absolute change | % change | Deferiprone: baseline | Deferiprone: end of trial | Absolute change | % change |
| 15/17 | 22.5 (10.1) mg/g d/w | approx. 11.5 (6.3) mg/g d/w (estimated from graph) | reduction of approx. 11 mg/g d/w | not reported | 15.8 (7.1) mg/g d/w | approx. 7.5 (3.6) mg/g d/w (estimated from graph) | reduction of approx. 8.5mg/g d/w | not reported | |
| 7/6 | not reported | not reported | increase of 2.90 (1.27) mg/g d/w | not available | not reported | not reported | increase of 5.63 (4.24) mg/g d/w | not available | |
| 15/21 | 3516 (2974) µg/g d/w | 3166 (2519) µg/g d/w (end of trial = median 30 months) | reduction of 350 (524) µg/g d/w | reduction of 9.95% | 3363 (5490) µg/g d/w | 2341 (2197) µg/g d/w (end of trial = median 30 months) | reduction of 1022 (3511) µg /g/ d/w | reduction of 30.4% | |
| Olivieiri 1997 | 18/19 | 6.90 (3.82) mg/g d/w liver (end of trial = mean 33 months) | 7.90 (5.52) mg/g d/w | increase of 1.0 mg/g d/w | increase of 14.5% | 8.90 (5.23) mg/g d/w liver | 13.70 (5.23) mg/g d/w liver (end of trial = mean 33 months) | increase of 4.8 mg/g d/w | increase of 53.9% |
| 30/27 | 6.32 (5.8) µg/L | not reported | reduction of 1.54 (2.5) mg/g d/w | reduction of 24.4% | 6.16 (6.0) µg/L | not reported | reduction of 0.93 (2.9) mg/g d/w (‐10% from baseline) | reduction of 10.1%a | |
| DFO: desferrioxamine | |||||||||
| Trial Name | Prior iron chelation therapy | Intervention | Total Adverse Events | Adverse Event Details | Dose Reduction | Temporary Withdrawal | Permanent Withdrawal |
|
| Prior DFO received at a daily dose of 40 mg/kg/day by sc infusion pump over 8 ‐ 10h, 5 ‐ 7 nights a week for "several years" | DFO | 3/30 | none noteda | none reported | none reported | 0 |
| DFO + Deferiprone | 8/30 | 1/30 (mild arthropathy); 1/30 (vomiting); 2/30 (abdominal pain); 1/30 (diarrhoea)a | none reported | none reported | 0 | ||
|
| Previous DFO therapy. All patients had washout period of 2 weeks with no iron chelation therapy prior to initiating trial treatment | DFO + Deferiprone | not reported | 1/9 (neutropenia wk 4/10 with subsequent agranulocytosis wk 14); 1/9 (arthralgia grade 2); “mild, local reactions observed in several patients treated with DFO”b | none reported | none reported | 1 (agranulocytosis at week 14) |
| Deferiprone | not reported | 1/12 (neutropenia); 1/12 (aseptic meningitis at wk 45); 1/12 (acute cerebellar syndrome with dizziness, tinitus, truncal ataxia)b | none reported | none reported | 1 (acute cerebellar syndrome) | ||
| Prior DFO therapy received by (most 97.4%) participants | DFO | not reported | 7 (deafness/neurosensory deafness/ hypoacusis); 2 (cataracts/lenticular opacities). | Dose interruptions and adjustments: 33.1% | Dose interruptions and adjustments: 33.1% | 12 | |
| Deferasirox | not reported | 15.2% (gastrointestinal symptoms); 10.8% (skin rash); 8 (deafness/ neurosensory deafness/ hypoacusis); 2 (cataracts/lenticular opacities). 2 (transient increase in ALT <2 times normal limit) | Dose interruptions and adjustments: 36.8% (dose reduction of 33 ‐ 50% according to age and creatine levels) | Dose interruptions and adjustments: 36.8% (dose reduction of 33‐50% according to age and creatine levels) | 17 | ||
| not reported | DFO | not reported | 1/23 (neutropenia); 1/23 (jaundice/very high liver enzymes); 5/23 (skin reactions/allergy, swelling); 1/23 (systemic allergy); 1/23 (arthropathy) | 0 | none reported | 0 | |
| DFO + Deferiprone | not reported | 1 /22 (neutropenia); 2/22 (jaundice/very high liver enzymes); 3/22 (skin reactions/allergy, swelling); 6/22 (arthropathy); 3/22 (musculoskeletal pain); 4/22 (nausea/vomiting); 2/22 (weakness, fever); 1/22 (insomnia); 5/22 (anorexia) | 2 (to 50 mg/kg due to arthropathy) | none reported | 1 (jaundice/very high liver enzymes) | ||
| Deferiprone | not reported | 1/21 (agranulocytosis); 1/21 (jaundice/very high liver enzymes); 8/21 (arthropathy); 7/21 (nausea/vomiting); 2/21 (anorexia) | 2 (to 50 mg/kg due to arthropathy) | none reported | 2 (1 agranulocytosis; 1 jaundice/very high liver enzymes) | ||
| Prior iron chelation therapy received: DFO treatment inferred but not explicitly stated | DFO | 2/30 | 1/30 (abscess at site of infusion); 1/30 (allergic reaction); 1/30 (neutropenia); 1/14 (transient increase in ALT three times of upper limit). | none reported | none reported | 0 | |
| DFO + Deferiprone | 7/29 | 5/29 (vomiting); 3/29 (abdominal pain); 1/29 (diarrhoea); 5/12 (transient increase in ALT three times of upper limit) | none reported | none reported | 1 (neutropenia on day two after receiving DFO therapy only) | ||
| not reported | DFO | not reported | no adverse effects observed | 0 | 0 | 0 | |
| Deferiprone (with or without DFO in combination) | not reported | 2/21 (arthropathy of large joints) | 0 | 2 (arthropathy of large joints) | 0 | ||
| All participants had received DFO prior to trial enrolment | DFO | 11/73 | 6/73 (pain/erythema at injection site); 2/73 (ototoxicity); 2/73 (infection); 1/73 (hypertransaminasaemia) | 7 (6 pain and erythema at the injection site; 1 transient hypertransaminasemia). Dose and duration of reduction were not reported | 4 (2 infection (Yersinia enterocolitiica); 2 ototoxicity). Dose and duration of withdrawal were not reported | 0 | |
| Deferiprone | 24/71 | 16/71 (hypertransaminasaemia); 3/71 (nausea); 2/71 (leucopenia); 2/71 (mild joint pain); 1/71 (infection) | 3 (nausea). Dose and duration of reduction were not reported. | 4 (3 transient hypertransaminasemia; 1 infection). Dose and duration of withdrawal were not reported. | 5 (3 recurrence of hypertransaminaesima; 2 leukocytopenia). Timepoint for withdrawal was not reported | ||
| All patients treated with either DFO or deferiprone prior to trial with 1‐week washout period | DFO + Deferiprone | not reported | 15/65 (neutropenia); 5/65 (arthralgia); 7/65 (gastrointestinal problems); 22/65 (>2‐fold increase in ALT) | Dose reduction reported in 25/51 (49%) patients. Dose and duration of reduction were not reported | Number of temporary withdrawals not reported, but "no statistically significant difference in temporary and definitive discontinuation of treatment between the groups" | 12 | |
| Deferiprone | not reported | 3/88 (agranulocytosis); 11/88 (neutropenia); 6/88 (arthralgia); 16/88 (gastrointestinal problems); 23/88 (>2‐fold increase in ALT | Dose reduction reported in 26/46 (56.5%) patients. Dose and duration of reduction were not reported. | Number of temporary withdrawals not reported, but "no statistically significant difference in temporary and definitive discontinuation of treatment between the groups" | 21 | ||
| All participants had received DFO prior to trial enrolmente | DFO | not reported | 12/14 (problems at site of injection: pain, itching, erythema, swelling and induration) | none reported | 0 | 0 | |
| DFO + Deferiprone | not reported | 5/11 (nausea); 3/11 (joint pain/swelling/stiffness) | none reported | 0 | 0 | ||
| not reported | Deferiprone | not reported | 2/27 (agranulocytosis) | none reported | none reported | 2 (2 x agranulocytosis) | |
| DFO | not reported | 0/30 (agranulocytosis) | none reported | none reported | 0 | ||
| All participants had received DFO prior to trial enrolment. | DFO | not reported | 12/31 (local reactions at infusion site); 6/31 (pain/swelling in joints) | none reported | none reported | none reported | |
| Deferiprone | not reported | 19/29 (gastrointestinal disturbance); 9/29 (increased appetite); 8/29 (pain/ swelling in joints); 1/29 (neutropenia) | 0 | 0 | 0 | ||
| All participants had received DFO at a mean daily dose of >30 mg/kg 5 days/week for at least 4 weeks prior to 5‐day washout period | DFO | 21/23 | 3/23 (arthralgia); 8/23 (abdominal pain); 2/23 (nausea); 2/23 (vomiting); 8/23 (back pain); 4/23 (cough); 6/23 (pyrexia); 6/23 (rhinitis); 4/23 (asthenia); 4/23 (headache); 8/23 (pharyngitis); 6/23 (diarrhoea); 6/23 (pharyngolaryngeal pain); 5/23 (influenza); 2/23 (dyspepsia); 4/23 (influenza‐like); 3/23 (vertigo); 1/23 (urinary tract infection); 1/23 (bronchitis)* | Dose reduction reported in 4/23 (17.4%) patients. Dose and duration of reduction were not reported. | 5 (due to adverse events) | 2 | |
| Deferasirox 10mg/kg/day | 24/24 | 4/24 (arthralgia); 14/24 (abdominal pain); 2/24 (nausea); 8/24 (back pain); 5/24 (cough); 7/24 (pyrexia); 7/24 (rhinitis); 3/24 (asthenia); 9/24 (headache); 10/24 (pharyngitis); 7/24 (diarrhoea); 5/24 (pharyngolaryngeal pain); 1/24 (influenza); 1/24 (dyspepsia); 7/24 (influenza‐like); 5/24 (vertigo); 4/24 (urinary tract infection); 5/24 (bronchitis)* | Dose reduction reported in 13/24 (54.2%) patients. Dose and duration of reduction were not reported. | 5 (due to adverse events) | 0 | ||
| Deferasirox 20mg/kg/day | 23/24 | 2/24 (arthralgia); 9/24 (abdominal pain); 8/24 (nausea); 8/24 (vomiting); 10/24 (back pain); 10/24 (cough); 10/24 (pyrexia); 9/24 (rhinitis); 7/24 (asthenia); 7/24 (headache); 7/24 (pharyngitis); 6/24 (diahorrea); 6/24 (pharyngolaryngeal pain); 5/24 (influenza); 4/24 (dyspepsia); 3/24 (influenza‐like); 2/24 (vertigo); 1/24 (urinary tract infection); 4/24 (allergic conjunctivitis)* | Dose reduction reported in 14/24 (58.3%) patients. Dose and duration of reduction were not reported. | 11 (due to adverse events) | 2 | ||
| All participants had received DFO prior to trial enrolment. | DFO | not reported | 1/40 (abscess at site of infusion); 11/40 (skin allergic reactions) | None reported | 0 | 0 | |
| DFO + Deferiprone | not reported | 3/40 (nausea); 3/40 (nausea with abdominal pain); 2/40 (diarrhoea); 2/40 (arthralgia); 8/40 (transient fluctuations in serum alanine ALT levels) | Temporary deferiprone dose reduction reported in "some" patients with gastrointestinal disturbances | 0 | 0 | ||
| Prior DFO received: mean (SD) dose 36.4 (11.1) mg/kg per day for 5.5 day/week (equivalent to 40.5 mg/kg for 5 days/week). No prior deferiprone received | DFO + placebo | not reported | 24% (gastrointestinal symptoms – generally mild); 6% (reactions at infusion site); 18% (joint pain/swelling) | none reported | none reported | 3 (1 x artrial fibrillation; 2 x personal reasons) | |
| DFO + Deferiprone | not reported | 38% (gastrointestinal symptoms – generally mild); 3% (reactions at infusion site); 9% (joint pain/swelling); 1/28 (agranulocytosis; 2/28 (neutropenia) | none reported | none reported | 4 (1 x agranulocytosis; 1 x reduction of myocardial T2* to <8ms; 1 x gastrointestinal symptoms; 1 x personal reasons) | ||
| All participants had received DFO 40 ‐ 50 mg/kg/day over 10 hours prior to study | DFO (bolus injection) | not reported | 30% (mild pain during injection); 70% (slight redness and painless swelling) | none reported | none reported | none reported | |
| DFO (continuous infusion) | not reported | 60% (painless swelling); 20% (hyperemia) | none reported | none reported | none reported | ||
| ALT: alanine aminotransferase *Piga 2006 ‐ only adverse events that occurred in 4 or more patients were reported | |||||||
| Study | Intervention | How measured? | Compliance Rate |
| DFO | Audit | No results reported | |
| DFO + Deferiprone | Audit | No results reported | |
| DFO + Deferiprone | Drug accounting at each visit ‐ counting the used vials of DFO and study‐specific questionnaire completed by patient or legal guardian at quaterly intervals | “Generally excellent during the entire study period” – no further details provided | |
| Deferiprone | Drug accounting at each visit ‐ counting returned empty blisters of deferiprone and study‐specific questionnaire completed by patient or legal guardian at quarterly intervals | “Generally excellent during the entire study period”. Only 1 patient who missed more than 1 chelation dose per week due to problems with swallowing | |
| DFO | Drug accounting at each visit: counting returned used vials of DFO | "Compliance excellent during study period". 4 patients were excluded due to lack of compliance (time point not stated) | |
| DFO + Deferiprone | Drug accounting at each visit; counting returned empty blisters of deferiprone and used vials of DFO | "Compliance excellent during study period". 80% patients complained about difficulties in the parenteral use of DFO or problems inserting the needle. 1 patient dropped out for reasons of non‐compliance | |
| Deferiprone | Drug accounting at each visit; counting returned empty blisters of deferiprone | "Compliance excellent during study period". 76% patients complained about difficulties in the parenteral use of DFO or problems inserting the needle | |
| DFO | Diary cards, weekly physical exam of infusion sites & by the Crono infusion pump that recorded the number of completed infusions | 95.7 (5.7)% | |
| DFO + Deferiprone | DFO: diary cards, weekly physical exam of infusion sites & by the Crono infusion pump that recorded the number of completed infusions Deferiprone: pill counts, diary cards & an electronic cap that recorded the time & date of each opening of the tablet container | 96.1 (5.0)% (compliance with DFO) | |
| DFO | By reviewing the diaries maintained by the patients or their parents at each visit | No results reported | |
| DFO + Deferiprone | By reviewing the diaries maintained by the patients or their parents at each visit | No results reported | |
| DFO | By reviewing the diaries maintained by the patients or their parents at each visit | No results reported | |
| Deferiprone | By reviewing the diaries maintained by the patients or their parents at each visit | No results reported | |
| DFO | Not reported | Compliance was not reported as an outcome in this trial. However the authors do note that 7/73 participants (10%) took a reduce dose of DFO due to low compliance. The dosage, duration and outcome of this change were not reported | |
| Deferiprone | Not reported | Compliance was not reported as an outcome in this trial. However the authors do note that 4/71 participants (6%) took a reduce dose of deferiprone due to low compliance. The dosage, duration and outcome of this change were not reported | |
| DFO + Deferiprone | By counting pills in each returned bag of deferiprone and assessing the number of infusions of DFO registered on the electronic pump | Deferiprone mean (SD): 92.7 (15.2)% (range 27% ‐ 100%); DFO: 70.6 (24.1)% (range 25 ‐ 100%) | |
| Deferiprone | By counting pills in each returned bag of deferiprone | Deferiprone mean (SD): 93.6 (9.7)% (range 56% ‐ 100%) | |
| DFO | By counting the number of vials of DFO used. Trial does not report what constituted "adequate levels of adherence", but rates compliance as 'excellent' or 'good' | Excellent (taking >90% of recommended dose): 11 participants | |
| DFO + Deferiprone | By counting the number of vials of DFO or tablets of deferiprone used. Trial does not report what constituted "adequate levels of adherence", but rates compliance as 'excellent' or 'good'. | Excellent (taking >90% of recommended dose): 10 participants | |
| DFO | Ambulatory pumps. Trial does not report what constituted "adequate levels of adherence" | DFO mean (SD): 71.6 (22.5)% | |
| Deferiprone | Computerised bottles. Trial does not report what constituted "adequate levels of adherence" | Deferiprone mean (SD): 94.9 (6.69)% | |
| DFO | Calculated as the percent of completed infusions, as determined by the Crono pumps, divided by the number of infusions prescribed. Trial does not report what constituted "adequate levels of adherence" | DFO mean (SD): 93 (9.7)% | |
| Deferiprone | Using the medication event monitoring system device and calculated as the % of openings with an interval >4 hours recorded, divided by the number of doses prescribed. Trial does not report what constituted "adequate levels of adherence" | Deferiprone mean (SD): 94 (5.3)% | |
| DFO | % complete infusions divided by prescribed infusions | DFO mean (SD): 92.6 (12.7)% | |
| DFO + Deferiprone | Pill counting at bimonthly visits; % of complete DFO infusions divided by prescribed infusions. | DFO mean (SD): 91.4 (12.7)%; deferiprone mean (SD): 82.4 (18.1)% | |
| DFO: desferrioxamine | |||
| Variables | DFO | DFO + deferiprone | Deferiprone |
| Cost of drug | 180 = Rs.150 for vial of 500 mg + Rs. 30 for needle and syringe | Rs. 198 | Rs. 18 = Rs. 6 per 250 mg capsule, 3 capsules daily |
| Cost of treatment per week | Rs. 900 | Rs. 486 | Rs. 126 |
| Cost of treatment for 6 months | Rs. 21600 | Rs. 11664 | Rs. 3024 |
| DFO: desferrioxamine | |||
| Trial | No. | DFO with deferiprone: baseline | DFO with deferiprone: end of trial | Absolute change | % change | Deferiprone: baseline | Deferiprone: end of trial | Absolute change | % change |
| 12/8 | 4070 (3223) µg/L | 3209 (2279) µg/L | reduction of 861 µg/L (SD not reported) | reduction of 32% | 4350 (3342) µg/L | 2954 (2765) µg/L | reduction of 1396 µg/L (SD not reported) | reduction of 32% | |
| 20/18 | 2865 (983) µg/L | approx. 1050 µg/L (estimated from graph) | reduction of approx. 1815 µg/L | not available | 2926 (1107) µg/L | approx. 900 µg/L (estimated from graph) | reduction of approx. 2026 µg/L | not available | |
| 10/11 | 3347.78 (1526.46) ng/ml | 3376.57 (1222.41) ng/ml | increase of 28.79 (915.86) ng/ml | increase of 0.9% | 2672.90 (886.44) ng/ml | 3422.66 (1581.01) ng/ml | increase of 749.75 (1155.77) ng/ml | increase of 28% | |
| 78/74 (12 months); 32/26 (5 years) | 1787 (735) ng/ml | 12 months: 1400 (770) ng/ml 5 years: 1369 (816) ng/mla | 12 months: reduction of 417 (589) ng/ml 5 years: reduction of 396 (894) ng/mla | not availablea | 1890 (816) ng/ml | 12 months: 1633 (+/‐ 841) ng/ml 5 years: 1588 (+/‐ 1217) ng/mla | 12 months: reduction of 132 (724) ng/ml 5 years: reduction of 115 (1009) ng/mla | not availablea | |
| DFO: desferrioxamine | |||||||||
| Trial | No. | DFO: baseline | DFO: end of trial | Absolute change | % change | DFO with deferiprone: baseline | DFO with deferiprone: end of trial | Absolute change | % change |
| 30/30 | 4250 (1500) ng/ml | 1200 (850) ng/ml | reduction of 3050 ng/ml (SD not reported) | reduction of 72% | 4500 (1250) ng/ml | 1250 (750) ng/ml | reduction of 3250 ng/ml (SD not reported) | reduction of 72% | |
| 20/18 | 2838 (967) µg/L | approx. 1650 µg/L (estimated from graph) | reduction of approx. 1188 µg/L | Not available | 2865 (983) µg/L | approx. 1050 µg/L (estimated from graph) | reduction of approx. 1815 µg/L
| not available | |
| 30/29 | 2257 (748) µg/L | approx. 1850 µg/L (estimated from graph) | reduction of 349 (573) ug/L | reduction of 15.4% | 2048 (685) µg/L | approx. 1750 µg/L (estimated from graph) | reduction of 248 (791) ug/L | reduction of 12.1% | |
| 7/10 | 5077.18 (1714.99) ng/ml | 3718 (738.39) ng/ml | reduction of 1358.87 (1374.14) ng/ml | reduction of 26.8% | 3347.78 (+/‐ 1526.46) ng/ml | 3376.57 (1222.41) ng/ml | increase of 28.79 (915.86) ng/ml | increase of 0.9% | |
| 14/17 | not reported | not reported | increase of 1059 (2285) mmol/L | not available | not reported | not reported | reduction of 987.0 (2984) mmol/L | not available | |
| 14/11 | 5506 (2375) µg/L | 6 mths: 4856 (2615) µg/L 12 mths: 3998 (2409) µg/L | 6 months: reduction of 650 µg/L 12 months: reduction of 1508 µg/L | 6 months: reduction of 11.8% 12 months: reduction of 27.4% | 4153 (1715) µg/L | 6 months: 3005 (1303) µg/L months: 2805 (1084) µg/L | 6 months: reduction of 1148 µg/L 12 months: reduction of 1348 µg/L | 6 months: reduction of 27.6% 12 months: reduction of 32.5% | |
| 40/40 | 2945 (591) ng/ml | 6 months: 2702 (242) ng/ml 12 months: 2451 (352) ng/ml | 6 months: reduction of 243 ng/ml 12 months: 494 ng/ml | 6 months: reduction of 8.3% 12 months: reduction of 16.8% | 2986 (612) ng/ml | 6 months: 2453 (318) ng/ml 12 months: 2082 (221) ng/ml | 6 months: reduction of 533 ng/ml 12 months: reduction of 904 ng/ml | 6 months: reduction of 17.8% 12 months: reduction of 30.3% | |
| 30/28a | 1379 (CV 10) µg/Lb | 1146 (CV 11) µg/Lb | reduction of 233 µg/L | reduction of 16.9% | 1574 (11) µg/Lb | 598 (CV 14) µg/Lb | reduction of 976 µg/L | reduction of 62% | |
| DFO: desferrioxamine | |||||||||
| Trial | No. | DFO: baseline | DFO: end | Absolute change | % change | Deferiprone + DFO: baseline | Deferiprone + DFO: end | Absolute change | % change |
| 15/16 | 22.5 (10.1) mg/g d/w | approx. 11.5 (6.3) mg/g d/w (estimated from graph) | reduction of approx. 11mg/g d/w | not reported | 17.1 (9.1) mg/g d/w | approx. 6.5 (3.5) mg/g d/w (estimated from graph) | reduction of approx. 10.6 mg/g d/w | not reported | |
| 30/29 | 1625 (642) µg/g w/w | not reported | reduction of 239 (474) µg FE/g liver | reduction of 14.7% | 1629 (744) µg/g w/w | not reported | reduction of 65 (615) µg FE/g liver | reduction of 4.0% | |
| 14/17 | not reported | not reported | increase of 0.82 (8.25) mg/g d/w | not available | not reported | not reported | increase of 0.95 (15.49) mg/g d/w | not available | |
| 32/28 | 4.2 (CV 0.62) msa | 5.0 msa | increase of 0.8 msa | increase of 20.0% | 4.9 (CV 0.52) msa | 10.7 msa | increase of 5.8 msa | increase of 18.4% | |
| DFO: desferrioxamine a values given are geometric mean of liver T2* (CV, coefficient of variation). | |||||||||
| Trial | No. | DFO with deferiprone: baseline | DFO with deferiprone: end of trial | Absolute change | % change | Deferiprone: baseline | Deferiprone: end of trial | Absolute change | % change |
| 8/12 | 26.6 (5.4) mg/g d/w | 18.1 (11.6) mg/g d/w | reduction of 8.5 mg/g d/w | reduction of 32.0% | 30.7 (10.6) mg/g d/w | 28.6 (12.8) mg/g d/w | reduction of 2.1 mg/g d/w | reduction of 6.8% | |
| 16/17 | 17.1 (9.1) mg/g d/w | approx. 6.5 (3.5) mg/g d/w (estimated from graph) | reduction of approx. 10.6 mg/g d/w | not reported | 15.8 (7.1) mg/g d/w | approx. 7.5 (3.6) mg/g d/w (estimated from graph) | reduction of approx. 8.3 mg/g d/w | not reported | |
| 34/20 | 4.0 (2.9) msa | 4.4 (3.4) msa | increase of 0.4 ms | not reported | 4.0 (5.9) msa | 3.5 (4.3) msa | reduction of 0.4 ms | not reported | |
| DFO: desferrioxamine | |||||||||
| Dose | Serum ferritin concentration | Liver iron concentration | ||||
| N | Baseline* | Mean (SD) change from baseline | N | Baseline | Mean (SD) change from baseline | |
| DFO 20 ‐ 30 mg/kg/day | 13 | not reported | increase: 211(459) ug/L | 13 | 2.7 (0.28) | increase: 0.5 (1.11) |
| DFO 25 ‐ 35 mg/kg/day | 77 | not reported | increase: 32 (585) ug/L | 75 | 5.2 (1.22) | no change: 0.0 (2.36) |
| DFO 35 ‐ 50 mg/kg/day | 89 | not reported | reduction: ‐364 (614) ug/L | 87 | 10.6 (2.03) | reduction: ‐1.9 (2.93) |
| DFO <50 mg/kg/day | 101 | not reported | reduction: ‐1003 (1428) ug/L | 98 | 23.9 (8.06) | reduction: ‐6.4 (6.93) |
| Deferasirox 5 mg/kg/day | 15 | not reported | increase: 1189(700) ug/L | 15 | 2.5 (0.21) | increase: 4.8 (3.77) |
| Deferasirox 10 mg/kg/day | 73 | not reported | increase: 833 (817) ug/L | 68 | 4.9 (1.08) | increase: 3.8 (3.85) |
| Deferasirox 20 mg/kg/day | 80 | not reported | reduction: ‐36 (721) ug/L | 77 | 10.6 (2.08) | reduction: ‐0.4 (4.7) |
| Deferasirox 30 mg/kg/day | 115 | not reported | reduction: ‐926 (1416) ug/L | 108 | 24.2 (7.82) | reduction: ‐8.9 (8.07) |
| DFO: desferrioxamine | ||||||
| Outcome or subgroup title | No. of studies | No. of participants | Statistical method | Effect size |
| 1 Left ventricular ejection fraction: mean change from baseline (%) Show forest plot | 3 | Mean Difference (IV, Fixed, 95% CI) | Subtotals only | |
| 1.1 At 6 months | 1 | 61 | Mean Difference (IV, Fixed, 95% CI) | ‐1.48 [‐3.04, 0.08] |
| 1.2 At 12 months | 3 | 245 | Mean Difference (IV, Fixed, 95% CI) | ‐1.60 [‐2.97, ‐0.24] |
| 1.3 At 24 months | 1 | 23 | Mean Difference (IV, Fixed, 95% CI) | ‐7.6 [‐15.85, 0.65] |
| 2 Right ventricular ejection fraction: mean at endpoint (%) Show forest plot | 1 | Mean Difference (IV, Fixed, 95% CI) | Totals not selected | |
| 2.1 At 6 months | 1 | Mean Difference (IV, Fixed, 95% CI) | 0.0 [0.0, 0.0] | |
| 2.2 At 12 months | 1 | Mean Difference (IV, Fixed, 95% CI) | 0.0 [0.0, 0.0] | |
| 3 Liver fibrosis Ishak score: mean at endpoint Show forest plot | 1 | Mean Difference (IV, Fixed, 95% CI) | Totals not selected | |
| 3.1 At 12 months | 1 | Mean Difference (IV, Fixed, 95% CI) | 0.0 [0.0, 0.0] | |
| 4 Serum ferritin concentration: mean change from baseline (ng/ml) Show forest plot | 5 | Mean Difference (IV, Fixed, 95% CI) | Totals not selected | |
| 4.1 At 6 months | 3 | Mean Difference (IV, Fixed, 95% CI) | 0.0 [0.0, 0.0] | |
| 4.2 At 12 months | 2 | Mean Difference (IV, Fixed, 95% CI) | 0.0 [0.0, 0.0] | |
| 4.3 At 24 months | 1 | Mean Difference (IV, Fixed, 95% CI) | 0.0 [0.0, 0.0] | |
| 5 Urinary iron excretion: mean at endpoint (mg/24h) Show forest plot | 4 | Mean Difference (IV, Fixed, 95% CI) | Totals not selected | |
| 5.1 As a mean of quarterly readings | 1 | Mean Difference (IV, Fixed, 95% CI) | 0.0 [0.0, 0.0] | |
| 5.2 At 12 months | 1 | Mean Difference (IV, Fixed, 95% CI) | 0.0 [0.0, 0.0] | |
| 5.3 Early after starting treatment | 1 | Mean Difference (IV, Fixed, 95% CI) | 0.0 [0.0, 0.0] | |
| 5.4 24 hours after starting treatment | 1 | Mean Difference (IV, Fixed, 95% CI) | 0.0 [0.0, 0.0] | |
| 6 Urinary iron excretion: mean over study (%) Show forest plot | 1 | Mean Difference (IV, Fixed, 95% CI) | Totals not selected | |
| 7 Urinary iron excretion: mean change from baseline (mg/24h) Show forest plot | 1 | Mean Difference (IV, Fixed, 95% CI) | Totals not selected | |
| 7.1 At 12 months | 1 | Mean Difference (IV, Fixed, 95% CI) | 0.0 [0.0, 0.0] | |
| 8 Liver iron concentration: ratio of geometric means at endpoint (mg/g dry weight) Show forest plot | 3 | Ratio of GM (Fixed, 95% CI) | Totals not selected | |
| 8.1 At 12 months | 1 | Ratio of GM (Fixed, 95% CI) | 0.0 [0.0, 0.0] | |
| 8.2 At 24 months | 1 | Ratio of GM (Fixed, 95% CI) | 0.0 [0.0, 0.0] | |
| 8.3 At 31‐36 months | 2 | Ratio of GM (Fixed, 95% CI) | 0.0 [0.0, 0.0] | |
| 9 Liver iron concentration: mean change from baseline (mg/g dry weight) Show forest plot | 3 | Mean Difference (IV, Fixed, 95% CI) | Totals not selected | |
| 9.1 At 6 months | 1 | Mean Difference (IV, Fixed, 95% CI) | 0.0 [0.0, 0.0] | |
| 9.2 At 12 months | 1 | Mean Difference (IV, Fixed, 95% CI) | 0.0 [0.0, 0.0] | |
| 9.3 At 24 months | 1 | Mean Difference (IV, Fixed, 95% CI) | 0.0 [0.0, 0.0] | |
| 10 Myocardial T2*: ratio of geometric means of change from baseline Show forest plot | 1 | Ratio of GM (Fixed, 95% CI) | Totals not selected | |
| 10.1 At 6 months | 1 | Ratio of GM (Fixed, 95% CI) | 0.0 [0.0, 0.0] | |
| 10.2 At 12 months | 1 | Ratio of GM (Fixed, 95% CI) | 0.0 [0.0, 0.0] | |
| 11 Chelation efficiency (%) Show forest plot | 1 | Mean Difference (IV, Fixed, 95% CI) | Totals not selected | |
| 11.1 At end of trial | 1 | Mean Difference (IV, Fixed, 95% CI) | 0.0 [0.0, 0.0] | |
| 12 Plasma NTBI: mean change from baseline (mM) Show forest plot | 1 | Mean Difference (IV, Fixed, 95% CI) | Totals not selected | |
| 12.1 At end of trial | 1 | Mean Difference (IV, Fixed, 95% CI) | 0.0 [0.0, 0.0] | |
| 13 Total iron excretion: mean at endpoint (mg/kg/day) Show forest plot | 1 | Mean Difference (IV, Fixed, 95% CI) | Totals not selected | |
| 13.1 At end of trial | 1 | Mean Difference (IV, Fixed, 95% CI) | 0.0 [0.0, 0.0] | |
| 14 Adverse events Show forest plot | 5 | Risk Ratio (M‐H, Fixed, 95% CI) | Subtotals only | |
| 14.1 Number of participants experiencing an adverse event | 1 | 144 | Risk Ratio (M‐H, Fixed, 95% CI) | 0.45 [0.24, 0.84] |
| 14.2 Risk of pain or swelling in joints | 3 | 248 | Risk Ratio (M‐H, Fixed, 95% CI) | 0.38 [0.17, 0.83] |
| 14.3 Risk of gastrointestinal disturbances | 2 | 188 | Risk Ratio (M‐H, Fixed, 95% CI) | 0.09 [0.01, 0.64] |
| 14.4 Risk of leucopenia, neutropenia and/or agranulocytosis | 5 | 323 | Risk Ratio (M‐H, Fixed, 95% CI) | 0.31 [0.08, 1.28] |
| 14.5 Risk of increased liver transaminase | 2 | 188 | Risk Ratio (M‐H, Fixed, 95% CI) | 0.11 [0.03, 0.48] |
| 15 Participant compliance (%) Show forest plot | 2 | Mean Difference (IV, Fixed, 95% CI) | Totals not selected | |
| 15.1 At 12 months | 1 | Mean Difference (IV, Fixed, 95% CI) | 0.0 [0.0, 0.0] | |
| 15.2 At 3 years | 1 | Mean Difference (IV, Fixed, 95% CI) | 0.0 [0.0, 0.0] | |
| Outcome or subgroup title | No. of studies | No. of participants | Statistical method | Effect size |
| 1 Left ventricular ejection fraction: mean at endpoint (%) Show forest plot | 1 | Mean Difference (IV, Fixed, 95% CI) | Totals not selected | |
| 1.1 At 12 months | 1 | Mean Difference (IV, Fixed, 95% CI) | 0.0 [0.0, 0.0] | |
| 2 Serum ferritin concentration: mean at endpoint (ng/ml) Show forest plot | 3 | Mean Difference (IV, Fixed, 95% CI) | Totals not selected | |
| 2.1 At 6 months | 1 | Mean Difference (IV, Fixed, 95% CI) | 0.0 [0.0, 0.0] | |
| 2.2 At 12 months | 2 | Mean Difference (IV, Fixed, 95% CI) | 0.0 [0.0, 0.0] | |
| 3 Serum ferritin concentration: mean change from baseline (ng/ml) Show forest plot | 2 | Mean Difference (IV, Fixed, 95% CI) | Totals not selected | |
| 3.1 At 6 months | 1 | Mean Difference (IV, Fixed, 95% CI) | 0.0 [0.0, 0.0] | |
| 3.2 At 12 months | 1 | Mean Difference (IV, Fixed, 95% CI) | 0.0 [0.0, 0.0] | |
| 3.3 At 2 years | 1 | Mean Difference (IV, Fixed, 95% CI) | 0.0 [0.0, 0.0] | |
| 3.4 At 3 years | 1 | Mean Difference (IV, Fixed, 95% CI) | 0.0 [0.0, 0.0] | |
| 3.5 At 4 years | 1 | Mean Difference (IV, Fixed, 95% CI) | 0.0 [0.0, 0.0] | |
| 3.6 At 5 years | 1 | Mean Difference (IV, Fixed, 95% CI) | 0.0 [0.0, 0.0] | |
| 4 Urinary iron excretion: mean over study (%) Show forest plot | 1 | Mean Difference (IV, Fixed, 95% CI) | Totals not selected | |
| 5 Urinary iron excretion: mean at endpoint (mg/24h) Show forest plot | 2 | Mean Difference (IV, Fixed, 95% CI) | Totals not selected | |
| 5.1 Early after starting treatment | 1 | Mean Difference (IV, Fixed, 95% CI) | 0.0 [0.0, 0.0] | |
| 5.2 As a mean of quarterly readings (mg/kg/day) | 1 | Mean Difference (IV, Fixed, 95% CI) | 0.0 [0.0, 0.0] | |
| 6 Liver iron concentration: mean at endpoint (mg/g dry weight) Show forest plot | 2 | Mean Difference (IV, Fixed, 95% CI) | Subtotals only | |
| 6.1 At 12 months | 2 | 53 | Mean Difference (IV, Fixed, 95% CI) | ‐1.45 [‐3.82, 0.91] |
| 7 Chelation efficiency (%) Show forest plot | 1 | Mean Difference (IV, Fixed, 95% CI) | Totals not selected | |
| 7.1 At end of trial | 1 | Mean Difference (IV, Fixed, 95% CI) | 0.0 [0.0, 0.0] | |
| 8 Plasma NTBI: mean change from baseline (mM) Show forest plot | 1 | Mean Difference (IV, Fixed, 95% CI) | Totals not selected | |
| 8.1 At end of trial | 1 | Mean Difference (IV, Fixed, 95% CI) | 0.0 [0.0, 0.0] | |
| 9 Total Iron excretion: mean at endpoint (mg/kg/day) Show forest plot | 2 | Mean Difference (IV, Fixed, 95% CI) | Totals not selected | |
| 9.1 At end of trial | 1 | Mean Difference (IV, Fixed, 95% CI) | 0.0 [0.0, 0.0] | |
| 9.2 Mean change from baseline | 1 | Mean Difference (IV, Fixed, 95% CI) | 0.0 [0.0, 0.0] | |
| 10 Adverse Events Show forest plot | 3 | Risk Ratio (M‐H, Fixed, 95% CI) | Subtotals only | |
| 10.1 Risk of pain or swelling in joints | 3 | 217 | Risk Ratio (M‐H, Fixed, 95% CI) | 0.97 [0.50, 1.90] |
| 10.2 Risk of gastrointestinal disturbances | 2 | 196 | Risk Ratio (M‐H, Fixed, 95% CI) | 0.58 [0.30, 1.11] |
| 10.3 Risk of leucopenia, neutropenia and/or agranulocytosis | 3 | 217 | Risk Ratio (M‐H, Fixed, 95% CI) | 1.41 [0.76, 2.61] |
| 10.4 Risk of increased liver transaminase | 2 | 196 | Risk Ratio (M‐H, Fixed, 95% CI) | 1.37 [0.85, 2.21] |
| Outcome or subgroup title | No. of studies | No. of participants | Statistical method | Effect size |
| 1 Left ventricular ejection fraction: mean at endpoint (%) Show forest plot | 2 | Mean Difference (IV, Fixed, 95% CI) | Subtotals only | |
| 1.1 At 12 months | 2 | 118 | Mean Difference (IV, Fixed, 95% CI) | ‐6.22 [‐8.12, ‐4.32] |
| 2 Serum ferritin concentration: ratio of geometric means at endpoint (ng/ml) Show forest plot | 3 | Ratio of GM (Fixed, 95% CI) | Totals not selected | |
| 2.1 At 6 months | 3 | Ratio of GM (Fixed, 95% CI) | 0.0 [0.0, 0.0] | |
| 3 Serum ferritin concentration: ratio of geometric means at endpoint (ng/ml) Show forest plot | 3 | Ratio of GM (Fixed, 95% CI) | Subtotals only | |
| 3.1 At 12 months | 3 | Ratio of GM (Fixed, 95% CI) | 1.17 [1.10, 1.23] | |
| 4 Serum ferritin concentration: mean change from baseline (ng/ml) Show forest plot | 3 | Mean Difference (IV, Fixed, 95% CI) | Totals not selected | |
| 4.1 At 6 months | 2 | Mean Difference (IV, Fixed, 95% CI) | 0.0 [0.0, 0.0] | |
| 4.2 At 12 months | 1 | Mean Difference (IV, Fixed, 95% CI) | 0.0 [0.0, 0.0] | |
| 5 Urinary iron excretion: mean at endpoint (mg/24h) Show forest plot | 3 | Mean Difference (IV, Fixed, 95% CI) | Totals not selected | |
| 5.1 At 6 months | 1 | Mean Difference (IV, Fixed, 95% CI) | 0.0 [0.0, 0.0] | |
| 5.2 At 12 months | 1 | Mean Difference (IV, Fixed, 95% CI) | 0.0 [0.0, 0.0] | |
| 5.3 As a mean of quarterly readings | 1 | Mean Difference (IV, Fixed, 95% CI) | 0.0 [0.0, 0.0] | |
| 6 Urinary iron excretion: mean over study (%) Show forest plot | 1 | Mean Difference (IV, Fixed, 95% CI) | Totals not selected | |
| 7 Liver iron concentration: mean change from baseline Show forest plot | 2 | Mean Difference (IV, Fixed, 95% CI) | Totals not selected | |
| 7.1 At 6 months (mg/g dry weight) | 1 | Mean Difference (IV, Fixed, 95% CI) | 0.0 [0.0, 0.0] | |
| 7.2 At 12 months (mg/g wet weight) | 1 | Mean Difference (IV, Fixed, 95% CI) | 0.0 [0.0, 0.0] | |
| 8 Chelation efficency (%) Show forest plot | 1 | Mean Difference (IV, Fixed, 95% CI) | Totals not selected | |
| 8.1 At end of trial | 1 | Mean Difference (IV, Fixed, 95% CI) | 0.0 [0.0, 0.0] | |
| 9 Plasma NBTI: mean change from baseline (mM) Show forest plot | 1 | Mean Difference (IV, Fixed, 95% CI) | Totals not selected | |
| 9.1 At end of trial | 1 | Mean Difference (IV, Fixed, 95% CI) | 0.0 [0.0, 0.0] | |
| 10 Total iron excretion: mean at endpoint (mg/kg/day) Show forest plot | 1 | Mean Difference (IV, Fixed, 95% CI) | Totals not selected | |
| 10.1 At end of trial | 1 | Mean Difference (IV, Fixed, 95% CI) | 0.0 [0.0, 0.0] | |
| 11 Adverse events Show forest plot | 5 | Risk Ratio (M‐H, Fixed, 95% CI) | Subtotals only | |
| 11.1 Number of participants experiencing an adverse event | 2 | 119 | Risk Ratio (M‐H, Fixed, 95% CI) | 0.33 [0.13, 0.84] |
| 11.2 Risk of pain or swelling in joints | 3 | 190 | Risk Ratio (M‐H, Fixed, 95% CI) | 0.63 [0.26, 1.52] |
| 11.3 Risk of gastrointestinal disturbances | 2 | 106 | Risk Ratio (M‐H, Fixed, 95% CI) | 0.47 [0.23, 0.98] |
| 11.4 Risk of leucopenia, neutropenia and/or agranulocytosis | 4 | 226 | Risk Ratio (M‐H, Fixed, 95% CI) | 0.55 [0.14, 2.20] |
| 11.5 Risk of increased liver transaminase | 3 | 131 | Risk Ratio (M‐H, Fixed, 95% CI) | 0.58 [0.28, 1.20] |
| Outcome or subgroup title | No. of studies | No. of participants | Statistical method | Effect size |
| 1 Serum ferritin concentration: mean change from baseline (ng/ml) Show forest plot | 1 | Mean Difference (IV, Fixed, 95% CI) | Totals not selected | |
| 1.1 DFO 20‐30 mg/day; Deferasirox 5mg/kg | 1 | Mean Difference (IV, Fixed, 95% CI) | 0.0 [0.0, 0.0] | |
| 1.2 DFO 25‐30 mg/day; Defersirox 10mg/kg | 1 | Mean Difference (IV, Fixed, 95% CI) | 0.0 [0.0, 0.0] | |
| 1.3 DFO 35‐50 mg/day; Deferasirox 20mg/kg | 1 | Mean Difference (IV, Fixed, 95% CI) | 0.0 [0.0, 0.0] | |
| 1.4 DFO >50 mg/day; Deferasirox 30mg/kg | 1 | Mean Difference (IV, Fixed, 95% CI) | 0.0 [0.0, 0.0] | |
| 1.5 Deferasirox combined across all doses | 1 | Mean Difference (IV, Fixed, 95% CI) | 0.0 [0.0, 0.0] | |
| 2 Liver iron concentration: mean change from baseline (mg/g dry weight) Show forest plot | 2 | Mean Difference (IV, Fixed, 95% CI) | Totals not selected | |
| 2.1 At 12 months: deferasirox 5mg/kg | 1 | Mean Difference (IV, Fixed, 95% CI) | 0.0 [0.0, 0.0] | |
| 2.2 At 12 months: deferasirox 10mg/kg | 1 | Mean Difference (IV, Fixed, 95% CI) | 0.0 [0.0, 0.0] | |
| 2.3 At 12 months: deferasirox 20mg/kg | 1 | Mean Difference (IV, Fixed, 95% CI) | 0.0 [0.0, 0.0] | |
| 2.4 At 12 months: deferasirox 30mg/kg | 1 | Mean Difference (IV, Fixed, 95% CI) | 0.0 [0.0, 0.0] | |
| 2.5 At 12 months: deferasirox combined across all doses | 1 | Mean Difference (IV, Fixed, 95% CI) | 0.0 [0.0, 0.0] | |
| 2.6 At 18 months: deferasirox 10mg/kg | 1 | Mean Difference (IV, Fixed, 95% CI) | 0.0 [0.0, 0.0] | |
| 2.7 At 18 months: deferasirox 20mg/kg | 1 | Mean Difference (IV, Fixed, 95% CI) | 0.0 [0.0, 0.0] | |
| 3 Total iron excretion: ratio of iron excretion to iron intake (mg/kg/day) Show forest plot | 1 | Mean Difference (IV, Fixed, 95% CI) | Totals not selected | |
| 3.1 DFO 20‐30mg/kg; deferasirox 5mg/kg | 1 | Mean Difference (IV, Fixed, 95% CI) | 0.0 [0.0, 0.0] | |
| 3.2 DFO 25‐35mg/kg; deferasirox 10mg/kg | 1 | Mean Difference (IV, Fixed, 95% CI) | 0.0 [0.0, 0.0] | |
| 3.3 DFO 35‐50mg/kg; deferasirox 20mg/kg | 1 | Mean Difference (IV, Fixed, 95% CI) | 0.0 [0.0, 0.0] | |
| 3.4 DFO >50mg/kg; deferasirox 30mg/kg | 1 | Mean Difference (IV, Fixed, 95% CI) | 0.0 [0.0, 0.0] | |
| 3.5 DFO and deferiprone combined across all doses | 1 | Mean Difference (IV, Fixed, 95% CI) | 0.0 [0.0, 0.0] | |
| Outcome or subgroup title | No. of studies | No. of participants | Statistical method | Effect size |
| 1 Serum ferritin concentration: mean at endpoint (ng/ml) Show forest plot | 1 | Mean Difference (IV, Fixed, 95% CI) | Totals not selected | |
| 1.1 At 12 months | 1 | Mean Difference (IV, Fixed, 95% CI) | 0.0 [0.0, 0.0] | |
| 2 Urinary iron excretion (mg/24h) Show forest plot | 1 | Mean Difference (IV, Fixed, 95% CI) | Totals not selected | |
| 2.1 At 48 hours | 1 | Mean Difference (IV, Fixed, 95% CI) | 0.0 [0.0, 0.0] | |
| 3 Liver iron concentration: mean at endpoint (mg/g dry weight) Show forest plot | 1 | Mean Difference (IV, Fixed, 95% CI) | Totals not selected | |
| 3.1 At 12 months | 1 | Mean Difference (IV, Fixed, 95% CI) | 0.0 [0.0, 0.0] | |