Scolaris Content Display Scolaris Content Display

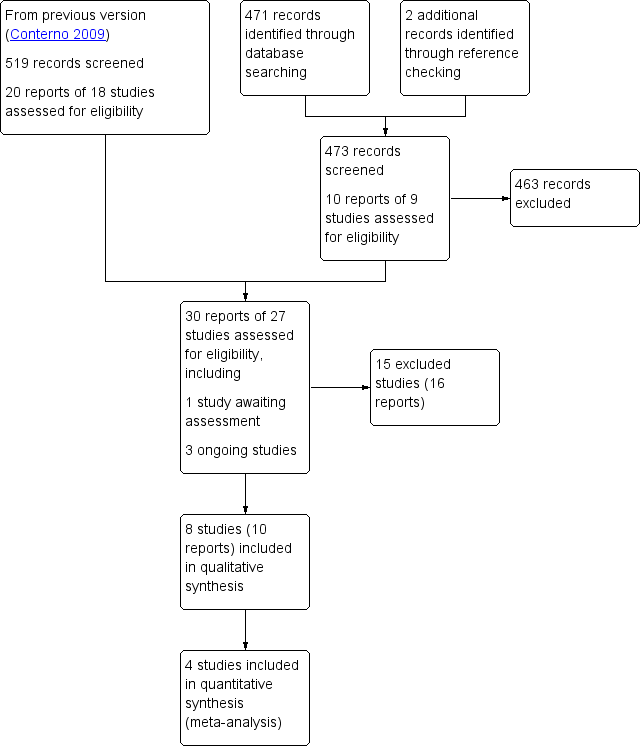
Study flow diagram.
Figuras y tablas -
Figure 1

Study flow diagram.

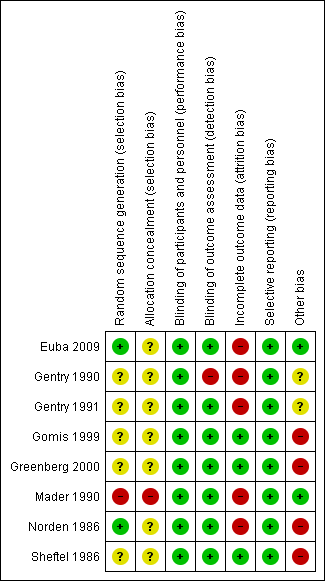
Risk of bias summary: review authors' judgements about each risk of bias item for each included study
Figuras y tablas -
Figure 2

Risk of bias summary: review authors' judgements about each risk of bias item for each included study

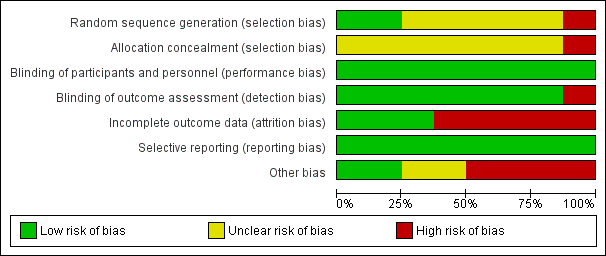
Risk of bias graph: review authors' judgements about each risk of bias item presented as percentages across all included studies
Figuras y tablas -
Figure 3

Risk of bias graph: review authors' judgements about each risk of bias item presented as percentages across all included studies

Comparison 1 Oral antibiotic versus parenteral antibiotic (AB), Outcome 1 Remission at the end of treatment.
Figuras y tablas -
Analysis 1.1

Comparison 1 Oral antibiotic versus parenteral antibiotic (AB), Outcome 1 Remission at the end of treatment.

Comparison 1 Oral antibiotic versus parenteral antibiotic (AB), Outcome 2 Remission at least 12 months after the end of treatment.
Figuras y tablas -
Analysis 1.2

Comparison 1 Oral antibiotic versus parenteral antibiotic (AB), Outcome 2 Remission at least 12 months after the end of treatment.

Comparison 1 Oral antibiotic versus parenteral antibiotic (AB), Outcome 3 Mild adverse events.
Figuras y tablas -
Analysis 1.3

Comparison 1 Oral antibiotic versus parenteral antibiotic (AB), Outcome 3 Mild adverse events.

Comparison 1 Oral antibiotic versus parenteral antibiotic (AB), Outcome 4 Moderate or severe adverse events.
Figuras y tablas -
Analysis 1.4

Comparison 1 Oral antibiotic versus parenteral antibiotic (AB), Outcome 4 Moderate or severe adverse events.

Comparison 1 Oral antibiotic versus parenteral antibiotic (AB), Outcome 5 Superinfection.
Figuras y tablas -
Analysis 1.5

Comparison 1 Oral antibiotic versus parenteral antibiotic (AB), Outcome 5 Superinfection.

Comparison 2 Oral antibiotic versus parenteral plus oral antibiotic, Outcome 1 Remission at least 12 months after the end of the treatment.
Figuras y tablas -
Analysis 2.1

Comparison 2 Oral antibiotic versus parenteral plus oral antibiotic, Outcome 1 Remission at least 12 months after the end of the treatment.

Comparison 2 Oral antibiotic versus parenteral plus oral antibiotic, Outcome 2 Adverse events.
Figuras y tablas -
Analysis 2.2

Comparison 2 Oral antibiotic versus parenteral plus oral antibiotic, Outcome 2 Adverse events.

Comparison 3 Parenteral plus oral antibiotics versus parenteral antibiotic, Outcome 1 Remission at least 12 months after the end of treatment.
Figuras y tablas -
Analysis 3.1

Comparison 3 Parenteral plus oral antibiotics versus parenteral antibiotic, Outcome 1 Remission at least 12 months after the end of treatment.

Comparison 3 Parenteral plus oral antibiotics versus parenteral antibiotic, Outcome 2 Adverse events.
Figuras y tablas -
Analysis 3.2

Comparison 3 Parenteral plus oral antibiotics versus parenteral antibiotic, Outcome 2 Adverse events.

Comparison 4 Parenteral antibiotic 1 (ceftazidime) versus parenteral antibiotic 2 (ticarcillin plus tobramycin), Outcome 1 Remission at least 12 months after the end of the treatment.
Figuras y tablas -
Analysis 4.1

Comparison 4 Parenteral antibiotic 1 (ceftazidime) versus parenteral antibiotic 2 (ticarcillin plus tobramycin), Outcome 1 Remission at least 12 months after the end of the treatment.

Comparison 4 Parenteral antibiotic 1 (ceftazidime) versus parenteral antibiotic 2 (ticarcillin plus tobramycin), Outcome 2 Adverse events.
Figuras y tablas -
Analysis 4.2

Comparison 4 Parenteral antibiotic 1 (ceftazidime) versus parenteral antibiotic 2 (ticarcillin plus tobramycin), Outcome 2 Adverse events.

Comparison 4 Parenteral antibiotic 1 (ceftazidime) versus parenteral antibiotic 2 (ticarcillin plus tobramycin), Outcome 3 Superinfection.
Figuras y tablas -
Analysis 4.3

Comparison 4 Parenteral antibiotic 1 (ceftazidime) versus parenteral antibiotic 2 (ticarcillin plus tobramycin), Outcome 3 Superinfection.

Comparison 5 Oral antibiotic 1 (ciprofloxacin) versus oral antibiotic 2 (lomefloxacin), Outcome 1 Remission at least 12 months after the end of treatment.
Figuras y tablas -
Analysis 5.1

Comparison 5 Oral antibiotic 1 (ciprofloxacin) versus oral antibiotic 2 (lomefloxacin), Outcome 1 Remission at least 12 months after the end of treatment.

Comparison 5 Oral antibiotic 1 (ciprofloxacin) versus oral antibiotic 2 (lomefloxacin), Outcome 2 Adverse events.
Figuras y tablas -
Analysis 5.2

Comparison 5 Oral antibiotic 1 (ciprofloxacin) versus oral antibiotic 2 (lomefloxacin), Outcome 2 Adverse events.

Comparison 1. Oral antibiotic versus parenteral antibiotic (AB)

Outcome or subgroup title

No. of studies

No. of participants

Statistical method

Effect size

1 Remission at the end of treatment Show forest plot

4

150

Risk Ratio (M‐H, Fixed, 95% CI)

1.04 [0.92, 1.18]

2 Remission at least 12 months after the end of treatment Show forest plot

3

118

Risk Ratio (M‐H, Fixed, 95% CI)

0.94 [0.78, 1.13]

3 Mild adverse events Show forest plot

3

118

Risk Ratio (M‐H, Fixed, 95% CI)

1.08 [0.49, 2.42]

4 Moderate or severe adverse events Show forest plot

3

91

Risk Ratio (M‐H, Fixed, 95% CI)

0.69 [0.19, 2.57]

5 Superinfection Show forest plot

3

124

Risk Ratio (M‐H, Fixed, 95% CI)

1.08 [0.33, 3.60]

Figuras y tablas -
Comparison 1. Oral antibiotic versus parenteral antibiotic (AB)
Comparison 2. Oral antibiotic versus parenteral plus oral antibiotic

Outcome or subgroup title

No. of studies

No. of participants

Statistical method

Effect size

1 Remission at least 12 months after the end of the treatment Show forest plot

1

Risk Ratio (M‐H, Fixed, 95% CI)

Totals not selected

2 Adverse events Show forest plot

1

Risk Ratio (M‐H, Fixed, 95% CI)

Totals not selected

Figuras y tablas -
Comparison 2. Oral antibiotic versus parenteral plus oral antibiotic
Comparison 3. Parenteral plus oral antibiotics versus parenteral antibiotic

Outcome or subgroup title

No. of studies

No. of participants

Statistical method

Effect size

1 Remission at least 12 months after the end of treatment Show forest plot

1

Risk Ratio (M‐H, Fixed, 95% CI)

Totals not selected

2 Adverse events Show forest plot

1

Risk Ratio (M‐H, Fixed, 95% CI)

Totals not selected

Figuras y tablas -
Comparison 3. Parenteral plus oral antibiotics versus parenteral antibiotic
Comparison 4. Parenteral antibiotic 1 (ceftazidime) versus parenteral antibiotic 2 (ticarcillin plus tobramycin)

Outcome or subgroup title

No. of studies

No. of participants

Statistical method

Effect size

1 Remission at least 12 months after the end of the treatment Show forest plot

1

Risk Ratio (M‐H, Fixed, 95% CI)

Totals not selected

2 Adverse events Show forest plot

1

Risk Ratio (M‐H, Fixed, 95% CI)

Totals not selected

3 Superinfection Show forest plot

1

Risk Ratio (M‐H, Fixed, 95% CI)

Totals not selected

Figuras y tablas -
Comparison 4. Parenteral antibiotic 1 (ceftazidime) versus parenteral antibiotic 2 (ticarcillin plus tobramycin)
Comparison 5. Oral antibiotic 1 (ciprofloxacin) versus oral antibiotic 2 (lomefloxacin)

Outcome or subgroup title

No. of studies

No. of participants

Statistical method

Effect size

1 Remission at least 12 months after the end of treatment Show forest plot

1

Risk Ratio (M‐H, Fixed, 95% CI)

Totals not selected

2 Adverse events Show forest plot

1

Risk Ratio (M‐H, Fixed, 95% CI)

Totals not selected

Figuras y tablas -
Comparison 5. Oral antibiotic 1 (ciprofloxacin) versus oral antibiotic 2 (lomefloxacin)