Terapia de movimiento inducido por restricción para las extremidades superiores en personas con un accidente cerebrovascular
Resumen
Antecedentes
En las personas que han sufrido un accidente cerebrovascular, la paresia de las extremidades superiores afecta a muchas actividades cotidianas. Por lo tanto, la reducción de la discapacidad es uno de los principales objetivos de las intervenciones de rehabilitación. A pesar de conservar o recuperar la capacidad de movimiento tras un accidente cerebrovascular, a veces las personas no aprovechan completamente esta capacidad en sus actividades cotidianas. La terapia de movimiento inducido por restricción (TMIR) es un enfoque de la rehabilitación del accidente cerebrovascular que implica el uso forzado y la práctica intensiva del brazo afectado mediante la restricción del brazo no afectado. Se ha propuesto como una herramienta útil para recuperar las habilidades en las actividades cotidianas.
Objetivos
Evaluar la eficacia de la TMIR, la TMIR modificada (TMIRm) o el uso forzado (UF) para el tratamiento del brazo en personas con hemiparesia después de un accidente cerebrovascular.
Métodos de búsqueda
Se realizaron búsquedas en el registro de ensayos del Grupo Cochrane de Accidentes cerebrovasculares (Cochrane Stroke Group) (última búsqueda en junio de 2015), en el Registro Cochrane central de ensayos controlados (Cochrane Central Register of Controlled Trials [CENTRAL]; La Biblioteca Cochrane número 1, 2015), en MEDLINE (desde 1966 hasta enero de 2015), en EMBASE (desde 1980 hasta enero de 2015), en CINAHL (desde 1982 hasta enero de 2015) y en la Physiotherapy Evidence Database (PEDro; enero de 2015).
Criterios de selección
Ensayos controlados aleatorizados (ECA) y cuasialeatorizados que compararan TMIR, TMIRm o UF con otras técnicas de rehabilitación, o ninguna.
Obtención y análisis de los datos
Un autor identificó los ensayos a partir de los resultados de las búsquedas electrónicas según los criterios de inclusión y exclusión, tres autores de la revisión evaluaron de forma independiente la calidad metodológica y el riesgo de sesgo, y extrajeron los datos. El desenlace principal fue la discapacidad.
Resultados principales
Se incluyeron 42 estudios con 1453 participantes. Los ensayos incluyeron a participantes que tenían cierta capacidad motora residual del brazo parético, la posibilidad de una mayor recuperación motora y que presentaban dolor o espasticidad limitados, pero que tendían a utilizar poco o nada la extremidad. La mayoría de los estudios tenían escaso poder estadístico (la mediana del número de participantes incluidos fue 29) y no fue posible descartar un sesgo de ensayo pequeño. Once ensayos (344 participantes) evaluaron la discapacidad inmediatamente después de la intervención, indicando una diferencia de medias estandarizada (DME) no significativa de 0,24 (intervalo de confianza [IC] del 95%: ‐0,05 a 0,52) que favoreció a la TMIR en comparación con el tratamiento convencional. Para el desenlace informado con más frecuencia, la función motora del brazo (28 estudios con 858 participantes), la DME fue 0,34 (IC del 95%: 0,12 a 0,55), lo que muestra un efecto significativo (valor de p 0,004) a favor de la TMIR. Tres estudios con 125 participantes exploraron la discapacidad tras unos meses de seguimiento y no encontraron diferencias significativas, DME ‐0,20 (IC del 95%: ‐0,57 a 0,16) a favor del tratamiento convencional.
Conclusiones de los autores
La TMIR es una intervención multifacética en la que la restricción de la extremidad menos afectada se acompaña de un aumento del ejercicio adaptado a la capacidad de la persona. Se encontró que la TMIR se asoció con mejorías limitadas en el deterioro motor y la función motora, pero que estos beneficios no redujeron de forma convincente la discapacidad. Esto difiere del resultado del metanálisis anterior de esta revisión, en el que se indicó que la TMIR podría ser superior a la rehabilitación tradicional. La información sobre los efectos a largo plazo de la TMIR es escasa. Se necesitan más ensayos que estudien la relación entre las características de los participantes y la mejoría de los desenlaces.
PICO
Resumen en términos sencillos
Terapia de movimiento inducido por restricción para las extremidades superiores (brazos) en pacientes con un ictus
Pregunta de la revisión
Se necesitaba evaluar los efectos de la terapia de movimiento inducido por restricción (TMIR) sobre la capacidad de realizar las actividades cotidianas y sobre la recuperación del movimiento de los brazos paralizados después de un ictus.
Antecedentes
Después de un ictus, los pacientes pueden presentar parálisis de un brazo, y, aunque se mantenga algún control del movimiento, se puede utilizar menos que el brazo no afectado. La parálisis hace que los movimientos del brazo como alcanzar, agarrar y manipular los objetos sean difíciles. A su vez, este hecho provoca muchas dificultades en las actividades cotidianas como bañarse, vestirse, comer y usar el baño. Durante la TMIR se restringe el brazo no afectado para que no se pueda utilizar, lo que significa que se tiene que utilizar en su lugar el brazo afectado. El movimiento del brazo y la mano no afectados se impide con un guante o un reposabrazos especial. Se supone que la TMIR es una herramienta útil para recuperar la capacidad de realizar las actividades cotidianas.
Características de los estudios
El equipo de investigadores Cochrane que ha realizado esta revisión, buscó ampliamente en la literatura médica e identificó 42 estudios relevantes con 1453 participantes. La evidencia está actualizada hasta enero de 2015. Los participantes en estos estudios tenían algún control del brazo afectado y generalmente fueron capaces de abrir la mano afectada al extender la muñeca y los dedos. Los tratamientos con TMIR variaron entre los estudios en cuanto al tiempo de restricción diario del brazo no afectado de los participantes y la cantidad de ejercicio activo que se recomendó que se hiciera con el brazo. La TMIR se comparó principalmente con tratamientos con fisioterapia activa y a veces con ningún tratamiento.
Resultados clave
Los 42 estudios evaluaron diferentes aspectos de la recuperación del ictus y no todos midieron lo mismo. Once estudios (con 344 participantes) evaluaron el efecto de la TMIR sobre la discapacidad (el uso efectivo del brazo en la vida cotidiana) y determinaron que el uso de la TMIR no provocó una mejoría en la capacidad de realizar actividades cotidianas como bañarse, vestirse, comer y usar el baño. Veintiocho ensayos (con 858 participantes) probaron si la TMIR mejoró la capacidad de utilizar el brazo afectado. La TMIR pareció ser más efectiva en la mejoría del movimiento del brazo que los tratamientos con fisioterapia activa o ningún tratamiento.
Calidad de la evidencia
La calidad de la evidencia para cada desenlace es limitada debido al escaso número de participantes en los estudios y al informe deficiente de los detalles de los estudios. Se consideró que la calidad de la evidencia fue baja para la discapacidad y muy baja para la capacidad de utilizar la extremidad afectada.
Authors' conclusions
Summary of findings
| Constraint‐induced movement therapy (CIMT) or modified CIMT (mCIMT) or Forced Use (FU) compared with usual care or no treatment for the recovery of affected upper limb in people with stroke | |||||
| Patient or population: people with stroke receiving upper limb rehabilitation | |||||
| Outcomes | Illustrative comparative risks* (95% CI) | Relative effect | No of participants | Comments | |
| Assumed risk | Corresponding risk | ||||
| Usual care or no treatment | CIMT or mCIMT or FU | ||||
| Disability Follow‐up: at the end of treatment | The mean disability in the intervention groups was | 344 | A standard deviation of 0.24 represents a small difference between the groups The estimated effect is non significant because its 95% interval confidence includes the null effect | ||
| Arm Motor Function Follow‐up: at the end of treatment | The mean arm motor function in the intervention groups was | 858 | A standard deviation of 0.34 represents a small difference between the groups | ||
| Perceived Arm Motor Function (Quality of Use) Follow‐up: at the end of treatment | The mean perceived arm motor function (quality of use) ranged across control groups from 0.14 to 1.4 points | The mean perceived arm motor function (quality of use) in the intervention groups was | 891 | The minimal clinically important difference for this scale assessing the quality of use is 1 or 1.1 points depending on the dominance of the affected arm (Lang 2008). | |
| Perceived Arm Motor Function (Amount of Use) | The mean perceived arm motor function (amount of use) ranged across control groups from ‐0.07 to 1.6 points | The mean perceived arm motor function (amount of use) in the intervention groups was | 851 | ||
| Arm Motor Impairment Follow‐up: at the end of treatment | The mean arm motor impairment in the intervention groups was | 372 | A standard deviation of 0.82 represents a large difference between the groups | ||
| Quality of life Follow‐up: at the end of treatment | The mean quality of life score ranged across control groups from ‐3.46 to 7.5 points | The mean quality of life in the intervention groups was | 96 | ||
| Dexterity Follow‐up: at the end of treatment | The mean dexterity in the intervention groups was | 113 | A standard deviation of 0.42 represents a small difference between the groups. | ||
| *The assumed risk is based on the highest and the lowest estimate of the scores in the control groups. The corresponding risk (and its 95% confidence interval) is based on the assumed risk in the comparison group and the relative effect of the intervention (and its 95% CI). | |||||
Background
Description of the condition
Stroke is a health concern worldwide and one of the main causes of disability (Albert 2012; WHO 2011). In Europe, stroke costs around EUR 64.1 billion, and in the United Kingdom around GBP 8.9 billion per annum is spent on community care and rehabilitation of people after stroke (Gustavsson 2010; Saka 2009). In fact, only 12% of people that experience a stroke are independent in basic activities of daily living (ADL) one week after stroke onset (Wade 1987); in the long‐term, up to 74% of them have to rely on assistance for basic ADLs like feeding, self‐care, and mobility (Miller 2010).
Description of the intervention
To restore independence to stroke survivors and reduce the cost of therapy and care, a number of approaches are now being investigated in an attempt to increase the effectiveness of stroke rehabilitation techniques for the recovery of the upper extremity (Pollock 2014). The management of upper extremity in people with stroke can involve a number of different treatments, which include: bilateral arm training (McCombe Waller 2008), biofeedback (Crow 1989; Moreland 1994; Rathkolb 1990; Sathian 2000), brain stimulation (Dayan 2013; Kagan 2012), electrical stimulation/functional electrical stimulation (Pomeroy 2006), mental practice (Page 2005a; Page 2007a), mirror therapy (Michielsen 2010), robot assistance (Hesse 2003; Lum 2002; Masiero 2007; Mehrholz 2012), repetitive task training (French 2007), virtual reality (Laver 2011), and constraint‐induced movement therapy (CIMT; Miltner 1999; Page 2001; Page 2002a; Taub 1993; Taub 1994; Taub 1999).
CIMT, as described by the first authors (Miltner 1999; Taub 1994; Taub 1999), is based on two fundamental principles.
-
Forced use of the affected arm by restraining the unaffected arm, with a sling or a hand splint, during dedicated exercise sections or usual ADLs (90% of waking hours).
-
Massed practice (several hours of exercise) of the affected arm through a shaping method, where shaping involves a commonly operant conditioning method in which a behavioural objective (in this case 'movement') is approached in small steps of progressively increasing difficulty. The participant is rewarded with enthusiastic approval for improvement, but never blamed or punished for failure.
The initial report of the use of CIMT proposed extensive and intensive training (six to eight hours per day; Miltner 1999; Taub 1994; Taub 1999); over the years, though, others have developed different forms of constraint therapy, reducing the training during the period of restraint (Page 2001; Page 2002a; Page 2002b), or concentrating only on the use of restraint (forced use), with no additional treatment of the affected arm (Burns 2007; Ploughman 2004).
How the intervention might work
The rationale for CIMT is based on the theory of 'learning non‐use' from experiments on monkeys. Researchers observed that after upper limb de‐afferentation (interruption of nerves), monkeys did not use their affected limb even though their motor ability was nearly normal (Knapp 1963; Taub 1977; Taub 1980). This 'non‐use' was an acquired behaviour learned during the spinal shock period and, as a consequence of its origin, could be reversed by behavioural measures such as, for example, constraint of the sound limb. Thus the learned 'non‐use' theory predicts that people after stroke have, in fact, greater movement ability than they show in their everyday tasks. If this is correct, constraint of the unaffected arm would be a useful tool for realising this ability in everyday activities (Sterr 2006).
Why it is important to do this review
Over recent years, the neuroplasticity and cortical reorganisation of the central nervous system (CNS) has been observed and described in trials with people after stroke undergoing CIMT (Kim 2004; Levy 2001; Liepert 2000; Liepert 2001; Lin 2010; Ro 2006; Schaechter 2002; Szaflarski 2006). The preliminary findings suggest that the functional improvements produced by CIMT are accompanied by plastic brain reorganisation associating noticeable brain changes with functional improvements related to CIMT. Our initial review published in 2008 identified 19 studies, now several new studies have been published and an update of our review was necessary in order to define better the effect of constraining therapies on stroke recovery.
Objectives
To assess the efficacy of CIMT, modified CIMT (mCIMT), or forced use (FU) for arm management in people with hemiparesis after stroke.
Methods
Criteria for considering studies for this review
Types of studies
Randomised controlled trials (RCTs) and quasi‐RCTs comparing CIMT or mCIMT or FU with other rehabilitative techniques (occupational therapy or physiotherapy), or none.
Types of participants
We examined trials of adults (aged over 18 years) with a clinical diagnosis of stroke, either ischaemic or haemorrhagic (World Health Organization (WHO) definition; Hatano 1976), with paresis of an arm.
Types of interventions
The studies included all used CIMT or mCIMT or FU for the treatment of the affected upper limb compared with other rehabilitative techniques (occupational therapy or physiotherapy) or none.
For the purpose of this review we used the following definitions (as described in Hoare 2007):
-
CIMT: restraint of the unaffected upper limb, with more than three hours per day of therapy;
-
mCIMT: restraint of the unaffected upper limb, with three hours or less per day of therapy;
-
FU: restraint of the unaffected upper limb but no specific treatment of the affected upper limb.
We considered all interventions, irrespective of:
-
number of hours of training per day;
-
number of hours of restraint per day;
-
duration of treatment;
-
type of exercise used in training sessions.
Types of outcome measures
If a study presented more than one measure for the same outcome category, we included the measure most frequently used across studies in the analysis.
Primary outcomes
Disability
Functional Independence Measure (FIM), Barthel Index (BI).
Secondary outcomes
Arm motor function
Wolf Motor Function Test (only score; WFMT), Arm Research Arm Test (ARAT), Arm Motor Ability Test (AMAT), Emory Function Test (EMF), Assessment of motor and process skills (AMPS).
Perceived arm motor function
Motor Activity Log (MAL): Amount of Use (AoU) and Quality of Use (QoU).
Arm motor impairment
Fugl Meyer Assessment (FMA), Chedoke McMaster Impairment Inventory (CMII), hand strength.
Quality of life
Stoke Impact Scale (SIS).
Dexterity*
Nine‐Hole Peg Test (9HPT), Sixteen‐Hole Peg Test (16HPT), Grooved Pegboard Test (GPT).
* a low score in scales assessing this item indicates a positive outcome and indicates a better performance.
Search methods for identification of studies
See the 'Specialized register' section in the Cochrane Stroke Group module. We searched for trials in all languages and arranged translation of relevant papers where necessary.
Electronic searches
We searched the Cochrane Stroke Group Trials Register (last searched June 2015), the Cochrane Central Register of Controlled Trials (CENTRAL; The Cochrane Library 2015, Issue 1; Appendix 1), MEDLINE Ovid (1966 to January 2015; Appendix 2), EMBASE Ovid (1980 to January 2015; Appendix 3), CINAHL Ebsco (1982 to January 2015; Appendix 4), AMED Ovid (1985 to January 2015; Appendix 5), and in January 2015 the Physiotherapy Evidence Database (PEDro; http://ptwww.cchs.usyd.edu.au/pedro/; Appendix 6).
In addition, we searched the following trials registries:
-
National Institute of Health Clinical Trials Database (http://www.clinicaltrials.gov; 1 June 2015);
-
Stroke Trials Registry (www.strokecenter.org/trials/; 1 June 2015).
Searching other resources
We also searched the reference lists of relevant papers.
Data collection and analysis
Selection of studies
One review author (DC) read the titles of identified references and eliminated obviously irrelevant studies. We obtained abstracts for the remaining studies and then, on the basis of the inclusion criteria, two review authors (DC and VS) independently ranked these as 'relevant', 'irrelevant' or 'unsure'. We retrieved and reviewed the full text articles for those ranked as relevant and those ranked as unsure. We resolved disagreements by consensus, and consulted a third review author (RG) if disagreements persisted.
We have documented the reasons for the exclusion of studies in Characteristics of excluded studies. When studies published in non‐English languages appeared relevant, we retrieved the full text and asked a native speaker to translate it in order to ascertain whether the study met the inclusion criteria.
Data extraction and management
Four review authors (DC, VS, GC and RG) independently extracted data. We recorded all data on a standardised checklist, incorporating: methods (e.g. randomisation, blinding, completeness of follow‐up, reliability and validity of scales), details of participants (e.g. age, sex, time since stroke, side affected), interventions, inclusion and exclusion criteria, and all assessed outcomes. We resolved disagreements by consensus. In some cases we contacted study authors by email for clarification. When not clearly reported or imputable, we extracted numeric data from graphs through the use of Engauge Software 5.1.
Assessment of risk of bias in included studies
We assessed the risk of bias in the included studies using the criteria in the Cochrane Handbook for Systematic Reviews of Interventions (Higgins 2011).
Methods of randomisation
We regarded a randomisation method as appropriate if it meant that each study participant had the same chance of receiving each intervention. We considered the following methods of allocation appropriate: using random number tables, a computer random number generator, coin tossing, or card shuffling.
Allocation concealment (when the investigators cannot predict which treatment comes next)
We scored this as:
-
low risk of bias — when the method of allocation was clearly described (e.g. central randomisation, serially numbered opaque, sealed envelopes);
-
unclear risk of bias — when the authors did not report any allocation concealment approach at all, or did not describe it clearly;
-
high risk of bias — when the method of allocation was not concealed.
Potential for selection bias after allocation
We scored this as:
-
low risk of bias — trials where an intention‐to‐treat analysis was possible and there were few losses to follow up;
-
unclear risk of bias — trials reporting exclusions (less than 10% exclusions);
-
high risk of bias — no reporting of exclusions, or more than 10% exclusions, or wide differences in exclusions between groups.
Blinding with reference only to the outcome assessor
We scored this as:
-
low risk of bias — blinded;
-
unclear risk of bias — information not reported;
-
high risk of bias — not blinded.
Follow‐up
We scored this as:
-
low risk of bias — if the numbers and reasons for dropouts and withdrawals in all intervention groups were described and if 90% or more of the randomised participants were included in the analysis, or if it was specified that there were no dropouts or withdrawals;
-
unclear risk of bias — if the report gave the impression there were no dropouts or withdrawals, but it was not specifically stated;
-
high risk of bias — if less than 90% of the randomised participants were included in the analysis or the number or reasons for dropouts and withdrawals were not described.
Scales to measure outcomes
Scales had to be supported by studies about their psychometric properties. We classified the scales as:
-
low risk of bias — if studies support the reliability and validity of the scale;
-
unclear risk of bias — if supporting data were not provided, or the scale has never been tested;
-
high risk of bias — if there was evidence of insufficient reliability or validity.
Measures of treatment effect
Two review authors (DC and VS) independently classified outcome measures in terms of the domain assessed (disability, arm motor function, perceived arm motor function, arm motor impairment, quality of life and dexterity). When a study presented more than one outcome measure for the same domain, we used the measure most frequently utilised across studies for the analysis. We converted continuous data to mean difference (MD) and, if different scales were used, we first computed a standardised mean difference (SMD), and second, an overall MD and overall SMD.
Dealing with missing data
When standard deviations of the changes were not reported, we estimated them in the treatment and control groups from the variances, or through the use of Engauge Software 5.1 as needed for data analysis.
If data for the estimation of standard deviation of changes were unreported, we contacted study authors by email to request the information. If we did not receive a reply, we contacted the study authors again.
Assessment of heterogeneity
We did a statistical summary of treatment effects only if there was no major clinical heterogeneity in terms of participants' characteristics. We assessed the degree of heterogeneity among the trials by the I2 statistic for each outcome. We judged an I2 value greater than 50% to be indicative of substantial heterogeneity (Higgins 2011). We calculated overall estimates using the fixed‐effect or random‐effects model, depending on the I2 heterogeneity test results and on clinical heterogeneity related to the implementation of interventions and to the characteristics of the participants.
Assessment of reporting biases
We addressed publication bias by means of visual inspection of funnel plots for signs of asymmetry, and generated the funnel plots using Review Manager 5 (RevMan 2014). We explored publication bias on arm motor function instead of disability, as arm motor function was the most frequent outcome assessed by the included studies.
Data synthesis
We pooled outcomes measured with different instruments using SMD. In all analyses with the exception of the subgroup analyses, we used the random‐effects model with 95% CI using Review Manager 5 in order to take into account the clinical heterogeneity among studies (RevMan 2014).
Subgroup analysis and investigation of heterogeneity
There were four possible post‐hoc subgroup analyses (Table 1).
| Study ID | Dosage of practice | Anatomical restraint | Constraint effect | Time since stroke |
| 1 = 3 hour or less; 2 = more than 3 hours | 1 = only hand; 2 = both arm and hand | 1 = restraint; 2 = restraint plus exercise | 1 = 0 to 3 months; 2 = 3 to 9 months; 3 = more than 9 months; 4 = wide range (from 0.5 to 37 months) | |
| 2 | 1 | 2 | 2 | |
| 1 | 2 | 2 | 2 | |
| 1 | 1 | 2 | 1 | |
| 1 | 1 | 2 | 1 | |
| 2 | 1 | 2 | 1 | |
| 1 | 1 | 2 | 1 | |
| 1 | 1 | 2 | 1 | |
| 2 | 1 | 2 | 4 | |
| 1 | 1 | 2 | 1 | |
| 1 | 1 | 2 | 1 | |
| 1 | 2 | 1 | 1 | |
| 2 | 1 | 2 | 3 | |
| 1 | 1 | 2 | 2 | |
| 2 | 1 | 2 | 4 | |
| 1 | 1 | 1 | 3 | |
| 2 | 2 | 2 | 3 | |
| 1 | 1 | 2 | 3 | |
| 1 | 1 | 2 | 4 | |
| 1 | 1 | 2 | 4 | |
| 2 | 2 | 2 | 1 | |
| 1 | 2 | 2 | 2 | |
| 1 | 2 | 2 | 2 | |
| 1 | 2 | 2 | 3 | |
| 1 | 1 | 2 | 1 | |
| 1 | 2 | 2 | 3 | |
| 1 | 1 | 2 | 1 | |
| 1 | 1 | 2 | 1 | |
| 1 | 1 | 2 | 2 | |
| 1 | 1 | 2 | 2 | |
| 2 | 2 | 2 | 3 | |
| 1 | 1 | 2 | 1 | |
| 1 | 1 | 2 | 2 | |
| 1 | 1 | 2 | 1 | |
| 2 | 2 | 2 | 3 | |
| 2 | 1 | 2 | 2 | |
| 1 | 1 | 2 | 4 | |
| 1 | 1 | 2 | 4 | |
| 1 | 1 | 2 | 4 | |
| 1 | 1 | 2 | 4 | |
| 1 | 1 | 2 | 4 | |
| 2 | 2 | 2 | 1 |
-
'Dosage of task practice': on the basis of the cut‐off of three hours, which is the difference between CIMT and mCIMT (see 'Types of interventions'), we calculated the dosage of exercise by multiplying the number of weeks by the number of sessions per week by the session duration in hours. We divided trials into those providing more than 30 hours of training, and those providing 30 hours of training or less.
-
Anatomical region restraint: we divided studies in to those constraining the unaffected arm only at the hand by a mitt, and those constraining both hand and arm by a sling and mitt.
-
Restraint effect: we included only the studies where the only independent variable between groups was restraint (e.g. where constraint was not accompanied by additional exercise, or the number of hours and type of treatment in the control and constraint groups were the same).
-
Time since stroke: we used mean time since stroke at recruitment to classify trials into three categories: zero to three months, three months to nine months, and over nine months.
To investigate differences between subgroups, we used the approach for a significance test described by Deeks 2001. This method is implemented in the Review Manager software for fixed‐effect analyses based on the inverse‐variance method (RevMan 2014).
Sensitivity analysis
We conducted sensitivity analyses for the primary outcome to explore the effects of the methodological quality of the included studies on overall effect.
Results
Description of studies
See Characteristics of included studies, Characteristics of excluded studies.
Results of the search
The database searches identified 5863 records, while the searches of the trial registers identified nine records of ongoing, completed or terminated studies.
On the basis of information presented in titles and abstracts, we identified 33 studies as potentially relevant and we obtained the full text papers. Seven papers did not meet at least one of our inclusion criteria: firstly, most studies compared different forms of CIMT, and secondly, they reported data from trials already included in the review.
We included 24 papers that reported 23 trials, and added these to the 19 trials identified in the previous version of this review to give a total of 42 included trials (Figure 1).
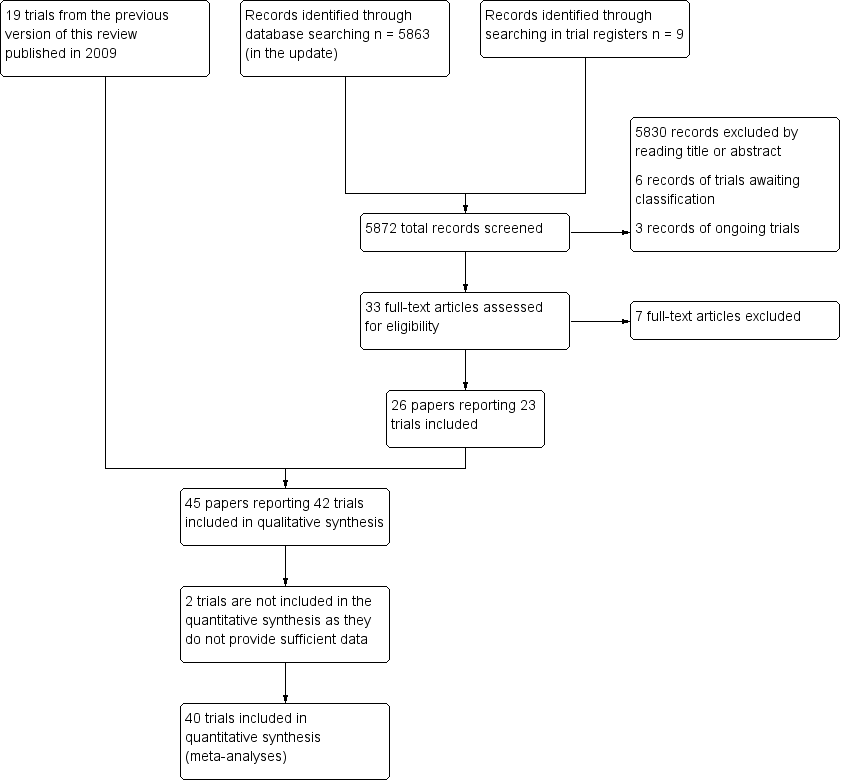
Study flow diagram.
Included studies
A total of 42 published RCTs met the inclusion criteria (Alberts 2004; Atteya 2004; Azab 2009; Boake 2007; Bergheim 2010; Brogårdh 2009; Brunner 2012; Dahl 2008; Dromerick 2000; Dromerick 2009; Hammer 2009; Hayner 2010; Huseyinsinoglu 2012; Khan 2011; Kim 2008; Krawczyk 2012; Lin 2007; Lin 2009a; Lin 2010; Myint 2008; Page 2001; Page 2002b; Page 2004; Page 2005b; Page 2008; Ploughman 2004; Singh 2013; Smania 2012; Suputtitada 2004; Tariah 2010; Taub 1993; Treger 2012; Van Delden 2013; Wang 2011; Wittenberg 2003; Wolf 2006; Wu 2007a; Wu 2007b; Wu 2007c; Wu 2011, Wu 2012a; Yoon 2014).
In 13 studies, participants were randomised to three interventions:
-
mCIMT, traditional rehabilitation (training without restriction of the sound limb), and no treatment (Atteya 2004; Page 2001; Page 2002b ; Page 2004; Page 2008);
-
CIMT at low dose versus CIMT at high dose versus control (Dromerick 2009);
-
mCIMT versus conventional therapy versus therapeutic climbing (Khan 2011);
-
mCIMT versus bilateral arm training (BAT) versus control (Lin 2009a);
-
mCIMT versus modified bilateral arm training with rhythmic auditory cueing (BATRAC) versus dose‐matched conventional treatment Van Delden 2013);
-
CIMT plus mirror therapy versus CIMT versus control (Yoon 2014);
-
mCIMT versus conventional treatment versus intensive conventional treatment (Wang 2011);
-
mCIMT versus BAT versus control (Wu 2011);
-
mCIMT plus trunk restraint versus mCIMT versus control (Wu 2012a).
In order to reduce the heterogeneity among studies and to preserve the equipoise principle, we considered only the data from arms comparing CIMT or mCIMT of FU with traditional rehabilitation (Edwards 1998). For Dromerick 2009 we combined the two experimental groups working at two different regimens into a single group performing mCIMT; in Wang 2011 we considered the intensive conventional group to be the control group.
For more details, see the Characteristics of included studies table.
The studies were conducted in the USA (14 studies), Asia (14 studies) and Europe (14 studies).
Nine were identified as pilot RCTs (Alberts 2004; Brogårdh 2009; Dromerick 2000; Hammer 2009; Khan 2011; Myint 2008; Page 2002b; Page 2005b; Ploughman 2004), although it is not clear whether 'pilot' referred to examination of new CIMT characteristics, to the feasibility of the study, or to the small sample and lack of sample size calculation. Nineteen studies were multicentre.
Participants
A total of 1453 participants were enrolled in the 42 trials. There were more men (n = 934; 64%) than women. The mean age ranged from 37 years to 87 years (Page 2004; Wu 2007c, respectively), with the majority between 55 and 70 years. Time since stroke was zero to three months for 13 trials (Azab 2009; Bergheim 2010; Boake 2007; Brogårdh 2009; Brunner 2012; Dromerick 2000; Dromerick 2009; Myint 2008; Page 2005b; Ploughman 2004; Singh 2013; Treger 2012; Yoon 2014); three to nine months for six trials (Alberts 2004; Atteya 2004; Hammer 2009; Page 2001; Page 2002b; Wolf 2006), and more than nine months for five trials (Lin 2007; Page 2004; Page 2008; Taub 1993; Wittenberg 2003). Eight studies reported time since stroke onset vaguely: in the next days (Khan 2011), more than 1.5 months (Krawczyk 2012), more than two months (Tariah 2010), more than three months (Lin 2010), more than six months (Hayner 2010; Lin 2009a; Wu 2011), and more than one year (Kim 2008). One trial considered participants in which stroke onset varied between 0 to six months (Wang 2011), three trials between one to 37 months (Wu 2007a; Wu 2007b; Wu 2007c), one between one to six months (Van Delden 2013), two between three to 24 months (Huseyinsinoglu 2012; Smania 2012), one study between six to 59 months (Wu 2012a), one trial considered people in which the stroke onset varied between one to 92 months (Dahl 2008), and one between one and 10 years (Suputtitada 2004).
Thirty‐six studies with a total of 1298 participants described the type of stroke: 15 studies included only people with ischaemic stroke (Alberts 2004; Bergheim 2010; Dromerick 2000; Hammer 2009; Hayner 2010; Krawczyk 2012; Lin 2010; Page 2001; Page 2002b; Page 2004; Page 2005b; Page 2008; Tariah 2010; Taub 1993; Treger 2012), while the remaining 21 trials enrolled people with haemorrhagic and ischaemic stroke (Boake 2007; Brunner 2012; Dahl 2008; Dromerick 2009; Huseyinsinoglu 2012; Kim 2008; Lin 2007; Lin 2009a; Myint 2008; Ploughman 2004; Singh 2013; Smania 2012; Suputtitada 2004; Van Delden 2013; Wang 2011; Wolf 2006; Wu 2007b; Wu 2007c; Wu 2011; Wu 2012a; Yoon 2014).
Fifty‐six per cent (n = 729) of the participants had an ischaemic stroke, the remaining 44% (n = 569) had a haemorrhagic stroke.
Thirty‐three studies, with a total of 1011 participants, reported the number of people with the right‐side affected (n = 627; 62%; Alberts 2004; Atteya 2004; Azab 2009; Boake 2007; Bergheim 2010; Brogårdh 2009; Brunner 2012; Dromerick 2000; Dromerick 2009; Hammer 2009; Khan 2011; Krawczyk 2012; Lin 2007; Lin 2009a; Lin 2010; Myint 2008; Page 2001; Page 2002b; Page 2004; Page 2005b; Page 2008; Ploughman 2004; Smania 2012; Suputtitada 2004; Tariah 2010; Taub 1993; Van Delden 2013; Wu 2007a; Wu 2007b; Wu 2007c; Wu 2011; Wu 2012a; Yoon 2014).
Nine studies, with a total of 524 participants, reported the number of people presenting with paresis of pre‐stroke dominant side (n = 260; 50%; Alberts 2004; Huseyinsinoglu 2012; Myint 2008; Taub 1993; Van Delden 2013; Wolf 2006; Wu 2007a; Wu 2007b; Wu 2007c).
The main inclusion criteria reported were as follows.
-
Movement capacity of the upper arm:
-
ability to extend actively the metacarpophalangeal and interphalangeal joints at least 10°, and the wrist 20° (Alberts 2004; Atteya 2004; Bergheim 2010; Boake 2007; Dahl 2008; Hammer 2009; Huseyinsinoglu 2012; Lin 2010; Myint 2008; Page 2001; Page 2002b; Page 2004; Page 2005b; Page 2008; Taub 1993; Suputtitada 2004; Tariah 2010; Wang 2011; Wittenberg 2003; Wolf 2006; Wu 2007a);
-
ability to extend actively the metacarpophalangeal and interphalangeal joints and the wrist at least 10° (Singh 2013; Smania 2012);
-
ability to extend the metacarpophalangeal and interphalangeal joints of two digits and the wrist 10°, plus 10° of thumb abduction/extension (Alberts 2004; Brogårdh 2009; Brunner 2012; Smania 2012; Van Delden 2013; Wolf 2006; Yoon 2014);
-
trace of movements of the hand and some fingers dexterity preserved (Azab 2009; Hayner 2010; Kim 2008);
-
ability to lift a floppy disc off the table top and to release it afterwards (Krawczyk 2012);
-
score 1 to 3 on the motor arm items of the National Institute of Health Stroke Scale (NIHSS; Boake 2007; Dromerick 2000);
-
stage 3 or above in the reach Brunnstrom for the proximal part of the upper extremity (Lin 2007; Lin 2009a; Wu 2007b; Wu 2007c; Wu 2012a);
-
stage 2 to 6 on the Chedoke McMaster Impairment Inventory (CMII; Khan 2011; Ploughman 2004);
-
score 0 to 2 on Modified Rankin Scale before the stroke (Dahl 2008).
-
-
Absence of cognitive impairment:
-
Mini Mental State Examination (MMSE) or modified MMSE more than 24 or 70 respectively (Alberts 2004; Atteya 2004; Brogårdh 2009; Brunner 2012; Dahl 2008; Dromerick 2009; Hammer 2009; Hayner 2010; Huseyinsinoglu 2012; Krawczyk 2012; Lin 2007; Lin 2009a; Lin 2010; Myint 2008; Page 2001; Page 2002b; Page 2004; Page 2005b; Page 2008; Ploughman 2004; Singh 2013; Smania 2012; Suputtitada 2004; Tariah 2010; Taub 1993; Van Delden 2013; Wang 2011; Wolf 2006; Wu 2007a; Wu 2007b; Wu 2007c; Wu 2011; Wu 2012a);
-
no neglect or speech comprehension difficulties (Boake 2007; Brogårdh 2009; Dahl 2008; Hammer 2009; Huseyinsinoglu 2012; Kim 2008; Krawczyk 2012; Singh 2013; Suputtitada 2004; Taub 1993; Treger 2012; Van Delden 2013; Wang 2011; Yoon 2014);
-
score ≤ 1 on the consciousness, communication and neglect item of the NIHSS (Dromerick 2000).
-
-
Non‐use of the affected arm in the real world: score < 2.5 on the MAL (Alberts 2004; Huseyinsinoglu 2012; Lin 2007; Lin 2009a; Page 2005b; Page 2008; Smania 2012; Tariah 2010; Wittenberg 2003; Wolf 2006; Wu 2007a; Wu 2007b; Wu 2011; Wu 2012a).
-
No balance problems including walking (Alberts 2004; Brogårdh 2009; Hammer 2009; Hayner 2010; Huseyinsinoglu 2012; Kim 2008; Krawczyk 2012; Lin 2007; Lin 2009a; Myint 2008; Smania 2012; Suputtitada 2004; Tariah 2010; Taub 1993; Wang 2011; Wolf 2006; Wu 2007a; Wu 2007b; Wu 2011; Wu 2012a).
-
No excessive pain in the affected arm: score < 4 on the visual analogue scale (Alberts 2004; Atteya 2004; Huseyinsinoglu 2012; Khan 2011; Myint 2008; Page 2001; Page 2002b; Page 2004; Page 2005b; Page 2008; Singh 2013; Tariah 2010; Wang 2011; Wolf 2006).
-
No excessive spasticity: score ≤ 2 (in any joint) respectively on the Ashworth Scale or on the modified Ashworth Scale (Atteya 2004; Hammer 2009; Huseyinsinoglu 2012; Lin 2007; Page 2001; Page 2002b; Page 2004; Page 2005b; Page 2008; Singh 2013; Tariah 2010; Taub 1993; Wang 2011; Wu 2007a; Wu 2007c).
-
No joint limitation of the affected arm (Alberts 2004; Boake 2007; Wolf 2006).
Intervention
Nine studies, with a total of 416 participants, focused on the efficacy of CIMT (Alberts 2004; Dahl 2008; Hayner 2010; Krawczyk 2012; Myint 2008; Taub 1993; Wang 2011; Wittenberg 2003; Wolf 2006), while 29 studies, with a total of 943 participants, focused on the efficacy of mCIMT (Atteya 2004; Azab 2009; Bergheim 2010; Boake 2007; Brunner 2012; Dromerick 2000; Dromerick 2009; Huseyinsinoglu 2012; Khan 2011; Lin 2007; Lin 2009a; Lin 2010; Page 2001; Page 2002b; Page 2004; Page 2005b; Page 2008; Singh 2013; Smania 2012; Suputtitada 2004; Tariah 2010; Treger 2012; Van Delden 2013; Wu 2007a; Wu 2007b; Wu 2007c; Wu 2011; Wu 2012a; Yoon 2014). Four studies, with 94 participants, investigated the efficacy of FU (Brogårdh 2009; Hammer 2009; Kim 2008; Ploughman 2004).
Time of restraint:
-
During waking hours for one study (Wittenberg 2003);
-
90% of waking hours for eleven studies (Alberts 2004; Boake 2007; Brogårdh 2009; Dahl 2008; Huseyinsinoglu 2012; Myint 2008; Singh 2013; Smania 2012; Taub 1993; Wang 2011; Wolf 2006);
-
from six hours per day to 90% of waking hours for one study (Dromerick 2009);
-
from six to seven hours per day for two studies (Azab 2009; Bergheim 2010);
-
six hours per day for 14 studies (Dromerick 2000; Hammer 2009; Hayner 2010; Lin 2007; Lin 2009a; Lin 2010; Suputtitada 2004; Van Delden 2013; Wu 2007a; Wu 2007b; Wu 2007c; Wu 2011; Wu 2012a; Yoon 2014);
-
five hours per day for eight studies (Atteya 2004; Kim 2008; Krawczyk 2012; Page 2001; Page 2002b; Page 2004; Page 2005b; Page 2008);
-
four to five hours per day for one study (Khan 2011);
-
four hours per day for two studies ( Brunner 2012; Treger 2012);
-
two hours per day for one study (Tariah 2010);
-
a mean effective restraint time of 2.7 hours per day was reported by one study (Ploughman 2004).
Time of exercise with the affected arm:
-
between 30 and 45 hours/week in seven studies (Alberts 2004; Dahl 2008; Hayner 2010; Suputtitada 2004; Taub 1993; Wittenberg 2003; Wolf 2006);
-
between 10 and 25 hours/week in 20 studies (Boake 2007; Brunner 2012; Dromerick 2000; Dromerick 2009; Huseyinsinoglu 2012; Khan 2011; Krawczyk 2012; Lin 2007; Lin 2009a; Lin 2010; Myint 2008; Singh 2013; Smania 2012; Tariah 2010; Wang 2011; Wu 2007a; Wu 2007b; Wu 2007c; Wu 2011; Yoon 2014);
-
five hours/week or less in 11 studies (Atteya 2004; Azab 2009; Bergheim 2010; Page 2001; Page 2002b; Page 2004; Page 2005b; Page 2008; Ploughman 2004; Treger 2012; Van Delden 2013).
Treatment duration:
-
two weeks in 19 studies (Alberts 2004; Bergheim 2010; Boake 2007; Brogårdh 2009; Dahl 2008; Dromerick 2000; Dromerick 2009; Hammer 2009; Hayner 2010; Huseyinsinoglu 2012; Myint 2008; Singh 2013; Smania 2012; Suputtitada 2004; Taub 1993; Treger 2012; Wittenberg 2003; Wolf 2006; Yoon 2014);
-
three weeks for nine studies (Krawczyk 2012; Lin 2007; Lin 2009a; Lin 2010; Wu 2007a; Wu 2007b; Wu 2007c; Wu 2011; Wu 2012a);
-
four weeks for three studies (Azab 2009; Brunner 2012; Wang 2011);
-
six weeks for one study (Van Delden 2013);
-
eight weeks for two studies (Kim 2008; Tariah 2010);
-
10 weeks for six studies (Atteya 2004; Page 2001; Page 2002b; Page 2004; Page 2005b; Page 2008).
One study did not report the treatment duration (Khan 2011).
Types of exercise:
-
all studies used functional or ADL tasks: in 19 studies this was done through shaping techniques (Alberts 2004; Bergheim 2010; Brunner 2012; Boake 2007; Dromerick 2009; Hayner 2010; Huseyinsinoglu 2012; Kim 2008; Lin 2010; Myint 2008; Page 2002b; Page 2004; Page 2005b; Page 2008; Smania 2012; Tariah 2010; Van Delden 2013; Wolf 2006; Wu 2007a);
-
two studies included proprioceptive neuromuscular facilitation (PNF; Atteya 2004; Page 2001);
-
one study used conventional treatment for upper extremity, which involved the facilitation of proximal motor control progressing to skilled‐task training, without shaping therapy (Ploughman 2004).
Anatomical region restraint:
-
both hand and arm in 12 studies (Atteya 2004; Hammer 2009; Myint 2008; Page 2001; Page 2002b; Page 2004; Page 2008; Ploughman 2004; Taub 1993; Wang 2011; Wittenberg 2003; Yoon 2014);
-
only the hand in the remaining 30 studies.
Intervention delivery
In all studies the interventions were delivered and supervised by trained physiotherapists or occupational therapists, and each participant assigned to an intervention group participated in individual therapy sessions, except in Dahl 2008 and Suputtitada 2004 where the participants exercised in groups of four. The wearing of the constraint was checked by questioning the participants every two weeks about satisfaction with the protocol (Atteya 2004), keeping a log of the hours of restraint per day (Azab 2009; Brogårdh 2009; Brunner 2012; Hammer 2009; Lin 2009a; Myint 2008; Page 2002a; Page 2004; Page 2005b; Ploughman 2004; Singh 2013; Smania 2012; Tariah 2010; Treger 2012; Wang 2011; Wu 2011; Wu 2012a), and through a physical sensor and timer placed in the mitt and by a home diary (Wolf 2006). Supervision of the constraint was not described in the other studies.
Twenty‐four studies included outpatients (Alberts 2004; Atteya 2004; Azab 2009; Hayner 2010; Huseyinsinoglu 2012; Kim 2008; Lin 2007; Lin 2009a; Lin 2010; Myint 2008; Page 2001; Page 2002b; Page 2004; Page 2005b; Page 2008; Smania 2012; Suputtitada 2004; Tariah 2010; Taub 1993; Wang 2011; Wolf 2006; Wu 2007b; Wu 2011; Wu 2012a), 11 studies included only inpatients (Bergheim 2010; Brogårdh 2009; Dahl 2008; Dromerick 2000; Dromerick 2009; Khan 2011; Krawczyk 2012; Singh 2013; Treger 2012; Wittenberg 2003; Yoon 2014), six studies included both inpatients and outpatients (Boake 2007; Brunner 2012; Hammer 2009; Ploughman 2004; Wu 2007a; Wu 2007c), and one study did not specify (Van Delden 2013).
Outcomes
All studies considered pre‐treatment and post‐treatment outcome measures. Seventeen studies had longer follow‐up:
-
one month (Van Delden 2013);
-
one and three months (Hammer 2009);
-
three months (Bergheim 2010; Boake 2007; Brogårdh 2009; Dromerick 2009; Smania 2012);
-
four months (Tariah 2010);
-
six months (Azab 2009; Dahl 2008; Hayner 2010; Khan 2011; Wittenberg 2003);
-
12 months (Krawczyk 2012; Myint 2008);
-
at four, eight and 12 months (Wolf 2006);
-
up to three years (Taub 1993).
The 42 included trials considered similar outcome categories. We attributed measures used in the studies to each outcome category as detailed below and in Table 2.
| Study ID | Arm motor function | Perceived motor function | Dexterity | Arm motor impairment | Activities of daily living measures | Quality of life | Kinematics | Neurophysiologics | Strength |
| Wolf Motor Function Test | Fugl Meyer Assessment | Hand dynamometer | |||||||
| Action Research Arm Test, Wolf Motor Function Test | Motor Activity Log | Fugl Meyer Assessment | |||||||
| Bartel Index | |||||||||
| Wolf Motor Function Test, Motor Assessment Scale | |||||||||
| Motor Activity Log | Grooved Pegboard Test | Fugl Meyer Assessment | Transcranial magnetic stimulation | ||||||
| Motor Assessment Scale, Sollerman Hand Function Scale | Motor Activity Log | ||||||||
| Action Research Arm Test | Nine‐Hole Peg Test | ||||||||
| Wolf Motor Function Test | Motor Activity Log | Functional Independence Measure | Stroke Impact Scale | ||||||
| Action Research Arm Test | |||||||||
| Action Research Arm Test | Functional Independence Measure | Stroke Impact Scale | |||||||
| Action Research Arm Test, Motor Assessment Scale | Motor Activity Log | Sixteen‐Hole Peg Test | Fugl Meyer Assessment | Grippit | |||||
| Wolf Motor Function Test | |||||||||
| Wolf Motor Function Test | Motor Activity Log | Functional Independence Measure | |||||||
| Wolf Motor Function Test | Motor Activity Log | ||||||||
| Manual Function Test | Motor Activity Log | Perdue Pegboard Test | |||||||
| Rivermead motor assessment arm scale | Motor Activity Log | ||||||||
| Motor Activity Log | Functional Independence Measure | Yes | |||||||
| Motor Activity Log | Fugl Meyer Assessment | Functional Independence Measure | Stroke Impact Scale | ||||||
| Motor Activity Log | Fugl Meyer Assessment | Functional magnetic resonance | |||||||
| Action Research Arm Test | Motor Activity Log | Nine‐Hole Peg Test | Bartel Index | ||||||
| Action Research Arm Test, Wolf Motor Function Test | Motor Activity Log | Fugl Meyer Assessment | |||||||
| Action Research Arm Test | Motor Activity Log | Fugl Meyer Assessment | |||||||
| Action Research Arm Test | Motor Activity Log | Fugl Meyer Assessment | |||||||
| Action Research Arm Test | Motor Activity Log | Fugl Meyer Assessment | |||||||
| Action Research Arm Test | Motor Activity Log | Fugl Meyer Assessment | |||||||
| Action Research Arm Test | Chedoke McMaster Impairment Inventory | Functional Independence Measure | Jamar | ||||||
| Wolf Motor Function Test (only time) | Fugl Meyer Assessment | ||||||||
| Wolf Motor Function Test | Motor Activity Log | ||||||||
| Wolf Motor Function Test | Motor Activity Log | Fugl Meyer Assessment | |||||||
| Emory Motor Function Test | Motor Activity Log | ||||||||
| Manual Function Test | Functional Independence Measure | ||||||||
| Action Research Arm Test | Motor Activity Log | Nine‐Hole Peg Test | Fugl Meyer Assessment, Motricity Index | Stroke Impact Scale | |||||
| Wolf Motor Function Test | |||||||||
| Wolf Motor Function Test | Motor Activity Log | Transcranial magnetic stimulation, positron emission tomography | |||||||
| Wolf Motor Function Test | Motor Activity Log | Stroke Impact Scale | |||||||
| Motor Activity Log | Functional Independence Measure | Stroke Impact Scale | Yes | ||||||
| Motor Activity Log | Fugl Meyer Assessment | Yes | |||||||
| Motor Activity Log | Fugl Meyer Assessment | Functional Independence Measure | Stroke Impact Scale | ||||||
| Wolf Motor Function Test | Motor Activity Log | Yes | |||||||
| Action Research Arm Test | Motor Activity Log | Stroke Impact Scale | |||||||
| Wolf Motor Function Test | Nine‐Hole Peg Test, Box and Block Test | Fugl Meyer Assessment | Bartel Index | Hand Dynamometer |
Primary outcomes
-
Disability:
-
Functional Independence Measure (FIM): nine studies (Dahl 2008; Dromerick 2009; Huseyinsinoglu 2012; Lin 2007; Lin 2009a; Ploughman 2004; Treger 2012; Wu 2007a; Wu 2007c);
-
Barthel Index (BI): three studies (Azab 2009; Myint 2008; Yoon 2014).
-
Secondary outcomes
-
Arm motor function:
-
Action Research Arm Test (ARAT): 14 studies (Atteya 2004; Brunner 2012; Dromerick 2000; Dromerick 2009; Hammer 2009; Myint 2008; Page 2001; Page 2002b; Page 2004; Page 2005b; Page 2008; Ploughman 2004; Van Delden 2013; Wu 2012a);
-
Wolf Motor Function Test (WMFT): 14 studies (Alberts 2004; Atteya 2004; Dahl 2008; Hayner 2010; Huseyinsinoglu 2012; Khan 2011; Singh 2013; Smania 2012; Tariah 2010; Wittenberg 2003; Wang 2011; Wolf 2006; Wu 2011; Yoon 2014);
-
Emory Motor Function test (EMF): one study (Taub 1993);
-
Manual Function Test (MFT): two studies (Kim 2008; Treger 2012);
-
The Rivermead Motor Assessment Arm scale: one study (Krawczyk 2012);
-
Motor Assessment Scale: one study (Brogårdh 2009).
-
-
Perceived motor function, amount of use and quality of use:
-
Motor Activity Log (MAL): 29 studies (Atteya 2004; Boake 2007; Brogårdh 2009; Dahl 2008; Hammer 2009; Huseyinsinoglu 2012; Khan 2011; Kim 2008; Krawczyk 2012; Lin 2007; Lin 2009a; Lin 2010; Myint 2008; Page 2001; Page 2002b; Page 2004; Page 2005b; Page 2008; Smania 2012; Tariah 2010; Taub 1993; Van Delden 2013; Wittenberg 2003; Wolf 2006; Wu 2007a; Wu 2007b; Wu 2007c; Wu 2011; Wu 2012a).
-
-
Arm motor impairment:
-
Fugl‐Meyer Assessment (FMA): 17 studies (Alberts 2004; Atteya 2004; Boake 2007; Hammer 2009; Lin 2009a; Lin 2010; Page 2001; Page 2002b; Page 2004; Page 2005b; Page 2008; Singh 2013; Tariah 2010; Van Delden 2013; Wu 2007b; Wu 2007c; Yoon 2014);
-
Chedoke McMaster Impairment Inventory (CMII): three studies (Ploughman 2004; Tariah 2010; Van Delden 2013);
-
Birgitta Lind Marks Assessment Motor (BLMA): one study (Krawczyk 2012);
-
Jamar hand dynamometer: one study (Ploughman 2004);
-
maximal grip strength with a force transducer: three studies (Alberts 2004; Van Delden 2013; Yoon 2014);
-
shoulder and elbow isometric force: one study (Khan 2011).
-
-
Dexterity:
-
Grooved Pegboard Test (GPT): one study (Boake 2007);
-
Nine‐Hole Peg Test (NHPT): four studies (Brunner 2012; Myint 2008; Van Delden 2013; Yoon 2014);
-
Sixteen‐Hole Peg Test: one study (Hammer 2009);
-
Box and block test: one study (Yoon 2014);
-
Perdue Pegboard Test: one study (Kim 2008).
-
-
Quality of life:
-
Stroke Impact Scale (SIS): seven studies (Dahl 2008; Dromerick 2009; Lin 2009a; Van Delden 2013; Wolf 2006; Wu 2007c; Wu 2012a).
-
Excluded studies
We excluded 12 studies after reading the full text as they did not meet our inclusion criteria. We have provided all the reasons for these exclusions in Characteristics of excluded studies.
Risk of bias in included studies
Refer to Figure 2 or Figure 3 and Characteristics of included studies. If required, we contacted the corresponding author of the relevant studies for further information.
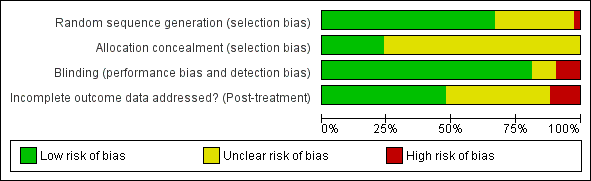
Risk of bias graph: review authors' judgements about each risk of bias item presented as percentages across all included studies.
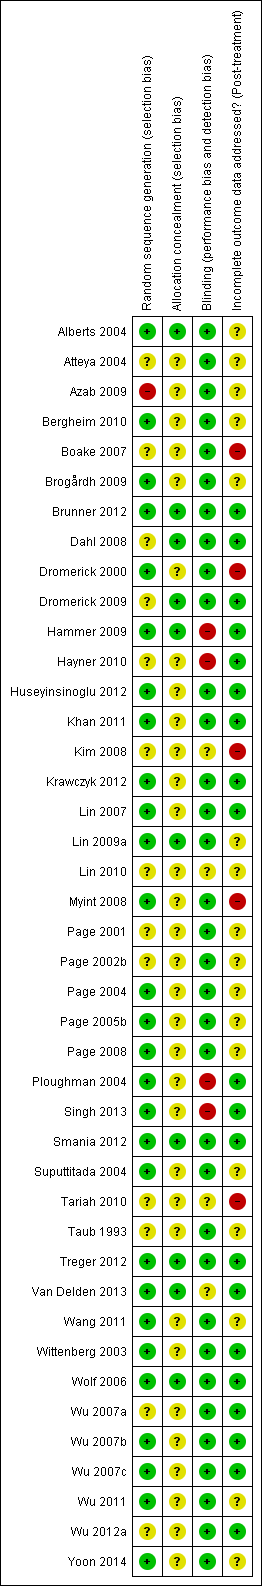
Risk of bias summary: review authors' judgements about each risk of bias item for each included study.
Allocation
Randomisation
The sequence of randomisation was described and appropriate in 27 studies (Alberts 2004; Bergheim 2010; Brogårdh 2009; Brunner 2012; Dromerick 2000; Hammer 2009; Huseyinsinoglu 2012; Khan 2011; Krawczyk 2012; Lin 2007; Lin 2009a; Page 2004; Page 2005b; Page 2008; Ploughman 2004; Singh 2013; Smania 2012; Suputtitada 2004; Treger 2012; Van Delden 2013; Wang 2011; Wittenberg 2003; Wolf 2006; Wu 2007b; Wu 2007c; Wu 2011; Yoon 2014). Lin 2007 used a randomisation stratified by side of stroke; Alberts 2004 and Wolf 2006 balanced the randomisation with respect to gender, premorbid handedness, side of stroke and level of function; Boake 2007 stratified by age and NIHSS score, and Dromerick 2009 balanced for age, total NIHSS score, pretest ARAT and days from stroke onset. Prestratification was applied to the participants based on whether they had received botulinum A injection in Huseyinsinoglu 2012. Van Delden 2013 stratified the participants according to whether they had higher functional ability or lower functional ability of the arm. In Hayner 2010 study participants were stratified into more and less affected.
We considered one study at high risk of bias because only a keyword of the article referred to randomisation (Azab 2009). We considered other studies at unclear risk of bias mainly because they provided insufficient data.
Allocation concealment
Allocation concealment was described and appropriate in 10 studies (Alberts 2004; Brunner 2012; Dahl 2008; Hammer 2009; Khan 2011; Lin 2009a; Smania 2012; Treger 2012; Van Delden 2013; Wolf 2006); the remaining studies did not report sufficient information.
Blinding
Outcome assessors were blinded in 34 studies. In Hammer 2009, Hayner 2010, Ploughman 2004 and Singh 2013 the assessor was not blinded, and blinding was not described in the remaining four studies (Kim 2008; Lin 2010; Tariah 2010; Van Delden 2013).
Incomplete outcome data
Sixteen studies provided complete information about participants who withdrew and their reasons (Boake 2007; Brunner 2012; Hammer 2009; Hayner 2010; Huseyinsinoglu 2012; Khan 2011; Kim 2008; Krawczyk 2012; Lin 2007; Myint 2008; Ploughman 2004; Singh 2013; Smania 2012; Treger 2012; Van Delden 2013; Wolf 2006); four studies provided numbers of withdrawals but not reasons (Azab 2009; Dromerick 2000; Dromerick 2009; Tariah 2010); 16 studies presented unclear information about withdrawals: none of these clearly stated that there were no dropouts (Alberts 2004; Atteya 2004; Brogårdh 2009; Lin 2009a; Lin 2010; Page 2001; Page 2002b; Page 2004; Page 2005b; Page 2008; Suputtitada 2004; Tariah 2010; Taub 1993; Wang 2011; Wu 2011; Yoon 2014 ). In one study one participant was excluded from the analyses post‐hoc because he had received botulinum toxin type A in the more affected limb less than three months before the study (Page 2004).
The remaining six studies had no drop‐outs.
By post‐treatment follow‐up nine studies had lost less than 10% of participants (Brogårdh 2009; Brunner 2012; Dromerick 2009; Hayner 2010; Huseyinsinoglu 2012; Khan 2011; Lin 2007; Van Delden 2013; Wolf 2006); six studies had lost between 10% and 20% of participants (Dromerick 2000; Hammer 2009; Krawczyk 2012; Myint 2008; Ploughman 2004; Smania 2012); and two studies had lost more than 20% of participants (Boake 2007; Kim 2008).
At long‐term follow‐up, Myint 2008 and Hammer 2009 had lost less than 10% of participants, while Azab 2009, Boake 2007, Brogårdh 2009, Krawczyk 2012, and Wolf 2006 had lost between 10% and 20% of participants.
Three studies performed intention‐to‐treat analyses (Alberts 2004; Smania 2012; Wolf 2006). Twenty‐five studies that did not have apparent withdrawals performed analyses on all included participants (Atteya 2004; Azab 2009; Bergheim 2010; Brogårdh 2009; Brunner 2012; Dromerick 2009; Dahl 2008; Krawczyk 2012; Lin 2009a; Lin 2010; Page 2001; Page 2002b; Page 2005b; Page 2008; Singh 2013; Suputtitada 2004; Treger 2012; Wang 2011; Wittenberg 2003; Wu 2007a; Wu 2007b; Wu 2007c; Wu 2011; Wu 2012a; Yoon 2014). One study mixed intention‐to‐treat and per‐protocol analyses (Boake 2007). The others performed per‐protocol analyses (Dromerick 2000; Hammer 2009; Hayner 2010; Huseyinsinoglu 2012; Khan 2011; Kim 2008; Lin 2007; Myint 2008; Page 2004; Ploughman 2004;Taub 1993; Tariah 2010; Van Delden 2013).
Validity of scales
All scales used in the studies for primary and secondary outcomes were supported by references to their psychometric properties, and were considered able to quantify performance in individuals after stroke with motor characteristics similar to the people enrolled in the included studies. The study on clinimetric properties of the MAL scale reports relatively stable internal consistency in a population of chronic stroke patients, a correlation with ARAT score at baseline (Spearman's rho was 0.63 for AoU and QoU), but considerable doubts remain about the longitudinal construct validity of the instrument, and the study does not recommend its use as a primary outcome measure in trials (Van der Lee 2004).
Other potential sources of bias
Six trials based their sample size on prior statistical power calculations (Brogårdh 2009; Brunner 2012; Smania 2012; Treger 2012; Van Delden 2013; Wolf 2006). Most studies were very small; the median sample size was 29 randomised participants (interquartile range 16 to 44). Small sample sizes are related to type 2 errors (Altman 1990; Hotopf 1997; Hotopf 1999), so if the median number of participants randomised is 29, then the complete analysis will only include around 15 participants per group.
Publication bias and small study effects
Visual inspection of the funnel plot indicated that pooled data might have been influenced by publication bias (Figure 4). Slight asymmetry of the plot is possible, with few studies characterised by extreme statistically significant results, largely favouring CIMT. It is also possible that others studies are 'missing' from the opposite area, which is in favour of the control. Another possible reason for slight asymmetry could be related to the large number of small trials we identified. Their methodological components for random sequence generation, allocation concealment and double blinding might have been inadequate. The reporting of most studies was largely unsatisfactory, preventing us from making full judgements of methods. These potential methodological shortcomings can be associated with exaggerated estimates of benefits of treatment.
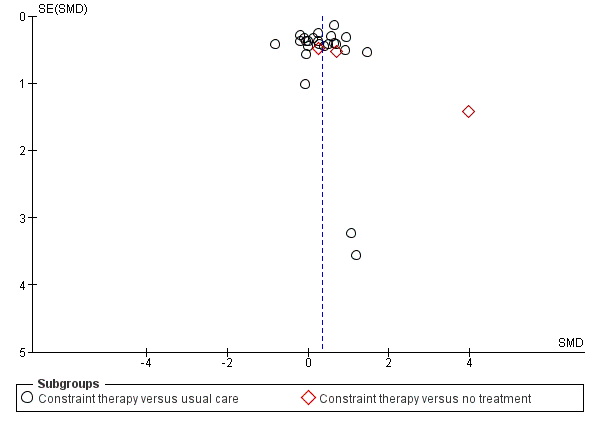
Funnel plot of comparison: 3 Constraint versus control: secondary outcomes, outcome: 3.1 Arm Motor Function.
Studies awaiting assessment
Six studies are awaiting assessment because information that is currently available about them is insufficient to determine whether they would be eligible for inclusion in this review. Five studies are labelled as 'completed' or 'terminated' on ClinicalTrials.gov (Barzel 2015; Boe 2014; Dos Santos 2012; Olivier 2012; Uswatte 2014), and one has been published as a poster (Jansa 2007).
Three studies are ongoing and recruiting (Gautier 2015; Padovani Do Santos 2015; Pereira 2015).
Effects of interventions
See: Summary of findings for the main comparison
We conducted meta‐analyses when at least two studies provided sufficient data. We included trials that compared the intervention versus no treatment, or no active treatment, in a specific subgroup to show how the estimated overall effect was based on information provided by these studies (Alberts 2004; Kim 2008; Taub 1993; Wittenberg 2003). In consideration of the clinical heterogeneity among studies, which related to variability in the interventions included and in the patient case‐mix, we considered it appropriate to perform random‐effects meta‐analyses to incorporate heterogeneity, except within subgroup analyses.
Fourteen trials monitored the presence of adverse events or medical complications leading to dropouts (Boake 2007; Brunner 2012; Dahl 2008; Dromerick 2000; Dromerick 2009; Hammer 2009; Khan 2011; Kim 2008; Krawczyk 2012; Myint 2008; Page 2008; Ploughman 2004; Smania 2012; Wolf 2006). Six of these studies monitored and reported on adverse events (Boake 2007; Dahl 2008; Dromerick 2000; Page 2008; Ploughman 2004; Wolf 2006), and four stated that none occurred (Boake 2007; Dahl 2008; Page 2008; Ploughman 2004). Rates of adverse events among these studies appeared not to differ between CIMT and the comparison groups, and CIMT appeared to have no adverse effects.
Primary outcomes
Comparison 1.1: Disability post‐intervention
Twelve studies with 411 participants measured disability immediately after the experimental and control interventions (Azab 2009; Dahl 2008; Dromerick 2009; Huseyinsinoglu 2012; Lin 2007; Lin 2009a; Myint 2008; Ploughman 2004; Treger 2012; Wu 2007a; Wu 2007c; Yoon 2014). Data were available for 344 participants (84%) from 11 studies. The impact of CIMT on disability indicated a non‐significant effect (SMD 0.24, 95% CI ‐0.05 to 0.52; Analysis 1.1).
Sixty‐nine participants contributing to this meta‐analysis were recruited from studies with more than a 10% loss to follow‐up.
Comparison 1.2: Disability at three‐ and six‐month follow‐up
Three studies recruiting 125 participants measured disability at three months (Dromerick 2009; Myint 2008), or at six months after treatment (Dahl 2008). The impact of CIMT on disability indicated a non‐significant effect (SMD ‐0.21, 95% CI ‐0.57 to 0.16, Analysis 1.2).
Subgroup analysis: Disability
We carried out analyses for the following three subgroups considering data availability.
-
'Dosage of task practice': we grouped trials according to whether they provided 30 or more hours of exercise, or up to 30 hours of exercise.
-
Anatomical region restraint: we grouped trials according to whether both arm and hand were restrained, or only the hand.
-
Time since stroke: we grouped trials according to whether they recruited within three months, three to nine months, or more than nine months post stroke.
Comparison 2.1: Amount of task practice
Three studies with 91 participants reported over 30 hours of exercise (Dahl 2008; Myint 2008; Yoon 2014); eight studies with 253 participants reported 30 hours or less of exercise (Dromerick 2009; Huseyinsinoglu 2012; Lin 2007; Lin 2009a; Ploughman 2004; Treger 2012; Wu 2007a; Wu 2007c). Longer exercise for upper limb function showed no statistically significant effect size (SMD 0.25, 95% CI ‐0.18 to 0.67); shorter exercise had a non‐significant effect size (SMD 0.18, 95% CI ‐0.07 to 0.44; Analysis 2.1). The difference between the two groups of trials was not significant (P value 0.8).
Comparison 2.2: Anatomical region restraint
Two studies with 61 participants reported both arm and hand restriction (Myint 2008; Yoon 2014); nine studies including 283 participants reported only hand restriction (Dahl 2008; Dromerick 2009; Huseyinsinoglu 2012; Lin 2007; Lin 2009a; Ploughman 2004; Treger 2012; Wu 2007a; Wu 2007c). The restriction of both arm and hand for upper limb function showed a non‐statistically significant effect size (SMD 0.35, 95% CI ‐0.17 to 0.87); restriction of the hand only was non‐statistically significant (SMD 0.17, 95% CI ‐0.08 to 0.41; Analysis 2.2). The difference between the effect estimates for the two groups of trials was not significant (P value 0.53).
Comparison 2.3: Time since stroke
Five studies with 164 participants measured disability on people with stroke at zero to three months (Myint 2008; Ploughman 2004; Treger 2012; Yoon 2014); five studies with 176 participants measured it at more than nine months (Dahl 2008; Huseyinsinoglu 2012; Lin 2007; Lin 2009a; Wu 2007a).
No studies measured disability on people with subacute stroke at three to nine months. We did not include four studies in this subgroup analysis because of the wide range of chronicity of participants (Dahl 2008; Huseyinsinoglu 2012; Lin 2009a; Wu 2007c). People with acute and chronic stroke showed no statistically significant effect size: for zero to three months (SMD 0.07, 95% CI ‐0.26 to 0.39) or more than nine months (SMD 0.49 CI ‐0.02 to 1.00; Analysis 2.3). The difference between the effect estimates for the two groups of trials was not significant (P value 0.17). We did not find heterogeneity among studies (I2 = 47.2%).
The comparison for the restraint effect could not be performed because of insufficient data.
Secondary outcomes
Comparison 3.1: Arm motor function
Thirty‐four studies with 988 participants measured arm motor function (Alberts 2004; Atteya 2004; Bergheim 2010; Brogårdh 2009; Brunner 2012; Dahl 2008; Dromerick 2000; Dromerick 2009; Hammer 2009; Hayner 2010; Huseyinsinoglu 2012; Khan 2011; Kim 2008; Krawczyk 2012; Myint 2008; Page 2001; Page 2002b; Page 2004; Page 2005b; Page 2008; Ploughman 2004; Singh 2013; Smania 2012; Tariah 2010; Taub 1993; Treger 2012; Van Delden 2013; Suputtitada 2004; Wang 2011; Wittenberg 2003; Wolf 2006; Wu 2011; Wu 2012a; Yoon 2014). Data were available for 858 participants (87%). The impact of CIMT on upper limb function indicated a significant effect size (SMD 0.34, 95% CI 0.12 to 0.55; Analysis 3.1). We found moderate heterogeneity among studies (I2 = 47%).
Comparison 3.2: Perceived arm motor function (quality of use (QoU))
Twenty‐nine studies with 1086 participants measured perceived arm motor function QoU (Atteya 2004; Boake 2007; Brogårdh 2009; Brunner 2012; Dahl 2008; Hammer 2009; Huseyinsinoglu 2012; Khan 2011; Kim 2008; Krawczyk 2012; Lin 2007; Lin 2009a; Lin 2010; Myint 2008; Page 2001; Page 2002b; Page 2004; Page 2005b; Page 2008; Smania 2012; Tariah 2010; Taub 1993; Van Delden 2013; Wolf 2006; Wu 2007a; Wu 2007b; Wu 2007c; Wu 2011; Wu 2012a); data were available for 891 participants (82%). The impact of CIMT on perceived upper limb function QoU indicated a large and significant effect (MD 0.68, 95% CI 0.47 to 0.88; Analysis 3.2). We found considerable heterogeneity among studies (I2 = 74%).
Comparison 3.3: Perceived arm motor function (amount of use (AoU))
Twenty‐eight studies with 1046 participants measured perceived arm motor function (AoU; Atteya 2004; Boake 2007; Brogårdh 2009; Brunner 2012; Dahl 2008; Hammer 2009; Huseyinsinoglu 2012; Khan 2011; Kim 2008; Lin 2007; Lin 2009a; Lin 2010; Myint 2008; Page 2001; Page 2002b; Page 2004; Page 2005b; Page 2008; Smania 2012; Tariah 2010; Van Delden 2013; Wittenberg 2003; Wolf 2006; Wu 2007a; Wu 2007b; Wu 2007c; Wu 2011; Wu 2012a); data were available for 851 participants (81%). The impact of CIMT on perceived upper limb function AoU indicated a large and significant effect (MD 0.79, 95% CI 0.50 to 1.08; Analysis 3.3). We found considerable heterogeneity among studies (I2 = 87%).
Comparison 3.4: Arm motor impairment
Eighteen studies with 451 participants measured arm motor impairment (Alberts 2004; Atteya 2004; Boake 2007; Hammer 2009; Lin 2009a; Lin 2010; Page 2001; Page 2002b; Page 2004; Page 2005b; Page 2008; Ploughman 2004; Singh 2013; Tariah 2010; Van Delden 2013; Wu 2007b; Wu 2007c; Yoon 2014); data were available for 372 participants (82%). The impact of CIMT on upper limb impairment indicated a significant effect (SMD 0.82, 95% CI 0.31 to 1.34; Analysis 3.4). We found considerable heterogeneity among studies (I2 = 77%).
Comparison 3.5: Quality of life
Eight studies with 537 participants measured quality of life (Dahl 2008; Dromerick 2009; Lin 2009a; Van Delden 2013; Wolf 2006; Wu 2007b; Wu 2007c; Wu 2012a); data were available for 96 participants (18%). The impact of CIMT on quality of life indicated a non‐significant effect (MD 6.54, 95% CI ‐1.2 to 14.28; Analysis 3.5). We found no statistical heterogeneity (I2 = 0%).
Comparison 3.6: Dexterity
Seven studies with 229 participants included a measure of dexterity (Boake 2007; Brunner 2012; Hammer 2009; Kim 2008; Myint 2008; Van Delden 2013; Yoon 2014); data were available for 113 participants (49%). The impact of CIMT on upper limb dexterity indicated a significant effect (SMD 0.42, 95% CI 0.04 to 0.79; Analysis 3.6). We found no statistical heterogeneity (I2 = 0%).
Discussion
Summary of main results
This work updates the previous Cochrane review published in 2008 on the efficacy of CIMT, mCIMT and FU. The review now includes 42 trials with 1453 participants. All studies enrolled people who had compromised, but residual, ability of upper arm and hand, participants were able to extend the wrist and the metacarpophalangeal joints at least 10° and 20° respectively, or presented a Brunnstrom stage > 3 and with limited pain or spasticity. Moreover, people with cognitive impairment were excluded.
Results of this review show a superiority of CIMT in comparison with other rehabilitation approaches on the recovery from motor impairment and motor function (secondary outcomes) but not in disability (primary outcome).
Effect of CIMT on disability
Eleven trials with 344 participants measured disability and we included their results in the analysis.
The impact of CIMT on disability indicates a non‐significant effect if compared with active rehabilitation approaches (SMD 0.24, 95% CI ‐0.05 to 0.52). Also, at the longest follow‐up, no superiority of CIMT is documented and subgroup analyses do not show interactions between disability and amount of task practice, anatomical region restraint or time since stroke. The main active rehabilitation approaches used by the control groups consisted of occupational therapy and techniques of adaptation to motor impairment (Dahl 2008; Dromerick 2009; Lin 2009a; Myint 2008), functional task practice (Lin 2007; Ploughman 2004; Treger 2012; Wu 2007a; Wu 2007c), Bobath principles (Huseyinsinoglu 2012), and unspecified conventional rehabilitation (Yoon 2014). The treatment duration was well balanced among studies except in that of Huseyinsinoglu 2012, in which CIMT treatment lasted three times as long as the treatment performed by the control group, and in the Yoon 2014 study, in which there was a similar four‐fold imbalance between the groups.
In summary, these studies showed that the use of constraining approaches (CIMT, mCIMT and FU) compared with a similar dose of rehabilitation targeting the practice of functional tasks did not result in a demonstrable improvement in disability.
Secondary outcomes
Twenty‐eight studies with a total of 848 participants measured arm motor function and we included them in the analysis. CIMT was always compared with active rehabilitation approaches, and showed a limited effect in improving arm motor function.
The majority of trials used a mCIMT, eight studies used CIMT (Dahl 2008; Hayner 2010; Khan 2011; Myint 2008; Taub 1993; Wittenberg 2003; Wolf 2006; Yoon 2014), and only three studies used FU (Hammer 2009; Kim 2008; Ploughman 2004). Comparison groups performed the same dose of treatment with the exception of five studies in which the control groups' dose was lower (Dromerick 2009; Taub 1993; Wittenberg 2003; Wolf 2006; Yoon 2014), one study in which the dose was smaller in the treatment group (Huseyinsinoglu 2012), and two studies in which it was not clearly specified (Dahl 2008; Kim 2008).
Twenty‐three and 24 of the included studies with a total of 851 and 891 participants, respectively, measured the perceived arm motor function (AoU and QoU, respectively) and we included them in the analysis. In three studies the control groups did not perform treatments (Kim 2008, Taub 1993, Wittenberg 2003). The estimated effect of CIMT led to a significant and clinically relevant improvement in the perceived arm motor function of the paretic arm (Lang 2008).
Sixteen of the included studies with a total of 372 participants measured arm motor impairment and we included them in the analysis. In one study the control group did not perform treatments (Kim 2008). The estimated effect of CIMT was considered to be large in modifying the arm motor impairment of the affected arm.
Four of the included studies with a total of 113 participants measured dexterity and we included them in the analysis. The estimated effect of CIMT led to a significant small effect in improving upper limb dexterity.
CIMT does not appear to have a better effect than other rehabilitation approaches in improving quality of life; this was measured in three studies.
It is worth noting the considerable heterogeneity of the studies included in the review, regarding the way in which CIMT was applied and the characteristics of the control treatments. Considering this heterogeneity, and some differences among the outcome measures used by the authors, the results of these analyses should be interpreted with caution.
When reported, rates of adverse events among included studies do not appear to differ between CIMT and the comparison groups, and CIMT appears to have no adverse effects.
Sixteen studies declared dropout levels of 4% to 23%, including losses for non‐medical reasons, with the exception of one study in which four of the 13 participants in the experimental group did not complete the programme due to difficulties in performing the ADLs (Kim 2008).
Overall completeness and applicability of evidence
In 2009 this review concluded that "the impact of CIMT on disability indicated a modest significant benefit". With the increase in the number of included studies, the effect of CIMT on disability decreased and became non‐significant (SMD 0.24, 95% CI ‐0.05 to 0.52; Analysis 1.1). We classified the magnitude of effect sizes as proposed by Juni 2006. The effect size of 0.24 standard deviation units obtained for disability is considered small. It corresponds to an overlap in the distribution of participants allocated in the experimental or control interventions of about 85% of cases, indicating that only 15% of people would benefit from CIMT treatment after stroke. Also, the sample sizes of the 42 included studies were generally small.
It has been argued that only individuals presenting with mild to moderate paresis of the upper limb (Nijland 2010; Smania 2007), as well as those who are more motivated, would be eligible for CIMT treatment (Wissink 2014). Actually, from reports of included trials there is a clear difficulty in finding eligible participants. Sixty‐one per cent for Lin 2010, and 93% for Smania 2012, of people assessed for eligibility were excluded because they did not fit the inclusion criteria. Moreover, about 20% of eligible people refused to participate in the study. This means that only a small number of the people who were screened were included in these eligible trials. Moreover, the presence of movement requested as part of the inclusion criteria could have allowed for selection of those people with less severe stroke. Transcranial magnetic stimulation and diffusion tensor imaging studies show that voluntary wrist and finger extension are associated with the integrity of the corticospinal tract system (Butler 2007; Stinear 2007; Stinear 2010). Consequently, the characteristics of people to include in these trials raise questions about the application of this intervention in a wide range of stroke survivors.
The included studies were heterogeneous in participant and intervention characteristics for both CIMT and the control group. However, none of the subgroup analyses performed in this review (dose of treatment, time since stroke, anatomical region restraint) revealed a group of better responders. Although no evidence exists that the dose of CIMT influences the results, it does not imply that it is not important. Consequently, it is not possible to exclude the possibility that the high dose of CIMT reported in the Yoon 2014 study introduced heterogeneity in the analysis, thus providing overestimation of the effect of CIMT on disability. Finally, the results of this meta‐analysis do not show that the first weeks after stroke onset are the most important for the application of CIMT, as studies on neuroplasticity might suggest (Sunderland 2005).
Improvements introduced by CIMT are mainly based on learning to optimise the use of end‐effectors through compensatory strategies. The effects documented in this meta‐analysis involve motor impairment and motor function without a translation in disability. This could be considered as surprising, as the rationale for CIMT is based on decreasing the learned non‐use phenomenon, however, it could be due to the characteristics of the measures of disability.
The number of RCTs and the data that inform this review have increased over the past few years. However, the included studies were generally poor in terms of relevance of findings and quality of reporting. Only 11 out of 42 studies (with 344 participants) reported data on the most relevant clinical outcome – disability – comparing CIMT with an active control intervention. Reporting was often incomplete, which made some studies uninformative.
The applicability of cumulative evidence characterised by a large number of small trials of uncertain quality challenges definitive conclusions about the role of CIMT; however, the findings of this review suggest that CIMT does not show relevant benefits for the outcomes that may matter most to people after their stroke.
Quality of the evidence
Three‐quarters of the included trials can be considered to be at unclear risk of bias (see Risk of bias in included studies) for at least one key bias area. In fact, key methodological information was often not reported for sequence generation, allocation concealment, blinding, and missing data. Blinding of study personnel, particularly outcome assessors, was reported in the majority of studies.
Many trials were likely to be underpowered, likely to approach analyses on a per protocol basis, and had a strong inclination to perform multiple testing on function scales.
Recent meta‐reporting studies showed promising improvements in the reporting of rehabilitation trials (Abdul Latif 2011; Villamar 2013), and reviews (DiSilvestro 2015; Gianola 2013). In the cohort of trials that have evaluated the effectiveness of CIMT, there were a few recent trials that adopted robust methods and accurate reporting of clinical and methodological aspects (Brunner 2012; Smania 2012; Treger 2012; Wolf 2006). These trials represent the next generation in terms of methodological issues, and a major step forward in research to understand fully the benefit and safety of rehabilitation techniques in comparative studies.
Potential biases in the review process
We chose disability as the primary outcome, although it was considered by a minority of eligible studies (11 studies with a total of 344 participants), whereas arm motor function was used as the primary outcome in the majority of included studies (28 studies with 858 participants).
Although the analysis showed the largest effect of CIMT on perceived arm motor function, caution is needed in interpreting this result, because of the lack of consistency in the MAL scale, as described in the Risk of bias in included studies section. Its clinimetric properties need further investigation in order to define its use in longitudinal studies.
Most trials were small, with some trials enrolling only six or 10 participants. This is unacceptable, given the high incidence of stroke and the opportunity to recruit a large sample. Our sample of trials may therefore have been influenced by publication bias, which tends to exaggerate the effect of treatment. The randomisation methods were described only in about half of the included trials. It is not possible to determine if some studies excluded participants after randomisation, or whether blinding was not adequately maintained. These weaknesses could be expected to lead to bias in favour of a treatment effect. The reporting of the data was poor; for example, many trials only reported that there were no significant differences between the intervention and the control groups. This lack of proper reporting could also be expected to lead to bias in favour of a treatment effect. It should also be noted that many authors of trials have a cultural and professional interest in disseminating positive results about the rehabilitative techniques they propose.
Finally, only one author of the review scanned the titles obtained from electronic databases searching in order to exclude irrelevant studies and this could have introduced bias.

Study flow diagram.

Risk of bias graph: review authors' judgements about each risk of bias item presented as percentages across all included studies.

Risk of bias summary: review authors' judgements about each risk of bias item for each included study.

Funnel plot of comparison: 3 Constraint versus control: secondary outcomes, outcome: 3.1 Arm Motor Function.

Comparison 1 Constraint versus control: primary outcome, Outcome 1 Disability postintervention.

Comparison 1 Constraint versus control: primary outcome, Outcome 2 Disability: 3 to 6‐month follow‐up.

Comparison 2 Constraint versus control: subgroup analysis on primary outcome, Outcome 1 Amount of task practice.

Comparison 2 Constraint versus control: subgroup analysis on primary outcome, Outcome 2 Anatomical region restraint.

Comparison 2 Constraint versus control: subgroup analysis on primary outcome, Outcome 3 Time since stroke.

Comparison 3 Constraint versus control: secondary outcomes, Outcome 1 Arm Motor Function.

Comparison 3 Constraint versus control: secondary outcomes, Outcome 2 Perceived Arm Motor Function (Quality of Use).
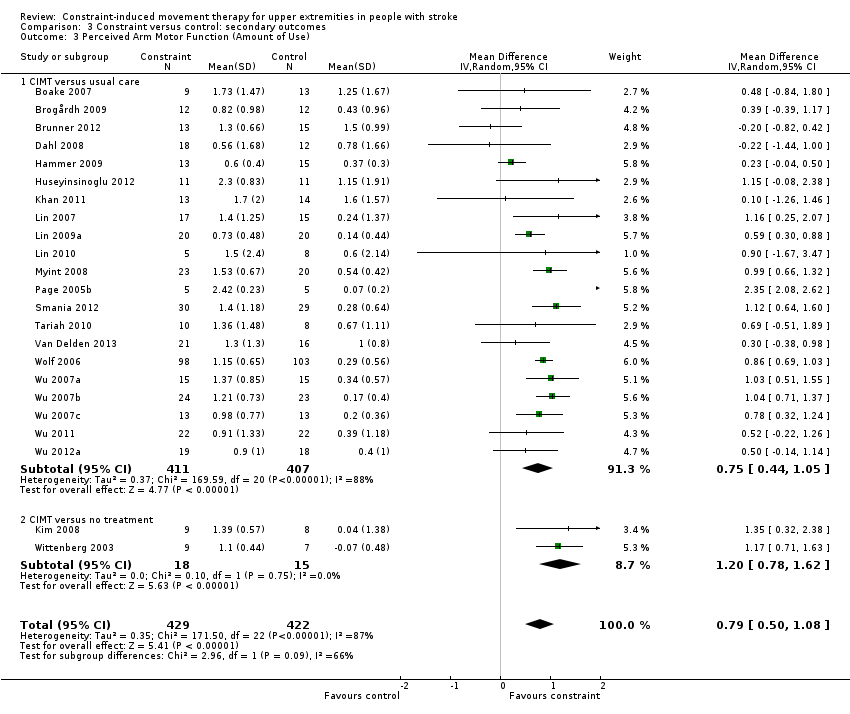
Comparison 3 Constraint versus control: secondary outcomes, Outcome 3 Perceived Arm Motor Function (Amount of Use).

Comparison 3 Constraint versus control: secondary outcomes, Outcome 4 Arm Motor Impairment.

Comparison 3 Constraint versus control: secondary outcomes, Outcome 5 Quality of life.

Comparison 3 Constraint versus control: secondary outcomes, Outcome 6 Dexterity.
| Constraint‐induced movement therapy (CIMT) or modified CIMT (mCIMT) or Forced Use (FU) compared with usual care or no treatment for the recovery of affected upper limb in people with stroke | |||||
| Patient or population: people with stroke receiving upper limb rehabilitation | |||||
| Outcomes | Illustrative comparative risks* (95% CI) | Relative effect | No of participants | Comments | |
| Assumed risk | Corresponding risk | ||||
| Usual care or no treatment | CIMT or mCIMT or FU | ||||
| Disability Follow‐up: at the end of treatment | The mean disability in the intervention groups was | 344 | A standard deviation of 0.24 represents a small difference between the groups The estimated effect is non significant because its 95% interval confidence includes the null effect | ||
| Arm Motor Function Follow‐up: at the end of treatment | The mean arm motor function in the intervention groups was | 858 | A standard deviation of 0.34 represents a small difference between the groups | ||
| Perceived Arm Motor Function (Quality of Use) Follow‐up: at the end of treatment | The mean perceived arm motor function (quality of use) ranged across control groups from 0.14 to 1.4 points | The mean perceived arm motor function (quality of use) in the intervention groups was | 891 | The minimal clinically important difference for this scale assessing the quality of use is 1 or 1.1 points depending on the dominance of the affected arm (Lang 2008). | |
| Perceived Arm Motor Function (Amount of Use) | The mean perceived arm motor function (amount of use) ranged across control groups from ‐0.07 to 1.6 points | The mean perceived arm motor function (amount of use) in the intervention groups was | 851 | ||
| Arm Motor Impairment Follow‐up: at the end of treatment | The mean arm motor impairment in the intervention groups was | 372 | A standard deviation of 0.82 represents a large difference between the groups | ||
| Quality of life Follow‐up: at the end of treatment | The mean quality of life score ranged across control groups from ‐3.46 to 7.5 points | The mean quality of life in the intervention groups was | 96 | ||
| Dexterity Follow‐up: at the end of treatment | The mean dexterity in the intervention groups was | 113 | A standard deviation of 0.42 represents a small difference between the groups. | ||
| *The assumed risk is based on the highest and the lowest estimate of the scores in the control groups. The corresponding risk (and its 95% confidence interval) is based on the assumed risk in the comparison group and the relative effect of the intervention (and its 95% CI). | |||||
| Study ID | Dosage of practice | Anatomical restraint | Constraint effect | Time since stroke |
| 1 = 3 hour or less; 2 = more than 3 hours | 1 = only hand; 2 = both arm and hand | 1 = restraint; 2 = restraint plus exercise | 1 = 0 to 3 months; 2 = 3 to 9 months; 3 = more than 9 months; 4 = wide range (from 0.5 to 37 months) | |
| 2 | 1 | 2 | 2 | |
| 1 | 2 | 2 | 2 | |
| 1 | 1 | 2 | 1 | |
| 1 | 1 | 2 | 1 | |
| 2 | 1 | 2 | 1 | |
| 1 | 1 | 2 | 1 | |
| 1 | 1 | 2 | 1 | |
| 2 | 1 | 2 | 4 | |
| 1 | 1 | 2 | 1 | |
| 1 | 1 | 2 | 1 | |
| 1 | 2 | 1 | 1 | |
| 2 | 1 | 2 | 3 | |
| 1 | 1 | 2 | 2 | |
| 2 | 1 | 2 | 4 | |
| 1 | 1 | 1 | 3 | |
| 2 | 2 | 2 | 3 | |
| 1 | 1 | 2 | 3 | |
| 1 | 1 | 2 | 4 | |
| 1 | 1 | 2 | 4 | |
| 2 | 2 | 2 | 1 | |
| 1 | 2 | 2 | 2 | |
| 1 | 2 | 2 | 2 | |
| 1 | 2 | 2 | 3 | |
| 1 | 1 | 2 | 1 | |
| 1 | 2 | 2 | 3 | |
| 1 | 1 | 2 | 1 | |
| 1 | 1 | 2 | 1 | |
| 1 | 1 | 2 | 2 | |
| 1 | 1 | 2 | 2 | |
| 2 | 2 | 2 | 3 | |
| 1 | 1 | 2 | 1 | |
| 1 | 1 | 2 | 2 | |
| 1 | 1 | 2 | 1 | |
| 2 | 2 | 2 | 3 | |
| 2 | 1 | 2 | 2 | |
| 1 | 1 | 2 | 4 | |
| 1 | 1 | 2 | 4 | |
| 1 | 1 | 2 | 4 | |
| 1 | 1 | 2 | 4 | |
| 1 | 1 | 2 | 4 | |
| 2 | 2 | 2 | 1 |
| Study ID | Arm motor function | Perceived motor function | Dexterity | Arm motor impairment | Activities of daily living measures | Quality of life | Kinematics | Neurophysiologics | Strength |
| Wolf Motor Function Test | Fugl Meyer Assessment | Hand dynamometer | |||||||
| Action Research Arm Test, Wolf Motor Function Test | Motor Activity Log | Fugl Meyer Assessment | |||||||
| Bartel Index | |||||||||
| Wolf Motor Function Test, Motor Assessment Scale | |||||||||
| Motor Activity Log | Grooved Pegboard Test | Fugl Meyer Assessment | Transcranial magnetic stimulation | ||||||
| Motor Assessment Scale, Sollerman Hand Function Scale | Motor Activity Log | ||||||||
| Action Research Arm Test | Nine‐Hole Peg Test | ||||||||
| Wolf Motor Function Test | Motor Activity Log | Functional Independence Measure | Stroke Impact Scale | ||||||
| Action Research Arm Test | |||||||||
| Action Research Arm Test | Functional Independence Measure | Stroke Impact Scale | |||||||
| Action Research Arm Test, Motor Assessment Scale | Motor Activity Log | Sixteen‐Hole Peg Test | Fugl Meyer Assessment | Grippit | |||||
| Wolf Motor Function Test | |||||||||
| Wolf Motor Function Test | Motor Activity Log | Functional Independence Measure | |||||||
| Wolf Motor Function Test | Motor Activity Log | ||||||||
| Manual Function Test | Motor Activity Log | Perdue Pegboard Test | |||||||
| Rivermead motor assessment arm scale | Motor Activity Log | ||||||||
| Motor Activity Log | Functional Independence Measure | Yes | |||||||
| Motor Activity Log | Fugl Meyer Assessment | Functional Independence Measure | Stroke Impact Scale | ||||||
| Motor Activity Log | Fugl Meyer Assessment | Functional magnetic resonance | |||||||
| Action Research Arm Test | Motor Activity Log | Nine‐Hole Peg Test | Bartel Index | ||||||
| Action Research Arm Test, Wolf Motor Function Test | Motor Activity Log | Fugl Meyer Assessment | |||||||
| Action Research Arm Test | Motor Activity Log | Fugl Meyer Assessment | |||||||
| Action Research Arm Test | Motor Activity Log | Fugl Meyer Assessment | |||||||
| Action Research Arm Test | Motor Activity Log | Fugl Meyer Assessment | |||||||
| Action Research Arm Test | Motor Activity Log | Fugl Meyer Assessment | |||||||
| Action Research Arm Test | Chedoke McMaster Impairment Inventory | Functional Independence Measure | Jamar | ||||||
| Wolf Motor Function Test (only time) | Fugl Meyer Assessment | ||||||||
| Wolf Motor Function Test | Motor Activity Log | ||||||||
| Wolf Motor Function Test | Motor Activity Log | Fugl Meyer Assessment | |||||||
| Emory Motor Function Test | Motor Activity Log | ||||||||
| Manual Function Test | Functional Independence Measure | ||||||||
| Action Research Arm Test | Motor Activity Log | Nine‐Hole Peg Test | Fugl Meyer Assessment, Motricity Index | Stroke Impact Scale | |||||
| Wolf Motor Function Test | |||||||||
| Wolf Motor Function Test | Motor Activity Log | Transcranial magnetic stimulation, positron emission tomography | |||||||
| Wolf Motor Function Test | Motor Activity Log | Stroke Impact Scale | |||||||
| Motor Activity Log | Functional Independence Measure | Stroke Impact Scale | Yes | ||||||
| Motor Activity Log | Fugl Meyer Assessment | Yes | |||||||
| Motor Activity Log | Fugl Meyer Assessment | Functional Independence Measure | Stroke Impact Scale | ||||||
| Wolf Motor Function Test | Motor Activity Log | Yes | |||||||
| Action Research Arm Test | Motor Activity Log | Stroke Impact Scale | |||||||
| Wolf Motor Function Test | Nine‐Hole Peg Test, Box and Block Test | Fugl Meyer Assessment | Bartel Index | Hand Dynamometer |
| Outcome or subgroup title | No. of studies | No. of participants | Statistical method | Effect size |
| 1 Disability postintervention Show forest plot | 11 | 344 | Std. Mean Difference (IV, Random, 95% CI) | 0.24 [‐0.05, 0.52] |
| 2 Disability: 3 to 6‐month follow‐up Show forest plot | 3 | 125 | Std. Mean Difference (IV, Random, 95% CI) | ‐0.21 [‐0.57, 0.16] |
| Outcome or subgroup title | No. of studies | No. of participants | Statistical method | Effect size |
| 1 Amount of task practice Show forest plot | 11 | Std. Mean Difference (IV, Fixed, 95% CI) | Subtotals only | |
| 1.1 ≤ 30 hours | 8 | 253 | Std. Mean Difference (IV, Fixed, 95% CI) | 0.18 [‐0.07, 0.44] |
| 1.2 > 30 hours | 3 | 91 | Std. Mean Difference (IV, Fixed, 95% CI) | 0.25 [‐0.18, 0.67] |
| 2 Anatomical region restraint Show forest plot | 11 | Std. Mean Difference (IV, Fixed, 95% CI) | Subtotals only | |
| 2.1 Arm plus hand | 2 | 61 | Std. Mean Difference (IV, Fixed, 95% CI) | 0.35 [‐0.17, 0.87] |
| 2.2 Hand only | 9 | 283 | Std. Mean Difference (IV, Fixed, 95% CI) | 0.17 [‐0.08, 0.41] |
| 3 Time since stroke Show forest plot | 7 | Std. Mean Difference (IV, Fixed, 95% CI) | Subtotals only | |
| 3.1 0 to 3 months | 5 | 164 | Std. Mean Difference (IV, Fixed, 95% CI) | 0.07 [‐0.26, 0.39] |
| 3.2 3 to 9 months | 0 | 0 | Std. Mean Difference (IV, Fixed, 95% CI) | 0.0 [0.0, 0.0] |
| 3.3 More than 9 months | 2 | 62 | Std. Mean Difference (IV, Fixed, 95% CI) | 0.49 [‐0.02, 1.00] |
| Outcome or subgroup title | No. of studies | No. of participants | Statistical method | Effect size |
| 1 Arm Motor Function Show forest plot | 28 | 858 | Std. Mean Difference (IV, Random, 95% CI) | 0.34 [0.12, 0.55] |
| 1.1 Constraint therapy versus usual care | 25 | 816 | Std. Mean Difference (IV, Random, 95% CI) | 0.31 [0.09, 0.52] |
| 1.2 Constraint therapy versus no treatment | 3 | 42 | Std. Mean Difference (IV, Random, 95% CI) | 1.04 [‐0.31, 2.40] |
| 2 Perceived Arm Motor Function (Quality of Use) Show forest plot | 24 | 891 | Mean Difference (IV, Random, 95% CI) | 0.68 [0.47, 0.88] |
| 2.1 CIMT versus usual care | 22 | 865 | Mean Difference (IV, Random, 95% CI) | 0.65 [0.44, 0.86] |
| 2.2 CIMT versus no treatment | 2 | 26 | Mean Difference (IV, Random, 95% CI) | 0.94 [‐0.32, 2.20] |
| 3 Perceived Arm Motor Function (Amount of Use) Show forest plot | 23 | 851 | Mean Difference (IV, Random, 95% CI) | 0.79 [0.50, 1.08] |
| 3.1 CIMT versus usual care | 21 | 818 | Mean Difference (IV, Random, 95% CI) | 0.75 [0.44, 1.05] |
| 3.2 CIMT versus no treatment | 2 | 33 | Mean Difference (IV, Random, 95% CI) | 1.20 [0.78, 1.62] |
| 4 Arm Motor Impairment Show forest plot | 16 | 372 | Std. Mean Difference (IV, Random, 95% CI) | 0.82 [0.31, 1.34] |
| 4.1 Constraint therapy versus usual care | 15 | 355 | Std. Mean Difference (IV, Random, 95% CI) | 0.88 [0.33, 1.42] |
| 4.2 Constraint therapy versus no treatment | 1 | 17 | Std. Mean Difference (IV, Random, 95% CI) | 0.25 [‐0.70, 1.21] |
| 5 Quality of life Show forest plot | 3 | 96 | Mean Difference (IV, Random, 95% CI) | 6.54 [‐1.20, 14.28] |
| 5.1 Constraint therapy versus usual care | 3 | 96 | Mean Difference (IV, Random, 95% CI) | 6.54 [‐1.20, 14.28] |
| 6 Dexterity Show forest plot | 4 | 113 | Std. Mean Difference (IV, Random, 95% CI) | 0.42 [0.04, 0.79] |
| 6.1 Constraint therapy versus usual care | 4 | 113 | Std. Mean Difference (IV, Random, 95% CI) | 0.42 [0.04, 0.79] |