Compulsory community and involuntary outpatient treatment for people with severe mental disorders
Abstract
Background
There is controversy as to whether compulsory community treatment (CCT) for people with severe mental illness (SMI) reduces health service use, or improves clinical outcome and social functioning.
Objectives
To examine the effectiveness of CCT for people with SMI.
Search methods
We searched the Cochrane Schizophrenia Group’s Trials Register and Science Citation Index (2003, 2008, and 2012). We obtained all references of identified studies and contacted authors where necessary. We further updated this search on the 8 November 2013.
Selection criteria
All relevant randomised controlled clinical trials (RCTs) of CCT compared with standard care for people with SMI (mainly schizophrenia and schizophrenia‐like disorders, bipolar disorder, or depression with psychotic features). Standard care could be voluntary treatment in the community or another pre‐existing form of compulsory community treatment such as supervised discharge.
Data collection and analysis
Review authors independently selected studies, assessed their quality and extracted data. We used The Cochrane Collaboration’s tool for assessing risk of bias. For binary outcomes, we calculated a fixed‐effect risk ratio (RR), its 95% confidence interval (CI) and, where possible, the weighted number needed to treat statistic (NNT). For continuous outcomes, we calculated a fixed‐effect mean difference (MD) and its 95% CI. We used the GRADE (Grading of Recommendations Assessment, Development and Evaluation) approach to create a 'Summary of findings' table for outcomes we rated as important and assessed the risk of bias of included studies.
Main results
All studies (n=3) involved patients in community settings who were followed up over 12 months (n = 752 participants).
Two RCTs from the USA (total n = 416) compared court‐ordered 'Outpatient Commitment' (OPC) with voluntary community treatment. OPC did not result in significant differences compared to voluntary treatment in any of the main outcome indices: health service use (2 RCTs, n = 416, RR for readmission to hospital by 11‐12 months 0.98 CI 0.79 to 1.21, low grade evidence); social functioning (2 RCTs, n = 416, RR for arrested at least once by 11‐12 months 0.97 CI 0.62 to 1.52, low grade evidence); mental state; quality of life (2 RCTs, n = 416, RR for homelessness 0.67 CI 0.39 to 1.15, low grade evidence) or satisfaction with care (2 RCTs, n = 416, RR for perceived coercion 1.36 CI 0.97 to 1.89, low grade evidence). However, risk of victimisation decreased with OPC (1 RCT, n = 264, RR 0.50 CI 0.31 to 0.80). Other than perceived coercion, no adverse outcomes were reported. In terms of numbers needed to treat (NNT), it would take 85 OPC orders to prevent one readmission, 27 to prevent one episode of homelessness and 238 to prevent one arrest. The NNT for the reduction of victimisation was lower at six (CI 6 to 6.5).
One further RCT compared community treatment orders (CTOs) with less intensive supervised discharge in England and found no difference between the two for either the main outcome of readmission (1 RCT, n = 333, RR for readmission to hospital by 12 months 0.99 CI 0.74 to 1.32, medium grade evidence), or any of the secondary outcomes including social functioning and mental state. It was not possible to calculate the NNT. The English study met three out of the seven criteria of The Cochrane Collaboration’s tool for assessing risk of bias, the others only one, the majority being rated unclear.
Authors' conclusions
CCT results in no significant difference in service use, social functioning or quality of life compared with standard voluntary care. People receiving CCT were, however, less likely to be victims of violent or non‐violent crime. It is unclear whether this benefit is due to the intensity of treatment or its compulsory nature. Short periods of conditional leave may be as effective (or non‐effective) as formal compulsory treatment in the community. Evaluation of a wide range of outcomes should be considered when this legislation is introduced. However, conclusions are based on three relatively small trials, with high or unclear risk of blinding bias, and evidence we rated as low to medium quality.
PICO
Plain language summary
Compulsory community and involuntary outpatient treatment for people with severe mental disorders
Compulsory community treatment (CCT) for people with severe mental health problems is used in many countries, including Australia, Israel, New Zealand, the United Kingdom, and the United States. Supporters of this approach suggest that it is less restrictive and better to compulsorily treat someone in the community than to subject them to repeated hospital admissions. They also argue that it is effective in bringing stability to the lives of people with severe mental illness. Opponents of CCT fear treatment and support will be replaced by a greater emphasis on control, restraint, and threat. CCT may also undermine the relationship between healthcare professionals and patients, leading to feelings of mistrust and being controlled, which may drive people with severe mental illnesses away from services.
Given the widespread use of such powers, which effectively force people in the community to compulsorily undergo treatment, it is important to assess the benefits, effectiveness or possible hazards of compulsory treatment.
Update searches for randomised trials were run in 2012 and 2013 and this review now includes three trials with a total of 752 people. Two of these trials compared a form of CCT called 'Outpatient Commitment' (OPC) versus standard care and the third trial compared a form of CCT called Community Treatment Order to supervised discharge. The review authors rated the quality of evidence for the main outcomes to be low to medium grade. Results from the trials showed overall CCT was no more likely to result in better service use, social functioning, mental state or quality of life compared with standard 'voluntary' care. People receiving CCT were less likely to be victims of violent or non‐violent crime. It is unclear whether this benefit is due to the intensity of treatment or its compulsory nature. Other than feelings of coercion or being controlled, there were no other negative outcomes. Short periods of conditional leave may be as effective (or non‐effective) as compulsory treatment in the community. However, there is very limited information available, all results are based on three relatively small trials of low to medium quality, making it difficult to draw firm conclusions, so further research into the effects of different types of compulsory community treatment is much needed.
Ben Gray, Senior Peer Researcher, McPin Foundation http://mcpin.org/.
Authors' conclusions
Summary of findings
| COMPULSORY COMMUNITY TREATMENT compared with STANDARD CARE for people with severe mental disorders | ||||||
| Patient or population: people with severe mental disorders | ||||||
| Outcomes | Illustrative comparative risks* (95% CI) | Relative effect | No of Participants | Quality of the evidence | Comments | |
| Assumed risk | Corresponding risk | |||||
| STANDARD CARE | COMPULSORY COMMUNITY TREATMENT | |||||
| Health service outcomes: 1. Readmission to hospital ‐ by 11‐12 months | Study population | RR 0.98 | 416 | ⊕⊕⊝⊝ | ||
| 460 per 1000 | 451 per 1000 | |||||
| Medium risk population | ||||||
| 446 per 1000 | 437 per 1000 | |||||
| Health service outcomes: 2. Compliance with medication ‐ by 11‐12 months | Study population | RR 0.99 | 416 | ⊕⊕⊝⊝ | ||
| 505 per 1000 | 500 per 1000 | |||||
| Medium risk population | ||||||
| 554 per 1000 | 548 per 1000 | |||||
| Patient level outcomes: 1a. Social functioning: trouble with police ‐ by 11‐12 months ‐ at least one arrest | Study population | RR 0.97 | 416 | ⊕⊕⊝⊝ | ||
| 158 per 1000 | 153 per 1000 | |||||
| Medium risk population | ||||||
| 156 per 1000 | 151 per 1000 | |||||
| Patient level outcomes: 1a. Social functioning: trouble with police ‐ by 11‐12 months ‐ ever arrested/picked up by police for violence against a person | Study population | RR 0.82 | 416 | ⊕⊕⊝⊝ | ||
| 208 per 1000 | 171 per 1000 | |||||
| Medium risk population | ||||||
| 156 per 1000 | 128 per 1000 | |||||
| Patient level outcomes: 1b. Social functioning: homeless ‐ by 11‐12 months | Study population | RR 0.67 | 416 | ⊕⊕⊝⊝ | ||
| 134 per 1000 | 90 per 1000 | |||||
| Medium risk population | ||||||
| 145 per 1000 | 97 per 1000 | |||||
| Patient level outcomes: 2. Quality of life: victimisation ‐ by 11‐12 months | Study population | RR 0.5 | 264 | ⊕⊕⊝⊝ | ||
| 311 per 1000 | 156 per 1000 | |||||
| Medium risk population | ||||||
| 311 per 1000 | 156 per 1000 | |||||
| Patient level outcomes: 3. Satisfaction with care/adverse events: perceived coercion ‐ by 11‐12 months | Study population | RR 1.36 | 416 | ⊕⊕⊝⊝ | ||
| 218 per 1000 | 296 per 1000 | |||||
| Medium risk population | ||||||
| 227 per 1000 | 309 per 1000 | |||||
| *The basis for the assumed risk (e.g. the median control group risk across studies) is provided in footnotes. The corresponding risk (and its 95% confidence interval) is based on the assumed risk in the comparison group and the relative effect of the intervention (and its 95% CI). | ||||||
| GRADE Working Group grades of evidence | ||||||
| 1 Allocation concealment and blinding unclear | ||||||
| COMMUNITY TREATMENT ORDERS compared with SECTION 17 for people with severe mental disorders | ||||||
| Patient or population: people with severe mental disorders | ||||||
| Outcomes | Illustrative comparative risks* (95% CI) | Relative effect | No of Participants | Quality of the evidence | Comments | |
| Assumed risk | Corresponding risk | |||||
| SECTION 17 | COMMUNITY TREATMENT ORDERS | |||||
| Health service outcomes: 1. Readmission to hospital ‐ by 12 months | Study population | RR 0.99 | 333 | ⊕⊕⊕⊝ | ||
| 359 per 1000 | 356 per 1000 | |||||
| Moderate risk population | ||||||
| 359 per 1000 | 355 per 1000 | |||||
| Health service outcomes: 2. Total duration of psychiatric hospital stays over12 months | The mean health service outcomes: 2. total duration of psychiatric hospital stays over12 months in the intervention groups was | 333 | ⊕⊕⊕⊝ | |||
| Health service outcomes: 3. Number of readmissions by 12 months | The mean health service outcomes: 3. number of readmissions by 12 months in the intervention groups was | 119 | ⊕⊕⊕⊝ | |||
| Health service outcomes: 4. Number with multiple readmissions by 12 months | Study population | RR 0.56 | 333 | ⊕⊕⊕⊝ | ||
| 108 per 1000 | 60 per 1000 | |||||
| Moderate risk population | ||||||
| 108 per 1000 | 60 per 1000 | |||||
| Days in community till 1st admission | The mean days in community till 1st admission in the intervention groups was | 333 | ⊕⊕⊕⊝ | |||
| Patient level outcomes: BPRS | The mean patient level outcomes: BPRS in the intervention groups was | 234 | ⊕⊕⊕⊝ | |||
| Patient level outcomes: GAF3 | The mean patient level outcomes: GAF in the intervention groups was | 237 | ⊕⊕⊕⊝ | |||
| *The basis for the assumed risk (e.g. the median control group risk across studies) is provided in footnotes. The corresponding risk (and its 95% confidence interval) is based on the assumed risk in the comparison group and the relative effect of the intervention (and its 95% CI). | ||||||
| GRADE Working Group grades of evidence | ||||||
| 1 Forty people (25%) allocated to Section 17 were subsequently placed on a CTO during the study 3 No adverse events were reported | ||||||
Background
Description of the condition
Compulsory treatment for people with severe mental disorders in the community is used in many countries, including Australia, Israel, New Zealand, the United Kingdom (UK), and the United States of America (USA) (Wilk 1988; Kanter 1995; Torrey 1995; McIvor 1998; McIvor 2001). In the USA, the majority of states have some form of compulsory community treatment (Torrey 1995) and there are similar provisions in Australia, Canada and New Zealand (Dedman 1990; Mulvany 1993; Torrey 1995; Gray 2001; O'Reilly 2001). Early initiatives in the UK included extended leave for patients leaving hospital and a 'supervision register' (Sensky 1991; Holloway 1996), with the more recent implementation of legislation for compulsory community treatment in Scotland, England, and Wales (Lawton‐Smith 2008; Wooley 2010).
Supporters of this approach suggest that it is less restrictive to compulsorily treat someone in the community than to subject them to repeated hospital admissions (Pinfold 2001). They also argue that it is effective in bringing stability to the lives of people with severe mental illness (O'Reilly 2001). Opponents of compulsory community treatment fear treatment and support will be replaced by a greater emphasis on control, restraint, and threat (Pinfold 2001). They argue that compulsion may be used as an alternative to intensive case management or assertive community treatment, which may be all that is needed (Swartz 1995). Compulsory community treatment may also adversely effect the therapeutic alliance between healthcare professionals and patients and drive people with severe mental illnesses away from services (Pinfold 2001), although the limited data to date do not suggest that this has happened (O'Reilly 2001).
Description of the intervention
Extended leave or supervised discharge is applied at the time of discharge from compulsory inpatient treatment. These methods are used in Canada (Gray 2001), the UK (Sensky 1991), and New Hampshire, USA (Torrey 1995). They give mental health professionals the right to return a patient to hospital against their wishes if they do not comply with treatment.
Community treatment orders (CTOs) are used in Australia (Vaughan 2000) and Canada (Gray 2001) and give mental health professionals the right to place an individual on an order, whether they are in hospital or not. This is in contrast to extended leave or supervised discharge, which only applies to patients who are being discharged from inpatient care (Gray 2001). Community treatment orders are designed to divert people from possibly having to be admitted as inpatients. In addition, unlike leave, the individual may not have to meet the same criteria for treatment as an inpatient (Gray 2001). Involuntary outpatient treatment or commitment is the preferred term in the USA and covers court‐ordered community treatment (O'Reilly 2001). In this case, a judge, not a healthcare professional, decides on the appropriateness of the order.
The range of different interventions and ways of reporting frequency of use make it difficult to estimate how often compulsory community treatment is used. The situation is complicated by the fact that in some jurisdictions, different forms of community treatment such as extended release and involuntary outpatient treatment exist in parallel. Use varies widely across jurisdictions with the highest rates being recorded in the Australian state of Victoria with a prevalence of (98.8 per 100,000). By contrast, in the USA, involuntary outpatient treatment was only used in approximately three per 100,000 of the general population, 9.8% of new outpatient admissions and 7.1% of continuing outpatients (Ridgely 2001). However, even within the USA, the use of involuntary outpatient treatment varied. For instance, survey data from respondents in 13 states and the District of Columbia indicated they used it commonly or very commonly, while in a further 21 states, use was rare or very rare. Some of this variation may be explained by the use of alternative provisions such as extended release (Torrey 1995). Canadian studies indicate a prevalence of around 5 per 100,000 of the general population (O'Reilly 2000).
How the intervention might work
Studies indicating limited but improved outcomes in terms of readmission to hospital, length of stay, and adherence to treatment have often not controlled for selection bias, variations in treatment, and differing criteria for compulsory treatment in the community (McIvor 1998). In South Carolina, the duration of psychosis was an important determining factor for compulsory treatment in the community (Schied‐Cook 1987). In England and Wales, extended leave has been used as a proxy for compulsory treatment in the community and researchers have identified both recent dangerousness and non‐adherence as determining factors for being placed on this provision (Sensky 1991). Community treatment orders in New South Wales are mostly used for unmarried men with schizophrenia (Vaughan 2000). Involuntary outpatient treatment in many American states does not include the power to give medication forcibly in a community setting, but CTOs in Australasia do. In addition, studies often do not include a control group to take into account the possibility that participants were recruited when particularly disturbed and that subsequent reductions in hospital use may be due to other factors. In one study with a control group of patients not subject to a compulsory treatment order, the control group showed a similar reduction in time in hospital (Bursten 1986).
In England and Wales the extended leave provision of the Mental Health Act has been evaluated as a proxy for the community treatment order, although it does not cover compulsory treatment in the community. One group of researchers found that extended leave improved adherence, reduced time spent in hospital, and reduced levels of dangerousness (Sensky 1991). The introduction of supervised discharge meant that a patient could be conveyed to a designated location for medical treatment, occupation, or training but was still not obliged to accept treatment; this legislative measure has never been formally evaluated.
Why it is important to do this review
Even when studies have used controls, it is difficult to know whether to attribute any improvement to compulsory community treatment, or to the non‐specific effects of increased contact with healthcare professionals (Swartz 1995; Torrey 1995; Geller 1998; Swartz 1999). A research group found that although patients who received prolonged involuntary community treatment had reduced hospital readmissions and bed‐days, it was difficult to separate out how much of the improvement was due to compulsory treatment and how much to intensive community management (Swartz 1999). In the case of non‐randomised designs, a further difficulty is ensuring that the control group is as severely ill as the group placed on a community treatment order (Vaughan 2000).
In summary, it remains unclear whether compulsory community treatment can improve patient outcome or reduce health service use. Given the widespread use of such powers in Australasia, Israel, North America, and the UK, it is important to assess the benefit and potential harms of this type of legislation.
Objectives
-
To compare compulsory community treatment of any form with standard voluntary care.
-
To compare different types of compulsory treatment (see Types of Compulsory community treatment 1.1 in Types of interventions). We did not pool data from different studies unless the types of compulsory community treatment in both arms of trials closely resembled each other.
Methods
Criteria for considering studies for this review
Types of studies
We considered all relevant randomised controlled trials (RCTs), and conducted economic evaluations alongside the included RCTs. We excluded quasi‐randomised studies, such as those allocating by using alternate days of the week. Where trials were described in some way as to suggest or imply that the study was randomised and where the demographic details of each group's participants were similar, we included trials and undertook Sensitivity analysis to the presence or absence of these data.
Types of participants
We included trials of adults with severe mental illnesses (mainly schizophrenia and schizophrenia‐like disorders, bipolar disorder, or depression with psychotic features), however diagnosed, who were managed in a community setting. Substance abuse was not considered to be a severe mental disorder in its own right. However, studies were eligible if they dealt with people with both diagnoses, i.e. people with severe mental illness plus substance abuse.
Types of interventions
1. Comparison I: Compulsory community treatment versus standard care
1.1 Compulsory community treatment
For an intervention to be accepted as compulsory community treatment, it had to be described in the trial using the following terms: community treatment order, involuntary outpatient treatment, involuntary outpatient commitment, supervised community treatment, extended leave, extended release or supervised discharge.
1.2 Standard care
The care that a person would normally receive had they not been included in the research trial, as long as it did not involve compulsory community treatment in any form.
2. Comparison II: Community treatment orders (CTOs) versus supervised discharge
Two different types of compulsory treatment, CTOs and supervised discharge (see Types of interventions 1.1). We did not pool data from different studies unless the compulsory treatments in both arms of the trials closely resembled each other.
Types of outcome measures
We did not plan to report highly specific outcomes (such as, for example, 'sense of safety') because multiple testing of sub‐components of outcome scales carries a risk of type I errors (finding a difference when none was present). Outcomes relating to the process of the interventions themselves, such as number of outpatient visits, were not reported (Wagner 2003). We did not consider loss to follow‐up for study purposes to be the same as loss to follow‐up to clinical services, as consent to treatment is not necessarily the same as consent to participate in a study.
In the original protocol for this study we stated we would group outcomes into short term (within 12 weeks of the start of therapy), medium term (between 13 to 24 weeks after the beginning of therapy), and long term (more than 24 weeks after the start of therapy). Only the Swartz 1999 study reported results of intermediate periods of follow‐up, and these were not from their RCT. We have therefore only been able to report outcomes at 11 to 12 months of follow‐up.
Primary outcomes
1. Health service contact and utilisation
1.1 Admission to hospital
1.2 Bed‐days spent in hospital
2. Social functioning
2.1 Specific ‐ imprisonment, police contact, and arrests
Secondary outcomes
1. Health service contact and utilisation
1.1 Remaining in contact with psychiatric services ‐ leaving the study early
2. Social functioning
2.1 General
2.2 Specific ‐ employment
2.3 Specific ‐ accommodation status
3. Mental state
3.1 General
3.2 Specific ‐ psychopathology
4. Global state
4.1 General
4.2 Specific
5. Quality of life
5.1 General
5.2 Self‐esteem
6. Satisfaction
6.1 Number of needs for care
6.2 Patient satisfaction
6.3 Carer satisfaction
6.4 Perceived coercion
7. Adverse events
7.1 Mortality
8. Economic outcomes
9. 'Summary of findings' table
We used the GRADE approach to interpret findings (Schünemann 2008) and used the GRADE profiler to import data from Review Manager (Revman) to create 'Summary of findings' tables. These tables provide outcome‐specific information concerning the overall quality of evidence from each included study in the comparison, the magnitude of effect of the interventions examined, and the sum of available data on all outcomes we rated as important to patient‐care and decision making. We have been able to add more outcomes to the table and selected the following main outcomes for inclusion in the 'Summary of findings' table.
9.1 Health service and utilisation
9.1.1 Admission/readmission to hospital
9.1.2 Bed‐days in hospital
9.1.3 Compliance with medication
9.1.4 Number with multiple readmissions by 12 months
9.1.4 Days in community before first admission
9.2 Patient level outcomes
9.2.1 Social functioning: trouble with police, homeless
9.2.2 Quality of life: victimisation
9.2.3 Satisfaction with care; perceived coercion
9.2.4 Mental state: Brief Psychiatric Rating Scale
9.2.5 Global state: Global Assessmant of Functioning
Search methods for identification of studies
Electronic searches
1. Cochrane Schizophrenia Group’s Trials Register
The Trials Search Coordinator (TSC) searched the Cochrane Schizophrenia Group’s Registry of Trials (2012 and 8 November 2013) using the following search strategies:
((*treatment* and *order*) or (*involuntar* and *outpatient*) or (*extend* and *leave*) or (*supervis* and *discharg*) or (*compulsor* or *compulsion*)) in Title, Abstract and Keyword Fields of REFERENCE and (Involuntary* or Outpatient*) in Intervention Field of STUDY
The Cochrane Schizophrenia Group’s Registry of Trials is compiled by systematic searches of major resources (including AMED, BIOSIS, CINAHL, EMBASE, MEDLINE, PsycINFO, PubMed, and registries of clinical trials) and their monthly updates, handsearches, grey literature, and conference proceedings (see Group Module). There is no language, date, document type, or publication status limitations for inclusion of records into the register.
For previous searches, see Appendix 1.
Searching other resources
1. Reference searching
We also inspected the references of all identified studies (including those rejected from the review) for more studies.
2. Personal contact
We contacted the first author of each included study and known experts who had published reviews in the field for information regarding unpublished trials and extra data on the published trials.
Data collection and analysis
For previous data collection and analysis please see Appendix 2.
Selection of studies
For this 2013 update review author SK independently inspected citations from the new electronic search and identified relevant abstracts. SK also inspected full articles of the abstracts meeting inclusion criteria. SK carried out the reliability check of all citations from the new electronic search.
Data extraction and management
1. Extraction
We extracted data presented only in graphs and figures whenever possible. When further information was necessary, we contacted authors of studies in order to obtain missing data or for clarification. If studies were multi‐centre, where possible, we extracted data relevant to each component centre separately.
2. Management
2.1 Forms
We extracted data onto standard, simple forms.
2.2 Scale‐derived data
We included continuous data from rating scales only if:
a. the psychometric properties of the measuring instrument have been described in a peer‐reviewed journal (Marshall 2000); and
b. the measuring instrument has not been written or modified by one of the trialists for that particular trial.
Ideally, the measuring instrument should either be i. a self‐report or ii. completed by an independent rater or relative (not the therapist). We realise that this is not often reported clearly; we have noted whether or not this is the case in Description of studies.
2.3 Endpoint versus change data
There are advantages of both endpoint and change data. Change data can remove a component of between‐person variability from the analysis. On the other hand, calculation of change needs two assessments (baseline and endpoint), which can be difficult in unstable and difficult to measure conditions such as schizophrenia. We decided primarily to use endpoint data, and only use change data if the former were not available. We combined endpoint and change data in the analysis as we used mean differences (MD) rather than standardised mean differences (SMD) throughout (Higgins 2011, Chapter 9.4.5.2).
2.4 Skewed data
Continuous data on clinical and social outcomes are often not normally distributed. To avoid the pitfall of applying parametric tests to non‐parametric data, we aimed to apply the following standards to all data before inclusion:
a) standard deviations (SDs) and means are reported in the paper or obtainable from the authors;
b) when a scale starts from the finite number zero, the SD, when multiplied by two, is less than the mean (as otherwise the mean is unlikely to be an appropriate measure of the centre of the distribution (Altman 1996));
c) if a scale started from a positive value (such as the Positive and Negative Syndrome Scale (PANSS, Kay 1986), which can have values from 30 to 210), we planned to modify the calculation described above to take the scale starting point into account. In these cases skew is present if 2 SD > (S‐S min), where S is the mean score and S min is the minimum score.
Endpoint scores on scales often have a finite start and end point and these rules can be applied. We planned to enter skewed endpoint data from studies of fewer than 200 participants in additional tables rather than into an analysis. Skewed data pose less of a problem when looking at mean if the sample size is large; we entered such endpoint data into syntheses.
When continuous data are presented on a scale that includes a possibility of negative values (such as change data), it is difficult to tell whether data are skewed or not. We therefore entered skewed change data into analyses regardless of size of study.
2.5 Common measure
To facilitate comparison between trials, we intended to convert variables that can be reported in different metrics, such as days in hospital (mean days per year, per week or per month) to a common metric (e.g. mean days per month).
2.6 Conversion of continuous to binary
Where possible, we made efforts to convert outcome measures to dichotomous data. This can be done by identifying cut‐off points on rating scales and dividing participants accordingly into 'clinically improved' or 'not clinically improved'. It is generally assumed that if there is a 50% reduction in a scale‐derived score such as the Brief Psychiatric Rating Scale (BPRS, Overall 1962) or the Positive and Negative Syndrome Scale (PANSS, Kay 1986), this could be considered as a clinically significant response (Leucht 2005; Leucht 2005a). If data based on these thresholds were not available, we used the primary cut‐off presented by the original authors.
2.7 Direction of graphs
Where possible, we entered data in such a way that the area to the left of the line of no effect indicated a favourable outcome for compulsory community and involuntary outpatient treatment. Where keeping to this made it impossible to avoid outcome titles with clumsy double‐negatives (e.g. 'Not improved'), we reported data where the left of the line indicates an unfavourable outcome. This was noted in the relevant graphs.
Assessment of risk of bias in included studies
Review author SK worked independently by using criteria described in the Cochrane Handbook for Systematic Reviews of Interventions (Higgins 2011) to assess trial quality. This new set of criteria is based on evidence of associations between overestimate of effect and high risk of bias of the article such as sequence generation, allocation concealment, blinding, incomplete outcome data and selective reporting.
Where inadequate details of randomisation and other characteristics of trials were provided, we contacted authors of the studies in order to obtain additional information.
We have noted the level of risk of bias in both the text of the review and in the summary of findings Table for the main comparison.
Measures of treatment effect
1. Binary data
For binary outcomes we calculated a standard estimation of the risk ratio (RR) and its 95% confidence interval (CI). It has been shown that RR is more intuitive (Boissel 1999) than odds ratios and that odds ratios tend to be interpreted as RR by clinicians (Deeks 2000). The Number Needed to Treat/Harm (NNT/H) statistic is intuitively attractive to clinicians but needs to be interpreted with caution (Hutton 2009). For binary data presented in the 'Summary of findings' table/s, where possible, we calculated illustrative comparative risks.
2. Continuous data
For continuous outcomes we estimated mean difference (MD) between groups. We preferred not to calculate effect size measures (standardised mean difference (SMD)). However, if scales of very considerable similarity were used, we presumed there was a small difference in measurement, calculated effect size, and transformed the effect back to the units of one or more of the specific instruments.
Unit of analysis issues
1. Cluster trials
Studies increasingly employ 'cluster randomisation' (such as randomisation by clinician or practice), but analysis and pooling of clustered data poses problems. Authors often fail to account for intra‐class correlation in clustered studies, leading to a 'unit of analysis' error (Divine 1992) whereby P values are spuriously low, confidence intervals unduly narrow and statistical significance overestimated. This causes type I errors (Bland 1997; Gulliford 1999).
Cluster trials were eligible for inclusion, however, the three studies identified in our review were randomised by participant, not by clinician or practice. Had we included cluster trials, where clustering was not accounted for in primary studies, we planned to present data in a table, with a (*) symbol to indicate the presence of a probable unit of analysis error. In subsequent versions of this review, and if relevant, we will seek to contact first authors of studies to obtain intra‐class correlation coefficients (ICCs) for their clustered data and to adjust for this by using accepted methods (Gulliford 1999). Where clustering has been incorporated into the analysis of primary studies, we will present these data as if from a non‐cluster randomised study, but adjust for the clustering effect.
We have sought statistical advice and have been advised that if the binary data are presented in a report, they should be divided by a 'design effect'. This is calculated using the mean number of participants per cluster (m) and the ICC [Design effect = 1+(m‐1)*ICC] (Donner 2002). If the ICC is not reported it will be assumed to be 0.1 (Ukoumunne 1999).
If cluster studies are appropriately analysed taking into account ICCs and relevant data documented in the report, data can be synthesised with other studies using the generic inverse variance technique.
2. Cross‐over trials
A major concern of cross‐over trials is the carry‐over effect. It occurs if an effect (e.g. pharmacological, physiological or psychological) of the treatment in the first phase is carried over to the second phase. As a consequence, on entry to the second phase the participants can differ systematically from their initial state despite a wash‐out phase. For the same reason cross‐over trials are not appropriate if the condition of interest is unstable (Elbourne 2002). As both effects are very likely in severe mental illness, had we included cross‐over trials, we planned to use only the data of the first phase of any cross‐over studies.
3. Studies with multiple treatment groups
If we had included any studies that involved more than two treatment arms, if relevant, we planned to present the additional treatment arms in comparisons. If data were binary, we would simply have added these and combined them within the two‐by‐two table. If data were continuous, we would have combined data following the formula in section 7.7.3.8 (Combining groups) of the Cochrane Handbook for Systemic reviews of Interventions (Higgins 2011). Where additional treatment arms were not relevant, we would not have presented these data.
Dealing with missing data
1. Overall loss of credibility
At some degree of loss of follow‐up, data must lose credibility (Xia 2009). We chose that, for any particular outcome, should more than 50% of data be unaccounted for, we would not reproduce these data or use them within analyses. If, however, more than 50% of those in one arm of a study were lost, but the total loss was less than 50%, we addressed this within the 'Summary of findings' table/s by down‐rating quality. Finally, we also downgraded quality within the 'Summary of findings' table/s should loss be 25% to 50% in total.
2. Binary
In the case where attrition for a binary outcome was between 0% and 50% and where these data were not clearly described, we presented data on a 'once‐randomised‐always‐analyse' basis (an intention‐to‐treat analysis). Those leaving the study early are all assumed to have the same rates of negative outcome as those who completed, with the exception of the outcome of death and adverse effects. For these outcomes, the rate of those who stay in the study ‐ in that particular arm of the trial ‐ were used for those who did not. We undertook a sensitivity analysis to test how prone the primary outcomes were to change when data only from people who completed the study to that point were compared to the intention‐to‐treat analysis using the above assumptions.
3. Continuous
3.1 Attrition
In the case where attrition for a continuous outcome was between 0% and 50%, and data only from people who completed the study to that point were reported, we presented and used these data.
3.2 Standard deviations
If standard deviations (SDs) were not reported, we first tried to obtain the missing values from the authors. If not available, where there were missing measures of variance for continuous data, but an exact standard error (SE) and confidence intervals available for group means, and either a P value or T value available for differences in mean, we calculated them according to the rules described in the Cochrane Handbook for Systemic reviews of Interventions (Higgins 2011): When only the standard error (SE) was reported, SDs were calculated by the formula SD = SE * square root (n). Chapters 7.7.3 and 16.1.3 of the Cochrane Handbook for Systemic reviews of Interventions (Higgins 2011) present detailed formulae for estimating SDs from P values, T or F values, confidence intervals, ranges or other statistics. If these formulae did not apply, we calculated the SDs according to a validated imputation method which is based on the SDs of the other included studies (Furukawa 2006). Although some of these imputation strategies can introduce error, the alternative was to exclude a given study’s outcome and thus to lose information. We nevertheless examined the validity of the imputations in a sensitivity analysis excluding imputed values.
3.3 Last observation carried forward
We anticipated that in some studies the method of last observation carried forward (LOCF) would be employed within the study report. As with all methods of imputation to deal with missing data, LOCF introduces uncertainty about the reliability of the results (Leucht 2007). Therefore, we intended where LOCF data were used in the trial, if less than 50% of the data have been assumed, we would reproduce these data and indicate that they were the product of LOCF assumptions.
Assessment of heterogeneity
1. Clinical heterogeneity
We considered all included studies initially, without seeing comparison data, to judge clinical heterogeneity. We simply inspected all studies for clearly outlying people or situations which we had not predicted would arise. When such situations or participant groups arose, we fully discussed these.
2. Methodological heterogeneity
We considered all included studies initially, without seeing comparison data, to judge methodological heterogeneity. We simply inspected all studies for clearly outlying methods which we had not predicted would arise. When such methodological outliers arose, we fully discussed these.
3. Statistical heterogeneity
3.1 Visual inspection
We visually inspected graphs to investigate the possibility of statistical heterogeneity.
3.2 Employing the I2 statistic
We investigated heterogeneity between studies by considering the I2 method alongside the Chi2 P value. The I2 provides an estimate of the percentage of inconsistency thought to be due to chance (Higgins 2003). The importance of the observed value of I2 depends on i. magnitude and direction of effects and ii. strength of evidence for heterogeneity (e.g. P value from Chi2 test, or a confidence interval for I2). An I2 estimate greater than or equal to around 50% accompanied by a statistically significant Chi2 statistic was interpreted as evidence of substantial levels of heterogeneity (Higgins 2011). When substantial levels of heterogeneity were found in the primary outcome, we explored reasons for heterogeneity (Subgroup analysis and investigation of heterogeneity).
Assessment of reporting biases
Reporting biases arise when the dissemination of research findings is influenced by the nature and direction of results (Egger 1997). These are described in Section 10 of the Handbook (Higgins 2011). We are aware that funnel plots may be useful in investigating reporting biases but are of limited power to detect small‐study effects. Only three trials were included in this version of the review. We planned to use funnel plots for outcomes where there were 10 or more studies, or where all studies were of similar sizes. In other cases, where funnel plots are possible, we would have sought statistical advice in their interpretation.
Data synthesis
We understand that there is no closed argument for preference for use of fixed‐effect or random‐effects models. The random‐effects method incorporates an assumption that the different studies are estimating different, yet related, intervention effects. This often seems to be true to us and the random‐effects model takes into account differences between studies even if there is no statistically significant heterogeneity. There is, however, a disadvantage to the random‐effects model: it puts added weight onto small studies which often are the most biased ones. Depending on the direction of effect, these studies can either inflate or deflate the effect size. We chose the fixed‐effect model for all analyses given the similarity of patients and interventions in each comparison. The reader is, however, able to choose to inspect the data using the random‐effects model.
Subgroup analysis and investigation of heterogeneity
1. Subgroup analyses ‐ only primary outcomes
1.1 Clinical state, stage or problem
We had hoped to investigate subgroups including different variations of types of intervention (e.g. CTOs, involuntary outpatient treatment, involuntary outpatient commitment (OPC) or supervised discharge). Because there were never more than two studies for each outcome, we could not undertake such sensitivity analyses as we had hoped.
2. Investigation of heterogeneity
If inconsistency was high, we have reported this. First, we investigated whether data had been entered correctly. Second, if data were correct, we visually inspected the graph and successively removed outlying studies to see if homogeneity was restored. For this review we had decided that should this occur with data contributing to the summary finding of no more than around 10% of the total weighting, we would present data. If not, then we would not pool data but would discuss issues. We know of no supporting research for this 10% cut‐off, but we used prediction intervals as an alternative to this unsatisfactory state.
Sensitivity analysis
We applied all sensitivity analyses to the primary outcomes of this review.
1. Implication of randomisation
We aimed to include trials in a sensitivity analysis if they were described in some way so as to imply randomisation. For the primary outcomes we included these studies and if there was no substantive difference when the implied randomised studies were added to those with a better description of randomisation, we entered all data from these studies.
2. Assumptions for lost binary data
Where assumptions had to be made regarding people lost to follow‐up (see Dealing with missing data), we compared the findings of the primary outcomes when we used our assumption/s and when we used data only from people who completed the study to that point. If there was a substantial difference, we reported results and discussed them but continued to employ our assumption.
Where assumptions had to be made regarding missing SDs data (see Dealing with missing data), we compared the findings of the primary outcomes when we used our assumption/s and when we used data only from people who completed the study to that point. A sensitivity analysis was undertaken to test how prone results are to change when completer‐only data only are compared to the imputed data using the above assumption. If there was a substantial difference, we reported results and discussed them but continued to employ our assumption
3. Risk of bias
We analysed the effects of excluding trials that were judged to be at high risk of bias across one or more of the domains of randomisation (implied as randomised with no further details available): allocation concealment, blinding and outcome reporting for the meta‐analysis of the primary outcome. If the exclusion of trials at high risk of bias did not substantially alter the direction of effect or the precision of the effect estimates, then we included data from these trials in the analysis.
4. Imputed values
We also planned to undertake a sensitivity analysis to assess the effects of including data from trials where we used imputed values for ICC in calculating the design effect in cluster randomised trials but this was not required for the current version of the review.
If we noted substantial differences in the direction or precision of effect estimates in any of the sensitivity analyses listed above, we did not pool data from the excluded trials with the other trials contributing to the outcome, but presented them separately.
Results
Description of studies
Also see Characteristics of included studies and Characteristics of excluded studies
Results of the search
Figure 1 gives details of our search results. We found 74 papers that were potentially relevant in our original search. Later searches identified six further publications, Of these, we excluded 65 records because they did not meet our inclusion criteria, lacked relevant data, or were evaluating different types of treatment such as joint crisis plans. This left 15 publications covering three studies (Figure 1).

Study flow diagram of trial selection.
Included studies
We included three studies involving 752 participants: two studies from the USA comparing outpatient commitment (OPC) with entirely voluntary treatment and one UK study, the Oxford Community Treatment Order Evaluation Trial (OCTET) comparing two types of compulsory community treatment interspaced with voluntary care. OCTET randomised patients discharged from hospital to an experimental group (community treatment order (CTO)) or a control group (extended leave under section 17 of the Mental Health Act) and compared their outcomes at 12 months (Burns 2013). “Leave of absence” under Section 17 of the Act allows patients to leave hospital for some hours or days, or even exceptionally weeks, while still subject to recall.
Excluded studies
We excluded 65 publications. All but two were excluded as they were not RCTs, did not contain primary data, or were reviews of intervention studies. Of the two excluded RCTs, one trial was excluded (Wagner 2003) as it reported outcomes inherent to the process of OPC, namely the number of outpatient visits for medication review, counselling and case management. The other was a study of joint crisis plans (Thornicroft 2013).
Risk of bias in included studies
Allocation
Steadman 2001, the New York study, did describe randomisation, using a random number list to identify assignment to either the intervention or control group. In this study, a random number list was generated by computer, which then split 200 numbers between one group and the other. The printed list was maintained in the research team's office in a locked file. When the treatment team had completed their treatment plan, they called the research team who checked the computer list to see whether the client was to be assigned to the experimental or comparison group. In the OCTET study, consenting participants were randomly assigned (ratio 1:1) by an independent statistician to be discharged from hospital either on CTO or Section 17 leave (Burns 2013). Randomisation used random permuted blocks with lengths of two, four, and six, and stratified for sex (male or female), schizophrenic diagnosis (yes or no) and duration of illness (< 2 years or ≥ 2 years). Assignments were enclosed in sequentially numbered, opaque, sealed envelopes and stored by a researcher independent to the trial team. The details of the sequence remained unknown to all members of the trial team until recruitment, data collection, and analyses were completed. Randomisation took place after consent was obtained and the baseline interview was done. The envelope was opened on the day of the interview by the independent researcher after recording the participant’s trial identification number on the envelope. She then communicated the randomised allocation to the recruiting researcher by telephone. Both studies were rated as being of low risk (Figure 2; Figure 3). Swartz 1999 was stated to be randomised but did not provide a description of the randomisation method and was therefore rated unclear (Figure 2; Figure 3).
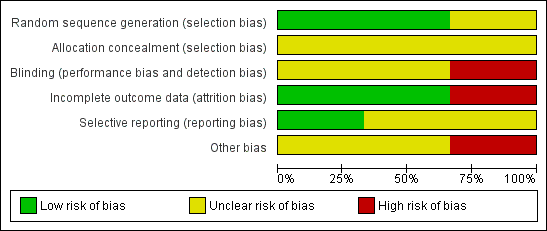
'Risk of bias' graph: review authors' judgements about each risk of bias item presented as percentages across all included studies

'Risk of bias' summary: review authors' judgements about each risk of bias item for each included study
Blinding
All three studies used self‐report measures for at least some of the outcomes, which are effectively self‐blinding so although blindness was not mentioned in two of the studies (Steadman 2001; Swartz 1999), we rated risk of bias for blinding as unclear. In Burns 2013 the study involved allocation to two different types of legal status. It was therefore both impossible and unlawful to mask research assistants, treating clinicians or patients, thus we rated this as high risk.
Incomplete outcome data
Attrition rates for Steadman 2001 were 45%. In the case of OCTET, follow‐up for the main outcomes reached 100% although data on psychiatric symptoms and the Global Assessment of Functioning Scale (GAF) were only available on 70% of the sample. Reporting on numbers leaving the Swartz 1999 study early was sometimes unclear.
Selective reporting
We could not use continuous data for several outcomes, as no variance was reported. In Swartz 1999 data from randomised and non‐randomised analyses were sometimes amalgamated and reported percentages rather than absolute numbers of people who had been followed up. We contacted the authors who kindly confirmed that, at follow‐up, there were 114 people in the control group, 102 in the court‐ordered outpatient commitment (OPC) group and 46 who were not randomised. Similarly, the authors of the Steadman 2001 study kindly supplied the additional data for an intention‐to‐treat analysis of their paper. Our overall rating was 'unclear'.
Other potential sources of bias
No conflicts of interest were reported in any of the studies. A potential source of bias in the OCTET study was that participants were only included if they were equally suitable for a relatively short Section 17 or CTO. Patients who might have especially benefited from a CTO may therefore have been excluded. A further potential source of bias in the same study was allowing clinicians to make decisions independent of initial randomisation—whereby 40 participants (25%) allocated to Section 17 were subsequently placed on a CTO during the study and 35 patients randomised to CTOs (22%) did not actually receive the intervention. A sensitivity analysis to remove these protocol violations may, in turn, have left the study underpowered and not removed the possibility that Section 17 patients swapped to a CTO might have been more severely ill than those remaining on Section 17 as per the protocol. There is uncertainty concerning the control condition. Although the length of initial compulsory outpatient treatment differed widely between the two groups (medians of 183 versus eight days), Section 17 patients averaged three months on some form of compulsory treatment. On the other hand, an alternative interpretation of this finding is that the controls still spent the majority of the study in voluntary treatment. A final issue is generalisability. Around 20% of the participants were ineligible or refused to take part. These people may have been the most unwell or lacking in insight, and therefore, the ones most likely to benefit from CTOs.
Effects of interventions
See: Summary of findings for the main comparison COMPULSORY COMMUNITY TREATMENT compared with STANDARD CARE for people with severe mental disorders; Summary of findings 2 COMMUNITY TREATMENT ORDERS compared with SECTION 17 for people with severe mental disorders
COMPARISON 1: COMPULSORY COMMUNITY TREATMENT versus STANDARD CARE
Results are presented as fixed‐effect risk ratios (RR) with 95% confidence intervals (CIs) or fixed‐effect mean difference (MD) with 95% CIs.
1.1 Health service outcomes: 1. Readmission to hospital ‐ by 11‐12 months
For this outcome we found two relevant trials (n = 416). There was no significant difference between compulsory community treatment and standard care (RR 0.98 CI 0.79 to 1.21, Analysis 1.1).
1.2 Health service outcomes: 2. Compliance with medication ‐ by 11‐12 months
For this outcome we found two relevant trials (n = 416). There was no significant difference between compulsory community treatment and standard care (RR 0.99 CI 0.83 to 1.19, Analysis 1.2).
1.3 Patient level outcomes: 1a. Social functioning: trouble with police ‐ by 11‐12 months
1.3.1 at least one arrest
In this subgroup we found two relevant trials (n = 416). There was no significant difference between compulsory community treatment and standard care (RR 0.97 CI 0.62 to 1.52, Analysis 1.3).
1.3.2 ever arrested/picked up by police for violence against a person
In this subgroup we found two relevant trials (n = 416). There was no significant difference between compulsory community treatment and standard care (RR 0.82 CI 0.56 to 1.21, Analysis 1.3).
1.4 Patient level outcomes: 1b. Social functioning: homeless ‐ by 11‐12 months
For this outcome we found two relevant trials (n = 416). There was no significant difference between compulsory community treatment and standard care (RR 0.67 CI 0.39 to 1.15, Analysis 1.4).
1.5 Patient level outcomes: 2. Quality of life: victimisation ‐ by 11‐12 months
For this outcome we only found one relevant trial (n = 264) (Swartz 1999). There was a statistically significant difference between compulsory community treatment and standard care (RR 0.50 CI 0.31 to 0.80, Analysis 1.5).
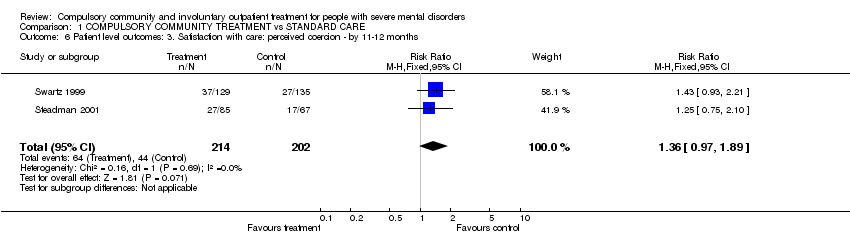
1.6 Patient level outcomes: 3. Satisfaction with care: perceived coercion ‐ by 11‐12 months
For this outcome we found two relevant trials (n = 416). There was no significant difference between compulsory community treatment and standard care (RR 1.36 CI 0.97 to 1.89, Analysis 1.6).
1.7 Economics
We identified no directly relevant costings.
1.8 Numbers needed to treat
In terms of numbers needed to treat (NNT), compared to placebo, it would take 85 OPC orders to prevent one readmission, 27 to prevent one episode of homelessness and 238 to prevent one arrest. The NNT for the reduction of victimisation was lower at six (CI 6 to 6.5).
COMPARISON 2: COMMUNITY TREATMENT ORDERS versus INTERMITTENT SUPERVISED DISCHARGE (SECTION 17)
2.1 Health service outcomes: 1. Readmission to hospital ‐ by 12 months
For this outcome we only found one relevant trial (n = 333) (Burns 2013). There was no significant difference between community treatment orders and section 17 (RR 0.99 CI 0.74 to 1.32, Analysis 2.1). It was not possible to calculate the NNT/H as the proportions of readmissions in both groups were identical (36%).
2.2 Health service outcomes: 2.Hospital bed‐days
For this outcome we only found one relevant trial (n = 333) (Burns 2013). There was no significant difference between community treatment orders and section 17 (MD ‐8.70 CI ‐30.88 to 13.48, Analysis 2.2).
2.3 Health service outcomes: 3. Number of readmissions by 12 months
For this outcome we only found one relevant trial (n = 119) (Burns 2013). There was a statistically significant difference between community treatment orders and section 17 (MD ‐0.20 CI ‐0.45 to 0.05, Analysis 2.3).
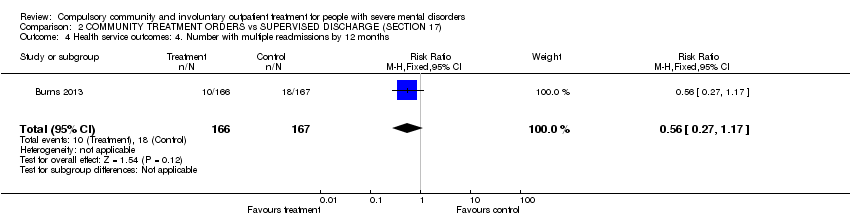
2.4 Health service outcomes: 4. Number with multiple readmissions by 12 months
For this outcome we only found one relevant trial (n = 333) (Burns 2013). There was no significant difference between community treatment orders and section 17 (RR 0.56 CI 0.27 to 1.17, Analysis 2.4).
2.5 Days in community till first admission
For this outcome we only found one relevant trial (n = 333) (Burns 2013). There was no significant difference between community treatment orders and section 17 (MD 5.00 CI ‐21.74 to 31.74, Analysis 2.5).
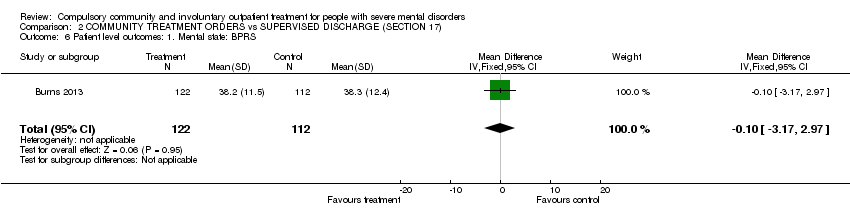
2.6 Patient level outcomes: Brief Psychiatric Rating Scale (BPRS)
For this outcome we only found one relevant trial (n = 234) (Burns 2013). There was no significant difference between community treatment orders and section 17 (MD ‐0.10 CI ‐3.17 to 2.97, Analysis 2.6).
2.7 Patient level outcomes: Global Assessment of Functioning Scale (GAF)
For this outcome we only found one relevant trial (n = 237) (Burns 2013). There was no significant difference between community treatment orders and section 17 (MD ‐0.70 CI ‐3.91 to 2.51, Analysis 2.7).
2.8 Economics
We identified no directly relevant costings.
2.9 Adverse events
There were no data on this outcome.
Discussion
In spite of the widespread use of compulsory community treatment and the continued controversy as to its effectiveness, we were struck by the limited number of studies that have been conducted in this area. We have therefore attempted to draw modest conclusions, based on available evidence, and to highlight areas requiring further study, rather than draw firm conclusions that may not be based on evidence of high quality.
This review revealed little evidence for the effectiveness of compulsory community treatment in any of the main outcome indices: health service use, costs, social functioning, mental state, quality of life or satisfaction with care. We were only able to establish a statistically significant effect for one outcome, social functioning (victimisation).
Although we identified 15 papers, these represented only three trials. Two of these were of court‐ordered 'Outpatient Commitment' (OPC) in the USA with limited generalisability to jurisdictions where compulsory community treatment is ordered by clinicians. The third trial, from the UK, was a study of clinician‐initiated, rather than court‐ordered treatment as in the American RCTs and thus, more relevant to other jurisdictions such as Australia, Canada and New Zealand. However, there is controversy as to whether this was a comparison of a compulsory intervention with voluntary treatment, or was a comparison of two different types of compulsory treatment. Problems common to all three studies included relatively small numbers of participants and questions concerning bias. This illustrates the difficult, but not impossible, task of using trial methods to study the effect of such legislation.
In the case of the North Carolina study (Swartz 1999), the study was supplemented by follow‐up of an additional non‐randomised group of patients with a recent history of violence who were also placed on OPC. It was sometimes difficult to separate the results of the randomised trials from the non‐randomised study. In the case of the New York study (Steadman 2001), there was a relatively small number of participants and the suggestion that members of the control group and their case managers thought that they were actually on OPC (NASMHPD 2001). These factors would minimise any effect of the intervention. In addition to the question around the voluntary or compulsory nature of the controls in the OCTET study, the other major issue was that a quarter of patients did not receive the intervention to which they were initially randomised. This was because treating physicians were able to make clinical decisions irrespective of initial randomisation, and was necessary for the trial to be lawful.
Summary of main results
All three studies were of patients in community settings who were followed up over 12 months. Two trials from the USA were of court‐ordered 'Outpatient Commitment' (OPC) compared with voluntary community treatment. The third compared clinician‐initiated community treatment orders (CTOs) with another type of supervised discharge in England.
Comparison 1. Compulsory community treatment versus standard care
1.1 Health service outcomes
Only data for two health service outcomes (readmission to hospital and compliance with medication) were usable. In both cases there were no differences between groups. By one year, people were no more likely to be readmitted to hospital if they were placed on OPC than if they had received standard care. They were also just as likely to comply with medication. It should be noted, however, that these results are based on two studies only and in one (Steadman 2001) attrition rates were 45%, so no firm conclusions can be made.
1.2 Patient level outcomes
Four patient level outcomes (trouble with the police, homelessness, coercion, and victimisation) were presented.
By one year, the number of arrests by police were similar for both groups and people in the compulsory community treatment group did not commit any more acts of violence than those in standard care. A problem with the data in this area was a possibility of selection bias as patients with a history of violence were explicitly excluded from both trials. This limits their applicability as recent dangerousness, particularly violence against others, is often the reason for compulsory treatment in hospital or the community (Sensky 1991; Lansing 1997). There is also a risk of bias when outcome data are not assessed blind to group status and the results of people who were not randomised or post hoc analyses are included in papers. The number of people who were homeless by one year was also similar in both groups.
The only significant benefit from compulsory community treatment was for victimisation. People on compulsory community treatment were less likely to be victims of a violent or non‐violent crime by one year in the North Carolina study (Swartz 1999).
In terms of possible adverse effects of compulsory community treatment, perceived coercion was higher in the North Carolina study (Swartz 1999), but not in the one from New York (Steadman 2001). Combining the findings from both studies in a meta‐analysis gave a non‐significant result.
2. Comparison II. Compulsory community treatment versus intermittent supervised discharge (Section 17)
1.1 Health service outcomes
There were no differences between patients on CTO and supervised discharge in terms of readmissions, bed‐days or survival in the community.
1.2 Patient‐level outcomes
Similarly there were no differences between the two groups in terms of psychiatric symptoms or social functioning as measured by standardised instruments.
Overall completeness and applicability of evidence
Two trials were of OPC in the USA. This is a court‐ordered compulsory treatment plan and the findings may not be applicable to other jurisdictions where compulsory community treatment is initiated by clinicians. In addition, both trials explicitly excluded patients with a history of violence. Although understandable from an ethical and legal standpoint, this limits applicability, as recent dangerousness, particularly violence against others, is often the reason for compulsory treatment in hospital or the community.
The OCTET study was a comparison of two types of clinician‐ordered community treatment, CTOs and supervised discharge in England. This may be more applicable to other jurisdictions. However, around 20% of the sample were ineligible or refused to take part. These people may have been the most unwell or particularly lacking in insight, and therefore the ones most likely to benefit from CTOs
Quality of the evidence
This is a difficult area to research using randomised controlled trials (RCTs) and so all three studies contained a number of potential biases. OCTET met three out of the seven criteria of The Cochrane Collaboration’s tool for assessing risk of bias, the others only one, the majority being rated unclear. There was no difference in these ratings by outcome. One issue in all three RCTS was selection and blindness bias and consequent applicability to everyday care. Depending on the study, patients with a history of dangerousness were excluded and around 20% of eligible patients lacked capacity to consent to the study, or refused to take part. This limits their applicability as recent dangerousness, particularly violence against others, is often the reason for compulsory treatment in hospital or the community (Sensky 1991; Lansing 1997). Only two of the three studies describe the process of randomisation in detail (Steadman 2001; Burns 2013 ) There is also a risk of bias when outcome data are not assessed blind to group status and the results of people who were not randomised or post hoc analyses are included in papers. All three studies used included intention‐to‐treat analyses for all (Swartz 1999; Burns 2013), or at least some of the outcomes of interest (Steadman 2001).
In the case of the North Carolina study (Swartz 1999), it was sometimes difficult to separate the results of the randomised trial from those of the follow‐up of an additional non‐randomised group of patients with a recent history of violence who were also placed on OPC. In the case of the New York study (Steadman 2001), there were a relatively small number of participants and the suggestion that members of the control group and their case managers thought that they were actually on OPC (NASMHPD 2001). These factors would minimise any effect of the intervention
There were also fewer data on psychosocial outcomes as measured by standardised instruments.
All these issues illustrate the difficult, but not impossible, task of using trial methods to study the effect of such legislation.
Potential biases in the review process
1. Post hoc decisions
We changed the level of acceptable loss to follow‐up. We felt that, in retrospect, the cut‐off of 35% was too restricting and changed this to 50% (see above). We also added an additional comparison of two different types of compulsory community treatment. We took both decisions in the light of only finding three studies. We have tried to present data in a way as to allow the reader to evaluate the effects of doing this.
2. Authors' area of interest
The two authors of this review were also authors of some of the papers considered for inclusion (Preston 2002; Kisely 2004; Kisely 2005; Kisely 2006; Kisely 2007a). We excluded all of these papers. It is possible that we, through detailed knowledge of these studies excluded them, but for others, where our knowledge is not first hand, we allowed inclusion.
Agreements and disagreements with other studies or reviews
Our findings are consistent with two other independent reviews of compulsory community treatment, which have all found little evidence that compulsory community treatment have a positive effect on outcomes such as hospital admissions, length of stay or compliance with medication (Ridgely 2001; Churchill 2007).

Study flow diagram of trial selection.

'Risk of bias' graph: review authors' judgements about each risk of bias item presented as percentages across all included studies
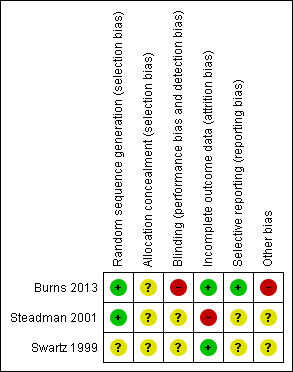
'Risk of bias' summary: review authors' judgements about each risk of bias item for each included study

Comparison 1 COMPULSORY COMMUNITY TREATMENT vs STANDARD CARE, Outcome 1 Health service outcomes: 1. Readmission to hospital ‐ by 11‐12 months.

Comparison 1 COMPULSORY COMMUNITY TREATMENT vs STANDARD CARE, Outcome 2 Health service outcomes: 2. Compliance with medication ‐ by 11‐12 months.

Comparison 1 COMPULSORY COMMUNITY TREATMENT vs STANDARD CARE, Outcome 3 Patient level outcomes: 1a. Social functioning: trouble with police ‐ by 11‐12 months.

Comparison 1 COMPULSORY COMMUNITY TREATMENT vs STANDARD CARE, Outcome 4 Patient level outcomes: 1b. Social functioning: homeless ‐ by 11‐12 months.

Comparison 1 COMPULSORY COMMUNITY TREATMENT vs STANDARD CARE, Outcome 5 Patient level outcomes: 2. Quality of life: victimisation ‐ by 11‐12 months.
Comparison 1 COMPULSORY COMMUNITY TREATMENT vs STANDARD CARE, Outcome 6 Patient level outcomes: 3. Satisfaction with care: perceived coercion ‐ by 11‐12 months.

Comparison 2 COMMUNITY TREATMENT ORDERS vs SUPERVISED DISCHARGE (SECTION 17), Outcome 1 Health service outcomes: 1. Readmission to hospital ‐ by 12 months.

Comparison 2 COMMUNITY TREATMENT ORDERS vs SUPERVISED DISCHARGE (SECTION 17), Outcome 2 Health service outcomes: 2. Hospital bed‐days.

Comparison 2 COMMUNITY TREATMENT ORDERS vs SUPERVISED DISCHARGE (SECTION 17), Outcome 3 Health service outcomes: 3. Number of readmissions by 12 months.
Comparison 2 COMMUNITY TREATMENT ORDERS vs SUPERVISED DISCHARGE (SECTION 17), Outcome 4 Health service outcomes: 4. Number with multiple readmissions by 12 months.

Comparison 2 COMMUNITY TREATMENT ORDERS vs SUPERVISED DISCHARGE (SECTION 17), Outcome 5 Health service outcomes: 5. Days in community till first admission.
Comparison 2 COMMUNITY TREATMENT ORDERS vs SUPERVISED DISCHARGE (SECTION 17), Outcome 6 Patient level outcomes: 1. Mental state: BPRS.

Comparison 2 COMMUNITY TREATMENT ORDERS vs SUPERVISED DISCHARGE (SECTION 17), Outcome 7 Patient level outcomes: 2. Global state: GAF.
| COMPULSORY COMMUNITY TREATMENT compared with STANDARD CARE for people with severe mental disorders | ||||||
| Patient or population: people with severe mental disorders | ||||||
| Outcomes | Illustrative comparative risks* (95% CI) | Relative effect | No of Participants | Quality of the evidence | Comments | |
| Assumed risk | Corresponding risk | |||||
| STANDARD CARE | COMPULSORY COMMUNITY TREATMENT | |||||
| Health service outcomes: 1. Readmission to hospital ‐ by 11‐12 months | Study population | RR 0.98 | 416 | ⊕⊕⊝⊝ | ||
| 460 per 1000 | 451 per 1000 | |||||
| Medium risk population | ||||||
| 446 per 1000 | 437 per 1000 | |||||
| Health service outcomes: 2. Compliance with medication ‐ by 11‐12 months | Study population | RR 0.99 | 416 | ⊕⊕⊝⊝ | ||
| 505 per 1000 | 500 per 1000 | |||||
| Medium risk population | ||||||
| 554 per 1000 | 548 per 1000 | |||||
| Patient level outcomes: 1a. Social functioning: trouble with police ‐ by 11‐12 months ‐ at least one arrest | Study population | RR 0.97 | 416 | ⊕⊕⊝⊝ | ||
| 158 per 1000 | 153 per 1000 | |||||
| Medium risk population | ||||||
| 156 per 1000 | 151 per 1000 | |||||
| Patient level outcomes: 1a. Social functioning: trouble with police ‐ by 11‐12 months ‐ ever arrested/picked up by police for violence against a person | Study population | RR 0.82 | 416 | ⊕⊕⊝⊝ | ||
| 208 per 1000 | 171 per 1000 | |||||
| Medium risk population | ||||||
| 156 per 1000 | 128 per 1000 | |||||
| Patient level outcomes: 1b. Social functioning: homeless ‐ by 11‐12 months | Study population | RR 0.67 | 416 | ⊕⊕⊝⊝ | ||
| 134 per 1000 | 90 per 1000 | |||||
| Medium risk population | ||||||
| 145 per 1000 | 97 per 1000 | |||||
| Patient level outcomes: 2. Quality of life: victimisation ‐ by 11‐12 months | Study population | RR 0.5 | 264 | ⊕⊕⊝⊝ | ||
| 311 per 1000 | 156 per 1000 | |||||
| Medium risk population | ||||||
| 311 per 1000 | 156 per 1000 | |||||
| Patient level outcomes: 3. Satisfaction with care/adverse events: perceived coercion ‐ by 11‐12 months | Study population | RR 1.36 | 416 | ⊕⊕⊝⊝ | ||
| 218 per 1000 | 296 per 1000 | |||||
| Medium risk population | ||||||
| 227 per 1000 | 309 per 1000 | |||||
| *The basis for the assumed risk (e.g. the median control group risk across studies) is provided in footnotes. The corresponding risk (and its 95% confidence interval) is based on the assumed risk in the comparison group and the relative effect of the intervention (and its 95% CI). | ||||||
| GRADE Working Group grades of evidence | ||||||
| 1 Allocation concealment and blinding unclear | ||||||
| COMMUNITY TREATMENT ORDERS compared with SECTION 17 for people with severe mental disorders | ||||||
| Patient or population: people with severe mental disorders | ||||||
| Outcomes | Illustrative comparative risks* (95% CI) | Relative effect | No of Participants | Quality of the evidence | Comments | |
| Assumed risk | Corresponding risk | |||||
| SECTION 17 | COMMUNITY TREATMENT ORDERS | |||||
| Health service outcomes: 1. Readmission to hospital ‐ by 12 months | Study population | RR 0.99 | 333 | ⊕⊕⊕⊝ | ||
| 359 per 1000 | 356 per 1000 | |||||
| Moderate risk population | ||||||
| 359 per 1000 | 355 per 1000 | |||||
| Health service outcomes: 2. Total duration of psychiatric hospital stays over12 months | The mean health service outcomes: 2. total duration of psychiatric hospital stays over12 months in the intervention groups was | 333 | ⊕⊕⊕⊝ | |||
| Health service outcomes: 3. Number of readmissions by 12 months | The mean health service outcomes: 3. number of readmissions by 12 months in the intervention groups was | 119 | ⊕⊕⊕⊝ | |||
| Health service outcomes: 4. Number with multiple readmissions by 12 months | Study population | RR 0.56 | 333 | ⊕⊕⊕⊝ | ||
| 108 per 1000 | 60 per 1000 | |||||
| Moderate risk population | ||||||
| 108 per 1000 | 60 per 1000 | |||||
| Days in community till 1st admission | The mean days in community till 1st admission in the intervention groups was | 333 | ⊕⊕⊕⊝ | |||
| Patient level outcomes: BPRS | The mean patient level outcomes: BPRS in the intervention groups was | 234 | ⊕⊕⊕⊝ | |||
| Patient level outcomes: GAF3 | The mean patient level outcomes: GAF in the intervention groups was | 237 | ⊕⊕⊕⊝ | |||
| *The basis for the assumed risk (e.g. the median control group risk across studies) is provided in footnotes. The corresponding risk (and its 95% confidence interval) is based on the assumed risk in the comparison group and the relative effect of the intervention (and its 95% CI). | ||||||
| GRADE Working Group grades of evidence | ||||||
| 1 Forty people (25%) allocated to Section 17 were subsequently placed on a CTO during the study 3 No adverse events were reported | ||||||
| Outcome or subgroup title | No. of studies | No. of participants | Statistical method | Effect size |
| 1 Health service outcomes: 1. Readmission to hospital ‐ by 11‐12 months Show forest plot | 2 | 416 | Risk Ratio (M‐H, Fixed, 95% CI) | 0.98 [0.79, 1.21] |
| 2 Health service outcomes: 2. Compliance with medication ‐ by 11‐12 months Show forest plot | 2 | 416 | Risk Ratio (M‐H, Fixed, 95% CI) | 0.99 [0.83, 1.19] |
| 3 Patient level outcomes: 1a. Social functioning: trouble with police ‐ by 11‐12 months Show forest plot | 2 | Risk Ratio (M‐H, Fixed, 95% CI) | Subtotals only | |
| 3.1 at least one arrest | 2 | 416 | Risk Ratio (M‐H, Fixed, 95% CI) | 0.97 [0.62, 1.52] |
| 3.2 ever arrested/picked up by police for violence against a person | 2 | 416 | Risk Ratio (M‐H, Fixed, 95% CI) | 0.82 [0.56, 1.21] |
| 4 Patient level outcomes: 1b. Social functioning: homeless ‐ by 11‐12 months Show forest plot | 2 | 416 | Risk Ratio (M‐H, Fixed, 95% CI) | 0.67 [0.39, 1.15] |
| 5 Patient level outcomes: 2. Quality of life: victimisation ‐ by 11‐12 months Show forest plot | 1 | 264 | Risk Ratio (M‐H, Fixed, 95% CI) | 0.50 [0.31, 0.80] |
| 6 Patient level outcomes: 3. Satisfaction with care: perceived coercion ‐ by 11‐12 months Show forest plot | 2 | 416 | Risk Ratio (M‐H, Fixed, 95% CI) | 1.36 [0.97, 1.89] |
| Outcome or subgroup title | No. of studies | No. of participants | Statistical method | Effect size |
| 1 Health service outcomes: 1. Readmission to hospital ‐ by 12 months Show forest plot | 1 | 333 | Risk Ratio (M‐H, Fixed, 95% CI) | 0.99 [0.74, 1.32] |
| 2 Health service outcomes: 2. Hospital bed‐days Show forest plot | 1 | 333 | Mean Difference (IV, Fixed, 95% CI) | ‐8.70 [‐30.88, 13.48] |
| 3 Health service outcomes: 3. Number of readmissions by 12 months Show forest plot | 1 | 119 | Mean Difference (IV, Fixed, 95% CI) | ‐0.20 [‐0.45, 0.05] |
| 4 Health service outcomes: 4. Number with multiple readmissions by 12 months Show forest plot | 1 | 333 | Risk Ratio (M‐H, Fixed, 95% CI) | 0.56 [0.27, 1.17] |
| 5 Health service outcomes: 5. Days in community till first admission Show forest plot | 1 | 333 | Mean Difference (IV, Fixed, 95% CI) | 5.0 [‐21.74, 31.74] |
| 6 Patient level outcomes: 1. Mental state: BPRS Show forest plot | 1 | 234 | Mean Difference (IV, Fixed, 95% CI) | ‐0.10 [‐3.17, 2.97] |
| 7 Patient level outcomes: 2. Global state: GAF Show forest plot | 1 | 237 | Mean Difference (IV, Fixed, 95% CI) | ‐0.70 [‐3.91, 2.51] |