Vacunas para sarampión, paperas, rubeola y varicela en niños
Resumen
Antecedentes
El sarampión, las paperas, la rubeola y la varicela son enfermedades graves que pueden derivar en complicaciones graves, discapacidad y muerte. Sin embargo, el debate público acerca de la seguridad de la tripe vírica (MMR) y la disminución resultante en las cobertura de vacunación en varios países persiste, a pesar de su uso casi universal y efectividad aceptada. Ésta es una actualización de una revisión publicada en 2005 y actualizada en 2012.
Objetivos
Evaluar la efectividad, la seguridad y los efectos adversos a corto y largo plazo asociados con la vacuna triple vírica, que contiene cepas de sarampión, rubeola y paperas (MMR), o la administración simultánea de la vacuna MMR y la vacuna contra la varicela (MMR+V), o la vacuna tetravalente que contiene cepas de sarampión, rubeola, paperas y varicela (MMRV), administrada a niños de hasta 15 años de edad.
Métodos de búsqueda
Se realizaron búsquedas en el Registro Cochrane Central de Ensayos Controlados (Cochrane Central Register of Controlled Trials; CENTRAL) (The Cochrane Library 2019, Número 5) que contiene el registro especializado del Grupo Cochrane de Infecciones Respiratorias Agudas (Cochrane Acute Respiratory Infections Group); MEDLINE (1966 hasta 2 de mayo de 2019), Embase (1974 hasta 2 de mayo de 2019); la International Clinical Trials Registry Platform de la OMS (2 de mayo de 2019); y ClinicalTrials.gov (2 de mayo de 2019).
Criterios de selección
Se incluyeron ensayos controlados aleatorizados (ECA), ensayos clínicos controlados (ECC), estudios de cohortes prospectivos y retrospectivos (ECP/ECR), estudios de casos y controles (CCS; por sus siglas en inglés), estudios de series temporales interrumpidas (STI), estudios de casos cruzados (CCO; por sus siglas en inglés), estudios ecológicos de caso único (ECU), estudios de series de casos autocontrolados (SCAC), estudios de cohortes persona/tiempo (CPT) y estudios de diseño de cobertura de casos/métodos de cribado (DCC/MC), que evalúan cualquier vacuna combinada MMR o MMRV / MMR+V administrada en cualquier dosis, composición o calendario, en comparación con ninguna intervención o placebo, en niños sanos de hasta 15 años de edad.
Obtención y análisis de los datos
Dos autores de la revisión extrajeron los datos y evaluaron la calidad metodológica de los estudios incluidos de forma independiente. Se agruparon los estudios para el análisis cuantitativo según el diseño del estudio, el tipo de vacuna (MMR, MMRV, MMR+V), la cepa del virus y el contexto del estudio. Los resultados de interés fueron los casos de sarampión, paperas, rubeola y varicela, y los daños. La certeza de la evidencia fue calificada mediante GRADE.
Resultados principales
Se incluyeron 138 estudios (23 480 668 participantes). Cincuenta y un estudios (10 248 159 niños) evaluaron la eficacia de las vacunas y 87 estudios (13 232 509 niños) evaluaron la asociación entre las vacunas y una variedad de efectos perjudiciales. Se incluyeron 74 nuevos estudios en esta versión de 2019 de la revisión.
Efectividad
La efectividad de la vacuna para la prevención del sarampión fue del 95% después de una dosis (razón de riesgo (RR) 0,05; IC del 95%: 0,02 a 0,13; siete estudios de cohorte; 12 039 niños; evidencia de certeza moderada) y del 96% después de dos dosis (RR 0,04; IC del 95%: 0,01 a 0,28; cinco estudios de cohorte; 21 604 niños; evidencia de certeza moderada). La efectividad para la prevención de casos entre contactos domésticos o en la prevención de la transmisión a otras personas con las que los niños estuvieron en contacto después de una dosis fue del 81% (RR 0,19; IC del 95%: 0,04 a 0,89; tres estudios de cohorte; 151 niños; evidencia de certeza baja), después de dos dosis del 85% (RR 0.15; IC del 95% 0,03 a 0,75; tres estudios de cohorte; 378 niños; evidencia de certeza baja), y después de tres dosis fue del 96% (RR 0,04; IC del 95% 0,01 a 0,23; dos estudios de cohorte; 151 niños; evidencia de certeza baja). La efectividad (al menos una dosis) para la prevención del sarampión después de la exposición (profilaxis posexposición) fue del 74% (RR 0,26; IC del 95%: 0,14 a 0,50; dos estudios de cohorte; 283 niños; evidencia de certeza baja).
La efectividad de la vacuna MMR de Jeryl Lynn para la prevención de las paperas fue del 72% después de una dosis (RR 0,24; IC del 95%: 0,08 a 0,76; seis estudios de cohorte; 9915 niños; evidencia de certeza moderada) y del 86% después de dos dosis (RR 0,12; IC del 95%: 0,04 a 0,35; cinco estudios de cohorte; 7792 niños; evidencia de certeza moderada). La efectividad para prevenir casos en contactos domésticos fue del 74% (RR 0,26; IC del 95%: 0,13 a 0,49; tres estudios de cohorte; 1036 niños; evidencia de certeza moderada).
La efectividad de la vacuna contra la rubeola, usando una vacuna con la cepa BRD2 que solo se utiliza en China, es del 89% (RR 0,11; IC del 95%: 0,03 a 0,42; un estudio de cohorte; 1621 niños; evidencia de certeza moderada).
La efectividad de la vacuna contra la varicela (cualquier gravedad) después de dos dosis administradas a niños de 11 a 22 meses es del 95% en un seguimiento de 10 años (cociente de tasas [rr] 0,05; IC del 95%: 0,03 a 0,08; un ECA; 2279 niños; evidencia de certeza alta).
Seguridad
Hay evidencia que respalda una asociación entre la meningitis aséptica y las vacunas MMR que contienen cepas de paperas de Urabe y Leningrad‐Zagreb, pero no hay evidencia que apoye esta asociación en el caso de las vacunas MMR que contienen cepas de paperas Jeryl Lynn (rr 1,30; IC del 95%: 0,66 a 2,56; evidencia de certeza baja). Los análisis proporcionan evidencia que apoya una asociación entre las vacunas MMR/MMR+V/MMRV (cepa Jeryl Lynn) y las convulsiones febriles. Las convulsiones febriles normalmente ocurren en el 2% al 4% de los niños sanos al menos una vez antes de los 5 años. Se estima que el riesgo atribuible a las convulsiones febriles inducidas por la vacuna es de 1 por 1700 a 1 por 1150 dosis administradas.
Los análisis proporcionan evidencia que apoya una asociación entre la vacuna triple vírica y la púrpura trombocitopénica idiopática (PTI). Sin embargo, el riesgo de PTI después de la vacunación es menor que después de una infección natural con estos virus. La infección natural de la PTI se produce en 5 casos por cada 100 000 (1 caso por cada 20 000) al año. Se estima que el riesgo atribuible es de aproximadamente 1 caso de PTI por cada 40 000 dosis de MMR administradas.
No hay evidencia de una asociación entre la vacunación de MMR y la encefalitis o la encefalopatía (cociente de tasas 0,90; IC del 95%: 0,50 a 1,61; dos estudios observacionales; 1 071 088 niños; evidencia de certeza baja) y los trastornos del espectro autista (cociente de tasas 0,93; IC del 95%: 0,85 a 1,01; dos estudios observacionales; 1 194 764 niños; certeza moderada). No hay evidencia suficiente para determinar la asociación entre la vacunación de MMR y la enfermedad inflamatoria intestinal (odds‐ratio 1,42; IC del 95%: 0,93 a 2,16; tres estudios observacionales; 409 casos y 1416 controles; evidencia de certeza moderada).
Además, no hay evidencia que apoye una asociación entre la vacunación de MMR y el retraso cognitivo, la diabetes tipo 1, el asma, la dermatitis/eccema, la alergia estacional, la leucemia, la esclerosis múltiple, los trastornos de la marcha y las infecciones bacterianas o víricas.
Conclusiones de los autores
La evidencia existente sobre la seguridad y la eficacia de las vacunas MMR/MMRV respalda su uso para la vacunación masiva. Las campañas destinadas a la erradicación mundial deberían evaluar la situación epidemiológica y socioeconómica de los países, así como la capacidad de lograr una elevada cobertura de vacunación. Se necesita más evidencia para evaluar si el efecto protector de la MMR/MMRV podría disminuir con el tiempo desde la inmunización.
PICO
Resumen en términos sencillos
¿Protege la vacuna contra el sarampión, las paperas, la rubeola y la varicela (MMRV, por sus siglas en inglés) a los niños, y tiene efectos nocivos?
Antecedentes
El sarampión, las paperas, la rubeola (sarampión alemán) y la varicela son enfermedades infecciosas causadas por virus. Son más frecuentes en niños y adultos jóvenes. No siempre son graves, pero pueden causar discapacidades (como sordera), complicaciones y muerte. Si las mujeres embarazadas contraen la rubeola, puede resultar en la pérdida del bebé no nacido (aborto) o causarle algún daño al mismo.
Una vacuna es un medicamento que previene la infección por una enfermedad específica. La vacuna MMR (sarampión, paperas, rubeola) protege a las personas contra estas tres infecciones (una vacuna combinada). Los médicos pueden vacunar contra la varicela a la vez juntado la vacuna contra la varicela con la vacuna MMR (MMRV) o administrándola por separado al mismo tiempo (MMR+V).
La vacuna MMR ha reducido las infecciones de sarampión, paperas y rubeola. Sin embargo, algunas personas piensan que la vacuna MMR causa efectos no deseados como el autismo, la hinchazón del cerebro (encefalitis), la meningitis, dificultades en el aprendizaje, la diabetes tipo 1 y otras enfermedades. En consecuencia, el número de niños vacunados ha disminuido.
Esta es una actualización del 2019 de una revisión publicada por primera vez en el 2005 y actualizada anteriormente en el 2012.
Pregunta de la revisión
Se quería conocer la eficacia de las vacunas MMR, MMR+V y MMRV contra el sarampión, paperas, rubeola y varicela en niños (hasta 15 años). También se quería saber si las vacunas causan efectos no deseados.
Características de los estudios
Se buscaron estudios que evaluaran las vacunas MMR, MMRV o MMR+V, administradas en cualquier dosis o calendario, en comparación con no administrar la vacuna, o la administración de una vacuna placebo (un tratamiento simulado), a niños sanos de hasta 15 años de edad. Es necesario realizar estudios para medir el número de casos de sarampión, paperas, rubeola y varicela, e informar si los niños sufrieron algún efecto no deseado atribuible a la vacunación. Se revisó cada estudio para asegurar que se utilizaban métodos sólidos para poder valorar la fiabilidad de los resultados.
Resultados
Se encontraron 138 estudios con más de 23 millones de niños. Cincuenta y un estudios (10 millones de niños) evaluaron la eficacia de las vacunas para prevenir las enfermedades, y 87 estudios (13 millones de niños) evaluaron los efectos no deseados. En esta actualización de 2020 se han incluido 74 nuevos estudios publicados desde 2012.
Sarampión: los resultados de siete estudios (12 000 niños) mostraron que una dosis de la vacuna fue efectiva en un 95% para la prevención del sarampión. El 7% de los niños no vacunados se contagió de sarampión. Esta cifra descendió a menos del 0,5% en los niños que recibieron una dosis de la vacuna.
Paperas: los resultados de seis estudios (9915 niños) mostraron que una dosis de la vacuna fue efectiva en un 72% para la prevención de las paperas. Este porcentaje aumentó al 86% con dos dosis, (tres estudios, 7792 niños). En niños no vacunados, el 7,4% se contagió de paperas. Esta cifra disminuiría al 1% si los niños recibieran dos dosis de la vacuna.
Los resultados en el caso de la rubeola (un estudio, 1621 niños) y la varicela (un estudio, 2279 niños) también mostraron que las vacunas son efectivas. Una dosis de la vacuna fue efectiva en un 89% para la prevención de la rubeola, con una vacuna con la cepa BRD2 que solo se utiliza en China, y la vacuna MMRV fue efectiva en un 95% para la prevención de la varicela tras 10 años.
Efectos no deseados
En general, los estudios encontraron que las vacunas MMR, MMRV y MMR+V no causaron autismo (dos estudios 1 194 764 niños), encefalitis (dos estudios 1 071 088 niños) ni cualquier otra sospecha de efecto no deseado.
Los análisis mostraron riesgos muy bajos de convulsiones por temperatura elevada o fiebre (convulsiones febriles) alrededor de dos semanas después de la vacunación, y de un trastorno en el que la sangre no coagula de forma normal (púrpura trombocitopénica idiopática) en los niños vacunados.
Certeza de la evidencia
La certeza (confianza) de la evidencia está ligeramente limitada por el diseño de la mayoría de los estudios. No obstante, la certeza de la evidencia acerca de la eficacia de la vacuna MMR se calificó como moderada y como alta en el caso de la vacuna contra la varicela. La certeza de la evidencia de autismo y convulsiones febriles también fue moderada.
Conclusiones
La revisión muestra que las vacunas MMR, MMRV y MMR+V son eficaces para prevenir la infección por sarampión, paperas, rubeola y varicela en niños, sin evidencia de un mayor riesgo de autismo o encefalitis y con un pequeño riesgo de convulsiones febriles.
Fecha de la búsqueda
Esta revisión incluye evidencia publicada hasta el 2 de mayo de 2019.
Authors' conclusions
Summary of findings
| Effectiveness against measles | |||||
| Patient or population: children 9 months to 15 years old | |||||
| Outcomes | Anticipated absolute effects* (95% CI) | Relative effect | № of participants | Certainty of the evidence | |
|---|---|---|---|---|---|
| Risk of measles | Risk of measles | ||||
| Cohort studies ‐ 1 dose | Study population | RR 0.05 | 12,039 | ⊕⊕⊕⊝ | |
| 66 per 1000 | 3 per 1000 | ||||
| Cohort studies ‐ 2 doses | Study population | RR 0.04 | 21,604 | ⊕⊕⊕⊝ | |
| 19 per 1000 | 1 per 1000 | ||||
| Cohort studies household contacts ‐ 1 dose | Study population | RR 0.19 | 151 | ⊕⊕⊝⊝ | |
| 508 per 1000 | 97 per 1000 | ||||
| Cohort studies household contacts ‐ 2 doses | Study population | RR 0.15 | 378 | ⊕⊕⊝⊝ | |
| 508 per 1000 | 76 per 1000 | ||||
| Cohort studies household contacts ‐ 3 doses | Study population | RR 0.04 | 151 | ⊕⊕⊝⊝ | |
| 351 per 1000 | 14 per 1000 | ||||
| Cohort studies postexposure prophylaxis | Study population | RR 0.26 | 283 | ⊕⊕⊝⊝ | |
| 314 per 1000 | 82 per 1000 | ||||
| *The risk in the intervention group (and its 95% confidence interval) is based on the assumed risk in the comparison group and the relative effect of the intervention (and its 95% CI). | |||||
| GRADE Working Group grades of evidence | |||||
| 1Upgraded one level for large effect size (non‐critical risk of bias in studies). | |||||
| Effectiveness against mumps | |||||
| Patient or population: children 9 months to 15 years old | |||||
| Outcomes | Anticipated absolute effects* (95% CI) | Relative effect | № of participants | Certainty of the evidence | |
|---|---|---|---|---|---|
| Risk of mumps | Risk of mumps | ||||
| Cohort studies ‐ Jeryl Lynn strain ‐ 1 dose | Study population | RR 0.24 | 9915 | ⊕⊕⊕⊝ | |
| 91 per 1000 | 22 per 1000 | ||||
| Cohort studies ‐ Jeryl Lynn strain ‐ 2 doses | Study population | RR 0.12 | 7792 | ⊕⊕⊕⊝ | |
| 74 per 1000 | 9 per 1000 | ||||
| Cohort studies ‐ Jeryl Lynn strain ‐ unspecified number of doses | Study population | RR 0.23 | 2011 | ⊕⊕⊝⊝ | |
| 97 per 1000 | 22 per 1000 | ||||
| Cohort studies ‐ Jeryl Lynn strain ‐ household contacts | Study population | RR 0.26 | 1036 | ⊕⊕⊕⊝ | |
| 408 per 1000 | 106 per 1000 | ||||
| Cohort studies ‐ Urabe strain ‐ unspecified numbers or at least 1 dose | Study population | RR 0.23 | 2721 | ⊕⊕⊝⊝ | |
| 202 per 1000 | 47 per 1000 | ||||
| Cohort studies ‐ Rubini strain ‐ unspecified numbers or at least 1 dose | Study population | RR 0.96 | 4219 | ⊕⊕⊝⊝ | |
| 202 per 1000 | 194 per 1000 | ||||
| Cohort studies ‐ mumps strain not reported or any strain | Study population | RR 0.52 | 769 | ⊕⊕⊝⊝ | |
| 225 per 1000 | 117 per 1000 | ||||
| Cohort studies ‐ third dose versus 2 doses | Study population | RR 0.59 | 5417 | ⊕⊕⊝⊝ | |
| 7 per 1000 | 4 per 1000 | ||||
| *The risk in the intervention group (and its 95% confidence interval) is based on the assumed risk in the comparison group and the relative effect of the intervention (and its 95% CI). | |||||
| GRADE Working Group grades of evidence | |||||
| 1Upgraded one level for large effect size (non‐critical risk of bias in studies). | |||||
| Effectiveness against rubella | |||||
| Patient or population: children 9 months to 15 years old | |||||
| Outcomes | Anticipated absolute effects* (95% CI) | Relative effect | № of participants | Certainty of the evidence | |
|---|---|---|---|---|---|
| Risk of rubella | Risk of rubella | ||||
| Cohort studies secondary cases ‐ any strain | Study population | RR 0.11 | 1621 (1 observational study) | ⊕⊕⊕⊝ | |
| 0 per 1000 | 0 per 1000 | ||||
| *The risk in the intervention group (and its 95% confidence interval) is based on the assumed risk in the comparison group and the relative effect of the intervention (and its 95% CI). | |||||
| GRADE Working Group grades of evidence | |||||
| 1Cohort study in China using the BRD2 strain. | |||||
| Effectiveness against varicella | |||||
| Patient or population: children 9 months to 15 years old | |||||
| Outcomes | Anticipated absolute effects* (95% CI) | Relative effect | № of participants | Certainty of the evidence | |
|---|---|---|---|---|---|
| Risk of varicella | Risk of varicella | ||||
| MMRV randomised controlled trial ‐ any severity ‐ 2 doses ‐ follow‐up at 5 years | Study population | Rate ratio 0.05 | 3022 | ⊕⊕⊕⊕ | |
| 271 per 1000 | 14 per 1000 | ||||
| MMRV randomised controlled trial ‐ any severity ‐ 2 doses ‐ follow‐up between 5 and 10 years | Study population | Rate ratio 0.05 | 3023 | ⊕⊕⊕⊕ | |
| 437 per 1000 | 22 per 1000 | ||||
| MMRV randomised controlled trial ‐ any severity ‐ 2 doses ‐ follow‐up at 10 years | Study population | Rate ratio 0.05 | 3023 | ⊕⊕⊕⊕ | |
| 473 per 1000 | 24 per 1000 | ||||
| MMRV randomised controlled trial ‐ moderate/severe cases ‐ 2 doses ‐ follow‐up at 5 years | Study population | Rate ratio 0.00 | 3022 | ⊕⊕⊕⊕ | |
| 157 per 1000 | 0 per 1000 | ||||
| MMRV randomised controlled trial ‐ moderate/severe cases ‐ 2 doses ‐ follow‐up between 5 and 10 years | Study population | Rate ratio 0.01 | 3023 | ⊕⊕⊕⊕ | |
| 237 per 1000 | 2 per 1000 | ||||
| MMRV randomised controlled trial ‐ moderate/severe cases ‐ 2 doses ‐ follow‐up at 10 years | Study population | Rate ratio 0.01 | 3023 | ⊕⊕⊕⊕ | |
| 237 per 1000 | 2 per 1000 | ||||
| MMR+V randomised controlled trial ‐ any severity ‐ 2 doses ‐ follow‐up at 5 years | Study population | Rate ratio 0.35 | 3006 | ⊕⊕⊕⊕ | |
| 271 per 1000 | 95 per 1000 | ||||
| MMR+V randomised controlled trial ‐ any severity ‐ 2 doses ‐ follow‐up between 5 and 10 years | Study population | Rate ratio 0.33 | 3010 | ⊕⊕⊕⊕ | |
| 437 per 1000 | 144 per 1000 | ||||
| MMR+V randomised controlled trial ‐ any severity ‐ 2 doses ‐ follow‐up at 10 years | Study population | Rate ratio 0.33 | 3010 | ⊕⊕⊕⊕ | |
| 473 per 1000 | 156 per 1000 | ||||
| MMR+V randomised controlled trial ‐ moderate/severe cases ‐ 2 doses ‐ follow‐up at 5 years | Study population | Rate ratio 0.09 | 3006 | ⊕⊕⊕⊕ | |
| 157 per 1000 | 14 per 1000 | ||||
| MMR+V randomised controlled trial ‐ moderate/severe cases ‐ 2 doses ‐ follow‐up between 5 and 10 years | Study population | Rate ratio 0.10 | 3010 | ⊕⊕⊕⊕ | |
| 237 per 1000 | 24 per 1000 | ||||
| MMR+V randomised controlled trial ‐ moderate/severe cases ‐ 2 doses ‐ follow‐up at 10 years | Study population | RR 0.10 | 3010 | ⊕⊕⊕⊕ | |
| 237 per 1000 | 24 per 1000 | ||||
| *The risk in the intervention group (and its 95% confidence interval) is based on the assumed risk in the comparison group and the relative effect of the intervention (and its 95% CI). | |||||
| GRADE Working Group grades of evidence | |||||
| Safety: short‐term side effects (local or systemic reactions) | |||||
| Patient or population: children 9 months to 15 years old | |||||
| Outcomes | Anticipated absolute effects* (95% CI) | Relative effect | № of participants | Certainty of the evidence | |
|---|---|---|---|---|---|
| Short‐term side effects | Short‐term side effects | ||||
| Temperature ‐ RCT/CCT axillary | Study population | RR 2.04 | 420 | ⊕⊕⊝⊝ | |
| 68 per 1000 | 139 per 1000 | ||||
| Temperature ‐ RCT/CCT rectal | Study population | RR 0.84 | 170 | ⊕⊕⊝⊝ | |
| 786 per 1000 | 660 per 1000 | ||||
| Temperature ‐ RCT/CCT measurement site not reported | Study population | RR 1.36 | 520 | ⊕⊕⊕⊕ | |
| 182 per 1000 | 247 per 1000 | ||||
| Temperature ‐ cohort studies orally | Study population | RR 1.37 | 334 | ⊕⊝⊝⊝ | |
| 377 per 1000 | 517 per 1000 | ||||
| Temperature ‐ cohort studies measurement site not reported | Study population | RR 1.12 | 457,123 | ⊕⊝⊝⊝ | |
| 31 per 1000 | 35 per 1000 | ||||
| Rash ‐ cohort studies | Study population | RR 1.49 | 457,261 | ⊕⊝⊝⊝ | |
| 4 per 1000 | 6 per 1000 | ||||
| Lymphadenopathy ‐ RCT/CCT | Study population | RR 1.32 | 1156 | ⊕⊕⊕⊝ | |
| 21 per 1000 | 28 per 1000 | ||||
| Lymphadenopathy ‐ cohort studies | Study population | RR 1.98 | 454,085 | ⊕⊝⊝⊝ | |
| 0 per 1000 | 1 per 1000 | ||||
| Coryza ‐ RCT/CCT | Study population | RR 0.45 | 831 | ⊕⊕⊝⊝ | |
| 37 per 1000 | 17 per 1000 | ||||
| Coryza ‐ cohort studies | Study population | RR 1.13 | 3176 | ⊕⊕⊝⊝ | |
| 502 per 1000 | 567 per 1000 | ||||
| URTI (rhinitis pharyngitis) ‐ RCT/CCT | Study population | RR 0.31 | 831 | ⊕⊕⊝⊝ | |
| 265 per 1000 | 82 per 1000 | ||||
| URTI (rhinitis pharyngitis) ‐ cohort studies | Study population | RR 1.44 | 966 | ⊕⊝⊝⊝ | |
| 484 per 1000 | 697 per 1000 | ||||
| Cough ‐ RCT/CCT | Study population | RR 1.99 | 831 | ⊕⊕⊝⊝ | |
| 8 per 1000 | 16 per 1000 | ||||
| Rash ‐ RCT/CCT | Study population | RR 2.05 | 1156 | ⊕⊕⊕⊕ | |
| 52 per 1000 | 107 per 1000 | ||||
| *The risk in the intervention group (and its 95% confidence interval) is based on the assumed risk in the comparison group and the relative effect of the intervention (and its 95% CI). | |||||
| GRADE Working Group grades of evidence | |||||
| 1Downgraded two levels due to selective reporting (reporting bias). | |||||
| Safety: encephalitis or encephalopathy | |||||
| Patient or population: children 9 months to 15 years old | |||||
| Outcomes | Anticipated absolute effects* (95% CI) | Relative effect | № of participants | Certainty of the evidence | |
|---|---|---|---|---|---|
| Risk of encephalitis or encephalopathy | Risk of encephalitis or encephalopathy | ||||
| Case‐control: MMR (risk interval from 0 to 90 days) | Study population | OR 0.98 | 452 cases, 1280 controls | ⊕⊕⊝⊝ | |
| 34 per 1000 | 34 per 1000 | ||||
| Self‐controlled case series/person‐time cohort | Study population | Rate ratio 0.90 | 1,071,088 | ⊕⊕⊝⊝ | |
| 22 per 100,000 | 20 per 100,000 | ||||
| *The risk in the intervention group (and its 95% confidence interval) is based on the assumed risk in the comparison group and the relative effect of the intervention (and its 95% CI). | |||||
| GRADE Working Group grades of evidence | |||||
| Safety: aseptic meningitis | |||||
| Patient or population: children 9 months to 15 years old | |||||
| Outcomes | Anticipated absolute effects* (95% CI) | Relative effect | № of participants | Certainty of the evidence | |
|---|---|---|---|---|---|
| Risk of aseptic meningitis | Risk of aseptic meningitis | ||||
| Case‐control ‐ Jeryl Lynn ‐ risk interval 0 to 30 days | Study population | OR 0.85 | 59 cases, 118 controls | ⊕⊕⊝⊝ | |
| 59 per 1000 | 51 per 1000 | ||||
| Case cross‐over ‐ Urabe or Hoshino | Study population | OR 4.00 | (2 observational studies) | ⊕⊕⊝⊝ | |
| 0 per 1000 | 0 per 1000 | ||||
| Case cross‐over ‐ Jeryl Lynn or Rubini | Study population | OR 0.60 | (1 observational study) | ⊕⊕⊝⊝ | |
| 0 per 1000 | 0 per 1000 | ||||
| Self‐controlled case series ‐ any strain | Study population | Rate ratio 12.40 | (1 observational study) | ⊕⊕⊝⊝ | |
| 0 per 1000 | 0 per 1000 | ||||
| Self‐controlled case series ‐ Urabe | Study population | Rate ratio 30.71 | 564,635 | ⊕⊕⊝⊝ | |
| 16 per 100,000 | 490 per 100,000 | ||||
| Self controlled case series ‐ Leningrad‐Zagreb | Study population | Rate ratio 6.40 | (1 observational study) | ⊕⊕⊝⊝ | |
| 0 per 1000 | 0 per 1000 | ||||
| Person‐time cohort ‐ Jeryl Lynn | Study population | Rate ratio 1.30 | 1,071,088 | ⊕⊕⊝⊝ | |
| 30 per 100,000 | 39 per 100,000 | ||||
| Case‐only ecological method ‐ Urabe | Study population | Rate ratio 9.12 | 1,054,305 | ⊕⊕⊝⊝ | |
| 9 per 100,000 | 80 per 100,000 | ||||
| Case‐only ecological method ‐ Leningrad‐Zagreb | Study population | Rate ratio 18.56 | 1,164,964 | ⊕⊕⊝⊝ | |
| 0 per 100,000 | 0 per 100,000 | ||||
| *The risk in the intervention group (and its 95% confidence interval) is based on the assumed risk in the comparison group and the relative effect of the intervention (and its 95% CI). | |||||
| GRADE Working Group grades of evidence | |||||
| Safety: seizures (febrile/afebrile) | |||||
| Patient or population: children 9 months to 15 years old | |||||
| Outcomes | Anticipated absolute effects* (95% CI) | Relative effect | № of participants | Certainty of the evidence | |
|---|---|---|---|---|---|
| Risk of seizures | Risk of seizures | ||||
| Cohort studies ‐ within 1 week after MMR vaccination | Study population | Rate ratio 2.45 | 1,451,990 | ⊕⊕⊕⊝ | |
| 108 per 1000 | 264 per 1000 | ||||
| Cohort studies ‐ between 1 and 2 weeks after MMR vaccination | Study population | Rate ratio 3.16 | 2,147,638 | ⊕⊕⊕⊝ | |
| 13 per 1000 | 42 per 1000 | ||||
| Cohort studies ‐ > 2 weeks after MMR vaccination | Study population | Rate ratio 0.97 | 1,018,998 | ⊕⊕⊝⊝ | |
| 3 per 1000 | 3 per 1000 | ||||
| Self‐controlled case series/person‐time ‐ between 1 and 2 weeks after MMR vaccination | Study population | Rate ratio 3.36 | 505,493 | ⊕⊕⊝⊝ | |
| 0 per 1000 | 0 per 1000 | ||||
| Self‐controlled case series/person‐time ‐ > 2 weeks after MMR vaccination | Study population | Rate ratio 1.18 | 102,099 | ⊕⊕⊝⊝ | |
| 0 per 1000 | 0 per 1000 | ||||
| Self‐controlled case series/person‐time ‐ between 1 and 2 weeks after vaccination; MMRV | Study population | Rate ratio 6.08 | 180,480 | ⊕⊕⊝⊝ | |
| 0 per 1000 | 0 per 1000 | ||||
| Self‐controlled case series/person‐time ‐ between 1 and 2 weeks after MMR+V vaccination | Study population | Rate ratio 3.13 | 181,088 | ⊕⊕⊝⊝ | |
| 0 per 1000 | 0 per 1000 | ||||
| MMRV vs MMR+V ‐ by brand ‐ from 0 to 42 days after vaccination (Priorix‐Tetra) | Study population | RR 1.95 | 115,022 | ⊕⊕⊝⊝ | |
| 1 per 1000 | 1 per 1000 | ||||
| MMRV vs MMR+V ‐ by brand ‐ from 7 to 10 days after vaccination (Priorix‐Tetra) | Study population | RR 1.69 | 114,922 | ⊕⊕⊝⊝ | |
| 1 per 1000 | 1 per 1000 | ||||
| MMRV vs MMR+V ‐ by brand ‐ from 0 to 42 days after vaccination (ProQuad) | Study population | RR 1.30 | 1,381,609 | ⊕⊕⊝⊝ | |
| 2 per 1000 | 2 per 1000 | ||||
| MMRV vs MMR+V ‐ by brand ‐ from 7 to 10 days after vaccination (ProQuad) | Study population | RR 2.01 | 1,381,609 | ⊕⊕⊝⊝ | |
| 2 per 1000 | 4 per 1000 | ||||
| MMRV vs MMR ‐ by brand ‐ from 0 to 42 days after vaccination (Priorix‐Tetra) | Study population | RR 1.28 | 292,535 | ⊕⊕⊝⊝ | |
| 1 per 1000 | 2 per 1000 | ||||
| MMRV vs MMR ‐ by brand ‐ from 7 to 10 days after vaccination (Priorix‐Tetra) | Study population | RR 2.49 | 292,535 | ⊕⊕⊝⊝ | |
| 1 per 1000 | 3 per 1000 | ||||
| MMRV vs MMR ‐ by brand ‐ from 0 to 42 days after vaccination (ProQuad) | Study population | RR 1.60 | 1,049,831 | ⊕⊕⊝⊝ | |
| 43 per 100,000 | 69 per 100,000 | ||||
| MMRV vs MMR ‐ by brand ‐ from 7 to 10 days after vaccination (ProQuad) | Study population | RR 1.46 | 1,989,157 | ⊕⊕⊝⊝ | |
| 21 per 100,000 | 30 per 100,000 | ||||
| *The risk in the intervention group (and its 95% confidence interval) is based on the assumed risk in the comparison group and the relative effect of the intervention (and its 95% CI). | |||||
| GRADE Working Group grades of evidence | |||||
| 1Upgraded one level due to large effect size | |||||
| Safety: autistic spectrum disorders | ||||||
| Patient or population: children 9 months to 15 years old | ||||||
| Outcomes | Anticipated absolute effects* (95% CI) | Relative effect | № of participants | Certainty of the evidence | Comments | |
|---|---|---|---|---|---|---|
| Risk of ASD amongst unvaccinated | Risk of ASD amongst vaccinated | |||||
| Cohort studies ‐ all children, MMR | Study population | Rate ratio 0.93 | 1,194,764 | ⊕⊕⊕⊝ |
| |
| 451 per 100,000 | 419 per 100,000 | |||||
| Cohort studies ‐ autism risk (low), MMR | Study population | Rate ratio 1.00 | 93,071 | ⊕⊕⊕⊝ |
| |
| 85 per 100,000 | 85 per 100,000 | |||||
| Cohort studies ‐ autism risk (moderate/high), MMR | Study population | Rate ratio 0.80 | 1914 | ⊕⊕⊝⊝ | The apparent protective effect is due to indication bias. | |
| 12 per 1000 | 9 per 1000 | |||||
| *The risk in the intervention group (and its 95% confidence interval) is based on the assumed risk in the comparison group and the relative effect of the intervention (and its 95% CI). | ||||||
| GRADE Working Group grades of evidence | ||||||
| 1Upgraded one level due to residual confounding ‐ confounding expected to increase the effect but no effect was observed. | ||||||
| Safety: inflammatory bowel disease | |||||
| Patient or population: children 9 months to 15 years old | |||||
| Outcomes | Anticipated absolute effects* (95% CI) | Relative effect | № of participants | Certainty of the evidence | |
|---|---|---|---|---|---|
| Risk of IBD | Risk of IBD | ||||
| Case control ‐ all IBD, MMR | Study population | OR 1.42 | 409 cases, 1416 controls | ⊕⊕⊕⊝ | |
| 0 per 1000 | 0 per 1000 | ||||
| Case control ‐ ulcerative colitis, MMR | Study population | OR 1.35 | 292 cases, 582 controls | ⊕⊕⊕⊝ | |
| 0 per 1000 | 0 per 1000 | ||||
| Case control ‐ Crohn's disease, MMR | Study population | OR 0.64 | 514 cases, 804 controls | ⊕⊕⊕⊝ | |
| 0 per 1000 | 0 per 1000 | ||||
| *The risk in the intervention group (and its 95% confidence interval) is based on the assumed risk in the comparison group and the relative effect of the intervention (and its 95% CI). | |||||
| GRADE Working Group grades of evidence | |||||
| 1Upgraded one level due to residual confounding ‐ confounding expected to increase the effect but no effect was observed. | |||||
| Safety: cognitive delay ‐ developmental delay | |||||
| Patient or population: children 9 months to 15 years old | |||||
| Outcomes | Anticipated absolute effects* (95% CI) | Relative effect | № of participants | Certainty of the evidence | |
|---|---|---|---|---|---|
| Risk of cognitive delay ‐ | Risk of cognitive delay ‐ | ||||
| Cohort study ‐ MDI‐BSID II 24th month, MMR | Study population | OR 1.35 | 337 | ⊕⊕⊝⊝ | |
| 0 per 1000 | 0 per 1000 | ||||
| Cohort study ‐ MDI‐BSID II 36th month, MMR | Study population | OR 0.37 | 337 | ⊕⊕⊝⊝ | |
| 0 per 1000 | 0 per 1000 | ||||
| Cohort study ‐ Raven 5th year, MMR | Study population | OR 1.22 | 337 | ⊕⊕⊝⊝ | |
| 0 per 1000 | 0 per 1000 | ||||
| Cohort study ‐ WISC‐R verbal 6th year, MMR | Study population | OR 1.23 | 337 | ⊕⊕⊝⊝ | |
| 0 per 1000 | 0 per 1000 | ||||
| *The risk in the intervention group (and its 95% confidence interval) is based on the assumed risk in the comparison group and the relative effect of the intervention (and its 95% CI). | |||||
| GRADE Working Group grades of evidence | |||||
| Safety: idiopathic thrombocytopenic purpura | |||||
| Patient or population: children 9 months to 15 years old | |||||
| Outcomes | Anticipated absolute effects* (95% CI) | Relative effect | № of participants | Certainty of the evidence | |
|---|---|---|---|---|---|
| Risk of ITP | Risk of ITP | ||||
| Case‐control ‐ case cross‐over ‐ case controls MMR | Study population | OR 2.80 | 410 cases, 2040 controls | ⊕⊕⊝⊝ | |
| 0 per 1000 | 0 per 1000 | ||||
| Self‐controlled case series ‐ MMR vaccine ‐ age from 9 to 23 months | Study population | Rate ratio 4.21 | 3,723,677 | ⊕⊕⊕⊝ | |
| 17 per 100,000 | 72 per 100,000 | ||||
| *The risk in the intervention group (and its 95% confidence interval) is based on the assumed risk in the comparison group and the relative effect of the intervention (and its 95% CI). | |||||
| GRADE Working Group grades of evidence | |||||
| 1Upgraded one level due to large effect size | |||||
| Safety: Henoch‐Schönlein purpura | |||||
| Patient or population: children 9 months to 15 years old | |||||
| Outcomes | Anticipated absolute effects* (95% CI) | Relative effect | № of participants | Certainty of the evidence | |
|---|---|---|---|---|---|
| Risk of HSP | Risk of HSP | ||||
| Case‐control ‐ MMR vaccine | Study population | OR 3.40 | 288 cases, 617 controls | ⊕⊕⊝⊝ | |
| 0 per 1000 | 0 per 1000 | ||||
| *The risk in the intervention group (and its 95% confidence interval) is based on the assumed risk in the comparison group and the relative effect of the intervention (and its 95% CI). | |||||
| GRADE Working Group grades of evidence | |||||
| Safety: type 1 diabetes | |||||
| Patient or population: children 9 months to 15 years old | |||||
| Outcomes | Anticipated absolute effects* (95% CI) | Relative effect | № of participants | Certainty of the evidence | |
|---|---|---|---|---|---|
| Risk of type 1 diabetes | Risk of type 1 diabetes | ||||
| Cohort study MMR ‐ all children | Study population | Rate ratio 1.09 | 1,666,829 | ⊕⊕⊝⊝ | |
| 0 per 1000 | 0 per 1000 | ||||
| Cohort study MMR ‐ children with at least 1 sibling with type 1 diabetes | Study population | Rate ratio 0.86 | 3848 | ⊕⊕⊝⊝ | |
| 6 per 1000 | 5 per 1000 | ||||
| *The risk in the intervention group (and its 95% confidence interval) is based on the assumed risk in the comparison group and the relative effect of the intervention (and its 95% CI). | |||||
| GRADE Working Group grades of evidence | |||||
| Safety: asthma | |||||
| Patient or population: children 9 months to 15 years old | |||||
| Outcomes | Anticipated absolute effects* (95% CI) | Relative effect | № of participants | Certainty of the evidence | |
|---|---|---|---|---|---|
| Risk of asthma | Risk of asthma | ||||
| Cohort study (rate ratio) ‐ all ages | Study population | Rate ratio 1.05 | 1,067,712 | ⊕⊕⊝⊝ | |
| 32 per 1000 | 33 per 1000 | ||||
| Cohort studies (risk ratio) ‐ all ages | Study population | RR 0.63 | 886 | ⊕⊕⊝⊝ | |
| 414 per 1000 | 261 per 1000 | ||||
| *The risk in the intervention group (and its 95% confidence interval) is based on the assumed risk in the comparison group and the relative effect of the intervention (and its 95% CI). | |||||
| GRADE Working Group grades of evidence | |||||
| 1Upgraded one level due to non‐critical risk of bias in the study and large number of participants. | |||||
| Safety: eczema ‐ dermatitis | |||||
| Patient or population: children 9 months to 15 years old | |||||
| Outcomes | Anticipated absolute effects* (95% CI) | Relative effect | № of participants | Certainty of the evidence | |
|---|---|---|---|---|---|
| Risk of eczema ‐ dermatitis | Risk of eczema ‐ dermatitis | ||||
| Cohort study (rate ratio) | Study population | Rate ratio 3.50 | 14,353 | ⊕⊝⊝⊝ | |
| 0 per 1000 | 0 per 1000 | ||||
| Cohort study (risk ratio) | Study population | RR 0.75 | 555 | ⊕⊕⊝⊝ | |
| 0 per 1000 | 0 per 1000 | ||||
| *The risk in the intervention group (and its 95% confidence interval) is based on the assumed risk in the comparison group and the relative effect of the intervention (and its 95% CI). | |||||
| GRADE Working Group grades of evidence | |||||
| 1Downgraded one level due to ascertainment bias which seriously weakens confidence in the results. | |||||
| Safety: hay fever, rhinoconjunctivitis, hypersensitivity/allergy | |||||
| Patient or population: children 9 months to 15 years old | |||||
| Outcomes | Anticipated absolute effects* (95% CI) | Relative effect | № of participants | Certainty of the evidence | |
|---|---|---|---|---|---|
| Risk of hay fever, rhinoconjunctivitis, hypersensitivity/allergy | Risk of hay fever, rhinoconjunctivitis, hypersensitivity/allergy | ||||
| Cohort study ‐ rhinoconjunctivitis | Study population | OR 0.64 | 489 | ⊕⊕⊝⊝ | |
| 211 per 1000 | 146 per 1000 | ||||
| Cohort study ‐ hypersensitivity/allergy | Study population | OR 0.63 | 544 | ⊕⊕⊝⊝ | |
| 429 per 1000 | 321 per 1000 | ||||
| Case control ‐ hay fever | Study population | OR 1.16 | 0 cases, 0 controls | ⊕⊕⊝⊝ | |
| 0 per 1000 | 0 per 1000 | ||||
| *The risk in the intervention group (and its 95% confidence interval) is based on the assumed risk in the comparison group and the relative effect of the intervention (and its 95% CI). | |||||
| GRADE Working Group grades of evidence | |||||
| 1Upgraded one level due to non‐critical risk of bias in the study. | |||||
| Safety: acute leukaemia | |||||
| Patient or population: children 9 months to 15 years old | |||||
| Outcomes | Anticipated absolute effects* (95% CI) | Relative effect | № of participants | Certainty of the evidence | |
|---|---|---|---|---|---|
| Risk of acute leukaemia | Risk of acute leukaemia | ||||
| Case‐control ‐ acute leukaemia | Study population | OR 0.97 | 941 cases, 1667 controls | ⊕⊕⊝⊝ | |
| 0 per 1000 | 0 per 1000 | ||||
| Case‐control ‐ acute lymphoblastic leukaemia | Study population | OR 0.91 | 1375 cases, 2316 controls | ⊕⊕⊝⊝ | |
| 0 per 1000 | 0 per 1000 | ||||
| Case‐control ‐ acute myeloblastic leukaemia | Study population | OR 0.56 | 62 cases, 1258 controls | ⊕⊕⊝⊝ | |
| 0 per 1000 | 0 per 1000 | ||||
| *The risk in the intervention group (and its 95% confidence interval) is based on the assumed risk in the comparison group and the relative effect of the intervention (and its 95% CI). | |||||
| GRADE Working Group grades of evidence | |||||
| Safety: demyelinating diseases ‐ multiple sclerosis ‐ acute disseminated encephalomyelitis | |||||
| Patient or population: children 9 months to 15 years old | |||||
| Outcomes | Anticipated absolute effects* (95% CI) | Relative effect | № of participants | Certainty of the evidence | |
|---|---|---|---|---|---|
| Risk of demyelinating diseases ‐ multiple sclerosis ‐ ADEM | Risk of demyelinating diseases ‐ multiple sclerosis ‐ ADEM | ||||
| Case‐control ‐ multiple sclerosis | Study population | OR 1.13 | 206 cases, 888 controls | ⊕⊕⊝⊝ | |
| 0 per 1000 | 0 per 1000 | ||||
| Case‐control ‐ ADEM | Study population | OR 1.03 | 272 cases, 1096 controls | ⊕⊕⊝⊝ | |
| 0 per 1000 | 0 per 1000 | ||||
| *The risk in the intervention group (and its 95% confidence interval) is based on the assumed risk in the comparison group and the relative effect of the intervention (and its 95% CI). | |||||
| GRADE Working Group grades of evidence | |||||
| Safety: gait disturbances | |||||
| Patient or population: children 9 months to 15 years old | |||||
| Outcomes | Anticipated absolute effects* (95% CI) | Relative effect | № of participants | Certainty of the evidence | |
|---|---|---|---|---|---|
| Risk of gait disturbances | Risk of gait disturbances | ||||
| Self‐controlled case series (hospitalisations) ‐ hospitalisations ‐ risk period: 0 to 60 days | Study population | Rate ratio 0.46 | 127 | ⊕⊕⊝⊝ | |
| 0 per 1000 | 0 per 1000 | ||||
| Self‐controlled case series (GP visits) ‐ GP visit ‐ risk period: 0 to 5 days | Study population | Rate ratio 1.88 | 1398 | ⊕⊕⊝⊝ | |
| 0 per 1000 | 0 per 1000 | ||||
| Self‐controlled case series (GP visits) ‐ GP visit ‐ risk period: 6 to 60 days | Study population | Rate ratio 0.93 | 1398 | ⊕⊕⊝⊝ | |
| 0 per 1000 | 0 per 1000 | ||||
| *The risk in the intervention group (and its 95% confidence interval) is based on the assumed risk in the comparison group and the relative effect of the intervention (and its 95% CI). | |||||
| GRADE Working Group grades of evidence | |||||
| Safety: bacterial or viral infections, immune overload | |||||
| Patient or population: children 9 months to 15 years old | |||||
| Outcomes | Anticipated absolute effects* (95% CI) | Relative effect | № of participants | Certainty of the evidence | |
|---|---|---|---|---|---|
| Risk of bacterial or viral infections, immune overload amongst | Risk of bacterial or viral infections, immune overload amongst | ||||
| Self‐controlled case series ‐ lobar pneumonia ‐ lobar pneumonia risk period (0 to 90 days) | Study population | Rate ratio 0.75 | 2412 | ⊕⊕⊝⊝ | |
| 0 per 1000 | 0 per 1000 | ||||
| Self‐controlled case series ‐ invasive bacterial infections ‐ invasive bacterial infections risk period (0 to 90 days) | Study population | Rate ratio 0.90 | 2412 | ⊕⊕⊝⊝ | |
| 0 per 1000 | 0 per 1000 | ||||
| Self‐controlled case series ‐ encephalitis meningitis ‐ encephalitis meningitis risk period (0 to 90 days) | Study population | Rate ratio 0.84 | 2025 | ⊕⊕⊝⊝ | |
| 0 per 1000 | 0 per 1000 | ||||
| Self‐controlled case series ‐ herpes ‐ herpes risk period (0 to 90 days) | Study population | Rate ratio 1.17 | 2025 | ⊕⊕⊝⊝ | |
| 0 per 1000 | 0 per 1000 | ||||
| Self‐controlled case series ‐ pneumonia ‐ pneumonia risk period (0 to 90 days) | Study population | Rate ratio 0.72 | 2025 | ⊕⊕⊝⊝ | |
| 0 per 1000 | 0 per 1000 | ||||
| Self‐controlled case series ‐ varicella zoster ‐ varicella zoster risk period (0 to 90 days) | Study population | Rate ratio 0.93 | 2025 | ⊕⊕⊝⊝ | |
| 0 per 1000 | 0 per 1000 | ||||
| Self‐controlled case series ‐ miscellaneous viral infections ‐ miscellaneous viral infections risk period (0 to 90 days) | Study population | Rate ratio 0.68 | 2025 | ⊕⊕⊝⊝ | |
| 0 per 1000 | 0 per 1000 | ||||
| *The risk in the intervention group (and its 95% confidence interval) is based on the assumed risk in the comparison group and the relative effect of the intervention (and its 95% CI). | |||||
| GRADE Working Group grades of evidence | |||||
Background
Description of the condition
Measles, mumps, and rubella (MMR) are serious diseases that can lead to potentially fatal illnesses, disabilities, and death. MMR is particularly prevalent in low‐income countries where vaccination programmes are inconsistent and mortality rates from disease are high. Large‐scale vaccination programmes have reduced MMR incidence, prevalence, and rates of complications in high‐income countries (Hambrosky 2015).
Measles is highly contagious with a case‐fatality rate ranging from 0.01% to 0.1% in high‐income countries to 3% to 30% in low‐income areas (Wolfson 2009). Otitis media (7% to 9%), pneumonia (8%), and diarrhoea (1% to 6%) are the most frequently reported complications of measles. These complications are responsible for the large proportion of measles‐related morbidity and mortality (Perry 2004). Pneumonia is the most common fatal complication of measles, occurring in 56% to 86% of measles‐related deaths (Bester 2016).
Rubella is an acute viral disease mostly affecting school‐aged children and young adults with high incidence and prevalence worldwide in the pre‐vaccine era (Lambert 2015). Women of childbearing age are susceptible to rubella infection before conception or during early pregnancy which can result in miscarriage, fetal death, or congenital rubella syndrome. These conditions are the most serious complications of rubella with incidence varying from fewer than 2 per 100,000 live births in the Americas and Europe to 121 per 100,000 live births in Africa and South East Asia (Vynnycky 2016).
Mumps is a viral infection that mostly affects children. Peak incidence occurs among those aged five to nine years (Hviid 2008). Annual incidence of 100 to 1000 cases/100,000 population was reported in the pre‐vaccine era with greater than 90% reduction after mumps vaccines were introduced (Hambrosky 2015). Orchitis (inflammation of the testicles) is the most common age‐related complication (12% to 66% of cases) (Yung 2011). The most serious complications are aseptic meningitis (1% to 10%) and deafness (4%) (Yung 2011).
Varicella (chickenpox) is a widespread and highly contagious infectious disease with peak incidence in children aged up to 15 years (Gershon 2015). Most epidemiological data are from high‐income countries and account for high pre‐vaccine incidence (from 320 to 1600 cases per 100,000) with case‐fatality rates of approximately 3 per 100,000 cases (Amjadi 2016; Helmuth 2015). Typically, varicella‐zoster virus (VZV) becomes latent in ganglionic neurons after primary infection, and reactivation may occur to cause zoster (shingles); risk increases with age (Gershon 2013).
Description of the intervention
The single‐component live attenuated vaccines of MMR were first licenced in the USA in the early 1960s (Plotkin 2017), and have been shown to be highly effective. Some combination vaccines were available from the early 1970s, including trivalent MMR vaccines; a combination of MMR with varicella (MMRV) was made available from 2005 (Plotkin 2017; WHO Position Paper 2017). At least two MMR vaccines are authorised worldwide and marketed widely:
-
MMR‐II or MMRVaxPro by Merck/MSD is a live‐virus vaccine. It is a sterile lyophilised preparation of 1000 TCID50 (50% tissue culture infectious doses) Enders' attenuated Edmonston measles strain propagated in chick embryo cell culture; mumps 20000 TCID50 Jeryl Lynn strain propagated in chick embryo cell culture; and rubella 1000 TCID50 Wistar RA 27/3 propagated on human diploid lung fibroblasts. The growth medium is medium 199 (5.7 mg) used with neomycin as stabiliser;
-
Priorix vaccine, Glaxo SmithKline Beecham (GSK), is a lyophilised mixed preparation of the attenuated Schwarz measles CCID50 (50% cell culture infective dose) strain; RIT 4385 mumps CCID50 (derived from Jeryl Lynn strain); and CCID50 Wistar RA 27/3 rubella strain of viruses. These are obtained separately by propagation either in chick embryo tissue cultures (mumps and measles) or MRC5 human diploid cells (rubella). The vaccine also contains residual amounts of neomycin (25 µg per dose).
A World Health Organization (WHO) pre qualified MMR vaccine has also been licenced by the Serum Institute of India/Masu Co Ltd for Asian markets. It is a sterile lyophilised preparation containing live attenuated Edmonston‐Zagreb measles virus (not less than 1000 CCID50), Leningrad‐Zagreb mumps virus (not less than 5000 CCID50), and Wistar RA 27/3 rubella virus (not less than 1000 CCID50).
Other commercial formulations of MMR vaccines have been used over the past 30 years, and to date are authorised in few countries, or have been withdrawn from marketing for commercial, safety, or both commercial and safety reasons:
-
Morupar by Chiron contains live attenuated Schwarz measles strain 1000 TCID50, propagated in chick embryo cell culture; Wistar RA 27/3 rubella strain 1000 TCID50, propagated on human diploid lung fibroblasts; and Urabe AM9 mumps 5000 TCID50, propagated in chick embryo cell culture, with neomycin as stabiliser (withdrawn globally because of increased allergic reactions due to the manufacturing process);
-
Trimovax by Pasteur‐Merieux Serums and Vaccines contains live attenuated Schwarz measles strain, 1000 CCID50; Urabe AM9 mumps strain, 5000 TCID50; and Wistar RA 27/3 rubella strain, 1000 TCID50;
-
Triviraten Berna contains live attenuated Edmonston‐Zagreb (EZ 19) measles strain, 1000 TCID50; Rubini mumps strain, 5000 TCID50; and Wistar RA 27/3 rubella strain, 1000 TCID50 propagated on human diploid cells. The product contains lactose (14 mg), human albumin (8.8 mg), sodium bicarbonate (0.3 mg), medium 199 (5.7 mg), and distilled water as solvent.
Two main MMRV combined vaccines are authorised for worldwide use and contain live attenuated Oka/Merck strain VZV:
-
ProQuad by Merck/MSD is a live‐virus vaccine with the same composition as MMR‐II/MMRVaxPro, including live attenuated Oka/Merck VZV strain, 3.99 log10 PFU (plaque forming units) propagated on MRC‐5 human diploid cells; and
-
Priorix Tetra by GSK is a live‐virus vaccine with the same composition as Priorix, including live attenuated Oka/Merck VZV strain, 103.3 PFU propagated on MRC‐5 human diploid cells.
The components of monovalent and subsequently combined MMR vaccine are described below (Plotkin 2017). Most attenuated measles vaccines currently produced worldwide are derived from the Edmonston strain. Vaccines containing non‐Edmonston‐derived strains are also in use, including Leningrad‐16, Shanghai‐191, CAM‐70, and TD97. In most cases the virus is cultured in chick embryo cells. However, a few vaccines are attenuated in human diploid cells. Most vaccines contain traces of antibiotics (e.g. 25 µg neomycin per dose), but some do not. Sorbitol and gelatine are used as stabilisers (Plotkin 2017; WHO Position Paper 2017).
More than 10 mumps vaccine strains (Jeryl Lynn, Urabe, Hoshino, Rubini, Leningrad‐3, L‐Zagreb, Miyahara, Torii, NK M‐46, S‐12, and RIT 4385) have been used throughout the world, but the Jeryl Lynn strain is the most widely used to date (Plotkin 2017). Although some manufacturers produce live mumps vaccines containing the Urabe AM9 virus strain, some countries have promptly stopped Urabe strain‐containing MMR vaccines because of concerns about vaccine‐associated meningitis. Viruses are often cultured in chick embryo fibroblasts (as with the Jeryl Lynn and Urabe strain‐containing vaccines), but quail and human embryo fibroblasts are also used. Most vaccines also contain neomycin (25 µg per dose) (WHO Position Paper 2017).
Most rubella vaccines used throughout the world contain the RA 27/3 virus strain. Exceptions are vaccines produced in Japan, which use different virus strains: Matsuba, DCRB 19, Takahashi, TO‐336 (cultured in rabbit kidney cells), and Matsuura (produced using quail embryo fibroblasts) (Plotkin 2017). The RA 27/3 strain is used most often because of consistent immunogenicity, induction of resistance to re‐infection, and low rate of adverse effects (WHO Position Paper 2017). The live virus produces viraemia and pharyngeal excretion, but both are of low magnitude and are non‐communicable (Plotkin 2017).
All available monovalent VZV vaccines consist of the Oka virus strain, which was subsequently attenuated by sequential passage in cultures of human embryonic lung cells, embryonic guinea pig cells, and the human diploid cell line WI‐38 or MCR‐5 (Plotkin 2017). The titre of VZV is around 14 times higher in the MMRV vaccines described than in the monovalent VZV vaccine (WHO Position Paper 2014).
How the intervention might work
Combined MMR (trivalent vaccine, containing measles, rubella, mumps strains), MMR+V (concurrent administration of MMR vaccine and varicella (chickenpox) vaccine), and MMRV (tetravalent vaccine containing measles, rubella, mumps, varicella strains) vaccines are widely recommended by health authorities and offer advantages over individual vaccines in the facilitation of current immunisation implementation strategies. Moreover, trivalent vaccines are included in the WHO Expanded Programme on Immunization, and are used in almost all European countries, the USA, Canada, Australia, New Zealand, and 100 other countries around the world (Orenstein 2018; WHO GVAP 2013). Quadrivalent MMRV vaccines are also recommended, but have to date been implemented in a limited number of countries where varicella vaccination is routinely recommended (WHO Immunization Monitoring 2019). According to accepted recommendations, the first dose of both MMR and MMRV should be administered on or after the child's first birthday (from 9 to 15 months of age), and the second dose at least 28 days later, or from 4 to 10 years of age (WHO Immunization Monitoring 2019; WHO Position Paper 2017). Combined vaccines provide a significant improvement in the efficiency of childhood immunisation, and a meaningful reduction in costs through increasing immunisation coverage against specific diseases with a single injection (Vesikari 2007).
Until 2011, single‐component measles vaccine was largely used in nearly all African and several Asian, and Western European WHO member states with different implementation strategies (single‐dose or second‐dose administration) (WHO GVAP 2013). A first dose of measles‐containing vaccine at nine months of age has been recommended in all countries with ongoing transmission and high risk of measles mortality among infants to ensure adequate protection. The introduction of a second measles‐containing vaccine dose at 15 to 18 months of age has been recommended when coverage of at least 80% for the first dose of measles‐containing vaccine has been reached for three consecutive years. By 2011, all 194 WHO member states had introduced or begun the process of introducing a two‐dose measles vaccination strategy through routine immunisation services, supplementary immunisation activity, or both (WHO Strategic Plan 2012). However, this policy was revised in April 2017, and recommended including the second measles vaccine dose in national vaccination schedules regardless of the coverage level (WHO Position Paper 2017). As of December 2010, 131 of the 194 WHO member states included MR or MMR combined vaccines in routine immunisation programmes (WHO Strategic Plan 2012). Relevant progress has been made toward the ambitious goals of the Global Measles and Rubella Strategic Plan 2012 to 2020 (WHO Strategic Plan 2012), with a further 23 of 194 WHO member states introducing a second dose of measles‐containing vaccine, and 17 countries introducing the rubella‐containing vaccine (Orenstein 2018).
Between 2000 and 2017, estimated measles vaccine coverage increased globally from 72% to 85%, with a reported 83% reduction of annual measles incidence and 80% reduction in estimated measles mortality (Dabbagh 2018). Estimated global rubella vaccine coverage increased from 39% to 46%, with high regional variability ranging from 12% in South East Asia to 94% in Europe (Orenstein 2018). According to Regional Verification Commissions in the American, European and Western Pacific Regions, the goal of measles elimination (end of endemic transmission for at least three years) had been reached by the end of 2015 in 61 member states (34/35, 21/53, and 6/27 member states respectively in the Americas, Europe, and western Pacific) and elimination of rubella in 55 member states (35/35 and 20/53 member states in the Americas and Europe, respectively) (Orenstein 2018; Perry 2015). However, measles elimination milestones have not been met in several countries in all WHO regions, and measles resurgence has been reported from 2017 to 2019 because of large outbreaks (Dabbagh 2018; Zimmerman 2019).
A global technical consultation requested by the WHO assessed the feasibility of measles elimination through mass immunisation and convened that eradication is biologically, technically, and operationally feasible (WHO 2011). MMR capability to eliminate the targeted diseases has been demonstrated in a number of countries and different scenarios.
The largest country to have ended endemic measles transmission is the USA, where the elimination of endemic measles had been previously verified in 2000 (CDC 2005; CDC 2012; Orenstein 2004). The interruption of indigenous transmission was first observed in 1993 after refining the elimination strategy to face the large resurgence of measles that occurred from 1989 to 1991 (CDC 1992; Watson 1998). Incidence has remained at less than 1 case per 1 million population continuously since 1997, with most measles cases from 2001 representing importations or import‐associated infections (CDC 2012; Fiebelkorn 2017). The elimination of rubella and congenital rubella syndrome was verified in 2004 by an external expert panel (CDC 2005). The incidence remained below 1 case per 10 million population with an annual median number of 10 cases (range 4 to 18 cases) (CDC 2012; Hinman 2011). Recent studies and reviews of USA measles and rubella outbreaks showed that most imported cases were unvaccinated people in areas with suboptima vaccination coverage and in regions where herd immunity threshold for first or second dose had not been reached, or both (Fiebelkorn 2017; Lee 2019; Papania 2014).
In Europe, measles and rubella outbreaks and endemic transmission persisted at regional levels due to suboptima vaccination coverage (Zimmerman 2019). Despite the substantial reduction of measles and rubella incidence, 21 of 53 countries in the European Union had interrupted the endemic transmission of measles, and 20 member states had interrupted endemic transmission of rubella (Muscat 2014; Orenstein 2018; WHO Regional Office for Europe 2016).
Finland was the first European country to end endemic measles transmission through a national vaccination programme as a two‐dose schedule launched in 1982, with an unremitting 95% coverage for both doses until 2017 (National Institute for Welfare and Health 2017; Peltola 2008). Incidence declined to 1 case per 1 million population for all MMR diseases in 1995, and in 1999 the country was documented as being free of indigenous measles, mumps, and rubella (Davidkin 2010). Since then, a few clusters of MMR imported cases have been observed annually without any outbreaks (WHO 2017).
After the introduction of MMR vaccine in 1988 for children aged 13 to 15 months with a catch‐up campaign for preschool‐aged children, the annual incidence of measles declined sharply in England and Wales, from 160/100,000 in 1989 to 17/100,000 in 1995 (Gay 1997; Ramsay 2003). The interruption of indigenous transmission was first observed in 1996 after a widespread vaccination campaign in 1994 and the introduction of the second MMR dose in 1995 (Vyse 2002). Nevertheless, endemic transmission in the UK re‐established in 2006 because of intense media coverage of the fraudulent Wakefield claim of a suspected link among MMR vaccines and autism (Public Health England 2019a). Moreover, an increased number of mumps‐confirmed cases were reported in England and Wales (Public Health England 2019b). However, after different nationwide vaccination campaigns, the UK had interrupted endemic transmission of measles and rubella by 2014, and elimination was certified in 2017 from the Regional Verification Commission for Measles and Rubella Elimination. Furthermore, a significant reduction of mumps cases in school‐aged children has been observed with persisting outbreaks in young adults (Public Health England 2019c).
Although varicella vaccines are licenced worldwide, a limited number of countries routinely recommend varicella vaccination with a one‐ or two‐dose programme (WHO Immunization Monitoring 2019). The USA was the first country to recommend a routine one‐dose programme in 1996, and an updated routine two‐dose programme in 2006 (Marin 2007). A progressive reduction of overall varicella incidence has been observed in target age groups, with more than 90% decrease in cases when maintaining coverage with two doses over 80%. Moreover, a significant reduction of zoster incidence has been observed in children and adolescents, but it is too early to observe the impact of childhood varicella vaccination in adults and the elderly (Harpaz 2019). Similar data have been reported in some European countries: Italy and Spain reported 75% and 89% reductions, respectively, despite lower rates of immunisation coverage (Bechini 2015; Garcia Cenoz 2013). No evidence suggested a shift of varicella disease burden to older age groups after the introduction of varicella vaccination, but significant reductions in hospitalisations, complications, and deaths have been reported globally (Wutzler 2017).
Why it is important to do this review
Despite its worldwide use, no systematic reviews studying the effectiveness and safety of MMR or MMRV vaccines are available.
Objectives
To assess the effectiveness, safety, and long‐ and short‐term adverse effects associated with the MMR (trivalent vaccine, containing measles, rubella, mumps strains), or MMR+V (concurrent administration of MMR vaccine and varicella vaccine), or MMRV (tetravalent vaccine containing measles, rubella, mumps, varicella strains), given to children aged up to 15 years.
Methods
Criteria for considering studies for this review
Types of studies
We included randomised controlled trials (RCTs), controlled clinical trials (CCTs), prospective and retrospective cohort studies (PCS/RCS), case‐control studies (CCS), interrupted time‐series (ITS) studies, case cross‐over (CCO) studies, case‐only ecological method (COEM) studies, self‐controlled case series (SCCS) studies, person‐time cohort (PTC) studies, and case‐coverage design/screening methods (CCD/SM) studies. See Appendix 1 for study design definitions (based on Farrington 2004; Harris 2006; Higgins 2011; Jefferson 1999; Last 2001; Maclure 1991; Morgenstern 1995). A study taxonomy is shown in Appendix 2.
Observational study design was crucial in this review because the main concern about MMR/V vaccination is in regard to safety. The cohort, case‐control, and case‐only studies are valid study designs to investigate the possible association between vaccination and rare adverse events (Farrington 2004).
Types of participants
Healthy children aged up to 15 years, or adults who received MMR or MMRV/MMR+V vaccination between 0 and 15 years of age. We included studies (or data sets) where participants received vaccination before 16 years of age. For studies conducted in the general population, only data regarding participants vaccinated under 15 years were included in analyses. Studies where most participants received vaccination when aged 16 years or older were excluded.
Types of interventions
Vaccination with any combined MMR or MMRV/MMR+V vaccine given in any dose, preparation, or time schedule compared with no intervention or placebo.
MMR (trivalent vaccine containing measles, rubella, mumps strains). MMR+V (concurrent administration of MMR vaccine and varicella vaccine). MMRV (tetravalent vaccine containing measles, rubella, mumps, varicella strains).
Types of outcome measures
Primary outcomes
-
Effectiveness: clinical and/or laboratory‐confirmed cases of measles, mumps, rubella, or varicella.
-
Safety: encephalitis or encephalopathy, aseptic meningitis, seizure (febrile/afebrile), autism spectrum disorders, inflammatory bowel disease, cognitive delay, developmental delay, idiopathic thrombocytopenic purpura, Henoch‐Schönlein purpura, type 1 diabetes, asthma, dermatitis or eczema, hay fever, rhinoconjunctivitis, hypersensitivity/allergy, acute leukaemia, demyelinating diseases, multiple sclerosis, encephalomyelitis, acute disseminated encephalomyelitis (ADEM), gait disturbances, bacterial or viral infections.
Secondary outcomes
-
Short‐term side effects: local reactions (e.g. soreness and redness at the site of inoculation) and systemic reactions (e.g. fever, rash, vomiting, and diarrhoea) following MMR or MMRV vaccination.
Search methods for identification of studies
Electronic searches
We searched the following databases up to 2 May 2019:
-
the Cochrane Central Register of Controlled Trials, which contains the Cochrane Acute Respiratory Infections Group's Specialised Register (CENTRAL; 2019, Issue 5) in the Cochrane Library using the strategy in Appendix 3;
-
MEDLINE via PubMed (from 1966 to 2 May 2019) using the strategy in Appendix 3; and
-
Embase via Elsevier (from 1974 to 2 May 2019) using the strategy in Appendix 3.
We searched the following trial registers on 2 May 2019:
-
US National Institutes of Health Ongoing Trials Register ClinicalTrials.gov (www.clinicaltrials.gov); and
-
World Health Organization International Clinical Trials Registry Platform (WHO ICTRP) (apps.who.int/trialsearch).
We used the strategies in Appendix 3 and did not restrict the results by language or publication status (published, unpublished, in press, or in progress).
Searching other resources
For effectiveness trials, we searched bibliographies of all relevant articles obtained and any published reviews for additional studies. We also searched trial registers (WHO ICTRP and ClinicalTrials.gov) for unpublished, prospectively registered trials. For safety trials, we assessed bibliographies of all relevant articles and any published reviews for additional studies. We imposed no language restrictions on all searches.
Data collection and analysis
Selection of studies
Two review authors (CDP, AR) independently applied the inclusion criteria to all identified and retrieved articles. A third review author (VD) arbitrated in case of disagreements about the eligibility of a study.
Data extraction and management
Two review authors (CDP, AR) independently performed data extraction using a data extraction form (Appendix 4). A third review author (VD) checked data extraction and arbitrated in case of disagreement. For each study, relevant information was summarised and reported by main outcomes in Additional tables and Characteristics of included studies.
We used a two‐letter prefix to distinguish types of study designs and whether these related to effectiveness/efficacy or safety (only). The first letter signifies the study design (a = RCT, b = case control, c = cohort, d = self‐controlled case series, e = case cross‐over, f = case‐coverage design, g = case‐only ecological method, h = interrupted time series), and the second letter signifies the endpoint (a = effectiveness/efficacy, b = safety only). See Appendix 2.
We classified the funding sources of included studies as follows.
-
Government or not‐for‐profit organisation: explicitly stated that funding sources were public institutions, not‐for‐profit organisations, health department, or other government institutions. All authors were affiliated with public institutions, and none were affiliated with the pharmaceutical industry. All critical aspects of the research (participant selection, outcome assessment, statistical analysis, vaccine supplies) were conducted without pharmaceutical industry support.
-
Pharmaceutical industry: explicitly declared that funding was provided by the pharmaceutical industry. All authors were affiliated with the pharmaceutical industry. All critical aspects of the research (participant selection, outcome assessment, statistical analysis, vaccine supplies) were conducted with pharmaceutical industry support.
-
Mixed (government and pharmaceutical industry): at least one author was affiliated with the pharmaceutical industry. Statistical analysis was conducted with pharmaceutical industry support. Study vaccines were supplied by the pharmaceutical industry.
-
Not stated or unclear: funding source was not declared, therefore it was not possible to apply the funding classification criteria.
Assessment of risk of bias in included studies
Two review authors (CDP, AR) independently assessed the methodological quality of the included studies (Appendix 5). We assessed the quality of RCTs and quasi‐RCTs using criteria adapted from the Cochrane Handbook for Systematic Reviews of Interventions (Higgins 2011). We assessed the quality of non‐RCTs in relation to the presence of potential confounders that could make interpretation of the results difficult. We evaluated the quality of case‐control (prospective and retrospective) and cohort studies using the appropriate Newcastle‐Ottawa Scales (Stang 2010; Wells 2000). We applied quality control assessment grids based on those developed by the University of York, NHS Centre for Reviews and Dissemination (Appendix 5) to historical controlled trials (HCTs), interrupted time‐series (Khan 2001).
Experimental and quasi‐experimental studies
See Appendix 5.
Random sequence generation
-
Low risk of bias: e.g. a table of random numbers or computer‐generated random numbers.
-
High risk of bias: e.g. alternation, date of birth, day of the week, or case record number.
-
Unclear risk of bias: if insufficient information was provided.
Allocation concealment
-
Low risk of bias: e.g. numbered or coded identical containers were administered sequentially; an on‐site computer system that could only be accessed after entering the characteristics of an enrolled participant; or serially numbered, opaque, sealed envelopes, or sealed envelopes that were not sequentially numbered.
-
High risk of bias: e.g. an open table of random numbers.
-
Unclear risk of bias: if insufficient information was provided.
Blinding
-
Low risk of bias: if adequate double‐blinding (e.g. placebo vaccine) or single‐blinding (i.e. blinded outcome assessment) was used.
-
High risk of bias: if there was no blinding.
-
Unclear risk of bias: if insufficient information was provided.
Incomplete outcome data
-
Low risk of bias: no missing data, or the proportion of missing data compared with the observed event risk was not enough to have a clinically relevant impact on the intervention effect estimate.
-
High risk of bias: when the proportion of missing data compared with observed event risk was large enough to induce clinically relevant bias in the intervention effect estimate.
-
Unclear risk of bias: if insufficient information was provided.
Non‐experimental studies
See Appendix 5.
We used different methodological quality checklists (unpublished) for the different case‐only design studies for:
-
self‐controlled case series (SCCS) and person‐time cohort (PTC) checklist based on Farrington 2004 and Petersen 2016;
-
case cross‐over studies (CCO) checklist was based on Farrington 2004 and Maclure 1991; and
-
case‐coverage methods/screening method (CCM/SM); and for case‐only ecological method (COEM) studies checklist was based on Farrington 2004.
We assessed evidence quality as a component of interpreting the overall results. We assigned the following 'Risk of bias' categories (Higgins 2011):
-
low risk of bias: plausible bias unlikely to seriously alter the results;
-
unclear risk of bias: plausible bias that raises some doubt about the results; and
-
high risk of bias: plausible bias that seriously weakens confidence in the result.
Measures of treatment effect
We used risk ratio (RR) and its confidence interval (CI) as measures of effect for RCT and cohort studies. We used the odds ratio (OR) and its CI for case‐control studies. The usual effect measure for case‐only studies is the rate ratio (rr). We calculated vaccine efficacy (or effectiveness) as VE = (1 − effect estimate) x 100, expressed as a percentage. For cohort and RCT/CCT studies VE = (1 − RR) x 100. For case‐control studies VE = (1 − OR) x 100. For study designs adopting the rr as effect measure (rate = events/person‐time), the vaccine effectiveness is VE = (1 − rr) x 100.
The inclusion of different studies involved different estimation methods and statistical models, so we are dealing with different measures of effect. Cohort studies may use the RR to compare two groups, or more sophisticated statistical models such as the logistic regression model or the proportional hazard regression model, where the effect measures reported are OR or hazard ratio (HR), respectively. Case‐control studies adopt the logistic regression model, so the effect measure is the OR. Case‐only studies design (SCCS, person‐time cohort, case cross‐over studies) use the Poisson regression model. In this case the effect measure is rr. Consequently, in order to perform meta‐analysis in some cases we had to convert one measure of the effect into another using the formulae described in Higgins 2011.
We converted temperatures to degrees celsius (°C) using the formula °C = (Fahrenheit − 32)/1.8.
Unit of analysis issues
We considered analytical studies that provided data at the person‐level for this review. The only ecological design considered was case‐only ecological study (COES). The differences between ecological study design and case‐only ecological study are described in Appendix 1.
Where several vaccine arms from the same study design were included in the same analysis, we split the placebo group equally between the different arms, so that the total number of participants in a single analysis did not exceed the actual number in the study.
Dealing with missing data
For this update we wrote to study authors to request missing data or for clarification. The response was disappointing, and we desisted from further attempts. Our analysis relies on existing data. Whenever possible we used the intention‐to‐treat (ITT) population. When necessary and possible we used strategies described in Di Pietrantonj 2006 to impute missing outcome data.
Assessment of heterogeneity
We calculated the I² statistic for each pooled estimate to assess the impact of statistical heterogeneity. The I² statistic can be interpreted as the proportion of total variation amongst effect estimates due to heterogeneity rather than sampling error, and is intrinsically independent from the number of studies. When the I² statistic is less than 30%, there is little concern about statistical heterogeneity (Higgins 2011). We used random‐effects models throughout to take account of the between‐study variance in our findings (Higgins 2011). Not all studies reported detail sufficient to enable a full analysis of the sources of heterogeneity.
Assessment of reporting biases
A detailed description of the study quality is provided in the Risk of bias in included studies section. We assessed publication bias by inspecting the funnel plots and heterogeneity (I²) (see Assessment of heterogeneity). Due to the limited number of studies in each comparison, the assessment of publication bias was not applicable. Since the evidence presented in this review originated mainly from published data, we cannot be sure that our results are not affected by publication bias. We were unable to retrieve unpublished papers, thus our results could be affected by publication bias.
Data synthesis
We carried out quantitative and qualitative data syntheses separately for efficacy/effectiveness and safety. We grouped studies for quantitative analysis according to study design (see Types of studies), vaccine type (MMR, MMRV, MMR+V), virus strain, and study settings. We incorporated heterogeneity into the pooled estimates by using the DerSimonian Laird random‐effects model.
Most of the studies included in this review were observational studies, therefore quantitative synthesis is performed on adjusted estimates by multivariate models. The estimates are adjusted for age and gender. The multicentre studies also take into account the geographical area, address, school, paediatric practice, and health organisation/insurance. Some studies adjusted estimates for the health history and health status of the older siblings.
As explained in the Measures of treatment effect section, the different studies involved different statistical models and estimation methods, so we are dealing with different measures of effect. Consequently, in some cases, in order to perform the meta‐analysis, we converted one measure of effect into another using the formulae described in Higgins 2011.
The cohort studies on MMR vaccine effectiveness against measles and mumps present estimates not adjusted by multivariate models but report binary data (fourfold frequency table) stratified by doses. In this case, the quantitative synthesis is performed on binary data. If some studies reported adjusted estimates, we used the method described in Di Pietrantonj 2006 to convert adjusted effect estimates into adjusted binary data.
We used RR for comparisons between vaccine and placebo/control groups for RCTs and cohort studies. We used rr for cohort studies using Poisson regression or the proportional hazard regression model. We OR for case‐control studies and rr for case‐only study designs.
We classified and discussed included studies according to the type of outcomes for which they provided evidence, effectiveness, and possible association with harms or local and systemic adverse effects. We illustrated study characteristics, design, population, and outcomes definitions in Additional tables.
Subgroup analysis and investigation of heterogeneity
We planned to carry out subgroup analyses where data were available, as follows.
-
Age group
-
aged < 5 years, aged 5 to 10 years;
-
aged < 6 years, aged 11 to 16 years; and
-
aged < 1 year, aged 1 to 4 years, aged 5 to 14 years.
-
-
Number of doses administered
-
all doses, 1 dose, 2 doses, at least 1 dose (or any dose).
-
-
Length of follow‐up
-
< 5 years, 5 to 10 years.
-
-
Risk period (self‐controlled case series)
-
0 to 30 days, 31 to 60 days, 61 to 90 days.
-
-
Disease severity
-
moderate, severe.
-
Sensitivity analysis
We had planned to perform a sensitivity analysis on results by applying fixed‐effect and random‐effects models to assess the impact of heterogeneity on our results. We performed a sensitivity analysis by excluding studies at high risk of bias to assess the robustness of our conclusions.
Summary of findings and assessment of the certainty of the evidence
We created 21 'Summary of findings' tables using the outcomes listed in Appendix 6.
-
Effectiveness against measles
-
Effectiveness against mumps
-
Effectiveness against rubella
-
Effectiveness against varicella
-
Safety ‐ short‐term side effects
-
Safety ‐ encephalitis or encephalopathy
-
Safety ‐ aseptic meningitis
-
Safety ‐ seizures (febrile/afebrile)
-
Safety ‐ autism spectrum disorders
-
Safety ‐ inflammatory bowel disease
-
Safety ‐ cognitive/developmental delay
-
Safety ‐ idiopathic thrombocytopenic purpura
-
Safety ‐ Henoch‐Schönlein purpura
-
Safety ‐ type 1 diabetes
-
Safety ‐ asthma
-
Safety ‐ eczema/dermatitis
-
Safety ‐ hay fever, rhinoconjunctivitis, hypersensitivity/allergy
-
Safety ‐ acute leukaemia
-
Safety ‐ demyelinating diseases ‐ multiple sclerosis ‐ acute disseminated encephalomyelitis (ADEM)
-
Safety ‐ gait disturbances
-
Safety ‐ bacterial or viral infections, immune overload
We used the five GRADE considerations (study limitations, consistency of effect, imprecision, indirectness, and publication bias) to assess the quality of a body of evidence as it relates to the studies that contributed data to the meta‐analyses for the prespecified outcomes (Atkins 2004). We used the methods and recommendations described in Section 8.5 and Chapter 12 of the Cochrane Handbook for Systematic Reviews of Interventions (Higgins 2011), employing GRADEpro GDT software (GRADEpro GDT 2015). We justified all decisions to down‐ or upgrade the quality of studies using footnotes, and made comments to aid readers’ understanding of the review where necessary.
Results
Description of studies
Results of the search
We updated searches on 2 May 2019 and identified 13,196 records for screening. We retrieved 101 papers after reviewing titles and abstracts, 74 of which we considered for this 2019 update. We also evaluated 16 studies identified as awaiting classification in our previous update (Demicheli 2012), of which we considered 12 studies. We included a total of 74 new studies, plus 12 studies from our previous update, for a total of 86 new included studies for this 2019 update. This review includes a total of 138 studies (see Figure 1; Figure 2).
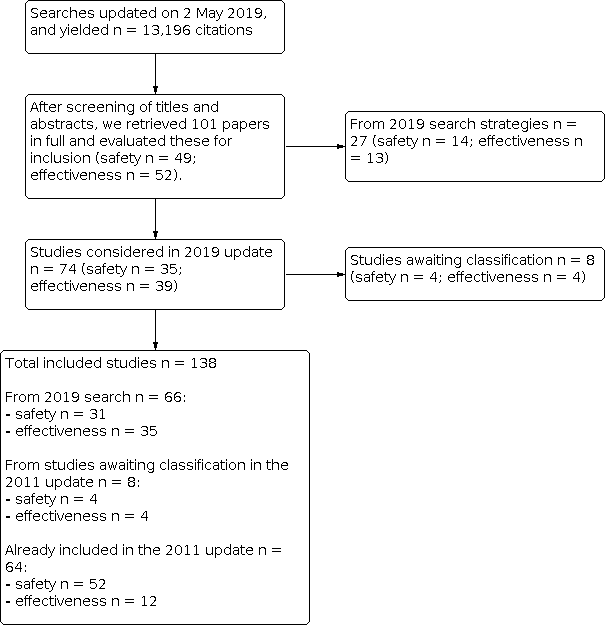
Flow diagram (simplified version).
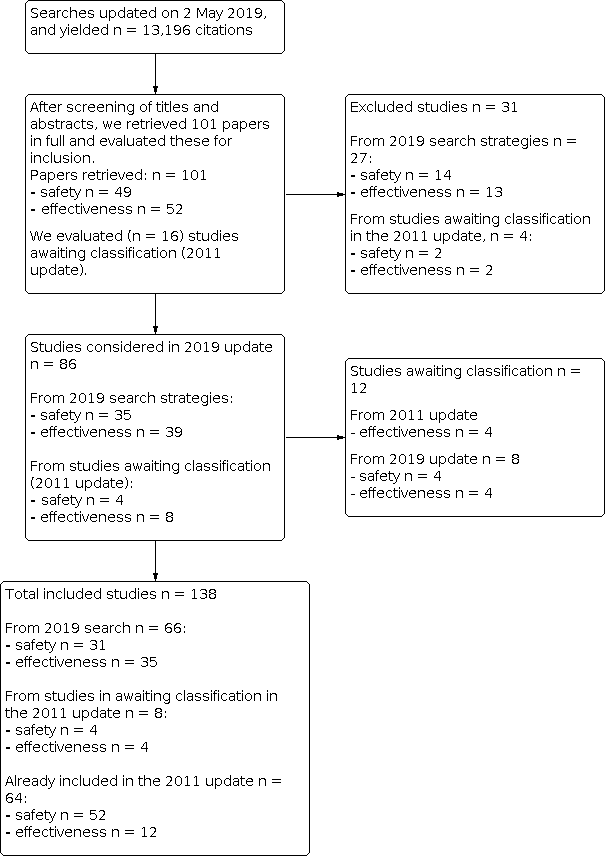
Flow diagram (complete).
Included studies
We included nine randomised controlled trials (RCTs) (aa‐Henry 2018; aa‐Povey 2019; aa‐Prymula 2014; ab‐Bloom 1975; ab‐Edees 1991; ab‐Freeman 1993; ab‐Lerman 1981; ab‐Peltola 1986; ab‐Schwarz 1975); one controlled clinical trial (CCT) (ab‐Ceyhan 2001); 63 cohort studies (PCS/RCS) (ca‐Arciuolo 2017; ca‐Arenz 2005; ca‐Barrabeig 2011a; ca‐Barrabeig 2011b; ca‐Bhuniya 2013; ca‐Chamot 1998; ca‐Chang 2015; ca‐Choe 2017; ca‐Compés‐Dea 2014; ca‐Giaquinto 2018; ca‐Greenland 2012; ca‐Hales 2016; ca‐La Torre 2017; ca‐Livingston 2013; ca‐Lopez Hernandez 2000; ca‐Ma 2018; ca‐Marin 2006; ca‐Marolla 1998; ca‐Musa 2018; ca‐Nelson 2013; ca‐Ogbuanu 2012; ca‐Ong 2005; ca‐Ong 2007; ca‐Rieck 2017; ca‐Schlegel 1999; ca‐Snijders 2012; ca‐Spackova 2010; ca‐Tafuri 2013; ca‐Takla 2014; ca‐Wichmann 2007; ca‐Woudenberg 2017; cb‐Ahlgren 2009; cb‐Barlow 2001; cb‐Beck 1989; cb‐Benjamin 1992; cb‐Benke 2004; cb‐Beyerlein 2017; cb‐DeStefano 2002; cb‐Dunlop 1989; cb‐Gavrielov‐Yusim 2014; cb‐Hviid 2004; cb‐Hviid 2008; cb‐Hviid 2019; cb‐Jacobsen 2009; cb‐Jain 2015; cb‐Klein 2010; cb‐Klein 2012; cb‐Klein 2017; cb‐Madsen 2002; cb‐Makino 1990; cb‐McKeever 2004; cb‐Miller 1989; cb‐Mrozek‐Budzyn 2013; cb‐Robertson 1988; cb‐Rowhani‐Rahbar 2013; cb‐Schink 2014; cb‐Sharma 2010; cb‐Stokes 1971; cb‐Swartz 1974; cb‐Timmermann 2015; cb‐Uchiyama 2007; cb‐Vestergaard 2004; cb‐Weibel 1980); 35 case‐control studies (CCS) (ba‐Andrade 2018; ba‐Castilla 2009; ba‐Cenoz 2013; ba‐Defay 2013; ba‐Fu 2013; ba‐Giovanetti 2002; ba‐Goncalves 1998; ba‐Harling 2005; ba‐Hungerford 2014; ba‐Jick 2010; ba‐Kim 2012; ba‐Liese 2013; ba‐Mackenzie 2006; ba‐Vazquez 2001; bb‐Ahlgren 2009; bb‐Baron 2005; bb‐Bertuola 2010; bb‐Black 1997; bb‐Black 2003; bb‐Bremner 2005; bb‐Bremner 2007; bb‐Chen 2018; bb‐Da Dalt 2016; bb‐Davis 2001; bb‐De Stefano 2004; bb‐Dockerty 1999; bb‐Groves 1999; bb‐Ma 2005; bb‐Mallol‐Mesnard 2007; bb‐Mrozek‐Budzyn 2010; bb‐Ray 2006; bb‐Shaw 2015; bb‐Smeeth 2004; bb‐Uno 2012; bb‐Vcev 2015); 16 self‐controlled case series/person‐time cohort studies (SCCS/PTC) (db‐Andrews 2012; db‐Dourado 2000; db‐Farrington 1995; db‐France 2008; db‐Macartney 2017; db‐MacDonald 2014; db‐Makela 2002; db‐McClure 2019; db‐Miller 2003; db‐Miller 2005; db‐Miller 2007; db‐O'Leary 2012; db‐Perez‐Vilar 2018; db‐Stowe 2009; db‐Taylor 1999; db‐Ward 2007); 3 case cross‐over studies (CCO) (eb‐Ki 2003; eb‐Lafaurie 2018; eb‐Park 2004); and 11 case‐only ecological method studies (COEM) (ga‐Boccalini 2015; ga‐Pozza 2011; ga‐Tafuri 2015; gb‐da Cunha 2002; gb‐da Silveira 2002; gb‐Fombonne 2001; gb‐Fombonne 2006; gb‐Honda 2005; gb‐Jonville‐Bera 1996; gb‐Seagroatt 2005; gb‐Taylor 2002).
We classified studies reported as field trials or controlled trials as cohort studies when the allocation procedure was not mentioned.
Vaccine effectiveness
We included 51 studies on MMR/MMRV effectiveness with the following study designs: 3 RCTs/CCTs, 31 cohorts, 14 case‐control, and 3 COEM. Two studies reported vaccine efficacy data against two diseases (measles and mumps) and were thus included in two different comparisons (ca‐La Torre 2017; ca‐Marolla 1998). We presented studies evaluating effectiveness in four main comparisons, as follows.
-
Measles: 17 studies included effectiveness data: 14 cohort studies, ca‐Arciuolo 2017; ca‐Arenz 2005; ca‐Barrabeig 2011a; ca‐Barrabeig 2011b; ca‐Bhuniya 2013; ca‐Choe 2017; ca‐Hales 2016; ca‐La Torre 2017; ca‐Marin 2006; ca‐Marolla 1998; ca‐Musa 2018; ca‐Ong 2007; ca‐Wichmann 2007; ca‐Woudenberg 2017, and 3 CCS (ba‐Defay 2013; ba‐Hungerford 2014; ba‐Jick 2010). See also Table 1 and Table 2.
-
Mumps: 21 studies included effectiveness data: 14 cohort studies, ca‐Chamot 1998; ca‐Compés‐Dea 2014; ca‐Greenland 2012; ca‐La Torre 2017; ca‐Livingston 2013; ca‐Lopez Hernandez 2000; ca‐Ma 2018; ca‐Marolla 1998; ca‐Nelson 2013; ca‐Ogbuanu 2012; ca‐Ong 2005; ca‐Schlegel 1999; ca‐Snijders 2012; ca‐Takla 2014, and 7 CCS (ba‐Castilla 2009; ba‐Fu 2013; ba‐Giovanetti 2002; ba‐Goncalves 1998; ba‐Harling 2005; ba‐Kim 2012; ba‐Mackenzie 2006). See also Table 3 and Table 4.
-
Rubella: 1 cohort study included effectiveness data (ca‐Chang 2015). See also Table 5.
-
Varicella: 14 studies included effectiveness data: 3 RCTs (aa‐Henry 2018; aa‐Povey 2019; aa‐Prymula 2014), 4 cohort studies (ca‐Giaquinto 2018; ca‐Rieck 2017; ca‐Spackova 2010; ca‐Tafuri 2013), 4 CCS (ba‐Andrade 2018; ba‐Cenoz 2013; ba‐Liese 2013; ba‐Vazquez 2001), and 3 COEM (ga‐Boccalini 2015; ga‐Pozza 2011; ga‐Tafuri 2015). See also Table 6, Table 7, Table 8, and Table 9.
| Study | Population | Case definition | Vaccine/strain | N vaccinated | N control | N events in exposed/ | Vaccine effectiveness |
|---|---|---|---|---|---|---|---|
| Children attending day‐care and preschool centres (a) ≥ 15 months (all ages) (b) 15 to 23 months (c) 24 to 35 months (d) ≥ 36 months ‐‐‐‐‐‐‐‐‐‐‐‐‐‐‐‐‐‐‐‐‐ (e) Indirect effectiveness (e1) 12 to 23 months (e2) 24 to 35 months (e3) ≥ 36 months | Confirmed measles was defined as laboratory‐confirmed case or met the WHO clinical case definition and was epidemiologically linked to laboratory‐confirmed case. | Priorix/Schwarz or dose 1 at 9 to 12 months dose 2 at 15 months | (a) N = 1027 (any dose) (a1) N = 830 (1 dose) (a2) N = 197 (2 doses) (b) N = 269 (any doses) (c) N = 384 (any doses) (d) N = 374 (any doses) | (a) n = 94 (b) n = 57 (c) n = 20 (d) n = 17 unvaccinated | (a) 5/1027 versus 12/94 (a1) 5/830 versus 12/94 (a2) 0/197 versus 12/94 (b) 3/296 versus 6/57 (c) 1/384 versus 4/20 (d) 1/374 versus 2/17 | (a) 96.2% (89.4% to 98.6%) (a1) 95.3% (86.9% to 98.%) (a2) 100% (‐% to ‐%) (b) 89.4% (58.9% to 97.3%) (c) 98.7% (88.9% to 99.8%) (d) 97.7% (76.1% to 99.8%) VE = (1 − RR) x 100 ‐‐‐‐‐‐‐‐‐‐‐‐‐‐‐‐‐‐‐‐‐‐‐‐‐‐‐‐‐ (e1) 71.1% (63.5% to 78.8%) (e2) 80.0% (56.3% to 94.3%) (e3) 88.2% (63.6% to 98.5%) VE = (ARU − ARV)/ARU x 100 | |
| Children aged 9 to 59 months (at 30 June 2011) (a) 9 to 59 months (b) 9 to 12 months (c) > 12 months | A clinical case of measles is defined as fever with maculopapular rash and either conjunctivitis or cough or coryza (catarrhal inflammation of the mucous membrane in the nose). A confirmed case of measles is defined as a clinical case who is positive for anti‐measles virus nucleoprotein immunoglobulin M antibodies in serological tests but has not been vaccinated against measles during last 1 month. | MMR vaccine not described | (a) N = 50 (1 dose) | (a) N = 18 | (a) 15/50 versus 16/18 | (a) 66.3% (46.9% to 78.6%) (b) 66.6%(*) (c) 65.4%(*) (*) no statistical evidence VE = (1 − RR) x 100 | |
| Outbreak at a university in 2014 Students born between 1984 and 1993. N = 14,465 VE > 10 years after vaccination | The definition of suspected measles case was individuals with All suspected cases were quarantined | MMR/not stated 2 doses | N = 11448 | N = 3017 | 52/11448 versus 33/3017 | 60% (38.2% to 74.1%) VE = (1 − RR) x 100 | |
| N = 11,004 children born between 2008 and 2010 who underwent vaccination in 2009 to 2011. Follow‐up = 24 months | Hospitalisation for (a) measles (b) mumps (see also Table 3) (c) measles and mumps (d) all infectious diseases (e) all respiratory diseases The effectiveness of MMR vaccine in reducing hospitalisations by analysing 2 distinct databases (vaccination record) and (hospital discharge): contained the following ICD‐9 codes in primary or secondary diagnosis: 001 to 139 for infectious and parasitic diseases; 460 to 519 for respiratory diseases | MMR not described the vaccination records of the database of the Roma Local Health Unit from which relevant data were extracted, such as date of birth; MMR vaccination (yes/no); MMR dose (only for vaccinated); personal tax code. The cohort was recomposed through record linkage of the 2 vaccination of hospital discharge tax codes as a common identification | (1) 1 dose N = 5392 (2) 2 doses N = 3310 (3) any dose N = 8702 | Unvaccinated N = 2302 | (a1) 3/5392 versus 9/2302 (a2) 0/3310 versus 9/2302 (a3) 3/8702 versus 9/2302 (b1) 1/5392 versus 1/2302 (b2) 0/3310 versus 1/2302 (b3) 1/8702 versus 1/2302 (c1) 4/5392 versus 10/2302 (c2) 0/3310 versus 10/2302 (c3) 4/8702 versus 10/2302 (d1) 82/5392 versus 262/2302 (d2) 70/3310 versus 262/2302 (d3) 414/8702 versus 262/2302 (e1) 202/5392 versus 424/2302 (e2) 183/3310 versus 424/2302 (e3) 809/8702 versus 424/2302 | Unadjusted estimates (a1) 85.8% (47.5% to 96.1%) (*) no statistical evidence VE = (1 − RR) x 100 ‐‐‐‐‐‐‐‐‐‐‐‐‐‐‐‐‐‐‐‐‐‐‐‐ Adjusted estimates any doses (a) 91% (68% to 99%) (b) not reported (c) 90% (66% to 97%) (d) 71% (66% to 75%) (e) 82% (52% to 93%) VE = (1 − HR)*100 | |
| Children (19 to 67 months) whose parent required a paediatrician visit during a measles outbreak peak | Clinical diagnosis | (a) Pluserix (c) Triviraten vaccination records | (a) N = 329 (1 dose) (b) N = 747 (1 dose) (c) N = 1023 (1dose) | N = 646 unvaccinated | (a) 0/329 versus 114/646 (b) 2/747 versus 114/646 (c) 8/1023 versus 114/646 ‐‐‐‐‐‐‐‐‐‐‐‐‐‐ (a) 0/ 19,836 PT (b) 2/ 12,906 PT (c) 8/ 31,329 PT (control) 114/22,188 PT = person‐time in months | (a) 100% (‐% to ‐%) (b) 97% (88% to 99%) VE = (ARU − ARV)/ARU x 100 | |
| Children aged up to 14 years. N = 2784 (children aged > 14 years, N = 2300). Data were presented by age group. The study included all students in 40 classes with 1 or more registered measles cases in the period February 2014 to September 2015. VE ≤ 5 years since vaccination 6 to 14 years since vaccination | Measles diagnosis was confirmed according to WHO guidelines. The clinical criteria case confirmation were measles IgM antibody detection, or | MMR/not stated (a) 1 dose (b) 2 doses (c) ≤ 5 years since vaccination (d) 6 to 14 years since vaccination | (a) N = 100 (b) N = 606 (c) N = 20 (d) N = 76 | N = 95 | (a) 3/100 versus 35/95 (b) 6/606 versus 35/95 (c) 1/20 versus 35/95 (d) 2/76 versus 35/95 | (a) 91.9% (74.4% to 97.4%) VE = (1 − RR) x 100 | |
| Children from primary school in Singapore (aged 8 to 14 years, > 5 years since vaccination) during a measles outbreak | Clinical with laboratory confirmation. Active survey and serological confirmation | MMR vaccine not described Vaccination status was ascertained from health booklet. | N = 171 (1 dose) | N = 13 unvaccinated | 2/171 versus 7 /13 | 97.8% (90.6% to 99.5%) VE = (1 − RR) x 100 | |
| School outbreak 2006. Students aged 10 to 15 years (N = 875) VE < 10 years after vaccination > 10 years after vaccination | Clinical or laboratory | MMR/not stated (a) 1 dose (b) 2 doses (c) unknown ‐‐‐‐‐‐‐‐‐‐‐‐‐‐‐‐‐‐‐‐‐‐ | All ages (a) N = 199 (b) N = 561 (c) N = 218 ‐‐‐‐‐‐‐‐‐‐‐‐‐‐‐‐ 10 to 15 years (a) N =196 ‐‐‐‐‐‐‐‐‐‐‐‐‐‐‐‐ (b) N = 59 (c) N = 74 | All ages N = 36 ‐‐‐‐‐‐‐‐‐‐‐‐‐‐‐‐‐ 10 to 15 years N = 33 | All ages (a) 2/199 versus 19/36 (b) 2/5611 versus 19/36 (c) 30/218 versus 19/36 ‐‐‐‐‐‐‐‐‐‐‐‐‐‐‐ 10 to 15 years (a) 2/196 versus 18/33 (b) 2/502 versus 18/33 ‐‐‐‐‐‐‐‐‐‐‐‐‐‐‐ (c) 5/74 versus 1/3 | All ages (c) 73.9% (59.0% to 83.4%) VE = (1 − RR) x 100 ‐‐‐‐‐‐‐‐‐‐‐‐‐‐‐‐‐‐‐‐‐‐‐‐‐‐‐‐‐‐‐‐‐‐‐‐ 10 to 15 years ‐‐‐‐‐‐‐‐‐‐‐‐‐‐‐‐‐‐‐‐‐‐‐‐‐‐‐‐‐‐‐‐‐‐‐‐ (a) 66.7% (*) (b) 97.8% (53.7% to 99.9%) (c) 79.7% (*) (*) no evidence | |
| Infants aged 6 to 14 months living in municipalities where coverage with the first dose of MMR vaccine was < 90%. Infants aged 6 to 11 months were offered an extra vaccination (and would thus still be eligible for their second MMR vaccination at the age of 14 months). Infants aged 12 to 14 months were offered an early MMR vaccination as an alternative to the regular time point at 14 months of age. All infants were eligible for another dose of MMR scheduled at 9 years of age. | Laboratory‐confirmed measles N = 1080 infants eligible for analysis laboratory‐confirmed | MMR vaccine: (M‐M‐RVAXPRO; Sanofi Pasteur MSD). This vaccine contains measles virus Enders’ Edmonston strain. Vaccination status was checked in the national vaccination register. Parents were asked whether their infant(s) had had measles in the preceding 3 months. | N = 919 | N = 311 | 3/106,631 (PT‐days) versus 10/23,769 (PT‐days) | HR (95% CI)(*) 0.29 (0.05 to 1.72) (*) adjusted estimates Cox proportional VE = 1 − HR | |
| Household contacts 55 families, 43 children (a) 1 dose (b) 2 doses (c) any dose | Clinical | MMR/strain | (a) N = 13 (b) N = 4 | N = 26 | (a) 1/13 versus 19/26 (b) 0/4 versus 19/26 (c) 1/20 versus 19/26 | (a) 96.9% (71.8% to 99.7%) (b) 95.7% (10.6% to 99.8%) (c) 97.7% (79.3% to 99.7%) VE = (1 − RR) x 100 ‐‐‐‐‐‐‐‐‐‐‐‐‐‐‐‐‐‐‐‐‐‐ (a) 90% (35% to 97%) (b) not reported (c) 92% (48% to 98%) VE = (ARU − ARV)/ARU x 100 | |
| Household contacts adolescents and young adults (10 to 29 years) (a) any dose (b) 1 dose (c) 2 doses (d) 3 doses | Clinical or laboratory confirmation, or both | MMR vaccine not described | (a) N = 302 (b) N = 27 (c) N = 205 (d) N = 70 | (a) N = 16 | Pre‐campaign MMR doses (a) 16/302 versus 2/16 (b) 3/27 versus 2/16 (c) 13/205 versus 2/16 (d) 0/70 versus 2/16 ‐‐‐‐‐‐‐‐‐‐‐‐‐‐‐‐‐‐‐‐‐‐‐‐ | Pre‐campaign MMR doses (a) (No data) (b) 23.1% (−425.0% to 87.3%)* (c) 63.4% (−103.0% to 90.6%)* (d) 95.9% (45% to 100%) ‐‐‐‐‐‐‐‐‐‐‐‐‐‐‐‐‐‐‐‐‐‐‐‐‐‐‐‐‐‐ Campaign MMR doses: 78.7% (10.1% to 97.7%) for pre‐exposure doses ‐‐‐‐‐‐‐‐‐‐‐‐‐‐‐‐‐‐‐‐‐‐‐‐‐‐‐‐‐ 50.4% (*) for postexposure doses (*) no statistical evidence ‐‐‐‐‐‐‐‐‐‐‐‐‐‐‐‐‐‐‐‐‐‐‐‐‐‐‐‐‐‐‐ VE = (1 − OR) x 100 from logistic regression | |
| Household contacts (6 months to 14 years) of primary measles cases | Secondary cases Clinical (WHO definition) or IgM positive antibody of secondary cases Standardised questionnaires | MMR vaccine not described Vaccination records | (a1) N = 48 (1 dose) (a2) N = 106 (2 doses) (b) N = 44 (> 2 doses) (c) N = 219 any doses contacts | N = 21 unvaccinated | (a1) 2/48 versus 11/21 (a2) 3/106 versus 11/21 (b) 1/44 versus 11/21 (c) 17/219 versus 11/21 | (a1) 92.0% (67.2% to 98.1%) (a2) 94.6% (82.3% to 98.4%) (b) 95.7% (68.6% to 99.4%) (c) 85.2% (72.7% to 92.0%) VE = (1 − RR) x 100 | |
| Postexposure prophylaxis Childrena aged < 19 years N = 208 | All who subsequently developed measles were considered as contacts. | MMR not described MMR PEP administered within 72 hours of initial exposure. | N = 44 | N = 164 | (a) 2/44 versus 45/164 | (a) 83.4% (34.4% to 95.8%) VE = (1 − RR) x 100 | |
| Postexposure prophylaxis N = 166 children with median age of 16.5 months (range 6 to 47 months) Candidates for the intervention were susceptible contacts who had not received either measles‐containing vaccine or had not suffered measles. | Clinical and laboratory | MMR not stated (a) at least 1 dose (b) vaccinated ≤ 3 days (c) vaccinated 4 to 5 days (d) vaccinated 6 to 7 days (e) vaccinated 8 to 9 days (f) vaccinated 10 to 12 days | (a) N = 54 (b) N = 17 (c) N = 14 (d) N = 14 (e) N = 8 (f) N = 1 | N = 21 | (a) 12/54 versus 13/21 (b) 1/17 versus 13/21 (c) 4/14 versus 13/21 (d) 5/14 versus 13/21 (e) 1/8 versus 13/21 (f) 1/1 versus 13/21 | (a) 64.1% (34.5% to 80.3%) (b) 90.5% (34.5% to 98.6%) (c) 53.8% (0.0% to 81.1%) (d) 42.3% (0.0% to 81.1%) (e) 79.8% (0.0% to 73.5%) (f) not reported VE = (1 − RR) x 100 |
ARU: attack rate amongst unvaccinated
ARV: attack rate amongst vaccinated
CI: confidence interval
HR: hazard ratio
ICD: International Statistical Classification of Diseases and Related Health Problems
IgG: immunoglobulin G
IgM: immunoglobulin M
incidence: cases/PT
MMR: measles, mumps, rubella vaccine
MMRV: measles, mumps, rubella, and varicella vaccine
N: number of participants in intervention and control arm
OR: odds ratio
PEP: postexposure prophylaxis
PT: person‐time in months
rr: rate ratio (relative incidence, incidence rate ratio, hazard ratio)
RR: risk ratio (relative risk)
RNA: ribonucleic acid
RT‐PCR: reverse‐transcription polymerase chain reaction
VE: vaccine effectiveness/efficacy
WHO: World Health Organization
| Study | Population | Case | Controls/ | MMR strain/exposure | N cases vaccinated/N cases | OR (95% CI) | VE% (95% CI) |
|---|---|---|---|---|---|---|---|
| Children aged 5 to 17 years (a) outside of outbreak school (b) all participants | (a) N = 61 (b) N = 102 confirmed by laboratory testing or epidemiologic link is notifiables by both physicians and laboratories in Quebec | (a) N = 305 (b) N = 510 Controls were matched for date of birth (± 6 months) and school attended in 2010 to 2011. | MMR‐II (Merck Canada, Montreal, Quebec) Cases and controls received 2 doses of measles‐containing vaccine. | No data reported | ‐ | ‐ | |
| Participants (median age 16 years, upper quartile age 76 years) living in Merseyside (UK) | N = 42 microbiological confirmation: oral fluid/blood test IgM positive or PCR positive | N = 42 Control group participants were selected at random, matched 1:1 by general medical practice and aged within 1 year. | MMR vaccine not described (a) vaccinated appropriately for age for vaccination (< 14 months) (c) all ‐ vaccinated Unvaccinated: incompletely or partially vaccinated for age (> 13 months) | (a) 5/27 versus 23/29 (b) 15/37 versus 12/18 (c) 20/42 versus 35/42 | Risk factors for measles infection (univariate analysis) age > 13 months and incomplete vaccination 6.3 (1.9 to 33.4) ‐‐‐‐‐‐‐‐‐‐‐‐‐‐‐‐‐‐‐‐‐‐‐‐‐‐‐‐‐ (Multivariate analysis) under age for routine vaccination 20.4 (2.0 to 300) incomplete/partial vaccination for age > 13 months 22.1 (3.8 to 300) (**) adjusted for confounders | Risk factors for measles infection (univariate analysis) age > 13 months and incomplete vaccination 84.1% (47.4% to 97.0%) ‐‐‐‐‐‐‐‐‐‐‐‐‐‐‐‐‐‐‐‐‐‐‐‐‐‐‐‐‐ (Multivariate analysis) under age for routine vaccination 95.1% (50.0% to 100%) incomplete/partial vaccination for age > 13 months 95.5% (73.7% to 100%) (**) adjusted for confounders VE = (1 − OR) x 100 | |
| Participants aged 1 to 19 years | N = 1261 clinical definition | N = 4996 randomly selected, matched for year of birth, gender, general practice attended, index date | MMR or MR not described (a) 1 dose (b) > 1 dose | (a) 409/1221 versus 2012/4750 (b) 40/852 versus 246/2984 | (a) 0.49 (0.41 to 0.58)* (b) 0.39 (0.26 to 0.58)* *adjusted estimates, conditional logistic regression | (a) 51.0% (42.0% to 59.0%) VE = (1 − OR) x 100 |
**: multivariate analysis
CCDC: Consultant in Communicable Disease Control
CI: confidence interval
IgM: immunoglobulin M
MR: measles and rubella vaccine
MMR: measles, mumps, rubella vaccine
MMRV: measles, mumps, rubella, and varicella vaccine
N: number of participants
OR: odds ratio
PCR: polymerase chain reaction
VE: vaccine effectiveness/efficacy
WHO: World Health Organization
| Study | Population | Case definition | Vaccine/strain | N vaccinated | N control | N events in exposed/ | VE% (95% CI) |
|---|---|---|---|---|---|---|---|
| Children aged up to 16 years from Geneva were household contacts | Clinical diagnosis of secondary cases Phone interview | (a) MMR‐II/Jeryl LynnB (b) Pluserix or Trimovax/Urabe AM9 (c) Triviraten/Rubini (d) any strain Vaccination records Unspecified number of doses | (a) N = 30 (b) N = 75 (c) N = 83 (d) N = 193 | N = 72 unvaccinated | (a) 4/30 versus 25/72 (b) 7/75 versus 25/72 (c) 27/83 versus 25/72 (d) 38/193 versus 25/72 | (a) 61.6 % (−0.9% to 85.4%) (b) 73.1% (41.8% to 87.6%) (c) 6.3% (−45.9% to 39.8%) (d) 43.0% (12.7% to 62.8%) VE = (1 − RR) x 100 | |
| 235 students (in Spain) (aged 16 to 17 years) | Laboratory confirmed | MMR vaccine: (a) 1 dose (b) 2 dose (c) 3 dose (d) any dose | (a) N = 5 (b) N = 37 (c) N = 2 (d) N = 44 | N = 2 unvaccinated | (a) 2/5 versus 1/2 (b) 9/37 versus 1/2 (b) 2/2 versus 1/2 (d) 13/44 versus 1/2 ‐‐‐‐‐‐‐‐‐‐‐‐‐‐‐‐‐‐‐‐‐ Incidence (a) 33 versus 50 x 100 person‐day (≥ 2 doses) 16 versus 50 x 100 person‐day | (a) not reported ‐‐‐‐‐‐‐‐‐‐‐‐‐‐‐‐‐‐‐‐‐‐‐‐‐‐‐‐‐‐ VE = (1 − rr) x 100 (a) 34% (−44% to 70%)* (≥ 2 doses) 67% (28% to 83%) *no statistical evidence | |
| Students from the 3 university cities N = 989 | Self‐reported | MMR vaccine: Jeryl Lynn (a) 1 dose (b) 2 doses | (a) N = 29 (b) N = 706 | N = 16 unvaccinated | (a) 2/29 versus 7/16 (b) 92/706 versus 7/16 | (a) not reported (b) 68% (40.6% to 82.2%) adjusted estimate VE = 1 − RR | |
| N = 11,004 children born between 2008 and 2010, who underwent vaccination in 2009 to 2011. Follow‐up = 24 months | Hospitalisation for (a) measles (see also Table 1) (b) mumps (c) measles and mumps (d) all infectious diseases (e) all respiratory diseases The effectiveness of MMR vaccine in reducing hospitalisations was assessed by analysing 2 distinct databases (vaccination record) and (hospital discharge): diagnosis contained the following ICD‐9 codes in primary or secondary diagnosis:
| MMR not described (we assume Jeryl Lynn) the vaccination records from the Roma Local Health Unit database from which relevant data were extracted, such as date of birth; MMR vaccination (yes/no); MMR dose (only for vaccinated); personal tax code. The cohort was recomposed through record linkage of the 2 vaccination of hospital discharge personal tax codes as a common identification | (1) 1 dose N = 5392 (2) 2 doses N = 3310 (3) any dose N = 8702 | Unvaccinated N = 2302 | (a1) 3/5392 versus 9/2302 (a2) 0/3310 versus 9/2302 (a3) 3/8702 versus 9/2302 (b1) 1/5392 versus 1/2302 (b2) 0/3310 versus 1/2302 (b3) 1/8702 versus 1/2302 (c1) 4/5392 versus 10/2302 (c2) 0/3310 versus 10/2302 (c3) 4/8702 versus 10/2302 (d1) 82/5392 versus 262/2302 (d2) 70/3310 versus 262/2302 (d3) 414/8702 versus 262/2302 (e1) 202/5392 versus 424/2302 (e2) 183/3310 versus 424/2302 (e3) 809/8702 versus 424/2302 | Unadjusted estimates (a1) 85.8% (47.5% to 96.1%) (*) no statistical evidence VE = (1 − RR) x 100 ‐‐‐‐‐‐‐‐‐‐‐‐‐‐‐‐‐‐‐‐‐‐‐‐ Adjusted estimates any dose (a) 91% (68% to 99%) (b) not reported (c) 90% (66% to 97%) (d) 71% (66% to 75%) (e) 82% (52% to 93%) VE = 1 − HR | |
| From 2176 household residents from 2009 to 2010 All ages, (age group 1) age ≤ 17 years (age group 2) age ≥ 18 years | Clinical or | MMR vaccine: Jeryl Lynn (a) 1 dose (b) 2 doses (c) unknown (d) any dose | Age ≤ 17 years (group 1) (1a) 1 dose N = 342 (1b) 2 doses N = 361 (1c) unknown N = 914 (d) any dose ‐‐‐‐‐‐‐‐‐‐‐‐‐‐‐‐‐‐‐ Age ≥ 18 years (2a) 1 dose N = 9 (2b) 2 doses N = 97 (2c) unknown N = 574 (d) any dose | Age ≤ 17 years (group 1) N = 126 ‐‐‐‐‐‐‐‐‐‐‐‐‐‐‐‐‐‐‐ Age ≥ 18 years (group 2) N = 6 unvaccinated | All ages (group 1 + 2) (a) 4/117 versus 4/20 (b) 19/691 versus 4/20 (c) 17/520 versus 4/20 (d) 23/808 versus 4/20 Secondary households contacts age ≥ 5 years N = 1348 | All ages (a) 82.9% (37.1% to 95.4%) (b) 86.3% (63.3% to 94.9%) (c) 83.7% (55.9% to 93.9%) (d) 85.8% (62.7% to 94.6%) VE = (1 − RR) x 100 assessed amongst 44 secondary cases and 1304 non‐sick household contacts | |
| Male children aged between 3 and 15 years attending a scholastic institute in Spain during a mumps outbreak (March to November 1997) | Clinical diagnosis. Cases notified by the Andalusian survey system. | MMR strain not reported | N = 685 vaccination record | N = 38 unvaccinated | 73/685 versus 8/38 | 49% (3% to 74%) VE = (1 − RR) x 100 | |
| Conducted between 1 December 2014 and 20 September 2015. N = 2303 students aged 6 to 15 years. Of these, 114 were excluded because they had history of mumps illness; 281 students were excluded because of unknown immunisation history. N = 1378 vaccinated and unvaccinated N = 530 children included in the analysis | A mumps case was defined as a student having unilateral or bilateral parotid or other salivary gland swelling and pain, lasting 2 or more days, with onset between 1 December 2014 and 20 September 2015. All cases were diagnosed by clinical criteria without laboratory confirmation, and no mumps virus genotype information was obtained during this outbreak investigation. | MMR: S79 strain of mumps vaccine virus, derived through further attenuation of the Jeryl Lynn strain. Students’ vaccination certificates were obtained during the field investigation. (a) 1 dose (≤ 5 years since vaccination) (b) 1 dose (> 5 years since vaccination) (c) any time since vaccination | (a) N = 363 (b) N = 301 (c) N = 664 | Unvaccinated N = 530 | (a) 28/363 versus 93/530 (b) 21/301 versus 93/530 (c) 49/664 versus 93/530 | (a) 56% (34.4% to 70.6%) VE = (1 − RR) x 100 | |
| Children (19 to 67 months) | Clinical diagnosis Patient records and parent interviews | (a) Pluserix/Urabe (b) Morupar/Urabe (c) Triviraten/Rubini Vaccination records | (a) N = 329 (1 dose) (b) N = 747 (1 dose) (c) N = 1023 (1 dose) | N = 646 unvaccinated | (a) 38 cases/19433 (PT) (b) 28 cases/12785 (PT) (c) 185 cases/29974 (PT) Control = 206 cases/25,816 PT=person‐ time in months | (a) 75% (65% to 83%) (b) 73% (59% to 82%) (c) 23% (6% to 37%) VE = (ARU − ARV)/ARU x 100 | |
| During 2009 to 2010 mumps outbreak Children aged 9 to 14 years with a history of 2 MMR vaccine doses, had not previously received a third MMR vaccine dose, and had no history of mumps | Laboratory confirmed | MMR vaccine not described third dose | N = 1068 | Only 2 doses MMR N = 2171 | 1/1068 versus 5/2171 | 59.3% (−247% to 95.2%) VE = (1 − RR) x 100 | |
| During 2009 to 2010 mumps outbreak Schoolchildren (aged 11 to 17 years) from 3 schools. N = 2665. N = 2178 had validated history of receiving 2 previous doses of MMR. | Laboratory confirmed | MMR vaccine not described third dose (a) all students with validated 2 doses (b1) postvaccination period 1 to 21 days after third dose (b2) postvaccination period 22 to 41 days after third dose | Third dose (a) N = 1755 (b1) N = 1751 (b2) N = 1723 | Only 2 doses MMR (a) N = 432 (b1) N = 420 (b2) N = 413 | (a) 35/1755 versus 14/432 (b1) 28/1751 versus 7/420 (b2) 1/1723 versus 2/413 | (a) 39.7% (−11.0% to 67.3%) (b1) 4.1% (−118% to 57.8%) (b2) 88% (−31.9% to 98.9%) VE = (1 − RR) x 100 | |
| Children from childcare centres and aged 5 to 12 years | Clinical diagnosis. Standard questionnaire filled by trained public health officer or physician diagnoses. | (a) Jeryl Lynn (b) Urabe (c) Rubini Health booklet | (a) N = 711 (b) N = 190 (c) N = 1694 1 or 2 MMR doses | N = 614 unvaccinated | (a) 8/711 versus 35/614 (b) 5/190 versus 35/614 (c) 150/1694 versus 35/614 | (a) 80.3% (57.8% to 90.8%) (b) 53.8%* (c) −55.3% (−121.8% to −8.8%) VE = (1 − RR) x 100 *no statistical evidence | |
| Children aged 5 to 13 years | Clinical confirmation after virus isolation or clinical picture observed in sibling of confirmed cases. Parents interview and evaluation by study investigators | (a) Jeryl Lynn (b) Urabe (c) Rubini Vaccination records | (a) N = 36 (b) N = 40 (c) N = 79 at least 1 dose | N = 8 unvaccinated | (a) 5/36 versus 5/8 (b) 3/40 versus 5/8 (c) 53/79 versus 5/8 | (a) 78% (64% to 82%) (b) 87% (76% to 94%) (c) −4% VE = (ARU − ARV)/ARU x 100 | |
| Children (aged < 19 years) attending (a) primary schools and (b) their household contacts. (c) index case | Clinical diagnosis | MMR Jeryl Lynn or RIT 4385 | (a1) (1 dose) N = 484 (a2) (2 doses) N = 301 (b) (unspecified number of doses) N = 19 (c) (any dose) N = 16 | (a) N = 351 (b) N = 87 (c) N = 90 unvaccinated | (a1) 13/484 versus 183/351 (a2) 7/301 versus 183/351 (b) 3/19 versus 44/87 (c) 3/16 versus 44/90 ‐‐‐‐‐‐‐‐‐‐‐‐‐‐‐‐‐‐ adjusted data (a1) 9/484 versus 65/351 (a2) 7/301 versus 86/351 | (a1) 92% (83% to 96%) (a2) 93% (85% to 97%) (b) 67% (65% to 95%) (c) 11% (−4% to 88%) Adjusted for confounders from Poisson regression VE = 1 − incidence rate In order to include "adjusted data", Di Pietrantonj 2006 method is used to convert adjusted estimates and its 95% CI in "adjusted data". | |
| Primary school: 108 students of 5 classes with at least 1 mumps case | Clinical or | MMR vaccine: RIT 4385 or | (a) (1 dose) N = 4 (b) (2 doses) N = 89 | N = 6 | (a) 3/4 versus 5/6 (b) 6/89 versus 5/6 | (a) 10% (−75% to 53%) (b) 91.9% (81.0% to 96.5%) VE = (1 − RR) x 100 |
ARU: attack rate amongst unvaccinated
ARV: attack rate amongst vaccinated
CI: confidence interval
HR: hazard ratio
ICD: International Statistical Classification of Diseases and Related Health Problems
IgM: immunoglobulin M
incidence : cases/PT
MMR: measles, mumps, rubella vaccine
MMRV: measles, mumps, rubella, and varicella vaccine
N: number of participants
OR: odds ratio
PT: person‐time in months
rr: rate ratio (relative incidence, incidence rate ratio, hazard ratio)
RNA: ribonucleic acid
RR: risk ratio (relative risk)
VE: vaccine effectiveness/efficacy
WHO: World Health Organization
| Study | Population characteristics | Case definition | Controls/selection | MMR strain/exposure | N cases vaccinated/ | OR (95% CI) | VE% (95% CI) |
|---|---|---|---|---|---|---|---|
| Children aged between 15 months and 10 years from Navarre region (Northern Spain) at the time a mumps outbreak occurred (between August 2006 and June 2008) | (a) N = 181 (b) N = 72 (c) N = 241 Laboratory or epidemiological swelling of 1 of more salivary glands Obtained from cases notified | (a) N = 875 (b) N = 353 (c) N = 1205 matched for sex, | (a) 1 dose (b) 2 doses (c) any dose MMR/Jeryl Lynn doses received at least 30 days before symptom disease onset. Blinded review of primary care vaccination registry | (a) 169/181 versus 852/875 (b) 59/72 versus 330/353 (c) 228/241 versus 1182/1205 | ‐ | (a) 66% (25% to 85%) (b) 83% (54% to 94%) (c) 72% (39% to 87%) adjusted for confounders | |
| Children in Guangzhou aged 8 months to 12 years during 2006 to 2012 | N = 1983 randomly selected clinical definition | N = 1983 matched 1:1 by birth date, gender, residence not reported breakdown by type of vaccine administrated | (a) MMR/Jeryl Lynn RIT4385 (b) measles‐mumps (c) missing (vaccine type) (d) any vaccine 1 dose | (a) 112 versus 145 (b) 242 versus 261 (c) 620 versus 837 (d) 974/1983 versus 1243/1983 | (a) OR extracted from VE reported 0.49 (0.26 to 0.93) | (a) 51.3% (7.2% to 95.0%) | |
| Children and adolescents aged 14 months to 15 years from urban area of Alba and Bra and 10 rural towns (n = 12,800 residents from 0 to 15 years) during 2000 to 2001 epidemic | Clinical diagnosis (cases notified by national infectious diseases surveillance system) N = 139 notified mumps cases | N = 139 randomly selected from immunisation registry, matched for birth year and address. (controls received | MMR vaccine not specified. Vaccination registry and phone interviews, immunisation should have been received at least 30 days before disease onset. | 90/139 versus 111/139 | 0.46 (0.27 to 0.80) | 53.7% (20.4% to 73.0%) | |
| Children and adolescents (15 months to 16 years) from Oporto (Portugal) | Clinical diagnosis Cases reported by GPs or hospital doctors, occurred during the 1995 to 1996 mumps outbreak (a) N = 73 (b) N = 133 (c) N = 189 | 2 consecutive (a) N = 169 (b) N = 236 (c) N = 378 Controls received at least 1 MMR dose. | Assuming that before 1 November 1992 MMR mumps Urabe strain was administered, subsequently the Rubini strain (a) Urabe (b) Rubini (c) all at least 1 MMR dose | (a) 56/73 versus 142/169 (b) 116/133 versus 209/236 (c) 172/189 versus 351/378 | ‐ | (a) 70% (25% to 88%) (b) 1% (−108% to 53%) adjusted for confounders | |
| Children and adolescents | Clinical diagnosis N = 156 (GP notification to the local CCDC, mumps diagnoses from electronic practice list, verbal reports by community members) ‐‐‐‐‐‐‐‐‐‐‐‐ Laboratory confirmation of clinical diagnosis N = 43 GP notification to the local CCDC of notified cases, IgM and mumps RNA testing was offered | N = 175 | Jeryl Lynn 1 or 2 MMR doses received at least 1 month before index date (a) at least 1 dose (b) 1 dose (c) 2 doses | 79/156 versus 134/175 | (a) 0.31 (0.20 to 0.50) | (a) 69% (50% to 80%) (crude) (a) 69% (41% to 84%) adjusted for age, sex, practice ‐‐‐‐‐‐‐‐‐‐ Laboratory‐confirmed cases (a) 65% (25% to 84%) (b) 64% (40% to 78%) (c) 88% (62% to 96%) All adjusted for age, sex, practice. Proportion of vaccinated in cases and controls not provided. | |
| Children (a) prospective case‐control study from March 2010 (b) retrospective case‐control study 2008 to 2009 in western Seoul, Incheon, and Goyang (c) total | (a) N = 55 (a1) 1 dose (a2) 2 doses (a3) any dose ‐‐‐‐‐‐‐‐‐‐‐‐ (b) N = 122 (b1) 1 dose (b2) 2 doses (b3) any dose ‐‐‐‐‐‐‐‐‐‐‐‐‐‐‐‐‐‐ (c) N = 177 (c1) 1 dose (c2) 2 doses (c3) any dose | (a) N = 165 (a1) 1 dose (a2) 2 doses (a3) any dose ‐‐‐‐‐‐‐‐‐‐‐‐‐‐‐‐ (b) N = 449 (b1) 1 dose (b2) 2 doses (b3) any dose ‐‐‐‐‐‐‐‐‐‐‐‐‐‐ (c) N = 614 (c1) 1 dose (c2) 2 doses (c3) any dose | MMR vaccine not described (assumed to be Jeryl Lynn following Park 2015) For (a) and (b): data about demographic characteristics and MMR vaccination status were collected from cases and controls. | ‐‐‐‐‐‐‐‐‐‐(a)‐‐‐‐‐‐‐‐‐‐‐‐‐‐‐‐ (a1) 0.58 (0.05 to 6.90) (a2) 1.1 (0.09 to 13.3) (a3) 0.67 (0.06 to 7.35) ‐‐‐‐‐‐‐‐‐‐(b)‐‐‐‐‐‐‐‐‐‐‐‐‐‐‐ (b1) 0.33 (0.02 to 5.33) (b2) 0.11 (0.01 to 2.12) (b3) 0.33 (0.02 to 5.33) ‐‐‐‐‐‐‐‐‐(c)‐‐‐‐‐‐‐‐‐‐‐ (c1) 0.58 (0.10 to 3.56) (c2) 0.42 (0.06 to 2.81) (c3) 0.50 (0.08 to 2.99) | ‐‐‐‐‐‐‐‐(a)‐‐‐‐‐‐‐‐‐ (a1) 42.0%* (b1) 67.0%* ‐‐‐‐‐‐‐‐‐(c)‐‐‐‐‐‐‐‐‐‐‐ *no statistical evidence | ||
| About 600 pupils attending a boarding school in Scotland during a mumps outbreak that peaked between October and November 2004 | Virological confirmation N = 20 (aged 13 to 17 years). Cases notified to consultant | N = 40 | MMR vaccine not described (a) 1 dose (b) 2 doses (c) any dose Not specified. Pre‐outbreak communication with parents, and from Scottish Immunisation Recall System. | (a) 9/18 versus 20/34 (b) 2/11 versus 6/20 (c) 11/20 versus 26/40 | (a) 0.7 (0.22 to 2.21) (b) 0.52 (0.09 to 3.16) (c) 0.66 (0.22 to 1.97) | (a) 30.0%* (b) 48.1%* (c) 32.4%* *no statistical evidence |
CCDC: Consultant in Communicable Disease Control
CI: confidence interval
GP: general practitioner
ICD: International Statistical Classification of Diseases and Related Health Problems
IgM: immunoglobulin M
N: number of participants in intervention and control arm
MMR: measles, mumps, rubella vaccine
MMRV: measles, mumps, rubella, and varicella vaccine
OR: odds ratio
PCR: polymerase chain reaction
PT: person‐time
RNA: ribonucleic acid
RR: risk ratio (relative risk)
VE: vaccine effectiveness/efficacy
| Study | Population | Case definition | Vaccine/strain | N vaccinated | N control | N events in exposed/ | VE% (95% CI) |
|---|---|---|---|---|---|---|---|
| Cohort study Secondary attack rate | Middle school with a total of 1621 students enrolled in the 7th, 8th, and 9th grades, with a total of 37 classes (ages 11 to 13) | Probable rubella case: defined as a suspected rubella case with fever > 37.5 °C and at least 1 of the following symptoms: arthralgia, arthritis, lymphadenopathy, or conjunctivitis. Laboratory‐confirmed case: required a positive serologic test for rubella IgM antibody. Epidemiologically linked case: confirmed case was defined as a suspected case or a probable case that was not laboratory confirmed, but that was geographically and temporally related to a laboratory‐confirmed case. | MMR (BRD‐II or RA27/3) A BRD‐II rubella strain vaccine was developed in the 1980s in China, and has been available in the Chinese private market since1993. All monovalent rubella and measles and rubella combined (MR) vaccines in use in China are based on the BRD‐II rubella strain. A domestic measles, mumps, and rubella combined vaccine (MMR) based on BRD‐II strain has been available in China’s private market since 2003. There is also an imported RA27/3 strain‐based vaccine available in China. | ‐ | ‐ | Secondary cases = 2 Exposed person = 47 RR 0.11 (95% CI 0.03 to 0.44) | 89% (56% to 97%) VE = (1 − RR) x 100 |
CI: confidence interval
IgM: immunoglobulin M
MMR: measles, mumps, rubella vaccine
RR: risk ratio (relative risk)
VE: vaccine effectiveness/efficacy
| Study ID and | Population | Outcome | Vaccine arms | Comparator arm | Vaccine arm | Comparator arm | VE% (95% CI) |
|---|---|---|---|---|---|---|---|
| RCT | This study is the first phase (1 September 2005 to 29 June 2009) of an RCT. The study was done in 111 study centres in Europe: Czech Republic (22), Greece (11), Italy (9), Lithuania (9), Norway (5), Poland (10), Romania (9), Russia (14), Slovakia (17), and Sweden (5). An eligible participant was a healthy child aged 12 to 22 months at the time of the first vaccination; had a measles, and rubella diseases and vaccinations; and was one of the following: (1) at home with at least 1 sibling (with negative history of varicella disease and vaccination), (2) attending a child minder (where at least 1 child was without a known positive (3) playing for more than 5 min weekly with children without a known positive history of varicella disease and vaccination, a day‐care centre from 24 months of age. An eligible participant’s parents or guardians had direct access to a telephone and were deemed by the complying with the requirements of the trial protocol. | The primary efficacy endpoint was the occurrence of confirmed varicella from 42 days after the second vaccine dose to the end of the first phase of the trial. The secondary efficacy endpoint was the occurrence of confirmed varicella graded by severity over the same time period. Varicella cases (a) All (b) Moderate/severe Follow‐up = 3 years | MMRV group: 2 doses of MMRV (Priorix‐Tetra, GSK) N = 2279 MMR+V group: 1 dose MMR (Priorix, GSK) and monovalent varicella vaccine (Varilrix, GSK) at dose 2 N = 2263 | MMR group (control): 2 doses of MMR (Priorix, GSK) N = 743 | MMRV (a) 37/2279 (b) 2/2279 MMR+V (a) 243/2263 (b) 37/2263 | MMR (a) 201/743 (b) 117/743 | MMRV (a) 94.9% (92.4% to 96.6%) (b) 99.5% (97.5% to 99.9%) MMR+V (a) 65.4% (57.2% to 72.1%) (b) 90.7% (85.9% to 93.9%) VE = (1 − HR) x 100 |
| RCT linked to | Healthy children aged 12 to 22 months. n = 5803 children enrolled and vaccinated (TVC) in phase A, n = 4580 in the TVC in phase B, n = 3829 completed the study up to Year 6; n = 5289 ATP cohort for efficacy in phase A + B, n = 3791 in the ATP cohort for efficacy in phase B | Varicella cases (a) All (b) Moderate/severe (c) Severe Follow‐up = 6 years | ATP phase A + B MMRV n = 2279 MMR+V n = 2266 Phase B MMRV n = 1802 MMR+V n = 1593 MMRV group 2 doses of MMRV (Priorix‐Tetra, GSK) at Day 0 and Day 42 MMR+V group 1 dose of MMR (Priorix, GSK) at Day 0 and 1 dose of monovalent varicella vaccine (Varilrix, GSK) at Day 42 | ATP phase A + B Phase B MMR n = 396 MMR group 2 doses of the MMR (Priorix, GSK) vaccine at Day 0 and Day 42 | Phase A + B MMRV (a) 71/2279 (b) 6/2279 (c) 0/2270 MMR+V (a) 419/2266 (b) 58/2266 (c) 1/2266 Phase B MMRV (a) 33/1800 (b) 4/1800 (c) 0/1800 MMR+V (a) 176/1592 (b) 18/1592 (c) 0/1592 | Phase A + B MMR (a) 325 /744 (b) not reported Phase B (a) 125/396 (b) not reported | Phase A + B MMRV (a) 95.0% (93.6% to 96.2%) (b) 99.0% (97.7% to 99.6%) (c) undefined MMR+V (a) 67.0% (61.8% to 71.4%) (b) 90.3% (86.9% to 92.8%) (c) 94.6% (55.3% to 99.4%) Phase B MMRV (a) 95.3% (93.1% to 96.8%) (b) 98.4% (95.5% to 99.4%) (c) undefined MMR+V (a) 69.5% (61.5% to 75.8%) (b) 91.8% (85.9% to 95.2%) (c) undefined VE = (1 − HR) x 100 |
| RCT linked to | Children aged 12 to 22 months were eligible for inclusion if: had not received MMR or varicella vaccines, or both, or had measles‐mumps‐rubella or varicella zoster or herpes zoster diseases, or both, and were at home with at least 1 sibling with negative history of varicella disease and vaccination, at a child‐minders where at least 1 child was without a known positive history of varicella disease and vaccination, playing for more than 5 min/week with children without a known positive history of varicella disease and vaccination, or registered to attend day care from 24 months. | Varicella cases (a) All (b) Moderate/Severe Follow‐up = 10 years | Phase A + B MMRV n = 2279 MMR+V n = 2266 Phase B MMRV n = 1800 MMR+V n = 1591 MMRV group 2 doses of MMRV (Priorix‐Tetra, GSK) at Day 0 and Day 42 MMR+V group 1 dose of MMR (Priorix, GSK) at Day 0 and 1 dose of monovalent varicella vaccine (Varilrix, GSK) at Day 42 | Phase A + B Phase B MMR n = 396 MMR group 2 doses of the MMR (Priorix, GSK) vaccine at Day 0 and Day 42 | Phase A + B MMRV (a) 71/2279 (b) 6/2279 MMR+V (a) 469/2266 (b) 67/2266 Phase B MMRV (a) 33/1800 (b) 4/1800 MMR+V (a) 176/1592 (b) 18/1592 | Phase A + B MMR (a) 352/744 (b) 176/744 Phase B (a) 149/396 (b) 59/396 | Phase A + B MMRV (a) 95.4% (94.0% to 96.4%) (b) 99.1% (97.7% to 99.6%) MMR+V (a) 67.2% (62.3% to 71.5%) (b) 89.5% (86.1% to 92.1%) Phase B MMRV (a) 95.9% (94.1% to 97.1%) (b) 98.7% (96.4% to 99.5%) MMR+V (a) 69.8% (62.8% to 75.5%) (b) 90.0% (84.2% to 93.7%) VE = (1 − HR) x 100 |
ATP: according‐to‐protocol
CI: confidence interval
MMR: measles, mumps, rubella vaccine
MMRV: measles, mumps, rubella, and varicella vaccine
MMR+V: measles, mumps, rubella, and varicella vaccine
OR: odds ratio
PT: person‐time
RCT: randomised controlled trial
RR: risk ratio (relative risk)
TVC: total vaccinated cohort
VE: vaccine effectiveness/efficacy
| Study | Population | Case definition | Vaccine/strain | N vaccinated | N control | N events in exposed/ | VE% (95% CI) |
|---|---|---|---|---|---|---|---|
| Children aged 0 to 14 registered with 35 Pedianet database physicians across Italy between 1 October 1997 and 30 September 1998 | Varicella cases recorded in the Pedianet databases are based on physician confirmation only (no laboratory tests were performed). | MMRV: vaccine ProQuad | n = 2357 | n = 912 unvaccinated | 43/2357 versus 287/912 | unadjusted estimate 94% (92% to 96%) adjusted estimate 94% (91% to 95%) VE = (1 −RR) x 100 | |
| Between January 2006 and October 2013, n = 1,449,411 children | 4‐step algorithm to only select confirmed Step 1: excluded incompatible or implausible coding combinations for varicella diagnosis reliability; step 2: excluded observations with diagnosis reliability other than confirmed (i.e. suspected, excluded, recovered); step 3: excluded observations with diagnosis type other than incident (i.e. previous state, unknown, not provided); to the earliest ICD‐10 code per patient whilst also keeping the information about the most severe ICD‐10 code (within up to one‐quarter following the initial diagnosis) using the following ranking (in descending order of severity): varicella with encephalitis, meningitis, pneumonia, other complications, no complications, no further ‘no complications’. | Since 2004, single‐dose varicella vaccination has all children aged 11 to 14 months. 2 single‐compound varicella vaccines (VAR; Varivax, were initially available. In 2006, a combined (MMR)‐varicella vaccine (MMRV; was licenced with a 2‐dose schedule. A 2‐dose schedule has been recommended since 2009 targeting children with the second dose at age 15 to 23 months. Since 2011, the first immunisation has been given preferably as 2 separate injections of VAR and MMR due to higher rates of febrile seizures following immunisation with MMRV. (a) 1 dose MMRV (b) 2 doses MMRV | ‐ | ‐ | ‐ | VE = (1 − HR) x 100 adjusted estimate (a) 81.7% (81.0% to 82.4%) (b) 94.4% (94.2% to 94.6%) ‐‐‐‐‐‐‐‐‐‐‐‐‐‐‐‐‐‐‐ (a) 61.8% (60.6% to 63.0%) | |
| 1084 children attended day‐care centres in Germany | Varicella was classified clinically as mild (< 50 skin lesions), moderate (≥ 50 skin lesions), severe (any hospitalised case). | MMRV Priorix‐Tetra (a) All‐brand doses (b1) All‐brand 1 dose (b2) All‐brand 2 dose ‐‐‐‐‐‐‐‐‐‐‐‐‐‐‐‐‐‐‐‐‐‐‐‐‐‐‐‐‐‐‐‐‐ (c) Varivax 1 dose (d) Varilrix 1 dose (e1) Priorix‐Tetra 1 dose (e2) Priorix‐Tetra 2 doses ‐‐‐‐‐‐‐‐‐‐‐‐‐‐‐‐‐‐‐‐‐‐‐‐‐‐‐‐‐‐‐‐‐‐ (f1) Mild disease (f2) Moderate disease | (a) n = 244 (b1) n = 167 (b2) n = 77 (c) n = 48 (d) n = 77 (e1) n = 38 (e2) n = 56 (f1) n = 233 (f2) n = 221 | n = 108 (f1) n = 71 (f2) n = 93 | (a) 33/244 versus 52/108 (b1) 31/167 versus 52/108 (b2) 2/77 versus 52/108 (c) 4/48 versus 52/108 (d) 19/77 versus 52/108 (e1) 7/38 versus 52/108 (e2) 2/56 versus 52/108 (f1) 22/233 versus 15/71 (f2) 10/221 versus 37/93 | (a) 71% (57% to 81%) (b1) 62% (43% to 75%) (b2) 94% (75% to 98%) ‐‐‐‐‐‐‐‐‐‐‐‐‐‐‐‐‐‐‐‐‐‐‐‐‐‐‐‐‐‐ (c) 86% (56% to 96%) (d) 56% (29% to 72%) (e1) 55% (8% to 78%) (e2) 91% (65% to 98%) ‐‐‐‐‐‐‐‐‐‐‐‐‐‐‐‐‐‐‐‐‐‐‐‐‐‐‐‐‐‐ (f1) 53% (14% to 75%) (f2) 89% (78% to 95%) adjusted for confounders VE = (ARU − ARV)/ARU x 100 VE = (1 − RR) x 100 | |
| Children at (a) preschool (b) elementary school (c) all ages | Reported by | MMRV (Priorix‐Tetra) Varicella OKA; 1 dose | (a) n = 170 (b) n = 71 (c) n = 241 | (a) n = 40 (b) n = 287 (c) n = 327 | (a) 2/170 versus 14/40 (b) 2/71 versus 223/287 (c) 4/241 versus 237/327 | (a) Not reported (b) 69.2% (50.5% to 88.1%) (c) 59.9% (48.3% to 69.8%) VE = (ARU − ARV)/ARU x 100 VE = (1 − RR) x 100 |
ARU: attack rate amongst unvaccinated
ARV: attack rate amongst vaccinated
CI: confidence interval
ICD‐10: International Classification of Diseases, Tenth Revision
HR: hazards ratio
MMR: measles, mumps, rubella vaccine
MMRV: measles, mumps, rubella, and varicella vaccine
OR: odds ratio
PT: person‐time
RR: risk ratio (relative risk)
VE: vaccine effectiveness/efficacy
| Study | Population characteristics | Case definition | Controls/selection | MMR strain/exposure | N cases vaccinated/N cases | OR (95% CI) | VE% (95% CI) |
|---|---|---|---|---|---|---|---|
| From November 2013 to December 2015, | Cases were defined as children aged 15 to 32 months with rash and either suspected as having varicella by an attending physician or being a contact to a confirmed varicella case. Cases were confirmed by either clinical or laboratory criteria. Cases: n = 168 Cases were further classified by severity of disease based on number of skin lesions, being: (1) mild – fewer than 50 lesions; (2) mild/moderate – between 50 and 249 lesions; (3) moderate – between 250 and 499 lesions; or (4) severe – 500 lesions or more, having been hospitalised, or having any complication. | Controls matched 1:2 by: age (15 to 32 months). neighbourhood of the case, in which no history of varicella or outpatient clinics visits due to skin lesion was reported. To identify controls, houses nearby the cases were visited following a systematic sampling procedure. Controls: n = 301 | MMRV A combined tetravalent vaccine containing measles, mumps, rubella, and varicella antigens (MMRV), manufactured by GlaxoSmithKline | (a) Any severity | Adjusted‐estimates (a) 0.14 (0.07 to 0.28) (b) 0.07 (0.03 to 0.18) adjusted for confounders: | (a) 86% (72% to 92%) (b) 93% (82% to 97%) VE = 1 − OR | |
| Children between 15 months and 10 years of age | PCR‐confirmed varicella Cases n = 54 | Matched 1:8 by paediatric practice, district of residence, and date of birth (± 1 year) Controls n = 432 | MMR+V (Varivax OKA/Merck) not described (a) any doses and age (a1) 1 dose (a2) 2 doses (b) age < 3 years (b1) 1 dose (c) age ≥ 3 years (c1) 1 dose (c2) 2 doses | (a) 6/54 versus 175/432 (a1) 5/54 versus 112/432 (a2) 1/54 versus 63/432 (b1) 1/6 versus 36/48 (c1) 4/48 versus 76/384 (c2) 1/48 versus 63/384 | ‐ | Adjusted estimates (a) 92% (77% to 97%) (a1) 87% (60% to 97%) (a2) 97% (79.5% to 99.6%) (b1) 84% (−58% to 100%)(*) (c1) 80% (37% to 95%) (c2) 97% (79% to 100%) VE = (1 −OR) x 100 (*) no statistical evidence | |
| Children at least 1 year of age, born on or after 1 July 2003, who resided in Germany | PCR‐confirmed varicella n = 432 | Children matched by age and paediatric practice, fulfilling the same criteria as cases but without history or present clinical diagnosis of varicella n = 432 | Any varicella vaccine (a1) 1 dose (a2) 2 doses ‐‐‐‐‐‐‐‐‐‐‐‐‐‐‐‐‐‐‐‐‐‐‐‐‐‐‐‐ OKA/GSK (b1) 1 dose (b2) 2 doses ‐‐‐‐‐‐‐‐‐‐‐‐‐‐‐‐‐‐‐‐‐‐‐‐‐‐‐‐‐ Other than OKA/GSK* (c1) 1 dose (c2) 2 doses ‐‐‐‐‐‐‐‐‐‐‐‐‐‐‐‐‐‐‐‐‐‐‐‐‐‐‐ Unknown vaccine (d1) 1 dose (d2) 2 doses ‐‐‐‐‐‐‐‐‐‐‐‐‐‐‐‐‐‐‐‐‐‐‐‐‐‐‐‐ Any varicella vaccine (after vaccination) (y1) up to 1 year (y2) 1 to 2 year (y3) 4 to 5 year ‐‐‐‐‐‐‐‐‐‐‐‐‐‐‐‐‐‐‐‐‐‐‐‐‐‐‐‐‐‐‐‐‐‐‐ (*) includes OKA/Merck | (a) 57/432 versus 195/432 (a1) 55/430 versus 153/390 (a2) 2/377 versus 42/279 ‐‐‐‐‐‐‐‐‐‐‐‐‐‐‐‐‐‐‐‐‐‐‐‐‐ (b1) 35/410 versus 63/300 (b2) 0/375 versus 6/243 ‐‐‐‐‐‐‐‐‐‐‐‐‐‐‐‐‐‐‐‐‐‐‐‐‐ (c1) 19/394 versus 87/324 (c2) 2/377 versus 25/262 ‐‐‐‐‐‐‐‐‐‐‐‐‐‐‐‐‐‐‐‐‐‐‐‐‐ (d1) 1/376 versus 3/240 (d2) 0/375 versus 11/248 | ‐ | Adjusted estimates (a1) 86.4% (77.3% to 91.8%) (a2) 94.3% (76.4% to 98.6%) (b1) 71.5% (49.1% to 84.0%) (b2) not reported (c1) not reported (c2) not reported (d1) not reported (d2) not reported (y1) 94.5% (76.9% to 98.7%) (y2) 81.5% (56.8% to 92.1%) (y3) 73.2% (9.1% to 92.1%) VE = (1 − OR) x 100 | |
| Children between 13 months and 16 years of age. (a) < 5 years old (b) 5 to 10 years old (c) > 10 years old (d) all ages | PCR‐confirmed varicella n = 202 | Matched 1:2 according to date of birth (within 1 month) and paediatric practice n = 389 | MMR+V Vaccine type and | 46/202 versus 238/389 | ‐ | Adjusted estimates (a) 79% (61% to 89%) (b) 89% (80% to 94%) (c) 92% (45% to 99%) (d) 87% (78% to 90%) VE = (1 − OR) x 100 |
CI: confidence interval
IgM: immunoglobulin M
MMR: measles, mumps, rubella vaccine
MMRV: measles, mumps, rubella, and varicella vaccine
MMR+V: measles, mumps, rubella, and varicella vaccine
n: number of participants in intervention and control arm
OR: odds ratio
PCR: polymerase chain reaction
VE: vaccine effectiveness/efficacy
WHO: World Health Organization
| Study | Population characteristics | Case definition | Exposure MMR/MMRV vaccine | Crude data | Estimate (95% CI) | VE% (95% CI) |
|---|---|---|---|---|---|---|
| Case‐only ecological method | Hospitalisation between 2004 to 2012 in the Tuscan region. Aged 0 to 14 years (a) age < 1 year (b) age 1 to 4 years (c) age 5 to 14 years | Hospitalised cases for varicella or its complications, as a primary or secondary discharge diagnosis, with the following ICD‐9‐CM codes (2002 and 2007) were examined: | MMRV vaccine: not described and monovalent varicella vaccine Reference period 2004 to 2007 Exposed period 2009 to 2012 Data from 2008, the transition year | Reference period (a) 73/122,483 (b) 189/478,481 (c) 105/1,141,304 Exposed period (a) 42/128,440 (b) 99/523,810 (c) 55/1,222,222 | RR (95% CI) (*) (a) 0.55 (0.38 to 0.80) (b) 0.48 (0.38 to 0.61) (c) 0.48 (0.35 to 0.67) (*) Relative risk between exposed and reference period | VE = 1 − RR (a) 45.1% (19.8% to 62.5%) |
| ga‐Pozza 2011 | Hospitalisation between 2000 to 2008 in the Veneto region. Aged 0 to 14 years | Varicella cases incidence: (a) from surveillance data retrieved from the RDP (b) sentinel surveillance system based on a sample of paediatricians (SPES). Hospitalised cases for varicella hospital discharges that reported diagnoses codes 052.X. Admissions with coexistent codes for herpes zoster, i.e. 053.X, were excluded. (c) hospitalisations | MMRV vaccine: not described and monovalent varicella vaccine Reference period 2000 to 2006 Exposed period 2007 to 2008 | Cases/person time (RDP) incidence reference period (a) 81,276/438,3097 Exposed period (a) 14,749/1,345,351 (SPES) incidence reference period (b) 13,543/196,949 Exposed period (b) 1344/26,861 Hospitalised reference period (c) 770/4,383,497 Exposed period (c) 126/1,348,474 | rr (95% CI) (a) 0.59 (0.58 to 0.6) ‐‐‐‐‐‐‐‐‐‐‐‐‐‐‐‐‐‐‐‐‐ (a1) 0.44 (0.43 to 0.45) Sensitivity analysis Data from 2007, | VE = (1 − rr) x 100 (a) 40.9% (39.8% to 41.9%) ‐‐‐‐‐‐‐‐‐‐‐‐‐‐‐‐‐‐‐‐‐‐‐‐‐‐‐‐‐‐ (a1) 56.2% (54.9% to 57.3%) |
| ga‐Tafuri 2015 | Hospitalisation between 2003 to 2012 in the Puglia region. Aged 0 to 14 years (a) age < 1 year (b) age 1 to 4 years (c) age 5 to 14 years | Hospitalised cases for varicella Hospitalisation rates, overall and specific by from the regional HDR, selecting all hospital admissions with or its complications (ICD9‐CM Incidence rates, overall and specific by age, between 2003 collected in the Apulian for communicable diseases. | MMRV vaccine: not described and monovalent varicella vaccine Reference period 2003 to 2005 Exposed period 2009 to 2012 | Hospitalised reference period (a) 245/39,618 (b) 2148/163,321 (c) 2201/451,858 Exposed period (a) 39/37,356 (b) 161/152,607 (c) 289/420,058 Incidence reference period (a) 14/39,548 (b) 57/1,623,931 (c) 42/446,809 Exposed period (a) 5/39,063 (b) 9/160,714 (c) 10/434,783 | rr (95% CI)(*) Hospitalised (a) 0.17 (0.12 to 0.24) (b) 0.08 (0.07 to 0.09) (c) 0.14 (0.12 to 0.16) Incidence (a) 0.36 (0.13 to 1.03) (b) 0.16 (0.08 to 0.33) (c) 0.25 (0.12 to.050) (*) Relative risk between exposed and reference period | VE = (1 − rr) x 100 Hospitalised (a) 63.8% (−0.4% to 87%) Incidence (a) 83.1% (76.3% to 88%) |
CI: confidence interval
HDR: hospital discharge registry
ICD‐9‐CM
MMR: measles, mumps, rubella vaccine
MMRV: measles, mumps, rubella, and varicella vaccine
n: number of participants in intervention and control arm
RDP: Regional Department of Prevention
SPES: Sorveglianza PEdiatric Sentinella
VE: vaccine effectiveness/efficacy
Vaccine safety‐harms
We included 87 studies on the safety of MMR/MMRV vaccines, with the following study designs: 7 RCTs/CCTs, 21 case control, 32 cohorts, 16 SCCS/PTC, 3 CCO, and 4 COEM. Seven of 87 studies reported data on several adverse effects and were therefore included in each corresponding comparison group (cb‐McKeever 2004; cb‐Timmermann 2015; db‐Farrington 1995; db‐Makela 2002; db‐Miller 2007; db‐Perez‐Vilar 2018; db‐Ward 2007). The studies evaluating adverse events are presented in 18 main groups.
-
Short‐term side effects: overall 17 studies: 7 RCTs/CCTs, ab‐Bloom 1975; ab‐Ceyhan 2001; ab‐Edees 1991; ab‐Freeman 1993; ab‐Lerman 1981; ab‐Peltola 1986; ab‐Schwarz 1975, and 10 cohort studies (cb‐Beck 1989; cb‐Benjamin 1992; cb‐Dunlop 1989; cb‐Makino 1990; cb‐Miller 1989; cb‐Robertson 1988; cb‐Sharma 2010; cb‐Stokes 1971; cb‐Swartz 1974; cb‐Weibel 1980). See Table 10 and Table 11.
-
Encephalitis or encephalopathy: overall 3 studies: 1 case control (bb‐Ray 2006), 1 SCCS (db‐Ward 2007), and 1 PTC (db‐Makela 2002). See Table 12.
-
Aseptic meningitis: overall 10 studies: 1 case control (bb‐Black 1997), 4 SCCS/PTC (db‐Dourado 2000; db‐Farrington 1995; db‐Miller 2007; db‐Perez‐Vilar 2018), 1 PTC (db‐Makela 2002), 2 CCO (eb‐Ki 2003; eb‐Park 2004), and 2 COEM (gb‐da Cunha 2002; gb‐da Silveira 2002). See Table 13.
-
Seizure ‐ febrile/afebrile: overall 8 studies: 2 cohort (cb‐Barlow 2001; cb‐Vestergaard 2004), 4 SCCS (db‐Farrington 1995; db‐Macartney 2017; db‐Miller 2007; db‐Ward 2007), and 2 PTC (db‐MacDonald 2014; db‐McClure 2019). See Table 14.
-
MMRV versus MMR/MMR+V ‐ febrile seizures: overall 7 cohort (cb‐Gavrielov‐Yusim 2014; cb‐Jacobsen 2009; cb‐Klein 2010; cb‐Klein 2012; cb‐Klein 2017; cb‐Rowhani‐Rahbar 2013; cb‐Schink 2014). See Table 15.
-
Autism spectrum disorders: overall 13 studies: 4 cohort (cb‐Hviid 2019; cb‐Jain 2015; cb‐Madsen 2002; cb‐Uchiyama 2007), 4 case control (bb‐De Stefano 2004; bb‐Mrozek‐Budzyn 2010; bb‐Smeeth 2004; bb‐Uno 2012), 1 SCCS (db‐Taylor 1999), 1 PTC (db‐Makela 2002), and 3 COEM (gb‐Fombonne 2001; gb‐Fombonne 2006; gb‐Honda 2005). See Table 16.
-
Inflammatory bowel disease: overall 6 studies: 4 case control, bb‐Baron 2005; bb‐Davis 2001; bb‐Shaw 2015; bb‐Vcev 2015, and 2 COEM (gb‐Seagroatt 2005; gb‐Taylor 2002). See Table 17.
-
Cognitive delay, developmental delay: 1 cohort study reported data on cognitive delay (cb‐Mrozek‐Budzyn 2013). See Table 18.
-
Idiopathic thrombocytopenic purpura: overall 9 studies: 2 case control (bb‐Bertuola 2010; bb‐Black 2003), 5 SCCS (db‐Andrews 2012; db‐Farrington 1995; db‐France 2008; db‐O'Leary 2012; db‐Perez‐Vilar 2018), 1 CCO (eb‐Lafaurie 2018), 1 COEM (gb‐Jonville‐Bera 1996). See Table 19.
-
Henoch‐Schönlein purpura: 1 case control study (bb‐Da Dalt 2016). See Table 20.
-
Type 1 diabetes: 2 cohort studies (cb‐Beyerlein 2017; cb‐Hviid 2004). See Table 21.
-
Asthma: 5 cohort studies (cb‐Benke 2004; cb‐DeStefano 2002; cb‐Hviid 2008; cb‐McKeever 2004; cb‐Timmermann 2015). See Table 22.
-
Dermatitis or eczema: 2 cohort studies (cb‐McKeever 2004; cb‐Timmermann 2015). See also Table 23.
-
Hay fever, rhinoconjunctivitis, hypersensitivity/allergy: overall 3 studies: 1 cohort study (cb‐Timmermann 2015), 2 case control (bb‐Bremner 2005; bb‐Bremner 2007). See Table 24.
-
Acute leukaemia: 4 case control studies (bb‐Dockerty 1999; bb‐Groves 1999; bb‐Ma 2005; bb‐Mallol‐Mesnard 2007). See Table 25.
-
Demyelinating diseases, multiple sclerosis, encephalomyelitis, acute disseminated encephalomyelitis (ADEM): overall 3 studies reported data on demyelinating diseases, multiple sclerosis, and ADEM: 1 cohort study (cb‐Ahlgren 2009), 2 case control studies (bb‐Ahlgren 2009; bb‐Chen 2018). See Table 26.
-
Gait disturbances: 1 SCCS (db‐Miller 2005). See Table 27.
-
Bacterial or viral infections: 2 SCCS reported data on bacterial or viral infections (db‐Miller 2003; db‐Stowe 2009). See Table 28.
| Study ID and design | Population | Vaccine arm | Comparator arm | Outcome | MMR vaccine arm | Other vaccine arms | Comparator arm |
|---|---|---|---|---|---|---|---|
| RCT | Children aged 11 months to 4 years Observation period 21 days | MMR vaccine Measles Schwarz Mumps Jeryl Lynn Rubella Cendehill n = 183 ‐‐‐‐‐‐‐‐‐‐‐‐‐‐‐‐‐‐‐ Temperature sample size n = 160 Normal temperature rectal 99.6 °F (37.5 °C) (163 children) Oral 98.6 °F (37 °C) (6 children) Axillary 97.6 °F | Placebo n = 40 ‐‐‐‐‐‐‐‐‐‐ Temperature sample size n = 35 | Reactions (a) Rash (b) Lymphadenopathy (d) Rhinitis (e) Cough (f) Other total ‐‐‐‐‐‐‐‐‐‐‐‐‐‐‐‐ Temperature (a) 1.5 to 2.4 °F (b) 2.5 to 3.4 °F (c) 3.5 to 4.4 °F (d) 4.5 to 4.9 °F (e) ≥ (normal + 1.5) °F | MMR vaccine (a) 22/183 (b) 2/183 (c) 4/183 (d) 2/183 (e) 5/183 (f) 35/183 total 70/183 ‐‐‐‐‐‐‐‐‐‐‐‐‐‐‐‐‐‐‐ Temperature above normal (a) 17/160 (b) 1/160 (c) 5/160 (d) 2/160 (e) 25/160 | ‐ | Placebo arm (a) 2/40 (b) 1/40 (c) 4/40 (d) 4/40 (e) 1/40 (f) 8/40 total 20/40 ‐‐‐‐‐‐‐‐‐‐‐‐‐‐‐‐‐‐‐ Temperature above normal (a) 2/35 (b) 2/35 (c) 0/35 (d) 0/35 (e) 4/35 |
| CCT | Infants aged 38 to 40 months Observation period 28 days | Arm A: n = 442 (1) MV/Rouvax Measles Schwarz at 9 months; and (2) MMR/Trimovax Measles Schwarz Mumps Urabe AM9 Rubella Wistar RA 27/3 at 15 months ‐‐‐‐‐‐‐‐‐‐‐‐‐‐‐‐‐‐‐‐‐‐‐ Arm B: n = 495 (3) MMR/Trimovax Measles Schwarz Mumps Urabe AM9 Rubella Wistar RA 27/3 at 12 months | No placebo arm | Systemic reactions (a) Fever (b) Runny nose (c) Cough (d) Rash (e) Diarrhoea ‐‐‐‐‐‐‐‐‐‐‐‐‐‐‐‐‐‐‐ Local (f) Redness (g) Swelling ‐‐‐‐‐‐‐‐‐‐‐‐‐‐‐‐‐ Total events (x) Fever (y) Systemic (z) Local | MMR vaccine (2)15 months; (3)12 months (a) 40/442; 55/495 (b) 7/442; 22/495 (c) 36/442; 34/495 (d) 16/442; 19/495 (e) 2/442; 5/495 ‐‐‐‐‐‐‐‐‐‐‐‐‐‐‐‐‐‐‐‐‐‐‐‐‐‐‐‐‐‐‐‐‐‐‐ Local (2)15 months; (3)12 months (f) 14/442; 19/495 (g) 2/442; 3/495 ‐‐‐‐‐‐‐‐‐‐‐‐‐‐‐‐‐‐‐‐‐‐‐‐‐‐‐‐‐‐‐‐‐‐ Total events (2)15 months; (3)12 months (x) 40/442; 55/495 (y) 61/442; 80/495 (z) 16/442; 22/495 | MV vaccine (1) 9 months (a) 38/442 (b) 19/442 (c) 28/442 (d) 2/442 (e) 5/442 ‐‐‐‐‐‐‐‐‐‐‐‐‐‐‐‐‐‐‐ Local (f) 7/442 (g) 2/442 ‐‐‐‐‐‐‐‐‐‐‐‐‐‐‐‐‐‐ Total events (x) 38/442 (y) 54/442 (z) 9/442 | |
| RCT | Children aged 12 to 18 months. Observation period 21 days | Arm A: n = 196 MV/Rouvax Measles Schwarz ‐‐‐‐‐‐‐‐‐‐‐‐‐‐‐‐‐‐‐‐‐‐‐ Arm B: n = 198 MMR/Trimovax Measles Schwarz Mumps Urabe AM9 Rubella Wistar RA 27/3 | No placebo arm | Local symptoms ‐‐‐‐‐‐‐‐‐‐‐‐‐‐‐‐‐‐‐‐‐‐‐‐‐‐‐ Specific systemic ‐‐‐‐‐‐‐‐‐‐‐‐‐‐‐‐‐‐‐‐‐‐‐‐‐‐‐‐‐ Restlessness: used to describe a non‐specifically unwell child; it covers terms such as irritable miserable tearful clingy not sleeping. | MMR vaccine (Arm B) Local (a) 18/198 ‐‐‐‐‐‐‐‐‐‐‐‐‐‐‐‐‐‐‐‐‐‐‐‐‐‐‐ Specific systemic ‐‐‐‐‐‐‐‐‐‐‐‐‐‐‐‐‐‐‐‐‐‐‐‐‐‐‐‐‐‐‐ Non‐specific systemic (a) 76/198 | MV vaccine (Arm A) Local (a) 16/196 (b) 0/196 (c) 14/196 ‐‐‐‐‐‐‐‐‐‐‐‐‐‐‐‐‐‐‐‐‐‐‐‐‐‐‐‐‐‐‐ Specific systemic (a) 100/196 ‐‐‐‐‐‐‐‐‐‐‐‐‐‐‐‐‐‐‐‐‐‐‐‐‐‐‐‐‐‐‐ Non‐specific systemic (a) 74/196 | |
| RCT | Children aged 15 months to 5 years Observation period 42 days | Arm(1): n = 43: Arm(2): n = 41: Arm(3): n = 47: Arm(4): n = 142 Arm(5): n = 46: Rubella/Wistar RA27/3 Arm(6): n = 141: | Placebo arm (vaccine diluent) | Reactions (a) Local reaction (b) Fever (c) Fever (fever 39.4 to 40.5 °C) (d) Respiratory symptoms (e) Rash (f) Lymphadenopathy (g) Sore eyes (h) Joint symptoms | MMR vaccine | Other vaccine arms: (1); (2); (3); (5) (a) 1/43; 6/41; 3/47; 2/46 | Placebo arm (a) 3/42 |
| RCT | Pairs of twins aged (a) 14 to 18 months (first dose) (b) 6 years (second dose) Observation period 21 days | MMR vaccine Vivirac (MSD) 2 doses n = 581 | Placebo arm | No data available for quantitative synthesis | |||
| RCT | Children aged 10 months to 8 years Observation period | MMR vaccine Measles Schwarz Mumps Jeryl Lynn Rubella Cendehill n = 403 | Placebo arm n = 205 | Temperature (2) Rectal ‐‐‐‐‐‐‐‐‐‐‐‐‐‐‐‐‐‐‐‐‐‐‐‐‐‐ (a) < 37.0 °C (b) 37.0 to 37.4 °C (c) < 37.5 °C (d) 37.5 to 37.9 °C (e) 38.0 to 38.4 °C (f) 38.5 to 38.9 °C (g) 39.0 to 39.4 °C (h) 39.5 to 39.9 °C (i) 40.0 to 40.4 C° ‐‐‐‐‐‐‐‐‐‐‐‐‐‐‐‐‐‐‐‐‐‐‐‐‐‐ Reactions (s1) Rash | MMR vaccine (1) Temperature axillary (a) 56/244 (b) 154/244 (c) 210/244 (d) 21/244 (e) 6/244 (f) 2/244 (g) 3/244 (h) 2/244 (i) 0/244 ‐‐‐‐‐‐‐‐‐‐‐‐‐‐‐‐‐‐‐‐‐‐‐ (2) Temperature rectal (a) not reported (b) not reported (c) 48/142 (d) 51/142 (e) 30/142 (f) 8/142 (g) 1/142 (h) 1/142 (i) 3/142 ‐‐‐‐‐‐‐‐‐‐‐‐‐‐‐‐‐‐‐‐ Reactions (s1) 36/403 | Placebo arm (1) Axillary temperature (a) 32/176 (b) 132/176 (c) 164/176 (d) 9/176 (e) 2/176 (f) 1/176 (g) 0/176 (h) 0/176 (i) 0/176 ‐‐‐‐‐‐‐‐‐‐‐‐‐‐‐‐‐ (2) Rectal temperature (a) Not reported (b) Not reported (c) 6/28 (d) 13/28 (e) 6/28 (f) 1/28 (g) 2/28 (h) 0/28 (i) 0/28 ‐‐‐‐‐‐‐‐‐‐‐‐‐‐ Reactions (s1) 9/205 | |
| Cluster‐RCT | Children aged 13 to 15 months Observation period 30 days | MMR vaccine MMRII (MSD) n = 253 | No placebo arm | Reactions (a) Lymphadenopathy (b) Nasal discharge (c) Rash | Reactions (a) 57/240 (b) 15/240 (c) 11/240 (d) 8/240 (e) 8/240 (f) 2/240 |
MR: mumps‐rubella vaccine
MMR: measles, mumps, rubella vaccine
MMRV: measles, mumps, rubella, and varicella vaccine
RCT: randomised controlled trial
| Study ID and | Population | Vaccine arm | Comparator arm | Outcome | MMR vaccine arm | Other vaccine arms | Comparator arm |
|---|---|---|---|---|---|---|---|
| Prospective | Children aged 12 to 14 months | MMR vaccine n = 103 containing 4.1 TCID50 | Placebo n = 93 | Reactions (a) Local reactions(*) (b) Fever > 37.5 °C (c) Catarrhal symptoms (d) Swelling of cheeks (*)Local reactions: redness, swelling, tenderness | MMR vaccine arm (a) 2/103 (b) 2/103 (c) 13/103 (d) 3/103 | Placebo arm (a) 1/93 (b) 1/93 (c) 9/93 (d) 4/93 | |
| Retrospective | Children aged | MMR vaccine n = 1588 strain not stated | Comparator Not immunised n = 1242 | All episodes (e) Convulsion (f) Coryza (g) Swollen glands (h) Fever (i) Skin rash (k) Doctor consultation (*)Arthralgia was defined joint but not accompanied by swelling. (§)Possible arthritis | MMR vaccine arm All episodes (e) 11/1588 (f) 897/1588 (g) 184/1588 (h) 279/1588 (i) 260/1588 (j) 76/1588 (k) 616/1588 | Placebo arm All episodes (e) 5/1588 (f) 797/1588 (g) 135/1588 (h) 262/1588 (i) 216/1588 (j) 78/1588 (k) 554/1588 | |
| Prospective | Children aged | (1) MMR vaccine n = 319 Trimovax Mérieux, measles Schwarz rubella RA 27/3 (2) MV vaccine n = 16 Mérieux, containing | Local symptoms (a) Injury site bruise ‐‐‐‐‐‐‐‐‐‐‐‐‐‐‐‐‐‐‐‐‐‐‐‐‐‐‐‐ Systemic symptoms (a) Rash (b) Fever (c) Cough (d) Off‐color (e) Diarrhoea (f) Nappy rash (g) Earache (h) Parotitis (i) Lymphadenopathy (j) Hospital admission (a) Asymptomatic/unrelated | (1) MMR vaccine Local symptoms (a) 19/319 ‐‐‐‐‐‐‐‐‐‐‐‐‐‐‐‐‐‐‐‐‐‐‐‐‐‐‐‐ Systemic symptoms (a) 93/319 (b) 74/319 (c) 71/319 (d) 55/319 (e) 22/319 (f) 29/319 (g) 16/319 (h) 5/319 (i) 4/319 (j) 1/319 (a) 138/319 | (2) MV vaccine Local symptoms (a) 0/16 ‐‐‐‐‐‐‐‐‐‐‐‐‐‐‐‐‐‐‐‐‐‐‐‐‐‐‐‐ Systemic symptoms (a) 4/16 (b) 3/16 (c) 6/16 (d) 8/16 (e) 0/16 (f) 0/16 (g) 0/16 (h) 0/16 (i) 0/16 (j) 0/16 (a) 9/16 | ||
| Prospective | Children aged | (1) MMR vaccine n = 893 rubella Takahashi | Clinical reactions (a) Fever (≥ 37.5 °C) | (1) MMR vaccine (a) 139/893 | (2) Measles; (3) Mumps (a) 18/147; 0/122 | ||
| Prospective | Children aged | (1) MMR vaccine n = 6149 Immrawa or Pluserix, (not described) | Clinical reactions (a) Symptoms (1 day only) observation period | (1) MMR vaccine | (2) Measles vaccine | ||
| Prospective | Children aged | (1) MMR vaccine n = 236 | Clinical reactions (a) Irritability (g) Diarrhoea (o) Given paracetamol (p) Seen by a doctor observation period | (1) MMR vaccine (g) 55/236 | (2) Measles vaccine (g) 10/52 (o) 29/52 | ||
| cb‐Stokes 1971 prospective cohort | Costa Rica children aged | MMR vaccine n = 457 | Placebo arm n = 175 | (a) Conjunctivitis Observation period 28 days (*)Otitis, allergy, | MMR vaccine arm | Placebo arm | |
| USA; prospective cohort | USA children aged | MMR vaccine USA n = 228 | Placebo arm | (a) Conjunctivitis (a) < 99 °F, Observation period 28 days (*)Unrelated illness: ‐‐‐‐‐‐‐‐‐‐‐‐‐ Temperature | MMR vaccine arm ‐‐‐‐‐‐‐‐‐‐‐‐‐‐‐‐‐‐‐ | Placebo arm | |
| cohort study | Prospective | Children aged | MMR vaccine Serum Institute of India measles Edmonston‐Zagreb, 1000 CCID50 Sample sizes vaccine arms (1) n = 65,423 (2) n = 329,211 | Placebo arm unvaccinated Sample sizes placebo arms (1) n = 12,253 (2) n = 46,232 observation period | Local reactions Systemic reactions | Vaccine arms (1) age 16 to 24 months Local reactions Systemic reactions (2) age 5 to 7 years Local reactions Systemic reactions | Placebo arms (1) age 16 to 24 months Local reactions Systemic reactions (2) age 5 to 7 years Local reactions Systemic reactions |
| Prospective cohort | 59 children aged | (1) MMR vaccine n = 22 Merck Institute Temperature (1) 7 to 11 days (2) 7 to 12 days (3) 7 to 15 days | Reactions (a) Swollen glands (c) Conjunctivitis (d) Rash Temperature (a) < 37.2 °C | (1) MMR vaccine (a) 12/22 (b) 8/22 (c) 7/22 (d) 1/22 (e) 10/22 ‐‐‐‐‐‐‐‐‐‐‐‐‐‐‐‐‐‐ Temperature (b) 4/22 (c) 3/22 (d) 0/22 | (2) MR; (3) Rubella (a) 9/15: 7/22 (b) 8/15; 5/22 (c) 7/15; 7/22 (d) 3/15; 2/22 (e) 6/15; 14/22 ‐‐‐‐‐‐‐‐‐‐‐‐‐‐‐‐‐‐ Temperature (b) 3/15; 3/22 (c) 3/15; 3/22 (d) 0/15; 0/22 | ||
| Prospective cohort | (1) MMR vaccine n = 68 (Merck, containing | Reactions (a) Rash (b) Lymphadenopathy (c) Arthralgia (e) Anorexia Temperature Temperature | (1) MMR vaccine Reactions (a) 16/68 Temperature | (2) Rubella vaccine Reactions (a) 3/67 Temperature (a) 37/67 |
CCID50: cell culture infectious dose 50%
MR: mumps‐rubella vaccine
MMR: measles, mumps, rubella vaccine
MMRV: measles, mumps, rubella, and varicella vaccine
RCT: randomised controlled trial
TCID50: Median Tissue Culture Infectious Dose
URTI: upper respiratory tract infection
| Study ID and | Population | Outcome definition | Exposure | Findings | Crude data | Estimate (95% CI) |
|---|---|---|---|---|---|---|
| Case‐control | Cases: Controls: (n = 1280) matching for HMO, location, age within 7 days, sex, and length of enrolment in health plan | 1. Encephalopathy: acute generalised disturbance of brain function requiring hospitalisation and consisting of coma or stupor that cannot be attributed to medication or postictal state. Such cases must have altered consciousness, delirium, obtundation and/or confusion. 2. Reyes syndrome: clinical symptoms of acute encephalopathy with altered level of consciousness as well as:
3. Encephalitis/encephalomyelitis: evidence of acute neurologic disease presenting with non‐specific signs such as fever, seizures, altered consciousness, headache, vomiting, meningismus, or anorexia. Multifocal involvement of the central nervous system and evidence of cerebrospinal fluid inflammation (7 white blood cells/mm3) were required. Diseases with other known aetiologies were excluded. For data analysis, all cases were stratified on the basis of their aetiology: known, unknown, suspected but unconfirmed (this last when a diagnosis was not confirmed by a diagnostic test). Hospitalisation cases for encephalopathy, Reyes syndrome, or encephalitis (primary or secondary diagnosis) in children aged 0 to 6 years, members of the health plan of 4 HMOs in the USA, and occurred between 1 January 1981 and 31 December 1995, were considered as possible cases. | Vaccine exposure (a) 7 to 14 days MMR type not reported. Vaccination status | The findings do not support a conclusion that there is an This corresponds roughly to an all‐cause incidence (not an attributable risk) of 1 in 200,000 after MMR, a rate that is not statistically different from background. Consequently, our results support the continued use of DTP and MMR vaccines. | N cases vaccinated/ (a) 1/452 versus 6/1280 | OR (95% CI) ‐‐‐‐‐‐‐‐‐‐‐‐‐‐‐‐‐‐‐‐‐‐‐‐‐‐‐‐ (a) 0.40 (0.05 to 3.46) (b) 0.35 (0.04 to 2.95) (c) 0.85 (0.27 to 2.68) (d) 0.64 (0.27 to 1.50) (e) 0.98 (0.47 to 2.01) adjusted estimates |
| Person‐time cohort | Children immunised aged 1 to 7 years old. Between n = 535,544 n = 119 children (MMR vaccine was administered before the disease), and only 97 between 0 and 24 months after MMR vaccination. | Encephalitis: acute or subacute onset of neurologic symptoms. Presence of neurologic symptoms or findings (clinical or laboratory, e.g. microbiological, electroencephalographic, computed tomographic) indicative of involvement of the brain parenchyma, such as coma, seizures, focal neurologic findings, or mental function impairment. Absence of evidence of other diagnoses, including non‐inflammatory conditions, and no microbiological or other laboratory findings suggestive of a non‐viral infection. When pleocytosis in CSF is present, the term encephalitis is used, implying an inflammatory response within the brain. The presence of normal CSF findings does not preclude the diagnosis if the other criteria are satisfied. Encephalopathy: clinically resembles encephalitis but no inflammatory response is evident. Chronic encephalopathy: persistence of acute findings usually over several months. The National Hospital Discharge Register was consulted by using the following ICD‐8 codes: 065.99, 066.01, 066.02, 072.01, 292.20, 292.38, 292.39, 323.00, 323.01, 323.08, 323.09, 781.70, 999, 999.10. Medical records of hospitalised participants were reviewed (in order to evaluate possible other causes of the event) and their correspondence to diagnostic criteria (see column on the right) examined. | Exposure risk period: (a) 0 to 3 months after vaccination Control period: (b) 4 to 24 months Observation period: (c) 0 to 24 months MMR II vaccine (Merck & Co, West Point, PA) measles: Enders‐Edmonston mumps: Jeryl Lynn rubella: Wistar RA 27/3 Vaccination data were assessed through vaccination register. | Not significant excess of hospitalisation within 3 months of vaccination (P = 0.28) Incidence of encephalitis of undefined cause amongst 1‐ to 7‐year‐old children decreased from 13.0 per 100,000 in 1985. | (a) 9 cases (3 months) (b) 88 cases (21 months) (c) 97 cases (24 months) | rr (95% CI)* 0.72 (0.36 to 1.42) (*)rate ratio amongst risk period (b) and control period (a) |
| Self‐controlled case series | Children aged 2 to 35 months (immunised with MMR; NK) with outcome of interest diagnosed between October 1998 and September 2001 (n = 107) | Onset of illness: day of hospital admission Fever: temperature of 37.5 °C; the questionnaire asked whether there was a fever and also for the maximum temperature recorded at any site by any method Encephalitis:
Exclude:
Cases of suspected encephalitis and/or severe illness with fever and convulsion occurring in children aged between age 2 and 35 months through Britain and Ireland were identified by consultant paediatricians taking part in a survey (October 1998 to September 2001) and notified to the British Paediatric Surveillance Unit. Details about neurologic illnesses were collected by reporting paediatricians by means of a detailed questionnaire. For diagnostic purposes, saliva, blood, and cerebrospinal samples were also collected. Questionnaires were reviewed by study investigators in order to assess whether reported cases corresponded to an analytical case definition taking into account severe illness with fever and convulsion and encephalitis (see column on the right). | Exposure risk period: MMR vaccine type, not reported. Immunisation history of cases was obtained by the Immunisation Department of the Health Protection Agency (other than MMR vaccine, the study also considers DTP, Hib, and MenC vaccines). Only cases with known vaccination history were included in the analysis. | Regarding MMR vaccine, there was no evidence of a raised relative incidence of serious neurologic disease 15 to 35 days after immunisation. | Within 15 to 35 days with concurrent primary HHV‐6 or HHV‐7 infection (a) all (5 cases) (b) no (4 cases) (c) yes (1 case) | rr (95% CI) (a) 1.34 (0.52 to 3.47) (b) 1.52 (0.52 to 4.41) (c) 0.86 (0.10 to 7.23) |
incidence: cases/PT
CI: confidence interval
CSF: cerebrospinal fluid
DTP: diphtheria, tetanus, pertussis vaccine
Hib: Haemophilus influenzae b vaccine
HHV: human herpes virus
HMO: health maintenance organisation
ICD: International Classification of Diseases
MenC: meningococcus C vaccine
MMR: measles, mumps, rubella vaccine
MMRV: measles, mumps, rubella, and varicella vaccine
MRI: magnetic resonance imaging
PT: person‐time
OR: odds ratio
RR: risk ratio (relative risk)
rr = rate ratio (relative incidence; incidence rate ratio)
| Study ID and design | Population | Outcome definition | Exposure MMR/MMRV vaccine | Findings | Crude data | Estimate (95% CI) |
|---|---|---|---|---|---|---|
| bb‐Black 1997 case‐control | Cases n = 59 | Aseptic meningitis Potential cases of aseptic meningitis were identified by computerised hospitalisation at 4 HMOs that participated in the Vaccine Safety Datalink project. They were children aged 12 to 23 months with ICD‐9 discharge diagnoses 045.2, 047.*, 048, 072.1, 321.2 or 322.* between 1984 and 1993. Medical records of potential cases were reviewed and included as cases when corresponding to validation criteria (see column on the right). No evidence of prior underlying meningitis or underlying disease caused by toxoplasmosis, syphilis, cytomegalovirus, neonatal herpes simplex, or HIV. (The same exclusion criteria were used for controls.) In addition, bacterial, mycobacterial, and fungal cultures of the cerebrospinal fluid must have been negative, and the patient must have had a cerebrospinal fluid white blood cell count of >= 10 cells/mm3. | MMR vaccine: Jeryl Lynn mumps strain. Any vaccines includes: Vaccine and time window (a) MMR 0 to 14 days (b) MMR 0 to 30 days (c) MMR 8 to 14 days (d) Any vaccine 0 to 14 days (e) Any vaccine 0 to 30 days (f) Any vaccine 8 to 14 days Vaccination status of both cases and controls was derived from medical record review. | In this analysis of hospitalisation caused by AM, there was no increased risk of AM after MMR vaccine containing Jeryl Lynn strain mumps. | N cases vaccinated/ (a) 1/59 versus 4/118 (b) 3/59 versus 7/118 (c) 1/59 versus 2/118 (d) 2/59 versus 8/118 (e) 7/59 versus 18/118 (f) 2/59 versus 4/118 | OR (95% CI) (a) 0.50 (0.1 to 4.5) (b) 0.84 (0.2 to 3.5) (c) 1.00 (0.1 to 9.2) (d) 0.44 (0.1 to 2.1) (e) 0.75 (0.3 to 1.9) (f) 1.00 (0.2 to 5.6) |
| Case cross‐over | (1) n = 39. Children with aseptic meningitis aged 13 to 29 months of both sexes, vaccination date confirmed by vaccination record. (2) n = 19. Children with aseptic meningitis aged 12 to 15 months of both sexes, vaccination date confirmed by parents only. | Aseptic meningitis Generically defined as syndrome characterised by acute onset of meningeal symptoms, fever, and cerebrospinal fluid pleocytosis, with bacteriologically sterile cultures. Cases of aseptic meningitis were identified from insurance claims and hospitalisation data during 1998 in Korea. Authors considered cases corresponding to diagnosis criteria occurred in children aged 8 to 36 months who had received MMR vaccine within 1 year before disease onset and for whom vaccination records were available. | MMR vaccine: Risk period (42 days) (a) from disease onset date to 42 days after Control period (323 days) (b) from 42 days up to 365 days after disease onset | Study results showed that risk increased in the third week after vaccination and was elevated until the sixth week. | (a) versus(b) (1) 11 versus 28 cases (2) 5 versus 14 cases Sensitivity analysis n = 58, 16 versus 42 cases | RR (95% CI)(*) (1) 3.02 (1.50 to 6.08) Sensitivity analysis 2.93 (1.65 to 5.22) (*)Mantel‐Haenszel Under the null hypothesis, this estimator is directly analogous to the Mantel‐Haenszel OR for matched‐pair case‐control study. |
| Case cross‐over | 67 children, mean age 19.1 months (standard deviation = 5.4 months) | Aseptic meningitis Aseptic meningitis is a syndrome characterised by acute onset of meningeal symptoms, fever, and cerebrospinal fluid pleocytosis with bacteriologically sterile cultures. The following criteria were used to define eligible cases of aseptic meningitis for the study: 1) Korean insurance claim cases based on the ICD‐10 (codes A87.9, G03.0, G03.9, and G02.0); and 2) cerebrospinal fluid pleocytosis (leukocytes ≥ 5) with bacteriologically sterile cultures (if measured); or 3) neck stiffness and/or convulsions, or 2 other symptoms (headache or vomiting) in addition to a fever (≥ 38.0 °C, if measured). Patients’ charts were reviewed and their symptoms, laboratory tests, and last diagnoses on the discharge record checked. If patients were diagnosed with aseptic meningitis and were hospitalised in a general hospital, in accordance with these criteria, those who had headache, fever, and vomiting could be included as participants. | MMR vaccine (1) n = 29 MMR with Urabe or Hoshino mumps strain (2) n = 38 MMR with Jeryl Lynn or Rubini mumps strain Risk period (42 days) (a) from disease onset date to 42 days after Control period (323 days) (b) from 42 days up to 365 days after disease onset | Study results showed that no significant risk was associated with the Jeryl Lynn or Rubini strain of the vaccine. For the Urabe or Hoshino strain, the risk increased in the third week after vaccination and was elevated until the sixth week. | (a) versus(b) (1) 13 versus 16 cases (2) 3 versus 35 cases | RR (95% CI)(*) (1) 5.5 (2.6 to 11.8) (2) 0.6 (0.18 to 1.97) (*)Mantel‐Haenszel Under the null hypothesis, this estimator is directly analogous to the Mantel‐Haenszel OR for matched‐pair case‐control study. |
| Person‐time cohort | Children immunised n = 535,544 n = 120 children (MMR vaccine was administered before the disease), and only 64 between 0 and 24 months after MMR vaccination. | Aseptic meningitis Inflammation of the meninges. Usually a self‐limiting disease of known or suspected viral cause consisting of fever, headache, signs of meningeal irritation, without evidence of brain parenchymal involvement and a lymphocytic and mononuclear pleocytosis of CSF. The term 'meningoencephalitis' does not differentiate cases with prominent involvement of the brain parenchyma from those with meningeal involvement only. Hospitalisation records (ICD‐8 codes: 045.99, 320.88, 320.99) and review of patients' medical records to assess correspondence to case definition. | Exposure risk period: (a) 0 to 3 months after vaccination Control period: (b) 4 to 24 months after vaccination Observation period: (c) 0 to 24 months after vaccination MMR II vaccine (Merck & Co, West Point, PA) Measles: Enders‐Edmonston Mumps: Jeryl Lynn Rubella: Wistar RA 27/3 Vaccination data were assessed through vaccination register. | Not significant excess of hospitalisation within 3 months of vaccination (P = 0.57) The incidence of meningitis of undefined causes in 1‐ to 7‐year‐old children decreased from 10.17 per 100,000 in 1983 to 7.71 per 100,000 in 1985. | (a) 10 cases (3 months) (b) 54 cases (21 months) (c) 64 cases (24 months) | rr (95% CI)(*) 1.30 (0.66 to 2.55) (*)rate ratio amongst |
| Self‐controlled case series ‐‐‐‐‐‐‐‐‐‐‐‐‐ Case‐only ecological method | Children aged 1 to 11 years (from census) n = 452,344 n = 129 children aged 1 to 11 years old admitted to the referral hospital with a diagnosis of aseptic meningitis between 10th and 43rd epidemiologic surveillance weeks of 1997 (March to October). n = 87 fulfilled inclusion criteria; n = 29 cases of AM occurred prior to the mass immunisation campaign; n = 58 after the immunisation campaign. Of the 58 children, n = 50 were know to have been vaccinated. (The date of vaccination was available for 43 of these children.) | Aseptic meningitis Data about meningitis were obtained from the state Epidemiology Surveillance System and from the neurologic service of the state referral hospital for infectious disease (Hospital Couto Maia), by reviewing hospital records of children admitted between the 10th and 43rd epidemiological surveillance weeks. Demographic, clinical, and laboratory data were collected on a standardised form. Inclusion/exclusion criteria 1) Residence in the city of Salvador 2) Age 1 to 11 years 3) Cerebrospinal fluid with a cell count of > 10 and < 1200 cells per mL (higher counts could be attributed to unconfirmed bacterial meningitis) 4) Predominance of lymphocytes in the cerebrospinal fluid of > 50% of the total number of cells 5) Exclusion of any bacteriologic or fungal confirmation through the use of Gram stain, latex, immunoelectrophoresis, stain for Cryptococcus neoformans, Ziehl‐Neelsen stain, or culture for bacteria and Mycobacterium tuberculosis 6) Exclusion of all cases with a history of prior meningitis or any neurologic disorder and any cases with sepsis, pneumonia, otitis, or any other disease that might be associated with an increased cell count in the cerebrospinal fluid | Self‐controlled case series Exposure risk period: (a) 3 to 5 weeks after vaccination (i.e. 15 to 35 days) Control period: (b) 1 to 2 weeks and 6 to 10 weeks after vaccination Observation period: (c) 1 to 10 weeks after vaccination ‐‐‐‐‐‐‐‐‐‐‐‐‐‐‐‐‐‐‐‐‐‐‐‐‐‐‐‐‐ Case‐only ecological method (a) Reference period (pre‐vaccination): 10 to 32 epidemiologic surveillance weeks; (b) Low‐risk period: 34 to 35 epidemiologic surveillance weeks; time interval = 2 weeks (c) High‐risk period: 36 to 39 epidemiologic surveillance weeks (3 to 6 weeks after vaccination day) (d) Low‐risk period: 40 to 43 epidemiologic surveillance weeks; time interval = 3 weeks MMR vaccine Pluserix vaccine (SmithKline Beecham, UK) containing mumps Urabe strain Vaccination began on 16 August 1997 (National Immunisation Day, surveillance week 33), 45% coverage of the target population was achieved on that day, high coverage (exact data not reported, but very close to 100%) during the 2 following weeks. Vaccination history was obtained by vaccination cards or visits/phone call. | An elevated risk of aseptic meningitis was observed 3 weeks after Brazil's national vaccination day compared with the risk in the pre‐vaccination period. This result was confirmed by a case series analysis. | (a) 35 cases (b) 3 and 5 cases (c) 43 cases ‐‐‐‐‐‐‐‐‐‐‐‐‐‐‐‐ Cases/PT (weeks) (a) 29/10,403,912 (b) 3/904,688 (c) 46/1,809,376 (d) 9/1,809,376 | Self‐controlled case series rr (95% CI)(*) 30.4 (11.5 to 80.8) (*)Poisson regression ‐‐‐‐‐‐‐‐‐‐‐‐‐‐‐‐‐‐‐‐‐ Case‐only ecological method rr (95% CI)(**) (a) reference weeks (b) 1.19 (0.36 to 3.91) (**)rate ratio amongst and control period (a). |
| Case‐only ecological method | Children aged 1 to 11 years State of (MS) n = 580,587 State of Mato Grosso (MT) n = 473,718 | Aseptic meningitis Data on cases of meningitis were obtained from the routine surveillance system in both states. Notification of meningitis is statutory in Brazil, with a standardised form completed for each case. The attending physician or nurse completes the notification form in the health facility where the diagnosis is made. The notification form includes data on patient’s identification, clinical diagnosis, evolution, treatment, results of vaccination status, and laboratory investigations (the last 2 items not always reported). Reported cases of meningitis were classified into aseptic or not based on information from the notification forms, using 2 different criteria, which are independent but non‐exclusive. In both criteria, AM included only cases with absence of a positive bacteriological isolate in culture or stain of CSF and did not have a positive blood culture or mention of other non‐viral aetiology. Criterion 1: If the diagnosis in the form was of viral aetiology or unknown aetiology, cases were classified as AM. They were classified as not having AM if they had a suspected or confirmed diagnosis of meningitis by a known (non‐viral) agent through any laboratory or clinical finding. Criterion 2 (laboratory): Cases were considered AM if they had a CSF with the following findings: cell count greater than 10 and less than 1500 and presence of lymphocytes greater that 49%. (Applied for the cases in which laboratory data were present in the notification forms. In their absence, cases were excluded.) | (MS) Unexposed period (a) reference weeks 1 to 31 (MS) Exposed period (b) low‐risk weeks 32 to 34 (c) high‐risk weeks 35 to 37 (d) low‐risk weeks 38 to 42 (e) all weeks 32 to 42 ‐‐‐‐‐‐‐‐‐‐‐‐‐‐‐‐‐‐‐‐‐‐‐‐‐‐‐‐‐‐‐‐‐‐‐‐‐ (MT) Unexposed period (a) reference weeks 1 to 37 (MT) Exposed period (b) low‐risk weeks 38 to 40 (c) high‐risk weeks 41 to 43 (d) low‐risk weeks 44 to 48 (e) all weeks 38 to 48 ‐‐‐‐‐‐‐‐‐‐‐‐‐‐‐‐‐‐‐‐‐‐‐‐‐‐‐‐‐‐‐‐‐‐‐‐‐ MMR vaccine: Serum Institute of India, Ltd, Pune. Contained Leningrad‐Zagreb mumps strain. 3 different lots were used in each state (MS and MT). Vaccination began in mid‐August 1998 (week 32) in MS and late September in MT (week 38), and lasted for about 1 month, even if the most part of the doses had been administered during the first 2 campaign weeks. Vaccination was reported for 69.4% and 93.5% of the target population in MT and in MS, respectively. | This study shows an increase in number of notified cases of AM in the 2 states studied, 3 to 4 weeks after the MIC using Leningrad‐Zagreb mumps strain MMR vaccine (3 to 4 weeks after the MIC corresponding to incubation period for wild mumps infection, and the increase was restricted to the age group targeted by the campaign and to the aseptic form of meningitis). The use of the vaccine on a large scale over a short period of time made it possible to identify an increase in risk which may be present, but more difficult to measure when vaccination is spread over longer periods. The risk estimates varied depending on the diagnostic criteria used and the state. There was also an increase in the incidence of notified mumps after the campaign in the state where data were available. | cases/PT (weeks) (MS) AM criterion 1 (a) 22/14,685,258 (b) 7/1,421,154 (c) 35/1,421,154 (d) 6/2,368,590 (e) 48/5,210,898 ‐‐‐‐‐‐‐‐‐‐‐‐‐‐‐‐‐‐‐‐‐‐‐‐‐‐‐‐‐ (MT) AM criterion 1 (a) 71/21,481,719 (b) 7/1,741,761 (c) 71/1,741,761 (d) 25/2,902,935 (e) 103/6,386,457 ‐‐‐‐‐‐‐‐‐‐‐‐‐‐‐‐‐‐‐‐‐‐‐‐‐‐‐‐‐ (MS) AM criterion 2 (a) 8/14,685,258 (b) 4/1,421,154 (c) 24/1,421,154 (d) 2/2,368,590 (e) 30/ 5,210,898 ‐‐‐‐‐‐‐‐‐‐‐‐‐‐‐‐‐‐‐‐‐‐‐‐‐‐‐‐‐ (MT) AM criterion 2 (a) 36/21,481,719 (b) 3/1,741,761 (c) 54/1,741,761 (d) 15/2,902,935 (e) 72/6,386,457 | rr (95% CI)* (MS) AM criterion 1 (a) reference weeks (b) 3.3 (1.41 to 7.7) (c) 16.4 (9.65 to 28.0) (d) 1.7 (0.69 to 4.2) (e) 6.2 (3.71 to 10.2) ‐‐‐‐‐‐‐‐‐‐‐‐‐‐‐‐‐‐‐‐‐‐‐‐‐‐‐‐‐ (MT) AM criterion 1 (a) reference weeks (b) 1.2 (0.56 to 2.6) (c) 12.3 (8.88 to 17.1) (d) 2.6 (1.65 to 4.1) (e) 4.9 (3.61 to 6.6) ‐‐‐‐‐‐‐‐‐‐‐‐‐‐‐‐‐‐‐‐‐‐‐‐‐‐‐‐‐ (MS) AM criterion 2 (a) reference weeks (b) 5.2 (1.56 to 17.2) (c) 31.0 (13.93 to 69.0) (d) 1.6 (0.33 to 7.3) (e) 10.6 (4.84 to 23.1) ‐‐‐‐‐‐‐‐‐‐‐‐‐‐‐‐‐‐‐‐‐‐‐‐‐‐‐‐‐ (MT) AM criterion 2 (a) reference weeks (b) 1.0 (0.32 to 3.3) (c) 18.5 (12.13 to 28.2) (d) 3.1 (1.69 to 5.6) (e) 6.7 (4.51 to 10.0) (*)rate ratio amongst and unexposed period (a) |
| Case‐only ecological method | Children aged 1 to 11 years target population n = 110,629 (Rio Grande do Sul) dose | Aseptic meningitis Mumps‐associated AM was defined as: that occurring in conjunction with or following clinically diagnosed mumps. Vaccine‐associated AM was defined as: aseptic meningitis with a pleocytosis of 10 to 1500 leukocytes/mL and occurring within 15 to 35 days after vaccine receipt. | MMR vaccine: produced by Serum Institute of India, Lot: 180‐X: measles: Edmonston‐Zagreb; mumps: Leningrad‐Zagreb; rubella: Wistar RA 27/3. The campaign was conducted between weeks 37 to 48. (a) unexposed period in 1995/1996 39 to 47 weeks (b) unexposed period in 1997 1 to 38 weeks (c) exposed period in 1997: High risk: 39 to 47 weeks (d) exposed period in 1997: Low risk: 48 to 53 weeks | A total of 105,098 doses of Leningrad‐Zagreb were administered to children The risk of vaccine‐associated These findings suggest that Leningrad‐Zagreb is more reactogenic than Urabe and Jeryl‐Lynn strains. | (a) 2.4 cases per 100,000 person weeks; 4.5 cases in average (b) 10 cases (any cause) (c) 28.7 per 100,000 person weeks (d) 4 cases (any cause) | rr (95% CI) (c) 12.2 (6.0 to 24.7)(*) (*)rate ratio (c) and (a) |
| Self‐controlled case series | Children aged 12 to 24 months discharged from hospital in 5 districts in England (Ashford, Leicester, Nottingham, Preston, and Chorley & Ribble) for varying periods between October 1988 and February 1993. Readmissions within 72 h with the same diagnosis were counted as 1 episode. n = 952 children | Aseptic meningitis Children discharged from hospital with a diagnosis of: meningitis categorised as mumps, aseptic, or viral (ICD 072.1, 047., 321.) Children aged between 366 and 730 days. | MMR vaccine: Urabe mumps strain Jeryl Lynn mumps strain Rubella strain not specified. Exposure risk period: (a1) 6 to 11 days (1 to 2 weeks after vaccination) (a2) 15 to 35 days (3 to 5 weeks after vaccination) (Urabe strain) Control period: (b) for each vaccine was defined as the time not included in a risk period. The analyses were adjusted for age and were grouped in 6 equal intervals of about 2 months. | The study shows that there is a true risk of a neurological event attributable to the Urabe strain. | Urabe strain (a1) 0 cases (a2) 5 cases | rr (95% CI) (a2) 38.1 (4.3 to 336)(*) (*)Poisson regression |
| Self‐controlled case series | Children aged 12 to 23 months with discharge diagnosis of febrile convulsion or aseptic meningitis | Aseptic menigitis: Viral meningitis (A87), mumps (B26), meningitis in other infections classified elsewhere (G02), and meningitis due to other and unspecified causes (G03) were identified for the period 1 May 1998 to 30 June 2001, and case notes were reviewed by a paediatrician. In addition, computerised hospital records for children aged 12 to 23 months with an ICD‐9 discharge diagnosis of meningitis categorised as mumps, aseptic, or viral (072.1, 047, 321) were identified for the period 1 January 1991 to 30 September 1992, prior to the withdrawal of Urabe‐containing MMR vaccines, and were linked with MMR vaccination histories. | MMR vaccine: (1) MMR with Urabe mumps strain up to September 1992 (2) MMRII (Sanofi Pasteur) Edmonston‐Enders measles strain, Jeryl Lynn mumps strain, between September 1992 and May 1998 (3) MMR Priorix (GlaxoSmithKline) Schwarz measles strain RIT4385 (Jeryl Lynn) from May 1998 Exposure risk period: (a) 15 to 35 days after vaccination (from May 1998 to June 2001) (Urabe MMR) (b) 15 to 35 days after vaccination (from January 1991 to September 1992) (Jeryl Lynn MMR) MMR vaccination histories were independently obtained through linkage with computerised immunisation records in the 2 Thames regions, using either the National Health Service number or sex, date of birth, and post code, a highly specific linking algorithm. Information on batch number was sought for any confirmed aseptic meningitis cases with onset 15 to 35 days after MMR vaccination. The formatting of batch numbers differs substantially between manufacturers in length and alphanumeric coding and is a precise means of distinguishing between vaccines from different manufacturers. | Before after between 2 risk periods, re‐analysis of the data presented in db‐Farrington 1995 This study confirms that the risk of aseptic meningitis with Priorix vaccine, if it exists at all, is significantly lower than with Urabe‐containing mumps vaccine. The study allowed the exclusion of risks as rare as 1 in 437,000 for laboratory‐confirmed mumps meningitis with non‐Urabe‐containing | Comparison between 2 risk periods Aseptic meningitis (a) 4 cases (b) 0 cases ‐‐‐‐‐‐‐‐‐‐‐‐‐‐‐‐‐‐‐‐‐‐‐‐ Laboratory‐confirmed mumps‐positive cerebrospinal fluid (a) 16 cases (b) 0 cases Data from the paper | rr(95%CI) 25.9 (2.8 to 233)(*) (*) rate ratio (a) versus (b) |
| Self‐controlled case series | For this study, WHO selected 26 sentinel sites (49 hospitals) distributed in 16 countries of the 6 WHO regions. The study population included children ages 9 to 23 months admitted to a network‐participating hospital during January 2010 to March 2014, with a discharge diagnosis of either AM or immune thrombocytopenic purpura. | Aseptic meningitis probable cases ICD‐9 codes in first discharge diagnosis position: 047 (047.0 to 047.9) Meningitis due to enterovirus 049.0 to 049.1 Other non‐arthropod‐borne viral meningitis 072.1 Mumps meningitis 321.2 Meningitis due to viruses not elsewhere classified 322.0, 322.1, 322.9 Meningitis of unspecified cause ICD‐10 codes in first discharge diagnosis position: A87.0 Meningitis due to enterovirus A87.1 Adenoviral meningitis A87.2 Lymphocytic choriomeningitis A87.8 Other viral meningitis A87.9 Viral meningitis, unspecified B26.1 Mumps meningitis G02.0 Meningitis due to viruses not elsewhere classified G03.0, G03.8, G03.9 Meningitis of unspecified cause | Vaccine(measles strain) (mumps strain) Priorix, GSK (Schwarz) (RIT 4385a) (Schwarz) (Urabe AM9) Risk period 8 to 35 days Washout periods 1 to 7 days 36 to 42 days Control period 43 to 84 days | The elevated risk estimates found for the Leningrad‐Zagreb mumps strain are consistent with previous studies (gb‐da Cunha 2002; gb‐da Silveira 2002). Regarding Jeryl‐Lynn‐derived strain vaccines, although the study did not have enough power to confirm the absence of risk for these strains, the finding of zero cases in the risk window was consistent with the hypothesis of no association (bb‐Black 1997; db‐Makela 2002). | In 16 countries n = 84 confirmed aseptic menigitis cases (Risk versuscontrol) period (a) Overall risk of AM following mumps‐containing vaccines (35 versus 5) (b) Overall risk of AM following mumps‐containing vaccines (excluding cases from Iran) (22 versus 3) (c) Leningrad‐Zagreb strain (7 versus 1) (d) Vaccines products used Hoshino/Leningrad‐Zagreb/Urabe AM9 (27 versus 2) (e) Vaccines products used Hoshino/Leningrad‐Zagreb/Urabe AM9 (excluded cases from Iran) (14 versus 0) | rr (95% CI) adjusted (a) 10.8 (4.0 to 29.2) (b) 12.4 (3.1 to 49.1) (c) 6.4 (1.3 to 87.4) rr (95% CI) unadjusted (d) 20.3 (48 to 85.2) (e) not estimable |
AM: aseptic meningitis
CI: confidence interval
CSO: cerebro‐spinal fluid
HMO: health maintenance organisation
ICD‐10: International Classification of Diseases
incidence: cases/PT
MIC: mass immunisation campaigns
MMR: measles, mumps, rubella vaccine
MMRV: measles, mumps, rubella, and varicella vaccine
n: number of participants
OR: odds ratio
PT: person‐time
rr: rate ratio (relative incidence, incidence rate ratio)
RR: risk ratio (relative risk)
WHO: World Health Organization
| Study ID and design | Population | Outcome definition | Exposure | Authors' conclusion | Crude data | Estimate (95% CI) |
|---|---|---|---|---|---|---|
| Retrospective and prospective cohort | Children born in Denmark from 1 January 1991 to 31 December 1998 aged 3 months to 5 years n = 537,171 | Information on febrile seizures and epilepsy was obtained from the National Hospital Register (NHR), which contains information on all patients discharged from Danish hospitals since 1977 (since 1995 information on outpatients (visits to emergency department and hospital clinics)). Diagnostic information was classified according to the Danish version of the ICD as follows: ICD‐8 was used from 1977 to 1993, and ICD‐10 was used from 1994 to the end of 1999. Febrile seizure: (a) within 2 weeks after vaccination (a1) 1 weeks after vaccination (a2) 2 weeks after vaccination ICD‐8 code 780.21 or ICD‐10 code R56.0, were aged between 3 and 60 months at the time of discharge, and had no recorded history of non‐febrile seizures, cerebral palsy, severe head traumas, intracranial tumours, meningitis, or encephalitis. The febrile seizures could not be classified as simple or complex because the NHR contains no information on number of febrile seizures occurring within the febrile episode, duration of the febrile seizures, and type of febrile seizures (generalised or focal onset). (b) Recurrent febrile seizure (b1) within 2 weeks after vaccination (b2) > 2 weeks after vaccination (c) Epilepsy subsequent to a first febrile seizure episode Children were categorised with epilepsy if they had ICD‐8 code 345 or ICD‐10 code G40. (c1) within 2 weeks after vaccination (c2) > 2 weeks after vaccination | Vaccination status of the children was ascertained by using data of the National Board of Health to which vaccination data were transmitted by general practitioners. MMR vaccine: Moraten measles, Jeryl Lynn mumps, Wistar RA 27/3 rubella The national vaccination program recommended during the entire study period that children should be vaccinated twice, at 15 months and at 12 years. Only the first vaccination is relevant to the endpoint under study. | MMR vaccination was associated with a transient increased rate of febrile seizures, but the risk difference was small even in high‐risk children. The long‐term rate of epilepsy was not increased in children who had febrile seizures following vaccination compared with children who had febrile seizures of a different aetiology. Febrile seizure: no statistically significant difference in the RR of febrile seizures in the 2 weeks following vaccination between subgroups of children characterised by family history of seizures, sex, birth order, gestational age at birth, birthweight, or socioeconomic factors, compared with non‐vaccinated children within the subgroup under study. The highest rate ratio (2 weeks following vaccination) was found amongst (a1)siblings of children with a history of epilepsy compared with rate of febrile seizures following vaccination in siblings of children with no history of epilepsy. Recurrent febrile seizures and epilepsy The authors found that children who experienced febrile seizures within 2 weeks of MMR vaccination had a 19% increased rate of recurrent febrile seizures but no increased rate of epilepsy during up to 105 months of follow‐up. The reference group consisted of children who had not been vaccinated when having their first febrile seizure. | Cases/PT (years) vaccinated (a) 7445/1,151,661 versus unvaccinated 10,541/793,568 vaccinated (b1) 236/2212 (b2) 981/12,675 versus unvaccinated 2753/23,560 vaccinated (c1) 9/3825 (c2) 95/21,938 versus unvaccinated 251/41,310 | rr (95% CI)* (a) 2.75 (2.55 to 2.97) (a1) 2.46 (2.22 to 2.73) (a2) 3.17 (2.89 to 3.49) amongst children with a personal history of febrile seizure (a1) 2.75 (2.32 to 3.26) (b1) 1.19 (1.01 to 1.41) (b2) 1.10 (0.96 to 1.26) (c1) 0.70 (0.33 to 1.50) (c2) 0.92 (0.59 to 1.43) (*) Poisson regression adjusted for age, calendar period, age of first febrile seizure, and current vaccination status |
| Retrospective cohort study | Data are collected from 4 HMOs. Children (n = 716) with a confirmed seizure during the study period: from 1 March 1993 to 30 September 1993. n = 679,942 children n = 340,386 vaccinated DTP n = 202,099 (unvaccinated) | Seizures were identified through the automated data systems of each HMO, on the basis of visits classified according to the ICD‐9‐CM, as code 333.2 (myoclonus), code 345 (epilepsy), code 779.0 (convulsions in a newborn), or code 780.3 (convulsions). Simple febrile seizures were defined as short, generalised seizures, accompanied by documented fever or a parental report of fever. Complex febrile seizures were defined as febrile seizures that occurred more than once in 24 hours and either lasted for at least 12 minutes or were accompanied by focal signs. | MMR vaccine Exposure period (after vaccination): (a1) 1 to 7 days (a2) 8 to 14 days (a3) 15 to 30 days Control period | The study found significantly elevated risks of febrile seizures from 8 to 14 days after the administration of MMR vaccine. The authors did not find a significantly elevated risk of febrile seizures at any other time after vaccination, nor did they find an elevated risk of non‐febrile seizures at any time after vaccination with MMR vaccine. This risk translates into approximately 25 to 34 additional | n = 521 febrile seizures in the absence of vaccination Febrile seizures (a1) 8 cases (a2) 13 cases (a3) 11 cases Non‐febrile seizures (a1) 1 case (a2) 1 case (a3) 1 case | rr (95% CI)(*) Febrile seizures (a1) 1.73 (0.72 to 4.15) (a2) 2.83 (1.44 to 5.55) (a3) 0.97 (0.49 to 1.95) Non‐febrile seizures (a1) not reported (a2) 1.11 (0.11 to 11.28) (a3) 0.48 (0.05 to 4.64) (*) Cox proportional hazard regression multivariate model estimates adjusted for age, sex, HMO, calendar time, and receipt of DTP vaccine. |
| Self‐controlled case series | Children aged 2 to 35 months (immunised with MMR; NK) with outcome of interest diagnosed between October 1998 and September 2001 (n = 107) | Case definition of serious neurologic disease: any child 2 to 35 months old with a severe illness with fever and convulsions and/or encephalitis (see Table 12) was included. Severe illness with fever and convulsions
Exclude: Viral (aseptic) meningitis without encephalopathy The following confirmed causes were excluded: hypoxic/ischaemic; vascular; toxic; metabolic, neoplastic, traumatic, and pyogenic infections; uncomplicated convulsions; or a series of convulsions lasting 30 min in immunocompromised children. | Exposure risk period: MMR vaccine type, not reported Immunisation history of cases was obtained by the Immunisation Department of the Health Protection Agency (other than MMR vaccine the study also considers DTP, Hib, and MenC vaccines). Only cases with known vaccination history were included in the analysis. | 6 to 11 days after measles, mumps, rubella vaccine there is an increased risk of fever and convulsions lasting 30 minutes. All 6 of the episodes temporally related to immunisation met the criteria for complex febrile convulsions. | Within 6 to 11 days With concurrent primary HHV‐6 or HHV‐7 infection (a) all (6 cases) (b) no (4 cases) (c) yes (2 cases) | rr (95% CI) (a) 5.68 (2.31 to 13.97) (b) 5.80 (1.98 to 16.99) (c) 5.55 (1.12 to 27.63) |
| Self‐controlled case series | Children aged 12 to 24 months discharged from hospital in 5 districts in England (Ashford, Leicester, Nottingham, Preston, and Chorley & Ribble) for varying periods between October 1988 and February 1993. Readmissions within 72 h with the same diagnosis were counted as 1 episode. n = 952 children | Febrile convulsion ICD code 780.3 children aged 29 to 730 days | MMR vaccine: Urabe mumps strain Jeryl Lynn mumps strain Rubella strain not specified Exposure risk period: (a1) 6 to 11 days (1 to 2 weeks after vaccination) (a2) 15 to 35 days (3 to 5 weeks after vaccination) Control period: (b) for each vaccine was defined as the time not included in a risk period The analyses were adjusted for age and were grouped in 6 equal intervals of about 2 months. | The study shows that there was an attributable risk of 1 in 2600 doses of a febrile convulsion 15 to 35 days after giving Urabe MMR vaccine. There was no excess of admissions in the same period when Jeryl Lynn vaccine was given. | Any strain (a1) 49 cases (a2) 85 cases ‐‐‐‐‐‐‐‐‐‐‐‐‐‐‐‐‐‐ Urabe strain (a1) 0 cases (a2) 57 cases ‐‐‐‐‐‐‐‐‐‐‐‐‐‐‐‐‐‐‐ Jeryl Lynn strain (a1) 0 cases (a2) 9 cases | rr (95% CI)(*) Any strain (a1) 3.04 (2.27 to 4.07) (a2) 1.51 (1.21 to 1.90) ‐‐‐‐‐‐‐‐‐‐‐‐‐‐‐‐‐‐‐‐‐‐‐‐‐‐ Urabe strain (a1) 3.77 (1.95 to 7.30) (a2) 1.66 (1.26 to 2.20) ‐‐‐‐‐‐‐‐‐‐‐‐‐‐‐‐‐‐‐‐‐‐‐‐‐‐ Jeryl Lynn strain (a1) 2.70 (1.81 to 4.01) (a2) 1.04 (0.56 to 1.93) (*) Poisson regression |
| Self‐controlled case series | Children aged 12 to 23 months with discharge diagnosis corresponding to the outcome of interest who received MMR n = 894 | Febrile convulsion convulsion or fit, not otherwise specified, who were admitted between 1 January 1998 and 30 June 2002 were identified and linked with computerised immunisation records to obtain dates of MMR vaccination. Episodes within a same individual were considered as separate when they occurred at least 10 days apart. Case review not performed. ‐‐‐‐‐‐‐‐‐‐‐‐‐‐‐‐‐‐‐‐‐‐‐‐‐‐‐‐‐‐‐‐‐‐‐‐‐‐‐‐‐‐‐‐‐‐ Febrile convulsion ICD‐10 codes R560 only | MMR vaccine: (1) MMRII (Sanofi Pasteur) Edmonston‐Enders measles strain, Jeryl Lynn mumps strain, between September 1992 and May 1998 (2) MMR Priorix (GlaxoSmithKline) Schwarz measles strain RIT4385 (Jeryl Lynn) from May 1998 (3) unknown manufacturer Exposure risk period: (a1) a pre‐vaccination (a2) 6 to 11 days (1 to 2 weeks after vaccination) (a3) 15 to 35 days (3 to 5 weeks after vaccination) . Control period | The attributable risk of hospital admission for convulsion following receipt of any MMR vaccine was estimated as 1 in 1150 doses for the 6‐ to 11‐day postvaccination period, based on an estimated relative incidence of 4.09. The excess risk of convulsion in this period was attributable to the measles component of MMR vaccine. The relative incidence of convulsion in the 6‐ to 11‐day period was higher for Priorix than for MMRII, although the difference was not significant. There was no statistically significant evidence that children given MCC vaccine at the same time as MMR vaccine have a somewhat higher risk of convulsion in the 6‐ to 11‐day postvaccination period (rr 7.74, 3.82 to 15.71) than children who receive MMR but not MCC vaccine at the same time (rr 3.81, 2.87 to 5.05). Conclusion: there is no evidence to suggest that the new MMR vaccine used in the UK since mid‐1998 and derived from the Jeryl Lynn‐containing MMR vaccine causes aseptic meningitis attributable to its mumps component. | Any MMR vaccine (a1) 13 cases (a2) 66 cases (a3) 65 cases ‐‐‐‐‐‐‐‐‐‐‐‐‐‐‐‐‐‐‐‐ MMRII vaccine Jeryl Lynn (a1) 6 cases (a2) 27 cases (a3) 34 cases ‐‐‐‐‐‐‐‐‐‐‐‐‐‐‐‐‐‐‐‐ MMR Priorix vaccine RIT4385 (a1) 3 cases (a2) 19 cases (a3) 16 cases ‐‐‐‐‐‐‐‐‐‐‐‐‐‐‐‐‐‐‐‐ Unknown manufacturer (a1) 4 cases (a2) 20 cases (a3) 15 cases ‐‐‐‐‐‐‐‐‐‐‐‐‐‐‐‐‐‐‐‐ Febrile convulsion (R560 only) (a1) not reported (a2) 52 cases (a3) 57 cases | rr (95% CI)(*) Any MMR vaccine (a1) 0.38 (0.22 to 0.64) (a2) 4.09 (3.14 to 5.33) (a3) 1.13 (0.87 to 1.48) ‐‐‐‐‐‐‐‐‐‐‐‐‐‐‐‐‐‐‐‐ MMRII vaccine Jeryl Lynn (a1) 0.39 (0.18 to 0.84) (a2) 3.64 (2.44 to 5.44) (a3) 1.28 (0.89 to 1.84) ‐‐‐‐‐‐‐‐‐‐‐‐‐‐‐‐‐‐‐‐ MMR Priorix vaccine RIT4385 (a1) 0.47 (0.15 to 1.40) (a2) 6.26 (3.85 to 10.18) (a3) 1.48 (0.88 to 2.50) ‐‐‐‐‐‐‐‐‐‐‐‐‐‐‐‐‐‐‐‐ Unknown manufacturer (a1) 0.32 (0.13 to 0.81) (a2) 3.53 (2.23 to 5.61) (a3) 0.75 (0.44 to 1.26) ‐‐‐‐‐‐‐‐‐‐‐‐‐‐‐‐‐‐‐‐‐‐ Febrile convulsion (R560 only) (a1) not reported (a2) 4.27 (3.17 to 5.76) (a3) 1.33 (1.00 to 1.77) (*) Poisson regression exposure risk period versus control period |
| Person‐time cohort | Children (n = 556,864) were eligible if they had received their first dose of measles‐containing vaccine at age 12 through 23 months from January 2003 through September 2015. Children were excluded if they had a history of seizure or conditions strongly related to seizure prior to 12 months of age. Children born before 37 weeks gestational age were classified as preterm (< 37 weeks) and children born 37 weeks gestational age as full term (≥ 37 weeks). Preterm children were further classified into those born early preterm (< 35 weeks) and late preterm(35 through 36 weeks) gestational age. n = 24,489 were excluded because of documented history of seizures before age 12 months. In analysis n = 532,375 | Seizure (febrile/afebrile) A seizure was defined as the first emergency department or inpatient hospital encounter with ICD‐9‐CM diagnostic code of 780.3 (convulsions) during the 42 days following vaccination. | MMR and MMRV vaccines Risk interval 7 to 10 days after vaccination Control interval 15 to 42 days after vaccination n = number of children (a) Overall (a1) < 37 weeks n = 45,343 (a2) < 35 weeks n = 16,596 (a3) 35 to 36 weeks n = 28,757 (a4) ≥ 37 weeks n = 487,032 (b) MMR (b1) < 37 weeks n = 37,262 (b2) ≥ 37 weeks n = 403,238 (c) MMRV (c1) < 37 weeks n = 8081 (c2) ≥ 37 weeks n = 83,794 Age at vaccination (d) 12 to 15 months (d1) < 37 weeks n = 41,391 (d2) ≥ 37 weeks n = 442,919 (e) 16 to 23 months (e1) < 37 weeks n = 3952 (e2) ≥ 37 weeks n = 4413 | Conclusion: the results support the current ACIP recommendations | Risk versus control interval (a) Overall (a1) 31/500 versus 56/3500 (b) MMR (b1) 22/407 versus 48/2824 (c) MMRV (c1) 9/90 versus 8/615 Age at vaccination (d) 12 to 15 months (d1) 27/450 versus 51/3188 (e) 16 to 23 months (e1) 4/43 versus 5/294 | rr (95% CI)(*) (a) Overall (a1) 3.9 (2.5 to 6.0) (b) MMR (b1) 3.2 (1.9 to 5.3) (c) MMRV (c1) 7.9 (3.0 to 20) Age at vaccination (d) 12 to 15 months (d1) 3.7 (2.3 to 5.9) (e) 16 to 23 months (e1) 5.6 (1.5 to 21) (*) Poisson regression risk interval versus control interval |
| db‐Macartney 2017 | Children aged 11 to 23 months. Analysis was further restricted to include only children who had (1) 1 dose of MMR vaccine followed by 1 dose of MMRV vaccine at least 27 days later (consistent with NIP recommendations), (2) 1 dose of MMR vaccine (as some had not yet received MMRV vaccine), or (3) no MMR or MMRV vaccine (unvaccinated children, who contribute to the age‐specific relative incidence). Children who received MMRV vaccine as their first MCV were excluded because this schedule was not consistent with NIP recommendations and occurred rarely. | Febrile seizures in all children younger than 5 years. Periodic review of all ICD‐10‐Australian Modification coded R56.0 was also conducted to capture additional cases. Clinical and demographic data were collected from the medical records and caregiver interviews, and all FS diagnoses were confirmed. The primary analysis included children who had both first (considered unique episodes), in separated by at least 7 days from 2 sensitivity analyses were conducted: finer intervals (1‐month age groups); (2) restriction of the analysis to first FS episodes. | MMRV Priorix‐Tetra MMR+V Risk period after vaccination (a) 5 to 12 days (b) 13 to 30 days Control period before vaccination excluding interval −13 to −1 days before | Authors' conclusions: "To our knowledge, this is the first study to provide evidence of the absence of an association between use of MMRV vaccine as the second dose of MCV in toddlers and an increased risk of FSs. Incorporation of MMRV vaccine has facilitated improvements in vaccine coverage that will potentially improve disease control." | (1) Primary analysis: children who had both first and subsequent episodes (2) Adjustment for age using 1‐month interval (3) Restriction of the first FS episode | rr (95% CI)(*) (1) MMR (a) 2.71 (1.71 to 4.29) (b) 0.89 (0.54 to 1.48) (1) MMRV (a) 1.08 (0.55 to 2.13) (b) 1.08 (0.67 to 1.74) (2) MMR (a) 2.57 (1.56 to 4.43) (b) 0.83 (0.49 to 1.40) (2) MMRV (a) 1.17 (0.57 to 2.40) (b) 1.10 (0.66 to 1.83) (3) MMR (a) 2.85 (1.78 to 4.56) (b) 0.82 (0.47 to 1.43) (3) MMRV (a) 1.06 (0.49 to 2.27) (b) 1.21 (0.73 to 2.01) (*) Poisson regression |
| db‐MacDonald 2014 | Children aged 12 to 23 months who had received either MMRV or n = 277,774 | Seizure events ascertained from 3 administrative databases: 1) the physician claims database; system, which includes emergency department visits; 3) the hospital discharge abstracts database. From the physician claims database (ICD‐9), codes 780.3* for convulsions and the ambulatory care and hospital discharge databases (ICD, 10th revision, Canadian version, codes R56.0* for febrile with other High risk (cohort) Children with a personal history of febrile seizure; seizure disorder; central nervous system injury, infection, or neoplasm; encephalopathy; or a progressive, condition (as identified from physician claims, emergency department visits, or hospital discharges) | MMRV vaccine (Priorix‐Tetra) administered to children in Alberta, relative to same‐day administration of separate MMR and varicella Risk period (after vaccination) (a) 0 to 42 days Control period (before vaccination) 42 days preceding vaccination | Conclusion: single vaccine decreases pain for children and distress for parents, thus addressing common barriers to vaccine uptake, and may improve vaccine coverage levels and decrease immunisation delivery costs. These potential benefits must be balanced Febrile seizures are typically self‐limiting and rarely have long‐term effects, but they can be extremely distressing for parents, may precipitate acute care visits, and may undermine confidence in immunisation programmes. It is a matter for debate versus combination vaccine is a policy decision or a choice for parents to make in consultation with their vaccination provider. If MMRV continues to be offered for advisable to counsel parents regarding antipyretic use if children experience a fever within the peak risk period. | Full cohort n = 277,774 MMRV n = 96,686 (a1) 0 to 41 days (b1) 7 to 10 days MMR+V n = 181,088 (a2) 0 to 41 days (b2) 7 to 10 days Low risk n = 266,768 MMRV n = 92,570 (b3) 7 to 10 days MMR+V n = 174,198 (b4) 7 to 10 days High risk n = 11,006 MMRV n = 4116 (b5) 7 to 10 days MMR+V n = 6890 (b5) 7 to 10 days | rr (95% CI)(*) MMRV (full‐cohort) (a1) 1.80 (1.43 to 2.27) (b1) 6.57 (4.77 to 9.05) MMR+V (full‐cohort) (a2) 1.48 (1.22 to 1.79) (b2) 3.30 (2.40 to 4.52) MMRV (low risk) (b3) 6.69 (4.90 to 9.13) MMR+V (low risk) (b4) 2.94 (2.13 to 4.07) MMRV (high risk) (b5) 4.68 (2.49 to 8.79) MMR+V (high risk) (b6) 3.61 (2.20 to 5.93) (*) Poisson regression |
ACIP: Advisory Committee on Immunization Practice
CI: confidence interval
CSF: cerebrospinal fluid
DTP: diphtheria, tetanus, pertussis vaccine
FS: febrile seizures
HHV: human herpesvirus
Hib: Haemophilus influenzae b vaccine
HMO: health maintenance organisation
ICD: International Classification of Diseases
ICD‐9‐CM: International Classification of Diseases, 9th Revision, Clinical Modification
incidence: cases/PT
MCV: measles‐containing vaccines
MenC: meningococcus C vaccine
MMR: measles, mumps, rubella vaccine
MMRV: measles, mumps, rubella, and varicella vaccine
MMR+V: measles, mumps, rubella, plus varicella vaccine
NIP: National Imminization Program
OR: odds ratio
PT: person‐time
rr: rate ratio (relative incidence; incidence rate ratio)
RR: risk ratio (relative risk)
| Study ID and design | Population | Outcome definition | Exposure | Authors' conclusion | Crude data | Estimate (95% CI) |
|---|---|---|---|---|---|---|
| Retrospective | Index cohort all children ages 12 to 60 months vaccinated with MMRV at KPSC from February 2006 to June 2007. Children were excluded if they had a history of measles, mumps, rubella, or varicella disease or history of these diseases. Comparison (matched) cohorts (1) children vaccinated with MMR+V concomitantly before the routine use of MMRV at KPSC (November 2003 to January 2006). Children were optimally matched without replacement to children vaccinated with MMRV, on the basis of age, sex, and vaccination calendar day and month, and had to fulfil the same enrolment criteria. self‐comparison period defined by the period from 60 to 30 days prior to vaccination with MMRV. (3) postvaccination self‐comparison period defined by the period from 60 to 90 days following vaccination. | Febrile convulsion Potential convulsions were identified as occurring on any visit with 333.2 (myoclonus), 780.39 (other convulsion), 780.3 (convulsion), 780.32 (complex febrile convulsion) outpatient, emergency | MMRV: ProQuad contains components of 2 Merck vaccines, MMR‐II (MMR) and VARIVAX (V), and was approved in the USA in September 2005. Before MMRV was available, MMR and V were usually given concomitantly as 2 separate injections. Risk interval (a) 0 to 4 days (b) 5 to 12 days (c) 13 to 30 days (d) 0 to 30 days | Conclusion: "These data suggest that the risk of febrile convulsion is increased in days 5–12 following vaccination with MMRV as compared to MMR+V given separately during the same visit, when post‐vaccination fever and rash are also increased in clinical trials. While there was no evidence of an increase in the overall month following vaccination, the elevated risk during this time period should be communicated and needs to be balanced with the potential benefit of a combined vaccine." | Cases versus cases MMRV versusMMR+V (a) 9 versus 7 matched n = 31,298 matched n = 31,298 | RR (95% CI) MMRV versusPre‐Vacc |
| Retrospective | Index cohort Children aged 12 to 23 months who were members of the 7 participating versusD sites and had received their first dose of MMRV (n = 83,107) Comparison cohorts (1) children vaccinated with January 2000 and October 2008 (n = 376,354) (2) children vaccinated with (2000 to 2008) | Seizureevent The first instance during the 42 days after MMRV vaccination with ICD‐9 codes 345* (epilepsy) or 780.3* visits were examined by using ICD‐9 code | MMRV (Merck & Co Inc, West Point, PA) Risk interval after vaccination (a) 7 to 10 days (b) 0 to 42 days (c) 0 to 30 days | Conclusion: who had received their first dose of measles‐containing vaccine, fever and seizure were elevated 7 Vaccination with MMRV results in 1 additional doses given instead of separate Providers who recommend MMRV should increases the risk of fever and seizure | Seizures cases from MMRV n = 83,107 (a) 77 cases (b) 189 cases (c) not reported MMR+V n = 376,354 (a) 174 (b) 598 (c) not reported MMR n = 145,302 (a) 42 (b) 151 (c) not reported | rr (95% CI)(*) MMRV versusMMR+V (a) 1.98 (1.43 to 2.73) (b) 1.42 (1.11 to 1.81) (c) 1.40 (1.06 to 1.85) (*) Poisson regression due to rarity of the event rr (rate ratio) is very close to RR RR (95% CI) MMRV versusMMR (a) 3.21 (2.2 to 4.67) |
| cb‐Klein 2012 linked to | Children who were participating versusD January 2000 and October 2008 | Seizureevent Postvaccination seizure event as the first | 1) MMRV (Merck & Co) West Point, PA) + varicella (Merck & Co) separately administered on the same day 3) MMR Risk interval after vaccination (a) 7 to 10 days (b) 0 to 42 days | Conclusions: This study provides reassurance that MMRV and MMR+V were not associated with an increased risk of febrile seizures among 4‐ to 6‐year‐olds. The authors can rule out with 95% confidence a risk greater than 1 febrile seizure per 15,500 MMRV doses and 1 per 18,000 MMR+V doses. | Cases/PT MMRV n = 86,750 | RR (95% CI) MMRV versusMMR+V |
| Retrospective linked to | n = 840,348 children 12 to 23 months of age who had received a measles‐containing vaccine from 2001 through 2011 | Fever events in the o utpatient setting was defined using ICD‐9 code 780.6*. Seizure events in the postimmunisation medically attended in the emergency department or hospital setting was defined using ICD‐9 code 780.3* (convulsion) or 345* (epilepsy). The authors do not distinguish between febrile and afebrile seizures. | 1) MMRV (Merck & Co) West Point, PA) + varicella (Merck & Co) separately administered on the same day 3) MMR Risk interval after vaccination (a) 7 to 10 days (b) 0 to 42 days | Conclusions: Measles‐containing vaccines are associated with a lower seizures when administered at 12 to 15 months of age. Findings of this study outcomes highlight the importance of timely immunisation of children measles‐containing vaccines. | 12 to 15 months (0 to 42 days) (7 to 10 days) (0 to 42 days) (7 to 10 days) (0 to 42 days) (7 to 10 days) (0 to 42 days) (7 to 10 days) | MMRV versusMMR+V rr (95% CI)(*) Fever 12 to 15 months 16 to 23 months (a) 1.4 (1.1 to 1.7) Seizures 12 to 15 months 16 to 23 months (a) 2.1 (1.3 to 3.3) (*)Poisson regression MMRV versusMMR+V RR (95% CI) (a) 1.9 (1.43 to 2.53) |
| cb‐Gavrielov‐Yusim 2014 cohort study | Index cohort All participants were aged 10 to 24 months. n = 8344 MMRV Comparison cohorts | Febrile convulsion using the diagnoses: “convulsions”, FC differential diagnoses diagnoses used conditions were “encephalitis”, from the study | MMRV Priorix‐Tetra MMR (Priorix) GSK (Varilrix). Risk intervals Postvaccination (a) 40 days (b) 5 to 12 days (c) 7 to 10 days | Conclusion: GSK’s MMRV vaccine. appears during the FC attributable to MMRV and is not detectable | N cases MMRV/ (a) 19/8344 versus 198/90,294 | OR (95% CI) unadjusted estimates adjusted estimate(**) (a) 1.00 (0.6 to 1.67) (**) 2 different types of multivariate (a) Cox regression HR (b) logistic‐regression OR (c) logistic‐regression OR Due to rarity of events, |
| cb‐Schink 2014 | All children born between 1 January 2004 and 31 December 2008 n = 226,267 received an immunisation with 1 of the index vaccines during the study period (2006 to 2008) Index cohort n = 82,656 MMRV Comparison cohorts n = 111,241 MMR n = 32,370 MMR+V | Febrile convulsions Diagnosis of FC, i.e. an ICD‐10‐GM code R56.0 in any of the hospital diagnoses. 2 outcome definitions, as follows. The primary outcome “FC narrow” was defined as hospitalisation where no alternative plausible cause of FC. This endpoint included: (i) all hospitalisation with FC as main discharge diagnosis; (ii) all hospitalisation with FC as main admission diagnosis and without a main discharge diagnosis of an infectious disease (except measles, mumps, rubella, or chickenpox) or a neurological condition; (iii) all hospitalisation with FC as secondary or ancillary diagnosis and a main discharge diagnosis coded as complication following immunisation (ICD‐10 code T88.0 infection following immunization or T88.1 other complications following immunization, not elsewhere classified). Due to exclusion of alternative causes of FC in this outcome definition, it was assumed that it would have higher specificity, but lower sensitivity. only hospitalisations for FC with a neurological condition coded as main discharge diagnosis were excluded (cb‐Jacobsen 2009). Consequently, “FC Jacobsen” included: (i) all hospitalisation with FC as main discharge diagnosis; (ii) all hospitalisation with FC as main admission diagnosis and without a main discharge diagnosis of a neurological condition; and (iii) all hospitalisation with FC as secondary or ancillary diagnosis and with a main discharge diagnosis coded as complication following immunisation. “FC narrow” cases are a subset of “FC Jacobsen” cases. | MMRV: Priorix‐Tetra (GSK) compared to MMR and V vaccines (MMR+V). Risk interval postvaccination (a) 0 to 4 days (b) 5 to 12 days (c) 13 to 30 days (d) 0 to 30 days . | Conclusion: This study suggests a similar immunisation coverage. | FC narrow MMRV versusMMR matched n = 74,734 case versus cases (a) 4 versus 5 (b) 14 versus 3 (c) 4 versus 9 (d) 22 versus 17 FC narrow MMRV versusMMR+V matched n = 32,180 case versus cases (a) 2 versus 0 (b) 5 versus 1 (c) 4 versus 9 (d) 22 versus 17 FC narrow MMRV versusMMR/MMR+V matched n = 82,561 case versus cases (a) 4 versus 4 (b) 18 versus 4 (c) 4 versus 8 (d) 26 versus 16 FC Jacobsen MMRV versusMMR matched n = 74,734 case versus cases (a) 7 versus 13 (b) 45 versus 19 (c) 35 versus 31 (d) 87 versus 63 FC Jacobsen MMRV versusMMR+V matched n = 32,180 case versus cases (a) 5 versus 4 (b) 21 versus 14 (c) 18 versus 12 (d) 44 versus 30 FC Jacobsen MMRV versusMMR/MMR+V matched n = 82,561 case versus cases (a) 8 versus 15 (b) 51 versus 21 (c) 40 versus 31 (d) 99 versus 67 | OR (95% CI) FC narrow FC narrow FC narrow FC Jacobsen FC Jacobsen FC Jacobsen |
| cb‐Klein 2017 | n = 946,806 children < 36 months of age who had received a first dose of any measles‐containing vaccine from 2000 to 2012 | Fever visit ICD‐9 code 780.6. Fever due to an MCV was defined as any clinic or emergency department a first dose of any MCV This study analysed all fevers during postvaccination days 7 to 10 as if | 1) MMRV (Merck & Co) West Point, PA) + varicella (Merck & Co) separately administered on the same day 3) MMR Risk interval after vaccination (a) 7 to 10 days | Conclusion: This study identified risk factors associated with developing fever 7 to 10 days after a first dose of measles‐containing vaccines. The study confirmed previous findings that fever was more often associated with receipt of MMRV as compared with MMR vaccine and with older age at time of vaccination during the second year of life, and further found that prior fever and seizure events were associated with fever after measles vaccine and that being fever‐prone in general predicted fever after measles‐containing vaccine. Even after adjusting for general individual and familial susceptibility to fever, fever due to measles vaccine specifically clustered in families. This study suggests an important link between population health (surveillance of a large population for vaccine adverse events) and personalised medicine (possible genetic basis for susceptibility to fever after MCV). Future work is needed to further define this possible relationship of genetics and vaccine‐associated fever. | MMRV versus MMR (a) MCV‐associated fever (b) MCV‐associated fever (older sibling with MCV‐associated fever) | OR (95% CI)(*) (a) 1.3 (1.2 to 1.5) (b) 1.5 (1.2 to 1.8) (*)logistic regression |
CI: confidence interval
CNS: central nervous system
FC: febrile convulsion
HR:hazards ratio
ICD: International Classification of Diseases
ICD‐10‐GM: International Classification of Diseases. Tenth Revision, German Modification
incidence: cases/PT
MCV: measles‐containing vaccine
MMR: measles, mumps, rubella vaccine
MMRV: measles, mumps, rubella, and varicella vaccine
MMR+V: measles, mumps, rubella, and varicella vaccine
OR: odds ratio
PT: person‐time
rr: rate ratio (relative incidence, incidence rate ratio)
RR: risk ratio (relative risk)
| Study ID and design | Population | Outcome definition | Exposure | Findings | Crude data | Estimate (95% CI) |
|---|---|---|---|---|---|---|
| Retrospective cohort | Danish children born between January 1991 and December 1998 (n = 537,303) | (a) Autistic disorders ICD‐10 codes (b) Other autistic spectrum disorders and DSM‐IV codes 299.1‐ through 299.80. From medical records | MMR vaccine: Moraten (measles), Vaccination data reported in the National Board of Health. Vaccinated n = 440,655 Unvaccinated n = 96,648 | This study provides 3 strong arguments against a causal relation between MMR vaccination and autism.
Furthermore, the results were derived from a nationwide cohort study with nearly complete follow‐up data. | (a) Autistic disorders cases unvaccinated n = 53 PT unvaccinated PT(years) = 482,360 versus cases vaccinated n = 263 PT vaccinated PT(years) = 1,647,504 (b) Other autistic spectrum disorters cases unvaccinated n = 77 PT unvaccinated PT(years) = 482,360 versus cases vaccinated n = 345 PT vaccinated PT(years) = 1,647,504 | rr (95% CI)(*) (a) 0.92 (0.68 to 1.24) (b) 0.83 (0.65 to 1.07) (*) adjusted rr. Log‐linear Poisson regression |
| Retrospective cohort study | n = 657,461 children born in Denmark from 1999 through 31 December 2010, with follow‐up from 1 year of age and through 31 August 2013. | Autism spectrum disorders ICD‐10: F84.1 atypical autism, developmental disorder), developmental disorder). Autism risk score: In a preliminary analysis based on autism risk factors (maternal age, paternal age, smoking during pregnancy, method of delivery, preterm birth, 5‐minute Apgar score, low birthweight, and head circumference) a Risk Score was estimated for each child in the cohort. (b1) very low risk (b2) low risk (b3) moderate risk (b4) high risk Siblings status (at age 1 years): (c1) no siblings with autism (c2) siblings with autism (c3) no siblings | MMR vaccine Vaccinated n = 625,842 Unvaccinated n = 31,619 | The study found: no support for the hypothesis of increased risk for autism after MMR vaccination in a nationwide unselected population of Danish children; no support for the hypothesis of MMR vaccination triggering autism in susceptible subgroups characterised by environmental and familial risk factors; no support for a clustering of autism cases in specific time periods after MMR vaccination. | Cases vaccinated/vaccinated versus Cases unvaccinated/ unvaccinated All children (a) 5992/625,842 versus 525/31,619 Autism risk score (*) (b1) 1296 versus 91 cases (b2) 1637 versus 133 cases (b3) 2106 versus 206 cases (b4) 953 versus 95 cases Siblings status (*) (c1) 2297 versus 227 (c2) 32 versus 5 (c3) 3594 versus 283 (*) denominator not reported | HR (95% CI)(*) All children (a) 0.93 (0.85 to 1.02) Autism risk score (b1) 0.93 (0.74 to 1.16 (b2) 0.86 (0.71 to 1.04) (b3) 0.91 (0.78 to 1.06) (b4) 1.06 (0.85 to 1.32) Siblings status (c1) 0.98 (0.84 to 1.13) (c2) 2.96 (0.58 to 12.43) (c3) 0.89 (0.78 to 1.01) (*) adjusted by birth year, sex, other vaccines received, siblings history of autism, and autism risk score). Cox regression |
| cb‐Jain 2015 | Children continuously enrolled in the health plan from birth to at least 5 years of age during n = 95,727 children in the cohort, (a) n = 93,798 older siblings without ASD (b) n = 1929 older sibling with ASD. | Autism spectrum disorders Status in index children and older siblings was determined using a claims‐based algorithm that required 2 or more claims on separate dates of service with an ICD‐9‐CM diagnosis code in any position for autistic disorder, other specified pervasive developmental disorder including: Asperger syndrome, or unspecified PDD (299.0x, 299.8x, and 299.9x). Both index child and older sibling ASD status were determined using their entire enrolment time that fell within the study period. Index children had to have at least 1 older sibling with 2 claims with ASD diagnoses or all older siblings with no ASD diagnoses. Children with an older sibling with only 1 claim with an ASD diagnosis were excluded. Index children with only 1 claim with an ASD diagnosis were also excluded. | MMR vaccine receipt was defined as having a Current Procedural Terminology (CPT) or ICD‐9‐CM procedure code indicating receipt of each component (measles, mumps, and rubella) after 1 year of age. | The study found: MMR vaccine was not associated with increased risk of ASD, regardless of whether older siblings had ASD. These findings indicate no harmful association between MMR vaccine receipt and ASD even amongst children already at higher risk for ASD. | Cases vaccinated/vaccinated versus Cases unvaccinated/ unvaccinated age 2 years ‐ 1 dose (a) 53/77,822 versus 13/15,249 (b) 7/1394 versus 6/520 age 3 years ‐ 1 dose (a) 239/79,666 versus 45/12,853 (b) 38/1458 versus 17/438 age 4 years ‐ 1 dose (a) 395/79,691 versus 65/11,957 (b) 64/1491 versus 25/387 age 5 years ‐ 1 dose (a) 339/40,495 versus 56/7735 (b) 51/864 versus 23/269 age 5 years ‐ 2 doses (a) 244/45,568 versus 56/7735 (b) 30/796 versus 23/269 | HR (95% CI)(*) age 2 years ‐ 1 dose (a) 0.91 (0.68 to 1.20) (b) 0.76 (0.48 to 1.22) age 3 years ‐ 1 dose (a) 0.97 (0.77 to 1.21) (b) 0.81 (0.53 to 1.25) age 4 years ‐ 1 dose (a) 1.03 (0.81 to 1.31) (b) 0.86 (0.56 to 1.34) age 5 years ‐ 1 dose (a) 1.10 (0.79 to 1.53) (b) 0.92 (0.56 to 1.50) age 5 years ‐ 2 doses (a) 1.09 (0.76 to 1.54) (b) 0.56 (0.30 to 1.04) (*) Hazard rate ratio from Cox proportional hazards model adjusting for birth year, sex, region, race/ethnicity, maternal or paternal highest education level, household income, mother’s age at birth of index infant, father’s age at birth of index infant, continuous enrolment with mental health carve‐out benefit, Childhood Chronic Conditions score, seizure, allergies, and preterm birth. Cox regression |
| Retrospective cohort | Children born between 1976 and 1999 with clinical diagnosis of ASD analysed n = 858 (whole sample n = 904; n = 46 cases were excluded due to insufficient information on ASD regression) | Regression in autism spectrum disorders ASD regression defined as “a documented deterioration in any aspect of development or reported loss of skills, however transient” Note: over time 2 different diagnostic processes have been adopted at YPCD: until February 2000, the diagnostic process consisted of the assessment of ASD initially conducted by a child psychiatrist using the DSM‐IV (American Psychiatric Association, 1994), after which a clinical psychologist conducted an intelligence test. After admission a psychiatrist followed the patients once or twice a month. All doctors had been trained in using a common concept of diagnosis. From February 2000 onwards, a child psychiatrist with a clinical psychologist conducted the full assessment in 1 day. Diagnosis of ASD was made by 3 experienced child psychiatrists based on clinical observations, intellectual and developmental tests, and interviews with parents and patients. | MMR vaccine AIK‐C (measles), Urabe AM9 (mumps) To‐336 (rubella) strains. Data concerning MMR vaccination were moreover obtained from records of the Maternal and Child Health Handbook and were referred to the MMR generation group only. Participants were classified according to the chance of having received MMR vaccine (MMR was administered in Japan from April 1989 to April 1993 in children 12 to 36 months of age):
| The study found: within the MMR era, the rate of regression in those who received MMR was not higher than those who did not. Moreover, there was no indication that the rate of regression in ASD was higher during the era when MMR was used, compared to the ‘‘before’’ period and ‘‘after’’ period, and the ‘‘before" and "after’’ periods combined. | N cases vaccinated/ MMR‐generation (a) 15/54 versus 45/132 All generations (*) (b) 15/54 versus 272/715 (*) 98 cases out of 275 (MMR‐generation) were excluded due to unclear vaccination status, analysed n = 186. ‐‐‐‐‐‐‐‐‐‐‐‐‐‐‐‐‐‐‐‐‐‐‐‐‐‐‐ MMR‐era versusbefore (c) 98/275 versus 34/100 ‐‐‐‐‐‐‐‐‐‐‐‐‐‐‐‐‐‐‐‐‐‐‐‐‐‐‐‐‐‐‐ MMR‐era versusafter (d) 98/275 versus 193/483 ‐‐‐‐‐‐‐‐‐‐‐‐‐‐‐‐‐‐‐‐‐‐‐‐‐ MMR‐era versus(before + after) (e) 98/275 versus 227/583 | OR (95% CI) (a) 0.744 (0.349 to 1.571) (b) 0.626 (0.323 to 1.200) (c) 1.075 (0.646 to 1.791) (d) 0.832 (0.605 to 1.144) (e) 0.868 (0.638 to 1.182) |
| Case‐control | Children with a first diagnosis of a PDD during the study period registered with a GPRD practice. Cases: n = 1294 Controls: n = 4469 | Pervasive developmental disorder “Those with autistic disorders and similar presentations were classified as having 'autism' and those with other description (such as Asperger’s syndrome) were classified as having 'other PDD'. Patients who had more than one PDD diagnostic code recorded at different times (for example, autism and then Asperger’s syndrome) were classified as having the most specific diagnosis (in this example Asperger’s syndrome)” From diagnosis contained in UK General Practice Research Database (GPRD electronic records). | MMR vaccine: No single clinical code was immediately implemented for MMR, then MMR was identified by codes of measles, mumps, and rubella administered on the same day. Information on MMR exposure:
| The study found: MMR vaccination was not associated with an increased risk of subsequently being diagnosed with a PDD. | MMR vaccination Before index date (a) at any age (b1) before third birthday (b2) after third birthday (c1) before age 18 months (c2) after age 18 months (d) autism only (e) other PDD only | OR (95% CI)(*) (a) 0.86 (0.68 to 1.09) (b1) 0.90 (0.70 to 1.15) (b2) 0.77 (0.55 to 1.08) (c1) 0.90 (0.70 to 1.15) (c2) 0.80 (0.61 to 1.05) (d) 0.88 (0.67 to 1.15) (e) 0.75 (0.46 to 1.23) (*)adjusted conditional logistic regression |
| Case‐control | Children with autism aged 3 to 10 years in 1996. All sample Cases: n = 624 Controls: n = 1824 Birth certificate subsample Cases: n = 355 Controls: n = 1020 | Autism cases were identified through screening and abstraction of source files at schools, hospitals, clinics, and specialty providers. Clinical psychologists with expertise in the diagnosis of autism reviewed the abstracted records according to a standardised coding scheme to determine the presence of behavioural characteristics consistent with the DSM‐IV criteria for ASDs. | MMR vaccine type: not stated MMR vaccination was abstracted from “standardized state immunization forms”. 3 specific years cutoff: (a) 18 months of age, as an indicator of “on‐time” vaccination according to the recommended vaccination schedule for MMR vaccine; (b) 24 months of age, the age by which atypical development has become apparent in most children with autism; (c) 36 months of age, the age by which autistic characteristics must have developed to meet DSM‐IV criteria for autism. | The study found: no significant associations for vaccinated before 18 months or before 24 months of age, including children with some indication of regression or plateau in development, the group of most concern. Vaccination before 36 months of age was more common amongst case children than control children, although only a small proportion of children in either group received their first MMR vaccination after 36 months of age. Rather than representing causal relationships, associations with the 36‐month cutoff would be more likely than associations with earlier age cutoffs to have been influenced by factors related to the evaluation, management, and treatment of the child, e.g. case children might have been more likely than control children to have been vaccinated as a requirement for enrolment in early intervention or preschool special education programs. This possibility is supported by the finding that the difference between case and control children in the proportion vaccinated before 36 months of age was strongest in the 3‐ to 5‐year‐old age group. A majority of case children who were vaccinated after 36 months of age, however, had indications of developmental problems before 36 months of age. | All cases (a1) < 18 months (b1) < 24 months (c1) < 36 months Birth certificate (a2) < 18 months (b2) < 24 months (c2) < 36 months | OR (95% CI) All cases(*) (a1) 1.12 (0.91 to 1.38) (b1) 1.21 (0.93 to 1.57) (c1) 1.49 (1.04 to 2.14) Birth certificate (**) (a2) 0.93 (0.66 to 1.30) (b2) 0.99 (0.63 to 1.55) (c2) 1.23 (0.64 to 2.36) (*)partially adjusted estimates: conditional logistic regression model stratified by the matching variables (age, gender, school). (**)adjusted estimates: conditional logistic regression model stratified by the matching variables (age, gender, school) and adjusted for birthweight, multiple gestation, maternal age, and maternal education. |
| Case‐control | Children aged 2 to 15 years diagnosed with childhood or atypical autism. Cases: n = 96 Controls: n = 192 children matched for birth year, gender, and practice | Childhood or atypical autism classified according to ICD‐10 criteria as F84.0 or F84.1, respectively. Every diagnosis of autism was made by child psychiatrist. Dates of these diagnoses were recorded in general practitioner files. Cases with uncertain diagnosis of autism, secondary to disease state or trauma, were excluded. Parents were interviewed. Questions for all children included information about prenatal and postnatal development, mental and physical development, chronic diseases, malformations and injuries, history of bowel disturbances, birth order, family size, and parents’ socioeconomic status. Parents of children with autism were additionally asked about the date of onset of symptom, the period when parents first suspected their child’s symptoms might be related to autism, and their knowledge and beliefs regarding the cause of autism. | Vaccine type: MMR: not described Information about vaccination history was extracted from physician records. | The study found: MMR vaccination was not significantly associated with an increased risk of autism in children. In a separate analysis, a similar result was achieved for the single‐antigen measles vaccine. An unexpected finding was that odds ratios associated with MMR were lower than with the single measles vaccine. The decreased risk of autism amongst vaccinated children may be due to some other confounding factors in their health status. For example, healthcare workers or parents may have noticed signs of developmental delay or disease before the actual autism diagnosis and for this reason have avoided vaccination. | Any vaccine versusunvaccinated (a1) vaccinated before symptom onset (a2) vaccinated before diagnosis MMR vaccine versusunvaccinated (b1) vaccinated before symptom onset (b2) vaccinated before diagnosis MV vaccine versusunvaccinated (c1) vaccinated before symptom onset (c2) vaccinated before diagnosis | OR (95% CI)(*) any vaccine versusunvaccinated (a1) 0.65 (0.26 to 1.63) (a2) 0.28 (0.01 to 0.76) MMR versusunvaccinated (b1) 0.42 (0.15 to 1.16) (b2) 0.17 (0.06 to 0.52) MV versusunvaccinated (c1) 0.86 (0.33 to 2.23) (c2) 0.36 (0.13 to 1.00) (*)Adjusted for mother’s age (15 to 35, 36 to 44 years), medication during pregnancy, gestation time (36 to 37, 38 to 43 weeks), perinatal injury, 5‐minute Apgar scale score (3 to 8, 9 to 10). |
| Case‐control | The study analysed case data from patients of YPDC; the cases consisted of Children aged 6 to 36 months cases: n = 189 control: n = 224 | Diagnosis of ASD: based on the classifications of pervasive developmental disorders in the DSM‐IV and standardised criteria using the Diagnostic Interview for Social and Communication Disorder (DISCO). | MMR vaccine: not described | The study found: there was no convincing evidence that MMR vaccination and increasing the number of vaccine injections were associated with an increased risk of ASD in a genetically homogeneous population. Consequently, these findings indicate that there is no basis for avoiding vaccination out of concern for ASD. | Cases vaccinated/N cases versus Control vaccinated/N controls 47/189 versus 54/224 | OR (95% CI)(*) 1.04 (0.65 to 1.68) (*) matched odds ratio |
| Case‐only ecological method | Children aged 5 to 11 years (birth cohorts 1987 to 1998 attending a boarding school in Montreal (n = 27,749, out of whom 180 with PDD) | Pervasive developmental disorders Children with a diagnosis of PDD were identified by school personnel and given a study code to preserve the anonymity of the data. Children’s diagnoses were not verified by direct assessments, but it is worth noting that a majority of these children (N = 155; 86.1%) were diagnosed at the Montreal Children’s Hospital. School | MMR (no description) Identified by vaccination records | MMR and autism: During the 11‐year interval, rates of PDD significantly increased, whereas MMR vaccine uptake showed a slight opposite trend. The opposite directions of both trends make it even less likely that a true association was not detected in the study data. The study shows a lack of association between MMR uptake and PDD rates applied to the period (1987 to 1995) where a single MMR dose was administered at 12 months of age. Rates of PDD were rapidly increasing well before the introduction of the 2‐dose schedule and, during that first phase, the increase of PDD rate bore no relationship with MMR vaccine uptake. The authors tested whether the introduction of a second MMR dose after 1995 accelerated the increase in PDD rates in the following 3 years. No statistically significant difference could be found between the rate of increase in PDD prevalence between the 1‐dosing and the 2‐dosing periods. | No association. Significant increase in rates of PDDs from 1987 to 1998 (OR 1.10, 95% CI 1.05 to 1.16; P < 0.001) despite decrease in MMR uptake through birth cohorts from 1988 to 1998 (Chi² for trend = 80.7; df = 1; P < 0.001). | No data available for meta‐analysis |
| Case‐only ecological method | Children born from 1988 to 1996 (n = 31,426) | Autism spectrum disorders ASD cases defined as all cases of PDD according to ICD guidelines, but an early detection clinical system called DISCOVERY that included items drawn up by the Public Health Bureau of Yokohama called YACHT (Young Autism and other developmental disorders CHeckup Tool) was active in Kohoku Ward. Definite regression Probable regression | MMR vaccine: no description Exposed period: 1988 to 1992 MMR vaccination rates declined from 69.8% in the 1988 birth cohort to 42.9%, 33.6%, 24.0%, and a mere 1.8% in birth cohorts 1989 to 1992. Reference period: 1993 to 1996 In birth cohorts 1993 to 1996, when not a single child was immunised. | MMR vaccination is unlikely to be a main cause of ASD, that it cannot explain the rise over time in the incidence of ASD, and that withdrawal of MMR in countries where it is still being used cannot be expected to lead to a reduction in the incidence of ASD. | Risk period (cases/population) versus Reference period (cases/population) (a) Childhood autism 58/17,704 versus 100/13,722 (b) Other ASD 50/17,704 versus 70/13,722 (c) Definite regression 29/17,704 versus 31/13,722 (d) Definite + probable regression 35/17,704 versus 37/13,722 (e) All ASD 108/17,704 versus 170/13,722 | rr (95% CI) (a) 0.45 (0.33 to 0.62) |
| Person‐time cohort | Children 1 to 7 years old (n = 535,544) | Autism Autistic disorder: "Severe qualitative impairment in reciprocal social interaction, in verbal and non verbal communication and in imaginative activity and markedly restricted repertoire of activities and interests" (Steffenburg 1989) Data regarding first hospital visits during the study period identified by ICD‐8/9 codes respectively effective from 1969 to 1986 and from1987 through 1995 (299 ‐ Psychoses ex origine infantia; 2990 ‐ Autismus infantilis; 2998 ‐ Developmental disorder; 2999 ‐ Developmental disorder). | MMR II ‐ vaccine (Merck & Co, West Point, PA) Measles: Enders‐Edmonston Mumps: Jeryl Lynn Rubella: Wistar RA 27/3 Vaccination data were assessed through vaccination register. For autism the risk period is open‐ended. | The study found: no distinguishable clustering was detected in the intervals from vaccination to the hospitalisation. The number of hospital admissions remained relatively steady during the first 3 years and then gradually decreased, as was expected because of the increasing age of the vaccinees (Fig 3). | ASD cases n = 309 | No data available for meta‐analysis |
| Self‐controlled case series | Children born since 1979 from 8 health districts (North Thames, UK) | Autistic disorder “By use of criteria of the International Classification of Diseases, tenth revision (ICD10), the diagnosis of autism was checked against information in the available records on the child’s present condition and his or her condition between the ages of 18 months and 3 years.” ICD‐10 confirmed and non‐confirmed cases from computerised special needs/disability registers at child development centres and from records in special schools. Information on children with such disorders who were younger than 16 years of age was extracted from clinical records by 1 of 3 experienced paediatric registrars. | MMR vaccination identified by Regional Interactive Child Health Computing System (RICHS) Risk period: (a) Autism diagnosis (a1) < 12 months (a2) < 24 months after vaccination (b) Parental concern (b1) < 6 months (b2) < 12 months after vaccination (c) Regression (c1) < 2 months (c3) < 6 months Where vaccination and the event of interest | The case‐series analyses showed no evidence of temporal clustering between MMR or other measles‐containing vaccines and diagnosis of autism. Regression occurred in nearly a third of the cases of core autism; regression was not clustered in the months after vaccination. For age at first parental concern, no significant temporal clustering was seen for cases of core autism or atypical autism, with the exception of a single interval within 6 months of MMR vaccine associated with a peak in reported age at first parental concern at 18 months. This peak is likely to reflect the difficulty experienced by parents in defining the precise age at onset of symptoms in their child, particularly those with atypical autism, and consequent approximation with preference for 18 months. Our results do not support the hypothesis that MMR vaccination is causally related to autism, either its initiation or to the onset of regression. | MMR vaccine (a) Autism diagnosis (n = 357) (b) Parental concern (n = 326) (c) Regression (n = 105) | rr (95% CI)(*) (a1) 0.94 (0.60 to 1.47) (a2) 1.09 (0.79 to 1.52) (b1) 1.48 (1.04 to 2.12) (b2) 0.90 (0.63 to 1.29) (c1) 0.92 (0.38 to 2.21) (c2) 1.00 (0.52 to 1.95) (c3) 0.85 (0.45 to 1.60) (*) relative incidence, Poisson regression |
| Case‐only ecological method | Pre‐MMR: Maudsley Family Study (MFS) sample: n = 98 probands who had an ICD‐10 diagnosis of autism PDD. Children born between 1954 and 1979. Post‐MMR: Maudsley Hospital Clinical (MHC) sample: n = 68 children born between 1987 and 1996 and had a confirmed diagnosis of PDD. Post‐MMR: Stafford sample: n = 96 children born between 1992 and 1995 selected as part of an epidemiologic survey of PDD conducted in Staffordshire (Midlands, UK) total population n = 15,500. | Autistic enterocolitis (a) Age (in months) at first parental concern: in the 3 samples, item 2 of the ADI (earlier version of the ADI‐R) was used to assess the first onset of autistic symptoms, or the age of the child at which parents first became concerned about their child’s development. The precise wording of the question is, “How old was your child when you first wondered if there might be something not quite right with his/her development?” (b) Regression: the assessment of regression in the ADI‐R is covered with items 37 to 41 (for language) and items 95 to 103 (for other domains). The regression is assessed for language skills as follows: “Were you ever concerned that your child might have lost language skills during the first years of his/her life? Was there ever a time when he/she stopped speaking for some months after having learned to talk?” Assessment of bowel disorders and symptoms: these data were available only from the epidemiologic sample (Stafford sample). All children were reviewed regularly and are still followed up by the paediatrician, who has records of any additional hospital admissions/medical investigations for bowel disorders in these children. The occurrence of gastrointestinal symptoms was assessed by 2 sources: the parents and the paediatrician. ADI‐R: Autism Diagnostic Interview ‐ Revised was administered with the parents by trained staff. Interrater reliability on the ADI‐R interviews was assessed. | MMR vaccine type not described MFS sample (pre‐MMR): unvaccinated MHC sample (post‐MMR): likely vaccinated The MMR immunisation programme was introduced in 1988 in the UK (with first MMR given between 12 and 15 months of age) with coverage rates above 90%. MMR coverage rates in 2‐year‐olds fell from 92% in 1995 to 88% in 2000. | No evidence was found to support a distinct syndrome of MMR‐induced autism or of “autistic enterocolitis”. No changes in the mean age of parental recognition of first autistic symptoms were found when 2 samples of children, 1 clinical and 1 epidemiologic, all exposed to MMR immunisation, were compared with a pre‐MMR sample. No increase in the rate of regressive autism in recent years. Rates of regression in the development of children with autism were found to be similar in a pre‐ and post‐MMR sample. | ‐‐‐‐MFS sample (n = 98) (a) mean = 19.5 (SD = 13.6) (b) n = 18 ‐‐‐‐MHC sample (n = 68) (a) mean = 19.2 (SD = 8.8) (b) n = 0 ‐‐‐‐Stafford sample (n = 96) (a) mean = 19.3 (SD = 8.7) (b) n = 15 No statistically relevant differences across the 2 samples for the rate of probable or definite regression. | No data available for meta‐analysis |
ADI‐R: Autism Diagnostic Interview ‐ Revised
ASD: autism spectrum disorders
CI: confidence interval
DSM: Diagnostic and Statistical Manual of Mental Disorders
GPRD: General Practice Research Database
HMO: health maintenance organisation
HR: hazards ratio
ICD: International Classification of Diseases
ICD‐9‐CM: International Classification of Diseases, Ninth Revision, Clinical Modification
incidence: cases/PT
KPSC: Kaiser PermanteSsouth California
MMR: measles, mumps, rubella vaccine
MMRV: measles, mumps, rubella, and varicella vaccine
OR: odds ratio
PDD: pervasive developmental disorders
PT: person‐time
rr: rate ratio (relative incidence, incidence rate ratio)
RR: risk ratio (relative risk)
SD: standard deviation
YPDC: Yokohama Psycho‐Developmental Clinic
Definitions:
Childhood autism: children with symptoms before the age of 3 years that meet the necessary criteria under each section of the diagnostic triad for autism: communication difficulties, problems with social interaction, and behaviour problems such as stereotyped repetitions.
Atypical autism cases: with many of the features of childhood autism but not quite meeting the required criteria for that diagnosis, or with atypical features such as onset of symptoms after age 3 years (also known as pervasive developmental disorder not otherwise specified).
Developmental regression: a documented deterioration in any aspect of development or reported loss of skills, however transient (International Classification of Diseases, 10th revision (ICD‐10) and Diagnostic and Statistical Manual of Mental Disorders, 4th edition (DSM‐IV)).
| Study ID and design | Population | Outcome definition | Exposure | Findings | Crude data | Estimate (95% CI) |
|---|---|---|---|---|---|---|
| Case‐control | Vaccine Safety Datalink (versusD) cases were patients born between 1958 and 1989. Case IBD n = 142 (n = 75 Crohn's disease and n = 67 ulcerative colitis) Controls n = 432 matched for sex, HMO, and birth year | Inflammatory bowel diseases Review of medical records contained in the Vaccine Safety Datalink database of 4 HMOs and identified by using ICD‐9 codes specific for Crohn's disease, ulcerative colitis and idiopathic proctocolitis (555 and 556). Outpatient, emergency department, urgent care clinic visits were available for 3 out of the 4 HMOs and were also taken into account. After abstraction of medical records, IBD cases were classified as: Definite IBD: as individuals diagnosed with IBD by a gastroenterologist at 1 of the HMOs who had at least 1 sign or symptom compatible with IBD (such as bloody stool and/or bloody diarrhoea or severe and/or recurrent abdominal pain) recorded and a diagnostic test result (such as biopsy with pathology specimen, colonoscopy, or sigmoidoscopy) consistent with IBD. Probable IBD: the diagnosis of IBD was made by either an HMO non‐gastroenterologist physician or a gastroenterologist outside the HMO; there was at least 1 sign or symptom compatible with IBD; and there was a diagnostic test result consistent with IBD. IBD cases (suspected or questionable) that did not correspond to these criteria were excluded from analysis. IBD (definite and probable) were further classified as Crohn's disease and ulcerative colitis cases. | MMR vaccine MCV vaccine not specified MMR administered at any time before index date | In this population‐based study of IBD at 4 large HMOs, the authors found no evidence that vaccination with MMR or other MCV, or that the age of vaccination early in life, was associated with an increased risk for development of IBD. In addition, the authors did not find evidence that MMR or other MCV acutely triggers the onset of either ulcerative colitis/proctitis or Crohn's disease. | N cases vaccinated/ Crohn's disease (n = 75) (a) all age and vaccine type (a1) MMR < 12 months (a2) MMR 12 to 18 months (a3) MMR > 18 months Ulcerative colitis (n = 67) (b) all age and vaccine type (b1) MMR < 12 months (b2) MMR 12 to 18 months (b3) MMR > 18 months All IBD (n = 142) (c) all age and vaccine type 132/142 versus 409/432 (c1) MMR < 12 months 6/16 versus 25/48 (c2) MMR 12 to 18 months 84/94 versus 223/246 (c3) MMR > 18 months 4/14 versus 52/75 | OR (95% CI)(*) Crohn's disease (a) 0.40 (0.08 to 2.00) (a1) 0.38 (0.05 to 2.86) (a2) 0.54 (0.10 to 3.07) (a3) 0.18 (0.03 to 1.21) Ulcerative colitis (b) 0.80 (0.18 to 3.56) (b1) 0.96 (0.12 to 7.57) (b2) 1.14 (0.23 to 5.59) (b3) 0 (0 to 0) All IBD (c) 0.59 (0.21 to 1.69) (c1) 0.61 (0.15 to 2.45) (c2) 0.86 (0.28 to 2.59) (c3) 0.16 (0.04 to 0.68) (*)Conditional logistic regression matched on HMO, sex, birth year adjusted for race. |
| Case‐control | Cases: patients from the registry of inflammatory bowel diseases January 1988 to December 1997 aged less than 17 years old. Cases n = 222 Cases n = 60 ulcerative colitis Controls were randomly selected from telephone | Crohn's disease; ulcerative colitis Interviewer practitioners collected data on all patients Only patients who had been residents in the defined study areas at the time of diagnosis of their disease were included. A final diagnosis of CD or UC was made by 2 expert gastroenterologists and recorded as definite, probable, or possible, following criteria previously published. For the purpose of this study, only patients with definite or probable CD or UC were considered. | MMR vaccine not described | MMR vaccination was negatively associated | (a) Crohn's disease (b) ulcerative colitis | OR (95% CI)(*) (a) 0.5 (0.35 to 0.9) (b) no data available |
| Case‐control | Cases n = 117 with IBD diagnosis, born after 1989 and diagnosed before 31 March 2008. Controls n = 834 matched to cases on the basis of age, sex, and region of residence at time of diagnosis. All with an average age of 11 years. | Inflammatory bowel diseases The administrative data case definition used to identify patients with IBD was validated with the establishment of the population‐based University of Manitoba IBD Epidemiology Database (UMIBDED) in 1995; the UMIBDED contains extracted administrative data of IBD cases and their controls (at a 1:10 ratio) for those individuals with health coverage between 1 April 1984 and 31 March 2008. Residents of Manitoba who resided in the province for at least 2 years were identified as having IBD if they had at least 5 physician visits or hospitalisations with ICD‐9‐CM codes 555.xx (Crohn’s disease) or 556.xx (UC) recorded as a diagnosis at any time. Since 2004, ICD‐10‐CA codes were used for all inpatient contacts and for IBD included K50.xx and K51.xx. | MMR vaccine not described | No significant association between completed measles‐containing vaccination in the | (a) IBD | OR (95% CI)(*) (a) 1.54 (0.54 to 4.36) (*)Conditional logistic regression models were fitted to the data, with models adjusted for physician visits in the first 2 years of life and area‐level socioeconomic status at case date. |
| Case‐control | Cases inflammatory bowel diseases n = 150 Cases ulcerative colitis n = 119 Controls n = 150 not having a diagnosis of IBD, age and sex matched, were used as the control group. | Inflammatory bowel diseases Patients diagnosed with IBD (UC or CD), identified according to the hospital’s patient records. Of a total of 150 patients in the sample, 119 patients were diagnosed with UC and 31 were diagnosed with CD. They were identified according to the hospital’s patient records. Documentation of the regional hospitals in Vukovar and Vinkovci was used for this purpose. Hospitals in the near surroundings such as Clinical Hospital Centre Osijek and General Hospital Slavonski Brod were also contacted, as some patients were directly referred to these hospitals by their primary care physicians without prior registration in the resident hospitals. | MMR vaccine | The study found an association between exposure to MMR vaccine in the early childhood and later development of CD | N cases vaccinated/ (a) IBD 117/150 versus 101/150 (b) UC 89/119 versus 101/150 (c) CD 28/31 versus 101/150 | OR (95% CI) (a) 1.72 (1.03 to 2.88) (b) 1.44 (0.84 to 2.46) (c) 4.53 (1.31 to 15.63) |
| Case‐only ecological method | Crohn's Disease emergency admission cases (n = 4463) observed between April 1991 and March 2003 in England population aged below 19 years (about 11.6 million) | Crohn's disease | MMR vaccine not reported (a) Reference period: 1988 to 1989 (7% children completing a primary course) (b) Risk period: (68% children completing a primary course) (c) Risk period: 1991 to 2003 (84% children completing a primary course) | The study found no increase in Crohn’s disease associated with the introduction of the MMR vaccination programme, providing strong evidence against the hypothesis that MMR vaccine increases the risk of Crohn’s disease. | ‐ | RR (95% CI)(*) 0.95 (0.84 to 1.08) (*) Poisson regression. The estimated rate ratio (populations with a vaccination rate of 84% compared with those with a vaccination rate of 7%). |
| Case‐only ecological method linked to db‐Taylor 1999 | Children with childhood (core autism n = 278) and atypical autism (n = 195) born between 1979 and 1998 from computerised health registers of children with disabilities in the community and from special school and child psychiatry records, using the same methods and classifications as in the authors' earlier study. | Recorded bowel problems lasting at least 3 months, age of reported regression of the child's development where it was a feature, and relation of these to MMR vaccination. | MMR vaccine | The study provides no support for an MMR‐associated “new variant” form of autism with developmental regression and bowel problems, and further evidence against involvement of MMR vaccine in the initiation of autism. | Bowel problem all cases n = 78 unvaccinated cases n = 9 vaccinated before parental concern n = 50 vaccinated after parental concern n = 19 | OR (95% CI)(*) 0.98 (0.89 to 1.07) (*) logistic regression adjusted for sex, year of birth, district, age at parental concern, and type of autism. |
CD: Crohn's disease
CI: confidence interval
DSM: Diagnostic and Statistical Manual of Mental Disorders
HMO: health maintenance organisation
IBD: inflammatory bowel diseases
ICD: International Classification of Diseases
ICD‐10‐CA:
ICD‐9‐CM:
incidence: cases/PT
MMR: measles, mumps, rubella vaccine
MMRV: measles, mumps, rubella, and varicella vaccine
OR: odds ratio
PT: person‐time
rr: rate ratio (relative incidence; incidence rate ratio)
RR: risk ratio (relative risk)
UC: ulcerative colitis
Definitions:
Childhood autism: children with symptoms before the age of 3 years that meet the necessary criteria under each section of the diagnostic triad for autism: communication difficulties, problems with social interaction, and behaviour problems such as stereotyped repetitions.
Atypical autism: with many of the features of childhood autism but not quite meeting the required criteria for that diagnosis, or with atypical features such as onset of symptoms after age 3 years (also known as pervasive developmental disorder not otherwise specified).
Developmental regression: a documented deterioration in any aspect of development or reported loss of skills, however transient (International Classification of Diseases, 10th revision (ICD‐10) and Diagnostic and Statistical Manual of Mental Disorders, 4th edition (DSM‐IV)).
| Study ID and design | Population | Outcome definition | Exposure | Findings | Crude data | Estimate (95% CI) |
|---|---|---|---|---|---|---|
| Cohort study | (Birth‐cohort) The enrolment (3 November 2000 to 22 August 2003) included only non‐smoking women, aged 18 to 35 years, with singleton pregnancy without illicit drug use and HIV infection, free from chronic diseases such as diabetes or hypertension and residing in Krakow for at least 1 year prior to pregnancy. The infants were followed up to 8th year of life. n = 369 children (n = 307 vaccinated MMR; n = 32 vaccinated monovalent; n = 30 unvaccinated) | Fagan Test of Infant Intelligence (FTII) at 6th month of life. Bayley Scales of Infant Development, second edition (BSID‐II), was administered in the 12th, 24th, and 36th months of life. The Mental Scale of that test includes items that assess memory, habituation, problem solving, early number concepts, generalisation, classification, vocalisation, language, and social skills. Test scores are adjusted to child’s age to obtain the Mental Development Index (MDI). Test results are in 1 of 4 categories (range: from 50 to 150): (1) accelerated performance (score > 115); (2) within normal limits (score 85 to 114); (3) mildly delayed performance (score 70 to 84), and (4) significantly delayed (score < 69). Thetest of Raven’s Colored Progressive Matrices (Raven) was administered twice, in 5th and 8th year of life. The Wechsler Intelligence Scale for Children (WISC‐R) was administered in 6th and 7th year of life, and generated verbal, non‐verbal, and total IQ for evaluated children. Category with IQ < 100 was considered as the poorer outcomes. The outcomes range is from 40 to 160. | MMR vaccine | MMR and cognitive tests outcomes: No significant differences of cognitive and intelligence tests results were observed between children vaccinated with MMR and unvaccinated in univariable analysis. Their outcomes were on similar level. Conclusion: The results suggest that there is no relationship between MMR exposure and children’s cognitive development. Furthermore, the safety of triple MMR is the same as the single measles vaccine with respect to cognitive development. | (a1) MDI‐BSID II 24th month (a2) MDI‐BSID II 36th month (b1) Raven (centiles) 5th year (c1) WISC‐R Verbal IQ 6th year | OR (95% CI)(*) (a1) 1.35 (0.15 to 12.0) (a2) 0.37 (0.03 to 4.02) (b1) 1.22 (0.23 to 6.55) (c1) 1.23 (0.09 to 17.03) (*) adjusted for standardised to child’s gender, maternal education, maternal IQ, maternal economical status, birth order (further child versus first one), and exposure to environmental tobacco smoke during pregnancy (yes versus no). |
CI: confidence interval
incidence: cases/PT
IQ: intelligence quotient
MDI‐BSID II: Mental Development Index of Bayley Scales of Infant Development, second edition
MMR: measles, mumps, rubella vaccine
MMRV: measles, mumps, rubella, and varicella vaccine
OR: odds ratio
PT: person‐time
| Study ID and design | Population | Outcome definition | Exposure | Findings | Crude data | Estimate (95% CI) |
|---|---|---|---|---|---|---|
| Nested case‐control study | Cases: n = 23 children with outcome of interest at 12 to 23 months, between 1988 and 1999, GPRD members. Controls: n = 116 participants matching for index date (age), sex, practice. Nested case–control analysis to evaluate whether there was any relationship between recent MMR vaccination and the risk of ITP. Because the data were sparse, the authors grouped case–control sets by 3‐month age bands (13 to 15 months, 16 to 18 months, and so on). In addition, they included boys and girls in sets together because childhood ITP is reported to occur with equal | Idiopathic thrombocytopenic purpura GPRD electronic records with first‐time diagnosis of thrombocytopenia (ICD‐9 code 287.1) | MMR vaccine: not reported. Data about MMR vaccination were presumably obtained from GPRD records (type and composition not reported). The authors referred to ITP cases that occurred within 6 weeks after an MMR vaccine as "possible vaccine‐related"; this is a plausible period of risk related to a primary immune response. They also evaluated the risk of ITP during a longer period after MMR vaccination (7 to 26 weeks). Risk time following MMR immunisation (a) 0 to 6 weeks (b) 7 to 26 weeks (c) 0 to 26 weeks Reference time unexposed MMR or > 26 weeks after MMR | Authors' conclusion: "Although ITP is one of the most frequently diagnosed haematological disorders amongst young children, it is an uncommon condition. The risk of ITP occurring within the 6 weeks after vaccination with MMR is significantly increased. However, the attributable risk of ITP within 6 weeks after MMR vaccination remains low at 1 in 25,000" (95% CI 21,300 to 89,400) "vaccinated children. Complications or long‐term consequences of ITP in this age group are rare. For the majority of children less than 6 years of age, the illness is self‐limiting." | N cases vaccinated/ Data reported in the study: (a) 8/17 versus 19/84 (b) 6/15 versus 32/97 (c) 14/23 versus 51/116 | OR (95% CI) unadjusted estimates (a) 3.04 (1.03 to 8.96) (b) 1.35 (0.44 to 4.14) (c) 1.98 (0.79 to 4.95) computed from the data reported in the study. ‐‐‐‐‐‐‐‐‐‐‐‐‐‐‐‐‐‐‐‐‐‐‐‐‐‐‐‐ adjusted estimates(*) (*) logistic regresson |
| Case‐control study | Cases: n = 387 children aged 1 month to 18 years, hospitalised at emergency department with outcome of interest between November 1999 and September 2007, with outcome of interest. Controls: n = 1924 children of same age interval hospitalised at emergency department for acute neurological disorders or endoscopically confirmed gastroduodenal lesions | Acute immune thrombocytopenia Platelets count < 100,000/μL at admission. Participants with following conditions were excluded: cancer, immunodeficiency, chronic renal and hepatic failure, so as acute events related to a reactivation of an underlying chronic disease or a congenital anomaly Hospitalisation (emergency department) records review | Not reported. Exposure to the vaccine (and other drugs) was assessed during hospital admission by means of interview with parents. 0 to 6 weeks following MMR immunisation | Authors' conclusion: the study confirms an association between MMR vaccination and ITP. As the risk of ITP after vaccination is smaller than after natural infection with these viruses, it is clear that the benefit of vaccination programmes greatly exceed the significance of this possible adverse effect. Although thrombocytopenia is initially severe, the subsequent course is generally benign and short‐lasting. | N cases vaccinated/ 14/387 versus 27/1924 | OR (95% CI)(*) 2.4 (1.2 to 4.7) (*) adjusted estimates by logistic regression |
| Self‐controlled case series | Children (n = 63) aged 12 to 23 months with ITP identified from versusD database for the years 1991 to 2000, who had been vaccinated with MMR whilst actively enrolled in their respective MCOs. For each child, follow‐up time was limited to the 365 days before and after MMR vaccination. Vaccinated children with ITP that occurred outside this follow‐up window were excluded. | Immune thrombocytopenia purpura Participants with 2 platelet counts ≤ 50,000/μL within 6‐week period or with 1 platelets count ≤ 50,000/μL associated with ICD‐9 diagnosis codes 287.0 to 287.9 within 6 weeks, with exclusion of: cases of thrombocytopenia from a known condition (neonatal thrombocytopenia, aplastic anaemia, defibrination syndrome, acquired haemolytic anaemia, chronic liver disease, malignant neoplasm), thrombocytopenia diagnosed within the 30th day of life. By subsequent patient chart reviews, participants who did not have not have ITP, who had drug exposure, with acute illness, or with serendipitous finding during routine care were further excluded. | MMR vaccine: not reported MMR vaccination date assessed by means of separate audit of patient charts. Exposed period: 42 days after MMR vaccination Unexposed period: defined as the time periods before and after the exposed period. Period of 6 weeks immediately preceding MMR vaccination was excluded from analysis (because this represents a period when a child is most likely to be healthy (the healthy‐vaccinee) and may underestimate the background incidence of ITP) | Authors' conclusion: since its introduction in the 1960s, the MMR vaccine has reduced the incidence of wild‐type measles by nearly 100% in the USA. Although this vaccine is associated with an increased incidence of ITP, the attributable risk is low (1 case per 40,000 doses of MMR), and the disease associated with MMR vaccination is mild and resolves, on average, within 7 days. Our results, therefore, do not suggest a need to alter current immunisation policies. | Age groups (a) 12 to 23 months (b) 12 to 15 months | rr (95% CI)(*) Self‐controlled case series (a) 5.38 (2.72 to 10.62) (b) 7.06 (1.95 to 25.88) (*) conditional Poisson regression controlled by age in three 4‐month age groupings (12 to 15, 16 to 19, 20 to 23 months) and excluding fixed covariate from the model (gender, MCO, MMR dose number) ‐‐‐‐‐‐‐‐‐‐‐‐‐‐‐‐‐‐ Person‐time cohort(**) (a) 3.94 (2.01 to 7.69) (b) 7.10 (2.03 to 25.03) (**) Poisson regression model controlled for age, MMR dose number, MCO site, and gender |
| Self‐controlled case series | Children aged 12 to 24 months discharged from hospital in 5 districts in England (Ashford, Leicester, Nottingham, Preston, and Chorley & Ribble) for varying periods between October 1988, and February 1993. Readmissions within 72 h with the same diagnosis were counted as 1 episode. n = 952 children | Idiopatric thrombocytopenic purpura (ICD 287.3) children aged between 366 and 730 days | MMR vaccine: Urabe mumps strain Jeryl Lynn mumps strain Rubella strain not specified Exposure risk period: (a1) 6 to 11 days (1 to 2 weeks after vaccination) (a2) 15 to 35 days (3 to 5 weeks after vaccination) Control period: (b) for each vaccine was defined as the time not included in a risk period. The analyses were adjusted for age and were grouped in 6 equal intervals of about 2 months. | Authors' conclusion: we demonstrated a causal association between ITP and MMR vaccination, with an absolute risk of 1 in 24,000 doses and an attributable risk of 1 in 29,000 doses. | Any strain (a1) 0 cases (a2) 4 cases | rr (95% CI)(*) (a2) 6.44 (1.94 to 21.4) (*) Poisson regression |
| Self‐controlled case series | Multicountry The chosen study population was children aged 12 to 23 months (365 to 732 days). | Thrombocytopenic purpura The case definition for TP was based only on the presence of a relevant ICD‐10 code (D69.3) or ICD‐8 code (287.10) in 1 of the diagnostic discharge fields. First episodes were defined as the earliest record found for an individual, further episodes were initially required to be at least 14 days since a previous episode (to prevent double counting of episodes). In England cases (based on ICD‐10) occurring between 1 April 1996 and 31 March 2007 were linked using NHS number or gender/date of birth/postcode to immunisation records. In Denmark the Central Person Registry (CPR) was used to construct a nationwide cohort consisting of all Danish children born in the period 1 January 1990 to 31 December 2007 (∼1.2 million children). | MMR vaccine: not described Risk periods: (post‐MMR) (a) 0 to 13 days (b) 14 to 27 days (c) 28 to 42 days (d) 0 to 42 days Reference period pre‐vaccination (e) −7 to −1 days (to allow for a vaccination being delayed if the child was ill) | Authors' conclusion: this study gave consistent estimates of the relative incidence of TP following MMR vaccination in 1‐year‐olds. The 95% CI for the attributable risk of TP can be calculated based on the 95% CI for the relative incidence and gives an interval of 1 in 74,000 to 1 in 40,000 doses. | (a) 12 cases (b) 26 cases (c) 17 cases (d) 55 cases | rr (95% CI)(*) (a) 1.30 (0.71 to 2.38) (b) 2.87 (1.85 to 4.46) (c) 1.81 (1.07 to 3.05) (d) 1.98 (1.41 to 2.78) (*) adjusting for age, period, country, and country‐age interaction |
| Self‐controlled case series | Children < 18 years old (confirmed ITP cases) who had been vaccinated while actively enrolled in their respective health plans. This investigation was conducted in 5 healthcare systems (Kaiser Permanente: Colorado, Hawaii, Georgia, Northern California, and Harvard Vanguard Medical Associates) by using data from the years 2000 to 2009. | Thrombocytopenic purpura Case was defined as a child aged 6 weeks to 18 years with a platelet count of ≤ 50,000/μL, with normal red and white blood cell indices, and the presence of clinical signs and symptoms of ITP, such as petechiae, significant bruising, or spontaneous bleeding. | MMR, MMRV vaccine: not described Follow‐up time: 365 days before and after vaccination. Exposed period: 1 to 42 days after vaccination for all vaccines. Unexposed period: defined as the time before and after the exposed period within 365 days of follow‐up before or after vaccination. | Authors' conclusion: none of the routine childhood vaccines given in the first year of life was significantly associated with an increased risk of ITP. For vaccines routinely administered at 12 to 19 months of age, there was a significant association of ITP with MMR. There was no increased risk of ITP (calculated when not given simultaneously with MMR or MMRV). There were 1.9 cases of ITP per 100,000 doses of MMR. | Exposed cases versus unexposed cases (a) 12 to 19 months (a1) MMR: 6 versus 5 (a2) MMRV: 4 versus 6 (b) 4 to 6 years (b1) MMR: 2 versus 7 (b2) MMRV: 0 versus 5 (c) 11 to 17 years (c1) MMR: 0 versus 1 | rr (95% CI) (a1) 5.48 (1.61 to 18.64) (a2) 2.87 (0.78 to 10.56) (b1) 3.06 (0.42 to 22.30) (b2) not estimable (c1) not estimable |
| Self‐controlled case series | For this study, WHO selected 26 sentinel sites (49 hospitals) distributed in 16 countries of the 6 WHO regions. The study population included children aged 9 to 23 months admitted to a network‐participating hospital during January 2010 to March 2014, with a discharge diagnosis of either aseptic menigitis or immune thrombocytopenic purpura. | Immune thrombocytopenia ICD‐9 codes in first discharge diagnosis position: 287.30 to 287.39 Primary thrombocytopenia 287.41 to 287.49 Secondary thrombocytopenia 287.5 Thrombocytopenia, unspecified ICD‐10 codes in first discharge diagnosis position: D69.3, D69.4 (D69.41 to D69.43) Primary thrombocytopenia D69.5 (D69.51, D69.59) Secondary thrombocytopenia D69.6 Thrombocytopenia, unspecified | Vaccine (measle strain) (mumps strain) Priorix, GSK (Schwarz) (RIT 4385a) (Schwarz) (Urabe AM9) Risk period 8 to 35 days Washout periods 1 to 7 days 36 to 42 days Control period 43 to 84 days | The elevated risk of ITP following measles‐containing vaccination is consistent with the literature (db‐O'Leary 2012: db‐France 2008). Our strain‐specific unadjusted | In 16 countries n = 183 ITP cases ‐‐‐‐‐‐‐‐‐‐‐‐‐‐‐‐‐‐‐‐‐‐‐‐‐‐‐‐‐‐‐‐‐‐‐‐‐‐‐‐‐‐‐‐‐‐‐ (risk versus control) period (a) overall (36 versus 12) (b) overall (excluding Iran) (36 versus 8) (c) AIK‐C/Edmonston‐Zagreb/Schwarz (2 versus 5) (d) Edmonston‐Zagreb (7 versus 1) (e) Enders' Edmonston (11 versus 3) (f) Schwarz (14 versus 1) (g) Shanghai‐191 (0 versus 1) | rr (95% CI) adjusted (a) 5.6 (2.7 to 11.9) (b) 9.1 (3.7 to 22.3) (c) 0.54 (0.08 to 3.6) (d) 8.4 (0.7 to 100.3) (e) 28.7 (1.9 to 443.5) rr (95% CI) unadjusted (f) 20.7 (2.7 to 157.6) (g) not estimable |
| Case cross‐over | Population‐based study in France including all children newly diagnosed for primary ITP between July 2009 and June 2015. n = 2549 | Immune thrombocytopenia | MMR vaccine: not described Exposed period 6‐week interval immediately preceding the event (frequency of exposure to vaccines) Control period (1) 6 weeks, 6 months before (2) 6 weeks, 3 months before the case period | Conclusion: in this nationwide study, no significant risk was observed for vaccines against DTP, pneumococcus, meningococcus, and HBV. The increased risk of MMR‐induced ITP is shown in children (previously demonstrated as lower than after the natural infection with measles). Vaccine‐induced ITP remains an exceptional adverse drug reaction, including for MMR vaccines. The numbers of attributable cases per million MMR doses dispensed were 9.8. | n = 492 patients included in analysis | OR (95% CI) 1.62 (1.21 to 2.16) |
| Case‐only ecological study | Pharmacovigilance reports: case observed after vaccine administration between 1984 and 30 June 1992 (n = 60). Estimated number of administered vaccine doses was 9,205,483. | Thrombocytopenic purpura Acute haemorrhagic syndrome associated with platelet count of < 100,000/mm³, all cases within 45 days of vaccination, over 8‐year period | MMR vaccine: (a) ROR, Trimovax (measles Schwarz strain, mumps Urabe AM9 strain, rubella Wistar RA 27/3 M strain) Other measles‐containing vaccines: (b) Rouvax (measles Schwarz strain) (c) Rudi‐Rouvax (measles Schwarz strain, rubella Wistar RA 27/3 M strain) Other vaccine: (d) Rudivax (rubella Wistar RA 27/3 M strain) + DTbis (e) Rudivax (rubella Wistar RA 27/3 M strain, diptheria, tetanus) (e) Imovax Oreillons (mumps Urabe AM9 strain) 2 to 45 days following immunisation | Authors' conclusion: according to the clinical course and biologic findings, vaccine‐associated TP appears to be similar to that occurring after natural measles or rubella infections and is not distinguishable from acute childhood idiopathic thrombocytopenic purpura not associated with vaccination. Such observation, combined with a clear temporal relationship between MMR vaccination and occurrence of TP, make a causal relationship highly plausible. Nevertheless, the incidence of these events remains relatively low with a favourable immediate outcome. | Case/doses (a) 42/4,396,645 ‐‐‐ (b) 2/860,938 (c) 12/1,480,058 ‐‐‐ (d) 4/2,295,307 (e) 0/172,535 | Incidence x 100,000 doses (95% CI)(*) (a) 0.96 (0.71 to 1.29) ‐‐‐ (b) 0.23 (0.06 to 0.85) (c) 0.81 (0.46 to 1.42) ‐‐‐ (d) 0.17 (0.07 to 0.45) (e) 0.00 (0.00 to 2.23) (*) confidence intervals were recomputed by Wilson 1927 method. |
CI: confidence interval
DTP: diphtheria, tetanus, and pertussis
GPRD: General Practice Research Database
HMO: health maintenance organisation
HPV: human papillomavirus
ICD: International Classification of Diseases
ITP: idiopathic thrombocytopenic purpura
MCOs: Managed Care Organizations
MMR: measles, mumps, rubella vaccine
MMRV: measles, mumps, rubella, and varicella vaccine
OR: odds ratio
PT: person‐time
rr: rate ratio (relative incidence, incidence rate ratio)
incidence: cases/PT
RR: risk ratio (relative risk)
TP: thrombocytopenic purpura
WHO: World Health Organization
| Study ID and design | Population | Outcome definition | Exposure | Findings | Crude data | Estimate (95% CI) |
|---|---|---|---|---|---|---|
| Case‐control | Cases (n = 288) children (aged > 1 month and ≤ 18 years) hospitalised with a diagnosis of Henoch‐Schönlein purpura through the emergency departments (11 Italian paediatric hospitals/wards spread throughout the country (Treviso, Padua, Naples, Genoa, Turin, Florence, Perugia, Palermo, Messina, and Rome, with 2 centres)). Control (n = 617) children hospitalised for gastroduodenal lesions were considered as appropriate controls, since they represent an acute condition admitted through the emergency departments in the same clinical centres in which cases were identified. | Henoch‐Schönlein purpura All children hospitalised with a diagnosis of HSP at admission were included as cases. Discharge diagnosis was retrieved from clinical records and validated by clinicians, according to EULAR/PRINTO/PRES criteria for classification of HSP. Validation was conducted retrieving data from individual patient clinical records, blinded with respect to drug and vaccine exposure. Only validated cases were analysed. | Vaccines MMR | Conclusions: the association between MMR vaccination and HSP confirms previous published findings and adds a risk estimate. Further studies are needed to increase our understanding of the role of drugs and vaccines in the aetiology of HSP, a disease with important effects on health of children for its potential, though rare, chronic outcomes. This article confirms that HSP is a rare condition (288 children hospitalised in 14 years). Furthermore, the number of vaccinated cases was only 8, suggesting a very low absolute risk of the condition in children vaccinated with MMR vaccine. The benefit/risk profile of MMR vaccine is thus not affected by our results, being that MMR vaccination is an effective and safe tool against serious diseases in childhood. | N cases vaccinated/ 8/228 versus 6/617 | OR (95% CI)(*) 3.4 (1.2 to 10.0) (*) Adjusted by age |
CI: confidence interval
HSP: Henoch‐Schönlein purpura
incidence: cases/PT
MMR: measles, mumps, rubella vaccine
MMRV: measles, mumps, rubella, and varicella vaccine
OR: odds ratio
PT: person‐time
| Study ID and design | Population | Outcome definition | Exposure | Findings | Crude data | Estimate (95% CI) |
|---|---|---|---|---|---|---|
| Cohort study | A cohort of children born from 1 January 1990 to 31 December 2000 from the Danish Civil Registration System (n = 739,694) | Type 1 diabetes: information on the diagnosis of type 1 diabetes from 1 January 1990 through 31 December 2000 was obtained from the Danish National Hospital Register. From 1990 through 1993, Denmark used a modified version of the ICD‐8. From 1994 through 2001, the ICD‐10 was used. The authors used codes 249 and E10 (the code 249 does not exist in the standard World Health Organization version of the ICD‐8) to identify all cases of type 1 diabetes. Beginning in 1995, visits to the emergency room and outpatient visits were included in the National Hospital Register. (n = 681 cases of type 1 diabetes) | MMR vaccine: measles Moraten strain, mumps Jeryl Lynn strain, rubella Wistar RA 27/3 strain. Schedule 15 months and 12 years of age; composition: (a1) 1 dose (a2) unknown (b) unvaccinated | Authors' conclusion: these results do not support a causal relation between childhood vaccination and type 1 | All children (a1) 499/293,428 (a2) 58/412,830 (b) 124/1,373,401 Children with at least 1 sibling with type 1 diabetes (a1) 20/2795 (a2) 0/361 (b) 6/1053 | rr (95% CI)(*) All children (a1) 1.14 (0.90 to 1.45) (a2) 1.04 (0.71 to 1.52) Children with at least 1 sibling with type 1 diabetes (a1) 0.86 (0.34 to 2.14) (a2) ‐ (‐ to ‐) (*) Poisson log linear regression |
| Cohort study | Cohort of children recruited: between 1989 and 2000, a total of 1650 offspring of patients with T1D were recruited for the BABYDIAB study and were followed for 23,856 patient years. Between 2000 and 2006, 791 additional offspring or siblings of patients with T1D were screened in the context of the BABYDIET study and were followed by using the BABYDIAB protocol for 6358 patient years. | Islet autoimmunity: type 1 diabetes: (T1D) is one of the most common chronic diseases in childhood. The disease is preceded by a preclinical period of islet autoimmunity, which most commonly develops in early infancy. Factors that induce a strong immune response in early life might thus be relevant for the development of T1D‐associated islet autoimmunity. Islet autoantibodies were measured in venous blood samples from scheduled visits. Children in the BABYDIAB study had scheduled visits at birth, at age 9 months, and at 2, 5, 8, 11, 14, 17, and 20 years of age, whereas children in the BABYDIET study had 3‐monthly visits from birth until the age of 3 years, and yearly until the age of 12 years. Measurement of islet autoantibodies in these studies has been described elsewhere. Islet autoimmunity was defined as the development of persistent autoantibodies to 1 or more of the antigens insulin, GAD65, IA‐2 or Zn‐T8, with sample values above the 99th percentile of published population control children classified as positive. In case of single positive antibodies against insulin or GAD65, affinity and epitope reactivity was determined and children with low‐affinity antibodies (< 109 L/mol) were not classified as islet autoantibody positive, as these isolated antibody signals are not T1D specific and are not associated with increased T1D risk. Persistence was defined as positive in at least 2 consecutive samples. Islet autoantibody assays were evaluated according to the Diabetes Autoantibody Standardization Program. | MMR vaccine not described Age (a) 0 to 24 months | Conclusions: the authors found no evidence that early vaccinations increase the risk of T1D‐associated islet | Total n = 1918 n = 1779 children without confirmed islet autoimmunity n = 139 confirmed islet autoimmunity | HR (95% CI)(*) (a) 1.08 (0.96 to 1.21) (*) Cox regression |
CI: confidence interval
HMO: health maintenance organisation
HR:hazards ratio
ICD: International Classification of Diseases
incidence: cases/PT
MMR: measles, mumps, rubella vaccine
MMRV: measles, mumps, rubella, and varicella vaccine
OR: odds ratio
PT: person‐time
rr: rate ratio (relative incidence, incidence rate ratio)
RR: risk ratio (relative risk)
T1D: type 1 diabetes
| Study ID and design | Population | Outcome definition | Exposure | Findings | Crude data | Estimate (95% CI) |
|---|---|---|---|---|---|---|
| Cohort study | Children (0 to 6 years) enrolled in VSD project (4 HMOs) between 1991 and 1997 (n = 167,240) | Asthma: a child had to meet 1 of the following criteria: (1) at least 1 diagnosis of asthma ICD‐9 Code 493 and at least 1 prescription for an asthma medication; the first diagnosis and first prescription had to be within a 2‐year period. Asthma medications included oral or inhaled beta‐agonists, theophyllin, oral or inhaled corticosteroids, cromolyn sodium, adrenergic drugs not elsewhere specified, and unclassified asthma medications; (2) at least 1 prescription for an inhaled beta‐agonist and at least 1 prescription for cromolyn within a 2 year period; (3) at least 5 prescriptions for asthma medications during a 2‐year period. (Total asthma cases n = 18,407) | MMR vaccine: not reported Exposure to MMR vaccine (and other vaccines). Vaccinations were ascertained through computerised immunisation tracking systems, and onset of asthma was identified through computerised data on medical care encounters and medication dispensing. | Conclusion: there is no association between | Not reported | rr (95% CI)(*) 0.97 (0.91 to 1.04) (*) adjusted rr estimated from a proportional hazard regression model stratified by HMO and month and year of birth, gender, low birthweight status |
| Cohort study | Children (n = 16,470) aged from 20 months to 11 years, accounting for 69,602 person‐years n = 29,238 n = 20,845 vaccinated n = 8393 unvaccinated | Asthma: diagnoses of asthma/wheeze and eczema from the Oxford Medical Information System (which was derived from the ICD‐8) and Read codes (hierarchical codes commonly used in GP practices in England) diagnoses of asthma n = 1753 n = 28 (amongst unvaccinated) | MMR vaccine: not reported Vaccination status extracted from West Midlands General Practice Research Database. Data are presented (a1) 0 to 6 (a2) 7 to 10 (a3) 11 to 16 (a4) > 16 | Conclusion: the study data suggest that currently recommended routine vaccinations are not a risk factor for asthma or eczema. In this observational study analysing computerised primary care records, the authors found an association between MMR and DPT vaccination and the incidence of asthma and eczema, but these associations appeared to be limited to the minority of children who rarely seek care from a GP. This limited association is more likely to be the result of bias than a biological effect. | Cases vaccinated/PT‐years versus cases unvaccinated/PT‐years ‐‐‐‐‐‐‐‐‐‐‐‐All‐‐‐‐‐‐‐‐‐‐‐‐‐‐‐‐ (a) 1725/65,597 versus 28/4006 ‐‐‐‐‐‐‐‐‐‐‐‐‐‐‐‐‐‐‐‐‐‐‐‐‐‐‐‐‐‐‐ stratified by consulting frequency in first 18 months (a1) 165/12,462 versus 5/2843 (a2) 351/17,522 versus 7/425 (a3) 601/20,693 versus 8/452 (a4) 608 /14,920 versus 8/286 | rr (95% CI)(*) (a) 2.2 (1.50 to 3.21) (a1) 7.18 (2.95 to 17.49) (a2) 0.95 (0.45 to 2.01) (a3) 1.36 (0.68 to 2.73) (a4) 1.21 (0.60 to 2.43) (*) Adjusted rr estimated from a proportional hazard regression model stratified by consulting frequency, parental smoking, parental allergic disease, maternal age, number of older siblings, use of antibiotics early in life, year of birth, and GP practice. |
| Cohort study | Danish birth cohorts 1991 to 2003 followed up between 1 January 1991 and 31 December 2003, or between 1 and 5 years of age | Asthma hospitalisation: inpatient hospitalisation with asthma diagnosis (occurred between 1 January 1992 and 31 December 2004)
n = 871,234 children (vaccine coverage 85%) PT = 2,926,406 (person‐years) n = 26,880 hospitalisations amongst 17,885 children ‐‐‐‐‐‐‐‐‐‐‐‐‐‐‐‐‐‐‐‐‐‐‐‐‐‐‐‐‐‐‐ Anti‐asthma medication: prescription of the following cases of anti‐asthma medications have been considered:
n = 600,938 children (vaccine coverage 84%) PT = 1,858,199 (person‐years) n = 833,424 prescriptions anti‐asthma medication amongst 248,907 children | MMR vaccine: Measles Moraten strain, Mumps Jeryl Lynn strain, Rubella Wistar RA 27/3 strain. Dates of MMR vaccination were obtained from the National Board of Health. | Conclusion: these results are compatible not with an increased risk of asthma following MMR vaccination, but rather with the hypothesis that MMR vaccination is associated with a reduced risk of asthma‐like disease in young children. | (a) Asthma (b) Status asthmaticus (c) Anti‐asthma medication | rr (95% CI)(*) (a) 0.75 (0.73 to 0.78) (b) 0.63 (0.49 to 0.82) (c) 0.92 (0.91 to 0.92) (*) Adjusted for age, calendar period, hospitalisations propensity in infancy, birthweight, place of birth, mother’s country of birth, infant vaccine compliance, birth order, maternal age at birth, and child’s sex. Log‐linear Poisson regression. |
| Cohort study | Participants were aged between 22 and 44 years n = 309 | Participants were surveyed by a validated interviewer‐administered questionnaire covering: history of asthma; details of home and occupation environment; smoking history; medications; dietary information; and respiratory symptoms. The respiratory symptoms included wheezing or whistling in the chest, shortness of breath, chest tightness, and cough and phlegm during the previous 12 months. Atopy was assessed by skin prick testing to common aeroallergens. | MMR vaccine not described Questionnaire included vaccination history questions, which were not included in the questionnaire used by the other study centres. Vaccination history included measles or MMR vaccinations; hepatitis B; Bacille Calmette‐Guérin (BCG); oral polio vaccine (OPV); and diphtheria, tetanus, and whooping cough (DTP). | Conclusion: there was no significant association observed for participants diagnosed with asthma who had received measles or MMR vaccinations compared with those who did not receive measles or MMR vaccinations. | (a) Asthma (b) Atopy | RR (95% CI) (a) 1.33 (0.98 to 1.80) (b) 1.07 (0.88 to 1.30) |
| Cohort study | n = 640 children were followed from birth. Follow‐up examinations at ages 5, 7 and 13 years included a physical examination and a maternal questionnaire about the child’s health. | Asthma (and dermatitis eczema) At child's age 5, parents were asked whether the child was suspected to suffer from asthma or had been diagnosed with asthma, hypersensitivity, or allergy. At ages 5, 7, and 13 years, the same paediatrician determined the presence of current wheezing by auscultation. At the same ages, the paediatrician also examined all children for dermatitis/eczema. At age 13, the findings from this examination were graded according to a score for atopic dermatitis (SCORAD). At age 7, a blood sample was drawn and total IgE and grass‐specific IgE were quantified. At age 13, parents were asked whether the child had ever suffered from asthma. In accordance with the International Study of Asthma and Allergies in Childhood (ISAAC), they were also asked to | MMR vaccine: not described The Faroe Islands follow the Danish vaccination schedule, in which MMR vaccination, at the time of this study, was administered at age 15 months and 12 years (Fig. 1). There were no specific contraindications. At the 5‐year examination, the child’s vaccination card was inspected and all vaccination dates were registered. At child's age 13, the mothers were asked whether the child had received the MMR vaccination scheduled at 12 years of age. | Conclusion: the authors' findings support the notion that MMR vaccination may provide beneficial effects in preventing childhood allergy and asthma. | Asthma (a) 5 years old (b) 13 years old | OR (95% CI) (a) 0.33 (0.12 to 0.90)(*) (b) 0.22 (0.08 to 0.56)(*) (a) 0.32 (0.10 to 1.05)(*)(**) (b) 0.16 (0.05 to 0.53)(*)(**) RR (95% CI)(***) (a) 0.44 (0.18 to 0.93)(*) (b) 0.35 (0.14 to 0.71)(*) (*) Adjusted OR (logistic regression model) for birthweight and family history of chronic bronchitis/asthma. The analyses at age 13 years are additionally adjusted for whether the child had received the second MMR vaccine before the 13‐year examination. (**) Additional adjustment for sex, premature birth, maternal smoking during pregnancy, log (cord blood IgE), breastfeeding, number of older siblings, number of younger siblings, parental smoking in the home, day care, family history of eczema in children/allergic eczema/hay fever, family history of allergy, and age at the examination. (***) OR converted in RR (a) CER = 0.36 (b) CER = 0.47 |
ACT: Asthma Control Test
CER: control event rate
CI: confidence interval
DPT: diphtheria, pertussis, and tetanus vaccine
GP: general practice
HMO: health maintenance organisation
ICD: International Classification of Diseases
IgE: Immunoglobulin E
incidence: cases/PT
MMR: measles, mumps, rubella vaccine
MMRV: measles, mumps, rubella, and varicella vaccine
OR: odds ratio
PT: person‐time
rr: rate ratio (relative incidence, incidence rate ratio)
RR: risk ratio (relative risk)
VSD: Vaccine Safety Datalink
| Study ID and design | Population | Outcome definition | Exposure | Findings | Crude data | Estimate (95% CI) |
|---|---|---|---|---|---|---|
| Cohort study | Children (n = 14,353) aged from 20 months to 11 years, accounting for 59,520 person‐years | Eczema: diagnoses of asthma/wheeze and eczema from the Oxford Medical Information System (which was derived from the ICD‐8) and Read codes (hierarchical codes commonly used in GP in England) diagnoses of eczema n = 1884 | MMR vaccine: not reported Vaccination status extracted from West Midlands General Practice Research Database Data are presented (a1) 0 to 6 (a2) 7 to 10 (a3) 11 to 16 (a4) > 16 | Conclusion: the study data suggest that currently recommended routine vaccinations are not a risk factor for asthma or eczema. In this observational study analysing computerised primary care records, the authors found an association between MMR and DPPT vaccination and the incidence of asthma and eczema, but these associations appeared to be limited to the minority of children who rarely seek care from a GP. This limited association is more likely to be the result of bias than a biological effect. | Cases vaccinated/PT‐years versus Cases unvaccinated/PT‐years ‐‐‐‐‐‐‐‐‐‐‐‐‐‐‐All‐‐‐‐‐‐‐‐‐‐‐‐‐ (a) 1857/55,651 versus 27/3868 ‐‐‐‐‐‐‐‐‐‐‐‐‐‐‐‐‐‐‐‐‐‐‐‐‐‐‐‐‐‐ Stratified by consulting frequency in first 18 months (a1) 244/10,625 versus 6/2768 (a2) 457/14,293 versus 7/402 (a3) 601/17,427 versus 9/400 (a4) 555/13,306 versus 5/297 | rr (95% CI)(*) (a) 3.50 (2.38 to 5.15) (a1) 10.4 (4.61 to 23.29) (a2) 1.57 (0.75 to 3.32) (a3) 1.36 (0.71 to 2.64) (a4) 2.21 (0.92 to 5.33) (*) Adjusted rr estimated from a proportional hazard regression model stratified by consulting frequency, parental smoking, parental allergic disease, maternal age, number of older siblings, use of antibiotics early in life, year of birth, and GP practice. |
| Cohort study | n = 640 children were followed from birth. Follow‐up examinations at ages 5, 7, and 13 years included a physical examination and a maternal questionnaire about the child’s health. | Asthma and dermatitis eczema At age 5, parents were asked whether the child was suspected to suffer from asthma or had been diagnosed with asthma, hypersensitivity, or allergy. At ages 5, 7, and 13 years, the same paediatrician determined the presence of current wheezing by auscultation. At the same ages, the pediatrician also examined all children for dermatitis/eczema. At age 13, the findings from this examination were graded according to a score for atopic dermatitis (SCORAD). At age 7, a blood sample was drawn and total IgE and grass‐specific IgE were quantified. At child's age 13, parents were asked whether the child had ever suffered from asthma. In accordance with the International Study of Asthma and Allergies in Childhood (ISAAC), they were also asked to indicate whether the child had (i) suffered from wheezing in the past 12 months, (ii) suffered from sneezing, running, or blocked‐up nose except for when the child had a cold or was sick in the past 12 months, and, if so, whether it was accompanied by itching running/tearing eyes (current rhinoconjunctivitis symptoms), and (iii) whether the child had ever suffered from an itching rash that comes and goes for at least 6 months (eczema ever). At age 13, the children underwent a skin prick test with extracts of 5 common allergens (birch/grass pollen, dog/cat dander, and house dust mite (Dermatophagoides pteronyssinus)). | MMR vaccine: not described The Faroe Islands follow the Danish vaccination schedule, in which MMR vaccination, at the time of this study, was administered at age 15 months and 12 years (Fig. 1). There were no specific contraindications. At the 5‐year examination, the child’s vaccination card was inspected and all vaccination dates were registered. At child's age 13, the mothers were asked whether the child had received the MMR vaccination scheduled at 12 years of age. | Conclusion: there is no association between | Eczema (a) 5 years old (b) 13 years old | OR (95% CI) (a) no data (*) (b) 0.73 (0.26 to 2.10) (*) (a) no data (*) (**) (b) 0.46 (0.14 to 1.52) (*) (**) RR (95% CI) (***) (a) no data (*) (b) 0.75 (0.28 to 1.87) (*) (*) Adjusted OR (logistic regression model) for birthweight and family history of chronic bronchitis/asthma. The analyses at age 13 years are additionally adjusted for whether the child had received the second MMR vaccine before the 13‐year examination. (**) Additional adjustment for sex, premature birth, maternal smoking during pregnancy, log (cord blood IgE), breastfeeding, number of older siblings, number of younger siblings, parental smoking in the home, day care, family history of eczema in children/allergic eczema/hay fever, family history of allergy, and age at the examination. (***) OR converted in RR (a) no data (b) CER = 0.11 |
CER: control event rate
CI: confidence interval
HMO: health maintenance organisation
ICD: International Classification of Diseases
incidence: cases/PT
IgE: immunoglobulin E
GP: general practice
MMR: measles, mumps, rubella vaccine
MMRV: measles, mumps, rubella, and varicella vaccine
OR: odds ratio
PT: person‐time
rr: rate ratio (relative incidence, incidence rate ratio)
RR: risk ratio (relative risk)
VSD: Vaccine Safety Datalink
| Study ID and design | Population | Outcome definition | Exposure | Findings | Crude data | Estimate (95% CI) |
|---|---|---|---|---|---|---|
| Case‐control | n = 76,310 children from GPRD born between 1989 and 1993 from 464 general practices, and within a DIN cohort of n = 40,183 children born between 1989 and 1997 from 141 general practices. From GPRD cases = 3859 controls = 3859 From DIN cases = 2611 controls = 2611 | Hay fever Case certain (Definition I): a child with hay fever diagnosis before 24 months of age, and a second diagnosis of hay fever or a relevant therapy in a subsequent years and with a third diagnosis or a relevant therapy in a further year. Case certain (Definition II): a child without first diagnosis before 24 months of age, but with a second diagnosis of hay fever or a relevant therapy in subsequent year. Case less certain (Definition I): a child as a case certain (Definition I) without third diagnosis of hay fever or a relevant therapy in a further year. Case less certain (Definition II): a child with at least a hay fever diagnosis, even if there is not a second diagnosis or a relevant therapy in a subsequent year. The cases and controls were children with at least 5 years of follow‐up from birth and registered “within the practice within 3 months of birth”. Only codes synonymous with "allergic rhinitis” and with seasonal variation in recording were permitted. From GPRD and DIN database. | MMR vaccine: (first entries) MMR II The time categories for MMR immunisation: (a) 1st to 13th month (b) 14th month (c) 15th month (d) 16th month (e) 17th month (f) 18th to 24th month (g) ≥ 25th month (h) no MMR vaccine | Conclusions: this study shows that infants vaccinated with MMR are at no greater or lesser risk of developing hay fever than unvaccinated children. This should reassure parents and clinicians, and no opportunity should be missed to immunise. | n = (cases + controls) From GPRD (a) n = 1688 (b) n = 2311 (c) n = 1638 (d) n = 1183 (e) n = 510 (f) n = 618 (g) n = 234 (h) n = 210 From DIN (a) n = 1128 (b) n = 1769 (c) n = 1192 (d) n = 772 (e) n = 335 (f) n = 379 (g) n = 119 (h) n = 110 | OR (95% CI) From GPRD(*) (a) 0.97 (0.81 to 1.16) (b) 1.00 (1.00 to 1.00) (c) 0.89 (0.75 to 1.06) (d) 0.93 (0.75 to 1.14) (e) 0.96 (0.73 to 1.25) (f) 0.89 (0.70 to 1.14) (g) 0.83 (0.58 to 1.18) (h) 0.81 (0.53 to 1.24) From DIN(**) (a) 0.90 (0.71 to 1.16) (b) 1.00 (1.00 to 1.00) (c) 1.24 (1.00 to 1.53) (d) 0.96 (0.73 to 1.39) (e) 1.00 (0.69 to 1.45) (f) 1.01 (0.73 to 1.28) (g) 0.54 (0.31 to 0.95) (h) 0.82 (0.45 to 1.50) From GPRD‐DIN Pooled (fixed‐effect) 1.27 (0.93 to 1.72) (*) Adjusted for consultation (**) Adjusted for consultation frequency and restricted to |
| Case‐control | n = 76,310 children from GPRD born between 1989 and 1993 from 464 practices and within a DIN cohort of n = 40,183 children born between 1989 and 1997 from 141 general practices. case + controls = 13,523 | Hay fever risk in the first grass pollen season. Case of hay fever were children with diagnostic codes or treatment for hay fever, or both, after 2 years of age. Control was child that matched for general practice, sex, birth month, and follow‐up of control to at least date of diagnosis case. "Cases of hayfever were those who had diagnostic codes and/or treatment for hayfever, after 2 years of age”. From GPRD and DIN database. | MMR vaccine: MMR II exposure by 24 months in a grass pollen season (May, June, July) versus non‐pollen season exposure | Conclusion: in 2 population‐based birth cohorts, the authors have not Having MMR vaccine during grass pollen season by age 24 months (compared with MMR outside grass pollen season only) was not associated with an increased OR. | Cases + control out season = 9690 in season = 3833 | OR (95% CI)(*) 1.05 (0.94 to 1.18) (*) Odds ratios were pooled across databases (GPRD and DIN) using a fixed‐effect model. |
| Cohort study | n = 640 children were followed from birth. Follow‐up examinations at ages 5, 7, and 13 years included a physical examination and a maternal questionnaire about the child’s health. | Asthma (and dermatitis eczema) At child's age 5, parents were asked whether the child was suspected to suffer from asthma or had been diagnosed with asthma, hypersensitivity, or allergy. At ages 5, 7, and 13 years, the same paediatrician determined the presence of current wheezing by auscultation. At the same ages, the paediatrician also examined all children for dermatitis/eczema. At age 13, the findings from this examination were graded according to a score for atopic dermatitis (SCORAD). At age 7, a blood sample was drawn and total IgE and grass‐specific IgE were quantified. At age 13, parents were asked whether the child had ever suffered from asthma. In accordance with the International Study of Asthma and Allergies in Childhood (ISAAC), they were also asked to | MMR vaccine: not described. The Faroe Islands follow the Danish vaccination schedule, in which MMR vaccination, at the time of this study, was administered at age 15 months and 12 years (Fig. 1). There were no specific contraindications. At the 5‐year examination, the child’s vaccination card was inspected and all vaccination dates were registered. At child's age 13, the mothers were asked whether the child had received the MMR vaccination scheduled at 12 years of age. | Conclusion: the authors' findings support the notion that MMR vaccination may | Rhinoconjunctivitis (a) 5 years old (b) 13 years old Hypersensitivity/allergy (a) 5 years old (b) 13 years old | OR (95% CI) Rhinoconjunctivitis (a) no data (*) (b) 0.64 (0.19 to 2.07) (*) (a) no data (*)(**) (b) 0.63 (0.14 to 2.71) (*)(**) Hypersensitivity/allergy (a) 0.32 (0.11 to 0.88) (*) (b) no data (*) (a) 0.36 (0.11 to 1.21) (*)(**) (b) no data (*)(**) (*) Adjusted for birthweight and family history of chronic bronchitis/asthma. The analyses at age 13 years are additionally adjusted for whether the child had received the second MMR vaccine before the 13‐year examination. (**) Additional adjustment for sex, premature birth, maternal smoking during pregnancy, log (cord blood IgE), breastfeeding, number of older siblings, number of younger siblings, parental smoking in the home, day care, family history of eczema in children/allergic eczema/hay fever, family history of allergy, and age at the examination. |
CI: confidence interval
DIN: doctors' independent network
GPRD: General Practice Research Database
HMO: health maintenance organisation
incidence: cases/PT
IgE: immunoglobulin E
MMR: measles, mumps, rubella vaccine
MMRV: measles, mumps, rubella, and varicella vaccine
OR: odds ratio
PT: person‐time
rr: rate ratio (relative incidence, incidence rate ratio)
RR: risk ratio (relative risk)
| Study ID and design | Population | Outcome definition | Exposure | Findings | Crude data | Estimate (95% CI) |
|---|---|---|---|---|---|---|
| case control | Cases: patients with leukaemia or acute lymphoblastic leukaemia, aged 0 to 14 years identified within the NCCLS between 1995 and 2002. Controls: matched to cases for date of birth, gender, Hispanic status (either parent Hispanic), maternal race (white, African‐American, or other), and maternal county of residence, by means of birth certificates. Population coverage initially includes 17 countries in the Greater San Francisco Bay Area, and since 1999 was expanded to a further 18 countries in Northern and Southern California. The present study relies on cases of leukaemia ascertained between 1995 and 2002. | Leukaemia Acute lymphoblastic leukaemia Within the NCCLS, incident leukaemia cases were ascertained from major paediatric clinical centres within 72 hours after diagnosis. To be eligible, each case or control had to:
| MMR vaccine: not reported Complete vaccination record was requested to primary caretakers of case or control participants. (d1) 1 dose (d2) ≥ 2 doses (d0) unvaccinated (a) Leukaemia (a1) born in or before 1995 (a2) born after 1995 (b) Acute lymphoblastic leukaemia (b1) born in or before 1995 (b2) born after 1995 | Conclusion: Each dose of Hib vaccination was associated with a significantly reduced risk of childhood leukaemia, whilst the history of DPT, poliomyelitis, and MMR vaccinations did not differ between cases and controls. | N cases vaccinated/ Leukaemia (0 to 14 years) (d1) 176/323 versus 219/409 (d2) 123/323 versus 162/409 (d0) 24/323 versus 28/409 Leukaemia (> 1 years) (d1) 175/308 versus 219/392 (d2) 123/308 versus 162/392 (d0) 10/308 versus 11/392 ‐‐‐‐‐‐‐‐‐‐‐‐‐‐‐‐‐‐‐‐‐‐‐‐‐‐‐‐‐‐‐‐‐‐‐‐‐‐‐ Acute lymphoblastic leukaemia (a) cases = 282; controls = 360 (b1) born in or before 1995 (b2) born after 1995 cases = 270; controls = 346 | OR (95% CI) leukaemia (*) (a) 1.06 (0.69 to 1.63) (a1) 0.94 (0.75 to 1.53) (a2) 0.79 (0.35 to 1.78) Acute lymphoblastic leukaemia(*) (b) 0.87 (0.55 to 1.37) (b1) 0.95 (0.56 to 1.60) (b2) 0.65 (0.24 to 1.72) (*) Adjusted for maternal education and household income |
| Case‐control | Cases: patients with acute lymphoblastic leukaemia aged 0 to 14, diagnosed between 1989 and 1993. Participants who resided in Illinois, Indiana, Iowa, Michigan, Minnesota, New Jersey, Ohio, Pennsylvania, or Wisconsin at the time of diagnosis were eligible for the vaccination component of the study. Controls: selected through random‐digit dialling were individually matched to the cases by age (within 25% of the corresponding case's age at diagnosis), the first 8 digits of the telephone number, and race (African‐American/white/other). | Acute lymphoblastic leukaemia | MMR vaccine: not reported | Conclusion: the MMR vaccine does not alter the risk of subsequent acute lymphoblastic leukaemia. | cases = 395; controls = 394 | OR (95% CI)(*) 1.19 (0.67 to 2.10) (*)conditional logistic regression adjusted for age at censoring, year of birth, sex, race, family income, parental education, and attendance at day care and/or preschool |
| Case‐control | Each case of acute leukaemia incident in 2003 to 2004 in a child aged < 15 years, residing in France at the time of diagnosis and with no previous history of malignancy, was eligible. Theleukaemia cases(n = 726) were recruited directly by investigators assigned to each French paediatric oncology hospital department, with the support of the French National Registry of Childhood Haematopoietic Malignancies. The controls (n = 1681) were randomly selected from the French population using quotas, a priori determined to make the control group representative of all cancer cases in terms of age and gender. | (a)Acute leukaemia (b)Acute lymphoblastic leukaemia (c)Acute myeloblastic leukaemia All the childhood leukaemia cases were confirmed by bone marrow analysis. Children whose mother did not speak French or who had been adopted were not eligible. | MMR vaccine: not reported Note: the study shows measle‐mumps‐rubella vaccination separately, probably because for the study each mother was asked to read out each page of the vaccination record, line by line. | Conclusion: no association between vaccination and the risk of childhood acute leukaemia: acute lymphoblastic leukaemia or acute myeloblastic leukaemia was observed. No relationship between the risk of leukaemia and the type of vaccine, number of doses of each vaccine, total number of injections, total number of vaccine doses, or number of early vaccinations was evidenced. No confounding factor was observed. The study did not show any evidence of a role of vaccination in the aetiology of childhood leukaemia. | N cases vaccinated/ (a) 541/618 versus 1110/1258 (b) 480/554 versus 1110/1258 (c) 50/62 versus 1110/1258 | OR (95% CI) (a) 0.94 (0.70 to 1.26) (b) 0.86 (0.64 to 1.17) (c) 0.56 (0.29 to 1.07) |
| Case‐control | The eligible cases were newly diagnosed with childhood leukaemia (aged 0 to 14 years) 1990 to 1993, and born and resident in New Zealand. Controls (matched 1:1 to cases on age and sex) were selected randomly from the New Zealand‐born and resident childhood population, using national birth records. Each control’s birth was registered in the same quarter of the same year as the matched case. Adopted children were not eligible. | Acute lymphoblastic leukaemia n = 97 matched pairs | MMR vaccine not described. Vaccination histories were supplemented with information from parent‐held ‘Health and Development’ records. | Conclusion: for MMR, no association was found with leukaemia. | N cases vaccinated/ 6/118 versus 15/272 | OR (95% CI) (*) 0.8 (0.26 to 2.42) (*)unconditional logistic regression adjusted for age, sex, child’s social class, child’s ethnic group, mother’s marital status, mother’s education, mother’s home ownership, household crowding, delay from reference date to interview, interview year. |
CI: confidence interval
DPT: diphtheria, pertussis, tetanus vaccine
DT: diphtheria, tetanus vaccine
Hib: Haemophilus influenzae b vaccine
HMO: health maintenance organisation
ICD: International Classification of Diseases
incidence: cases/PT
MMR: measles, mumps, rubella vaccine
MMRV: measles, mumps, rubella, and varicella vaccine
NCCLS: Northern California Childhood Leukemia Study
OR: odds ratio
PT: person‐time
rr: rate ratio (relative incidence, incidence rate ratio)
RR: risk ratio (relative risk)
Td: tetanus, diphtheria vaccine
versusD: Vaccine Safety Datalink
| Study ID and design | Population | Outcome definition | Exposure | Findings | Crude data | Estimate (95% CI) |
|---|---|---|---|---|---|---|
| Cohort study | Residents in the great Gothenburg area (Sweden) born between 1959 and 1990. The study area was the greater Gothenburg area on the Swedish west coast, with 731,592 residents on 31 December 2000. | Multiple sclerosis (probable or definite) and clinically isolated syndromes. Incidence of multiple sclerosis (4 Poser's criteria) and clinically isolated syndrome with onset between 10 and 39 years of age was assessed in birth cohorts immunised within 4 vaccination programmes. The Gothenburg multiple sclerosis register was established from the 1950s. All records are reviewed with the following MS‐related diagnoses, according to the International Classification of Diseases (ICD) 10, 9, and 8: G359; 340; 340.99 multiple sclerosis; G368; G378; G379; 341W; 341.09 demyelinating disorders in the central nervous system; G360; 341A; 341.01 neuromyelitis optica; G369; 341X acute disseminated encephalomyelitis; G373 acute transverse myelitis: H46; 377D; 367.02 optic neuritis; H48,1; 367.03 retrobulbar neuritis. | MMR vaccine: not described. Different vaccination programmes carried out from 1971 with different vaccines (single‐component measle, mumps and rubella vaccine so as with MMR vaccine) having as target population children of different ages. 5 population birth cohorts were selected from the total incidence material: (0) born 1959 to 1961: the pre‐vaccine era; (1) born 1962 to 1966: monovalent rubella vaccine; (2) born 1970 to 1973: only received later dose of the MMR vaccine; (3) born 1974 to 1978: monovalent measles; (4) July 1981 to June 1984: combined MMR vaccine. | Conclusion: there was no significant change in the age‐ and gender‐specific incidence of MS in any of the selected cohorts compared with the incidence in the preceding selected birth cohorts. There was thus no significant change in MS incidence related to the implementation of the rubella vaccination programme in the 12‐year‐old female cohort born in 1962 to 1966 compared with the unvaccinated cohort born in 1959 to 1961. The incidence did not significantly change with all preceding selected cohorts as baseline, neither in the MMR‐vaccinated 12‐year‐old cohort born in 1970 to 1973, nor in the cohort born in 1974 to 1978, half of which were measles vaccinated in the preschool age and the majority MMR vaccinated at 12, nor in the cohort born in July 1981 to June 1984, which were MMR vaccinated at both 18 months and 12 years of age. Restricting the analyses to probable and definite MS cases did not change the results. | Incidence per 100,000 person‐years (‐) (male female) versus (male female) (*) (1) (14.98; 6.97) versus (17.61; 4.28) (*) including both the unvaccinated cohort 1959 to 1961 and the preceding vaccinated birth cohorts selected for this study, in the corresponding age groups | No data available for meta‐analysis |
| Case‐control study | Cases (n = 206): birth years 1959 to 1986, to be resident in the greater Gothenburg area (Sweden), MS onset from age of 10 years onwards, did attend the 6th school grade within study area, availability of CHSH records. Controls (n = 888): matched to cases for year of birth by random selection from the population register. Controls should have attended the 6th school grade within study area, and have available CHSH record. | Multiple sclerosis (probable or definite) and clinically isolated syndromes | MMR vaccine: not described MMR vaccination (vaccination with single‐component vaccines has also been considered). The second analysis was therefore restricted to the subgroup of the MMR vaccinations. The first analysis was restricted to the subgroup "MMR vaccination". 4 disjointed vaccination categories were defined: (0) no MMR vaccination; (1) early MMR vaccination only; (3) late MMR vaccination only; (4) both an early and a late MMR vaccination. Comparisons were made within the group of MMR vaccinations. | Conclusions: no significant association for vaccinated versus unvaccinated. | Cases = 206; controls = 888 | OR (95% CI) 1.13 (0.62 to 2.05) |
| Case‐control study | Case (n = 272): acute disseminated encephalomyelitis. Controls (n = 1096): for each ADEM case, 4 control individuals randomly selected from the same hospital with no history of ADEM were matched to the case according to year of birth (within 1 year), gender, and zip code (a surrogate measure for socioeconomic status) during the same period. The control participants were assigned the same index date as their matched case (symptom onset date). Controls were patients referred for headache (except trigeminal neuralgia), migraine, vascular, or other diseases which were thought not to modify the probability of vaccination. Patients with chronic severe neurological diseases or autoimmune diseases were excluded. | Acute disseminated encephalomyelitis: immune‐mediated From the Hospital Information Systems first mention of International Classification of Diseases, Tenth Revision (ICD‐10), diagnostic codes (G04.001, G04.002, G04.051, G04.903, and G04.912) for ADEM from 1 January 2011 to 31 December 2015, for individuals of any age. | MMR vaccine: not described | Conclusions: findings from the present study do not demonstrate an association of vaccines with an increased risk of ADEM and its recurrence among either paediatric (< 18 years) or adult (≥ 18 years) individuals within the 180 days after vaccinations. | 11/272 versus 36/1096 | OR (95% CI) adjusted estimate 1.03 (0.68 to 3.75) |
ADEM: acute disseminated encephalomyelitis
CI: confidence interval
CHSH: child health and school health records
CIS: clinically isolated syndromes
HMO: health maintenance organisation
incidence: cases/PT
MMR: measles, mumps, rubella vaccine
MMRV: measles, mumps, rubella, and varicella vaccine
MS: multiple sclerosis
OR: odds ratio
PT: person‐time
rr: rate ratio (relative incidence, incidence rate ratio)
RR: risk ratio (relative risk)
VSD: Vaccine Safety Datalink
| Study ID and design | Population | Outcome definition | Exposure | Findings | Crude data | Estimate (95% CI) |
|---|---|---|---|---|---|---|
| Self‐controlled case series | Children hospitalised with gait disturbance between April 1995 and June 2001 (n = 127, age 12 to 24 months). Children with gait disturbance resulting from general practice visit General Practice Research Database. (GPRD archive), born between 1988 and 1997 (n = 1398, age 12 to 24 months) | (a) Hospitalisation for gait disturbance Review of hospital computerised records (April 1995 to June 2001, children aged 12 to 24 months) with ICD‐10 diagnoses related to acute gait disorder (G111, G112, G25, R26, R27, R29, H55, and F984). Cases were grouped into 5 categories, as follows: (1) presumptive viral/postviral ataxia (clinical history of ataxia and evidence of encephalomyelitis or cerebellitis with lymphocytosis in CSF or encephalographic changes); (2) probable postviral ataxia (history consistent with ataxia but CSF/other investigations inconclusive or not done and no other cause identified); (3) probably not postviral gait disturbance (vague symptoms not suggestive of cerebellar ataxia, e.g. unsteady gait associated with constipation or gastroenteritis); (4) non‐ataxic, non‐viral gait disturbance (including limp after trauma, septic bone or joint disease, unsteadiness following drug ingestion); (5) transient synovitis/‘‘irritable hip’’ (a transient condition described following viral illnesses and with no long‐term sequelae) ‐‐‐‐‐‐‐‐‐‐‐‐‐‐‐‐ (b) GP visits for gait disturbance For the analysis of gait disorders presenting in general practice, information on all children born from 1988 to 1997 with at least 2 years of continuous follow‐up from birth in a GPRD practice deemed as supplying data of research standard was obtained from the Office for National Statistics. Read and OXMIS codes that indicated a consultation for possible gait disturbance in children aged 12 to 24 months were identified by mapping to ICD‐9 codes and by searching on the following keywords: ataxia, gait, co‐ordination, mobility, movement. Read/OXMIS descriptive diagnoses cover a wide range, so were grouped into 6 categories for analysis: (A) ataxia (including cerebellar ataxia and ataxic gait); (B) unsteady/veering/shuffling gait; (C) gait abnormality ‐ unspecified; (D) limp/limping gait; (E) poor mobility; (F) abnormal /involuntary movements. | MMR vaccine: not reported (a) Risk period: after immunisation (a1) 0 to 30 days (a2) 31 to 60 days (a3) 0 to 60 days (b) Risk period after immunisation (b1) 0 to 5 days (b2) 6 to 30 days (b3) 31 to 60 days (b4) 6 to 60 days | Conclusion: this study provides no evidence that MMR vaccine causes acute ataxia or other gait disturbance and suggests that the cases observed were chance occurrences, reflecting background incidence. The increased incidence of consultation for any gait disturbance 0 to 5 days after MMR vaccination was attributable to an excess in categories of gait disturbance (B, unsteady; and C, unspecified) that was caused by a clear excess of consultations on the day that MMR was given. It is biologically implausible that any specific MMR effect would be manifest on the day of vaccination since the viraemia induced by the vaccine, which might produce symptoms, does not start until the end of the first week. | Hospitalisation for gait disturbance any (categories 2, 3, 5) n = 62 (a1) cases = 3 (a2) cases = 1 (a3) cases = 4 GP visits for gait disturbance All cases ((A) to (F)) (b1) cases = 31 (b2) cases = 69 (b3) cases = 102 (b4) cases = 171 | rr (95% CI) (*) (a1) 0.83 (0.24 to 2.84) (a2) 0.20 (0.03 to 1.47) (a3) 0.46 (0.16 to 1.35) ‐‐‐‐‐‐‐‐‐‐‐‐‐‐‐‐‐‐‐‐‐‐‐‐‐‐‐‐‐‐ (b1) 1.88 (1.30 to 2.72) (b2) 0.90 (0.70 to 1.17) (b3) 0.95 (0.77 to 1.19) (b4) 0.93 (0.78 to 1.12) (*) Poisson regression |
CI: confidence interval
CSF: cerebrospinal fluid
GP: general practitioner
GPRD: General Practice Research Database
ICD: International Classification of Diseases
incidence: cases/PT
MMR: measles, mumps, rubella vaccine
MMRV: measles, mumps, rubella, and varicella vaccine
OXMIS: Oxford Medical Information Systems
PT: person‐time
rr: rate ratio (relative incidence, incidence rate ratio)
| Study ID and design | Population | Outcome definition | Exposure | Findings | Crude data | Estimate (95% CI) |
|---|---|---|---|---|---|---|
| Self‐controlled case series | Infants aged 12 to 23 months hospitalised for viral or bacterial infection between April 1995 and May 2005 identified from hospital admission records (n = 2025 accounting for 2077 admissions) | Lobar pneumonia ICD‐9 codes: 481 ICD‐10 codes: J18.1 Invasive bacterial infections ICD‐9 codes: 036, 038, 320, 711.0, 730.0 ICD‐10 codes: A39, A40, A41, G00, M00, M86, J13X Encephalitis/meningitis ICD‐9 codes: not specified ICD‐10 codes: A85, A86, A87, A88, A89 Herpes ICD‐9 codes: not specified ICD‐10 codes: B00 Pneumonia ICD‐9 codes: not specified ICD‐10 codes: J12 Varicella zoster ICD‐9 codes: not specified ICD‐10 codes: B01, B02 Miscellaneous viral infections ICD‐9 codes: not specified ICD‐10 codes: B08, B09, B15, B17, B25, B27, B34 Review of computerised hospital admission records from North, East, and South London, Essex, East Anglia, Sussex, and Kent using ICD‐9 or ICD‐10 codes | MMR vaccine: not reported Excluded period from the background from −14 to −1 days before immunisation Risk period after immunisation (a1) 0 to 30 days (a2) 31 to 60 days (a3) 61 to 90 days (a4) 0 to 90 days | Conclusion: the study confirms that the MMR vaccine does not increase the risk of invasive bacterial or viral infection in the 90 days after the vaccination and does not support the hypothesis that there is an induced immune deficiency due to overload from multi‐antigen vaccines. | Total cases Lobar pneumonia (a1) cases = 57 Invasive bacterial infections (a1) cases = 30 Encephalitis/meningitis (a1) cases = 1 Herpes (a1) cases = 16 Pneumonia (a1) cases = 0 Varicella zoster (a1) cases = 17 Miscellaneous viral infections (a1) cases = 12 | rr (95% CI) (*) Lobar pneumonia (a1) 0.65 (0.48 to 0.86) Invasive bacterial infections (a1) 0.75 (0.51 to 1.12) Encephalitis/meningitis (a1) 0.54 (0.06 to 4.83) Herpes (a1) 1.00 (0.57 to 1.74) Pneumonia (a1) 0 (‐ to ‐) Varicella zoster (a1) 0.58 (0.34 to 0.99) Miscellaneous viral infections (a1) 0.71 (0.37 to1.37) (*)Poisson regression |
| Self‐controlled case series | Children aged 12 to 23 months admitted to hospital between April 1991 and March 1995 in selected districts in the Thames region of southern England. Total of 387 admissions with 1 or more of the bacterial infection codes and with a linked MMR vaccination record were identified; occurred in 387 children (169 in 165 females, and 226 in 222 males); 116 had a diagnosis of invasive bacterial infection and 279 had lobar pneumonia. | Lobar pneumonia Invasive bacterial infections Cases were identified from computerised discharge records using ICD‐9 codes 036 (meningococcal infection), 038 (septicaemia), 320 (bacterial meningitis), 711.0 (pyogenic arthritis), 730.0 (acute osteomyelitis), and 481 (lobar (pneumococcal) pneumonia). Hospital records were linked with computerised district immunisation records by sex, date of birth, and post code. Cases in children with additional diagnostic codes indicating an underlying disorder predisposing to bacterial infection, such as immunosuppression, malignancy, cystic fibrosis, congenital heart defect, or a cerebrospinal fluid shunt, were excluded. | MMR vaccine: not described Excluded period from the background from −14 to −1 days before immunisation Risk period after immunisation (a1) 0 to 30 days (a2) 31 to 60 days (a3) 61 to 90 days (a4) 0 to 90 days | Conclusion: combined measles, mumps, and rubella (MMR) vaccine did not increase the risk of hospitalisation with invasive bacterial infection in the 3 months after vaccination; rather there was a protective effect. These results provide no support for the concept of 'immunological overload' induced by multiple‐antigen vaccinations, nor calls for single‐antigen vaccines. | Total cases Lobar pneumonia (a1) cases = 23 Invasive bacterial infections (a1) cases = 12 Both codes (a1) cases = 35 | rr (95% CI) (*) Lobar pneumonia (a1) 0.77 (0.48 to 1.23) Invasive bacterial infections (a1) 1.00 (0.52 to 1.94) Both codes (a1) 0.81 (0.56 to 1.19) (*)Poisson regression |
CI: confidence interval
CSF: cerebrospinal fluid
GP: general practitioner
GPRD: General Practice Research Database
ICD: International Classification of Diseases
incidence: cases/PT
MMR: measles, mumps, rubella vaccine
MMRV: measles, mumps, rubella, and varicella vaccine
PT: person‐time
rr: rate ratio (relative incidence, incidence rate ratio)
Excluded studies
We excluded 27 studies of the 101 papers identified and retrieved for this 2019 update. In addition, of 16 studies awaiting classification (see Characteristics of studies awaiting classification) in the previous update (Demicheli 2012), we excluded four studies because they were not comparative; they considered vaccines other than MMR; or they did not present original data (for details see Characteristics of excluded studies). We assessed a further seven studies as awaiting classification and five studies as ongoing because the papers were lacking in some important details (see Characteristics of studies awaiting classification and Characteristics of ongoing studies).
Risk of bias in included studies
Of the 138 included studies, we assessed 53 (38%) as at low risk of bias, 55 (40%) as at unclear risk of bias, and 30 (22%) as at high risk of bias (Figure 3). The quality assessment of each individual study and the description of the quality criteria adopted are shown in Figure 4 and Appendix 5, respectively. The risk of bias by study design and by publication year are shown in Table 29 and Table 30, respectively.

Risk of bias graph: review authors' judgements about each risk of bias item presented as percentages across all included studies.

Risk of bias summary: review authors' judgements about each risk of bias item for each included study.
| Study design | Low risk of bias | Unclear risk of bias | High risk of bias | |||||
|---|---|---|---|---|---|---|---|---|
| n | Row % | n | Row % | n | Row % | n total | ||
| Effectiveness | RCT/CCT | 3 | 100% | 3 | ||||
| Case‐control | 8 | 57.1% | 4 | 28.6% | 2 | 14.3% | 14 | |
| Prospective/retrospective cohort | 4 | 13.0% | 21 | 67.7% | 6 | 19.4% | 31 | |
| Case‐only ecological method | 2 | 66.7% | 1 | 33.3% | 3 | |||
| Subtotal | 15 | 29.4% | 27 | 53.0% | 9 | 17.6% | 51 | |
| Study design | Low risk of bias | Unclear risk of bias | High risk of bias | |||||
| n | Row % | n | Row % | n | Row % | n total | ||
| Safety | RCT/CCT | 2 | 28.6% | 2 | 28.6% | 3 | 42.9% | 7 |
| Case‐control | 8 | 38.1% | 11 | 52.4% | 2 | 9.5% | 21 | |
| Prospective/retrospective cohort | 14 | 43.8% | 4 | 12.5% | 14 | 43.8% | 32 | |
| Self‐controlled case series/person‐time cohort | 11 | 68.8% | 5 | 31.2% | 16 | |||
| Case cross‐over | 1 | 33.3% | 2 | 66.7% | 3 | |||
| Case‐only ecological method | 2 | 25.0% | 4 | 50.0% | 2 | 25.0% | 8 | |
| Subtotal | 38 | 43.7% | 28 | 32.2% | 21 | 24.1% | 87 | |
| Total (all studies) | 53 | 38.4% | 55 | 39.9% | 30 | 21.7% | 138 | |
| Study design | Low risk of bias | Unclear risk of bias | High risk of bias | |||||
| n | Row % | n | Row % | n | Row % | n total | ||
| Safety studies | Case‐control | 8 | 38% | 11 | 52% | 2 | 10% | 21 |
| Prospective/retrospective cohort | 14 | 64% | 4 | 18% | 4 | 18% | 22 | |
| Self‐controlled case series/person‐time cohort | 11 | 69% | 5 | 31% | 16 | |||
| Case cross‐over | 1 | 33% | 2 | 67% | 3 | |||
| Case‐only ecological method | 2 | 25% | 4 | 50% | 2 | 25% | 8 | |
| Total | 36 | 51% | 26 | 37% | 8 | 11% | 70 | |
CCT: controlled clinical trial
RCT: randomised controlled trial
| All studies included | Low risk of bias | Unclear risk of bias | High risk of bias | Total | |||
|---|---|---|---|---|---|---|---|
| Publication year | N | Row % | N | Row % | N | Row % | |
| 1971 to 1980 | 0 | 0% | 1 | 20% | 4 | 80% | 5 |
| 1981 to 1990 | 2 | 29% | 0 | 0% | 5 | 71% | 7 |
| 1991 to 2000 | 3 | 20% | 6 | 40% | 5 | 40% | 15 |
| 2001 to 2010 | 21 | 39% | 23 | 43% | 10 | 18% | 54 |
| 2011 to 2019 | 27 | 47% | 24 | 42% | 6 | 11% | 57 |
| Total | 53 | 36% | 54 | 42% | 30 | 22% | 138 |
| Only safety studies | Low risk of bias | Unclear risk of bias | High risk of bias | Total | |||
| Publication year | N | Row % | N | Row % | N | Row % | |
| 1971 to 1980 | 1 | 20% | 4 | 80% | 5 | ||
| 1981 to 1990 | 2 | 29% | 5 | 71% | 7 | ||
| 1991 to 2000 | 2 | 20% | 4 | 40% | 4 | 40% | 10 |
| 2001 to 2010 | 17 | 40% | 17 | 41% | 8 | 19% | 43 |
| 2011 to 2019 | 17 | 74% | 5 | 22% | 1 | 4% | 22 |
| Total | 38 | 39% | 27 | 37% | 22 | 24% | 87 |
Studies evaluating vaccine effectiveness
Of the 51 studies that assessed the effectiveness of MMR/MMRV vaccines, we assessed 15 (30%) as at low risk of bias, 27 (53%) as at unclear risk of bias, and 9 (17%) as at high risk of bias. These last studies were characterised by poor methodological quality due to poor reporting or missing information about comparability between exposed or non‐exposed groups, and the composition of MMR vaccine is sometimes not reported. See Table 29.
Studies evaluating vaccine safety
Of 87 included studies, we assessed 38 (44%) as at low risk of bias, 28 (32%) as at unclear risk of bias, and 21 (24%) as at high risk of bias. See Table 29.
-
Short‐term side effects: 17 studies (Table 10 and Table 11):
-
low risk of bias: 2 studies (ab‐Lerman 1981; ab‐Peltola 1986);
-
unclear risk of bias: 2 studies (ab‐Edees 1991; ab‐Schwarz 1975);
-
high risk of bias: 13 studies (ab‐Bloom 1975; ab‐Ceyhan 2001; ab‐Freeman 1993; cb‐Beck 1989; cb‐Benjamin 1992; cb‐Dunlop 1989; cb‐Makino 1990; cb‐Miller 1989; cb‐Robertson 1988; cb‐Sharma 2010; cb‐Stokes 1971; cb‐Swartz 1974; cb‐Weibel 1980).
-
-
Encephalitis or encephalopathy: 3 studies (Table 12):
-
low risk of bias: 1 study (db‐Ward 2007);
-
unclear risk of bias: 2 studies (bb‐Ray 2006; db‐Makela 2002).
-
-
Aseptic meningitis: 10 studies (Table 13):
-
low risk of bias: 2 studies (db‐Dourado 2000; eb‐Ki 2003);
-
unclear risk of bias: 8 studies (bb‐Black 1997; db‐Farrington 1995; db‐Makela 2002; db‐Miller 2007; db‐Perez‐Vilar 2018; eb‐Park 2004; gb‐da Cunha 2002; gb‐da Silveira 2002).
-
-
Seizure ‐ febrile/afebrile: 8 studies (Table 14):
-
low risk of bias: 5 studies (cb‐Vestergaard 2004; db‐Macartney 2017; db‐MacDonald 2014; db‐McClure 2019; db‐Ward 2007);
-
unclear risk of bias: 3 studies (cb‐Barlow 2001; db‐Farrington 1995; db‐Miller 2007).
-
-
MMRV versus MMR/MMR+V ‐ febrile seizures: 7 studies (Table 15):
-
low risk of bias: 7 studies (cb‐Gavrielov‐Yusim 2014; cb‐Jacobsen 2009; cb‐Klein 2010; cb‐Klein 2012; cb‐Klein 2017; cb‐Rowhani‐Rahbar 2013; cb‐Schink 2014).
-
-
Autism spectrum disorders: 13 studies (Table 16):
-
low risk of bias: 8 studies (bb‐De Stefano 2004; bb‐Smeeth 2004; cb‐Hviid 2019; cb‐Jain 2015; cb‐Madsen 2002; db‐Taylor 1999; gb‐Fombonne 2006; gb‐Honda 2005);
-
unclear risk of bias: 3 studies (bb‐Mrozek‐Budzyn 2010; bb‐Uno 2012; db‐Makela 2002);
-
high risk of bias: 2 studies (cb‐Uchiyama 2007; gb‐Fombonne 2001).
-
-
Inflammatory bowel disease: 6 studies (Table 17):
-
low risk of bias: 1 study (bb‐Shaw 2015);
-
unclear risk of bias: 4 studies (bb‐Baron 2005; bb‐Davis 2001; gb‐Seagroatt 2005; gb‐Taylor 2002);
-
high risk of bias: 1 study (bb‐Vcev 2015).
-
-
Cognitive delay, developmental delay: 1 study (Table 18):
-
unclear risk of bias (cb‐Mrozek‐Budzyn 2013).
-
-
Idiopathic thrombocytopenic purpura: 9 studies (Table 19):
-
low risk of bias: 3 studies (db‐Andrews 2012; db‐France 2008; db‐O'Leary 2012);
-
unclear risk of bias: 5 studies (bb‐Black 2003; bb‐Bertuola 2010; db‐Farrington 1995; db‐Perez‐Vilar 2018; eb‐Lafaurie 2018);
-
high risk of bias: 1 study (gb‐Jonville‐Bera 1996).
-
-
Henoch‐Schönlein purpura: 1 study (Table 20):
-
unclear risk of bias (bb‐Da Dalt 2016).
-
-
Type 1 diabetes: 2 studies (Table 21):
-
low risk of bias (cb‐Beyerlein 2017; cb‐Hviid 2004).
-
-
Asthma: 5 studies (Table 22):
-
low risk of bias: 1 study (cb‐Timmermann 2015);
-
unclear risk of bias: 2 studies (cb‐DeStefano 2002; cb‐Hviid 2008);
-
high risk of bias: 2 studies (cb‐Benke 2004; cb‐McKeever 2004).
-
-
Dermatitis or eczema: 2 studies (Table 23):
-
low risk of bias: 1 study (cb‐Timmermann 2015);
-
high risk of bias: 1 study (cb‐McKeever 2004).
-
-
Hay fever, rhinoconjunctivitis, hypersensitivity/allergy: 3 studies (Table 24):
-
low risk of bias (bb‐Bremner 2005; bb‐Bremner 2007; cb‐Timmermann 2015).
-
-
Acute leukaemia: 4 studies (Table 25):
-
low risk of bias: 2 studies (bb‐Ma 2005; bb‐Mallol‐Mesnard 2007);
-
unclear risk of bias: 2 studies (bb‐Dockerty 1999; bb‐Groves 1999).
-
-
Demyelinating diseases, multiple sclerosis, ADEM: 3 studies (Table 26):
-
low risk of bias: 1 study (bb‐Chen 2018);
-
high risk of bias: 2 studies (bb‐Ahlgren 2009; cb‐Ahlgren 2009).
-
-
Gait disturbances 1 study (Table 27):
-
low risk of bias (db‐Miller 2005).
-
-
Bacterial or viral infections: 2 studies (Table 28):
-
low risk of bias (db‐Stowe 2009)
-
unclear risk of bias (db‐Miller 2003).
-
Allocation
Of 10 RCTs/CCTs, five studies reported adequate concealment (aa‐Henry 2018; aa‐Povey 2019; aa‐Prymula 2014; ab‐Lerman 1981; ab‐Peltola 1986). See Figure 4.
Blinding
Of 10 RCTs/CCTs assessing effectiveness and/or short‐term side effects, six trials were double‐blind (aa‐Henry 2018; aa‐Povey 2019; aa‐Prymula 2014; ab‐Lerman 1981; ab‐Peltola 1986; ab‐Schwarz 1975); one was single‐blind (ab‐Edees 1991); two were not blinded (ab‐Bloom 1975; ab‐Ceyhan 2001); and in one study blinding was not reported (ab‐Freeman 1993).
Incomplete outcome data
In two trials (ab‐Ceyhan 2001; ab‐Lerman 1981), the selection of paediatric practices involved in the recruitment of children was not explained, and the number and assessment of non‐responders were not reported. Similarly in ab‐Edees 1991 there were few details on the refusal and response rate during the recruitment phase, and demographic information from the two UK areas where the trial was conducted was lacking. We considered two trials to be at unclear risk of detection bias affecting the outcomes (ab‐Ceyhan 2001; ab‐Edees 1991).
Selective reporting
In the two trials we assessed as being at high risk of reporting bias, adverse effects were reported for only 60% and 39% of participants, respectively (ab‐Bloom 1975; ab‐Schwarz 1975). We evaluated the only included cluster‐RCT as at high risk of reporting bias (ab‐Freeman 1993). The number of completed weekly diaries varied over the eight‐week study period, with no indication of whether the losses occurred pre‐ or postvaccination. Furthermore, there was an overall attrition rate of 33%.
Other potential sources of bias
Studies evaluating effectiveness
Fifteen (45%) of 33 cohort studies on effectiveness and 8 (57%) of 14 case‐control studies did not report adequate MMR or MMRV vaccine descriptions.
Studies evaluating safety ‐ harms
The association between MMR/MMRV and severe harms (excluding short‐term side effects) was investigated in 70 studies (22 cohort studies, 22 CCS, 13 SCCS, 3 PTC, 3 CCO, 8 COEM). Of 70 studies, we assessed 32 (46%) as at low risk of bias; 28 (40%) as at unclear risk of bias; and 10 (14%) as at high risk of bias. See Table 29.
Several cohort studies used matching procedures to ensure comparability or adopted a multivariate model. When only a few confounders were used to ensure comparability between cohorts, we assigned high risk of bias.
The study by db‐Makela 2002 was weakened by the loss of 14% of the original birth cohorts and the effects of the rather long‐term follow‐up. The impact of either of these factors in terms of confounders is open to debate. It should be taken into account that autism does not often involve hospitalisation, and data about outpatient visits were not available. Limited errors could have been introduced by using population data from a previous census (as estimation of the denominator) in db‐Dourado 2000. Therefore, the number of doses administered (as opposed to supplied) was used to compute the risk of aseptic meningitis in the mass vaccination programme. In eb‐Park 2004, there was an unclear likelihood of selection bias due to missing participants and records (up to 27%). In bb‐Black 1997, there was an unclear likelihood of selection bias due to missing participants and their records (up to 27%) but the study and its methods were well reported. The exclusive use of discharge diagnoses for identification of cases in db‐Miller 2007 could have introduced a noteworthy selection bias. Estimates from cb‐McKeever 2004 (although significant) were strongly affected by ascertainment bias: children who were not taken to the doctor were less likely to be vaccinated and to have fewer opportunities for diagnoses of allergic diseases to be recorded. Lack of clarity over the vaccine exposure status of the controls made the results of the bb‐Black 2003 study difficult to interpret. In bb‐Bertuola 2010, cases and controls were apparently not matched. In bb‐Ma 2005, refusal to participate in the study or inability to locate participants and controls could have introduced an unclear risk of selection bias. Exclusion of participants without completed questionnaires and of those who did not attend the sixth grade at school within the study area could have introduced a relevant selection bias in the bb‐Ahlgren 2009 case‐control study. Assessment of pervasive developmental disorders cases in gb‐Fombonne 2006 was made on the basis of administrative codes only: diagnosis could have been imprecise and did not enable us to consider pervasive developmental disorders subtypes or regression. In gb‐Fombonne 2001, the number and possible impact of bias was so high that interpretation of the results was difficult. The cohort study of cb‐Uchiyama 2007 was potentially affected by a different type of bias, considering that the participants were from a private clinic and that definitions of applied autism spectrum disorders diagnosis and methods used for disorders regression ascertainment were not clearly reported. The long follow‐up for autism could be due to the lack of a properly constructed causal hypothesis. The study of db‐Taylor 1999 demonstrated the difficulties of drawing inferences in the absence of a non‐exposed population or a clearly defined causal hypothesis.
Effects of interventions
See: Summary of findings 1 Effectiveness against measles; Summary of findings 2 Effectiveness against mumps; Summary of findings 3 Effectiveness against rubella; Summary of findings 4 Effectiveness against varicella; Summary of findings 5 Safety: short‐term side effects (local or systemic reactions); Summary of findings 6 Safety: encephalitis or encephalopathy; Summary of findings 7 Safety: aseptic meningitis; Summary of findings 8 Safety: seizures (febrile/afebrile); Summary of findings 9 Safety: autistic spectrum disorders; Summary of findings 10 Safety: inflammatory bowel disease; Summary of findings 11 Safety: cognitive delay ‐ developmental delay; Summary of findings 12 Safety: idiopathic thrombocytopenic purpura; Summary of findings 13 Safety: Henoch‐Schönlein purpura; Summary of findings 14 Safety: type 1 diabetes; Summary of findings 15 Safety: asthma; Summary of findings 16 Safety: eczema ‐ dermatitis; Summary of findings 17 Safety: hay fever, rhinoconjunctivitis, hypersensitivity/allergy; Summary of findings 18 Safety: acute leukaemia; Summary of findings 19 Safety: demyelinating diseases ‐ multiple sclerosis ‐ acute disseminated encephalomyelitis; Summary of findings 20 Safety: gait disturbances; Summary of findings 21 Safety: bacterial or viral infections, immune overload
1. Effectiveness against measles
Seventeen studies included effectiveness data against measles: 14 cohort studies (ca‐Arciuolo 2017; ca‐Arenz 2005; ca‐Barrabeig 2011a; ca‐Barrabeig 2011b; ca‐Bhuniya 2013; ca‐Choe 2017; ca‐Hales 2016; ca‐La Torre 2017; ca‐Marin 2006; ca‐Marolla 1998; ca‐Musa 2018; ca‐Ong 2007; ca‐Wichmann 2007; ca‐Woudenberg 2017), and 3 case‐control studies (ba‐Defay 2013; ba‐Hungerford 2014; ba‐Jick 2010).
The studies are described in Table 1 and Table 2, and the summary of findings is presented in summary of findings Table 1.
Evidence from cohort studies
Comparison 1.1 (Analysis 1.1) reports on vaccine effectiveness (VE) from eight cohort studies (ca‐Barrabeig 2011b; ca‐Bhuniya 2013; ca‐Choe 2017; ca‐La Torre 2017; ca‐Marolla 1998; ca‐Musa 2018; ca‐Ong 2007; ca‐Wichmann 2007). The VE = (1 − RR) x 100 after one dose is 95% (95% confidence interval (CI) 87% to 98%) and after two doses 96% (95% CI 72% to 99%). Heterogeneity was 88% and 93% for both subgroups, respectively. After exclusion of the two studies at high risk of bias (ca‐Bhuniya 2013ca‐Choe 2017), heterogeneity was reduced to 32% for the first group and 0% for the second. Overall VE for one dose was 96% (95% CI 93% to 98%) and for two doses 98% (95% CI 96% to 99%).
One cohort study evaluated the effectiveness of MMR vaccination in preventing clinical cases of measles in children aged from 18 to 90 months from several local health agencies in Rome, Italy (N = 2745) (ca‐Marolla 1998). Vaccination was performed with three different commercial MMR vaccines, two containing both Schwarz strain (Pluserix and Morupar) and one prepared with Edmonston‐Zagreb strain (Triviraten). One other cohort study investigated the effectiveness of MMR immunisation (composition not reported by study authors) in children aged between 8 and 14 years in preventing laboratory‐confirmed measles cases (ca‐Ong 2007). Two laboratory‐confirmed measles cases occurred amongst the vaccinated children (one dose), whereas seven were observed in the unvaccinated group.
Comparison 1.2 (Analysis 1.2) reports on effectiveness of MMR vaccination in preventing secondary measles cases from three cohort studies (ca‐Arenz 2005; ca‐Hales 2016; ca‐Marin 2006). 'Household contacts' was defined as a person residing in the household during the primary case's infection period. A contact was considered vaccinated (one dose or two doses) if there was a documented record of measles vaccination before the rash onset of the primary case. In ca‐Hales 2016 and ca‐Marin 2006, the VE after one dose was 81% (95% CI 11% to 96%), after two doses 85% (95% CI 25% to 97%), and after three doses 96% (95% CI 77% to 99%). Heterogeneity was 61%, 65%, and 0% for each subgroup, respectively. After excluding one study at high risk of bias (ca‐Hales 2016), heterogeneity was reduced to less than 30% for each subgroup, and VE after one dose was 91% (95% CI 73% to 97%), after two doses 94% (95% CI 81% to 98%), and after three doses 96% (95% CI 69% to 99%). Vaccination with one or two doses of MMR vaccine (composition unknown) was highly effective in preventing secondary cases amongst contacts.
Comparison 1.3 (Analysis 1.3) reports on effectiveness of MMR vaccination for postexposure prophylaxis from two cohort studies (ca‐Arciuolo 2017; ca‐Barrabeig 2011a). Where candidates for the intervention were susceptible contacts who had not received either measles‐containing vaccine or had not suffered measles, the VE was 74% (95% CI 50% to 86%).
Evidence from case‐control studies
Comparison 1.4 (Analysis 1.4) reports on vaccine effectiveness from two case‐control studies (ba‐Hungerford 2014; ba‐Jick 2010). One study reported insufficient data for quantitative synthesis (ba‐Defay 2013). The VE after one dose was 51% (95% CI 42% to 59%) and after two doses 61% (95% CI 42% to 74%) (ba‐Jick 2010). One case‐control study was conducted during a measles outbreak amongst children and young previously vaccinated children (ba‐Hungerford 2014). The VE amongst "vaccinate appropriately by age" versus "incomplete or partially vaccinated" was 95% (95% CI 60% to 99%).
2. Effectiveness against mumps
Twenty‐one studies reported effectiveness data against mumps: 14 cohort studies, ca‐Chamot 1998; ca‐Compés‐Dea 2014; ca‐Greenland 2012; ca‐La Torre 2017; ca‐Livingston 2013; ca‐Lopez Hernandez 2000; ca‐Ma 2018; ca‐Marolla 1998; ca‐Nelson 2013; ca‐Ogbuanu 2012; ca‐Ong 2005; ca‐Schlegel 1999; ca‐Snijders 2012; ca‐Takla 2014, and 7 case‐control studies (ba‐Castilla 2009; ba‐Fu 2013; ba‐Giovanetti 2002; ba‐Goncalves 1998; ba‐Harling 2005; ba‐Kim 2012; ba‐Mackenzie 2006). The studies are described Table 3 and Table 4, and the summary of findings are presented in summary of findings Table 2.
All cohort studies present estimates based on binary data as presented in their papers. Only two cohort studies reported binary data and adjusted estimates by multivariate models (ca‐La Torre 2017; ca‐Snijders 2012). The study by ca‐La Torre 2017 reported a combined (measles‐mumps) adjusted (age and gender) estimate, but binary data were reported separately, and we have included these data in a quantitative synthesis. In ca‐Snijders 2012, VE computed from binary data was 95% for one dose and 96% for two doses, when vaccine effectiveness adjusted estimates were 92% (one dose) and 93% (two doses). We used the method described in Di Pietrantonj 2006 to convert the adjusted effect estimates to adjusted binary data.
Evidence from cohort studies
Comparison 2.1 (Analysis 2.1) reports vaccine effectiveness containing Jeryl Lynn strain from nine cohort studies (ca‐Chamot 1998; ca‐Greenland 2012; ca‐La Torre 2017; ca‐Livingston 2013; ca‐Ma 2018; ca‐Ong 2005; ca‐Schlegel 1999; ca‐Snijders 2012; ca‐Takla 2014). Occurrence of clinical mumps cases during outbreaks was retrospectively evaluated by comparing the incidence of disease amongst children who had been immunised with MMR vaccines containing Jeryl Lynn strain. Three cohort studies evaluated the effectiveness of MMR vaccination in household contacts during an outbreak (ca‐Chamot 1998; ca‐Livingston 2013; ca‐Snijders 2012). One cohort study was conducted during a mumps outbreak amongst university students previously vaccinated (once or twice) (ca‐Greenland 2012). Four studies did not specify numbers of doses (ca‐Chamot 1998; ca‐Livingston 2013; ca‐Ong 2005; ca‐Schlegel 1999). The VE after one dose was 72% (95% CI 38% to 87%) and after two doses 86% (95% CI 73% to 93%). The VE from studies that did not specify numbers of doses was 77% (95% CI 65% to 86%). The VE of MMR vaccination in preventing secondary mumps cases (in household contacts) was 74% (95% CI 51% to 87%).
We excluded ca‐Takla 2014 due to its small sample size, which made this study susceptible to bias and low statistical power. We also excluded ca‐Greenland 2012 due to its particular population. The VE after one dose was 79% (95% CI 52% to 81%) and after two doses 83% (95% CI 62% to 93%).
Comparison 2.2 (Analysis 2.2) reports vaccine effectiveness containing Urabe strain from four cohort studies (ca‐Chamot 1998; ca‐Marolla 1998; ca‐Ong 2005; ca‐Schlegel 1999). In ca‐Marolla 1998, two different MMR vaccines containing Urabe strain were evaluated (Pluserix and Morupar). To avoid data duplication, half of the control arm (206/646) were assigned to the Morupar arm (28/747 versus 103/323) and half to the Pluserix arm (38/329 versus 103/323). None of the studies specified numbers of doses administered. The cohort study ca‐Ong 2005 was carried out in childcare centres and primary schools in Singapore (children aged 5 to 12 years), and the cohort study by ca‐Schlegel 1999 was performed amongst children (aged 5 to 13 years) from a small rural village in Switzerland. The VE (at least one dose) was 77% (95% CI 56% to 88%). The high level of heterogeneity seemed to be due to ca‐Marolla 1998, which showed a significant difference in vaccine effectiveness amongst Pluserix and Morupar arms, and partially due to the ca‐Schlegel 1999 cohort study.
Comparison 2.3 (Analysis 2.3) reports vaccine effectiveness containing Rubini strain from four cohort studies (ca‐Chamot 1998; ca‐Marolla 1998; ca‐Ong 2005; ca‐Schlegel 1999). None of the studies specified numbers of doses administered. Overall, the studies did not show statistical evidence of vaccine (containing Rubini strain) effectiveness. Only ca‐Marolla 1998 showed statistical evidence in favour of vaccine effectiveness 43% (95% CI 33% to 52%). However, ca‐Ong 2005 showed statistical evidence in favour of the control ‐55% (95% CI ‐122% to ‐9%). The other two studies did not show statistical evidence for vaccine effectiveness (ca‐Chamot 1998; ca‐Schlegel 1999).
Comparison 2.4 (Analysis 2.4) reports vaccine effectiveness from two cohort studies where mumps strain is not reported or any strain (when in the same study population different participants are vaccinated with different MMR vaccines, each containing different mumps strain, but results by mumps strain were not reported) (ca‐Compés‐Dea 2014; ca‐Lopez Hernandez 2000). The cohort study by ca‐Lopez Hernandez 2000 estimated MMR vaccine effectiveness in preventing clinical mumps in male children aged between 3 and 15 years, attending a scholastic institute in Granada, Spain during an outbreak. Occurrence of clinical mumps cases was compared between children who received at least one dose of MMR vaccine (investigators were not able to determine the vaccine composition), and those who did not receive the MMR vaccine. The cohort study by ca‐Compés‐Dea 2014 was performed during an outbreak of mumps that occurred in high school students aged 16 to 17 years in December 2011. The study compared occurrence of clinical mumps between students previously vaccinated with at least one dose of MMR vaccine and those who did not receive the MMR vaccine (vaccine containing different mumps strains were used: Jeryl Lynn RIT‐4385 and Rubini). The overall VE was 48% (95% CI 6% to 71%).
Comparison 2.5 (Analysis 2.5) includes two cohort studies that assessed the impact of three doses of MMR vaccine against mumps in children aged 9 to 17 years (ca‐Nelson 2013; ca‐Ogbuanu 2012). The overall risk ratio (RR) was 0.59 (95% CI 0.33 to 1.05). There was no evidence of effect of the third MMR dose administered in children aged between 9 to 17 years.
Evidence from case‐control studies
Comparison 2.6 (Analysis 2.6) reports vaccine effectiveness containing Jeryl Lynn strain from four case‐control studies (ba‐Castilla 2009; ba‐Fu 2013; ba‐Harling 2005; ba‐Kim 2012). The study by ba‐Kim 2012 was available only as a poster presentation and provides very little information. The overall VE after one dose was 57% (95% CI 30% to 73%), after two doses 81% (95% CI 59% to 91%), and the VE irrespective of the number of doses administered was 65% (95% CI 52% to 75%).
In ba‐Castilla 2009, case definition considers clinical mumps with laboratory or epidemiological confirmation occurring during an outbreak in the Navarre region of northern Spain between August 2006 and June 2008 in children and adolescents (241 cases and 1205 matched controls). The study authors hypothesised a higher risk of having mumps when the first MMR dose was administered after 36 months of age, odds ratio (OR) 3.11 (95% CI 1.15 to 8.43), or when the two MMR doses were administered more than 36 months apart (OR 10.19, 95% CI 1.47 to 70.73).
Comparison 2.7 (Analysis 2.7) reports vaccine effectiveness containing Jeryl Lynn from one case‐control study (ba‐Harling 2005), where cases included in the study were laboratory‐confirmed (by immunoglobulin M radioimmunoassay, detection of mumps ribonucleic acid (RNA) by polymerase chain reaction (PCR), or both). The VE after one, two, and any dose was 64% (95% CI 41% to 78%), 88% (95% CI 63% to 96%), and 65% (95% CI 24% to 84%), respectively.
Comparison 2.8 (Analysis 2.8) reports vaccine effectiveness on vaccines containing Urabe strain, and Comparison 2.9 (Analysis 2.9) reports on vaccines containing Rubini strain. One case‐control study reported evidence from both strains (ba‐Goncalves 1998), assessing the effectiveness of at least one dose of MMR vaccine in preventing clinical mumps cases during an epidemic in a population of children and adolescents. Significant protection was conferred by the Urabe strain‐containing MMR vaccine (VE 70%, 95% CI 25% to 88%), but not by the Rubini strain‐containing MMR (VE 1%, 95% CI −108% to 53%).
Comparison 2.10 (Analysis 2.10) reports vaccine effectiveness from two case‐control studies where cases and controls were selected from a population where, because of a changing vaccine schedule, different MMR vaccines with different mumps strains were administered (ba‐Giovanetti 2002; ba‐Mackenzie 2006). ba‐Giovanetti 2002 conducted a field study on MMR vaccination effectiveness (at least one dose) in preventing clinical mumps in a population of children and adolescents. ba‐Mackenzie 2006 attempted to estimate the effectiveness of MMR vaccination against virologically confirmed mumps on students aged 13 to 17 years attending a boarding school in Scotland. The study was not large enough to reach statistical evidence of effect. The overall VE (at least one dose) was 50% (95% CI 19% to 69%).
3. Effectiveness against rubella
Comparison 3.1 (Analysis 3.1) reports vaccine effectiveness from one cohort study that attempted to estimate MMR vaccine effectiveness in a population who received two rubella strain‐based MMR vaccines (ca‐Chang 2015): MMR containing the BRD‐II rubella strain, or MMR containing the RA27/3 rubella strain. The VE was 89% (95% CI 56% to 95%). See Table 5 and summary of findings Table 3.
4. Effectiveness against varicella (MMR+V or MMRV)
Fourteen studies reported effectiveness data against varicella: 3 RCTs (aa‐Henry 2018; aa‐Povey 2019; aa‐Prymula 2014), 4 cohort studies (ca‐Giaquinto 2018; ca‐Rieck 2017; ca‐Spackova 2010; ca‐Tafuri 2013), 4 CCS (ba‐Andrade 2018; ba‐Cenoz 2013; ba‐Liese 2013; ba‐Vazquez 2001), and 3 COEM (ga‐Boccalini 2015; ga‐Pozza 2011; ga‐Tafuri 2015). In ga‐Pozza 2011, data from two independent surveillance systems were reported. The studies are described in Table 6, Table 7, Table 8, and Table 9. The summary of findings are presented in summary of findings Table 4.
Evidence from RCTs/CCTs
Three multicentre RCTs evaluated vaccine effectiveness of 2 doses in children aged 11 to 22 months against varicella (any severity) and against varicella (moderate/severe) during 3 follow‐up time periods: up to 5 years, between 5 and 10 years, and 10 years (aa‐Henry 2018; aa‐Povey 2019; aa‐Prymula 2014). Each of these studies compared three vaccine types: MMRV (Priorix‐Tetra), MMR (Priorix), and MMR+V (Priorix + Varilrix).
Comparison 4.1 and Comparison 4.2. The overall MMRV vaccine effectiveness against varicella (any severity) after 10 years' follow‐up was 95% (95% CI 94% to 96%) (Analysis 4.1). The vaccine effectiveness against varicella (moderate/severe) was 99% (95% CI 98% to 100%) (Analysis 4.2).
Comparison 4.3, Comparison 4.4, and Comparison 4.5. The overall MMR+V vaccine effectiveness against varicella (any severity) after 10 years' follow‐up was 67% (95% CI 64% to 70%) (Analysis 4.3); against varicella (moderate/severe) 90% (95% CI 88% to 92%) (Analysis 4.4); and against varicella (severe) 95% (95% CI 53% to 99%) (Analysis 4.5).
Evidence from cohort studies
Comparison 4.6 (Analysis 4.6) reports on MMRV vaccine effectiveness from four cohort studies (ca‐Giaquinto 2018; ca‐Rieck 2017; ca‐Spackova 2010; ca‐Tafuri 2013). One study evaluated one dose of the (MMRV ProQuad) vaccine (ca‐Giaquinto 2018), whilst the rest of the cohorts evaluated MMRV (Priorix‐Tetra). The one‐dose MMRV (ProQuad) vaccine effectiveness against varicella was 94% (95% CI 92% to 96%). The overall MMRV (Priorix‐Tetra) vaccine effectiveness against varicella was 62% (95% CI 61% to 63%) after one dose and 87% (95% CI 86% to 87%) after two doses.
Evidence from case‐control studies
Comparison 4.7 (Analysis 4.7) includes one case‐control study evaluating the MMRV (GSK) vaccine effectiveness against varicella (any severity) 86% (95% CI 72% to 93%) and against varicella (moderate/severe) 93% (95% CI 83% to 97%) (ba‐Andrade 2018).
Comparison 4.8 (Analysis 4.8) includes three studies evaluating MMR+V versus MMR. The overall VE against varicella (any severity) was 86% (95% CI 78% to 92%) after one dose; 95% (95% CI 86% to 99%) after two doses; and 88% (95% CI 82% to 92%) after at least one dose (ba‐Cenoz 2013; ba‐Liese 2013; ba‐Vazquez 2001).
Evidence from case‐only ecological method studies
Comparison 4.9 (Analysis 4.9) includes three studies evaluating reduction in the number of hospitalisations before and after introduction of MMRV vaccine in children aged 0 to 14 years (ga‐Boccalini 2015; ga‐Pozza 2011; ga‐Tafuri 2015). The overall vaccine effectiveness (VE = (1 − rate ratio) x 100) in reducing hospitalisation in children aged 0 to 14 years was 57% (95% CI 45% to 66%).
Comparison 4.10 (Analysis 4.10) includes two studies evaluating incidence reduction before and after introduction of MMRV vaccine in children aged 0 to 14 years (ga‐Pozza 2011; ga‐Tafuri 2015). The overall vaccine effectiveness (VE = (1 − rate ratio) x 100) in reduced incidence was 76% (95% CI 57% to 86%).
However, we note that there was a large difference in efficacy amongst subgroups. The highest efficacy was observed in children aged 1 to 4 years, whilst the smallest efficacy was observed in the subgroup of children aged 0 to 14 years (ga‐Pozza 2011). There was no difference between subgroups aged under 1 year and 5 to 14 years. These differences may be due to different methodological quality amongst studies.
5. Safety: short‐term side effects
Seventeen studies reported data on short‐term side effects after MMR vaccination: 7 RCTs/CCTs, ab‐Bloom 1975; ab‐Ceyhan 2001; ab‐Edees 1991; ab‐Freeman 1993; ab‐Lerman 1981; ab‐Peltola 1986; ab‐Schwarz 1975, and 10 cohorts (cb‐Beck 1989; cb‐Benjamin 1992; cb‐Dunlop 1989; cb‐Makino 1990; cb‐Miller 1989; cb‐Robertson 1988; cb‐Sharma 2010; cb‐Stokes 1971; cb‐Swartz 1974; cb‐Weibel 1980). See Table 10, Table 11, and summary of findings Table 5.
Evidence from RCTs/CCTs and cohort studies
From RCTs: MMR vaccines were compared with monovalent measles vaccine (ab‐Ceyhan 2001; ab‐Edees 1991; ab‐Lerman 1981), two types of monovalent mumps and rubella vaccines (ab‐Lerman 1981), or placebo (ab‐Bloom 1975; ab‐Lerman 1981; ab‐Peltola 1986; ab‐Schwarz 1975). One trial carried out in twins reported a possible protective effect of the MMR vaccine with a lower incidence of respiratory symptoms, nausea and vomiting, and no difference in the incidence of other unintended side effects compared with placebo, with the exception of irritability (ab‐Peltola 1986). Another trial concluded there was no increased clinical reactivity from an MMR vaccine containing two strains of rubella (ab‐Lerman 1981). ab‐Edees 1991 concluded there was no significant difference in numbers of children developing symptoms after MMR or measles vaccination. Two studies concluded that the incidences of raised temperature, rash, lymphadenopathy, coryza, rhinitis, cough, local reactions, or limb and joint symptoms were not significantly different from children who received placebo (ab‐Bloom 1975; ab‐Schwarz 1975). All RCTs and CCTs reported a wide range of outcomes and used different terms, often with no definitions. For example, body temperature higher than 38 °C was measured or reported in 16 ways. When this information was reported, different temperature increments, recording methods, observation periods, and incidence made comparisons amongst trials and pooling of data impossible. In ab‐Freeman 1993, conducted by 22 family physicians, the occurrence of common symptoms following MMR immunisation (type not described) was assessed by means of weekly diaries amongst participants immunised at 13 and 15 months of age, comparing incidence during the four weeks before with four weeks after immunisation. The incidence of rash, lymphadenopathy, and nasal discharge was found to be higher after exposure to MMR immunisation.
From cohort studies: 10 cohort studies assessed the occurrence of short‐term side effects, comparing MMR vaccine with single measles vaccines (cb‐Dunlop 1989; cb‐Makino 1990; cb‐Miller 1989; cb‐Robertson 1988), mumps‐rubella vaccine (cb‐Swartz 1974), single mumps vaccines (cb‐Makino 1990), single rubella vaccines (cb‐Swartz 1974; cb‐Weibel 1980), placebo (cb‐Beck 1989), or no intervention (cb‐Benjamin 1992; cb‐Sharma 2010; cb‐Stokes 1971). cb‐Benjamin 1992 found that the MMR vaccine was associated with an increased risk of episodes of joint and limb symptoms in girls younger than 5 years of age. There was no difference in the incidence of common outcomes such as fever, rash, lymphadenopathy, cough, arthralgia, myalgia, and anorexia between the MMR vaccine and rubella vaccine (cb‐Makino 1990; cb‐Swartz 1974; cb‐Weibel 1980), mumps‐rubella vaccine (cb‐Swartz 1974), single mumps vaccine (cb‐Makino 1990), or measles vaccine (cb‐Dunlop 1989; cb‐Makino 1990). Two studies found that symptoms were similar following MMR and measles vaccination (cb‐Miller 1989; cb‐Robertson 1988), except for a higher incidence of parotitis following MMR vaccination (cb‐Miller 1989). cb‐Makino 1990 reported a higher incidence of diarrhoea in the MMR vaccines arm compared to the single measles or rubella vaccines arms. Two studies reported no difference in the incidence of rash and lymphadenopathy between MMR vaccination and placebo, cb‐Beck 1989, or no treatment (cb‐Stokes 1971). However, cb‐Stokes 1971 reported an increase in the incidence of fever in the period Day 5 to Day 12 postvaccination, but cb‐Beck 1989 reported no difference. Considering the cohort of cb‐Sharma 2010 only within the subgroup of younger children (16 to 24 months of age), fever during the 42 days' postvaccination was reported more frequently amongst children immunised with MMR than in unvaccinated children. This trend appeared to differ when an older population was considered: fever was reported with slightly higher frequency amongst unvaccinated children.
We performed quantitative synthesis for the most common adverse effects: temperature, rash, lymphadenopathy, coryza, upper respiratory tract infections, and cough. The analysis includes only studies comparing MMR versus placebo (or no treatment). The measure of association between MMR vaccination and specific adverse effect is the risk ratio (RR) and its 95% confidence interval (CI). Results from RCTs and cohort studies are presented separately.
Comparison 5.1 (Analysis 5.1). Seven studies assessed the association between MMR vaccination and temperature: 3 RCTs, ab‐Bloom 1975; ab‐Lerman 1981; ab‐Schwarz 1975, and 4 cohort studies (cb‐Beck 1989; cb‐Benjamin 1992; cb‐Sharma 2010; cb‐Stokes 1971). From RCT data the overall RR was 1.29 (95% CI 0.77 to 2.17). A close value is shown from cohort data (RR 1.16, 95% CI 0.90 to 1.51).
Comparison 5.2 (Analysis 5.2). Six studies evaluated the association between vaccination and rash: 3 RCTs, ab‐Bloom 1975; ab‐Lerman 1981; ab‐Schwarz 1975, and 3 cohort studies (cb‐Benjamin 1992; cb‐Sharma 2010; cb‐Stokes 1971). From RCT data the overall RR was 2.05 (95% CI 1.21 to 3.48). However, from cohort studies it was RR 1.49 (95% CI 0.73 to 3.04).
Comparison 5.3 (Analysis 5.3). Five studies evaluated the association between vaccination and lymphadenopathy: 3 RCTs, ab‐Bloom 1975; ab‐Lerman 1981; ab‐Schwarz 1975, and 2 cohort studies (cb‐Sharma 2010; cb‐Stokes 1971). From RCT data the overall association was RR 1.32 (95% CI 0.52 to 3.33); from cohort studies it was RR 1.98 (95% CI 0.19 to 20.97).
Comparison 5.4 (Analysis 5.4). Three studies assessed the association between vaccination and coryza: 2 RCTs, ab‐Bloom 1975; ab‐Schwarz 1975, and one cohort study (cb‐Benjamin 1992); the association was RR 0.45 (95% CI 0.12 to 1.63) and RR 1.13 (95% CI 1.05 to 1.20), respectively.
Comparison 5.5 (Analysis 5.5). Three studies assessed the association between vaccination and coryza: 2 RCTs, ab‐Bloom 1975; ab‐Schwarz 1975, and one cohort study (cb‐Stokes 1971); the association was RR 0.31 (95% CI 0.06 to 1.56) and RR 1.44 (95% CI 1.26 to 1.64), respectively.
Comparison 5.6 (Analysis 5.6). Two RCTs assessed the association between vaccination and coryza: RR 1.99 (95% CI 0.45 to 8.81) (ab‐Bloom 1975; ab‐Schwarz 1975).
These results must be interpreted cautiously because different MMR vaccines with different strains were used. However, we found a weak association between MMR vaccination and rash (RCT), coryza (cohort), and upper respiratory tract infections (cohort). We found no evidence of association between MMR vaccine and temperature, lymphadenopathy, and cough.
Safety: severe harms
The association between MMR/MMRV and severe harms (excluding short‐term side effects) was investigated in 70 studies (22 cohort studies, 22 CCS, 13 SCCS, 3 PTC, 2 CCO, 8 COEM). The measure of association between MMR vaccination and specific severe harm is the RR for cohort studies, the OR for case‐control studies, and the rate ratio (rr) for cohort studies, self‐controlled case series, and person‐time cohort studies. Each estimate is reported with its 95% CI.
6. Safety: encephalitis or encephalopathy
The potential association between MMR immunisation and the occurrence of encephalopathies was investigated in three studies: one case‐control study, bb‐Ray 2006, and two SCCS (db‐Makela 2002; db‐Ward 2007). See Table 12 and summary of findings Table 6.
Evidence from case‐control studies
Comparison 6.1 (Analysis 6.1). bb‐Ray 2006 tested if hospitalisations due to encephalopathy, Reye's syndrome, or encephalitis occurring in children aged 0 to 6 years could be linked to MMR vaccine administration (Table 12). Different time intervals between MMR exposure and date of hospitalisation were considered: 7 to 14 days, 0 to 14 days, 0 to 30 days, 0 to 60 days, and 0 to 90 days (Analysis 6.1). A total of 452 cases together with their 1280 matched controls were included in the analysis. Exposure to the MMR vaccine did not differ statistically between cases and controls for any of the time intervals considered.
Evidence from self‐controlled case series studies
Comparison 6.2 (Analysis 6.2). db‐Makela 2002 was based on a surveillance study by the National Public Health Institute that began after the introduction of MMR vaccination in Finland for children aged 14 to 18 months and 6 years (1982). Participants aged 1 to 7 years (N = 535,544) who received the MMR II vaccine between November 1982 and June 1986 were considered in the study (this population corresponds to 86% of all children scheduled for MMR vaccination in Finland). Risk association was evaluated by comparing the number of hospitalisations for encephalitis or encephalopathy (see Table 12 for the outcome definition) within three months after vaccination, with those occurring during the subsequent seven three‐month intervals. Of 199 hospitalisations for encephalitis or encephalopathy, 9 occurred within 3 months after MMR vaccination, 110 occurred more than 3 months after vaccination (88 between 3 and 24 months), whereas 80 occurred before the vaccine was administered. The trial authors stated that no hospitalisation excess for encephalitis or encephalopathy was observed during the three months' postimmunisation. In db‐Ward 2007, to evaluate the association between encephalitis and MMR vaccination (see Table 12 for case definitions), cases (N = 107) diagnosed between the ages of 2 to 35 months were considered (in Britain and Ireland, the MMR vaccine is scheduled at 12 to 15 months of age). The risk period for encephalitis was considered to be the time between 15 and 35 days following MMR immunisation. The incidence of disease within the risk period was compared with the control period. The incidence of encephalitis in the risk period (15 to 35 days) was not statistically different from the control period (rr 1.34, 95% CI 0.52 to 3.47). This estimate did not change in the presence or absence of primary human herpesvirus 6 (HHV‐6) or HHV‐7 infections. The meta‐analysis estimate of the association between MMR immunisation and encephalitis is rr 0.90 (95% CI 0.50 to 1.61; Analysis 6.2).
The meta‐analysis did not provide evidence supporting an association between MMR immunisation and encephalitis or encephalopathy.
7. Safety: aseptic meningitis
The association between MMR vaccine and aseptic meningitis was evaluated in the following 10 studies: 1 case‐control (bb‐Black 1997), 2 CCO (eb‐Ki 2003; eb‐Park 2004), 4 SCCS/PTC (db‐Dourado 2000; db‐Farrington 1995; db‐Miller 2007; db‐Perez‐Vilar 2018), 1 PTC (db‐Makela 2002), and 2 COEM (gb‐da Cunha 2002; gb‐da Silveira 2002). The qualitative synthesis is presented in Table 13. The summary of findings are presented in summary of findings Table 7.
Evidence from case‐control studies ‐ case cross‐over studies
Comparison 7.1 (Analysis 7.1). In bb‐Black 1997, MMR vaccination within defined intervals before the index date (0 to 14 days, 0 to 30 days, 8 to 14 days) was assessed in cases and controls to assess its association with aseptic meningitis (see Table 13 for outcome definitions). Exposure to the MMR vaccine was not statistically different between cases and controls in any of the considered time intervals. The association between MMR vaccination and aseptic meningitis was evaluated in two case cross‐over studies (eb‐Ki 2003; eb‐Park 2004). MMR containing Urabe strain or MMR vaccine containing Hoshino strain was administered to participants of both studies. The overall association between these MMR vaccines and aseptic meningitis is odds ratio (OR) 4.00 (95% CI 2.23 to 7.20; Analysis 7.1). eb‐Ki 2003 presents data from a subgroup for whom only MMR vaccine containing Jeryl Lynn strain was administered. No association between MMR (Jeryl Lynn) vaccine and aseptic meningitis was shown.
Evidence from self‐controlled case‐series/person‐time cohort studies
Comparison 7.2 (Analysis 7.2) includes data from five studies. MMR vaccine containing Urabe strain was used in three studies (db‐Dourado 2000; db‐Farrington 1995; db‐Miller 2007). The overall association between MMR (Urabe) and aseptic meningitis is rr 30.71 (95% CI 13.45 to 70.10). In db‐Makela 2002, no association was shown with MMR II vaccine (Enders‐Edmonston, Jeryl Lynn, Wistar RA 27/3). db‐Perez‐Vilar 2018 was conducted on 26 sentinel sites (49 hospitals) distributed in 16 countries of the 6 World Health Organization (WHO) regions, where different MMR vaccines containing different strains were administered. Data showed no association when MMR containing Lenigrad‐Zagreb was administered.
Evidence from case‐only ecological method studies
Comparison 7.3 (Analysis 7.3) includes data from three studies (db‐Dourado 2000; gb‐da Cunha 2002; gb‐da Silveira 2002). MMR with Urabe strain was used in db‐Dourado 2000. MMR with Leningrad‐Zagreb was used in gb‐da Cunha 2002 and gb‐da Silveira 2002. The association between MMR and aseptic meningitis was rate ratio (rr) 9.12 (95% CI 5.73 to 14.52) and rr 18.45 (95% CI 13.26 to 25.56), respectively.
The association between MMR vaccination and aseptic meningitis was due to the Urabe or Leningrad‐Zagreb strains. The meta‐analysis showed no evidence of an association between MMR containing Jeryl Lynn strain and aseptic meningitis.
8. Safety: seizures (febrile/afebrile)
Fifteen studies evaluated the association between MMR/MMR+V/MMRV immunisation and seizure (febrile/afebrile). Eight studies compared MMR/MMR+V/MMRV versus placebo or no treatment: 2 cohorts (cb‐Barlow 2001; cb‐Vestergaard 2004), 4 SCCS (db‐Farrington 1995; db‐Macartney 2017; db‐Miller 2007; db‐Ward 2007), and 2 PTC (db‐MacDonald 2014; db‐McClure 2019) (see Table 14). Seven cohort studies compared MMRV versus MMR or MMR+V (cb‐Gavrielov‐Yusim 2014; cb‐Jacobsen 2009; cb‐Klein 2010; cb‐Klein 2012; cb‐Klein 2017; cb‐Rowhani‐Rahbar 2013; cb‐Schink 2014). See Table 15 and summary of findings Table 8.
Evidence from cohort studies
Comparison 8.1 (Analysis 8.1) includes data from two studies (cb‐Barlow 2001; cb‐Vestergaard 2004). cb‐Vestergaard 2004 is a cohort study assessing the risk of febrile seizure after the introduction of routine MMR vaccination in Denmark in 1987 (Table 14). Globally, the risk of febrile seizure was significantly higher amongst vaccinated children (RR 1.10, 95% CI 1.05 to 1.15). When different time frames after vaccination were considered, the RR was at the highest point within two weeks after immunisation (RR 2.75, 95% CI 2.55 to 2.97). The RR did not differ significantly in weeks 3 to 6, and was slightly less than 1 in weeks 7, 8, 9 to 26 and 27 to 52. Amongst children with personal history of febrile seizure, the RR was 2.75 (95% CI 2.32 to 3.26) (adjusted for age, calendar period, age at first febrile seizure) compared with non‐vaccinated children with personal history of febrile seizure. For evaluation of long‐term prognosis, the number of recurrent episodes of febrile seizure and the cases of epilepsy observed in children who received MMR vaccination within 14 days before their first febrile seizure episode, and in those who were vaccinated more than 14 days before their first febrile seizure episode, were compared with those who were not vaccinated at the time of their first febrile seizure episode. A significant risk association was found only for recurrent febrile seizure episodes in children who were immunised with MMR within 14 days before the first episode (RR 1.19, 95% CI 1.10 to 1.41) adjusted for age, calendar period, age at first febrile seizure, and current vaccination status. cb‐Barlow 2001 was a cohort study conducted at four large health maintenance organisations. The study showed statistical evidence of association (within two weeks) between MMR immunisation and febrile seizures. However, there was no evidence of an association with afebrile seizures (RR 1.11, 95% CI 0.11 to 11.28).
The overall RR of having febrile seizures within two weeks after MMR immunisation was 3.16 (95% CI 2.89 to 3.46).
Evidence from self‐controlled case series/person‐time cohort studies
Comparison 8.2 (Analysis 8.2) includes evidence from six studies (db‐Farrington 1995; db‐Macartney 2017; db‐MacDonald 2014; db‐McClure 2019; db‐Miller 2007; db‐Ward 2007). db‐Farrington 1995 shows the rr estimates of febrile seizures amongst people vaccinated with the MMR containing Jeryl Lynn strain and people vaccinated with the MMR containing Urabe strain. The seizure risk associate to MMR (Urabe) was rr 3.77 (95% CI 1.95 to 7.30) within 6 to 11 days, and rr 1.04 (95% CI 0.56 to 1.93) within 15 to 35 days. We only included data from MMR (Jeryl Lynn). db‐Miller 2007 shows the rr estimates of febrile seizures for MMR II vaccine (Jeryl Lynn) and MMR Priorix (RIT 4385). Both estimates were included. In db‐Miller 2007, the risk incidence of febrile convulsion was also analysed considering a more specific definition (Table 16). Considering all MMR vaccine types, the risk incidence remained higher in the 6 to 11 days following vaccination (rr 4.27, 95% CI 3.17 to 5.76), whereas at 15 to 35 days following vaccination it remained at borderline significance (rr 1.33, 95% CI 1.00 to 1.77). db‐McClure 2019 reported data for two vaccines (MMR and MMRV) stratified by gestational age (born before 37 weeks, born ≥ 37 weeks). db‐MacDonald 2014 analysed the risk of febrile seizure amongst people vaccinated with MMRV and people vaccinated with MMR+V; the rr estimates of febrile seizures for each vaccine (MMRV and MMR+V) were presented stratified in two subcohorts (low risk, high risk).
The overall rr of having febrile seizures within two weeks after MMR immunisation was 3.36 (95% CI 2.65 to 4.24; Analysis 8.2). No evidence of association was shown beyond two weeks (rr 1.18, 95% CI 0.93 to 1.50). The rr was 6.08 (95% CI 4.95 to 7.47) within two weeks after MMRV immunisation and 3.13 (95% CI 2.38 to 4.10) after MMR+V immunisation.
Evidence from cohort studies ‐ MMRV versus (MMR+V or MMR)
Of seven cohort studies evaluating the risk of having febrile seizures after immunisation with MMRV, four cohort studies evaluated MMRV ProQuad (Merck and Co, USA) (cb‐Jacobsen 2009; cb‐Klein 2010; cb‐Klein 2012; cb‐Rowhani‐Rahbar 2013), and two cohort studies evaluated MMRV Priorix‐Tetra (GSK) (cb‐Gavrielov‐Yusim 2014; cb‐Schink 2014). See Table 15.
Comparison 8.3 (Analysis 8.3). MMRV versus MMR+V includes evidence from five cohort studies (cb‐Jacobsen 2009; cb‐Klein 2010; cb‐Klein 2012; cb‐Rowhani‐Rahbar 2013; cb‐Schink 2014). The studies estimated the risk of febrile seizures after MMRV vaccination compared to MMR+V vaccination. The overall estimate was RR 1.31 (95% CI 1.19 to 1.45) within 42 days after vaccination and RR 1.98 (95% CI 1.69 to 2.33) within 7 to 10 days after vaccination.
Comparison8.4 (Analysis 8.4). The RR including only MMRV (Priorix‐Tetra) studies was 1.95 (95% CI 0.85 to 4.48) within 0 to 42 days after vaccination, and RR 1.69 (95% CI 0.93 to 3.07) between 7 and 10 days after vaccination. Including only MMRV (ProQuad) studies, the RR was 1.30 (95% CI 1.17 to 1.44) within 0 to 42 days after vaccination and 2.01 (95% CI 1.70 to 2.38) between 7 and 10 days after vaccination.
Comparison 8.5 (Analysis 8.5). MMRV versus MMR includes evidence from six cohort studies (cb‐Gavrielov‐Yusim 2014; cb‐Klein 2010; cb‐Klein 2012; cb‐Klein 2017; cb‐Rowhani‐Rahbar 2013; cb‐Schink 2014). The studies estimated the risk of febrile seizures after MMRV vaccination compared to MMR vaccination. The overall RR was 1.53 (95% CI 1.37 to 1.71) within 42 days after vaccination and RR 1.50 (95% CI 1.36 to 1.66) within 7 to 10 days after vaccination.
Comparion 8.6 (Analysis 8.6). The RR including only MMRV (Priorix‐Tetra) studies was 1.28 (95% CI 1.00 to 1.64) within 0 to 42 days after vaccination, and 2.49 (95% CI 1.66 to 3.74) between 7 and 10 days after vaccination. However, including only MMRV (ProQuad) studies, the RR was 1.60 (95% CI 1.42 to 1.82) within 0 to 42 days after vaccination, and 1.46 (95% CI 1.32 to 1.61) between 7 and 10 days after vaccination.
To correctly interpret the associations between MMR/MMRV/MMRV (containing Jeryl Lynn strain) vaccines and febrile seizures, we must consider that vaccine‐induced febrile seizures is an infrequent event, amongst both non‐vaccinated and vaccinated people. cb‐Gavrielov‐Yusim 2014 reported that febrile seizures normally occur in 2% to 4% of healthy children at least once before the age of five years. cb‐Vestergaard 2004 showed a risk difference (RD) of febrile seizures amongst vaccinated and unvaccinated people equal to 0.16% (95% CI 0.14% to 0.17%), and reported a 0.25% absolute cumulative risk of febrile seizures amongst vaccinated people. db‐MacDonald 2014 and db‐McClure 2019 showed a cumulative risk amongst vaccinated people ranging from 0.15% to 0.29%. The attributable risk was estimated to be 1:1700 doses, db‐Farrington 1995, and 1:1150 doses (db‐Miller 2007). db‐McClure 2019 found no difference in RR of febrile seizures by gestational age.
9. Safety: autism spectrum disorders
Thirteen studies investigated the hypothesised link between MMR vaccination and autism spectrum disorders: 4 cohorts (cb‐Hviid 2019; cb‐Jain 2015; cb‐Madsen 2002; cb‐Uchiyama 2007), 4 case‐control (bb‐De Stefano 2004; bb‐Mrozek‐Budzyn 2010; bb‐Smeeth 2004; bb‐Uno 2012), 1 SCCS (db‐Taylor 1999), 1 PTC (db‐Makela 2002), and 3 COEM (gb‐Fombonne 2001; gb‐Fombonne 2006; gb‐Honda 2005). See Table 16 and summary of findings Table 9.
Evidence from cohort studies
Four retrospective cohort studies investigated the risk of autism and pervasive developmental disorders following MMR immunisation (Table 16) (cb‐Hviid 2019; cb‐Jain 2015; cb‐Madsen 2002; cb‐Uchiyama 2007). Two studies were conducted in Denmark and included all Danish children born between January 1991 and December 1998, and 1999 to December 2010, respectively (cb‐Hviid 2019; cb‐Madsen 2002). The study authors linked vaccination data reported by the National Board of Health with a diagnosis of autism (Table 16) from the Danish Psychiatric Central Register. cb‐Jain 2015 was conducted in the USA and included children born between 2001 to 2012. Data are presented stratified by age (2‐, 3‐, 4‐year‐olds received first dose, 5‐year‐olds received the first and second dose) and subdivided in two subgroups: low risk of autism (older sibling without autism spectrum disorder) and moderate/high risk of autism (older sibling with autism spectrum disorder). The retrospective cohort study cb‐Uchiyama 2007 assessed the association between exposure to MMR vaccination and regression in autistic spectrum disorders. Participants were children with an autism spectrum disorder diagnosis (Table 16) from a private paediatric psychiatric clinic located in Yokohama City, Japan (Yokohama Psycho‐Developmental Clinic, YPCD), which has become recognised as a centre for autism spectrum disorders. Cases of autism spectrum disorders in people born between 1976 and 1999 were considered for study purposes. Regression in autism spectrum could be assessed for 325/904 children who were identified with disorders. Data were analysed in different ways. Within the MMR vaccine generation group, odds ratio (OR) estimates were calculated considering the cases of deterioration observed in children who had received the MMR vaccine from the Mental Child Health Handbook (15/54), and the number of regressions observed amongst participants who did not receive the MMR vaccine (45/132), after exclusion of those with unknown vaccination status (N = 89). Study authors reported a non‐significant OR 0.74 (95% CI 0.35 to 1.52) in people who had received the MMR vaccine versus no MMR vaccination in the MMR period. Furthermore, the OR estimate was calculated considering as the control group (not MMR vaccinated) also both pre‐ and post‐MMR generation groups. Estimates were non‐significant: OR 0.63 (95% CI 0.32 to 1.20). Comparison of regression cases observed within the MMR generation group (independent from documented vaccination status) with that observed in pre‐MMR, post‐MMR, and pre‐ plus post‐MMR groups provided no statistically significant OR estimates. According to the data reported by cb‐Uchiyama 2007, there was no evidence supporting an association between MMR immunisation and autism spectrum disorders (see Table 16). We did not include data in the quantitative synthesis because the study authors did not state which statistical model had been adopted.
Comparison 9.1 (Analysis 9.1) includes evidence from cb‐Hviid 2019, cb‐Jain 2015, and cb‐Madsen 2002.
The meta‐analysis did not provide evidence supporting an association between MMR immunisation and autism spectrum disorder in all children (rr 0.93, 95% CI 0.85 to 1.01). The meta‐analysis did not provide evidence supporting an association between MMR immunisation and autism spectrum disorders amongst low‐risk children (RR 1.00, 95% CI 0.89 to 1.14).
The analysis shows statistical evidence of a protective effect of MMR vaccine amongst high‐risk children (rr 0.80, 95% CI 0.64 to 0.98). This result is clearly due to the effect of indication bias. In previous years, children who had an older sibling with an autism spectrum disorder diagnosis were less likely to be vaccinated. Conversely, children who have an older sibling with an autism spectrum disorder diagnosis have a high risk of autism spectrum disorder diagnosis.
Evidence from case‐control studies
Four case‐control studies investigated the risk of an association between the MMR vaccine and autism (bb‐De Stefano 2004; bb‐Mrozek‐Budzyn 2010; bb‐Smeeth 2004; bb‐Uno 2012) (Table 16). bb‐Smeeth 2004 assessed the association between exposure to the MMR vaccine and the onset of autism and other pervasive developmental disorders (Table 16). The study was based on data from the UK's General Practice Research Database (GPRD), which was established 1 June 1987. bb‐De Stefano 2004 compared the distribution of ages at first MMR vaccination in children with autism (Table 16) cases and controls, divided into three age strata: up to 18, 24, and 36 months. In bb‐Mrozek‐Budzyn 2010, cases of autism in children aged between 2 and 15 years were identified by means of general practitioners' records from Małopolska Province in southern Poland (Table 16). For each case, two controls matching for birth year, gender, and practice were selected. A total of 92 cases with childhood or atypical autism and 192 matched controls were included. Estimate ORs were calculated considering vaccine exposure (MMR or monovalent measles) before autism diagnosis or before onset of symptoms, separately in univariate and multivariate analyses (balanced for mother's age ≥ 35 years, gestation time ≤ 38 weeks, medication during pregnancy, perinatal injuries, and 5‐minute Apgar score). The bb‐Uno 2012 study analysed case data from patients of the Yokohama Psycho‐Developmental Clinic; the cases consisted of children who were diagnosed with autism spectrum disorders born between 1 April 1984 and 30 April 1992, the possible time period for MMR vaccination.
Comparison 9.2 (Analysis 9.2). The meta‐analysis did not provide evidence supporting an association between MMR immunisation and autism spectrum disorders in children vaccinated at any age (18 months to 15 years) (OR 0.62, 95% CI 0.36 to 1.09).
The meta‐analysis did not provide evidence supporting an association between MMR immunisation and autism spectrum disorders if the vaccine was administered before 18 months (OR 0.91, 95% CI 0.75 to 1.11) or after 18 months (OR 0.80, 95% CI 0.61 to 1.05).
The meta‐analysis did not provide evidence supporting an association between MMR immunisation and autism spectrum disorders if the vaccine was administered before 36 months (OR 0.94, 95% CI 0.74 to 1.18) or after 36 months (OR 0.77, 95% CI 0.55 to 1.08).
Evidence from self‐controlled case series/person‐time cohort studies
In db‐Makela 2002, described in the section related to neurological diseases, an attempt to evaluate the association between MMR vaccination and hospitalisation for autism was made (Table 16). Unlike for encephalitis and aseptic meningitis, instead of a risk period, changes in the overall number of hospitalisations for autism after MMR vaccination, including only the first hospital visit during the study period, were considered. Times between immunisation and hospitalisation observed amongst the 309 hospitalisations for autism following MMR immunisation were very wide (range 3 days to 12 years and 5 months); their numbers remained relatively steady during the first 3 years and then decreased gradually. No cluster intervals from vaccination could be identified. The study authors concluded that there was no evidence of association, but did not report statistical data supporting this conclusion. Another SCCS assessed clustering of cases of autism by postexposure periods in a cohort of 498 (with 293 confirmed cases) children (db‐Taylor 1999). The study authors reported a significant increase in onset of parental concern at 6 months postvaccination, but no significant clustering of interval to diagnosis or regression was found within any of the considered time periods (2, 4, 6, 12, 24 months).
Comparison 9.3 (Analysis 9.3) includes data from db‐Taylor 1999. The results showed no evidence supporting an association between MMR immunisation and autism spectrum disorder diagnosis or regression (autism spectrum disorder diagnosis < 12 months: rr 0.94, 95% CI 0.60 to 1.47; autism spectrum disorder diagnosis < 24 months: rr 1.09, 95% CI 0.79 to 1.52; regression < 2 months: rr 0.92, 95% CI 0.38 to 2.21; regression < 4 months: rr 1.00, 95% CI 0.52 to 1.95; and regression < 6 months: rr 0.85, 95% CI 0.45 to 1.60).
Evidence from case‐only ecological method studies
gb‐Fombonne 2001 tested several causal hypotheses and mechanisms of association between exposure to MMR vaccination and pervasive developmental disorders (Table 16). The population was made up of three cohorts of participants; one was of older children acting as the control (pre‐MMR vaccination introduction). The study authors concluded that there was no evidence that pervasive developmental disorders had become more frequent; the mean age at parental concern had not moved closer to the date of exposure to MMR vaccination. Furthermore, the study authors concluded that there was no evidence that regression with autism had become more common. The parents of children with autism regression did not become concerned about their child in a different time frame than children without regression; children with regressive autism did not have different profiles or severity to those in the control group. There was no evidence that regressive autism was associated with inflammatory bowel disorders. gb‐Fombonne 2006 analysed the trend of pervasive developmental disorder prevalence in cohorts born from 1987 to 1998 attending schools in southern and western Montreal (N = 27,749; 1 October 2003). The relationship between pervasive developmental disorder prevalence trends and MMR vaccination coverage through each birth cohort was assessed. Children with pervasive developmental disorders (N = 180) were identified only if their diagnosis was specifically stated as autism and autism spectrum disorder to allow the schools to receive incremental funding. The study authors reported that whilst a significant trend towards a decrease in MMR uptake through birth cohorts from 1988 to 1998 (Chi² for trend = 80.7; df = 1; P < 0.001) could be assessed, a significant increase in rates of pervasive developmental disorders from 1987 to 1998 was found (OR 1.10, 95% CI 1.05 to 1.16; P < 0.001). By comparing the rate of increase in pervasive developmental disorder prevalence between the one‐ and two‐dose period, no statistically significant differences were detected.
A Japanese study assessed the autism spectrum disorders incidence trend amongst birth cohorts from 1988 to 1996 in Yokohama City in children aged up to 7 years (gb‐Honda 2005). gb‐Honda 2005 assessed the incidence trend in relation to decline of MMR vaccination coverage in the same birth cohorts (before and after termination of MMR vaccination programmes in children in 1993). Examination of risk factor analysis with conditional regression detected a significant increase in cumulative incidence of all autism spectrum disorders amongst birth cohorts from 1988 to 1996 (Chi² = 45.17, df = 8, P < 0.001). This trend was different before and after the 1992 birth cohort: considering the 1996 birth cohort as a reference, incidence of all autism spectrum disorders was significantly lower until 1992 and did not differ after 1993. A significantly increased incidence could be assessed when outcomes definition of childhood autism (Chi² = 31.86, df = 8, P < 0.001) or other autism spectrum disorder (Chi² = 19.25, df = 8, P = 0.01) were considered. The study authors concluded that causal hypothesis involving the MMR vaccine as a risk factor was not supported by the evidence because autism spectrum disorder incidence continued to increase even if the MMR vaccination programme was terminated.
Comparison 9.4 (Analysis 9.4) includes data from gb‐Honda 2005. The analysis showed statistical evidence of a protective effect of MMR vaccine against childhood autism (rr 0.45, 95% CI 0.33 to 0.62); against other autism spectrum disorders (rr 0.55, 95% CI 0.39 to 0.80); and against all autism spectrum disorders (rr 0.49, 95% CI 0.39 to 0.63). These results are surely due to effect of the indication bias.
The meta‐analysis did not provide evidence supporting an association between MMR immunisation and autism spectrum disorders.
10. Safety: inflammatory bowel disease
Six studies considered the hypothesis of an association between MMR vaccination and inflammatory bowel disease (IBD) or Crohn's disease and ulcerative colitis: 4 case‐control studies, bb‐Baron 2005; bb‐Davis 2001; bb‐Shaw 2015; bb‐Vcev 2015, and 2 COEM (gb‐Seagroatt 2005; gb‐Taylor 2002). See Table 17 and summary of findings Table 10.
Evidence from case‐control studies
bb‐Baron 2005 was conducted in France between January 1988 and December 1997. Cases were all patients from the EPIMAD (Epidemiology of Inflammatory Bowel Disease) registry who had a diagnosis of either Crohn's disease or ulcerative colitis and were aged under 17 years. bb‐Davis 2001 was conducted in the USA using data from the Vaccine Safety Datalink (versusD). Cases were patients born between 1958 and 1989. bb‐Shaw 2015 was conducted in Canada University of Manitoba IBD Epidemiology Database (UMIBDED) linked to the Manitoba Immunization Monitoring System. All paediatric IBD cases in Manitoba, born after 1989 and diagnosed before 31 March 2008, were included. bb‐Vcev 2015 was conducted in Croatia. IBD patients (> 18 years old) were identified according to the hospital’s patient records. This study has different methodological limitations, a small number of cases, and a weak control for confounders. The region where the study was conducted was affected by the war in Croatia between 1991 and 1997, and experienced large demographic changes during the war and long postwar period.
Comparison 10.1 (Analysis 10.1). The meta‐analysis estimates did not provide evidence supporting an association between MMR immunisation and IBD (OR 1.42, 95% CI 0.93 to 2.16) or an association between MMR and ulcerative colitis (OR 1.35, 95% CI 0.81 to 2.23). Crohn's disease data showed a protective effect (OR 0.64, 95% CI 0.42 to 0.98).
Evidence from case‐only ecological method studies
gb‐Seagroatt 2005 investigated a possible association between the MMR vaccine and Crohn's disease. Using national data on emergency admissions from England, the authors compared admissions for Crohn's disease in populations with a vaccination coverage of ≥ 84% with populations with MMR vaccination coverage of ≥ 7%. Even if age‐specific rates of emergency admission for Crohn's disease increased during the time considered in the study (April 1991 to March 2003), this trend seems not to have been influenced by the introduction of the MMR vaccine. The introduction of the MMR vaccination programme in England did not increase the risk of Crohn's disease. gb‐Taylor 2002 is linked to db‐Taylor 1999, as the study includes children with childhood and atypical autism born between 1979 and 1998, to investigate whether MMR vaccination is associated with bowel problems and developmental regression in children with autism.
Comparison 10.1 (Analysis 10.2) includes data from gb‐Seagroatt 2005. Results did not show evidence supporting an association between MMR immunisation and Crohn's disease (rr 0.95, 95% CI 0.84 to 1.08).
Comparison 10.2 (Analysis 10.3) includes data from gb‐Taylor 2002. Results did not show evidence supporting an association between MMR immunisation and IBD (in children with autism) (OR 0.98, 95% CI 0.89 to 1.07).
11. Safety: cognitive delay/developmental delay
The cohort study cb‐Mrozek‐Budzyn 2013 examined the hypothesis that MMR exposure could have a negative influence on cognitive development in children. The Mental Development Index of Bayley Scales of Infant Development, second edition (MDI‐BSID‐II) was administered in the 24th and 36th months of life. The Raven's Colored Scale was administered in the fifth year of life. The Wechsler Intelligence Scale for Children, Revised Form (WISC‐R) was administered in the sixth year of life. See Table 18 and summary of findings Table 11.
Comparison 11.1 (Analysis 11.1). The estimates did not show evidence supporting an association between MMR vaccine and cognitive development in children.
12. Safety: idiopathic thrombocytopenic purpura
Nine studies investigated a suspected association between MMR vaccination and idiopathic thrombocytopenic purpura (ITP): 2 case‐control studies (bb‐Bertuola 2010; bb‐Black 2003), 5 SCCS (db‐Andrews 2012; db‐Farrington 1995; db‐France 2008; db‐O'Leary 2012; db‐Perez‐Vilar 2018), 1 CCO (eb‐Lafaurie 2018), and 1 COEM (gb‐Jonville‐Bera 1996). See Table 19 and summary of findings Table 12.
Evidence from case‐control and case cross‐over studies
bb‐Black 2003 was a matched case‐control study conducted in children aged 12 to 23 months. The cases were patients with a diagnosis of ITP. The controls were selected within data contained in the General Practice Research Database (GPRD). bb‐Bertuola 2010 tested the association between acute immune thrombocytopenia and MMR vaccination by means of a case‐control design in children and adolescents (aged 1 month to 18 years). eb‐Lafaurie 2018 was a population‐based case cross‐over study. See Table 19.
Comparison 12.1 (Analysis 12.1). The overall meta‐analysis estimate from case‐control studies showed statistical evidence of an association between the MMR vaccination and ITP (OR 2.80, 95% CI 1.50 to 5.23). The estimate from the case cross‐over study showed statistical evidence of an association (OR 1.62, 95% CI 1.21 to 2.16).
Evidence from self‐controlled case series/person‐time cohort studies
The study by db‐France 2008 was based on data contained in the Vaccines Safety Datalink project from 1991 to 2000, covering eight managed care organisations across the USA. By consulting the database, 63 children aged 12 to 23 months who met the definition (Table 19) could be identified. The incidence rate ratio between the exposed and unexposed time was calculated using two different analytical methods: the self‐controlled case series and the 'risk interval' (i.e. person‐time cohort) method. For the latter method, the estimate rate ratio was rr 3.94 (95% CI 2.01 to 7.69) in children aged 12 to 23 months, and 7.10 (95% CI 2.03 to 25.03) in children aged 12 to 15 months (the age at which about 80% of MMR vaccinations were administered). To avoid data duplication, we included only data from SCCS designs in the meta‐analysis. db‐Andrews 2012 was a multicountry collaboration (England and Denmark) study. db‐O'Leary 2012 involved five healthcare systems. db‐Perez‐Vilar 2018 was conducted on 26 sentinel sites (49 hospitals) in 16 countries of the six WHO regions, that is the Western Pacific region, the South‐East Asia region, the Americas region, the European region, the Eastern Mediterranean region, and the African region.
Comparison 12.2 (Analysis 12.2). The overall meta‐analysis estimate of association between MMR vaccination and ITP in children aged 9 to 23 months was rr 4.21 (95% CI 2.28 to 7.78). There was no statistical evidence in children aged 4 to 6 years (rr 3.06, 95% CI 0.42 to 22.30), and no statistical evidence of association between MMRV vaccination and ITP in children aged 9 to 23 months (rr 2.87, 95% CI 0.78 to 10.56). The latter two results came from one study (db‐O'Leary 2012).
Evidence from case‐only ecological method studies
The evidence of association between MMR or any of its component vaccines and the onset of thrombocytopenic purpura was also assessed in one ecological study (gb‐Jonville‐Bera 1996). The study concluded that the evidence favoured an association, but in all cases thrombocytopenic purpura appeared to be a benign, self‐limiting condition not distinguishable from its idiopathic counterpart or from thrombocytopenic purpura occurring after natural infection with MMR. The study discussed the weakness of relying on the passive reporting system for the identification of cases and acknowledged a possible under‐reporting of cases of thrombocytopenic purpura.
The results confirm an association between MMR vaccination and ITP. However, the risk of ITP after vaccination is smaller than the one after natural infection with these viruses (bb‐Bertuola 2010; Cecinati 2013). bb‐Bertuola 2010 reported that natural infection of ITP occurs in 5 cases per 100,000 children per year, with a prevalence of 4 to 6 per 100,000. The attributable risk was estimated to be about 1 ITP case per 40,000 administered MMR doses (Cecinati 2013; db‐Andrews 2012; db‐France 2008). bb‐Black 2003 and db‐Farrington 1995 estimate the attributable risk of ITP within six weeks after MMR vaccination about 1 case per 25,000 (95% CI 21,300 to 89,400).
13. Safety: Henoch‐Schönlein purpura
One case control study estimated the association of Henoch‐Schönlein purpura with drug and vaccine (MMR and diphtheria, tetanus, and pertussis (DTaP) vaccine) administration in a paediatric population (bb‐Da Dalt 2016). See Table 20 and summary of findings Table 13.
Comparison 13.1 (Analysis 13.1). The estimate showed statistical evidence of an association between MMR vaccine and Henoch‐Schönlein purpura (OR 3.40, 95% CI 1.18 to 9.81).
The result confirmed an association between MMR and Henoch‐Schönlein purpura. However, Henoch‐Schönlein purpura is the most common vasculitis in childhood with an incidence of 10 to 20 cases per 100,000 in children under 17 years, with a peak incidence of 70 cases per 100,000 in the 4‐ to 6‐year age group (bb‐Da Dalt 2016).
14. Safety: type 1 diabetes
Two cohort studies reported on type 1 diabetes (cb‐Beyerlein 2017; cb‐Hviid 2004). See Table 21 and summary of findings Table 14.
cb‐Beyerlein 2017 analysed data from two German birth cohorts of healthy neonates with a familial increased risk of type 1 diabetes, the BABYDIAB study and the BABYDIET natural follow‐up study, which were combined for association analyses of vaccination patterns and the development of islet autoimmunity. Between 1989 and 2000, a total of 1650 children of people with type 1 diabetes were recruited. Between 2000 and 2006, 791 additional children or siblings of people with type 1 diabetes were screened and followed up. cb‐Hviid 2004 was a retrospective cohort study carried out in Denmark aiming to evaluate if there was an association between childhood vaccinations and the onset of type 1 diabetes. A cohort of children born between 1 January 1990 and 31 December 2000 from the Danish Civil Registration System was recruited.
Comparison 14.1 (Analysis 14.1). The overall meta‐analysis result did not provide evidence supporting an association between MMR vaccination and type 1 diabetes (rr 1.09, 95% CI 0.98 to 1.21). In addition, restricting the analysis to children with at least one sibling with type 1 diabetes did not show evidence of an association (rr 0.86, 95% CI 0.34 to 2.16).
15. Safety: asthma
Five cohort studies reported on asthma (cb‐Benke 2004; cb‐DeStefano 2002; cb‐Hviid 2008; cb‐McKeever 2004; cb‐Timmermann 2015). See Table 22 and summary of findings Table 15.
As the studies provided insufficient information to enable us to convert rate ratio (hazard ratio) into RR, we performed two meta‐analyses: Analysis 15.1 includes cb‐DeStefano 2002, cb‐Hviid 2008, and cb‐McKeever 2004, where rate ratio was adopted as the effect measure, and Analysis 15.2 includes cb‐Benke 2004 and cb‐Timmermann 2015, where RR was adopted.
The cohort study cb‐McKeever 2004 used an historical birth cohort of children (from 1988 to 1999) consisting of 29,238 children of both sexes aged between 0 and 11 years and identified through the West Midlands General Practice Research Database (GPRD), to investigate the association between MMR and diphtheria, polio, pertussis, and tetanus (DPPT) vaccination and asthma or eczema (Table 22). Incident diagnoses of asthma/wheeze and eczema (Table 22) were identified using the relevant Oxford Medical Information System (OMIS, derived from the International Classification of Diseases, Revision 8 (ICD‐8)) and Read codes (a hierarchical code used in general practitioner (GP) practices in England). Association with MMR vaccine exposure and risk of asthma was assessed by univariate analyses. Adjusted hazard ratios (HR) were 2.20 (95% CI 1.50 to 3.21) for asthma. Stratifying for GP consultation frequency in the first 18 months, HR estimates remained significant only for the subgroup with lower consulting frequency (0 to 6 times in the first 18 months), and not for the other subgroups (7 to 10 times, 11 to 16 times, and more than 16 times): HR 7.18 (95% CI 2.95 to 17.49) for an association between MMR vaccination and asthma. cb‐Hviid 2008 shows a protective effect of MMR vaccination against asthma hospitalisation and anti‐asthma medications (Table 22). The study was conducted on Danish birth cohorts from 1991 to 2003 using the Danish Civil Registration System. Each participant recorded in the register had an identification number that allowed a link to data contained in other national registers (Danish National Hospital Register, Danish Prescription Drug Database, and National Board of Health). MMR vaccination status was considered as a time‐varying variable, and individuals could contribute to person‐time as both unvaccinated and vaccinated participants. MMR vaccination is protective against all asthma hospitalisations (RR 0.75, 95% CI 0.73 to 0.78); the protective effect of vaccination was greater in younger children (no more significant when the vaccine was administered after 18 months of age), in those with the longest time spent in hospital (18 days to 1 year), in girls, in low‐birthweight children, in children with 1 older sibling, and in those living in rural areas. Vaccination was also protective against hospitalisation for severe asthma (RR 0.63, 95% CI 0.49 to 0.82), even if estimates were not significant within the following stratifications: aged 3 to 4 years; fully immunised children; low hospitalisation propensity; male sex; birthweight below 2499 g or above 4000 g; birth order >/= 3; or born in the capital or in a rural area. Total use of anti‐asthma medications was less frequent amongst participants immunised with MMR (RR 0.92, 95% CI 0.91 to 0.92). No reduction in use of all medications was observed for participants vaccinated between 23 and 26 months old (RR 1.00, 95% CI 0.98 to 1.01) or at 27 months old or later (RR 1.01, 95% CI 0.99 to 1.03). Considering single classes of medication in the unstratified study population, these data were confirmed with the exception for systemic beta2‐agonists, for which reduction in use was not observed (RR 1.02, 95% CI 1.01 to 1.02). Considering only the first use of any anti‐asthma medication in the unstratified population, the RR was 0.93 (95% CI 0.92 to 0.94). Also, cb‐Timmermann 2015 showed a protective effect against asthma. The study was conducted on a birth cohort of consecutive, spontaneous births in the Faroe Islands from 1997 to 2000.
Comparison 15.1 (Analysis 15.1). The overall rr estimate did not provide evidence supporting an association between asthma diagnosis and MMR vaccination (rr 1.05, 95% CI 0.80 to 1.39). Excluding a study at high risk of bias, the new estimate did not show evidence of association (rr 0.85, 95% CI 0.66 to 1.10).
Comparison 15.2 (Analysis 15.2). The overall RR estimate did not provide evidence supporting an association between asthma diagnosis and MMR vaccination (RR 0.63, 95% CI 0.24 to 1.63). Excluding a study at high risk of bias, the new estimate based on cb‐Timmermann 2015 showed evidence of a protective effect of MMR vaccination against asthma (RR 0.39, 95% CI 0.22 to 0.70).
The results did not show evidence supporting an association between MMR vaccination and asthma risk. The association between MMR vaccination and asthma found by cb‐McKeever 2004 appeared to be limited to the minority of children. This limited association is more likely to be the result of bias than a biological effect.
16. Safety: eczema ‐ dermatitis
Two cohort studies reported data on dermatitis/eczema (cb‐McKeever 2004; cb‐Timmermann 2015). See Table 23 and summary of findings Table 16.
The cb‐McKeever 2004 cohort study used an historical birth cohort of children from 1988 to 1999 consisting of 29,238 children of both sexes aged between 0 and 11 years and identified through the West Midlands General Practice Research Database (GPRD) to investigate the association between MMR and DPPT vaccination and asthma or eczema (Table 23). Incident diagnoses of asthma/wheeze and eczema (Table 23) were identified using the relevant Oxford Medical Information System (OMIS, derived from ICD‐8) and Read codes (a hierarchical code used in GP practices in England). Association with MMR vaccine exposure and the risk of asthma and eczema was assessed by univariate analysis. Correspondent adjusted rate ratio was 3.50 (95% CI 2.38 to 5.15) for eczema (Analysis 16.1). Stratifying for GP consultation frequency in the first 18 months, HR estimates remained significant only for the subgroup with lower consulting frequency (0 to 6 times in the first 18 months) and not for the other subgroups (7 to 10 times, 11 to 16 times, and more than 16 times) for the association between MMR vaccination and asthma (HR 7.18, 95% CI 2.95 to 17.49) and the association between MMR vaccination and eczema (HR 10.4, 95% CI 4.61 to 23.29). Instead, cb‐Timmermann 2015 did not show evidence of an association between MMR vaccination and risk of eczema (RR 0.75, 95% CI 0.29 to 1.94; Analysis 16.2).
Data suggest that currently MMR vaccinations are not a risk factor for eczema. The association found between MMR vaccination and eczema by cb‐McKeever 2004 appeared to be limited to a small subset of children. This limited association is more likely to be the result of bias than a biological effect.
17. Safety: hay fever, rhinoconjunctivitis, hypersensitivity/allergy
Three studies reported data on hay fever/rhinoconjunctivitis/allergy: 1 cohort study, cb‐Timmermann 2015, and 2 case‐control studies (bb‐Bremner 2005; bb‐Bremner 2007). See Table 24 and summary of findings Table 17.
Evidence from cohort studies
Comparison 17.1 (Analysis 17.1). The estimate did not provide evidence supporting an association between MMR vaccination and rhinoconjunctivitis (OR 0.64, 95% CI 0.19 to 2.11).
Comparison 17.2 (Analysis 17.2). The estimate did not provide evidence supporting an association between MMR vaccination and hypersensitivity/allergy (OR 0.63, 95% CI 0.14 to 2.77).
Evidence from case‐control studies
The two case‐control studies investigated the risk of hay fever in MMR‐vaccinated children in the UK (using the same data source) (bb‐Bremner 2005; bb‐Bremner 2007). The bb‐Bremner 2005 study focused particular attention on the timing of MMR vaccination to identify a critical period for MMR immunisation and hay fever risk (see Table 24 for definitions). The nested case‐control study was conducted within two large databases, the General Practice Research Database (GPRD) and Doctors’ Independent Network (DIN), and involved 7098 hay fever cases and controls. Data were reported by month of life (1st to 13th; 14th, 15th, 16th to 17th, 18th to 24th, and > 25th) by database (GPRD and DIN). bb‐Bremner 2007 specifically investigated if exposure to MMR vaccination during the first grass pollen season of life influences the risk of hay fever more than any other time of the year. The study was conducted within GPRD and DIN databases and involved 7098 hay fever cases matched with controls.
Comparison 17.3 (Analysis 17.3). The overall meta‐analysis estimate did not provide evidence supporting an association between MMR vaccination and hay fever (OR 1.16, 95% CI 0.92 to 1.45). The results showed that infants vaccinated with MMR are not at a greater or lesser risk of developing hay fever or rhinoconjunctivitis than unvaccinated children.
18. Safety: acute leukaemia
Four case‐control studies reported data on acute leukaemia (bb‐Dockerty 1999; bb‐Groves 1999; bb‐Ma 2005; bb‐Mallol‐Mesnard 2007). See Table 25 and summary of findings Table 18.
Four case‐control studies assessed whether vaccination with MMR (and other vaccines) played a role in the aetiology of leukaemia in children aged between 0 and 14 years (Table 25) (bb‐Dockerty 1999; bb‐Groves 1999; bb‐Ma 2005; bb‐Mallol‐Mesnard 2007).
Comparison 18.1 (Analysis 18.1). The overall meta‐analysis estimate did not provide evidence supporting an association between MMR vaccination and acute leukaemia (OR 0.97, 95% CI 0.76 to 1.24) or acute lymphoblastic leukaemia (OR 0.91, 95% CI 0.72 to 1.14). Moreover, the overall estimate did not provide evidence supporting an association with acute myeloblastic leukaemia (OR 0.56, 95% CI 0.29 to 1.07).
The results showed no evidence of an association between MMR vaccination and the risk of leukaemia.
19. Safety: demyelinating diseases, multiple sclerosis, acute disseminated encephalomyelitis
The possible association between the MMR vaccine and demyelinating diseases was assessed in three studies: 1 cohort study, cb‐Ahlgren 2009, and 2 case‐control studies (bb‐Ahlgren 2009; bb‐Chen 2018). See Table 26 and summary of findings Table 19.
Two studies used the same population data set (bb‐Ahlgren 2009; cb‐Ahlgren 2009). cb‐Ahlgren 2009 was a cohort study carried out in the Gothenburg area (Swedish west coast, 731,592 residents on 31 December 2000). Cases of multiple sclerosis and clinically isolated syndrome in participants born between 1959 and 1990 with onset between 10 and 39 years of age before July 1984 amongst Gothenburg residents were considered, corresponding to a total of 5.9 million person‐years of observation (Table 26). The incidence of probable or definite multiple sclerosis (Poser criteria) and clinically isolated syndrome (372 and 162 cases, respectively) was analysed in corresponding MMR vaccination programmes, by selecting four birth cohorts corresponding to the first years of a specific vaccination programme.
-
Birth cohorts 1962 to 1966 (102 multiple sclerosis cases): administration of the monovalent rubella vaccine to 12‐year‐old girls in 1974.
-
Birth cohorts 1970 to 1973 (62 multiple sclerosis cases): administration of the MMR vaccine at 12 years of age (1982).
-
Birth cohorts 1974 to 1978 (37 multiple sclerosis cases): administration of monovalent measles vaccine in preschool children. (It was already introduced in 1971, thus adequate coverage was reached only for those born in 1974 and onwards). About 90% of participants from these birth cohorts received the MMR vaccine at 12 years of age.
-
Born between July 1981 and June 1984 (five multiple sclerosis cases): administration of the MMR vaccine at 18 months and 12 years of age.
The incidence of multiple sclerosis and clinically isolated syndrome within each birth cohort was compared to that calculated for the preceding ones, including that of 1959 to 1961, corresponding to the pre‐vaccine era. No significant changes in age and gender‐specific incidence of multiple sclerosis between selected and preceding selected cohorts was observed. The authors used the same population incidence data in order to assess an association between MMR exposure and multiple sclerosis onset by means of a case‐control design (bb‐Ahlgren 2009). Similar to the cohort study, case definitions included multiple sclerosis or clinically isolated syndrome according to Poser's criteria, residence in Gothenburg, birth date between 1959 and 1986, and disease onset from the age of 10 years onwards. For analysis of vaccine exposure, only cases and controls who attended the sixth grade in school (12 years) within the study area, for whom child health and school health records were available (206 cases and 888 controls), were included.
Evidence from case‐control studies
Comparison 19.1 (Analysis 19.1). The estimate did not show evidence supporting an association between MMR vaccination and multiple sclerosis (OR 1.13, 95% CI 0.62 to 2.05). The estimate did not show evidence supporting an association between MMR vaccination and acute disseminated encephalomyelitis (OR 1.03, 95% CI 0.44 to 2.42).
The results did not show evidence supporting an association between MMR vaccination and the risk of demyelinating diseases.
20. Safety: gait disturbance
An association between MMR vaccination and gait disturbance was assessed by means of an SCCS, db‐Miller 2005, and considered as cases of hospital admissions (Analysis 20.1) or general practice consultations (Analysis 20.2) in children from the Thames regions of England. Hospital admission cases were obtained from hospital computerised records from April 1995 to June 2001 and considered those relative to children aged 12 to 24 months with ICD‐10 diagnoses related to acute gait disorder (G111, G112, G25, R26, R27, R29, H55, and F984). Cases were validated by reviewing hospital case notes and were grouped into five categories. See Table 27 and summary of findings Table 20.
The vaccination history of cases was obtained from immunisation records. In all, 127 cases with available immunisation status were identified. Of these, 65 belonged to category 4 (i.e. non‐ataxic, non‐viral origin) and were excluded from analysis. No cases corresponding to category 1 definition were found.
Evidence from self‐controlled case series
Comparison 20.1 (Analysis 20.1). The rr within and outside postvaccination time risk (0 to 30 and 31 to 60 days) was calculated after age stratification in one‐month intervals. Rate ratio (rr) estimates for pooled 2, 3, and 5 categories showed no evidence of an association between MMR vaccination and hospitalisations for gait disturbance for 0 to 30 days' risk time (rr 0.83, 95% CI 0.24 to 2.86); 31 to 60 days' risk time (rr 0.20, 95% CI 0.03 to 1.40); and 0 to 60 days' risk time (rr 0.46, 95% CI 0.16 to 1.34).
As gait disturbance does not require hospitalisation, the authors carried out a further analysis based on cases observed in general practices using the General Practice Research Database (GPRD) as the source, and considered children aged 12 to 24 months, born between 1988 and 1997. Read and OXMIS codes indicating a possible consult for gait disturbance were identified in the GPRD by mapping ICD‐9 codes and by searching keywords 'ataxia', 'gait', 'co‐ordination', 'mobility', and 'movement'. Diagnoses were grouped into six categories (Table 27). Vaccination history was obtained from prescription records. In all, 1398 children with diagnoses A to F and known immunisation history were included.
Comparison 20.2 (Analysis 20.2). The relative incidence (RI) within and outside postvaccination time risk (0 to 5, 6 to 30, 31 to 60 days) was calculated. Rate ratio (rr) estimate for 0 to 5 days' risk time shows evidence of association between MMR vaccination and hospitalisations for gait disturbance (rr 1.88, 95% CI 1.30 to 2.72). However, estimates in any other risk period showed no evidence of association for 6 to 30 days' risk time (rr 0.90, 95% CI 0.70 to 1.16); 31 to 60 days' risk time (rr 0.95, 95% CI 0.76 to 1.18); and 6 to 60 days' risk time (rr 0.93, 95% CI 0.78 to 1.11). Early administration of thiomersal‐containing diphtheria, tetanus, and pertussis (DTP)/ diphtheria tetanus (DT) vaccine did not influence this estimate.
The results did not show evidence supporting an association between MMR vaccination and gait disturbance.
In the study authors' opinion, a vaccine‐specific effect would appear one week after immunisation. An excess of B and C diagnoses was observed on vaccination day, caused by an excess of consultations on the day that MMR was given. It is biologically implausible that any specific MMR effect would manifest on the day of vaccination since the viraemia induced by the vaccine, which might produce symptoms, does not start until the end of the first week (db‐Miller 2005).
21. Safety: bacterial or viral infections, immune overload
The incidence of viral and bacterial infection following MMR administration was investigated by means of a SCCS design by db‐Miller 2003 and db‐Stowe 2009. See Table 28 and summary of findings Table 21.
Episodes of hospitalisation for bacterial or viral infections occurring in children aged between 12 and 23 months were identified by consulting computerised hospital admission records from southern England using ICD‐9 or ICD‐10 codes between April 1991 and March 1995 (db‐Miller 2003); and occurring in children aged between 12 and 23 months were identified by consulting computerised hospital admission records from North, East, and South London, Essex, East Anglia, Sussex, and Kent using ICD‐9 or ICD‐10 codes and covering the time between 1 April 1995 and 1 May 2005 (db‐Stowe 2009). Bacterial infections were characterised as lobar pneumonia or invasive bacterial infection, whereas those of viral aetiology were encephalitis/meningitis, herpes, pneumonia, varicella zoster, or miscellaneous virus (Table 28). Admissions were linked to date of MMR (and meningococcal) immunisation resulting from records held on child health systems. 'At risk' time periods were considered to be the whole risk period (0 to 90) days after immunisation, and subperiods: (0 to 30), (31 to 60), and (61 to 90) days after immunisation.
Comparison 21.1 (Analysis 21.1). The overall meta‐analysis estimate showed that admissions for lobar pneumonia were less frequent in the time between 0 and 90 days after MMR immunisation (protective effect of the MMR vaccine) (rr 0.75, 95% CI 0.64 to 0.89).
Comparison 21.2 (Analysis 21.2). The estimate did not show evidence supporting an association between MMR vaccination and risk of hospitalisations due to invasive bacterial diseases (rr 0.90, 95% CI 0.71 to 1.13) for the whole risk period (0 to 90 days). In addition, no evidence of an association was shown considering the other risk subperiods.
Comparison 21.3 (Analysis 21.3). The estimate did not show evidence supporting an association between MMR vaccination and encephalitis/meningitis (rr 0.84, 95% CI 0.20 to 3.51) for the whole risk period (0 to 90 days) and other risk subperiods.
Comparison 21.4 (Analysis 21.4). The risk of hospitalisation due to herpes infection was higher in the risk time interval between 31 and 60 days after MMR vaccine administration (rr 1.69, 95% CI 1.06 to 2.70), but this risk was not statistically significant. Data showed no evidence of association considering the other risk subperiods and the whole risk period (0 to 90 days) (rr 1.17, 95% CI 0.56 to 2.46).
Comparison 21.5 (Analysis 21.5). The estimate did not show evidence supporting an association between MMR vaccination and hospitalisations due to pneumonia (rr 0.72, 95% CI 0.32 to 1.60) for the whole risk period (0 to 90 days) and the other risk subperiods.
Comparison 21.6 (Analysis 21.6). A significantly lower incidence of varicella zoster was assessed within 30 days after MMR immunisation (protective effect) (rr 0.58, 95% CI 0.34 to 0.99). However, the estimate did not show evidence supporting an association considering the whole risk period (rr 0.93, 95% CI 0.68 to 1.27) and other subperiods.
Comparison 21.7 (Analysis 21.7). The estimate did not show evidence supporting an association between MMR vaccination and hospitalisations due to other viral infections (rr 0.68, 95% CI 0.43 to 1.08) for the whole risk period (0 to 90 days) and the other risk subperiods. No statistically significant risk of both bacterial and viral infection was detected following concomitant administration of MMR and meningococcal C vaccine.
The studies confirmed that the MMR vaccine does not increase the risk of invasive bacterial or viral infection in the 90 days after the vaccination and does not support the hypothesis that there is an induced immune deficiency due to overload from multi‐antigen vaccines (db‐Miller 2003; db‐Stowe 2009).
Discussion
Summary of main results
MMR vaccination is ≥ 95% effective in preventing clinically confirmed measles in preschool children. Effectiveness is 95% after one dose (7 cohort studies, n = 12,039) and 96% after two doses (5 cohort studies n = 21,604). The estimates were similar for each of the two measles strains with which participants had been immunised (Schwarz or Edmonston‐Zagreb, 1 cohort study, n = 2745). Effectiveness in preventing secondary measles cases amongst household contacts or preventing transmission of measles to people with which the children were in contact was 81% after one dose (3 cohort studies, 151 participants), 85% after two doses (3 cohort studies, 378 participants), and 96% after three doses (2 cohort studies, 151 participants). The effectiveness of MMR vaccination (at least one dose) in preventing measles after postexposure prophylaxis (at least one dose) was 74% (2 cohort studies, 283 participants). The effectiveness of Jeryl Lynn‐containing MMR vaccine in preventing clinical mumps in children and adolescents was 72% after one dose (6 cohort studies, 9915 participants) and 86% after two doses (5 cohort studies, 7792 participants). The effectiveness of Jeryl Lynn‐containing MMR vaccine in preventing mumps being passed on to contacts was 74% (3 cohort studies, 1036 participants). The Urabe strain was also effective at 77% (4 cohort studies, 2721 participants).
We found no evidence of effect from administering a third MMR dose to prevent mumps among children aged between 9 and 17 years (2 cohort studies, N = 5417). There is an acceptably high effectiveness of the vaccine prepared only with Urabe or Jeryl Lynn strain, but not for vaccines containing the Rubini strain. MMR vaccination effectiveness against rubella is 89%, (1 cohort study, N = 1621). However, this is based on only one cohort study in China using the BRD2 strain (ca‐Chang 2015). This strain is not used anywhere else in the world, and higher vaccine effectiveness has been reported with other strains. MMRV vaccination effectiveness against varicella (any severity) after two doses is 95%; effectiveness against varicella (moderate/severe) is 99%. MMR+V vaccination effectiveness is 67% against any severity of varicella. Effectiveness is 90% against moderate/severe varicella, and 95% against severe varicella (1 RCT, N = 2279).
Association with aseptic meningitis is confirmed for MMR vaccines containing Urabe and Leningrad‐Zagreb mumps strains on the basis of two very large studies at unclear risk of bias, carried out on about 2 million children aged 1 to 11 years and assessing a significant increased risk in the time between 1 and 10 weeks after immunisation, peaking within the third or fifth week. No evidence of association was found for vaccines prepared with mumps Jeryl Lynn strains in results from one case‐control study and one self‐controlled case series study.
We have identified associations between MMR/MMRV/MMRV (containing Jeryl Lynn strain) vaccines and febrile seizures (15 studies, N = 2,166,172). To correctly interpret this association, we must consider that vaccine‐induced febrile seizures is an infrequent event, both amongst non‐vaccinated and vaccinated people. cb‐Gavrielov‐Yusim 2014 reported that febrile seizures normally occur in 2% to 4% of healthy children at least once before the age of 5 years. The risk difference (RD) of febrile seizures amongst vaccinated and unvaccinated was RD 0.16% (95% CI 0.14% to 0.17%). The cumulative risk of having a febrile seizure after vaccination ranges from 0.15% to 0.29%. The attributable risk is estimated to be from 1:1700 to 1:1150 MMR administered doses.
The results confirm an association between MMR vaccination and idiopathic thrombocytopenic purpura (ITP). However, the risk of ITP after vaccination is smaller than the risk after natural infection with these viruses. bb‐Bertuola 2010 reported that natural infection of ITP occurs in 5 cases per 100,000 children per year, with a prevalence of 4 to 6 per 100,000. The attributable risk is estimated to be about 1 ITP case per 40,000 administered MMR doses. The studies estimated the attributable risk of ITP within six weeks after MMR vaccination to be about 1 case/25,000 (95% CI 1/21,300 to 1/89,400) doses. The result confirms an association between MMR and Henoch‐Schönlein purpura. However, Henoch‐Schönlein purpura is the most common vasculitis in childhood with an incidence of 10 to 20 cases per 100,000 in children under 17 years of age, with a peak incidence of 70 cases per 100,000 in the 4‐ to 6‐year age group. Association with acute or idiopathic thrombocytopenic purpura within six weeks of immunisation is assessed in nine studies (n = 6300), but vaccine composition is described in only three studies (db‐Farrington 1995; db‐Perez‐Vilar 2018; gb‐Jonville‐Bera 1996).
Based on the included studies, the meta‐analysis does not provide evidence supporting an association between MMR immunisation and the following conditions: encephalitis or encephalopathy (3 studies, around 500,000 children), autism spectrum disorders (13 studies, around 2 million children), inflammatory bowel disease/Crohn's disease (6 studies, N = 2385 children), cognitive delay (1 study, N = 369 children), type 1 diabetes (2 studies, around 770,000 children), asthma (5 studies, around 1 million children), dermatitis/eczema (2 studies, around 15,000 children), hay fever (3 studies, around 120,000 children), leukaemia (4 studies, N = 4318 children), demyelinating diseases/multiple sclerosis (3 studies, around 730,000 children), gait disturbance (1 study, N = 1525 children), and bacterial or viral infections (2 studies, N = 2412 children).
Overall completeness and applicability of evidence
Internal and external validity of included studies has improved in recent years (Table 30).
Quality of the evidence
Of the 138 included studies, we classified 36% as at low risk of bias with reliable results; 42% as at unclear risk of bias due to a problematic aspect of the study (generally selection bias), but the results remain sufficiently reliable; and 22% as at high risk of bias (Figure 3), for which we found problematic internal validity, and the biases present in the studies (selection, performance, attrition, detection, and reporting) influenced our confidence in their findings. The most common type of bias was selection bias. We analysed reasons presented in the papers to justify missing data. Whilst we accepted as adequate such explanations as 'non‐response to questionnaire' and 'medical records unavailable', not all reports offered adequate explanations for missing data. The overall quality assessment by study design is shown in Table 29 and by publication year in Table 30.
Of the 51 studies on MMR effectiveness, 42 were funded by public or government institutions, and only 5 by the pharmaceutical industry. Of the 87 studies on MMR/MMRV safety, 65 were funded by public or government institutions, 9 by the pharmaceutical industry, and 10 studies were funded in part by industry and in part by government or public institutions.
Potential biases in the review process
There are some weaknesses in our review. The age limit of participants, although substantially justified by public health concerns about the effects of vaccination on the developing child, did lead us to exclude some studies on this basis alone. Additionally, the methodological quality tools used to assess the case‐only designs have not, to our knowledge, been empirically tested. We believe this had a minimal impact on our findings, given the size and nature of the biases present in the design and reporting of the included studies. The range of differing study designs used by authors is partly a reflection of the lack of 'control' children not exposed to MMR, due to the population nature of vaccination programmes. As MMR vaccine is universally recommended, recent studies are constrained by the lack of a non‐exposed control group. This is a methodological difficulty that is likely to be encountered in all comparative studies of established childhood vaccines. We were unable to include some of the retrieved studies because a comparable, clearly defined control group or risk period was not available. This exclusion may be a limitation of our review, or may reflect a more fundamental methodological dilemma: how to carry out meaningful studies in the absence of a representative population not exposed to a vaccine that is universally used in public health programmes? Whichever view one takes, we believe that meaningful inferences from individual studies that lack a non‐exposed control group are difficult to make.
The hypothesis that secondary vaccine failure (waning immunity) could occur and increase over the years after the last immunisation has been considered in some studies (ca‐Greenland 2012; ca‐Nelson 2013; ca‐Ogbuanu 2012), but it needs to be better explained. Two studies, Briss 1994; Hersh 1991, carried out in the USA during mumps epidemics on high school students having high vaccination coverage (over 97% received at least one mumps‐containing vaccine dose before the outbreak), showed that the risk of acquiring mumps was higher in participants who were vaccinated at least three, Briss 1994, or five years, Hersh 1991, before the outbreak, than in those who were more recently vaccinated. This estimate was not statistically relevant. Linear regression analysis demonstrated no significant trend for increasing mumps attack rates by years since last vaccination, after either one or two mumps‐containing vaccine doses (Schaffzin 2007). A Belgian study carried out on pupils from seven kindergartens and primary schools in Bruges (age range 3 to 12 years) during a mumps epidemic in 1995 and 1996 estimated that the odds of developing mumps increased 27% per one‐year increase, from one year after the last MMR immunisation onwards (Vandermeulen 2004). A case‐cohort study carried out at the University in Kansas, USA, during the 2006 outbreak showed that case patients were more likely than their roommates without mumps to have received the second MMR dose more than 10 years before (OR 2.50, 95% CI 1.28 to 5.00) (Cortese 2008). Waning immunity may be secondary to a lack of natural exposure (Cortese 2008; Dayan 2008a). The group with the highest mumps incidence during the 2006 outbreak in the USA were college‐age students (18 to 24 years) born during the 1980s, when the spread of mumps was so low that many of them were never exposed to the disease. They probably received a second dose in the early 1990s, when opportunities for booster shots against exposure to wild viruses became increasingly rare (Dayan 2008a). Moreover, the risk of the contracting mumps virus from abroad should be considered, because in several countries, mumps vaccination was not routinely administered (Cohen 2007; Dayan 2008a). Apart from waning immunity, it must be considered that mumps strains used in vaccine preparation differed phylogenically from those isolated during recent mumps outbreaks (Dayan 2008a; Dayan 2008b). These facts could explain, at least in part, the vaccine failure observed during some mumps outbreaks.
Agreements and disagreements with other studies or reviews
This is currently the only review covering both effectiveness and safety issues of MMR, MMR+V, and MMRV vaccines. In agreement with results from other studies and reviews, we did not find a significant association between autism and MMR exposure. The Wakefield 1998 study which links MMR vaccination with autism has been fully retracted (Editors of the Lancet 2010), as Wakefield was found guilty of ethical, medical, and scientific misconduct in the publication of the paper. Many other authors have shown that the Wakefield data were fraudulent (Flaherty 2011). A formal retraction of the interpretation that there was a causal link between MMR vaccine and autism was issued in 2004 by 10 of the 12 original co‐authors (Murch 2004). In 1998, an excessive and unjustified media coverage of this small study had disastrous consequences (Flaherty 2011; Hilton 2007; Offit 2003; Smith 2008), such as distrust of public health vaccination programmes and suspicion about vaccine safety. The consequence of this was a significant decrease in MMR vaccine coverage and re‐emergence of measles in the UK.

Flow diagram (simplified version).

Flow diagram (complete).

Risk of bias graph: review authors' judgements about each risk of bias item presented as percentages across all included studies.

Risk of bias summary: review authors' judgements about each risk of bias item for each included study.

Comparison 1: Effectiveness against measles, Outcome 1: Cohort studies (vaccinated vs unvaccinated)

Comparison 1: Effectiveness against measles, Outcome 2: Cohort studies (household contacts: vaccinated vs unvaccinated)

Comparison 1: Effectiveness against measles, Outcome 3: Cohort studies (postexposure prophylaxis: vaccinated vs unvaccinated)

Comparison 1: Effectiveness against measles, Outcome 4: Case‐control studies

Comparison 2: Effectiveness against mumps, Outcome 1: Cohort studies ‐ Jeryl Lynn strain

Comparison 2: Effectiveness against mumps, Outcome 2: Cohort studies ‐ Urabe strain

Comparison 2: Effectiveness against mumps, Outcome 3: Cohort studies ‐ Rubini strain

Comparison 2: Effectiveness against mumps, Outcome 4: Cohort studies ‐ mumps strain not reported or mixed

Comparison 2: Effectiveness against mumps, Outcome 5: Cohort studies ‐ 3 doses vs 2 doses

Comparison 2: Effectiveness against mumps, Outcome 6: Case‐control studies ‐ Jeryl Lynn strain

Comparison 2: Effectiveness against mumps, Outcome 7: Case‐control studies ‐ Jeryl Lynn strain ‐ lab‐confirmed cases

Comparison 2: Effectiveness against mumps, Outcome 8: Case‐control studies ‐ Urabe strain

Comparison 2: Effectiveness against mumps, Outcome 9: Case‐control studies ‐ Rubini strain

Comparison 2: Effectiveness against mumps, Outcome 10: Case‐control studies ‐ strain type not reported or any strain

Comparison 3: Effectiveness against rubella, Outcome 1: Cohort studies secondary cases

Comparison 4: Effectiveness against varicella, Outcome 1: MMRV randomised clinical trial ‐ any severity

Comparison 4: Effectiveness against varicella, Outcome 2: MMRV randomised clinical trial ‐ moderate/severe cases

Comparison 4: Effectiveness against varicella, Outcome 3: MMR+V randomised clinical trial ‐ any severity

Comparison 4: Effectiveness against varicella, Outcome 4: MMR+V randomised clinical trial ‐ moderate/severe cases

Comparison 4: Effectiveness against varicella, Outcome 5: MMR+V randomised clinical trial ‐ severe cases

Comparison 4: Effectiveness against varicella, Outcome 6: MMRV cohort study

Comparison 4: Effectiveness against varicella, Outcome 7: MMRV case‐control

Comparison 4: Effectiveness against varicella, Outcome 8: MMR+V case control

Comparison 4: Effectiveness against varicella, Outcome 9: MMRV case only ecological method ‐ hospitalisation

Comparison 4: Effectiveness against varicella, Outcome 10: MMRV case only ecological method ‐ incidence

Comparison 5: Safety: short‐term side effects (local or systemic reactions), Outcome 1: Temperature

Comparison 5: Safety: short‐term side effects (local or systemic reactions), Outcome 2: Rash

Comparison 5: Safety: short‐term side effects (local or systemic reactions), Outcome 3: Lymphadenopathy

Comparison 5: Safety: short‐term side effects (local or systemic reactions), Outcome 4: Coryza

Comparison 5: Safety: short‐term side effects (local or systemic reactions), Outcome 5: URTI (rhinitis, pharyngitis)

Comparison 5: Safety: short‐term side effects (local or systemic reactions), Outcome 6: Cough

Comparison 6: Safety: encephalitis or encephalopathy, Outcome 1: Case‐control: MMR (risk interval from 0 to 90 days)

Comparison 6: Safety: encephalitis or encephalopathy, Outcome 2: Self‐controlled case series/person‐time cohort

Comparison 7: Safety: aseptic meningitis, Outcome 1: Case‐control ‐ case cross‐over

Comparison 7: Safety: aseptic meningitis, Outcome 2: Self‐controlled case series (SCCS)/person‐time cohort (PT)

Comparison 7: Safety: aseptic meningitis, Outcome 3: Case only ecological method (COEM)

Comparison 8: Safety: seizures (febrile/afebrile), Outcome 1: Cohort studies

Comparison 8: Safety: seizures (febrile/afebrile), Outcome 2: Self‐controlled case series/person‐time cohort

Comparison 8: Safety: seizures (febrile/afebrile), Outcome 3: MMRV versus MMR+V

Comparison 8: Safety: seizures (febrile/afebrile), Outcome 4: MMRV versus MMR+V ‐ by brand

Comparison 8: Safety: seizures (febrile/afebrile), Outcome 5: MMRV versus MMR

Comparison 8: Safety: seizures (febrile/afebrile), Outcome 6: MMRV versus MMR ‐ by brand

Comparison 9: Safety: autism spectrum disorders, Outcome 1: Cohort studies

Comparison 9: Safety: autism spectrum disorders, Outcome 2: Case‐control

Comparison 9: Safety: autism spectrum disorders, Outcome 3: Self‐controlled case series/person‐time cohort

Comparison 9: Safety: autism spectrum disorders, Outcome 4: Case only ecological method

Comparison 10: Safety: inflammatory bowel disease (IBD), Outcome 1: Case‐control

Comparison 10: Safety: inflammatory bowel disease (IBD), Outcome 2: Case‐only ecological method (rate ratio)

Comparison 10: Safety: inflammatory bowel disease (IBD), Outcome 3: Case only ecological method (odds ratio)

Comparison 11: Safety: cognitive delay ‐ developmental delay, Outcome 1: Cohort study

Comparison 12: Safety: idiopathic thrombocytopenic purpura, Outcome 1: Case‐control ‐ case cross‐over

Comparison 12: Safety: idiopathic thrombocytopenic purpura, Outcome 2: Self‐controlled case series

Comparison 13: Safety: Henoch‐Schönlein purpura, Outcome 1: Case‐control

Comparison 14: Safety: type 1 diabetes, Outcome 1: Cohort study MMR

Comparison 15: Safety: asthma, Outcome 1: Cohort study (rate ratio)

Comparison 15: Safety: asthma, Outcome 2: Cohort study (risk ratio)

Comparison 16: Safety: eczema ‐ dermatitis, Outcome 1: Cohort study (rate ratio)

Comparison 16: Safety: eczema ‐ dermatitis, Outcome 2: Cohort study (risk ratio)

Comparison 17: Safety: hay fever, rhinoconjunctivitis, hypersensitivity/allergy, Outcome 1: Cohort study ‐ rhinoconjunctivitis

Comparison 17: Safety: hay fever, rhinoconjunctivitis, hypersensitivity/allergy, Outcome 2: Cohort study ‐ hypersensitivity/allergy

Comparison 17: Safety: hay fever, rhinoconjunctivitis, hypersensitivity/allergy, Outcome 3: Case‐control ‐ hay fever

Comparison 18: Safety: acute leukaemia, Outcome 1: Case‐control

Comparison 19: Safety: demyelinating diseases ‐ multiple sclerosis ‐ acute disseminated encephalomyelitis, Outcome 1: Case‐control

Comparison 20: Safety: gait disturbances, Outcome 1: Self‐controlled case series (hospitalisations)

Comparison 20: Safety: gait disturbances, Outcome 2: Self‐controlled case series (GP visits)

Comparison 21: Safety: bacterial or viral infections, immune overload, Outcome 1: Self‐controlled case series ‐ lobar pneumonia

Comparison 21: Safety: bacterial or viral infections, immune overload, Outcome 2: Self‐controlled case series ‐ invasive bacterial infections

Comparison 21: Safety: bacterial or viral infections, immune overload, Outcome 3: Self‐controlled case series ‐ encephalitis meningitis

Comparison 21: Safety: bacterial or viral infections, immune overload, Outcome 4: Self‐controlled case series ‐ herpes

Comparison 21: Safety: bacterial or viral infections, immune overload, Outcome 5: Self‐controlled case series ‐ pneumonia

Comparison 21: Safety: bacterial or viral infections, immune overload, Outcome 6: Self‐controlled case series ‐ varicella zoster

Comparison 21: Safety: bacterial or viral infections, immune overload, Outcome 7: Self‐controlled case series ‐ miscellaneous viral infections
| Effectiveness against measles | |||||
| Patient or population: children 9 months to 15 years old | |||||
| Outcomes | Anticipated absolute effects* (95% CI) | Relative effect | № of participants | Certainty of the evidence | |
|---|---|---|---|---|---|
| Risk of measles | Risk of measles | ||||
| Cohort studies ‐ 1 dose | Study population | RR 0.05 | 12,039 | ⊕⊕⊕⊝ | |
| 66 per 1000 | 3 per 1000 | ||||
| Cohort studies ‐ 2 doses | Study population | RR 0.04 | 21,604 | ⊕⊕⊕⊝ | |
| 19 per 1000 | 1 per 1000 | ||||
| Cohort studies household contacts ‐ 1 dose | Study population | RR 0.19 | 151 | ⊕⊕⊝⊝ | |
| 508 per 1000 | 97 per 1000 | ||||
| Cohort studies household contacts ‐ 2 doses | Study population | RR 0.15 | 378 | ⊕⊕⊝⊝ | |
| 508 per 1000 | 76 per 1000 | ||||
| Cohort studies household contacts ‐ 3 doses | Study population | RR 0.04 | 151 | ⊕⊕⊝⊝ | |
| 351 per 1000 | 14 per 1000 | ||||
| Cohort studies postexposure prophylaxis | Study population | RR 0.26 | 283 | ⊕⊕⊝⊝ | |
| 314 per 1000 | 82 per 1000 | ||||
| *The risk in the intervention group (and its 95% confidence interval) is based on the assumed risk in the comparison group and the relative effect of the intervention (and its 95% CI). | |||||
| GRADE Working Group grades of evidence | |||||
| 1Upgraded one level for large effect size (non‐critical risk of bias in studies). | |||||
| Effectiveness against mumps | |||||
| Patient or population: children 9 months to 15 years old | |||||
| Outcomes | Anticipated absolute effects* (95% CI) | Relative effect | № of participants | Certainty of the evidence | |
|---|---|---|---|---|---|
| Risk of mumps | Risk of mumps | ||||
| Cohort studies ‐ Jeryl Lynn strain ‐ 1 dose | Study population | RR 0.24 | 9915 | ⊕⊕⊕⊝ | |
| 91 per 1000 | 22 per 1000 | ||||
| Cohort studies ‐ Jeryl Lynn strain ‐ 2 doses | Study population | RR 0.12 | 7792 | ⊕⊕⊕⊝ | |
| 74 per 1000 | 9 per 1000 | ||||
| Cohort studies ‐ Jeryl Lynn strain ‐ unspecified number of doses | Study population | RR 0.23 | 2011 | ⊕⊕⊝⊝ | |
| 97 per 1000 | 22 per 1000 | ||||
| Cohort studies ‐ Jeryl Lynn strain ‐ household contacts | Study population | RR 0.26 | 1036 | ⊕⊕⊕⊝ | |
| 408 per 1000 | 106 per 1000 | ||||
| Cohort studies ‐ Urabe strain ‐ unspecified numbers or at least 1 dose | Study population | RR 0.23 | 2721 | ⊕⊕⊝⊝ | |
| 202 per 1000 | 47 per 1000 | ||||
| Cohort studies ‐ Rubini strain ‐ unspecified numbers or at least 1 dose | Study population | RR 0.96 | 4219 | ⊕⊕⊝⊝ | |
| 202 per 1000 | 194 per 1000 | ||||
| Cohort studies ‐ mumps strain not reported or any strain | Study population | RR 0.52 | 769 | ⊕⊕⊝⊝ | |
| 225 per 1000 | 117 per 1000 | ||||
| Cohort studies ‐ third dose versus 2 doses | Study population | RR 0.59 | 5417 | ⊕⊕⊝⊝ | |
| 7 per 1000 | 4 per 1000 | ||||
| *The risk in the intervention group (and its 95% confidence interval) is based on the assumed risk in the comparison group and the relative effect of the intervention (and its 95% CI). | |||||
| GRADE Working Group grades of evidence | |||||
| 1Upgraded one level for large effect size (non‐critical risk of bias in studies). | |||||
| Effectiveness against rubella | |||||
| Patient or population: children 9 months to 15 years old | |||||
| Outcomes | Anticipated absolute effects* (95% CI) | Relative effect | № of participants | Certainty of the evidence | |
|---|---|---|---|---|---|
| Risk of rubella | Risk of rubella | ||||
| Cohort studies secondary cases ‐ any strain | Study population | RR 0.11 | 1621 (1 observational study) | ⊕⊕⊕⊝ | |
| 0 per 1000 | 0 per 1000 | ||||
| *The risk in the intervention group (and its 95% confidence interval) is based on the assumed risk in the comparison group and the relative effect of the intervention (and its 95% CI). | |||||
| GRADE Working Group grades of evidence | |||||
| 1Cohort study in China using the BRD2 strain. | |||||
| Effectiveness against varicella | |||||
| Patient or population: children 9 months to 15 years old | |||||
| Outcomes | Anticipated absolute effects* (95% CI) | Relative effect | № of participants | Certainty of the evidence | |
|---|---|---|---|---|---|
| Risk of varicella | Risk of varicella | ||||
| MMRV randomised controlled trial ‐ any severity ‐ 2 doses ‐ follow‐up at 5 years | Study population | Rate ratio 0.05 | 3022 | ⊕⊕⊕⊕ | |
| 271 per 1000 | 14 per 1000 | ||||
| MMRV randomised controlled trial ‐ any severity ‐ 2 doses ‐ follow‐up between 5 and 10 years | Study population | Rate ratio 0.05 | 3023 | ⊕⊕⊕⊕ | |
| 437 per 1000 | 22 per 1000 | ||||
| MMRV randomised controlled trial ‐ any severity ‐ 2 doses ‐ follow‐up at 10 years | Study population | Rate ratio 0.05 | 3023 | ⊕⊕⊕⊕ | |
| 473 per 1000 | 24 per 1000 | ||||
| MMRV randomised controlled trial ‐ moderate/severe cases ‐ 2 doses ‐ follow‐up at 5 years | Study population | Rate ratio 0.00 | 3022 | ⊕⊕⊕⊕ | |
| 157 per 1000 | 0 per 1000 | ||||
| MMRV randomised controlled trial ‐ moderate/severe cases ‐ 2 doses ‐ follow‐up between 5 and 10 years | Study population | Rate ratio 0.01 | 3023 | ⊕⊕⊕⊕ | |
| 237 per 1000 | 2 per 1000 | ||||
| MMRV randomised controlled trial ‐ moderate/severe cases ‐ 2 doses ‐ follow‐up at 10 years | Study population | Rate ratio 0.01 | 3023 | ⊕⊕⊕⊕ | |
| 237 per 1000 | 2 per 1000 | ||||
| MMR+V randomised controlled trial ‐ any severity ‐ 2 doses ‐ follow‐up at 5 years | Study population | Rate ratio 0.35 | 3006 | ⊕⊕⊕⊕ | |
| 271 per 1000 | 95 per 1000 | ||||
| MMR+V randomised controlled trial ‐ any severity ‐ 2 doses ‐ follow‐up between 5 and 10 years | Study population | Rate ratio 0.33 | 3010 | ⊕⊕⊕⊕ | |
| 437 per 1000 | 144 per 1000 | ||||
| MMR+V randomised controlled trial ‐ any severity ‐ 2 doses ‐ follow‐up at 10 years | Study population | Rate ratio 0.33 | 3010 | ⊕⊕⊕⊕ | |
| 473 per 1000 | 156 per 1000 | ||||
| MMR+V randomised controlled trial ‐ moderate/severe cases ‐ 2 doses ‐ follow‐up at 5 years | Study population | Rate ratio 0.09 | 3006 | ⊕⊕⊕⊕ | |
| 157 per 1000 | 14 per 1000 | ||||
| MMR+V randomised controlled trial ‐ moderate/severe cases ‐ 2 doses ‐ follow‐up between 5 and 10 years | Study population | Rate ratio 0.10 | 3010 | ⊕⊕⊕⊕ | |
| 237 per 1000 | 24 per 1000 | ||||
| MMR+V randomised controlled trial ‐ moderate/severe cases ‐ 2 doses ‐ follow‐up at 10 years | Study population | RR 0.10 | 3010 | ⊕⊕⊕⊕ | |
| 237 per 1000 | 24 per 1000 | ||||
| *The risk in the intervention group (and its 95% confidence interval) is based on the assumed risk in the comparison group and the relative effect of the intervention (and its 95% CI). | |||||
| GRADE Working Group grades of evidence | |||||
| Safety: short‐term side effects (local or systemic reactions) | |||||
| Patient or population: children 9 months to 15 years old | |||||
| Outcomes | Anticipated absolute effects* (95% CI) | Relative effect | № of participants | Certainty of the evidence | |
|---|---|---|---|---|---|
| Short‐term side effects | Short‐term side effects | ||||
| Temperature ‐ RCT/CCT axillary | Study population | RR 2.04 | 420 | ⊕⊕⊝⊝ | |
| 68 per 1000 | 139 per 1000 | ||||
| Temperature ‐ RCT/CCT rectal | Study population | RR 0.84 | 170 | ⊕⊕⊝⊝ | |
| 786 per 1000 | 660 per 1000 | ||||
| Temperature ‐ RCT/CCT measurement site not reported | Study population | RR 1.36 | 520 | ⊕⊕⊕⊕ | |
| 182 per 1000 | 247 per 1000 | ||||
| Temperature ‐ cohort studies orally | Study population | RR 1.37 | 334 | ⊕⊝⊝⊝ | |
| 377 per 1000 | 517 per 1000 | ||||
| Temperature ‐ cohort studies measurement site not reported | Study population | RR 1.12 | 457,123 | ⊕⊝⊝⊝ | |
| 31 per 1000 | 35 per 1000 | ||||
| Rash ‐ cohort studies | Study population | RR 1.49 | 457,261 | ⊕⊝⊝⊝ | |
| 4 per 1000 | 6 per 1000 | ||||
| Lymphadenopathy ‐ RCT/CCT | Study population | RR 1.32 | 1156 | ⊕⊕⊕⊝ | |
| 21 per 1000 | 28 per 1000 | ||||
| Lymphadenopathy ‐ cohort studies | Study population | RR 1.98 | 454,085 | ⊕⊝⊝⊝ | |
| 0 per 1000 | 1 per 1000 | ||||
| Coryza ‐ RCT/CCT | Study population | RR 0.45 | 831 | ⊕⊕⊝⊝ | |
| 37 per 1000 | 17 per 1000 | ||||
| Coryza ‐ cohort studies | Study population | RR 1.13 | 3176 | ⊕⊕⊝⊝ | |
| 502 per 1000 | 567 per 1000 | ||||
| URTI (rhinitis pharyngitis) ‐ RCT/CCT | Study population | RR 0.31 | 831 | ⊕⊕⊝⊝ | |
| 265 per 1000 | 82 per 1000 | ||||
| URTI (rhinitis pharyngitis) ‐ cohort studies | Study population | RR 1.44 | 966 | ⊕⊝⊝⊝ | |
| 484 per 1000 | 697 per 1000 | ||||
| Cough ‐ RCT/CCT | Study population | RR 1.99 | 831 | ⊕⊕⊝⊝ | |
| 8 per 1000 | 16 per 1000 | ||||
| Rash ‐ RCT/CCT | Study population | RR 2.05 | 1156 | ⊕⊕⊕⊕ | |
| 52 per 1000 | 107 per 1000 | ||||
| *The risk in the intervention group (and its 95% confidence interval) is based on the assumed risk in the comparison group and the relative effect of the intervention (and its 95% CI). | |||||
| GRADE Working Group grades of evidence | |||||
| 1Downgraded two levels due to selective reporting (reporting bias). | |||||
| Safety: encephalitis or encephalopathy | |||||
| Patient or population: children 9 months to 15 years old | |||||
| Outcomes | Anticipated absolute effects* (95% CI) | Relative effect | № of participants | Certainty of the evidence | |
|---|---|---|---|---|---|
| Risk of encephalitis or encephalopathy | Risk of encephalitis or encephalopathy | ||||
| Case‐control: MMR (risk interval from 0 to 90 days) | Study population | OR 0.98 | 452 cases, 1280 controls | ⊕⊕⊝⊝ | |
| 34 per 1000 | 34 per 1000 | ||||
| Self‐controlled case series/person‐time cohort | Study population | Rate ratio 0.90 | 1,071,088 | ⊕⊕⊝⊝ | |
| 22 per 100,000 | 20 per 100,000 | ||||
| *The risk in the intervention group (and its 95% confidence interval) is based on the assumed risk in the comparison group and the relative effect of the intervention (and its 95% CI). | |||||
| GRADE Working Group grades of evidence | |||||
| Safety: aseptic meningitis | |||||
| Patient or population: children 9 months to 15 years old | |||||
| Outcomes | Anticipated absolute effects* (95% CI) | Relative effect | № of participants | Certainty of the evidence | |
|---|---|---|---|---|---|
| Risk of aseptic meningitis | Risk of aseptic meningitis | ||||
| Case‐control ‐ Jeryl Lynn ‐ risk interval 0 to 30 days | Study population | OR 0.85 | 59 cases, 118 controls | ⊕⊕⊝⊝ | |
| 59 per 1000 | 51 per 1000 | ||||
| Case cross‐over ‐ Urabe or Hoshino | Study population | OR 4.00 | (2 observational studies) | ⊕⊕⊝⊝ | |
| 0 per 1000 | 0 per 1000 | ||||
| Case cross‐over ‐ Jeryl Lynn or Rubini | Study population | OR 0.60 | (1 observational study) | ⊕⊕⊝⊝ | |
| 0 per 1000 | 0 per 1000 | ||||
| Self‐controlled case series ‐ any strain | Study population | Rate ratio 12.40 | (1 observational study) | ⊕⊕⊝⊝ | |
| 0 per 1000 | 0 per 1000 | ||||
| Self‐controlled case series ‐ Urabe | Study population | Rate ratio 30.71 | 564,635 | ⊕⊕⊝⊝ | |
| 16 per 100,000 | 490 per 100,000 | ||||
| Self controlled case series ‐ Leningrad‐Zagreb | Study population | Rate ratio 6.40 | (1 observational study) | ⊕⊕⊝⊝ | |
| 0 per 1000 | 0 per 1000 | ||||
| Person‐time cohort ‐ Jeryl Lynn | Study population | Rate ratio 1.30 | 1,071,088 | ⊕⊕⊝⊝ | |
| 30 per 100,000 | 39 per 100,000 | ||||
| Case‐only ecological method ‐ Urabe | Study population | Rate ratio 9.12 | 1,054,305 | ⊕⊕⊝⊝ | |
| 9 per 100,000 | 80 per 100,000 | ||||
| Case‐only ecological method ‐ Leningrad‐Zagreb | Study population | Rate ratio 18.56 | 1,164,964 | ⊕⊕⊝⊝ | |
| 0 per 100,000 | 0 per 100,000 | ||||
| *The risk in the intervention group (and its 95% confidence interval) is based on the assumed risk in the comparison group and the relative effect of the intervention (and its 95% CI). | |||||
| GRADE Working Group grades of evidence | |||||
| Safety: seizures (febrile/afebrile) | |||||
| Patient or population: children 9 months to 15 years old | |||||
| Outcomes | Anticipated absolute effects* (95% CI) | Relative effect | № of participants | Certainty of the evidence | |
|---|---|---|---|---|---|
| Risk of seizures | Risk of seizures | ||||
| Cohort studies ‐ within 1 week after MMR vaccination | Study population | Rate ratio 2.45 | 1,451,990 | ⊕⊕⊕⊝ | |
| 108 per 1000 | 264 per 1000 | ||||
| Cohort studies ‐ between 1 and 2 weeks after MMR vaccination | Study population | Rate ratio 3.16 | 2,147,638 | ⊕⊕⊕⊝ | |
| 13 per 1000 | 42 per 1000 | ||||
| Cohort studies ‐ > 2 weeks after MMR vaccination | Study population | Rate ratio 0.97 | 1,018,998 | ⊕⊕⊝⊝ | |
| 3 per 1000 | 3 per 1000 | ||||
| Self‐controlled case series/person‐time ‐ between 1 and 2 weeks after MMR vaccination | Study population | Rate ratio 3.36 | 505,493 | ⊕⊕⊝⊝ | |
| 0 per 1000 | 0 per 1000 | ||||
| Self‐controlled case series/person‐time ‐ > 2 weeks after MMR vaccination | Study population | Rate ratio 1.18 | 102,099 | ⊕⊕⊝⊝ | |
| 0 per 1000 | 0 per 1000 | ||||
| Self‐controlled case series/person‐time ‐ between 1 and 2 weeks after vaccination; MMRV | Study population | Rate ratio 6.08 | 180,480 | ⊕⊕⊝⊝ | |
| 0 per 1000 | 0 per 1000 | ||||
| Self‐controlled case series/person‐time ‐ between 1 and 2 weeks after MMR+V vaccination | Study population | Rate ratio 3.13 | 181,088 | ⊕⊕⊝⊝ | |
| 0 per 1000 | 0 per 1000 | ||||
| MMRV vs MMR+V ‐ by brand ‐ from 0 to 42 days after vaccination (Priorix‐Tetra) | Study population | RR 1.95 | 115,022 | ⊕⊕⊝⊝ | |
| 1 per 1000 | 1 per 1000 | ||||
| MMRV vs MMR+V ‐ by brand ‐ from 7 to 10 days after vaccination (Priorix‐Tetra) | Study population | RR 1.69 | 114,922 | ⊕⊕⊝⊝ | |
| 1 per 1000 | 1 per 1000 | ||||
| MMRV vs MMR+V ‐ by brand ‐ from 0 to 42 days after vaccination (ProQuad) | Study population | RR 1.30 | 1,381,609 | ⊕⊕⊝⊝ | |
| 2 per 1000 | 2 per 1000 | ||||
| MMRV vs MMR+V ‐ by brand ‐ from 7 to 10 days after vaccination (ProQuad) | Study population | RR 2.01 | 1,381,609 | ⊕⊕⊝⊝ | |
| 2 per 1000 | 4 per 1000 | ||||
| MMRV vs MMR ‐ by brand ‐ from 0 to 42 days after vaccination (Priorix‐Tetra) | Study population | RR 1.28 | 292,535 | ⊕⊕⊝⊝ | |
| 1 per 1000 | 2 per 1000 | ||||
| MMRV vs MMR ‐ by brand ‐ from 7 to 10 days after vaccination (Priorix‐Tetra) | Study population | RR 2.49 | 292,535 | ⊕⊕⊝⊝ | |
| 1 per 1000 | 3 per 1000 | ||||
| MMRV vs MMR ‐ by brand ‐ from 0 to 42 days after vaccination (ProQuad) | Study population | RR 1.60 | 1,049,831 | ⊕⊕⊝⊝ | |
| 43 per 100,000 | 69 per 100,000 | ||||
| MMRV vs MMR ‐ by brand ‐ from 7 to 10 days after vaccination (ProQuad) | Study population | RR 1.46 | 1,989,157 | ⊕⊕⊝⊝ | |
| 21 per 100,000 | 30 per 100,000 | ||||
| *The risk in the intervention group (and its 95% confidence interval) is based on the assumed risk in the comparison group and the relative effect of the intervention (and its 95% CI). | |||||
| GRADE Working Group grades of evidence | |||||
| 1Upgraded one level due to large effect size | |||||
| Safety: autistic spectrum disorders | ||||||
| Patient or population: children 9 months to 15 years old | ||||||
| Outcomes | Anticipated absolute effects* (95% CI) | Relative effect | № of participants | Certainty of the evidence | Comments | |
|---|---|---|---|---|---|---|
| Risk of ASD amongst unvaccinated | Risk of ASD amongst vaccinated | |||||
| Cohort studies ‐ all children, MMR | Study population | Rate ratio 0.93 | 1,194,764 | ⊕⊕⊕⊝ |
| |
| 451 per 100,000 | 419 per 100,000 | |||||
| Cohort studies ‐ autism risk (low), MMR | Study population | Rate ratio 1.00 | 93,071 | ⊕⊕⊕⊝ |
| |
| 85 per 100,000 | 85 per 100,000 | |||||
| Cohort studies ‐ autism risk (moderate/high), MMR | Study population | Rate ratio 0.80 | 1914 | ⊕⊕⊝⊝ | The apparent protective effect is due to indication bias. | |
| 12 per 1000 | 9 per 1000 | |||||
| *The risk in the intervention group (and its 95% confidence interval) is based on the assumed risk in the comparison group and the relative effect of the intervention (and its 95% CI). | ||||||
| GRADE Working Group grades of evidence | ||||||
| 1Upgraded one level due to residual confounding ‐ confounding expected to increase the effect but no effect was observed. | ||||||
| Safety: inflammatory bowel disease | |||||
| Patient or population: children 9 months to 15 years old | |||||
| Outcomes | Anticipated absolute effects* (95% CI) | Relative effect | № of participants | Certainty of the evidence | |
|---|---|---|---|---|---|
| Risk of IBD | Risk of IBD | ||||
| Case control ‐ all IBD, MMR | Study population | OR 1.42 | 409 cases, 1416 controls | ⊕⊕⊕⊝ | |
| 0 per 1000 | 0 per 1000 | ||||
| Case control ‐ ulcerative colitis, MMR | Study population | OR 1.35 | 292 cases, 582 controls | ⊕⊕⊕⊝ | |
| 0 per 1000 | 0 per 1000 | ||||
| Case control ‐ Crohn's disease, MMR | Study population | OR 0.64 | 514 cases, 804 controls | ⊕⊕⊕⊝ | |
| 0 per 1000 | 0 per 1000 | ||||
| *The risk in the intervention group (and its 95% confidence interval) is based on the assumed risk in the comparison group and the relative effect of the intervention (and its 95% CI). | |||||
| GRADE Working Group grades of evidence | |||||
| 1Upgraded one level due to residual confounding ‐ confounding expected to increase the effect but no effect was observed. | |||||
| Safety: cognitive delay ‐ developmental delay | |||||
| Patient or population: children 9 months to 15 years old | |||||
| Outcomes | Anticipated absolute effects* (95% CI) | Relative effect | № of participants | Certainty of the evidence | |
|---|---|---|---|---|---|
| Risk of cognitive delay ‐ | Risk of cognitive delay ‐ | ||||
| Cohort study ‐ MDI‐BSID II 24th month, MMR | Study population | OR 1.35 | 337 | ⊕⊕⊝⊝ | |
| 0 per 1000 | 0 per 1000 | ||||
| Cohort study ‐ MDI‐BSID II 36th month, MMR | Study population | OR 0.37 | 337 | ⊕⊕⊝⊝ | |
| 0 per 1000 | 0 per 1000 | ||||
| Cohort study ‐ Raven 5th year, MMR | Study population | OR 1.22 | 337 | ⊕⊕⊝⊝ | |
| 0 per 1000 | 0 per 1000 | ||||
| Cohort study ‐ WISC‐R verbal 6th year, MMR | Study population | OR 1.23 | 337 | ⊕⊕⊝⊝ | |
| 0 per 1000 | 0 per 1000 | ||||
| *The risk in the intervention group (and its 95% confidence interval) is based on the assumed risk in the comparison group and the relative effect of the intervention (and its 95% CI). | |||||
| GRADE Working Group grades of evidence | |||||
| Safety: idiopathic thrombocytopenic purpura | |||||
| Patient or population: children 9 months to 15 years old | |||||
| Outcomes | Anticipated absolute effects* (95% CI) | Relative effect | № of participants | Certainty of the evidence | |
|---|---|---|---|---|---|
| Risk of ITP | Risk of ITP | ||||
| Case‐control ‐ case cross‐over ‐ case controls MMR | Study population | OR 2.80 | 410 cases, 2040 controls | ⊕⊕⊝⊝ | |
| 0 per 1000 | 0 per 1000 | ||||
| Self‐controlled case series ‐ MMR vaccine ‐ age from 9 to 23 months | Study population | Rate ratio 4.21 | 3,723,677 | ⊕⊕⊕⊝ | |
| 17 per 100,000 | 72 per 100,000 | ||||
| *The risk in the intervention group (and its 95% confidence interval) is based on the assumed risk in the comparison group and the relative effect of the intervention (and its 95% CI). | |||||
| GRADE Working Group grades of evidence | |||||
| 1Upgraded one level due to large effect size | |||||
| Safety: Henoch‐Schönlein purpura | |||||
| Patient or population: children 9 months to 15 years old | |||||
| Outcomes | Anticipated absolute effects* (95% CI) | Relative effect | № of participants | Certainty of the evidence | |
|---|---|---|---|---|---|
| Risk of HSP | Risk of HSP | ||||
| Case‐control ‐ MMR vaccine | Study population | OR 3.40 | 288 cases, 617 controls | ⊕⊕⊝⊝ | |
| 0 per 1000 | 0 per 1000 | ||||
| *The risk in the intervention group (and its 95% confidence interval) is based on the assumed risk in the comparison group and the relative effect of the intervention (and its 95% CI). | |||||
| GRADE Working Group grades of evidence | |||||
| Safety: type 1 diabetes | |||||
| Patient or population: children 9 months to 15 years old | |||||
| Outcomes | Anticipated absolute effects* (95% CI) | Relative effect | № of participants | Certainty of the evidence | |
|---|---|---|---|---|---|
| Risk of type 1 diabetes | Risk of type 1 diabetes | ||||
| Cohort study MMR ‐ all children | Study population | Rate ratio 1.09 | 1,666,829 | ⊕⊕⊝⊝ | |
| 0 per 1000 | 0 per 1000 | ||||
| Cohort study MMR ‐ children with at least 1 sibling with type 1 diabetes | Study population | Rate ratio 0.86 | 3848 | ⊕⊕⊝⊝ | |
| 6 per 1000 | 5 per 1000 | ||||
| *The risk in the intervention group (and its 95% confidence interval) is based on the assumed risk in the comparison group and the relative effect of the intervention (and its 95% CI). | |||||
| GRADE Working Group grades of evidence | |||||
| Safety: asthma | |||||
| Patient or population: children 9 months to 15 years old | |||||
| Outcomes | Anticipated absolute effects* (95% CI) | Relative effect | № of participants | Certainty of the evidence | |
|---|---|---|---|---|---|
| Risk of asthma | Risk of asthma | ||||
| Cohort study (rate ratio) ‐ all ages | Study population | Rate ratio 1.05 | 1,067,712 | ⊕⊕⊝⊝ | |
| 32 per 1000 | 33 per 1000 | ||||
| Cohort studies (risk ratio) ‐ all ages | Study population | RR 0.63 | 886 | ⊕⊕⊝⊝ | |
| 414 per 1000 | 261 per 1000 | ||||
| *The risk in the intervention group (and its 95% confidence interval) is based on the assumed risk in the comparison group and the relative effect of the intervention (and its 95% CI). | |||||
| GRADE Working Group grades of evidence | |||||
| 1Upgraded one level due to non‐critical risk of bias in the study and large number of participants. | |||||
| Safety: eczema ‐ dermatitis | |||||
| Patient or population: children 9 months to 15 years old | |||||
| Outcomes | Anticipated absolute effects* (95% CI) | Relative effect | № of participants | Certainty of the evidence | |
|---|---|---|---|---|---|
| Risk of eczema ‐ dermatitis | Risk of eczema ‐ dermatitis | ||||
| Cohort study (rate ratio) | Study population | Rate ratio 3.50 | 14,353 | ⊕⊝⊝⊝ | |
| 0 per 1000 | 0 per 1000 | ||||
| Cohort study (risk ratio) | Study population | RR 0.75 | 555 | ⊕⊕⊝⊝ | |
| 0 per 1000 | 0 per 1000 | ||||
| *The risk in the intervention group (and its 95% confidence interval) is based on the assumed risk in the comparison group and the relative effect of the intervention (and its 95% CI). | |||||
| GRADE Working Group grades of evidence | |||||
| 1Downgraded one level due to ascertainment bias which seriously weakens confidence in the results. | |||||
| Safety: hay fever, rhinoconjunctivitis, hypersensitivity/allergy | |||||
| Patient or population: children 9 months to 15 years old | |||||
| Outcomes | Anticipated absolute effects* (95% CI) | Relative effect | № of participants | Certainty of the evidence | |
|---|---|---|---|---|---|
| Risk of hay fever, rhinoconjunctivitis, hypersensitivity/allergy | Risk of hay fever, rhinoconjunctivitis, hypersensitivity/allergy | ||||
| Cohort study ‐ rhinoconjunctivitis | Study population | OR 0.64 | 489 | ⊕⊕⊝⊝ | |
| 211 per 1000 | 146 per 1000 | ||||
| Cohort study ‐ hypersensitivity/allergy | Study population | OR 0.63 | 544 | ⊕⊕⊝⊝ | |
| 429 per 1000 | 321 per 1000 | ||||
| Case control ‐ hay fever | Study population | OR 1.16 | 0 cases, 0 controls | ⊕⊕⊝⊝ | |
| 0 per 1000 | 0 per 1000 | ||||
| *The risk in the intervention group (and its 95% confidence interval) is based on the assumed risk in the comparison group and the relative effect of the intervention (and its 95% CI). | |||||
| GRADE Working Group grades of evidence | |||||
| 1Upgraded one level due to non‐critical risk of bias in the study. | |||||
| Safety: acute leukaemia | |||||
| Patient or population: children 9 months to 15 years old | |||||
| Outcomes | Anticipated absolute effects* (95% CI) | Relative effect | № of participants | Certainty of the evidence | |
|---|---|---|---|---|---|
| Risk of acute leukaemia | Risk of acute leukaemia | ||||
| Case‐control ‐ acute leukaemia | Study population | OR 0.97 | 941 cases, 1667 controls | ⊕⊕⊝⊝ | |
| 0 per 1000 | 0 per 1000 | ||||
| Case‐control ‐ acute lymphoblastic leukaemia | Study population | OR 0.91 | 1375 cases, 2316 controls | ⊕⊕⊝⊝ | |
| 0 per 1000 | 0 per 1000 | ||||
| Case‐control ‐ acute myeloblastic leukaemia | Study population | OR 0.56 | 62 cases, 1258 controls | ⊕⊕⊝⊝ | |
| 0 per 1000 | 0 per 1000 | ||||
| *The risk in the intervention group (and its 95% confidence interval) is based on the assumed risk in the comparison group and the relative effect of the intervention (and its 95% CI). | |||||
| GRADE Working Group grades of evidence | |||||
| Safety: demyelinating diseases ‐ multiple sclerosis ‐ acute disseminated encephalomyelitis | |||||
| Patient or population: children 9 months to 15 years old | |||||
| Outcomes | Anticipated absolute effects* (95% CI) | Relative effect | № of participants | Certainty of the evidence | |
|---|---|---|---|---|---|
| Risk of demyelinating diseases ‐ multiple sclerosis ‐ ADEM | Risk of demyelinating diseases ‐ multiple sclerosis ‐ ADEM | ||||
| Case‐control ‐ multiple sclerosis | Study population | OR 1.13 | 206 cases, 888 controls | ⊕⊕⊝⊝ | |
| 0 per 1000 | 0 per 1000 | ||||
| Case‐control ‐ ADEM | Study population | OR 1.03 | 272 cases, 1096 controls | ⊕⊕⊝⊝ | |
| 0 per 1000 | 0 per 1000 | ||||
| *The risk in the intervention group (and its 95% confidence interval) is based on the assumed risk in the comparison group and the relative effect of the intervention (and its 95% CI). | |||||
| GRADE Working Group grades of evidence | |||||
| Safety: gait disturbances | |||||
| Patient or population: children 9 months to 15 years old | |||||
| Outcomes | Anticipated absolute effects* (95% CI) | Relative effect | № of participants | Certainty of the evidence | |
|---|---|---|---|---|---|
| Risk of gait disturbances | Risk of gait disturbances | ||||
| Self‐controlled case series (hospitalisations) ‐ hospitalisations ‐ risk period: 0 to 60 days | Study population | Rate ratio 0.46 | 127 | ⊕⊕⊝⊝ | |
| 0 per 1000 | 0 per 1000 | ||||
| Self‐controlled case series (GP visits) ‐ GP visit ‐ risk period: 0 to 5 days | Study population | Rate ratio 1.88 | 1398 | ⊕⊕⊝⊝ | |
| 0 per 1000 | 0 per 1000 | ||||
| Self‐controlled case series (GP visits) ‐ GP visit ‐ risk period: 6 to 60 days | Study population | Rate ratio 0.93 | 1398 | ⊕⊕⊝⊝ | |
| 0 per 1000 | 0 per 1000 | ||||
| *The risk in the intervention group (and its 95% confidence interval) is based on the assumed risk in the comparison group and the relative effect of the intervention (and its 95% CI). | |||||
| GRADE Working Group grades of evidence | |||||
| Safety: bacterial or viral infections, immune overload | |||||
| Patient or population: children 9 months to 15 years old | |||||
| Outcomes | Anticipated absolute effects* (95% CI) | Relative effect | № of participants | Certainty of the evidence | |
|---|---|---|---|---|---|
| Risk of bacterial or viral infections, immune overload amongst | Risk of bacterial or viral infections, immune overload amongst | ||||
| Self‐controlled case series ‐ lobar pneumonia ‐ lobar pneumonia risk period (0 to 90 days) | Study population | Rate ratio 0.75 | 2412 | ⊕⊕⊝⊝ | |
| 0 per 1000 | 0 per 1000 | ||||
| Self‐controlled case series ‐ invasive bacterial infections ‐ invasive bacterial infections risk period (0 to 90 days) | Study population | Rate ratio 0.90 | 2412 | ⊕⊕⊝⊝ | |
| 0 per 1000 | 0 per 1000 | ||||
| Self‐controlled case series ‐ encephalitis meningitis ‐ encephalitis meningitis risk period (0 to 90 days) | Study population | Rate ratio 0.84 | 2025 | ⊕⊕⊝⊝ | |
| 0 per 1000 | 0 per 1000 | ||||
| Self‐controlled case series ‐ herpes ‐ herpes risk period (0 to 90 days) | Study population | Rate ratio 1.17 | 2025 | ⊕⊕⊝⊝ | |
| 0 per 1000 | 0 per 1000 | ||||
| Self‐controlled case series ‐ pneumonia ‐ pneumonia risk period (0 to 90 days) | Study population | Rate ratio 0.72 | 2025 | ⊕⊕⊝⊝ | |
| 0 per 1000 | 0 per 1000 | ||||
| Self‐controlled case series ‐ varicella zoster ‐ varicella zoster risk period (0 to 90 days) | Study population | Rate ratio 0.93 | 2025 | ⊕⊕⊝⊝ | |
| 0 per 1000 | 0 per 1000 | ||||
| Self‐controlled case series ‐ miscellaneous viral infections ‐ miscellaneous viral infections risk period (0 to 90 days) | Study population | Rate ratio 0.68 | 2025 | ⊕⊕⊝⊝ | |
| 0 per 1000 | 0 per 1000 | ||||
| *The risk in the intervention group (and its 95% confidence interval) is based on the assumed risk in the comparison group and the relative effect of the intervention (and its 95% CI). | |||||
| GRADE Working Group grades of evidence | |||||
| Study | Population | Case definition | Vaccine/strain | N vaccinated | N control | N events in exposed/ | Vaccine effectiveness |
|---|---|---|---|---|---|---|---|
| Children attending day‐care and preschool centres (a) ≥ 15 months (all ages) (b) 15 to 23 months (c) 24 to 35 months (d) ≥ 36 months ‐‐‐‐‐‐‐‐‐‐‐‐‐‐‐‐‐‐‐‐‐ (e) Indirect effectiveness (e1) 12 to 23 months (e2) 24 to 35 months (e3) ≥ 36 months | Confirmed measles was defined as laboratory‐confirmed case or met the WHO clinical case definition and was epidemiologically linked to laboratory‐confirmed case. | Priorix/Schwarz or dose 1 at 9 to 12 months dose 2 at 15 months | (a) N = 1027 (any dose) (a1) N = 830 (1 dose) (a2) N = 197 (2 doses) (b) N = 269 (any doses) (c) N = 384 (any doses) (d) N = 374 (any doses) | (a) n = 94 (b) n = 57 (c) n = 20 (d) n = 17 unvaccinated | (a) 5/1027 versus 12/94 (a1) 5/830 versus 12/94 (a2) 0/197 versus 12/94 (b) 3/296 versus 6/57 (c) 1/384 versus 4/20 (d) 1/374 versus 2/17 | (a) 96.2% (89.4% to 98.6%) (a1) 95.3% (86.9% to 98.%) (a2) 100% (‐% to ‐%) (b) 89.4% (58.9% to 97.3%) (c) 98.7% (88.9% to 99.8%) (d) 97.7% (76.1% to 99.8%) VE = (1 − RR) x 100 ‐‐‐‐‐‐‐‐‐‐‐‐‐‐‐‐‐‐‐‐‐‐‐‐‐‐‐‐‐ (e1) 71.1% (63.5% to 78.8%) (e2) 80.0% (56.3% to 94.3%) (e3) 88.2% (63.6% to 98.5%) VE = (ARU − ARV)/ARU x 100 | |
| Children aged 9 to 59 months (at 30 June 2011) (a) 9 to 59 months (b) 9 to 12 months (c) > 12 months | A clinical case of measles is defined as fever with maculopapular rash and either conjunctivitis or cough or coryza (catarrhal inflammation of the mucous membrane in the nose). A confirmed case of measles is defined as a clinical case who is positive for anti‐measles virus nucleoprotein immunoglobulin M antibodies in serological tests but has not been vaccinated against measles during last 1 month. | MMR vaccine not described | (a) N = 50 (1 dose) | (a) N = 18 | (a) 15/50 versus 16/18 | (a) 66.3% (46.9% to 78.6%) (b) 66.6%(*) (c) 65.4%(*) (*) no statistical evidence VE = (1 − RR) x 100 | |
| Outbreak at a university in 2014 Students born between 1984 and 1993. N = 14,465 VE > 10 years after vaccination | The definition of suspected measles case was individuals with All suspected cases were quarantined | MMR/not stated 2 doses | N = 11448 | N = 3017 | 52/11448 versus 33/3017 | 60% (38.2% to 74.1%) VE = (1 − RR) x 100 | |
| N = 11,004 children born between 2008 and 2010 who underwent vaccination in 2009 to 2011. Follow‐up = 24 months | Hospitalisation for (a) measles (b) mumps (see also Table 3) (c) measles and mumps (d) all infectious diseases (e) all respiratory diseases The effectiveness of MMR vaccine in reducing hospitalisations by analysing 2 distinct databases (vaccination record) and (hospital discharge): contained the following ICD‐9 codes in primary or secondary diagnosis: 001 to 139 for infectious and parasitic diseases; 460 to 519 for respiratory diseases | MMR not described the vaccination records of the database of the Roma Local Health Unit from which relevant data were extracted, such as date of birth; MMR vaccination (yes/no); MMR dose (only for vaccinated); personal tax code. The cohort was recomposed through record linkage of the 2 vaccination of hospital discharge tax codes as a common identification | (1) 1 dose N = 5392 (2) 2 doses N = 3310 (3) any dose N = 8702 | Unvaccinated N = 2302 | (a1) 3/5392 versus 9/2302 (a2) 0/3310 versus 9/2302 (a3) 3/8702 versus 9/2302 (b1) 1/5392 versus 1/2302 (b2) 0/3310 versus 1/2302 (b3) 1/8702 versus 1/2302 (c1) 4/5392 versus 10/2302 (c2) 0/3310 versus 10/2302 (c3) 4/8702 versus 10/2302 (d1) 82/5392 versus 262/2302 (d2) 70/3310 versus 262/2302 (d3) 414/8702 versus 262/2302 (e1) 202/5392 versus 424/2302 (e2) 183/3310 versus 424/2302 (e3) 809/8702 versus 424/2302 | Unadjusted estimates (a1) 85.8% (47.5% to 96.1%) (*) no statistical evidence VE = (1 − RR) x 100 ‐‐‐‐‐‐‐‐‐‐‐‐‐‐‐‐‐‐‐‐‐‐‐‐ Adjusted estimates any doses (a) 91% (68% to 99%) (b) not reported (c) 90% (66% to 97%) (d) 71% (66% to 75%) (e) 82% (52% to 93%) VE = (1 − HR)*100 | |
| Children (19 to 67 months) whose parent required a paediatrician visit during a measles outbreak peak | Clinical diagnosis | (a) Pluserix (c) Triviraten vaccination records | (a) N = 329 (1 dose) (b) N = 747 (1 dose) (c) N = 1023 (1dose) | N = 646 unvaccinated | (a) 0/329 versus 114/646 (b) 2/747 versus 114/646 (c) 8/1023 versus 114/646 ‐‐‐‐‐‐‐‐‐‐‐‐‐‐ (a) 0/ 19,836 PT (b) 2/ 12,906 PT (c) 8/ 31,329 PT (control) 114/22,188 PT = person‐time in months | (a) 100% (‐% to ‐%) (b) 97% (88% to 99%) VE = (ARU − ARV)/ARU x 100 | |
| Children aged up to 14 years. N = 2784 (children aged > 14 years, N = 2300). Data were presented by age group. The study included all students in 40 classes with 1 or more registered measles cases in the period February 2014 to September 2015. VE ≤ 5 years since vaccination 6 to 14 years since vaccination | Measles diagnosis was confirmed according to WHO guidelines. The clinical criteria case confirmation were measles IgM antibody detection, or | MMR/not stated (a) 1 dose (b) 2 doses (c) ≤ 5 years since vaccination (d) 6 to 14 years since vaccination | (a) N = 100 (b) N = 606 (c) N = 20 (d) N = 76 | N = 95 | (a) 3/100 versus 35/95 (b) 6/606 versus 35/95 (c) 1/20 versus 35/95 (d) 2/76 versus 35/95 | (a) 91.9% (74.4% to 97.4%) VE = (1 − RR) x 100 | |
| Children from primary school in Singapore (aged 8 to 14 years, > 5 years since vaccination) during a measles outbreak | Clinical with laboratory confirmation. Active survey and serological confirmation | MMR vaccine not described Vaccination status was ascertained from health booklet. | N = 171 (1 dose) | N = 13 unvaccinated | 2/171 versus 7 /13 | 97.8% (90.6% to 99.5%) VE = (1 − RR) x 100 | |
| School outbreak 2006. Students aged 10 to 15 years (N = 875) VE < 10 years after vaccination > 10 years after vaccination | Clinical or laboratory | MMR/not stated (a) 1 dose (b) 2 doses (c) unknown ‐‐‐‐‐‐‐‐‐‐‐‐‐‐‐‐‐‐‐‐‐‐ | All ages (a) N = 199 (b) N = 561 (c) N = 218 ‐‐‐‐‐‐‐‐‐‐‐‐‐‐‐‐ 10 to 15 years (a) N =196 ‐‐‐‐‐‐‐‐‐‐‐‐‐‐‐‐ (b) N = 59 (c) N = 74 | All ages N = 36 ‐‐‐‐‐‐‐‐‐‐‐‐‐‐‐‐‐ 10 to 15 years N = 33 | All ages (a) 2/199 versus 19/36 (b) 2/5611 versus 19/36 (c) 30/218 versus 19/36 ‐‐‐‐‐‐‐‐‐‐‐‐‐‐‐ 10 to 15 years (a) 2/196 versus 18/33 (b) 2/502 versus 18/33 ‐‐‐‐‐‐‐‐‐‐‐‐‐‐‐ (c) 5/74 versus 1/3 | All ages (c) 73.9% (59.0% to 83.4%) VE = (1 − RR) x 100 ‐‐‐‐‐‐‐‐‐‐‐‐‐‐‐‐‐‐‐‐‐‐‐‐‐‐‐‐‐‐‐‐‐‐‐‐ 10 to 15 years ‐‐‐‐‐‐‐‐‐‐‐‐‐‐‐‐‐‐‐‐‐‐‐‐‐‐‐‐‐‐‐‐‐‐‐‐ (a) 66.7% (*) (b) 97.8% (53.7% to 99.9%) (c) 79.7% (*) (*) no evidence | |
| Infants aged 6 to 14 months living in municipalities where coverage with the first dose of MMR vaccine was < 90%. Infants aged 6 to 11 months were offered an extra vaccination (and would thus still be eligible for their second MMR vaccination at the age of 14 months). Infants aged 12 to 14 months were offered an early MMR vaccination as an alternative to the regular time point at 14 months of age. All infants were eligible for another dose of MMR scheduled at 9 years of age. | Laboratory‐confirmed measles N = 1080 infants eligible for analysis laboratory‐confirmed | MMR vaccine: (M‐M‐RVAXPRO; Sanofi Pasteur MSD). This vaccine contains measles virus Enders’ Edmonston strain. Vaccination status was checked in the national vaccination register. Parents were asked whether their infant(s) had had measles in the preceding 3 months. | N = 919 | N = 311 | 3/106,631 (PT‐days) versus 10/23,769 (PT‐days) | HR (95% CI)(*) 0.29 (0.05 to 1.72) (*) adjusted estimates Cox proportional VE = 1 − HR | |
| Household contacts 55 families, 43 children (a) 1 dose (b) 2 doses (c) any dose | Clinical | MMR/strain | (a) N = 13 (b) N = 4 | N = 26 | (a) 1/13 versus 19/26 (b) 0/4 versus 19/26 (c) 1/20 versus 19/26 | (a) 96.9% (71.8% to 99.7%) (b) 95.7% (10.6% to 99.8%) (c) 97.7% (79.3% to 99.7%) VE = (1 − RR) x 100 ‐‐‐‐‐‐‐‐‐‐‐‐‐‐‐‐‐‐‐‐‐‐ (a) 90% (35% to 97%) (b) not reported (c) 92% (48% to 98%) VE = (ARU − ARV)/ARU x 100 | |
| Household contacts adolescents and young adults (10 to 29 years) (a) any dose (b) 1 dose (c) 2 doses (d) 3 doses | Clinical or laboratory confirmation, or both | MMR vaccine not described | (a) N = 302 (b) N = 27 (c) N = 205 (d) N = 70 | (a) N = 16 | Pre‐campaign MMR doses (a) 16/302 versus 2/16 (b) 3/27 versus 2/16 (c) 13/205 versus 2/16 (d) 0/70 versus 2/16 ‐‐‐‐‐‐‐‐‐‐‐‐‐‐‐‐‐‐‐‐‐‐‐‐ | Pre‐campaign MMR doses (a) (No data) (b) 23.1% (−425.0% to 87.3%)* (c) 63.4% (−103.0% to 90.6%)* (d) 95.9% (45% to 100%) ‐‐‐‐‐‐‐‐‐‐‐‐‐‐‐‐‐‐‐‐‐‐‐‐‐‐‐‐‐‐ Campaign MMR doses: 78.7% (10.1% to 97.7%) for pre‐exposure doses ‐‐‐‐‐‐‐‐‐‐‐‐‐‐‐‐‐‐‐‐‐‐‐‐‐‐‐‐‐ 50.4% (*) for postexposure doses (*) no statistical evidence ‐‐‐‐‐‐‐‐‐‐‐‐‐‐‐‐‐‐‐‐‐‐‐‐‐‐‐‐‐‐‐ VE = (1 − OR) x 100 from logistic regression | |
| Household contacts (6 months to 14 years) of primary measles cases | Secondary cases Clinical (WHO definition) or IgM positive antibody of secondary cases Standardised questionnaires | MMR vaccine not described Vaccination records | (a1) N = 48 (1 dose) (a2) N = 106 (2 doses) (b) N = 44 (> 2 doses) (c) N = 219 any doses contacts | N = 21 unvaccinated | (a1) 2/48 versus 11/21 (a2) 3/106 versus 11/21 (b) 1/44 versus 11/21 (c) 17/219 versus 11/21 | (a1) 92.0% (67.2% to 98.1%) (a2) 94.6% (82.3% to 98.4%) (b) 95.7% (68.6% to 99.4%) (c) 85.2% (72.7% to 92.0%) VE = (1 − RR) x 100 | |
| Postexposure prophylaxis Childrena aged < 19 years N = 208 | All who subsequently developed measles were considered as contacts. | MMR not described MMR PEP administered within 72 hours of initial exposure. | N = 44 | N = 164 | (a) 2/44 versus 45/164 | (a) 83.4% (34.4% to 95.8%) VE = (1 − RR) x 100 | |
| Postexposure prophylaxis N = 166 children with median age of 16.5 months (range 6 to 47 months) Candidates for the intervention were susceptible contacts who had not received either measles‐containing vaccine or had not suffered measles. | Clinical and laboratory | MMR not stated (a) at least 1 dose (b) vaccinated ≤ 3 days (c) vaccinated 4 to 5 days (d) vaccinated 6 to 7 days (e) vaccinated 8 to 9 days (f) vaccinated 10 to 12 days | (a) N = 54 (b) N = 17 (c) N = 14 (d) N = 14 (e) N = 8 (f) N = 1 | N = 21 | (a) 12/54 versus 13/21 (b) 1/17 versus 13/21 (c) 4/14 versus 13/21 (d) 5/14 versus 13/21 (e) 1/8 versus 13/21 (f) 1/1 versus 13/21 | (a) 64.1% (34.5% to 80.3%) (b) 90.5% (34.5% to 98.6%) (c) 53.8% (0.0% to 81.1%) (d) 42.3% (0.0% to 81.1%) (e) 79.8% (0.0% to 73.5%) (f) not reported VE = (1 − RR) x 100 | |
| ARU: attack rate amongst unvaccinated | |||||||
| Study | Population | Case | Controls/ | MMR strain/exposure | N cases vaccinated/N cases | OR (95% CI) | VE% (95% CI) |
|---|---|---|---|---|---|---|---|
| Children aged 5 to 17 years (a) outside of outbreak school (b) all participants | (a) N = 61 (b) N = 102 confirmed by laboratory testing or epidemiologic link is notifiables by both physicians and laboratories in Quebec | (a) N = 305 (b) N = 510 Controls were matched for date of birth (± 6 months) and school attended in 2010 to 2011. | MMR‐II (Merck Canada, Montreal, Quebec) Cases and controls received 2 doses of measles‐containing vaccine. | No data reported | ‐ | ‐ | |
| Participants (median age 16 years, upper quartile age 76 years) living in Merseyside (UK) | N = 42 microbiological confirmation: oral fluid/blood test IgM positive or PCR positive | N = 42 Control group participants were selected at random, matched 1:1 by general medical practice and aged within 1 year. | MMR vaccine not described (a) vaccinated appropriately for age for vaccination (< 14 months) (c) all ‐ vaccinated Unvaccinated: incompletely or partially vaccinated for age (> 13 months) | (a) 5/27 versus 23/29 (b) 15/37 versus 12/18 (c) 20/42 versus 35/42 | Risk factors for measles infection (univariate analysis) age > 13 months and incomplete vaccination 6.3 (1.9 to 33.4) ‐‐‐‐‐‐‐‐‐‐‐‐‐‐‐‐‐‐‐‐‐‐‐‐‐‐‐‐‐ (Multivariate analysis) under age for routine vaccination 20.4 (2.0 to 300) incomplete/partial vaccination for age > 13 months 22.1 (3.8 to 300) (**) adjusted for confounders | Risk factors for measles infection (univariate analysis) age > 13 months and incomplete vaccination 84.1% (47.4% to 97.0%) ‐‐‐‐‐‐‐‐‐‐‐‐‐‐‐‐‐‐‐‐‐‐‐‐‐‐‐‐‐ (Multivariate analysis) under age for routine vaccination 95.1% (50.0% to 100%) incomplete/partial vaccination for age > 13 months 95.5% (73.7% to 100%) (**) adjusted for confounders VE = (1 − OR) x 100 | |
| Participants aged 1 to 19 years | N = 1261 clinical definition | N = 4996 randomly selected, matched for year of birth, gender, general practice attended, index date | MMR or MR not described (a) 1 dose (b) > 1 dose | (a) 409/1221 versus 2012/4750 (b) 40/852 versus 246/2984 | (a) 0.49 (0.41 to 0.58)* (b) 0.39 (0.26 to 0.58)* *adjusted estimates, conditional logistic regression | (a) 51.0% (42.0% to 59.0%) VE = (1 − OR) x 100 | |
| **: multivariate analysis | |||||||
| Study | Population | Case definition | Vaccine/strain | N vaccinated | N control | N events in exposed/ | VE% (95% CI) |
|---|---|---|---|---|---|---|---|
| Children aged up to 16 years from Geneva were household contacts | Clinical diagnosis of secondary cases Phone interview | (a) MMR‐II/Jeryl LynnB (b) Pluserix or Trimovax/Urabe AM9 (c) Triviraten/Rubini (d) any strain Vaccination records Unspecified number of doses | (a) N = 30 (b) N = 75 (c) N = 83 (d) N = 193 | N = 72 unvaccinated | (a) 4/30 versus 25/72 (b) 7/75 versus 25/72 (c) 27/83 versus 25/72 (d) 38/193 versus 25/72 | (a) 61.6 % (−0.9% to 85.4%) (b) 73.1% (41.8% to 87.6%) (c) 6.3% (−45.9% to 39.8%) (d) 43.0% (12.7% to 62.8%) VE = (1 − RR) x 100 | |
| 235 students (in Spain) (aged 16 to 17 years) | Laboratory confirmed | MMR vaccine: (a) 1 dose (b) 2 dose (c) 3 dose (d) any dose | (a) N = 5 (b) N = 37 (c) N = 2 (d) N = 44 | N = 2 unvaccinated | (a) 2/5 versus 1/2 (b) 9/37 versus 1/2 (b) 2/2 versus 1/2 (d) 13/44 versus 1/2 ‐‐‐‐‐‐‐‐‐‐‐‐‐‐‐‐‐‐‐‐‐ Incidence (a) 33 versus 50 x 100 person‐day (≥ 2 doses) 16 versus 50 x 100 person‐day | (a) not reported ‐‐‐‐‐‐‐‐‐‐‐‐‐‐‐‐‐‐‐‐‐‐‐‐‐‐‐‐‐‐ VE = (1 − rr) x 100 (a) 34% (−44% to 70%)* (≥ 2 doses) 67% (28% to 83%) *no statistical evidence | |
| Students from the 3 university cities N = 989 | Self‐reported | MMR vaccine: Jeryl Lynn (a) 1 dose (b) 2 doses | (a) N = 29 (b) N = 706 | N = 16 unvaccinated | (a) 2/29 versus 7/16 (b) 92/706 versus 7/16 | (a) not reported (b) 68% (40.6% to 82.2%) adjusted estimate VE = 1 − RR | |
| N = 11,004 children born between 2008 and 2010, who underwent vaccination in 2009 to 2011. Follow‐up = 24 months | Hospitalisation for (a) measles (see also Table 1) (b) mumps (c) measles and mumps (d) all infectious diseases (e) all respiratory diseases The effectiveness of MMR vaccine in reducing hospitalisations was assessed by analysing 2 distinct databases (vaccination record) and (hospital discharge): diagnosis contained the following ICD‐9 codes in primary or secondary diagnosis:
| MMR not described (we assume Jeryl Lynn) the vaccination records from the Roma Local Health Unit database from which relevant data were extracted, such as date of birth; MMR vaccination (yes/no); MMR dose (only for vaccinated); personal tax code. The cohort was recomposed through record linkage of the 2 vaccination of hospital discharge personal tax codes as a common identification | (1) 1 dose N = 5392 (2) 2 doses N = 3310 (3) any dose N = 8702 | Unvaccinated N = 2302 | (a1) 3/5392 versus 9/2302 (a2) 0/3310 versus 9/2302 (a3) 3/8702 versus 9/2302 (b1) 1/5392 versus 1/2302 (b2) 0/3310 versus 1/2302 (b3) 1/8702 versus 1/2302 (c1) 4/5392 versus 10/2302 (c2) 0/3310 versus 10/2302 (c3) 4/8702 versus 10/2302 (d1) 82/5392 versus 262/2302 (d2) 70/3310 versus 262/2302 (d3) 414/8702 versus 262/2302 (e1) 202/5392 versus 424/2302 (e2) 183/3310 versus 424/2302 (e3) 809/8702 versus 424/2302 | Unadjusted estimates (a1) 85.8% (47.5% to 96.1%) (*) no statistical evidence VE = (1 − RR) x 100 ‐‐‐‐‐‐‐‐‐‐‐‐‐‐‐‐‐‐‐‐‐‐‐‐ Adjusted estimates any dose (a) 91% (68% to 99%) (b) not reported (c) 90% (66% to 97%) (d) 71% (66% to 75%) (e) 82% (52% to 93%) VE = 1 − HR | |
| From 2176 household residents from 2009 to 2010 All ages, (age group 1) age ≤ 17 years (age group 2) age ≥ 18 years | Clinical or | MMR vaccine: Jeryl Lynn (a) 1 dose (b) 2 doses (c) unknown (d) any dose | Age ≤ 17 years (group 1) (1a) 1 dose N = 342 (1b) 2 doses N = 361 (1c) unknown N = 914 (d) any dose ‐‐‐‐‐‐‐‐‐‐‐‐‐‐‐‐‐‐‐ Age ≥ 18 years (2a) 1 dose N = 9 (2b) 2 doses N = 97 (2c) unknown N = 574 (d) any dose | Age ≤ 17 years (group 1) N = 126 ‐‐‐‐‐‐‐‐‐‐‐‐‐‐‐‐‐‐‐ Age ≥ 18 years (group 2) N = 6 unvaccinated | All ages (group 1 + 2) (a) 4/117 versus 4/20 (b) 19/691 versus 4/20 (c) 17/520 versus 4/20 (d) 23/808 versus 4/20 Secondary households contacts age ≥ 5 years N = 1348 | All ages (a) 82.9% (37.1% to 95.4%) (b) 86.3% (63.3% to 94.9%) (c) 83.7% (55.9% to 93.9%) (d) 85.8% (62.7% to 94.6%) VE = (1 − RR) x 100 assessed amongst 44 secondary cases and 1304 non‐sick household contacts | |
| Male children aged between 3 and 15 years attending a scholastic institute in Spain during a mumps outbreak (March to November 1997) | Clinical diagnosis. Cases notified by the Andalusian survey system. | MMR strain not reported | N = 685 vaccination record | N = 38 unvaccinated | 73/685 versus 8/38 | 49% (3% to 74%) VE = (1 − RR) x 100 | |
| Conducted between 1 December 2014 and 20 September 2015. N = 2303 students aged 6 to 15 years. Of these, 114 were excluded because they had history of mumps illness; 281 students were excluded because of unknown immunisation history. N = 1378 vaccinated and unvaccinated N = 530 children included in the analysis | A mumps case was defined as a student having unilateral or bilateral parotid or other salivary gland swelling and pain, lasting 2 or more days, with onset between 1 December 2014 and 20 September 2015. All cases were diagnosed by clinical criteria without laboratory confirmation, and no mumps virus genotype information was obtained during this outbreak investigation. | MMR: S79 strain of mumps vaccine virus, derived through further attenuation of the Jeryl Lynn strain. Students’ vaccination certificates were obtained during the field investigation. (a) 1 dose (≤ 5 years since vaccination) (b) 1 dose (> 5 years since vaccination) (c) any time since vaccination | (a) N = 363 (b) N = 301 (c) N = 664 | Unvaccinated N = 530 | (a) 28/363 versus 93/530 (b) 21/301 versus 93/530 (c) 49/664 versus 93/530 | (a) 56% (34.4% to 70.6%) VE = (1 − RR) x 100 | |
| Children (19 to 67 months) | Clinical diagnosis Patient records and parent interviews | (a) Pluserix/Urabe (b) Morupar/Urabe (c) Triviraten/Rubini Vaccination records | (a) N = 329 (1 dose) (b) N = 747 (1 dose) (c) N = 1023 (1 dose) | N = 646 unvaccinated | (a) 38 cases/19433 (PT) (b) 28 cases/12785 (PT) (c) 185 cases/29974 (PT) Control = 206 cases/25,816 PT=person‐ time in months | (a) 75% (65% to 83%) (b) 73% (59% to 82%) (c) 23% (6% to 37%) VE = (ARU − ARV)/ARU x 100 | |
| During 2009 to 2010 mumps outbreak Children aged 9 to 14 years with a history of 2 MMR vaccine doses, had not previously received a third MMR vaccine dose, and had no history of mumps | Laboratory confirmed | MMR vaccine not described third dose | N = 1068 | Only 2 doses MMR N = 2171 | 1/1068 versus 5/2171 | 59.3% (−247% to 95.2%) VE = (1 − RR) x 100 | |
| During 2009 to 2010 mumps outbreak Schoolchildren (aged 11 to 17 years) from 3 schools. N = 2665. N = 2178 had validated history of receiving 2 previous doses of MMR. | Laboratory confirmed | MMR vaccine not described third dose (a) all students with validated 2 doses (b1) postvaccination period 1 to 21 days after third dose (b2) postvaccination period 22 to 41 days after third dose | Third dose (a) N = 1755 (b1) N = 1751 (b2) N = 1723 | Only 2 doses MMR (a) N = 432 (b1) N = 420 (b2) N = 413 | (a) 35/1755 versus 14/432 (b1) 28/1751 versus 7/420 (b2) 1/1723 versus 2/413 | (a) 39.7% (−11.0% to 67.3%) (b1) 4.1% (−118% to 57.8%) (b2) 88% (−31.9% to 98.9%) VE = (1 − RR) x 100 | |
| Children from childcare centres and aged 5 to 12 years | Clinical diagnosis. Standard questionnaire filled by trained public health officer or physician diagnoses. | (a) Jeryl Lynn (b) Urabe (c) Rubini Health booklet | (a) N = 711 (b) N = 190 (c) N = 1694 1 or 2 MMR doses | N = 614 unvaccinated | (a) 8/711 versus 35/614 (b) 5/190 versus 35/614 (c) 150/1694 versus 35/614 | (a) 80.3% (57.8% to 90.8%) (b) 53.8%* (c) −55.3% (−121.8% to −8.8%) VE = (1 − RR) x 100 *no statistical evidence | |
| Children aged 5 to 13 years | Clinical confirmation after virus isolation or clinical picture observed in sibling of confirmed cases. Parents interview and evaluation by study investigators | (a) Jeryl Lynn (b) Urabe (c) Rubini Vaccination records | (a) N = 36 (b) N = 40 (c) N = 79 at least 1 dose | N = 8 unvaccinated | (a) 5/36 versus 5/8 (b) 3/40 versus 5/8 (c) 53/79 versus 5/8 | (a) 78% (64% to 82%) (b) 87% (76% to 94%) (c) −4% VE = (ARU − ARV)/ARU x 100 | |
| Children (aged < 19 years) attending (a) primary schools and (b) their household contacts. (c) index case | Clinical diagnosis | MMR Jeryl Lynn or RIT 4385 | (a1) (1 dose) N = 484 (a2) (2 doses) N = 301 (b) (unspecified number of doses) N = 19 (c) (any dose) N = 16 | (a) N = 351 (b) N = 87 (c) N = 90 unvaccinated | (a1) 13/484 versus 183/351 (a2) 7/301 versus 183/351 (b) 3/19 versus 44/87 (c) 3/16 versus 44/90 ‐‐‐‐‐‐‐‐‐‐‐‐‐‐‐‐‐‐ adjusted data (a1) 9/484 versus 65/351 (a2) 7/301 versus 86/351 | (a1) 92% (83% to 96%) (a2) 93% (85% to 97%) (b) 67% (65% to 95%) (c) 11% (−4% to 88%) Adjusted for confounders from Poisson regression VE = 1 − incidence rate In order to include "adjusted data", Di Pietrantonj 2006 method is used to convert adjusted estimates and its 95% CI in "adjusted data". | |
| Primary school: 108 students of 5 classes with at least 1 mumps case | Clinical or | MMR vaccine: RIT 4385 or | (a) (1 dose) N = 4 (b) (2 doses) N = 89 | N = 6 | (a) 3/4 versus 5/6 (b) 6/89 versus 5/6 | (a) 10% (−75% to 53%) (b) 91.9% (81.0% to 96.5%) VE = (1 − RR) x 100 | |
| ARU: attack rate amongst unvaccinated | |||||||
| Study | Population characteristics | Case definition | Controls/selection | MMR strain/exposure | N cases vaccinated/ | OR (95% CI) | VE% (95% CI) |
|---|---|---|---|---|---|---|---|
| Children aged between 15 months and 10 years from Navarre region (Northern Spain) at the time a mumps outbreak occurred (between August 2006 and June 2008) | (a) N = 181 (b) N = 72 (c) N = 241 Laboratory or epidemiological swelling of 1 of more salivary glands Obtained from cases notified | (a) N = 875 (b) N = 353 (c) N = 1205 matched for sex, | (a) 1 dose (b) 2 doses (c) any dose MMR/Jeryl Lynn doses received at least 30 days before symptom disease onset. Blinded review of primary care vaccination registry | (a) 169/181 versus 852/875 (b) 59/72 versus 330/353 (c) 228/241 versus 1182/1205 | ‐ | (a) 66% (25% to 85%) (b) 83% (54% to 94%) (c) 72% (39% to 87%) adjusted for confounders | |
| Children in Guangzhou aged 8 months to 12 years during 2006 to 2012 | N = 1983 randomly selected clinical definition | N = 1983 matched 1:1 by birth date, gender, residence not reported breakdown by type of vaccine administrated | (a) MMR/Jeryl Lynn RIT4385 (b) measles‐mumps (c) missing (vaccine type) (d) any vaccine 1 dose | (a) 112 versus 145 (b) 242 versus 261 (c) 620 versus 837 (d) 974/1983 versus 1243/1983 | (a) OR extracted from VE reported 0.49 (0.26 to 0.93) | (a) 51.3% (7.2% to 95.0%) | |
| Children and adolescents aged 14 months to 15 years from urban area of Alba and Bra and 10 rural towns (n = 12,800 residents from 0 to 15 years) during 2000 to 2001 epidemic | Clinical diagnosis (cases notified by national infectious diseases surveillance system) N = 139 notified mumps cases | N = 139 randomly selected from immunisation registry, matched for birth year and address. (controls received | MMR vaccine not specified. Vaccination registry and phone interviews, immunisation should have been received at least 30 days before disease onset. | 90/139 versus 111/139 | 0.46 (0.27 to 0.80) | 53.7% (20.4% to 73.0%) | |
| Children and adolescents (15 months to 16 years) from Oporto (Portugal) | Clinical diagnosis Cases reported by GPs or hospital doctors, occurred during the 1995 to 1996 mumps outbreak (a) N = 73 (b) N = 133 (c) N = 189 | 2 consecutive (a) N = 169 (b) N = 236 (c) N = 378 Controls received at least 1 MMR dose. | Assuming that before 1 November 1992 MMR mumps Urabe strain was administered, subsequently the Rubini strain (a) Urabe (b) Rubini (c) all at least 1 MMR dose | (a) 56/73 versus 142/169 (b) 116/133 versus 209/236 (c) 172/189 versus 351/378 | ‐ | (a) 70% (25% to 88%) (b) 1% (−108% to 53%) adjusted for confounders | |
| Children and adolescents | Clinical diagnosis N = 156 (GP notification to the local CCDC, mumps diagnoses from electronic practice list, verbal reports by community members) ‐‐‐‐‐‐‐‐‐‐‐‐ Laboratory confirmation of clinical diagnosis N = 43 GP notification to the local CCDC of notified cases, IgM and mumps RNA testing was offered | N = 175 | Jeryl Lynn 1 or 2 MMR doses received at least 1 month before index date (a) at least 1 dose (b) 1 dose (c) 2 doses | 79/156 versus 134/175 | (a) 0.31 (0.20 to 0.50) | (a) 69% (50% to 80%) (crude) (a) 69% (41% to 84%) adjusted for age, sex, practice ‐‐‐‐‐‐‐‐‐‐ Laboratory‐confirmed cases (a) 65% (25% to 84%) (b) 64% (40% to 78%) (c) 88% (62% to 96%) All adjusted for age, sex, practice. Proportion of vaccinated in cases and controls not provided. | |
| Children (a) prospective case‐control study from March 2010 (b) retrospective case‐control study 2008 to 2009 in western Seoul, Incheon, and Goyang (c) total | (a) N = 55 (a1) 1 dose (a2) 2 doses (a3) any dose ‐‐‐‐‐‐‐‐‐‐‐‐ (b) N = 122 (b1) 1 dose (b2) 2 doses (b3) any dose ‐‐‐‐‐‐‐‐‐‐‐‐‐‐‐‐‐‐ (c) N = 177 (c1) 1 dose (c2) 2 doses (c3) any dose | (a) N = 165 (a1) 1 dose (a2) 2 doses (a3) any dose ‐‐‐‐‐‐‐‐‐‐‐‐‐‐‐‐ (b) N = 449 (b1) 1 dose (b2) 2 doses (b3) any dose ‐‐‐‐‐‐‐‐‐‐‐‐‐‐ (c) N = 614 (c1) 1 dose (c2) 2 doses (c3) any dose | MMR vaccine not described (assumed to be Jeryl Lynn following Park 2015) For (a) and (b): data about demographic characteristics and MMR vaccination status were collected from cases and controls. | ‐‐‐‐‐‐‐‐‐‐(a)‐‐‐‐‐‐‐‐‐‐‐‐‐‐‐‐ (a1) 0.58 (0.05 to 6.90) (a2) 1.1 (0.09 to 13.3) (a3) 0.67 (0.06 to 7.35) ‐‐‐‐‐‐‐‐‐‐(b)‐‐‐‐‐‐‐‐‐‐‐‐‐‐‐ (b1) 0.33 (0.02 to 5.33) (b2) 0.11 (0.01 to 2.12) (b3) 0.33 (0.02 to 5.33) ‐‐‐‐‐‐‐‐‐(c)‐‐‐‐‐‐‐‐‐‐‐ (c1) 0.58 (0.10 to 3.56) (c2) 0.42 (0.06 to 2.81) (c3) 0.50 (0.08 to 2.99) | ‐‐‐‐‐‐‐‐(a)‐‐‐‐‐‐‐‐‐ (a1) 42.0%* (b1) 67.0%* ‐‐‐‐‐‐‐‐‐(c)‐‐‐‐‐‐‐‐‐‐‐ *no statistical evidence | ||
| About 600 pupils attending a boarding school in Scotland during a mumps outbreak that peaked between October and November 2004 | Virological confirmation N = 20 (aged 13 to 17 years). Cases notified to consultant | N = 40 | MMR vaccine not described (a) 1 dose (b) 2 doses (c) any dose Not specified. Pre‐outbreak communication with parents, and from Scottish Immunisation Recall System. | (a) 9/18 versus 20/34 (b) 2/11 versus 6/20 (c) 11/20 versus 26/40 | (a) 0.7 (0.22 to 2.21) (b) 0.52 (0.09 to 3.16) (c) 0.66 (0.22 to 1.97) | (a) 30.0%* (b) 48.1%* (c) 32.4%* *no statistical evidence | |
| CCDC: Consultant in Communicable Disease Control | |||||||
| Study | Population | Case definition | Vaccine/strain | N vaccinated | N control | N events in exposed/ | VE% (95% CI) |
|---|---|---|---|---|---|---|---|
| Cohort study Secondary attack rate | Middle school with a total of 1621 students enrolled in the 7th, 8th, and 9th grades, with a total of 37 classes (ages 11 to 13) | Probable rubella case: defined as a suspected rubella case with fever > 37.5 °C and at least 1 of the following symptoms: arthralgia, arthritis, lymphadenopathy, or conjunctivitis. Laboratory‐confirmed case: required a positive serologic test for rubella IgM antibody. Epidemiologically linked case: confirmed case was defined as a suspected case or a probable case that was not laboratory confirmed, but that was geographically and temporally related to a laboratory‐confirmed case. | MMR (BRD‐II or RA27/3) A BRD‐II rubella strain vaccine was developed in the 1980s in China, and has been available in the Chinese private market since1993. All monovalent rubella and measles and rubella combined (MR) vaccines in use in China are based on the BRD‐II rubella strain. A domestic measles, mumps, and rubella combined vaccine (MMR) based on BRD‐II strain has been available in China’s private market since 2003. There is also an imported RA27/3 strain‐based vaccine available in China. | ‐ | ‐ | Secondary cases = 2 Exposed person = 47 RR 0.11 (95% CI 0.03 to 0.44) | 89% (56% to 97%) VE = (1 − RR) x 100 |
| CI: confidence interval | |||||||
| Study ID and | Population | Outcome | Vaccine arms | Comparator arm | Vaccine arm | Comparator arm | VE% (95% CI) |
|---|---|---|---|---|---|---|---|
| RCT | This study is the first phase (1 September 2005 to 29 June 2009) of an RCT. The study was done in 111 study centres in Europe: Czech Republic (22), Greece (11), Italy (9), Lithuania (9), Norway (5), Poland (10), Romania (9), Russia (14), Slovakia (17), and Sweden (5). An eligible participant was a healthy child aged 12 to 22 months at the time of the first vaccination; had a measles, and rubella diseases and vaccinations; and was one of the following: (1) at home with at least 1 sibling (with negative history of varicella disease and vaccination), (2) attending a child minder (where at least 1 child was without a known positive (3) playing for more than 5 min weekly with children without a known positive history of varicella disease and vaccination, a day‐care centre from 24 months of age. An eligible participant’s parents or guardians had direct access to a telephone and were deemed by the complying with the requirements of the trial protocol. | The primary efficacy endpoint was the occurrence of confirmed varicella from 42 days after the second vaccine dose to the end of the first phase of the trial. The secondary efficacy endpoint was the occurrence of confirmed varicella graded by severity over the same time period. Varicella cases (a) All (b) Moderate/severe Follow‐up = 3 years | MMRV group: 2 doses of MMRV (Priorix‐Tetra, GSK) N = 2279 MMR+V group: 1 dose MMR (Priorix, GSK) and monovalent varicella vaccine (Varilrix, GSK) at dose 2 N = 2263 | MMR group (control): 2 doses of MMR (Priorix, GSK) N = 743 | MMRV (a) 37/2279 (b) 2/2279 MMR+V (a) 243/2263 (b) 37/2263 | MMR (a) 201/743 (b) 117/743 | MMRV (a) 94.9% (92.4% to 96.6%) (b) 99.5% (97.5% to 99.9%) MMR+V (a) 65.4% (57.2% to 72.1%) (b) 90.7% (85.9% to 93.9%) VE = (1 − HR) x 100 |
| RCT linked to | Healthy children aged 12 to 22 months. n = 5803 children enrolled and vaccinated (TVC) in phase A, n = 4580 in the TVC in phase B, n = 3829 completed the study up to Year 6; n = 5289 ATP cohort for efficacy in phase A + B, n = 3791 in the ATP cohort for efficacy in phase B | Varicella cases (a) All (b) Moderate/severe (c) Severe Follow‐up = 6 years | ATP phase A + B MMRV n = 2279 MMR+V n = 2266 Phase B MMRV n = 1802 MMR+V n = 1593 MMRV group 2 doses of MMRV (Priorix‐Tetra, GSK) at Day 0 and Day 42 MMR+V group 1 dose of MMR (Priorix, GSK) at Day 0 and 1 dose of monovalent varicella vaccine (Varilrix, GSK) at Day 42 | ATP phase A + B Phase B MMR n = 396 MMR group 2 doses of the MMR (Priorix, GSK) vaccine at Day 0 and Day 42 | Phase A + B MMRV (a) 71/2279 (b) 6/2279 (c) 0/2270 MMR+V (a) 419/2266 (b) 58/2266 (c) 1/2266 Phase B MMRV (a) 33/1800 (b) 4/1800 (c) 0/1800 MMR+V (a) 176/1592 (b) 18/1592 (c) 0/1592 | Phase A + B MMR (a) 325 /744 (b) not reported Phase B (a) 125/396 (b) not reported | Phase A + B MMRV (a) 95.0% (93.6% to 96.2%) (b) 99.0% (97.7% to 99.6%) (c) undefined MMR+V (a) 67.0% (61.8% to 71.4%) (b) 90.3% (86.9% to 92.8%) (c) 94.6% (55.3% to 99.4%) Phase B MMRV (a) 95.3% (93.1% to 96.8%) (b) 98.4% (95.5% to 99.4%) (c) undefined MMR+V (a) 69.5% (61.5% to 75.8%) (b) 91.8% (85.9% to 95.2%) (c) undefined VE = (1 − HR) x 100 |
| RCT linked to | Children aged 12 to 22 months were eligible for inclusion if: had not received MMR or varicella vaccines, or both, or had measles‐mumps‐rubella or varicella zoster or herpes zoster diseases, or both, and were at home with at least 1 sibling with negative history of varicella disease and vaccination, at a child‐minders where at least 1 child was without a known positive history of varicella disease and vaccination, playing for more than 5 min/week with children without a known positive history of varicella disease and vaccination, or registered to attend day care from 24 months. | Varicella cases (a) All (b) Moderate/Severe Follow‐up = 10 years | Phase A + B MMRV n = 2279 MMR+V n = 2266 Phase B MMRV n = 1800 MMR+V n = 1591 MMRV group 2 doses of MMRV (Priorix‐Tetra, GSK) at Day 0 and Day 42 MMR+V group 1 dose of MMR (Priorix, GSK) at Day 0 and 1 dose of monovalent varicella vaccine (Varilrix, GSK) at Day 42 | Phase A + B Phase B MMR n = 396 MMR group 2 doses of the MMR (Priorix, GSK) vaccine at Day 0 and Day 42 | Phase A + B MMRV (a) 71/2279 (b) 6/2279 MMR+V (a) 469/2266 (b) 67/2266 Phase B MMRV (a) 33/1800 (b) 4/1800 MMR+V (a) 176/1592 (b) 18/1592 | Phase A + B MMR (a) 352/744 (b) 176/744 Phase B (a) 149/396 (b) 59/396 | Phase A + B MMRV (a) 95.4% (94.0% to 96.4%) (b) 99.1% (97.7% to 99.6%) MMR+V (a) 67.2% (62.3% to 71.5%) (b) 89.5% (86.1% to 92.1%) Phase B MMRV (a) 95.9% (94.1% to 97.1%) (b) 98.7% (96.4% to 99.5%) MMR+V (a) 69.8% (62.8% to 75.5%) (b) 90.0% (84.2% to 93.7%) VE = (1 − HR) x 100 |
| ATP: according‐to‐protocol | |||||||
| Study | Population | Case definition | Vaccine/strain | N vaccinated | N control | N events in exposed/ | VE% (95% CI) |
|---|---|---|---|---|---|---|---|
| Children aged 0 to 14 registered with 35 Pedianet database physicians across Italy between 1 October 1997 and 30 September 1998 | Varicella cases recorded in the Pedianet databases are based on physician confirmation only (no laboratory tests were performed). | MMRV: vaccine ProQuad | n = 2357 | n = 912 unvaccinated | 43/2357 versus 287/912 | unadjusted estimate 94% (92% to 96%) adjusted estimate 94% (91% to 95%) VE = (1 −RR) x 100 | |
| Between January 2006 and October 2013, n = 1,449,411 children | 4‐step algorithm to only select confirmed Step 1: excluded incompatible or implausible coding combinations for varicella diagnosis reliability; step 2: excluded observations with diagnosis reliability other than confirmed (i.e. suspected, excluded, recovered); step 3: excluded observations with diagnosis type other than incident (i.e. previous state, unknown, not provided); to the earliest ICD‐10 code per patient whilst also keeping the information about the most severe ICD‐10 code (within up to one‐quarter following the initial diagnosis) using the following ranking (in descending order of severity): varicella with encephalitis, meningitis, pneumonia, other complications, no complications, no further ‘no complications’. | Since 2004, single‐dose varicella vaccination has all children aged 11 to 14 months. 2 single‐compound varicella vaccines (VAR; Varivax, were initially available. In 2006, a combined (MMR)‐varicella vaccine (MMRV; was licenced with a 2‐dose schedule. A 2‐dose schedule has been recommended since 2009 targeting children with the second dose at age 15 to 23 months. Since 2011, the first immunisation has been given preferably as 2 separate injections of VAR and MMR due to higher rates of febrile seizures following immunisation with MMRV. (a) 1 dose MMRV (b) 2 doses MMRV | ‐ | ‐ | ‐ | VE = (1 − HR) x 100 adjusted estimate (a) 81.7% (81.0% to 82.4%) (b) 94.4% (94.2% to 94.6%) ‐‐‐‐‐‐‐‐‐‐‐‐‐‐‐‐‐‐‐ (a) 61.8% (60.6% to 63.0%) | |
| 1084 children attended day‐care centres in Germany | Varicella was classified clinically as mild (< 50 skin lesions), moderate (≥ 50 skin lesions), severe (any hospitalised case). | MMRV Priorix‐Tetra (a) All‐brand doses (b1) All‐brand 1 dose (b2) All‐brand 2 dose ‐‐‐‐‐‐‐‐‐‐‐‐‐‐‐‐‐‐‐‐‐‐‐‐‐‐‐‐‐‐‐‐‐ (c) Varivax 1 dose (d) Varilrix 1 dose (e1) Priorix‐Tetra 1 dose (e2) Priorix‐Tetra 2 doses ‐‐‐‐‐‐‐‐‐‐‐‐‐‐‐‐‐‐‐‐‐‐‐‐‐‐‐‐‐‐‐‐‐‐ (f1) Mild disease (f2) Moderate disease | (a) n = 244 (b1) n = 167 (b2) n = 77 (c) n = 48 (d) n = 77 (e1) n = 38 (e2) n = 56 (f1) n = 233 (f2) n = 221 | n = 108 (f1) n = 71 (f2) n = 93 | (a) 33/244 versus 52/108 (b1) 31/167 versus 52/108 (b2) 2/77 versus 52/108 (c) 4/48 versus 52/108 (d) 19/77 versus 52/108 (e1) 7/38 versus 52/108 (e2) 2/56 versus 52/108 (f1) 22/233 versus 15/71 (f2) 10/221 versus 37/93 | (a) 71% (57% to 81%) (b1) 62% (43% to 75%) (b2) 94% (75% to 98%) ‐‐‐‐‐‐‐‐‐‐‐‐‐‐‐‐‐‐‐‐‐‐‐‐‐‐‐‐‐‐ (c) 86% (56% to 96%) (d) 56% (29% to 72%) (e1) 55% (8% to 78%) (e2) 91% (65% to 98%) ‐‐‐‐‐‐‐‐‐‐‐‐‐‐‐‐‐‐‐‐‐‐‐‐‐‐‐‐‐‐ (f1) 53% (14% to 75%) (f2) 89% (78% to 95%) adjusted for confounders VE = (ARU − ARV)/ARU x 100 VE = (1 − RR) x 100 | |
| Children at (a) preschool (b) elementary school (c) all ages | Reported by | MMRV (Priorix‐Tetra) Varicella OKA; 1 dose | (a) n = 170 (b) n = 71 (c) n = 241 | (a) n = 40 (b) n = 287 (c) n = 327 | (a) 2/170 versus 14/40 (b) 2/71 versus 223/287 (c) 4/241 versus 237/327 | (a) Not reported (b) 69.2% (50.5% to 88.1%) (c) 59.9% (48.3% to 69.8%) VE = (ARU − ARV)/ARU x 100 VE = (1 − RR) x 100 | |
| ARU: attack rate amongst unvaccinated | |||||||
| Study | Population characteristics | Case definition | Controls/selection | MMR strain/exposure | N cases vaccinated/N cases | OR (95% CI) | VE% (95% CI) |
|---|---|---|---|---|---|---|---|
| From November 2013 to December 2015, | Cases were defined as children aged 15 to 32 months with rash and either suspected as having varicella by an attending physician or being a contact to a confirmed varicella case. Cases were confirmed by either clinical or laboratory criteria. Cases: n = 168 Cases were further classified by severity of disease based on number of skin lesions, being: (1) mild – fewer than 50 lesions; (2) mild/moderate – between 50 and 249 lesions; (3) moderate – between 250 and 499 lesions; or (4) severe – 500 lesions or more, having been hospitalised, or having any complication. | Controls matched 1:2 by: age (15 to 32 months). neighbourhood of the case, in which no history of varicella or outpatient clinics visits due to skin lesion was reported. To identify controls, houses nearby the cases were visited following a systematic sampling procedure. Controls: n = 301 | MMRV A combined tetravalent vaccine containing measles, mumps, rubella, and varicella antigens (MMRV), manufactured by GlaxoSmithKline | (a) Any severity | Adjusted‐estimates (a) 0.14 (0.07 to 0.28) (b) 0.07 (0.03 to 0.18) adjusted for confounders: | (a) 86% (72% to 92%) (b) 93% (82% to 97%) VE = 1 − OR | |
| Children between 15 months and 10 years of age | PCR‐confirmed varicella Cases n = 54 | Matched 1:8 by paediatric practice, district of residence, and date of birth (± 1 year) Controls n = 432 | MMR+V (Varivax OKA/Merck) not described (a) any doses and age (a1) 1 dose (a2) 2 doses (b) age < 3 years (b1) 1 dose (c) age ≥ 3 years (c1) 1 dose (c2) 2 doses | (a) 6/54 versus 175/432 (a1) 5/54 versus 112/432 (a2) 1/54 versus 63/432 (b1) 1/6 versus 36/48 (c1) 4/48 versus 76/384 (c2) 1/48 versus 63/384 | ‐ | Adjusted estimates (a) 92% (77% to 97%) (a1) 87% (60% to 97%) (a2) 97% (79.5% to 99.6%) (b1) 84% (−58% to 100%)(*) (c1) 80% (37% to 95%) (c2) 97% (79% to 100%) VE = (1 −OR) x 100 (*) no statistical evidence | |
| Children at least 1 year of age, born on or after 1 July 2003, who resided in Germany | PCR‐confirmed varicella n = 432 | Children matched by age and paediatric practice, fulfilling the same criteria as cases but without history or present clinical diagnosis of varicella n = 432 | Any varicella vaccine (a1) 1 dose (a2) 2 doses ‐‐‐‐‐‐‐‐‐‐‐‐‐‐‐‐‐‐‐‐‐‐‐‐‐‐‐‐ OKA/GSK (b1) 1 dose (b2) 2 doses ‐‐‐‐‐‐‐‐‐‐‐‐‐‐‐‐‐‐‐‐‐‐‐‐‐‐‐‐‐ Other than OKA/GSK* (c1) 1 dose (c2) 2 doses ‐‐‐‐‐‐‐‐‐‐‐‐‐‐‐‐‐‐‐‐‐‐‐‐‐‐‐ Unknown vaccine (d1) 1 dose (d2) 2 doses ‐‐‐‐‐‐‐‐‐‐‐‐‐‐‐‐‐‐‐‐‐‐‐‐‐‐‐‐ Any varicella vaccine (after vaccination) (y1) up to 1 year (y2) 1 to 2 year (y3) 4 to 5 year ‐‐‐‐‐‐‐‐‐‐‐‐‐‐‐‐‐‐‐‐‐‐‐‐‐‐‐‐‐‐‐‐‐‐‐ (*) includes OKA/Merck | (a) 57/432 versus 195/432 (a1) 55/430 versus 153/390 (a2) 2/377 versus 42/279 ‐‐‐‐‐‐‐‐‐‐‐‐‐‐‐‐‐‐‐‐‐‐‐‐‐ (b1) 35/410 versus 63/300 (b2) 0/375 versus 6/243 ‐‐‐‐‐‐‐‐‐‐‐‐‐‐‐‐‐‐‐‐‐‐‐‐‐ (c1) 19/394 versus 87/324 (c2) 2/377 versus 25/262 ‐‐‐‐‐‐‐‐‐‐‐‐‐‐‐‐‐‐‐‐‐‐‐‐‐ (d1) 1/376 versus 3/240 (d2) 0/375 versus 11/248 | ‐ | Adjusted estimates (a1) 86.4% (77.3% to 91.8%) (a2) 94.3% (76.4% to 98.6%) (b1) 71.5% (49.1% to 84.0%) (b2) not reported (c1) not reported (c2) not reported (d1) not reported (d2) not reported (y1) 94.5% (76.9% to 98.7%) (y2) 81.5% (56.8% to 92.1%) (y3) 73.2% (9.1% to 92.1%) VE = (1 − OR) x 100 | |
| Children between 13 months and 16 years of age. (a) < 5 years old (b) 5 to 10 years old (c) > 10 years old (d) all ages | PCR‐confirmed varicella n = 202 | Matched 1:2 according to date of birth (within 1 month) and paediatric practice n = 389 | MMR+V Vaccine type and | 46/202 versus 238/389 | ‐ | Adjusted estimates (a) 79% (61% to 89%) (b) 89% (80% to 94%) (c) 92% (45% to 99%) (d) 87% (78% to 90%) VE = (1 − OR) x 100 | |
| CI: confidence interval | |||||||
| Study | Population characteristics | Case definition | Exposure MMR/MMRV vaccine | Crude data | Estimate (95% CI) | VE% (95% CI) |
|---|---|---|---|---|---|---|
| Case‐only ecological method | Hospitalisation between 2004 to 2012 in the Tuscan region. Aged 0 to 14 years (a) age < 1 year (b) age 1 to 4 years (c) age 5 to 14 years | Hospitalised cases for varicella or its complications, as a primary or secondary discharge diagnosis, with the following ICD‐9‐CM codes (2002 and 2007) were examined: | MMRV vaccine: not described and monovalent varicella vaccine Reference period 2004 to 2007 Exposed period 2009 to 2012 Data from 2008, the transition year | Reference period (a) 73/122,483 (b) 189/478,481 (c) 105/1,141,304 Exposed period (a) 42/128,440 (b) 99/523,810 (c) 55/1,222,222 | RR (95% CI) (*) (a) 0.55 (0.38 to 0.80) (b) 0.48 (0.38 to 0.61) (c) 0.48 (0.35 to 0.67) (*) Relative risk between exposed and reference period | VE = 1 − RR (a) 45.1% (19.8% to 62.5%) |
| ga‐Pozza 2011 | Hospitalisation between 2000 to 2008 in the Veneto region. Aged 0 to 14 years | Varicella cases incidence: (a) from surveillance data retrieved from the RDP (b) sentinel surveillance system based on a sample of paediatricians (SPES). Hospitalised cases for varicella hospital discharges that reported diagnoses codes 052.X. Admissions with coexistent codes for herpes zoster, i.e. 053.X, were excluded. (c) hospitalisations | MMRV vaccine: not described and monovalent varicella vaccine Reference period 2000 to 2006 Exposed period 2007 to 2008 | Cases/person time (RDP) incidence reference period (a) 81,276/438,3097 Exposed period (a) 14,749/1,345,351 (SPES) incidence reference period (b) 13,543/196,949 Exposed period (b) 1344/26,861 Hospitalised reference period (c) 770/4,383,497 Exposed period (c) 126/1,348,474 | rr (95% CI) (a) 0.59 (0.58 to 0.6) ‐‐‐‐‐‐‐‐‐‐‐‐‐‐‐‐‐‐‐‐‐ (a1) 0.44 (0.43 to 0.45) Sensitivity analysis Data from 2007, | VE = (1 − rr) x 100 (a) 40.9% (39.8% to 41.9%) ‐‐‐‐‐‐‐‐‐‐‐‐‐‐‐‐‐‐‐‐‐‐‐‐‐‐‐‐‐‐ (a1) 56.2% (54.9% to 57.3%) |
| ga‐Tafuri 2015 | Hospitalisation between 2003 to 2012 in the Puglia region. Aged 0 to 14 years (a) age < 1 year (b) age 1 to 4 years (c) age 5 to 14 years | Hospitalised cases for varicella Hospitalisation rates, overall and specific by from the regional HDR, selecting all hospital admissions with or its complications (ICD9‐CM Incidence rates, overall and specific by age, between 2003 collected in the Apulian for communicable diseases. | MMRV vaccine: not described and monovalent varicella vaccine Reference period 2003 to 2005 Exposed period 2009 to 2012 | Hospitalised reference period (a) 245/39,618 (b) 2148/163,321 (c) 2201/451,858 Exposed period (a) 39/37,356 (b) 161/152,607 (c) 289/420,058 Incidence reference period (a) 14/39,548 (b) 57/1,623,931 (c) 42/446,809 Exposed period (a) 5/39,063 (b) 9/160,714 (c) 10/434,783 | rr (95% CI)(*) Hospitalised (a) 0.17 (0.12 to 0.24) (b) 0.08 (0.07 to 0.09) (c) 0.14 (0.12 to 0.16) Incidence (a) 0.36 (0.13 to 1.03) (b) 0.16 (0.08 to 0.33) (c) 0.25 (0.12 to.050) (*) Relative risk between exposed and reference period | VE = (1 − rr) x 100 Hospitalised (a) 63.8% (−0.4% to 87%) Incidence (a) 83.1% (76.3% to 88%) |
| CI: confidence interval | ||||||
| Study ID and design | Population | Vaccine arm | Comparator arm | Outcome | MMR vaccine arm | Other vaccine arms | Comparator arm |
|---|---|---|---|---|---|---|---|
| RCT | Children aged 11 months to 4 years Observation period 21 days | MMR vaccine Measles Schwarz Mumps Jeryl Lynn Rubella Cendehill n = 183 ‐‐‐‐‐‐‐‐‐‐‐‐‐‐‐‐‐‐‐ Temperature sample size n = 160 Normal temperature rectal 99.6 °F (37.5 °C) (163 children) Oral 98.6 °F (37 °C) (6 children) Axillary 97.6 °F | Placebo n = 40 ‐‐‐‐‐‐‐‐‐‐ Temperature sample size n = 35 | Reactions (a) Rash (b) Lymphadenopathy (d) Rhinitis (e) Cough (f) Other total ‐‐‐‐‐‐‐‐‐‐‐‐‐‐‐‐ Temperature (a) 1.5 to 2.4 °F (b) 2.5 to 3.4 °F (c) 3.5 to 4.4 °F (d) 4.5 to 4.9 °F (e) ≥ (normal + 1.5) °F | MMR vaccine (a) 22/183 (b) 2/183 (c) 4/183 (d) 2/183 (e) 5/183 (f) 35/183 total 70/183 ‐‐‐‐‐‐‐‐‐‐‐‐‐‐‐‐‐‐‐ Temperature above normal (a) 17/160 (b) 1/160 (c) 5/160 (d) 2/160 (e) 25/160 | ‐ | Placebo arm (a) 2/40 (b) 1/40 (c) 4/40 (d) 4/40 (e) 1/40 (f) 8/40 total 20/40 ‐‐‐‐‐‐‐‐‐‐‐‐‐‐‐‐‐‐‐ Temperature above normal (a) 2/35 (b) 2/35 (c) 0/35 (d) 0/35 (e) 4/35 |
| CCT | Infants aged 38 to 40 months Observation period 28 days | Arm A: n = 442 (1) MV/Rouvax Measles Schwarz at 9 months; and (2) MMR/Trimovax Measles Schwarz Mumps Urabe AM9 Rubella Wistar RA 27/3 at 15 months ‐‐‐‐‐‐‐‐‐‐‐‐‐‐‐‐‐‐‐‐‐‐‐ Arm B: n = 495 (3) MMR/Trimovax Measles Schwarz Mumps Urabe AM9 Rubella Wistar RA 27/3 at 12 months | No placebo arm | Systemic reactions (a) Fever (b) Runny nose (c) Cough (d) Rash (e) Diarrhoea ‐‐‐‐‐‐‐‐‐‐‐‐‐‐‐‐‐‐‐ Local (f) Redness (g) Swelling ‐‐‐‐‐‐‐‐‐‐‐‐‐‐‐‐‐ Total events (x) Fever (y) Systemic (z) Local | MMR vaccine (2)15 months; (3)12 months (a) 40/442; 55/495 (b) 7/442; 22/495 (c) 36/442; 34/495 (d) 16/442; 19/495 (e) 2/442; 5/495 ‐‐‐‐‐‐‐‐‐‐‐‐‐‐‐‐‐‐‐‐‐‐‐‐‐‐‐‐‐‐‐‐‐‐‐ Local (2)15 months; (3)12 months (f) 14/442; 19/495 (g) 2/442; 3/495 ‐‐‐‐‐‐‐‐‐‐‐‐‐‐‐‐‐‐‐‐‐‐‐‐‐‐‐‐‐‐‐‐‐‐ Total events (2)15 months; (3)12 months (x) 40/442; 55/495 (y) 61/442; 80/495 (z) 16/442; 22/495 | MV vaccine (1) 9 months (a) 38/442 (b) 19/442 (c) 28/442 (d) 2/442 (e) 5/442 ‐‐‐‐‐‐‐‐‐‐‐‐‐‐‐‐‐‐‐ Local (f) 7/442 (g) 2/442 ‐‐‐‐‐‐‐‐‐‐‐‐‐‐‐‐‐‐ Total events (x) 38/442 (y) 54/442 (z) 9/442 | |
| RCT | Children aged 12 to 18 months. Observation period 21 days | Arm A: n = 196 MV/Rouvax Measles Schwarz ‐‐‐‐‐‐‐‐‐‐‐‐‐‐‐‐‐‐‐‐‐‐‐ Arm B: n = 198 MMR/Trimovax Measles Schwarz Mumps Urabe AM9 Rubella Wistar RA 27/3 | No placebo arm | Local symptoms ‐‐‐‐‐‐‐‐‐‐‐‐‐‐‐‐‐‐‐‐‐‐‐‐‐‐‐ Specific systemic ‐‐‐‐‐‐‐‐‐‐‐‐‐‐‐‐‐‐‐‐‐‐‐‐‐‐‐‐‐ Restlessness: used to describe a non‐specifically unwell child; it covers terms such as irritable miserable tearful clingy not sleeping. | MMR vaccine (Arm B) Local (a) 18/198 ‐‐‐‐‐‐‐‐‐‐‐‐‐‐‐‐‐‐‐‐‐‐‐‐‐‐‐ Specific systemic ‐‐‐‐‐‐‐‐‐‐‐‐‐‐‐‐‐‐‐‐‐‐‐‐‐‐‐‐‐‐‐ Non‐specific systemic (a) 76/198 | MV vaccine (Arm A) Local (a) 16/196 (b) 0/196 (c) 14/196 ‐‐‐‐‐‐‐‐‐‐‐‐‐‐‐‐‐‐‐‐‐‐‐‐‐‐‐‐‐‐‐ Specific systemic (a) 100/196 ‐‐‐‐‐‐‐‐‐‐‐‐‐‐‐‐‐‐‐‐‐‐‐‐‐‐‐‐‐‐‐ Non‐specific systemic (a) 74/196 | |
| RCT | Children aged 15 months to 5 years Observation period 42 days | Arm(1): n = 43: Arm(2): n = 41: Arm(3): n = 47: Arm(4): n = 142 Arm(5): n = 46: Rubella/Wistar RA27/3 Arm(6): n = 141: | Placebo arm (vaccine diluent) | Reactions (a) Local reaction (b) Fever (c) Fever (fever 39.4 to 40.5 °C) (d) Respiratory symptoms (e) Rash (f) Lymphadenopathy (g) Sore eyes (h) Joint symptoms | MMR vaccine | Other vaccine arms: (1); (2); (3); (5) (a) 1/43; 6/41; 3/47; 2/46 | Placebo arm (a) 3/42 |
| RCT | Pairs of twins aged (a) 14 to 18 months (first dose) (b) 6 years (second dose) Observation period 21 days | MMR vaccine Vivirac (MSD) 2 doses n = 581 | Placebo arm | No data available for quantitative synthesis | |||
| RCT | Children aged 10 months to 8 years Observation period | MMR vaccine Measles Schwarz Mumps Jeryl Lynn Rubella Cendehill n = 403 | Placebo arm n = 205 | Temperature (2) Rectal ‐‐‐‐‐‐‐‐‐‐‐‐‐‐‐‐‐‐‐‐‐‐‐‐‐‐ (a) < 37.0 °C (b) 37.0 to 37.4 °C (c) < 37.5 °C (d) 37.5 to 37.9 °C (e) 38.0 to 38.4 °C (f) 38.5 to 38.9 °C (g) 39.0 to 39.4 °C (h) 39.5 to 39.9 °C (i) 40.0 to 40.4 C° ‐‐‐‐‐‐‐‐‐‐‐‐‐‐‐‐‐‐‐‐‐‐‐‐‐‐ Reactions (s1) Rash | MMR vaccine (1) Temperature axillary (a) 56/244 (b) 154/244 (c) 210/244 (d) 21/244 (e) 6/244 (f) 2/244 (g) 3/244 (h) 2/244 (i) 0/244 ‐‐‐‐‐‐‐‐‐‐‐‐‐‐‐‐‐‐‐‐‐‐‐ (2) Temperature rectal (a) not reported (b) not reported (c) 48/142 (d) 51/142 (e) 30/142 (f) 8/142 (g) 1/142 (h) 1/142 (i) 3/142 ‐‐‐‐‐‐‐‐‐‐‐‐‐‐‐‐‐‐‐‐ Reactions (s1) 36/403 | Placebo arm (1) Axillary temperature (a) 32/176 (b) 132/176 (c) 164/176 (d) 9/176 (e) 2/176 (f) 1/176 (g) 0/176 (h) 0/176 (i) 0/176 ‐‐‐‐‐‐‐‐‐‐‐‐‐‐‐‐‐ (2) Rectal temperature (a) Not reported (b) Not reported (c) 6/28 (d) 13/28 (e) 6/28 (f) 1/28 (g) 2/28 (h) 0/28 (i) 0/28 ‐‐‐‐‐‐‐‐‐‐‐‐‐‐ Reactions (s1) 9/205 | |
| Cluster‐RCT | Children aged 13 to 15 months Observation period 30 days | MMR vaccine MMRII (MSD) n = 253 | No placebo arm | Reactions (a) Lymphadenopathy (b) Nasal discharge (c) Rash | Reactions (a) 57/240 (b) 15/240 (c) 11/240 (d) 8/240 (e) 8/240 (f) 2/240 | ||
| MR: mumps‐rubella vaccine | |||||||
| Study ID and | Population | Vaccine arm | Comparator arm | Outcome | MMR vaccine arm | Other vaccine arms | Comparator arm |
|---|---|---|---|---|---|---|---|
| Prospective | Children aged 12 to 14 months | MMR vaccine n = 103 containing 4.1 TCID50 | Placebo n = 93 | Reactions (a) Local reactions(*) (b) Fever > 37.5 °C (c) Catarrhal symptoms (d) Swelling of cheeks (*)Local reactions: redness, swelling, tenderness | MMR vaccine arm (a) 2/103 (b) 2/103 (c) 13/103 (d) 3/103 | Placebo arm (a) 1/93 (b) 1/93 (c) 9/93 (d) 4/93 | |
| Retrospective | Children aged | MMR vaccine n = 1588 strain not stated | Comparator Not immunised n = 1242 | All episodes (e) Convulsion (f) Coryza (g) Swollen glands (h) Fever (i) Skin rash (k) Doctor consultation (*)Arthralgia was defined joint but not accompanied by swelling. (§)Possible arthritis | MMR vaccine arm All episodes (e) 11/1588 (f) 897/1588 (g) 184/1588 (h) 279/1588 (i) 260/1588 (j) 76/1588 (k) 616/1588 | Placebo arm All episodes (e) 5/1588 (f) 797/1588 (g) 135/1588 (h) 262/1588 (i) 216/1588 (j) 78/1588 (k) 554/1588 | |
| Prospective | Children aged | (1) MMR vaccine n = 319 Trimovax Mérieux, measles Schwarz rubella RA 27/3 (2) MV vaccine n = 16 Mérieux, containing | Local symptoms (a) Injury site bruise ‐‐‐‐‐‐‐‐‐‐‐‐‐‐‐‐‐‐‐‐‐‐‐‐‐‐‐‐ Systemic symptoms (a) Rash (b) Fever (c) Cough (d) Off‐color (e) Diarrhoea (f) Nappy rash (g) Earache (h) Parotitis (i) Lymphadenopathy (j) Hospital admission (a) Asymptomatic/unrelated | (1) MMR vaccine Local symptoms (a) 19/319 ‐‐‐‐‐‐‐‐‐‐‐‐‐‐‐‐‐‐‐‐‐‐‐‐‐‐‐‐ Systemic symptoms (a) 93/319 (b) 74/319 (c) 71/319 (d) 55/319 (e) 22/319 (f) 29/319 (g) 16/319 (h) 5/319 (i) 4/319 (j) 1/319 (a) 138/319 | (2) MV vaccine Local symptoms (a) 0/16 ‐‐‐‐‐‐‐‐‐‐‐‐‐‐‐‐‐‐‐‐‐‐‐‐‐‐‐‐ Systemic symptoms (a) 4/16 (b) 3/16 (c) 6/16 (d) 8/16 (e) 0/16 (f) 0/16 (g) 0/16 (h) 0/16 (i) 0/16 (j) 0/16 (a) 9/16 | ||
| Prospective | Children aged | (1) MMR vaccine n = 893 rubella Takahashi | Clinical reactions (a) Fever (≥ 37.5 °C) | (1) MMR vaccine (a) 139/893 | (2) Measles; (3) Mumps (a) 18/147; 0/122 | ||
| Prospective | Children aged | (1) MMR vaccine n = 6149 Immrawa or Pluserix, (not described) | Clinical reactions (a) Symptoms (1 day only) observation period | (1) MMR vaccine | (2) Measles vaccine | ||
| Prospective | Children aged | (1) MMR vaccine n = 236 | Clinical reactions (a) Irritability (g) Diarrhoea (o) Given paracetamol (p) Seen by a doctor observation period | (1) MMR vaccine (g) 55/236 | (2) Measles vaccine (g) 10/52 (o) 29/52 | ||
| cb‐Stokes 1971 prospective cohort | Costa Rica children aged | MMR vaccine n = 457 | Placebo arm n = 175 | (a) Conjunctivitis Observation period 28 days (*)Otitis, allergy, | MMR vaccine arm | Placebo arm | |
| USA; prospective cohort | USA children aged | MMR vaccine USA n = 228 | Placebo arm | (a) Conjunctivitis (a) < 99 °F, Observation period 28 days (*)Unrelated illness: ‐‐‐‐‐‐‐‐‐‐‐‐‐ Temperature | MMR vaccine arm ‐‐‐‐‐‐‐‐‐‐‐‐‐‐‐‐‐‐‐ | Placebo arm | |
| cohort study | Prospective | Children aged | MMR vaccine Serum Institute of India measles Edmonston‐Zagreb, 1000 CCID50 Sample sizes vaccine arms (1) n = 65,423 (2) n = 329,211 | Placebo arm unvaccinated Sample sizes placebo arms (1) n = 12,253 (2) n = 46,232 observation period | Local reactions Systemic reactions | Vaccine arms (1) age 16 to 24 months Local reactions Systemic reactions (2) age 5 to 7 years Local reactions Systemic reactions | Placebo arms (1) age 16 to 24 months Local reactions Systemic reactions (2) age 5 to 7 years Local reactions Systemic reactions |
| Prospective cohort | 59 children aged | (1) MMR vaccine n = 22 Merck Institute Temperature (1) 7 to 11 days (2) 7 to 12 days (3) 7 to 15 days | Reactions (a) Swollen glands (c) Conjunctivitis (d) Rash Temperature (a) < 37.2 °C | (1) MMR vaccine (a) 12/22 (b) 8/22 (c) 7/22 (d) 1/22 (e) 10/22 ‐‐‐‐‐‐‐‐‐‐‐‐‐‐‐‐‐‐ Temperature (b) 4/22 (c) 3/22 (d) 0/22 | (2) MR; (3) Rubella (a) 9/15: 7/22 (b) 8/15; 5/22 (c) 7/15; 7/22 (d) 3/15; 2/22 (e) 6/15; 14/22 ‐‐‐‐‐‐‐‐‐‐‐‐‐‐‐‐‐‐ Temperature (b) 3/15; 3/22 (c) 3/15; 3/22 (d) 0/15; 0/22 | ||
| Prospective cohort | (1) MMR vaccine n = 68 (Merck, containing | Reactions (a) Rash (b) Lymphadenopathy (c) Arthralgia (e) Anorexia Temperature Temperature | (1) MMR vaccine Reactions (a) 16/68 Temperature | (2) Rubella vaccine Reactions (a) 3/67 Temperature (a) 37/67 | |||
| CCID50: cell culture infectious dose 50% | |||||||
| Study ID and | Population | Outcome definition | Exposure | Findings | Crude data | Estimate (95% CI) |
|---|---|---|---|---|---|---|
| Case‐control | Cases: Controls: (n = 1280) matching for HMO, location, age within 7 days, sex, and length of enrolment in health plan | 1. Encephalopathy: acute generalised disturbance of brain function requiring hospitalisation and consisting of coma or stupor that cannot be attributed to medication or postictal state. Such cases must have altered consciousness, delirium, obtundation and/or confusion. 2. Reyes syndrome: clinical symptoms of acute encephalopathy with altered level of consciousness as well as:
3. Encephalitis/encephalomyelitis: evidence of acute neurologic disease presenting with non‐specific signs such as fever, seizures, altered consciousness, headache, vomiting, meningismus, or anorexia. Multifocal involvement of the central nervous system and evidence of cerebrospinal fluid inflammation (7 white blood cells/mm3) were required. Diseases with other known aetiologies were excluded. For data analysis, all cases were stratified on the basis of their aetiology: known, unknown, suspected but unconfirmed (this last when a diagnosis was not confirmed by a diagnostic test). Hospitalisation cases for encephalopathy, Reyes syndrome, or encephalitis (primary or secondary diagnosis) in children aged 0 to 6 years, members of the health plan of 4 HMOs in the USA, and occurred between 1 January 1981 and 31 December 1995, were considered as possible cases. | Vaccine exposure (a) 7 to 14 days MMR type not reported. Vaccination status | The findings do not support a conclusion that there is an This corresponds roughly to an all‐cause incidence (not an attributable risk) of 1 in 200,000 after MMR, a rate that is not statistically different from background. Consequently, our results support the continued use of DTP and MMR vaccines. | N cases vaccinated/ (a) 1/452 versus 6/1280 | OR (95% CI) ‐‐‐‐‐‐‐‐‐‐‐‐‐‐‐‐‐‐‐‐‐‐‐‐‐‐‐‐ (a) 0.40 (0.05 to 3.46) (b) 0.35 (0.04 to 2.95) (c) 0.85 (0.27 to 2.68) (d) 0.64 (0.27 to 1.50) (e) 0.98 (0.47 to 2.01) adjusted estimates |
| Person‐time cohort | Children immunised aged 1 to 7 years old. Between n = 535,544 n = 119 children (MMR vaccine was administered before the disease), and only 97 between 0 and 24 months after MMR vaccination. | Encephalitis: acute or subacute onset of neurologic symptoms. Presence of neurologic symptoms or findings (clinical or laboratory, e.g. microbiological, electroencephalographic, computed tomographic) indicative of involvement of the brain parenchyma, such as coma, seizures, focal neurologic findings, or mental function impairment. Absence of evidence of other diagnoses, including non‐inflammatory conditions, and no microbiological or other laboratory findings suggestive of a non‐viral infection. When pleocytosis in CSF is present, the term encephalitis is used, implying an inflammatory response within the brain. The presence of normal CSF findings does not preclude the diagnosis if the other criteria are satisfied. Encephalopathy: clinically resembles encephalitis but no inflammatory response is evident. Chronic encephalopathy: persistence of acute findings usually over several months. The National Hospital Discharge Register was consulted by using the following ICD‐8 codes: 065.99, 066.01, 066.02, 072.01, 292.20, 292.38, 292.39, 323.00, 323.01, 323.08, 323.09, 781.70, 999, 999.10. Medical records of hospitalised participants were reviewed (in order to evaluate possible other causes of the event) and their correspondence to diagnostic criteria (see column on the right) examined. | Exposure risk period: (a) 0 to 3 months after vaccination Control period: (b) 4 to 24 months Observation period: (c) 0 to 24 months MMR II vaccine (Merck & Co, West Point, PA) measles: Enders‐Edmonston mumps: Jeryl Lynn rubella: Wistar RA 27/3 Vaccination data were assessed through vaccination register. | Not significant excess of hospitalisation within 3 months of vaccination (P = 0.28) Incidence of encephalitis of undefined cause amongst 1‐ to 7‐year‐old children decreased from 13.0 per 100,000 in 1985. | (a) 9 cases (3 months) (b) 88 cases (21 months) (c) 97 cases (24 months) | rr (95% CI)* 0.72 (0.36 to 1.42) (*)rate ratio amongst risk period (b) and control period (a) |
| Self‐controlled case series | Children aged 2 to 35 months (immunised with MMR; NK) with outcome of interest diagnosed between October 1998 and September 2001 (n = 107) | Onset of illness: day of hospital admission Fever: temperature of 37.5 °C; the questionnaire asked whether there was a fever and also for the maximum temperature recorded at any site by any method Encephalitis:
Exclude:
Cases of suspected encephalitis and/or severe illness with fever and convulsion occurring in children aged between age 2 and 35 months through Britain and Ireland were identified by consultant paediatricians taking part in a survey (October 1998 to September 2001) and notified to the British Paediatric Surveillance Unit. Details about neurologic illnesses were collected by reporting paediatricians by means of a detailed questionnaire. For diagnostic purposes, saliva, blood, and cerebrospinal samples were also collected. Questionnaires were reviewed by study investigators in order to assess whether reported cases corresponded to an analytical case definition taking into account severe illness with fever and convulsion and encephalitis (see column on the right). | Exposure risk period: MMR vaccine type, not reported. Immunisation history of cases was obtained by the Immunisation Department of the Health Protection Agency (other than MMR vaccine, the study also considers DTP, Hib, and MenC vaccines). Only cases with known vaccination history were included in the analysis. | Regarding MMR vaccine, there was no evidence of a raised relative incidence of serious neurologic disease 15 to 35 days after immunisation. | Within 15 to 35 days with concurrent primary HHV‐6 or HHV‐7 infection (a) all (5 cases) (b) no (4 cases) (c) yes (1 case) | rr (95% CI) (a) 1.34 (0.52 to 3.47) (b) 1.52 (0.52 to 4.41) (c) 0.86 (0.10 to 7.23) |
| incidence: cases/PT | ||||||
| Study ID and design | Population | Outcome definition | Exposure MMR/MMRV vaccine | Findings | Crude data | Estimate (95% CI) |
|---|---|---|---|---|---|---|
| bb‐Black 1997 case‐control | Cases n = 59 | Aseptic meningitis Potential cases of aseptic meningitis were identified by computerised hospitalisation at 4 HMOs that participated in the Vaccine Safety Datalink project. They were children aged 12 to 23 months with ICD‐9 discharge diagnoses 045.2, 047.*, 048, 072.1, 321.2 or 322.* between 1984 and 1993. Medical records of potential cases were reviewed and included as cases when corresponding to validation criteria (see column on the right). No evidence of prior underlying meningitis or underlying disease caused by toxoplasmosis, syphilis, cytomegalovirus, neonatal herpes simplex, or HIV. (The same exclusion criteria were used for controls.) In addition, bacterial, mycobacterial, and fungal cultures of the cerebrospinal fluid must have been negative, and the patient must have had a cerebrospinal fluid white blood cell count of >= 10 cells/mm3. | MMR vaccine: Jeryl Lynn mumps strain. Any vaccines includes: Vaccine and time window (a) MMR 0 to 14 days (b) MMR 0 to 30 days (c) MMR 8 to 14 days (d) Any vaccine 0 to 14 days (e) Any vaccine 0 to 30 days (f) Any vaccine 8 to 14 days Vaccination status of both cases and controls was derived from medical record review. | In this analysis of hospitalisation caused by AM, there was no increased risk of AM after MMR vaccine containing Jeryl Lynn strain mumps. | N cases vaccinated/ (a) 1/59 versus 4/118 (b) 3/59 versus 7/118 (c) 1/59 versus 2/118 (d) 2/59 versus 8/118 (e) 7/59 versus 18/118 (f) 2/59 versus 4/118 | OR (95% CI) (a) 0.50 (0.1 to 4.5) (b) 0.84 (0.2 to 3.5) (c) 1.00 (0.1 to 9.2) (d) 0.44 (0.1 to 2.1) (e) 0.75 (0.3 to 1.9) (f) 1.00 (0.2 to 5.6) |
| Case cross‐over | (1) n = 39. Children with aseptic meningitis aged 13 to 29 months of both sexes, vaccination date confirmed by vaccination record. (2) n = 19. Children with aseptic meningitis aged 12 to 15 months of both sexes, vaccination date confirmed by parents only. | Aseptic meningitis Generically defined as syndrome characterised by acute onset of meningeal symptoms, fever, and cerebrospinal fluid pleocytosis, with bacteriologically sterile cultures. Cases of aseptic meningitis were identified from insurance claims and hospitalisation data during 1998 in Korea. Authors considered cases corresponding to diagnosis criteria occurred in children aged 8 to 36 months who had received MMR vaccine within 1 year before disease onset and for whom vaccination records were available. | MMR vaccine: Risk period (42 days) (a) from disease onset date to 42 days after Control period (323 days) (b) from 42 days up to 365 days after disease onset | Study results showed that risk increased in the third week after vaccination and was elevated until the sixth week. | (a) versus(b) (1) 11 versus 28 cases (2) 5 versus 14 cases Sensitivity analysis n = 58, 16 versus 42 cases | RR (95% CI)(*) (1) 3.02 (1.50 to 6.08) Sensitivity analysis 2.93 (1.65 to 5.22) (*)Mantel‐Haenszel Under the null hypothesis, this estimator is directly analogous to the Mantel‐Haenszel OR for matched‐pair case‐control study. |
| Case cross‐over | 67 children, mean age 19.1 months (standard deviation = 5.4 months) | Aseptic meningitis Aseptic meningitis is a syndrome characterised by acute onset of meningeal symptoms, fever, and cerebrospinal fluid pleocytosis with bacteriologically sterile cultures. The following criteria were used to define eligible cases of aseptic meningitis for the study: 1) Korean insurance claim cases based on the ICD‐10 (codes A87.9, G03.0, G03.9, and G02.0); and 2) cerebrospinal fluid pleocytosis (leukocytes ≥ 5) with bacteriologically sterile cultures (if measured); or 3) neck stiffness and/or convulsions, or 2 other symptoms (headache or vomiting) in addition to a fever (≥ 38.0 °C, if measured). Patients’ charts were reviewed and their symptoms, laboratory tests, and last diagnoses on the discharge record checked. If patients were diagnosed with aseptic meningitis and were hospitalised in a general hospital, in accordance with these criteria, those who had headache, fever, and vomiting could be included as participants. | MMR vaccine (1) n = 29 MMR with Urabe or Hoshino mumps strain (2) n = 38 MMR with Jeryl Lynn or Rubini mumps strain Risk period (42 days) (a) from disease onset date to 42 days after Control period (323 days) (b) from 42 days up to 365 days after disease onset | Study results showed that no significant risk was associated with the Jeryl Lynn or Rubini strain of the vaccine. For the Urabe or Hoshino strain, the risk increased in the third week after vaccination and was elevated until the sixth week. | (a) versus(b) (1) 13 versus 16 cases (2) 3 versus 35 cases | RR (95% CI)(*) (1) 5.5 (2.6 to 11.8) (2) 0.6 (0.18 to 1.97) (*)Mantel‐Haenszel Under the null hypothesis, this estimator is directly analogous to the Mantel‐Haenszel OR for matched‐pair case‐control study. |
| Person‐time cohort | Children immunised n = 535,544 n = 120 children (MMR vaccine was administered before the disease), and only 64 between 0 and 24 months after MMR vaccination. | Aseptic meningitis Inflammation of the meninges. Usually a self‐limiting disease of known or suspected viral cause consisting of fever, headache, signs of meningeal irritation, without evidence of brain parenchymal involvement and a lymphocytic and mononuclear pleocytosis of CSF. The term 'meningoencephalitis' does not differentiate cases with prominent involvement of the brain parenchyma from those with meningeal involvement only. Hospitalisation records (ICD‐8 codes: 045.99, 320.88, 320.99) and review of patients' medical records to assess correspondence to case definition. | Exposure risk period: (a) 0 to 3 months after vaccination Control period: (b) 4 to 24 months after vaccination Observation period: (c) 0 to 24 months after vaccination MMR II vaccine (Merck & Co, West Point, PA) Measles: Enders‐Edmonston Mumps: Jeryl Lynn Rubella: Wistar RA 27/3 Vaccination data were assessed through vaccination register. | Not significant excess of hospitalisation within 3 months of vaccination (P = 0.57) The incidence of meningitis of undefined causes in 1‐ to 7‐year‐old children decreased from 10.17 per 100,000 in 1983 to 7.71 per 100,000 in 1985. | (a) 10 cases (3 months) (b) 54 cases (21 months) (c) 64 cases (24 months) | rr (95% CI)(*) 1.30 (0.66 to 2.55) (*)rate ratio amongst |
| Self‐controlled case series ‐‐‐‐‐‐‐‐‐‐‐‐‐ Case‐only ecological method | Children aged 1 to 11 years (from census) n = 452,344 n = 129 children aged 1 to 11 years old admitted to the referral hospital with a diagnosis of aseptic meningitis between 10th and 43rd epidemiologic surveillance weeks of 1997 (March to October). n = 87 fulfilled inclusion criteria; n = 29 cases of AM occurred prior to the mass immunisation campaign; n = 58 after the immunisation campaign. Of the 58 children, n = 50 were know to have been vaccinated. (The date of vaccination was available for 43 of these children.) | Aseptic meningitis Data about meningitis were obtained from the state Epidemiology Surveillance System and from the neurologic service of the state referral hospital for infectious disease (Hospital Couto Maia), by reviewing hospital records of children admitted between the 10th and 43rd epidemiological surveillance weeks. Demographic, clinical, and laboratory data were collected on a standardised form. Inclusion/exclusion criteria 1) Residence in the city of Salvador 2) Age 1 to 11 years 3) Cerebrospinal fluid with a cell count of > 10 and < 1200 cells per mL (higher counts could be attributed to unconfirmed bacterial meningitis) 4) Predominance of lymphocytes in the cerebrospinal fluid of > 50% of the total number of cells 5) Exclusion of any bacteriologic or fungal confirmation through the use of Gram stain, latex, immunoelectrophoresis, stain for Cryptococcus neoformans, Ziehl‐Neelsen stain, or culture for bacteria and Mycobacterium tuberculosis 6) Exclusion of all cases with a history of prior meningitis or any neurologic disorder and any cases with sepsis, pneumonia, otitis, or any other disease that might be associated with an increased cell count in the cerebrospinal fluid | Self‐controlled case series Exposure risk period: (a) 3 to 5 weeks after vaccination (i.e. 15 to 35 days) Control period: (b) 1 to 2 weeks and 6 to 10 weeks after vaccination Observation period: (c) 1 to 10 weeks after vaccination ‐‐‐‐‐‐‐‐‐‐‐‐‐‐‐‐‐‐‐‐‐‐‐‐‐‐‐‐‐ Case‐only ecological method (a) Reference period (pre‐vaccination): 10 to 32 epidemiologic surveillance weeks; (b) Low‐risk period: 34 to 35 epidemiologic surveillance weeks; time interval = 2 weeks (c) High‐risk period: 36 to 39 epidemiologic surveillance weeks (3 to 6 weeks after vaccination day) (d) Low‐risk period: 40 to 43 epidemiologic surveillance weeks; time interval = 3 weeks MMR vaccine Pluserix vaccine (SmithKline Beecham, UK) containing mumps Urabe strain Vaccination began on 16 August 1997 (National Immunisation Day, surveillance week 33), 45% coverage of the target population was achieved on that day, high coverage (exact data not reported, but very close to 100%) during the 2 following weeks. Vaccination history was obtained by vaccination cards or visits/phone call. | An elevated risk of aseptic meningitis was observed 3 weeks after Brazil's national vaccination day compared with the risk in the pre‐vaccination period. This result was confirmed by a case series analysis. | (a) 35 cases (b) 3 and 5 cases (c) 43 cases ‐‐‐‐‐‐‐‐‐‐‐‐‐‐‐‐ Cases/PT (weeks) (a) 29/10,403,912 (b) 3/904,688 (c) 46/1,809,376 (d) 9/1,809,376 | Self‐controlled case series rr (95% CI)(*) 30.4 (11.5 to 80.8) (*)Poisson regression ‐‐‐‐‐‐‐‐‐‐‐‐‐‐‐‐‐‐‐‐‐ Case‐only ecological method rr (95% CI)(**) (a) reference weeks (b) 1.19 (0.36 to 3.91) (**)rate ratio amongst and control period (a). |
| Case‐only ecological method | Children aged 1 to 11 years State of (MS) n = 580,587 State of Mato Grosso (MT) n = 473,718 | Aseptic meningitis Data on cases of meningitis were obtained from the routine surveillance system in both states. Notification of meningitis is statutory in Brazil, with a standardised form completed for each case. The attending physician or nurse completes the notification form in the health facility where the diagnosis is made. The notification form includes data on patient’s identification, clinical diagnosis, evolution, treatment, results of vaccination status, and laboratory investigations (the last 2 items not always reported). Reported cases of meningitis were classified into aseptic or not based on information from the notification forms, using 2 different criteria, which are independent but non‐exclusive. In both criteria, AM included only cases with absence of a positive bacteriological isolate in culture or stain of CSF and did not have a positive blood culture or mention of other non‐viral aetiology. Criterion 1: If the diagnosis in the form was of viral aetiology or unknown aetiology, cases were classified as AM. They were classified as not having AM if they had a suspected or confirmed diagnosis of meningitis by a known (non‐viral) agent through any laboratory or clinical finding. Criterion 2 (laboratory): Cases were considered AM if they had a CSF with the following findings: cell count greater than 10 and less than 1500 and presence of lymphocytes greater that 49%. (Applied for the cases in which laboratory data were present in the notification forms. In their absence, cases were excluded.) | (MS) Unexposed period (a) reference weeks 1 to 31 (MS) Exposed period (b) low‐risk weeks 32 to 34 (c) high‐risk weeks 35 to 37 (d) low‐risk weeks 38 to 42 (e) all weeks 32 to 42 ‐‐‐‐‐‐‐‐‐‐‐‐‐‐‐‐‐‐‐‐‐‐‐‐‐‐‐‐‐‐‐‐‐‐‐‐‐ (MT) Unexposed period (a) reference weeks 1 to 37 (MT) Exposed period (b) low‐risk weeks 38 to 40 (c) high‐risk weeks 41 to 43 (d) low‐risk weeks 44 to 48 (e) all weeks 38 to 48 ‐‐‐‐‐‐‐‐‐‐‐‐‐‐‐‐‐‐‐‐‐‐‐‐‐‐‐‐‐‐‐‐‐‐‐‐‐ MMR vaccine: Serum Institute of India, Ltd, Pune. Contained Leningrad‐Zagreb mumps strain. 3 different lots were used in each state (MS and MT). Vaccination began in mid‐August 1998 (week 32) in MS and late September in MT (week 38), and lasted for about 1 month, even if the most part of the doses had been administered during the first 2 campaign weeks. Vaccination was reported for 69.4% and 93.5% of the target population in MT and in MS, respectively. | This study shows an increase in number of notified cases of AM in the 2 states studied, 3 to 4 weeks after the MIC using Leningrad‐Zagreb mumps strain MMR vaccine (3 to 4 weeks after the MIC corresponding to incubation period for wild mumps infection, and the increase was restricted to the age group targeted by the campaign and to the aseptic form of meningitis). The use of the vaccine on a large scale over a short period of time made it possible to identify an increase in risk which may be present, but more difficult to measure when vaccination is spread over longer periods. The risk estimates varied depending on the diagnostic criteria used and the state. There was also an increase in the incidence of notified mumps after the campaign in the state where data were available. | cases/PT (weeks) (MS) AM criterion 1 (a) 22/14,685,258 (b) 7/1,421,154 (c) 35/1,421,154 (d) 6/2,368,590 (e) 48/5,210,898 ‐‐‐‐‐‐‐‐‐‐‐‐‐‐‐‐‐‐‐‐‐‐‐‐‐‐‐‐‐ (MT) AM criterion 1 (a) 71/21,481,719 (b) 7/1,741,761 (c) 71/1,741,761 (d) 25/2,902,935 (e) 103/6,386,457 ‐‐‐‐‐‐‐‐‐‐‐‐‐‐‐‐‐‐‐‐‐‐‐‐‐‐‐‐‐ (MS) AM criterion 2 (a) 8/14,685,258 (b) 4/1,421,154 (c) 24/1,421,154 (d) 2/2,368,590 (e) 30/ 5,210,898 ‐‐‐‐‐‐‐‐‐‐‐‐‐‐‐‐‐‐‐‐‐‐‐‐‐‐‐‐‐ (MT) AM criterion 2 (a) 36/21,481,719 (b) 3/1,741,761 (c) 54/1,741,761 (d) 15/2,902,935 (e) 72/6,386,457 | rr (95% CI)* (MS) AM criterion 1 (a) reference weeks (b) 3.3 (1.41 to 7.7) (c) 16.4 (9.65 to 28.0) (d) 1.7 (0.69 to 4.2) (e) 6.2 (3.71 to 10.2) ‐‐‐‐‐‐‐‐‐‐‐‐‐‐‐‐‐‐‐‐‐‐‐‐‐‐‐‐‐ (MT) AM criterion 1 (a) reference weeks (b) 1.2 (0.56 to 2.6) (c) 12.3 (8.88 to 17.1) (d) 2.6 (1.65 to 4.1) (e) 4.9 (3.61 to 6.6) ‐‐‐‐‐‐‐‐‐‐‐‐‐‐‐‐‐‐‐‐‐‐‐‐‐‐‐‐‐ (MS) AM criterion 2 (a) reference weeks (b) 5.2 (1.56 to 17.2) (c) 31.0 (13.93 to 69.0) (d) 1.6 (0.33 to 7.3) (e) 10.6 (4.84 to 23.1) ‐‐‐‐‐‐‐‐‐‐‐‐‐‐‐‐‐‐‐‐‐‐‐‐‐‐‐‐‐ (MT) AM criterion 2 (a) reference weeks (b) 1.0 (0.32 to 3.3) (c) 18.5 (12.13 to 28.2) (d) 3.1 (1.69 to 5.6) (e) 6.7 (4.51 to 10.0) (*)rate ratio amongst and unexposed period (a) |
| Case‐only ecological method | Children aged 1 to 11 years target population n = 110,629 (Rio Grande do Sul) dose | Aseptic meningitis Mumps‐associated AM was defined as: that occurring in conjunction with or following clinically diagnosed mumps. Vaccine‐associated AM was defined as: aseptic meningitis with a pleocytosis of 10 to 1500 leukocytes/mL and occurring within 15 to 35 days after vaccine receipt. | MMR vaccine: produced by Serum Institute of India, Lot: 180‐X: measles: Edmonston‐Zagreb; mumps: Leningrad‐Zagreb; rubella: Wistar RA 27/3. The campaign was conducted between weeks 37 to 48. (a) unexposed period in 1995/1996 39 to 47 weeks (b) unexposed period in 1997 1 to 38 weeks (c) exposed period in 1997: High risk: 39 to 47 weeks (d) exposed period in 1997: Low risk: 48 to 53 weeks | A total of 105,098 doses of Leningrad‐Zagreb were administered to children The risk of vaccine‐associated These findings suggest that Leningrad‐Zagreb is more reactogenic than Urabe and Jeryl‐Lynn strains. | (a) 2.4 cases per 100,000 person weeks; 4.5 cases in average (b) 10 cases (any cause) (c) 28.7 per 100,000 person weeks (d) 4 cases (any cause) | rr (95% CI) (c) 12.2 (6.0 to 24.7)(*) (*)rate ratio (c) and (a) |
| Self‐controlled case series | Children aged 12 to 24 months discharged from hospital in 5 districts in England (Ashford, Leicester, Nottingham, Preston, and Chorley & Ribble) for varying periods between October 1988 and February 1993. Readmissions within 72 h with the same diagnosis were counted as 1 episode. n = 952 children | Aseptic meningitis Children discharged from hospital with a diagnosis of: meningitis categorised as mumps, aseptic, or viral (ICD 072.1, 047., 321.) Children aged between 366 and 730 days. | MMR vaccine: Urabe mumps strain Jeryl Lynn mumps strain Rubella strain not specified. Exposure risk period: (a1) 6 to 11 days (1 to 2 weeks after vaccination) (a2) 15 to 35 days (3 to 5 weeks after vaccination) (Urabe strain) Control period: (b) for each vaccine was defined as the time not included in a risk period. The analyses were adjusted for age and were grouped in 6 equal intervals of about 2 months. | The study shows that there is a true risk of a neurological event attributable to the Urabe strain. | Urabe strain (a1) 0 cases (a2) 5 cases | rr (95% CI) (a2) 38.1 (4.3 to 336)(*) (*)Poisson regression |
| Self‐controlled case series | Children aged 12 to 23 months with discharge diagnosis of febrile convulsion or aseptic meningitis | Aseptic menigitis: Viral meningitis (A87), mumps (B26), meningitis in other infections classified elsewhere (G02), and meningitis due to other and unspecified causes (G03) were identified for the period 1 May 1998 to 30 June 2001, and case notes were reviewed by a paediatrician. In addition, computerised hospital records for children aged 12 to 23 months with an ICD‐9 discharge diagnosis of meningitis categorised as mumps, aseptic, or viral (072.1, 047, 321) were identified for the period 1 January 1991 to 30 September 1992, prior to the withdrawal of Urabe‐containing MMR vaccines, and were linked with MMR vaccination histories. | MMR vaccine: (1) MMR with Urabe mumps strain up to September 1992 (2) MMRII (Sanofi Pasteur) Edmonston‐Enders measles strain, Jeryl Lynn mumps strain, between September 1992 and May 1998 (3) MMR Priorix (GlaxoSmithKline) Schwarz measles strain RIT4385 (Jeryl Lynn) from May 1998 Exposure risk period: (a) 15 to 35 days after vaccination (from May 1998 to June 2001) (Urabe MMR) (b) 15 to 35 days after vaccination (from January 1991 to September 1992) (Jeryl Lynn MMR) MMR vaccination histories were independently obtained through linkage with computerised immunisation records in the 2 Thames regions, using either the National Health Service number or sex, date of birth, and post code, a highly specific linking algorithm. Information on batch number was sought for any confirmed aseptic meningitis cases with onset 15 to 35 days after MMR vaccination. The formatting of batch numbers differs substantially between manufacturers in length and alphanumeric coding and is a precise means of distinguishing between vaccines from different manufacturers. | Before after between 2 risk periods, re‐analysis of the data presented in db‐Farrington 1995 This study confirms that the risk of aseptic meningitis with Priorix vaccine, if it exists at all, is significantly lower than with Urabe‐containing mumps vaccine. The study allowed the exclusion of risks as rare as 1 in 437,000 for laboratory‐confirmed mumps meningitis with non‐Urabe‐containing | Comparison between 2 risk periods Aseptic meningitis (a) 4 cases (b) 0 cases ‐‐‐‐‐‐‐‐‐‐‐‐‐‐‐‐‐‐‐‐‐‐‐‐ Laboratory‐confirmed mumps‐positive cerebrospinal fluid (a) 16 cases (b) 0 cases Data from the paper | rr(95%CI) 25.9 (2.8 to 233)(*) (*) rate ratio (a) versus (b) |
| Self‐controlled case series | For this study, WHO selected 26 sentinel sites (49 hospitals) distributed in 16 countries of the 6 WHO regions. The study population included children ages 9 to 23 months admitted to a network‐participating hospital during January 2010 to March 2014, with a discharge diagnosis of either AM or immune thrombocytopenic purpura. | Aseptic meningitis probable cases ICD‐9 codes in first discharge diagnosis position: 047 (047.0 to 047.9) Meningitis due to enterovirus 049.0 to 049.1 Other non‐arthropod‐borne viral meningitis 072.1 Mumps meningitis 321.2 Meningitis due to viruses not elsewhere classified 322.0, 322.1, 322.9 Meningitis of unspecified cause ICD‐10 codes in first discharge diagnosis position: A87.0 Meningitis due to enterovirus A87.1 Adenoviral meningitis A87.2 Lymphocytic choriomeningitis A87.8 Other viral meningitis A87.9 Viral meningitis, unspecified B26.1 Mumps meningitis G02.0 Meningitis due to viruses not elsewhere classified G03.0, G03.8, G03.9 Meningitis of unspecified cause | Vaccine(measles strain) (mumps strain) Priorix, GSK (Schwarz) (RIT 4385a) (Schwarz) (Urabe AM9) Risk period 8 to 35 days Washout periods 1 to 7 days 36 to 42 days Control period 43 to 84 days | The elevated risk estimates found for the Leningrad‐Zagreb mumps strain are consistent with previous studies (gb‐da Cunha 2002; gb‐da Silveira 2002). Regarding Jeryl‐Lynn‐derived strain vaccines, although the study did not have enough power to confirm the absence of risk for these strains, the finding of zero cases in the risk window was consistent with the hypothesis of no association (bb‐Black 1997; db‐Makela 2002). | In 16 countries n = 84 confirmed aseptic menigitis cases (Risk versuscontrol) period (a) Overall risk of AM following mumps‐containing vaccines (35 versus 5) (b) Overall risk of AM following mumps‐containing vaccines (excluding cases from Iran) (22 versus 3) (c) Leningrad‐Zagreb strain (7 versus 1) (d) Vaccines products used Hoshino/Leningrad‐Zagreb/Urabe AM9 (27 versus 2) (e) Vaccines products used Hoshino/Leningrad‐Zagreb/Urabe AM9 (excluded cases from Iran) (14 versus 0) | rr (95% CI) adjusted (a) 10.8 (4.0 to 29.2) (b) 12.4 (3.1 to 49.1) (c) 6.4 (1.3 to 87.4) rr (95% CI) unadjusted (d) 20.3 (48 to 85.2) (e) not estimable |
| AM: aseptic meningitis | ||||||
| Study ID and design | Population | Outcome definition | Exposure | Authors' conclusion | Crude data | Estimate (95% CI) |
|---|---|---|---|---|---|---|
| Retrospective and prospective cohort | Children born in Denmark from 1 January 1991 to 31 December 1998 aged 3 months to 5 years n = 537,171 | Information on febrile seizures and epilepsy was obtained from the National Hospital Register (NHR), which contains information on all patients discharged from Danish hospitals since 1977 (since 1995 information on outpatients (visits to emergency department and hospital clinics)). Diagnostic information was classified according to the Danish version of the ICD as follows: ICD‐8 was used from 1977 to 1993, and ICD‐10 was used from 1994 to the end of 1999. Febrile seizure: (a) within 2 weeks after vaccination (a1) 1 weeks after vaccination (a2) 2 weeks after vaccination ICD‐8 code 780.21 or ICD‐10 code R56.0, were aged between 3 and 60 months at the time of discharge, and had no recorded history of non‐febrile seizures, cerebral palsy, severe head traumas, intracranial tumours, meningitis, or encephalitis. The febrile seizures could not be classified as simple or complex because the NHR contains no information on number of febrile seizures occurring within the febrile episode, duration of the febrile seizures, and type of febrile seizures (generalised or focal onset). (b) Recurrent febrile seizure (b1) within 2 weeks after vaccination (b2) > 2 weeks after vaccination (c) Epilepsy subsequent to a first febrile seizure episode Children were categorised with epilepsy if they had ICD‐8 code 345 or ICD‐10 code G40. (c1) within 2 weeks after vaccination (c2) > 2 weeks after vaccination | Vaccination status of the children was ascertained by using data of the National Board of Health to which vaccination data were transmitted by general practitioners. MMR vaccine: Moraten measles, Jeryl Lynn mumps, Wistar RA 27/3 rubella The national vaccination program recommended during the entire study period that children should be vaccinated twice, at 15 months and at 12 years. Only the first vaccination is relevant to the endpoint under study. | MMR vaccination was associated with a transient increased rate of febrile seizures, but the risk difference was small even in high‐risk children. The long‐term rate of epilepsy was not increased in children who had febrile seizures following vaccination compared with children who had febrile seizures of a different aetiology. Febrile seizure: no statistically significant difference in the RR of febrile seizures in the 2 weeks following vaccination between subgroups of children characterised by family history of seizures, sex, birth order, gestational age at birth, birthweight, or socioeconomic factors, compared with non‐vaccinated children within the subgroup under study. The highest rate ratio (2 weeks following vaccination) was found amongst (a1)siblings of children with a history of epilepsy compared with rate of febrile seizures following vaccination in siblings of children with no history of epilepsy. Recurrent febrile seizures and epilepsy The authors found that children who experienced febrile seizures within 2 weeks of MMR vaccination had a 19% increased rate of recurrent febrile seizures but no increased rate of epilepsy during up to 105 months of follow‐up. The reference group consisted of children who had not been vaccinated when having their first febrile seizure. | Cases/PT (years) vaccinated (a) 7445/1,151,661 versus unvaccinated 10,541/793,568 vaccinated (b1) 236/2212 (b2) 981/12,675 versus unvaccinated 2753/23,560 vaccinated (c1) 9/3825 (c2) 95/21,938 versus unvaccinated 251/41,310 | rr (95% CI)* (a) 2.75 (2.55 to 2.97) (a1) 2.46 (2.22 to 2.73) (a2) 3.17 (2.89 to 3.49) amongst children with a personal history of febrile seizure (a1) 2.75 (2.32 to 3.26) (b1) 1.19 (1.01 to 1.41) (b2) 1.10 (0.96 to 1.26) (c1) 0.70 (0.33 to 1.50) (c2) 0.92 (0.59 to 1.43) (*) Poisson regression adjusted for age, calendar period, age of first febrile seizure, and current vaccination status |
| Retrospective cohort study | Data are collected from 4 HMOs. Children (n = 716) with a confirmed seizure during the study period: from 1 March 1993 to 30 September 1993. n = 679,942 children n = 340,386 vaccinated DTP n = 202,099 (unvaccinated) | Seizures were identified through the automated data systems of each HMO, on the basis of visits classified according to the ICD‐9‐CM, as code 333.2 (myoclonus), code 345 (epilepsy), code 779.0 (convulsions in a newborn), or code 780.3 (convulsions). Simple febrile seizures were defined as short, generalised seizures, accompanied by documented fever or a parental report of fever. Complex febrile seizures were defined as febrile seizures that occurred more than once in 24 hours and either lasted for at least 12 minutes or were accompanied by focal signs. | MMR vaccine Exposure period (after vaccination): (a1) 1 to 7 days (a2) 8 to 14 days (a3) 15 to 30 days Control period | The study found significantly elevated risks of febrile seizures from 8 to 14 days after the administration of MMR vaccine. The authors did not find a significantly elevated risk of febrile seizures at any other time after vaccination, nor did they find an elevated risk of non‐febrile seizures at any time after vaccination with MMR vaccine. This risk translates into approximately 25 to 34 additional | n = 521 febrile seizures in the absence of vaccination Febrile seizures (a1) 8 cases (a2) 13 cases (a3) 11 cases Non‐febrile seizures (a1) 1 case (a2) 1 case (a3) 1 case | rr (95% CI)(*) Febrile seizures (a1) 1.73 (0.72 to 4.15) (a2) 2.83 (1.44 to 5.55) (a3) 0.97 (0.49 to 1.95) Non‐febrile seizures (a1) not reported (a2) 1.11 (0.11 to 11.28) (a3) 0.48 (0.05 to 4.64) (*) Cox proportional hazard regression multivariate model estimates adjusted for age, sex, HMO, calendar time, and receipt of DTP vaccine. |
| Self‐controlled case series | Children aged 2 to 35 months (immunised with MMR; NK) with outcome of interest diagnosed between October 1998 and September 2001 (n = 107) | Case definition of serious neurologic disease: any child 2 to 35 months old with a severe illness with fever and convulsions and/or encephalitis (see Table 12) was included. Severe illness with fever and convulsions
Exclude: Viral (aseptic) meningitis without encephalopathy The following confirmed causes were excluded: hypoxic/ischaemic; vascular; toxic; metabolic, neoplastic, traumatic, and pyogenic infections; uncomplicated convulsions; or a series of convulsions lasting 30 min in immunocompromised children. | Exposure risk period: MMR vaccine type, not reported Immunisation history of cases was obtained by the Immunisation Department of the Health Protection Agency (other than MMR vaccine the study also considers DTP, Hib, and MenC vaccines). Only cases with known vaccination history were included in the analysis. | 6 to 11 days after measles, mumps, rubella vaccine there is an increased risk of fever and convulsions lasting 30 minutes. All 6 of the episodes temporally related to immunisation met the criteria for complex febrile convulsions. | Within 6 to 11 days With concurrent primary HHV‐6 or HHV‐7 infection (a) all (6 cases) (b) no (4 cases) (c) yes (2 cases) | rr (95% CI) (a) 5.68 (2.31 to 13.97) (b) 5.80 (1.98 to 16.99) (c) 5.55 (1.12 to 27.63) |
| Self‐controlled case series | Children aged 12 to 24 months discharged from hospital in 5 districts in England (Ashford, Leicester, Nottingham, Preston, and Chorley & Ribble) for varying periods between October 1988 and February 1993. Readmissions within 72 h with the same diagnosis were counted as 1 episode. n = 952 children | Febrile convulsion ICD code 780.3 children aged 29 to 730 days | MMR vaccine: Urabe mumps strain Jeryl Lynn mumps strain Rubella strain not specified Exposure risk period: (a1) 6 to 11 days (1 to 2 weeks after vaccination) (a2) 15 to 35 days (3 to 5 weeks after vaccination) Control period: (b) for each vaccine was defined as the time not included in a risk period The analyses were adjusted for age and were grouped in 6 equal intervals of about 2 months. | The study shows that there was an attributable risk of 1 in 2600 doses of a febrile convulsion 15 to 35 days after giving Urabe MMR vaccine. There was no excess of admissions in the same period when Jeryl Lynn vaccine was given. | Any strain (a1) 49 cases (a2) 85 cases ‐‐‐‐‐‐‐‐‐‐‐‐‐‐‐‐‐‐ Urabe strain (a1) 0 cases (a2) 57 cases ‐‐‐‐‐‐‐‐‐‐‐‐‐‐‐‐‐‐‐ Jeryl Lynn strain (a1) 0 cases (a2) 9 cases | rr (95% CI)(*) Any strain (a1) 3.04 (2.27 to 4.07) (a2) 1.51 (1.21 to 1.90) ‐‐‐‐‐‐‐‐‐‐‐‐‐‐‐‐‐‐‐‐‐‐‐‐‐‐ Urabe strain (a1) 3.77 (1.95 to 7.30) (a2) 1.66 (1.26 to 2.20) ‐‐‐‐‐‐‐‐‐‐‐‐‐‐‐‐‐‐‐‐‐‐‐‐‐‐ Jeryl Lynn strain (a1) 2.70 (1.81 to 4.01) (a2) 1.04 (0.56 to 1.93) (*) Poisson regression |
| Self‐controlled case series | Children aged 12 to 23 months with discharge diagnosis corresponding to the outcome of interest who received MMR n = 894 | Febrile convulsion convulsion or fit, not otherwise specified, who were admitted between 1 January 1998 and 30 June 2002 were identified and linked with computerised immunisation records to obtain dates of MMR vaccination. Episodes within a same individual were considered as separate when they occurred at least 10 days apart. Case review not performed. ‐‐‐‐‐‐‐‐‐‐‐‐‐‐‐‐‐‐‐‐‐‐‐‐‐‐‐‐‐‐‐‐‐‐‐‐‐‐‐‐‐‐‐‐‐‐ Febrile convulsion ICD‐10 codes R560 only | MMR vaccine: (1) MMRII (Sanofi Pasteur) Edmonston‐Enders measles strain, Jeryl Lynn mumps strain, between September 1992 and May 1998 (2) MMR Priorix (GlaxoSmithKline) Schwarz measles strain RIT4385 (Jeryl Lynn) from May 1998 (3) unknown manufacturer Exposure risk period: (a1) a pre‐vaccination (a2) 6 to 11 days (1 to 2 weeks after vaccination) (a3) 15 to 35 days (3 to 5 weeks after vaccination) . Control period | The attributable risk of hospital admission for convulsion following receipt of any MMR vaccine was estimated as 1 in 1150 doses for the 6‐ to 11‐day postvaccination period, based on an estimated relative incidence of 4.09. The excess risk of convulsion in this period was attributable to the measles component of MMR vaccine. The relative incidence of convulsion in the 6‐ to 11‐day period was higher for Priorix than for MMRII, although the difference was not significant. There was no statistically significant evidence that children given MCC vaccine at the same time as MMR vaccine have a somewhat higher risk of convulsion in the 6‐ to 11‐day postvaccination period (rr 7.74, 3.82 to 15.71) than children who receive MMR but not MCC vaccine at the same time (rr 3.81, 2.87 to 5.05). Conclusion: there is no evidence to suggest that the new MMR vaccine used in the UK since mid‐1998 and derived from the Jeryl Lynn‐containing MMR vaccine causes aseptic meningitis attributable to its mumps component. | Any MMR vaccine (a1) 13 cases (a2) 66 cases (a3) 65 cases ‐‐‐‐‐‐‐‐‐‐‐‐‐‐‐‐‐‐‐‐ MMRII vaccine Jeryl Lynn (a1) 6 cases (a2) 27 cases (a3) 34 cases ‐‐‐‐‐‐‐‐‐‐‐‐‐‐‐‐‐‐‐‐ MMR Priorix vaccine RIT4385 (a1) 3 cases (a2) 19 cases (a3) 16 cases ‐‐‐‐‐‐‐‐‐‐‐‐‐‐‐‐‐‐‐‐ Unknown manufacturer (a1) 4 cases (a2) 20 cases (a3) 15 cases ‐‐‐‐‐‐‐‐‐‐‐‐‐‐‐‐‐‐‐‐ Febrile convulsion (R560 only) (a1) not reported (a2) 52 cases (a3) 57 cases | rr (95% CI)(*) Any MMR vaccine (a1) 0.38 (0.22 to 0.64) (a2) 4.09 (3.14 to 5.33) (a3) 1.13 (0.87 to 1.48) ‐‐‐‐‐‐‐‐‐‐‐‐‐‐‐‐‐‐‐‐ MMRII vaccine Jeryl Lynn (a1) 0.39 (0.18 to 0.84) (a2) 3.64 (2.44 to 5.44) (a3) 1.28 (0.89 to 1.84) ‐‐‐‐‐‐‐‐‐‐‐‐‐‐‐‐‐‐‐‐ MMR Priorix vaccine RIT4385 (a1) 0.47 (0.15 to 1.40) (a2) 6.26 (3.85 to 10.18) (a3) 1.48 (0.88 to 2.50) ‐‐‐‐‐‐‐‐‐‐‐‐‐‐‐‐‐‐‐‐ Unknown manufacturer (a1) 0.32 (0.13 to 0.81) (a2) 3.53 (2.23 to 5.61) (a3) 0.75 (0.44 to 1.26) ‐‐‐‐‐‐‐‐‐‐‐‐‐‐‐‐‐‐‐‐‐‐ Febrile convulsion (R560 only) (a1) not reported (a2) 4.27 (3.17 to 5.76) (a3) 1.33 (1.00 to 1.77) (*) Poisson regression exposure risk period versus control period |
| Person‐time cohort | Children (n = 556,864) were eligible if they had received their first dose of measles‐containing vaccine at age 12 through 23 months from January 2003 through September 2015. Children were excluded if they had a history of seizure or conditions strongly related to seizure prior to 12 months of age. Children born before 37 weeks gestational age were classified as preterm (< 37 weeks) and children born 37 weeks gestational age as full term (≥ 37 weeks). Preterm children were further classified into those born early preterm (< 35 weeks) and late preterm(35 through 36 weeks) gestational age. n = 24,489 were excluded because of documented history of seizures before age 12 months. In analysis n = 532,375 | Seizure (febrile/afebrile) A seizure was defined as the first emergency department or inpatient hospital encounter with ICD‐9‐CM diagnostic code of 780.3 (convulsions) during the 42 days following vaccination. | MMR and MMRV vaccines Risk interval 7 to 10 days after vaccination Control interval 15 to 42 days after vaccination n = number of children (a) Overall (a1) < 37 weeks n = 45,343 (a2) < 35 weeks n = 16,596 (a3) 35 to 36 weeks n = 28,757 (a4) ≥ 37 weeks n = 487,032 (b) MMR (b1) < 37 weeks n = 37,262 (b2) ≥ 37 weeks n = 403,238 (c) MMRV (c1) < 37 weeks n = 8081 (c2) ≥ 37 weeks n = 83,794 Age at vaccination (d) 12 to 15 months (d1) < 37 weeks n = 41,391 (d2) ≥ 37 weeks n = 442,919 (e) 16 to 23 months (e1) < 37 weeks n = 3952 (e2) ≥ 37 weeks n = 4413 | Conclusion: the results support the current ACIP recommendations | Risk versus control interval (a) Overall (a1) 31/500 versus 56/3500 (b) MMR (b1) 22/407 versus 48/2824 (c) MMRV (c1) 9/90 versus 8/615 Age at vaccination (d) 12 to 15 months (d1) 27/450 versus 51/3188 (e) 16 to 23 months (e1) 4/43 versus 5/294 | rr (95% CI)(*) (a) Overall (a1) 3.9 (2.5 to 6.0) (b) MMR (b1) 3.2 (1.9 to 5.3) (c) MMRV (c1) 7.9 (3.0 to 20) Age at vaccination (d) 12 to 15 months (d1) 3.7 (2.3 to 5.9) (e) 16 to 23 months (e1) 5.6 (1.5 to 21) (*) Poisson regression risk interval versus control interval |
| db‐Macartney 2017 | Children aged 11 to 23 months. Analysis was further restricted to include only children who had (1) 1 dose of MMR vaccine followed by 1 dose of MMRV vaccine at least 27 days later (consistent with NIP recommendations), (2) 1 dose of MMR vaccine (as some had not yet received MMRV vaccine), or (3) no MMR or MMRV vaccine (unvaccinated children, who contribute to the age‐specific relative incidence). Children who received MMRV vaccine as their first MCV were excluded because this schedule was not consistent with NIP recommendations and occurred rarely. | Febrile seizures in all children younger than 5 years. Periodic review of all ICD‐10‐Australian Modification coded R56.0 was also conducted to capture additional cases. Clinical and demographic data were collected from the medical records and caregiver interviews, and all FS diagnoses were confirmed. The primary analysis included children who had both first (considered unique episodes), in separated by at least 7 days from 2 sensitivity analyses were conducted: finer intervals (1‐month age groups); (2) restriction of the analysis to first FS episodes. | MMRV Priorix‐Tetra MMR+V Risk period after vaccination (a) 5 to 12 days (b) 13 to 30 days Control period before vaccination excluding interval −13 to −1 days before | Authors' conclusions: "To our knowledge, this is the first study to provide evidence of the absence of an association between use of MMRV vaccine as the second dose of MCV in toddlers and an increased risk of FSs. Incorporation of MMRV vaccine has facilitated improvements in vaccine coverage that will potentially improve disease control." | (1) Primary analysis: children who had both first and subsequent episodes (2) Adjustment for age using 1‐month interval (3) Restriction of the first FS episode | rr (95% CI)(*) (1) MMR (a) 2.71 (1.71 to 4.29) (b) 0.89 (0.54 to 1.48) (1) MMRV (a) 1.08 (0.55 to 2.13) (b) 1.08 (0.67 to 1.74) (2) MMR (a) 2.57 (1.56 to 4.43) (b) 0.83 (0.49 to 1.40) (2) MMRV (a) 1.17 (0.57 to 2.40) (b) 1.10 (0.66 to 1.83) (3) MMR (a) 2.85 (1.78 to 4.56) (b) 0.82 (0.47 to 1.43) (3) MMRV (a) 1.06 (0.49 to 2.27) (b) 1.21 (0.73 to 2.01) (*) Poisson regression |
| db‐MacDonald 2014 | Children aged 12 to 23 months who had received either MMRV or n = 277,774 | Seizure events ascertained from 3 administrative databases: 1) the physician claims database; system, which includes emergency department visits; 3) the hospital discharge abstracts database. From the physician claims database (ICD‐9), codes 780.3* for convulsions and the ambulatory care and hospital discharge databases (ICD, 10th revision, Canadian version, codes R56.0* for febrile with other High risk (cohort) Children with a personal history of febrile seizure; seizure disorder; central nervous system injury, infection, or neoplasm; encephalopathy; or a progressive, condition (as identified from physician claims, emergency department visits, or hospital discharges) | MMRV vaccine (Priorix‐Tetra) administered to children in Alberta, relative to same‐day administration of separate MMR and varicella Risk period (after vaccination) (a) 0 to 42 days Control period (before vaccination) 42 days preceding vaccination | Conclusion: single vaccine decreases pain for children and distress for parents, thus addressing common barriers to vaccine uptake, and may improve vaccine coverage levels and decrease immunisation delivery costs. These potential benefits must be balanced Febrile seizures are typically self‐limiting and rarely have long‐term effects, but they can be extremely distressing for parents, may precipitate acute care visits, and may undermine confidence in immunisation programmes. It is a matter for debate versus combination vaccine is a policy decision or a choice for parents to make in consultation with their vaccination provider. If MMRV continues to be offered for advisable to counsel parents regarding antipyretic use if children experience a fever within the peak risk period. | Full cohort n = 277,774 MMRV n = 96,686 (a1) 0 to 41 days (b1) 7 to 10 days MMR+V n = 181,088 (a2) 0 to 41 days (b2) 7 to 10 days Low risk n = 266,768 MMRV n = 92,570 (b3) 7 to 10 days MMR+V n = 174,198 (b4) 7 to 10 days High risk n = 11,006 MMRV n = 4116 (b5) 7 to 10 days MMR+V n = 6890 (b5) 7 to 10 days | rr (95% CI)(*) MMRV (full‐cohort) (a1) 1.80 (1.43 to 2.27) (b1) 6.57 (4.77 to 9.05) MMR+V (full‐cohort) (a2) 1.48 (1.22 to 1.79) (b2) 3.30 (2.40 to 4.52) MMRV (low risk) (b3) 6.69 (4.90 to 9.13) MMR+V (low risk) (b4) 2.94 (2.13 to 4.07) MMRV (high risk) (b5) 4.68 (2.49 to 8.79) MMR+V (high risk) (b6) 3.61 (2.20 to 5.93) (*) Poisson regression |
| ACIP: Advisory Committee on Immunization Practice | ||||||
| Study ID and design | Population | Outcome definition | Exposure | Authors' conclusion | Crude data | Estimate (95% CI) |
|---|---|---|---|---|---|---|
| Retrospective | Index cohort all children ages 12 to 60 months vaccinated with MMRV at KPSC from February 2006 to June 2007. Children were excluded if they had a history of measles, mumps, rubella, or varicella disease or history of these diseases. Comparison (matched) cohorts (1) children vaccinated with MMR+V concomitantly before the routine use of MMRV at KPSC (November 2003 to January 2006). Children were optimally matched without replacement to children vaccinated with MMRV, on the basis of age, sex, and vaccination calendar day and month, and had to fulfil the same enrolment criteria. self‐comparison period defined by the period from 60 to 30 days prior to vaccination with MMRV. (3) postvaccination self‐comparison period defined by the period from 60 to 90 days following vaccination. | Febrile convulsion Potential convulsions were identified as occurring on any visit with 333.2 (myoclonus), 780.39 (other convulsion), 780.3 (convulsion), 780.32 (complex febrile convulsion) outpatient, emergency | MMRV: ProQuad contains components of 2 Merck vaccines, MMR‐II (MMR) and VARIVAX (V), and was approved in the USA in September 2005. Before MMRV was available, MMR and V were usually given concomitantly as 2 separate injections. Risk interval (a) 0 to 4 days (b) 5 to 12 days (c) 13 to 30 days (d) 0 to 30 days | Conclusion: "These data suggest that the risk of febrile convulsion is increased in days 5–12 following vaccination with MMRV as compared to MMR+V given separately during the same visit, when post‐vaccination fever and rash are also increased in clinical trials. While there was no evidence of an increase in the overall month following vaccination, the elevated risk during this time period should be communicated and needs to be balanced with the potential benefit of a combined vaccine." | Cases versus cases MMRV versusMMR+V (a) 9 versus 7 matched n = 31,298 matched n = 31,298 | RR (95% CI) MMRV versusPre‐Vacc |
| Retrospective | Index cohort Children aged 12 to 23 months who were members of the 7 participating versusD sites and had received their first dose of MMRV (n = 83,107) Comparison cohorts (1) children vaccinated with January 2000 and October 2008 (n = 376,354) (2) children vaccinated with (2000 to 2008) | Seizureevent The first instance during the 42 days after MMRV vaccination with ICD‐9 codes 345* (epilepsy) or 780.3* visits were examined by using ICD‐9 code | MMRV (Merck & Co Inc, West Point, PA) Risk interval after vaccination (a) 7 to 10 days (b) 0 to 42 days (c) 0 to 30 days | Conclusion: who had received their first dose of measles‐containing vaccine, fever and seizure were elevated 7 Vaccination with MMRV results in 1 additional doses given instead of separate Providers who recommend MMRV should increases the risk of fever and seizure | Seizures cases from MMRV n = 83,107 (a) 77 cases (b) 189 cases (c) not reported MMR+V n = 376,354 (a) 174 (b) 598 (c) not reported MMR n = 145,302 (a) 42 (b) 151 (c) not reported | rr (95% CI)(*) MMRV versusMMR+V (a) 1.98 (1.43 to 2.73) (b) 1.42 (1.11 to 1.81) (c) 1.40 (1.06 to 1.85) (*) Poisson regression due to rarity of the event rr (rate ratio) is very close to RR RR (95% CI) MMRV versusMMR (a) 3.21 (2.2 to 4.67) |
| cb‐Klein 2012 linked to | Children who were participating versusD January 2000 and October 2008 | Seizureevent Postvaccination seizure event as the first | 1) MMRV (Merck & Co) West Point, PA) + varicella (Merck & Co) separately administered on the same day 3) MMR Risk interval after vaccination (a) 7 to 10 days (b) 0 to 42 days | Conclusions: This study provides reassurance that MMRV and MMR+V were not associated with an increased risk of febrile seizures among 4‐ to 6‐year‐olds. The authors can rule out with 95% confidence a risk greater than 1 febrile seizure per 15,500 MMRV doses and 1 per 18,000 MMR+V doses. | Cases/PT MMRV n = 86,750 | RR (95% CI) MMRV versusMMR+V |
| Retrospective linked to | n = 840,348 children 12 to 23 months of age who had received a measles‐containing vaccine from 2001 through 2011 | Fever events in the o utpatient setting was defined using ICD‐9 code 780.6*. Seizure events in the postimmunisation medically attended in the emergency department or hospital setting was defined using ICD‐9 code 780.3* (convulsion) or 345* (epilepsy). The authors do not distinguish between febrile and afebrile seizures. | 1) MMRV (Merck & Co) West Point, PA) + varicella (Merck & Co) separately administered on the same day 3) MMR Risk interval after vaccination (a) 7 to 10 days (b) 0 to 42 days | Conclusions: Measles‐containing vaccines are associated with a lower seizures when administered at 12 to 15 months of age. Findings of this study outcomes highlight the importance of timely immunisation of children measles‐containing vaccines. | 12 to 15 months (0 to 42 days) (7 to 10 days) (0 to 42 days) (7 to 10 days) (0 to 42 days) (7 to 10 days) (0 to 42 days) (7 to 10 days) | MMRV versusMMR+V rr (95% CI)(*) Fever 12 to 15 months 16 to 23 months (a) 1.4 (1.1 to 1.7) Seizures 12 to 15 months 16 to 23 months (a) 2.1 (1.3 to 3.3) (*)Poisson regression MMRV versusMMR+V RR (95% CI) (a) 1.9 (1.43 to 2.53) |
| cb‐Gavrielov‐Yusim 2014 cohort study | Index cohort All participants were aged 10 to 24 months. n = 8344 MMRV Comparison cohorts | Febrile convulsion using the diagnoses: “convulsions”, FC differential diagnoses diagnoses used conditions were “encephalitis”, from the study | MMRV Priorix‐Tetra MMR (Priorix) GSK (Varilrix). Risk intervals Postvaccination (a) 40 days (b) 5 to 12 days (c) 7 to 10 days | Conclusion: GSK’s MMRV vaccine. appears during the FC attributable to MMRV and is not detectable | N cases MMRV/ (a) 19/8344 versus 198/90,294 | OR (95% CI) unadjusted estimates adjusted estimate(**) (a) 1.00 (0.6 to 1.67) (**) 2 different types of multivariate (a) Cox regression HR (b) logistic‐regression OR (c) logistic‐regression OR Due to rarity of events, |
| cb‐Schink 2014 | All children born between 1 January 2004 and 31 December 2008 n = 226,267 received an immunisation with 1 of the index vaccines during the study period (2006 to 2008) Index cohort n = 82,656 MMRV Comparison cohorts n = 111,241 MMR n = 32,370 MMR+V | Febrile convulsions Diagnosis of FC, i.e. an ICD‐10‐GM code R56.0 in any of the hospital diagnoses. 2 outcome definitions, as follows. The primary outcome “FC narrow” was defined as hospitalisation where no alternative plausible cause of FC. This endpoint included: (i) all hospitalisation with FC as main discharge diagnosis; (ii) all hospitalisation with FC as main admission diagnosis and without a main discharge diagnosis of an infectious disease (except measles, mumps, rubella, or chickenpox) or a neurological condition; (iii) all hospitalisation with FC as secondary or ancillary diagnosis and a main discharge diagnosis coded as complication following immunisation (ICD‐10 code T88.0 infection following immunization or T88.1 other complications following immunization, not elsewhere classified). Due to exclusion of alternative causes of FC in this outcome definition, it was assumed that it would have higher specificity, but lower sensitivity. only hospitalisations for FC with a neurological condition coded as main discharge diagnosis were excluded (cb‐Jacobsen 2009). Consequently, “FC Jacobsen” included: (i) all hospitalisation with FC as main discharge diagnosis; (ii) all hospitalisation with FC as main admission diagnosis and without a main discharge diagnosis of a neurological condition; and (iii) all hospitalisation with FC as secondary or ancillary diagnosis and with a main discharge diagnosis coded as complication following immunisation. “FC narrow” cases are a subset of “FC Jacobsen” cases. | MMRV: Priorix‐Tetra (GSK) compared to MMR and V vaccines (MMR+V). Risk interval postvaccination (a) 0 to 4 days (b) 5 to 12 days (c) 13 to 30 days (d) 0 to 30 days . | Conclusion: This study suggests a similar immunisation coverage. | FC narrow MMRV versusMMR matched n = 74,734 case versus cases (a) 4 versus 5 (b) 14 versus 3 (c) 4 versus 9 (d) 22 versus 17 FC narrow MMRV versusMMR+V matched n = 32,180 case versus cases (a) 2 versus 0 (b) 5 versus 1 (c) 4 versus 9 (d) 22 versus 17 FC narrow MMRV versusMMR/MMR+V matched n = 82,561 case versus cases (a) 4 versus 4 (b) 18 versus 4 (c) 4 versus 8 (d) 26 versus 16 FC Jacobsen MMRV versusMMR matched n = 74,734 case versus cases (a) 7 versus 13 (b) 45 versus 19 (c) 35 versus 31 (d) 87 versus 63 FC Jacobsen MMRV versusMMR+V matched n = 32,180 case versus cases (a) 5 versus 4 (b) 21 versus 14 (c) 18 versus 12 (d) 44 versus 30 FC Jacobsen MMRV versusMMR/MMR+V matched n = 82,561 case versus cases (a) 8 versus 15 (b) 51 versus 21 (c) 40 versus 31 (d) 99 versus 67 | OR (95% CI) FC narrow FC narrow FC narrow FC Jacobsen FC Jacobsen FC Jacobsen |
| cb‐Klein 2017 | n = 946,806 children < 36 months of age who had received a first dose of any measles‐containing vaccine from 2000 to 2012 | Fever visit ICD‐9 code 780.6. Fever due to an MCV was defined as any clinic or emergency department a first dose of any MCV This study analysed all fevers during postvaccination days 7 to 10 as if | 1) MMRV (Merck & Co) West Point, PA) + varicella (Merck & Co) separately administered on the same day 3) MMR Risk interval after vaccination (a) 7 to 10 days | Conclusion: This study identified risk factors associated with developing fever 7 to 10 days after a first dose of measles‐containing vaccines. The study confirmed previous findings that fever was more often associated with receipt of MMRV as compared with MMR vaccine and with older age at time of vaccination during the second year of life, and further found that prior fever and seizure events were associated with fever after measles vaccine and that being fever‐prone in general predicted fever after measles‐containing vaccine. Even after adjusting for general individual and familial susceptibility to fever, fever due to measles vaccine specifically clustered in families. This study suggests an important link between population health (surveillance of a large population for vaccine adverse events) and personalised medicine (possible genetic basis for susceptibility to fever after MCV). Future work is needed to further define this possible relationship of genetics and vaccine‐associated fever. | MMRV versus MMR (a) MCV‐associated fever (b) MCV‐associated fever (older sibling with MCV‐associated fever) | OR (95% CI)(*) (a) 1.3 (1.2 to 1.5) (b) 1.5 (1.2 to 1.8) (*)logistic regression |
| CI: confidence interval | ||||||
| Study ID and design | Population | Outcome definition | Exposure | Findings | Crude data | Estimate (95% CI) |
|---|---|---|---|---|---|---|
| Retrospective cohort | Danish children born between January 1991 and December 1998 (n = 537,303) | (a) Autistic disorders ICD‐10 codes (b) Other autistic spectrum disorders and DSM‐IV codes 299.1‐ through 299.80. From medical records | MMR vaccine: Moraten (measles), Vaccination data reported in the National Board of Health. Vaccinated n = 440,655 Unvaccinated n = 96,648 | This study provides 3 strong arguments against a causal relation between MMR vaccination and autism.
Furthermore, the results were derived from a nationwide cohort study with nearly complete follow‐up data. | (a) Autistic disorders cases unvaccinated n = 53 PT unvaccinated PT(years) = 482,360 versus cases vaccinated n = 263 PT vaccinated PT(years) = 1,647,504 (b) Other autistic spectrum disorters cases unvaccinated n = 77 PT unvaccinated PT(years) = 482,360 versus cases vaccinated n = 345 PT vaccinated PT(years) = 1,647,504 | rr (95% CI)(*) (a) 0.92 (0.68 to 1.24) (b) 0.83 (0.65 to 1.07) (*) adjusted rr. Log‐linear Poisson regression |
| Retrospective cohort study | n = 657,461 children born in Denmark from 1999 through 31 December 2010, with follow‐up from 1 year of age and through 31 August 2013. | Autism spectrum disorders ICD‐10: F84.1 atypical autism, developmental disorder), developmental disorder). Autism risk score: In a preliminary analysis based on autism risk factors (maternal age, paternal age, smoking during pregnancy, method of delivery, preterm birth, 5‐minute Apgar score, low birthweight, and head circumference) a Risk Score was estimated for each child in the cohort. (b1) very low risk (b2) low risk (b3) moderate risk (b4) high risk Siblings status (at age 1 years): (c1) no siblings with autism (c2) siblings with autism (c3) no siblings | MMR vaccine Vaccinated n = 625,842 Unvaccinated n = 31,619 | The study found: no support for the hypothesis of increased risk for autism after MMR vaccination in a nationwide unselected population of Danish children; no support for the hypothesis of MMR vaccination triggering autism in susceptible subgroups characterised by environmental and familial risk factors; no support for a clustering of autism cases in specific time periods after MMR vaccination. | Cases vaccinated/vaccinated versus Cases unvaccinated/ unvaccinated All children (a) 5992/625,842 versus 525/31,619 Autism risk score (*) (b1) 1296 versus 91 cases (b2) 1637 versus 133 cases (b3) 2106 versus 206 cases (b4) 953 versus 95 cases Siblings status (*) (c1) 2297 versus 227 (c2) 32 versus 5 (c3) 3594 versus 283 (*) denominator not reported | HR (95% CI)(*) All children (a) 0.93 (0.85 to 1.02) Autism risk score (b1) 0.93 (0.74 to 1.16 (b2) 0.86 (0.71 to 1.04) (b3) 0.91 (0.78 to 1.06) (b4) 1.06 (0.85 to 1.32) Siblings status (c1) 0.98 (0.84 to 1.13) (c2) 2.96 (0.58 to 12.43) (c3) 0.89 (0.78 to 1.01) (*) adjusted by birth year, sex, other vaccines received, siblings history of autism, and autism risk score). Cox regression |
| cb‐Jain 2015 | Children continuously enrolled in the health plan from birth to at least 5 years of age during n = 95,727 children in the cohort, (a) n = 93,798 older siblings without ASD (b) n = 1929 older sibling with ASD. | Autism spectrum disorders Status in index children and older siblings was determined using a claims‐based algorithm that required 2 or more claims on separate dates of service with an ICD‐9‐CM diagnosis code in any position for autistic disorder, other specified pervasive developmental disorder including: Asperger syndrome, or unspecified PDD (299.0x, 299.8x, and 299.9x). Both index child and older sibling ASD status were determined using their entire enrolment time that fell within the study period. Index children had to have at least 1 older sibling with 2 claims with ASD diagnoses or all older siblings with no ASD diagnoses. Children with an older sibling with only 1 claim with an ASD diagnosis were excluded. Index children with only 1 claim with an ASD diagnosis were also excluded. | MMR vaccine receipt was defined as having a Current Procedural Terminology (CPT) or ICD‐9‐CM procedure code indicating receipt of each component (measles, mumps, and rubella) after 1 year of age. | The study found: MMR vaccine was not associated with increased risk of ASD, regardless of whether older siblings had ASD. These findings indicate no harmful association between MMR vaccine receipt and ASD even amongst children already at higher risk for ASD. | Cases vaccinated/vaccinated versus Cases unvaccinated/ unvaccinated age 2 years ‐ 1 dose (a) 53/77,822 versus 13/15,249 (b) 7/1394 versus 6/520 age 3 years ‐ 1 dose (a) 239/79,666 versus 45/12,853 (b) 38/1458 versus 17/438 age 4 years ‐ 1 dose (a) 395/79,691 versus 65/11,957 (b) 64/1491 versus 25/387 age 5 years ‐ 1 dose (a) 339/40,495 versus 56/7735 (b) 51/864 versus 23/269 age 5 years ‐ 2 doses (a) 244/45,568 versus 56/7735 (b) 30/796 versus 23/269 | HR (95% CI)(*) age 2 years ‐ 1 dose (a) 0.91 (0.68 to 1.20) (b) 0.76 (0.48 to 1.22) age 3 years ‐ 1 dose (a) 0.97 (0.77 to 1.21) (b) 0.81 (0.53 to 1.25) age 4 years ‐ 1 dose (a) 1.03 (0.81 to 1.31) (b) 0.86 (0.56 to 1.34) age 5 years ‐ 1 dose (a) 1.10 (0.79 to 1.53) (b) 0.92 (0.56 to 1.50) age 5 years ‐ 2 doses (a) 1.09 (0.76 to 1.54) (b) 0.56 (0.30 to 1.04) (*) Hazard rate ratio from Cox proportional hazards model adjusting for birth year, sex, region, race/ethnicity, maternal or paternal highest education level, household income, mother’s age at birth of index infant, father’s age at birth of index infant, continuous enrolment with mental health carve‐out benefit, Childhood Chronic Conditions score, seizure, allergies, and preterm birth. Cox regression |
| Retrospective cohort | Children born between 1976 and 1999 with clinical diagnosis of ASD analysed n = 858 (whole sample n = 904; n = 46 cases were excluded due to insufficient information on ASD regression) | Regression in autism spectrum disorders ASD regression defined as “a documented deterioration in any aspect of development or reported loss of skills, however transient” Note: over time 2 different diagnostic processes have been adopted at YPCD: until February 2000, the diagnostic process consisted of the assessment of ASD initially conducted by a child psychiatrist using the DSM‐IV (American Psychiatric Association, 1994), after which a clinical psychologist conducted an intelligence test. After admission a psychiatrist followed the patients once or twice a month. All doctors had been trained in using a common concept of diagnosis. From February 2000 onwards, a child psychiatrist with a clinical psychologist conducted the full assessment in 1 day. Diagnosis of ASD was made by 3 experienced child psychiatrists based on clinical observations, intellectual and developmental tests, and interviews with parents and patients. | MMR vaccine AIK‐C (measles), Urabe AM9 (mumps) To‐336 (rubella) strains. Data concerning MMR vaccination were moreover obtained from records of the Maternal and Child Health Handbook and were referred to the MMR generation group only. Participants were classified according to the chance of having received MMR vaccine (MMR was administered in Japan from April 1989 to April 1993 in children 12 to 36 months of age):
| The study found: within the MMR era, the rate of regression in those who received MMR was not higher than those who did not. Moreover, there was no indication that the rate of regression in ASD was higher during the era when MMR was used, compared to the ‘‘before’’ period and ‘‘after’’ period, and the ‘‘before" and "after’’ periods combined. | N cases vaccinated/ MMR‐generation (a) 15/54 versus 45/132 All generations (*) (b) 15/54 versus 272/715 (*) 98 cases out of 275 (MMR‐generation) were excluded due to unclear vaccination status, analysed n = 186. ‐‐‐‐‐‐‐‐‐‐‐‐‐‐‐‐‐‐‐‐‐‐‐‐‐‐‐ MMR‐era versusbefore (c) 98/275 versus 34/100 ‐‐‐‐‐‐‐‐‐‐‐‐‐‐‐‐‐‐‐‐‐‐‐‐‐‐‐‐‐‐‐ MMR‐era versusafter (d) 98/275 versus 193/483 ‐‐‐‐‐‐‐‐‐‐‐‐‐‐‐‐‐‐‐‐‐‐‐‐‐ MMR‐era versus(before + after) (e) 98/275 versus 227/583 | OR (95% CI) (a) 0.744 (0.349 to 1.571) (b) 0.626 (0.323 to 1.200) (c) 1.075 (0.646 to 1.791) (d) 0.832 (0.605 to 1.144) (e) 0.868 (0.638 to 1.182) |
| Case‐control | Children with a first diagnosis of a PDD during the study period registered with a GPRD practice. Cases: n = 1294 Controls: n = 4469 | Pervasive developmental disorder “Those with autistic disorders and similar presentations were classified as having 'autism' and those with other description (such as Asperger’s syndrome) were classified as having 'other PDD'. Patients who had more than one PDD diagnostic code recorded at different times (for example, autism and then Asperger’s syndrome) were classified as having the most specific diagnosis (in this example Asperger’s syndrome)” From diagnosis contained in UK General Practice Research Database (GPRD electronic records). | MMR vaccine: No single clinical code was immediately implemented for MMR, then MMR was identified by codes of measles, mumps, and rubella administered on the same day. Information on MMR exposure:
| The study found: MMR vaccination was not associated with an increased risk of subsequently being diagnosed with a PDD. | MMR vaccination Before index date (a) at any age (b1) before third birthday (b2) after third birthday (c1) before age 18 months (c2) after age 18 months (d) autism only (e) other PDD only | OR (95% CI)(*) (a) 0.86 (0.68 to 1.09) (b1) 0.90 (0.70 to 1.15) (b2) 0.77 (0.55 to 1.08) (c1) 0.90 (0.70 to 1.15) (c2) 0.80 (0.61 to 1.05) (d) 0.88 (0.67 to 1.15) (e) 0.75 (0.46 to 1.23) (*)adjusted conditional logistic regression |
| Case‐control | Children with autism aged 3 to 10 years in 1996. All sample Cases: n = 624 Controls: n = 1824 Birth certificate subsample Cases: n = 355 Controls: n = 1020 | Autism cases were identified through screening and abstraction of source files at schools, hospitals, clinics, and specialty providers. Clinical psychologists with expertise in the diagnosis of autism reviewed the abstracted records according to a standardised coding scheme to determine the presence of behavioural characteristics consistent with the DSM‐IV criteria for ASDs. | MMR vaccine type: not stated MMR vaccination was abstracted from “standardized state immunization forms”. 3 specific years cutoff: (a) 18 months of age, as an indicator of “on‐time” vaccination according to the recommended vaccination schedule for MMR vaccine; (b) 24 months of age, the age by which atypical development has become apparent in most children with autism; (c) 36 months of age, the age by which autistic characteristics must have developed to meet DSM‐IV criteria for autism. | The study found: no significant associations for vaccinated before 18 months or before 24 months of age, including children with some indication of regression or plateau in development, the group of most concern. Vaccination before 36 months of age was more common amongst case children than control children, although only a small proportion of children in either group received their first MMR vaccination after 36 months of age. Rather than representing causal relationships, associations with the 36‐month cutoff would be more likely than associations with earlier age cutoffs to have been influenced by factors related to the evaluation, management, and treatment of the child, e.g. case children might have been more likely than control children to have been vaccinated as a requirement for enrolment in early intervention or preschool special education programs. This possibility is supported by the finding that the difference between case and control children in the proportion vaccinated before 36 months of age was strongest in the 3‐ to 5‐year‐old age group. A majority of case children who were vaccinated after 36 months of age, however, had indications of developmental problems before 36 months of age. | All cases (a1) < 18 months (b1) < 24 months (c1) < 36 months Birth certificate (a2) < 18 months (b2) < 24 months (c2) < 36 months | OR (95% CI) All cases(*) (a1) 1.12 (0.91 to 1.38) (b1) 1.21 (0.93 to 1.57) (c1) 1.49 (1.04 to 2.14) Birth certificate (**) (a2) 0.93 (0.66 to 1.30) (b2) 0.99 (0.63 to 1.55) (c2) 1.23 (0.64 to 2.36) (*)partially adjusted estimates: conditional logistic regression model stratified by the matching variables (age, gender, school). (**)adjusted estimates: conditional logistic regression model stratified by the matching variables (age, gender, school) and adjusted for birthweight, multiple gestation, maternal age, and maternal education. |
| Case‐control | Children aged 2 to 15 years diagnosed with childhood or atypical autism. Cases: n = 96 Controls: n = 192 children matched for birth year, gender, and practice | Childhood or atypical autism classified according to ICD‐10 criteria as F84.0 or F84.1, respectively. Every diagnosis of autism was made by child psychiatrist. Dates of these diagnoses were recorded in general practitioner files. Cases with uncertain diagnosis of autism, secondary to disease state or trauma, were excluded. Parents were interviewed. Questions for all children included information about prenatal and postnatal development, mental and physical development, chronic diseases, malformations and injuries, history of bowel disturbances, birth order, family size, and parents’ socioeconomic status. Parents of children with autism were additionally asked about the date of onset of symptom, the period when parents first suspected their child’s symptoms might be related to autism, and their knowledge and beliefs regarding the cause of autism. | Vaccine type: MMR: not described Information about vaccination history was extracted from physician records. | The study found: MMR vaccination was not significantly associated with an increased risk of autism in children. In a separate analysis, a similar result was achieved for the single‐antigen measles vaccine. An unexpected finding was that odds ratios associated with MMR were lower than with the single measles vaccine. The decreased risk of autism amongst vaccinated children may be due to some other confounding factors in their health status. For example, healthcare workers or parents may have noticed signs of developmental delay or disease before the actual autism diagnosis and for this reason have avoided vaccination. | Any vaccine versusunvaccinated (a1) vaccinated before symptom onset (a2) vaccinated before diagnosis MMR vaccine versusunvaccinated (b1) vaccinated before symptom onset (b2) vaccinated before diagnosis MV vaccine versusunvaccinated (c1) vaccinated before symptom onset (c2) vaccinated before diagnosis | OR (95% CI)(*) any vaccine versusunvaccinated (a1) 0.65 (0.26 to 1.63) (a2) 0.28 (0.01 to 0.76) MMR versusunvaccinated (b1) 0.42 (0.15 to 1.16) (b2) 0.17 (0.06 to 0.52) MV versusunvaccinated (c1) 0.86 (0.33 to 2.23) (c2) 0.36 (0.13 to 1.00) (*)Adjusted for mother’s age (15 to 35, 36 to 44 years), medication during pregnancy, gestation time (36 to 37, 38 to 43 weeks), perinatal injury, 5‐minute Apgar scale score (3 to 8, 9 to 10). |
| Case‐control | The study analysed case data from patients of YPDC; the cases consisted of Children aged 6 to 36 months cases: n = 189 control: n = 224 | Diagnosis of ASD: based on the classifications of pervasive developmental disorders in the DSM‐IV and standardised criteria using the Diagnostic Interview for Social and Communication Disorder (DISCO). | MMR vaccine: not described | The study found: there was no convincing evidence that MMR vaccination and increasing the number of vaccine injections were associated with an increased risk of ASD in a genetically homogeneous population. Consequently, these findings indicate that there is no basis for avoiding vaccination out of concern for ASD. | Cases vaccinated/N cases versus Control vaccinated/N controls 47/189 versus 54/224 | OR (95% CI)(*) 1.04 (0.65 to 1.68) (*) matched odds ratio |
| Case‐only ecological method | Children aged 5 to 11 years (birth cohorts 1987 to 1998 attending a boarding school in Montreal (n = 27,749, out of whom 180 with PDD) | Pervasive developmental disorders Children with a diagnosis of PDD were identified by school personnel and given a study code to preserve the anonymity of the data. Children’s diagnoses were not verified by direct assessments, but it is worth noting that a majority of these children (N = 155; 86.1%) were diagnosed at the Montreal Children’s Hospital. School | MMR (no description) Identified by vaccination records | MMR and autism: During the 11‐year interval, rates of PDD significantly increased, whereas MMR vaccine uptake showed a slight opposite trend. The opposite directions of both trends make it even less likely that a true association was not detected in the study data. The study shows a lack of association between MMR uptake and PDD rates applied to the period (1987 to 1995) where a single MMR dose was administered at 12 months of age. Rates of PDD were rapidly increasing well before the introduction of the 2‐dose schedule and, during that first phase, the increase of PDD rate bore no relationship with MMR vaccine uptake. The authors tested whether the introduction of a second MMR dose after 1995 accelerated the increase in PDD rates in the following 3 years. No statistically significant difference could be found between the rate of increase in PDD prevalence between the 1‐dosing and the 2‐dosing periods. | No association. Significant increase in rates of PDDs from 1987 to 1998 (OR 1.10, 95% CI 1.05 to 1.16; P < 0.001) despite decrease in MMR uptake through birth cohorts from 1988 to 1998 (Chi² for trend = 80.7; df = 1; P < 0.001). | No data available for meta‐analysis |
| Case‐only ecological method | Children born from 1988 to 1996 (n = 31,426) | Autism spectrum disorders ASD cases defined as all cases of PDD according to ICD guidelines, but an early detection clinical system called DISCOVERY that included items drawn up by the Public Health Bureau of Yokohama called YACHT (Young Autism and other developmental disorders CHeckup Tool) was active in Kohoku Ward. Definite regression Probable regression | MMR vaccine: no description Exposed period: 1988 to 1992 MMR vaccination rates declined from 69.8% in the 1988 birth cohort to 42.9%, 33.6%, 24.0%, and a mere 1.8% in birth cohorts 1989 to 1992. Reference period: 1993 to 1996 In birth cohorts 1993 to 1996, when not a single child was immunised. | MMR vaccination is unlikely to be a main cause of ASD, that it cannot explain the rise over time in the incidence of ASD, and that withdrawal of MMR in countries where it is still being used cannot be expected to lead to a reduction in the incidence of ASD. | Risk period (cases/population) versus Reference period (cases/population) (a) Childhood autism 58/17,704 versus 100/13,722 (b) Other ASD 50/17,704 versus 70/13,722 (c) Definite regression 29/17,704 versus 31/13,722 (d) Definite + probable regression 35/17,704 versus 37/13,722 (e) All ASD 108/17,704 versus 170/13,722 | rr (95% CI) (a) 0.45 (0.33 to 0.62) |
| Person‐time cohort | Children 1 to 7 years old (n = 535,544) | Autism Autistic disorder: "Severe qualitative impairment in reciprocal social interaction, in verbal and non verbal communication and in imaginative activity and markedly restricted repertoire of activities and interests" (Steffenburg 1989) Data regarding first hospital visits during the study period identified by ICD‐8/9 codes respectively effective from 1969 to 1986 and from1987 through 1995 (299 ‐ Psychoses ex origine infantia; 2990 ‐ Autismus infantilis; 2998 ‐ Developmental disorder; 2999 ‐ Developmental disorder). | MMR II ‐ vaccine (Merck & Co, West Point, PA) Measles: Enders‐Edmonston Mumps: Jeryl Lynn Rubella: Wistar RA 27/3 Vaccination data were assessed through vaccination register. For autism the risk period is open‐ended. | The study found: no distinguishable clustering was detected in the intervals from vaccination to the hospitalisation. The number of hospital admissions remained relatively steady during the first 3 years and then gradually decreased, as was expected because of the increasing age of the vaccinees (Fig 3). | ASD cases n = 309 | No data available for meta‐analysis |
| Self‐controlled case series | Children born since 1979 from 8 health districts (North Thames, UK) | Autistic disorder “By use of criteria of the International Classification of Diseases, tenth revision (ICD10), the diagnosis of autism was checked against information in the available records on the child’s present condition and his or her condition between the ages of 18 months and 3 years.” ICD‐10 confirmed and non‐confirmed cases from computerised special needs/disability registers at child development centres and from records in special schools. Information on children with such disorders who were younger than 16 years of age was extracted from clinical records by 1 of 3 experienced paediatric registrars. | MMR vaccination identified by Regional Interactive Child Health Computing System (RICHS) Risk period: (a) Autism diagnosis (a1) < 12 months (a2) < 24 months after vaccination (b) Parental concern (b1) < 6 months (b2) < 12 months after vaccination (c) Regression (c1) < 2 months (c3) < 6 months Where vaccination and the event of interest | The case‐series analyses showed no evidence of temporal clustering between MMR or other measles‐containing vaccines and diagnosis of autism. Regression occurred in nearly a third of the cases of core autism; regression was not clustered in the months after vaccination. For age at first parental concern, no significant temporal clustering was seen for cases of core autism or atypical autism, with the exception of a single interval within 6 months of MMR vaccine associated with a peak in reported age at first parental concern at 18 months. This peak is likely to reflect the difficulty experienced by parents in defining the precise age at onset of symptoms in their child, particularly those with atypical autism, and consequent approximation with preference for 18 months. Our results do not support the hypothesis that MMR vaccination is causally related to autism, either its initiation or to the onset of regression. | MMR vaccine (a) Autism diagnosis (n = 357) (b) Parental concern (n = 326) (c) Regression (n = 105) | rr (95% CI)(*) (a1) 0.94 (0.60 to 1.47) (a2) 1.09 (0.79 to 1.52) (b1) 1.48 (1.04 to 2.12) (b2) 0.90 (0.63 to 1.29) (c1) 0.92 (0.38 to 2.21) (c2) 1.00 (0.52 to 1.95) (c3) 0.85 (0.45 to 1.60) (*) relative incidence, Poisson regression |
| Case‐only ecological method | Pre‐MMR: Maudsley Family Study (MFS) sample: n = 98 probands who had an ICD‐10 diagnosis of autism PDD. Children born between 1954 and 1979. Post‐MMR: Maudsley Hospital Clinical (MHC) sample: n = 68 children born between 1987 and 1996 and had a confirmed diagnosis of PDD. Post‐MMR: Stafford sample: n = 96 children born between 1992 and 1995 selected as part of an epidemiologic survey of PDD conducted in Staffordshire (Midlands, UK) total population n = 15,500. | Autistic enterocolitis (a) Age (in months) at first parental concern: in the 3 samples, item 2 of the ADI (earlier version of the ADI‐R) was used to assess the first onset of autistic symptoms, or the age of the child at which parents first became concerned about their child’s development. The precise wording of the question is, “How old was your child when you first wondered if there might be something not quite right with his/her development?” (b) Regression: the assessment of regression in the ADI‐R is covered with items 37 to 41 (for language) and items 95 to 103 (for other domains). The regression is assessed for language skills as follows: “Were you ever concerned that your child might have lost language skills during the first years of his/her life? Was there ever a time when he/she stopped speaking for some months after having learned to talk?” Assessment of bowel disorders and symptoms: these data were available only from the epidemiologic sample (Stafford sample). All children were reviewed regularly and are still followed up by the paediatrician, who has records of any additional hospital admissions/medical investigations for bowel disorders in these children. The occurrence of gastrointestinal symptoms was assessed by 2 sources: the parents and the paediatrician. ADI‐R: Autism Diagnostic Interview ‐ Revised was administered with the parents by trained staff. Interrater reliability on the ADI‐R interviews was assessed. | MMR vaccine type not described MFS sample (pre‐MMR): unvaccinated MHC sample (post‐MMR): likely vaccinated The MMR immunisation programme was introduced in 1988 in the UK (with first MMR given between 12 and 15 months of age) with coverage rates above 90%. MMR coverage rates in 2‐year‐olds fell from 92% in 1995 to 88% in 2000. | No evidence was found to support a distinct syndrome of MMR‐induced autism or of “autistic enterocolitis”. No changes in the mean age of parental recognition of first autistic symptoms were found when 2 samples of children, 1 clinical and 1 epidemiologic, all exposed to MMR immunisation, were compared with a pre‐MMR sample. No increase in the rate of regressive autism in recent years. Rates of regression in the development of children with autism were found to be similar in a pre‐ and post‐MMR sample. | ‐‐‐‐MFS sample (n = 98) (a) mean = 19.5 (SD = 13.6) (b) n = 18 ‐‐‐‐MHC sample (n = 68) (a) mean = 19.2 (SD = 8.8) (b) n = 0 ‐‐‐‐Stafford sample (n = 96) (a) mean = 19.3 (SD = 8.7) (b) n = 15 No statistically relevant differences across the 2 samples for the rate of probable or definite regression. | No data available for meta‐analysis |
| ADI‐R: Autism Diagnostic Interview ‐ Revised Definitions: Childhood autism: children with symptoms before the age of 3 years that meet the necessary criteria under each section of the diagnostic triad for autism: communication difficulties, problems with social interaction, and behaviour problems such as stereotyped repetitions. Atypical autism cases: with many of the features of childhood autism but not quite meeting the required criteria for that diagnosis, or with atypical features such as onset of symptoms after age 3 years (also known as pervasive developmental disorder not otherwise specified). Developmental regression: a documented deterioration in any aspect of development or reported loss of skills, however transient (International Classification of Diseases, 10th revision (ICD‐10) and Diagnostic and Statistical Manual of Mental Disorders, 4th edition (DSM‐IV)). | ||||||
| Study ID and design | Population | Outcome definition | Exposure | Findings | Crude data | Estimate (95% CI) |
|---|---|---|---|---|---|---|
| Case‐control | Vaccine Safety Datalink (versusD) cases were patients born between 1958 and 1989. Case IBD n = 142 (n = 75 Crohn's disease and n = 67 ulcerative colitis) Controls n = 432 matched for sex, HMO, and birth year | Inflammatory bowel diseases Review of medical records contained in the Vaccine Safety Datalink database of 4 HMOs and identified by using ICD‐9 codes specific for Crohn's disease, ulcerative colitis and idiopathic proctocolitis (555 and 556). Outpatient, emergency department, urgent care clinic visits were available for 3 out of the 4 HMOs and were also taken into account. After abstraction of medical records, IBD cases were classified as: Definite IBD: as individuals diagnosed with IBD by a gastroenterologist at 1 of the HMOs who had at least 1 sign or symptom compatible with IBD (such as bloody stool and/or bloody diarrhoea or severe and/or recurrent abdominal pain) recorded and a diagnostic test result (such as biopsy with pathology specimen, colonoscopy, or sigmoidoscopy) consistent with IBD. Probable IBD: the diagnosis of IBD was made by either an HMO non‐gastroenterologist physician or a gastroenterologist outside the HMO; there was at least 1 sign or symptom compatible with IBD; and there was a diagnostic test result consistent with IBD. IBD cases (suspected or questionable) that did not correspond to these criteria were excluded from analysis. IBD (definite and probable) were further classified as Crohn's disease and ulcerative colitis cases. | MMR vaccine MCV vaccine not specified MMR administered at any time before index date | In this population‐based study of IBD at 4 large HMOs, the authors found no evidence that vaccination with MMR or other MCV, or that the age of vaccination early in life, was associated with an increased risk for development of IBD. In addition, the authors did not find evidence that MMR or other MCV acutely triggers the onset of either ulcerative colitis/proctitis or Crohn's disease. | N cases vaccinated/ Crohn's disease (n = 75) (a) all age and vaccine type (a1) MMR < 12 months (a2) MMR 12 to 18 months (a3) MMR > 18 months Ulcerative colitis (n = 67) (b) all age and vaccine type (b1) MMR < 12 months (b2) MMR 12 to 18 months (b3) MMR > 18 months All IBD (n = 142) (c) all age and vaccine type 132/142 versus 409/432 (c1) MMR < 12 months 6/16 versus 25/48 (c2) MMR 12 to 18 months 84/94 versus 223/246 (c3) MMR > 18 months 4/14 versus 52/75 | OR (95% CI)(*) Crohn's disease (a) 0.40 (0.08 to 2.00) (a1) 0.38 (0.05 to 2.86) (a2) 0.54 (0.10 to 3.07) (a3) 0.18 (0.03 to 1.21) Ulcerative colitis (b) 0.80 (0.18 to 3.56) (b1) 0.96 (0.12 to 7.57) (b2) 1.14 (0.23 to 5.59) (b3) 0 (0 to 0) All IBD (c) 0.59 (0.21 to 1.69) (c1) 0.61 (0.15 to 2.45) (c2) 0.86 (0.28 to 2.59) (c3) 0.16 (0.04 to 0.68) (*)Conditional logistic regression matched on HMO, sex, birth year adjusted for race. |
| Case‐control | Cases: patients from the registry of inflammatory bowel diseases January 1988 to December 1997 aged less than 17 years old. Cases n = 222 Cases n = 60 ulcerative colitis Controls were randomly selected from telephone | Crohn's disease; ulcerative colitis Interviewer practitioners collected data on all patients Only patients who had been residents in the defined study areas at the time of diagnosis of their disease were included. A final diagnosis of CD or UC was made by 2 expert gastroenterologists and recorded as definite, probable, or possible, following criteria previously published. For the purpose of this study, only patients with definite or probable CD or UC were considered. | MMR vaccine not described | MMR vaccination was negatively associated | (a) Crohn's disease (b) ulcerative colitis | OR (95% CI)(*) (a) 0.5 (0.35 to 0.9) (b) no data available |
| Case‐control | Cases n = 117 with IBD diagnosis, born after 1989 and diagnosed before 31 March 2008. Controls n = 834 matched to cases on the basis of age, sex, and region of residence at time of diagnosis. All with an average age of 11 years. | Inflammatory bowel diseases The administrative data case definition used to identify patients with IBD was validated with the establishment of the population‐based University of Manitoba IBD Epidemiology Database (UMIBDED) in 1995; the UMIBDED contains extracted administrative data of IBD cases and their controls (at a 1:10 ratio) for those individuals with health coverage between 1 April 1984 and 31 March 2008. Residents of Manitoba who resided in the province for at least 2 years were identified as having IBD if they had at least 5 physician visits or hospitalisations with ICD‐9‐CM codes 555.xx (Crohn’s disease) or 556.xx (UC) recorded as a diagnosis at any time. Since 2004, ICD‐10‐CA codes were used for all inpatient contacts and for IBD included K50.xx and K51.xx. | MMR vaccine not described | No significant association between completed measles‐containing vaccination in the | (a) IBD | OR (95% CI)(*) (a) 1.54 (0.54 to 4.36) (*)Conditional logistic regression models were fitted to the data, with models adjusted for physician visits in the first 2 years of life and area‐level socioeconomic status at case date. |
| Case‐control | Cases inflammatory bowel diseases n = 150 Cases ulcerative colitis n = 119 Controls n = 150 not having a diagnosis of IBD, age and sex matched, were used as the control group. | Inflammatory bowel diseases Patients diagnosed with IBD (UC or CD), identified according to the hospital’s patient records. Of a total of 150 patients in the sample, 119 patients were diagnosed with UC and 31 were diagnosed with CD. They were identified according to the hospital’s patient records. Documentation of the regional hospitals in Vukovar and Vinkovci was used for this purpose. Hospitals in the near surroundings such as Clinical Hospital Centre Osijek and General Hospital Slavonski Brod were also contacted, as some patients were directly referred to these hospitals by their primary care physicians without prior registration in the resident hospitals. | MMR vaccine | The study found an association between exposure to MMR vaccine in the early childhood and later development of CD | N cases vaccinated/ (a) IBD 117/150 versus 101/150 (b) UC 89/119 versus 101/150 (c) CD 28/31 versus 101/150 | OR (95% CI) (a) 1.72 (1.03 to 2.88) (b) 1.44 (0.84 to 2.46) (c) 4.53 (1.31 to 15.63) |
| Case‐only ecological method | Crohn's Disease emergency admission cases (n = 4463) observed between April 1991 and March 2003 in England population aged below 19 years (about 11.6 million) | Crohn's disease | MMR vaccine not reported (a) Reference period: 1988 to 1989 (7% children completing a primary course) (b) Risk period: (68% children completing a primary course) (c) Risk period: 1991 to 2003 (84% children completing a primary course) | The study found no increase in Crohn’s disease associated with the introduction of the MMR vaccination programme, providing strong evidence against the hypothesis that MMR vaccine increases the risk of Crohn’s disease. | ‐ | RR (95% CI)(*) 0.95 (0.84 to 1.08) (*) Poisson regression. The estimated rate ratio (populations with a vaccination rate of 84% compared with those with a vaccination rate of 7%). |
| Case‐only ecological method linked to db‐Taylor 1999 | Children with childhood (core autism n = 278) and atypical autism (n = 195) born between 1979 and 1998 from computerised health registers of children with disabilities in the community and from special school and child psychiatry records, using the same methods and classifications as in the authors' earlier study. | Recorded bowel problems lasting at least 3 months, age of reported regression of the child's development where it was a feature, and relation of these to MMR vaccination. | MMR vaccine | The study provides no support for an MMR‐associated “new variant” form of autism with developmental regression and bowel problems, and further evidence against involvement of MMR vaccine in the initiation of autism. | Bowel problem all cases n = 78 unvaccinated cases n = 9 vaccinated before parental concern n = 50 vaccinated after parental concern n = 19 | OR (95% CI)(*) 0.98 (0.89 to 1.07) (*) logistic regression adjusted for sex, year of birth, district, age at parental concern, and type of autism. |
| CD: Crohn's disease Definitions: Childhood autism: children with symptoms before the age of 3 years that meet the necessary criteria under each section of the diagnostic triad for autism: communication difficulties, problems with social interaction, and behaviour problems such as stereotyped repetitions. Atypical autism: with many of the features of childhood autism but not quite meeting the required criteria for that diagnosis, or with atypical features such as onset of symptoms after age 3 years (also known as pervasive developmental disorder not otherwise specified). Developmental regression: a documented deterioration in any aspect of development or reported loss of skills, however transient (International Classification of Diseases, 10th revision (ICD‐10) and Diagnostic and Statistical Manual of Mental Disorders, 4th edition (DSM‐IV)). | ||||||
| Study ID and design | Population | Outcome definition | Exposure | Findings | Crude data | Estimate (95% CI) |
|---|---|---|---|---|---|---|
| Cohort study | (Birth‐cohort) The enrolment (3 November 2000 to 22 August 2003) included only non‐smoking women, aged 18 to 35 years, with singleton pregnancy without illicit drug use and HIV infection, free from chronic diseases such as diabetes or hypertension and residing in Krakow for at least 1 year prior to pregnancy. The infants were followed up to 8th year of life. n = 369 children (n = 307 vaccinated MMR; n = 32 vaccinated monovalent; n = 30 unvaccinated) | Fagan Test of Infant Intelligence (FTII) at 6th month of life. Bayley Scales of Infant Development, second edition (BSID‐II), was administered in the 12th, 24th, and 36th months of life. The Mental Scale of that test includes items that assess memory, habituation, problem solving, early number concepts, generalisation, classification, vocalisation, language, and social skills. Test scores are adjusted to child’s age to obtain the Mental Development Index (MDI). Test results are in 1 of 4 categories (range: from 50 to 150): (1) accelerated performance (score > 115); (2) within normal limits (score 85 to 114); (3) mildly delayed performance (score 70 to 84), and (4) significantly delayed (score < 69). Thetest of Raven’s Colored Progressive Matrices (Raven) was administered twice, in 5th and 8th year of life. The Wechsler Intelligence Scale for Children (WISC‐R) was administered in 6th and 7th year of life, and generated verbal, non‐verbal, and total IQ for evaluated children. Category with IQ < 100 was considered as the poorer outcomes. The outcomes range is from 40 to 160. | MMR vaccine | MMR and cognitive tests outcomes: No significant differences of cognitive and intelligence tests results were observed between children vaccinated with MMR and unvaccinated in univariable analysis. Their outcomes were on similar level. Conclusion: The results suggest that there is no relationship between MMR exposure and children’s cognitive development. Furthermore, the safety of triple MMR is the same as the single measles vaccine with respect to cognitive development. | (a1) MDI‐BSID II 24th month (a2) MDI‐BSID II 36th month (b1) Raven (centiles) 5th year (c1) WISC‐R Verbal IQ 6th year | OR (95% CI)(*) (a1) 1.35 (0.15 to 12.0) (a2) 0.37 (0.03 to 4.02) (b1) 1.22 (0.23 to 6.55) (c1) 1.23 (0.09 to 17.03) (*) adjusted for standardised to child’s gender, maternal education, maternal IQ, maternal economical status, birth order (further child versus first one), and exposure to environmental tobacco smoke during pregnancy (yes versus no). |
| CI: confidence interval | ||||||
| Study ID and design | Population | Outcome definition | Exposure | Findings | Crude data | Estimate (95% CI) |
|---|---|---|---|---|---|---|
| Nested case‐control study | Cases: n = 23 children with outcome of interest at 12 to 23 months, between 1988 and 1999, GPRD members. Controls: n = 116 participants matching for index date (age), sex, practice. Nested case–control analysis to evaluate whether there was any relationship between recent MMR vaccination and the risk of ITP. Because the data were sparse, the authors grouped case–control sets by 3‐month age bands (13 to 15 months, 16 to 18 months, and so on). In addition, they included boys and girls in sets together because childhood ITP is reported to occur with equal | Idiopathic thrombocytopenic purpura GPRD electronic records with first‐time diagnosis of thrombocytopenia (ICD‐9 code 287.1) | MMR vaccine: not reported. Data about MMR vaccination were presumably obtained from GPRD records (type and composition not reported). The authors referred to ITP cases that occurred within 6 weeks after an MMR vaccine as "possible vaccine‐related"; this is a plausible period of risk related to a primary immune response. They also evaluated the risk of ITP during a longer period after MMR vaccination (7 to 26 weeks). Risk time following MMR immunisation (a) 0 to 6 weeks (b) 7 to 26 weeks (c) 0 to 26 weeks Reference time unexposed MMR or > 26 weeks after MMR | Authors' conclusion: "Although ITP is one of the most frequently diagnosed haematological disorders amongst young children, it is an uncommon condition. The risk of ITP occurring within the 6 weeks after vaccination with MMR is significantly increased. However, the attributable risk of ITP within 6 weeks after MMR vaccination remains low at 1 in 25,000" (95% CI 21,300 to 89,400) "vaccinated children. Complications or long‐term consequences of ITP in this age group are rare. For the majority of children less than 6 years of age, the illness is self‐limiting." | N cases vaccinated/ Data reported in the study: (a) 8/17 versus 19/84 (b) 6/15 versus 32/97 (c) 14/23 versus 51/116 | OR (95% CI) unadjusted estimates (a) 3.04 (1.03 to 8.96) (b) 1.35 (0.44 to 4.14) (c) 1.98 (0.79 to 4.95) computed from the data reported in the study. ‐‐‐‐‐‐‐‐‐‐‐‐‐‐‐‐‐‐‐‐‐‐‐‐‐‐‐‐ adjusted estimates(*) (*) logistic regresson |
| Case‐control study | Cases: n = 387 children aged 1 month to 18 years, hospitalised at emergency department with outcome of interest between November 1999 and September 2007, with outcome of interest. Controls: n = 1924 children of same age interval hospitalised at emergency department for acute neurological disorders or endoscopically confirmed gastroduodenal lesions | Acute immune thrombocytopenia Platelets count < 100,000/μL at admission. Participants with following conditions were excluded: cancer, immunodeficiency, chronic renal and hepatic failure, so as acute events related to a reactivation of an underlying chronic disease or a congenital anomaly Hospitalisation (emergency department) records review | Not reported. Exposure to the vaccine (and other drugs) was assessed during hospital admission by means of interview with parents. 0 to 6 weeks following MMR immunisation | Authors' conclusion: the study confirms an association between MMR vaccination and ITP. As the risk of ITP after vaccination is smaller than after natural infection with these viruses, it is clear that the benefit of vaccination programmes greatly exceed the significance of this possible adverse effect. Although thrombocytopenia is initially severe, the subsequent course is generally benign and short‐lasting. | N cases vaccinated/ 14/387 versus 27/1924 | OR (95% CI)(*) 2.4 (1.2 to 4.7) (*) adjusted estimates by logistic regression |
| Self‐controlled case series | Children (n = 63) aged 12 to 23 months with ITP identified from versusD database for the years 1991 to 2000, who had been vaccinated with MMR whilst actively enrolled in their respective MCOs. For each child, follow‐up time was limited to the 365 days before and after MMR vaccination. Vaccinated children with ITP that occurred outside this follow‐up window were excluded. | Immune thrombocytopenia purpura Participants with 2 platelet counts ≤ 50,000/μL within 6‐week period or with 1 platelets count ≤ 50,000/μL associated with ICD‐9 diagnosis codes 287.0 to 287.9 within 6 weeks, with exclusion of: cases of thrombocytopenia from a known condition (neonatal thrombocytopenia, aplastic anaemia, defibrination syndrome, acquired haemolytic anaemia, chronic liver disease, malignant neoplasm), thrombocytopenia diagnosed within the 30th day of life. By subsequent patient chart reviews, participants who did not have not have ITP, who had drug exposure, with acute illness, or with serendipitous finding during routine care were further excluded. | MMR vaccine: not reported MMR vaccination date assessed by means of separate audit of patient charts. Exposed period: 42 days after MMR vaccination Unexposed period: defined as the time periods before and after the exposed period. Period of 6 weeks immediately preceding MMR vaccination was excluded from analysis (because this represents a period when a child is most likely to be healthy (the healthy‐vaccinee) and may underestimate the background incidence of ITP) | Authors' conclusion: since its introduction in the 1960s, the MMR vaccine has reduced the incidence of wild‐type measles by nearly 100% in the USA. Although this vaccine is associated with an increased incidence of ITP, the attributable risk is low (1 case per 40,000 doses of MMR), and the disease associated with MMR vaccination is mild and resolves, on average, within 7 days. Our results, therefore, do not suggest a need to alter current immunisation policies. | Age groups (a) 12 to 23 months (b) 12 to 15 months | rr (95% CI)(*) Self‐controlled case series (a) 5.38 (2.72 to 10.62) (b) 7.06 (1.95 to 25.88) (*) conditional Poisson regression controlled by age in three 4‐month age groupings (12 to 15, 16 to 19, 20 to 23 months) and excluding fixed covariate from the model (gender, MCO, MMR dose number) ‐‐‐‐‐‐‐‐‐‐‐‐‐‐‐‐‐‐ Person‐time cohort(**) (a) 3.94 (2.01 to 7.69) (b) 7.10 (2.03 to 25.03) (**) Poisson regression model controlled for age, MMR dose number, MCO site, and gender |
| Self‐controlled case series | Children aged 12 to 24 months discharged from hospital in 5 districts in England (Ashford, Leicester, Nottingham, Preston, and Chorley & Ribble) for varying periods between October 1988, and February 1993. Readmissions within 72 h with the same diagnosis were counted as 1 episode. n = 952 children | Idiopatric thrombocytopenic purpura (ICD 287.3) children aged between 366 and 730 days | MMR vaccine: Urabe mumps strain Jeryl Lynn mumps strain Rubella strain not specified Exposure risk period: (a1) 6 to 11 days (1 to 2 weeks after vaccination) (a2) 15 to 35 days (3 to 5 weeks after vaccination) Control period: (b) for each vaccine was defined as the time not included in a risk period. The analyses were adjusted for age and were grouped in 6 equal intervals of about 2 months. | Authors' conclusion: we demonstrated a causal association between ITP and MMR vaccination, with an absolute risk of 1 in 24,000 doses and an attributable risk of 1 in 29,000 doses. | Any strain (a1) 0 cases (a2) 4 cases | rr (95% CI)(*) (a2) 6.44 (1.94 to 21.4) (*) Poisson regression |
| Self‐controlled case series | Multicountry The chosen study population was children aged 12 to 23 months (365 to 732 days). | Thrombocytopenic purpura The case definition for TP was based only on the presence of a relevant ICD‐10 code (D69.3) or ICD‐8 code (287.10) in 1 of the diagnostic discharge fields. First episodes were defined as the earliest record found for an individual, further episodes were initially required to be at least 14 days since a previous episode (to prevent double counting of episodes). In England cases (based on ICD‐10) occurring between 1 April 1996 and 31 March 2007 were linked using NHS number or gender/date of birth/postcode to immunisation records. In Denmark the Central Person Registry (CPR) was used to construct a nationwide cohort consisting of all Danish children born in the period 1 January 1990 to 31 December 2007 (∼1.2 million children). | MMR vaccine: not described Risk periods: (post‐MMR) (a) 0 to 13 days (b) 14 to 27 days (c) 28 to 42 days (d) 0 to 42 days Reference period pre‐vaccination (e) −7 to −1 days (to allow for a vaccination being delayed if the child was ill) | Authors' conclusion: this study gave consistent estimates of the relative incidence of TP following MMR vaccination in 1‐year‐olds. The 95% CI for the attributable risk of TP can be calculated based on the 95% CI for the relative incidence and gives an interval of 1 in 74,000 to 1 in 40,000 doses. | (a) 12 cases (b) 26 cases (c) 17 cases (d) 55 cases | rr (95% CI)(*) (a) 1.30 (0.71 to 2.38) (b) 2.87 (1.85 to 4.46) (c) 1.81 (1.07 to 3.05) (d) 1.98 (1.41 to 2.78) (*) adjusting for age, period, country, and country‐age interaction |
| Self‐controlled case series | Children < 18 years old (confirmed ITP cases) who had been vaccinated while actively enrolled in their respective health plans. This investigation was conducted in 5 healthcare systems (Kaiser Permanente: Colorado, Hawaii, Georgia, Northern California, and Harvard Vanguard Medical Associates) by using data from the years 2000 to 2009. | Thrombocytopenic purpura Case was defined as a child aged 6 weeks to 18 years with a platelet count of ≤ 50,000/μL, with normal red and white blood cell indices, and the presence of clinical signs and symptoms of ITP, such as petechiae, significant bruising, or spontaneous bleeding. | MMR, MMRV vaccine: not described Follow‐up time: 365 days before and after vaccination. Exposed period: 1 to 42 days after vaccination for all vaccines. Unexposed period: defined as the time before and after the exposed period within 365 days of follow‐up before or after vaccination. | Authors' conclusion: none of the routine childhood vaccines given in the first year of life was significantly associated with an increased risk of ITP. For vaccines routinely administered at 12 to 19 months of age, there was a significant association of ITP with MMR. There was no increased risk of ITP (calculated when not given simultaneously with MMR or MMRV). There were 1.9 cases of ITP per 100,000 doses of MMR. | Exposed cases versus unexposed cases (a) 12 to 19 months (a1) MMR: 6 versus 5 (a2) MMRV: 4 versus 6 (b) 4 to 6 years (b1) MMR: 2 versus 7 (b2) MMRV: 0 versus 5 (c) 11 to 17 years (c1) MMR: 0 versus 1 | rr (95% CI) (a1) 5.48 (1.61 to 18.64) (a2) 2.87 (0.78 to 10.56) (b1) 3.06 (0.42 to 22.30) (b2) not estimable (c1) not estimable |
| Self‐controlled case series | For this study, WHO selected 26 sentinel sites (49 hospitals) distributed in 16 countries of the 6 WHO regions. The study population included children aged 9 to 23 months admitted to a network‐participating hospital during January 2010 to March 2014, with a discharge diagnosis of either aseptic menigitis or immune thrombocytopenic purpura. | Immune thrombocytopenia ICD‐9 codes in first discharge diagnosis position: 287.30 to 287.39 Primary thrombocytopenia 287.41 to 287.49 Secondary thrombocytopenia 287.5 Thrombocytopenia, unspecified ICD‐10 codes in first discharge diagnosis position: D69.3, D69.4 (D69.41 to D69.43) Primary thrombocytopenia D69.5 (D69.51, D69.59) Secondary thrombocytopenia D69.6 Thrombocytopenia, unspecified | Vaccine (measle strain) (mumps strain) Priorix, GSK (Schwarz) (RIT 4385a) (Schwarz) (Urabe AM9) Risk period 8 to 35 days Washout periods 1 to 7 days 36 to 42 days Control period 43 to 84 days | The elevated risk of ITP following measles‐containing vaccination is consistent with the literature (db‐O'Leary 2012: db‐France 2008). Our strain‐specific unadjusted | In 16 countries n = 183 ITP cases ‐‐‐‐‐‐‐‐‐‐‐‐‐‐‐‐‐‐‐‐‐‐‐‐‐‐‐‐‐‐‐‐‐‐‐‐‐‐‐‐‐‐‐‐‐‐‐ (risk versus control) period (a) overall (36 versus 12) (b) overall (excluding Iran) (36 versus 8) (c) AIK‐C/Edmonston‐Zagreb/Schwarz (2 versus 5) (d) Edmonston‐Zagreb (7 versus 1) (e) Enders' Edmonston (11 versus 3) (f) Schwarz (14 versus 1) (g) Shanghai‐191 (0 versus 1) | rr (95% CI) adjusted (a) 5.6 (2.7 to 11.9) (b) 9.1 (3.7 to 22.3) (c) 0.54 (0.08 to 3.6) (d) 8.4 (0.7 to 100.3) (e) 28.7 (1.9 to 443.5) rr (95% CI) unadjusted (f) 20.7 (2.7 to 157.6) (g) not estimable |
| Case cross‐over | Population‐based study in France including all children newly diagnosed for primary ITP between July 2009 and June 2015. n = 2549 | Immune thrombocytopenia | MMR vaccine: not described Exposed period 6‐week interval immediately preceding the event (frequency of exposure to vaccines) Control period (1) 6 weeks, 6 months before (2) 6 weeks, 3 months before the case period | Conclusion: in this nationwide study, no significant risk was observed for vaccines against DTP, pneumococcus, meningococcus, and HBV. The increased risk of MMR‐induced ITP is shown in children (previously demonstrated as lower than after the natural infection with measles). Vaccine‐induced ITP remains an exceptional adverse drug reaction, including for MMR vaccines. The numbers of attributable cases per million MMR doses dispensed were 9.8. | n = 492 patients included in analysis | OR (95% CI) 1.62 (1.21 to 2.16) |
| Case‐only ecological study | Pharmacovigilance reports: case observed after vaccine administration between 1984 and 30 June 1992 (n = 60). Estimated number of administered vaccine doses was 9,205,483. | Thrombocytopenic purpura Acute haemorrhagic syndrome associated with platelet count of < 100,000/mm³, all cases within 45 days of vaccination, over 8‐year period | MMR vaccine: (a) ROR, Trimovax (measles Schwarz strain, mumps Urabe AM9 strain, rubella Wistar RA 27/3 M strain) Other measles‐containing vaccines: (b) Rouvax (measles Schwarz strain) (c) Rudi‐Rouvax (measles Schwarz strain, rubella Wistar RA 27/3 M strain) Other vaccine: (d) Rudivax (rubella Wistar RA 27/3 M strain) + DTbis (e) Rudivax (rubella Wistar RA 27/3 M strain, diptheria, tetanus) (e) Imovax Oreillons (mumps Urabe AM9 strain) 2 to 45 days following immunisation | Authors' conclusion: according to the clinical course and biologic findings, vaccine‐associated TP appears to be similar to that occurring after natural measles or rubella infections and is not distinguishable from acute childhood idiopathic thrombocytopenic purpura not associated with vaccination. Such observation, combined with a clear temporal relationship between MMR vaccination and occurrence of TP, make a causal relationship highly plausible. Nevertheless, the incidence of these events remains relatively low with a favourable immediate outcome. | Case/doses (a) 42/4,396,645 ‐‐‐ (b) 2/860,938 (c) 12/1,480,058 ‐‐‐ (d) 4/2,295,307 (e) 0/172,535 | Incidence x 100,000 doses (95% CI)(*) (a) 0.96 (0.71 to 1.29) ‐‐‐ (b) 0.23 (0.06 to 0.85) (c) 0.81 (0.46 to 1.42) ‐‐‐ (d) 0.17 (0.07 to 0.45) (e) 0.00 (0.00 to 2.23) (*) confidence intervals were recomputed by Wilson 1927 method. |
| CI: confidence interval | ||||||
| Study ID and design | Population | Outcome definition | Exposure | Findings | Crude data | Estimate (95% CI) |
|---|---|---|---|---|---|---|
| Case‐control | Cases (n = 288) children (aged > 1 month and ≤ 18 years) hospitalised with a diagnosis of Henoch‐Schönlein purpura through the emergency departments (11 Italian paediatric hospitals/wards spread throughout the country (Treviso, Padua, Naples, Genoa, Turin, Florence, Perugia, Palermo, Messina, and Rome, with 2 centres)). Control (n = 617) children hospitalised for gastroduodenal lesions were considered as appropriate controls, since they represent an acute condition admitted through the emergency departments in the same clinical centres in which cases were identified. | Henoch‐Schönlein purpura All children hospitalised with a diagnosis of HSP at admission were included as cases. Discharge diagnosis was retrieved from clinical records and validated by clinicians, according to EULAR/PRINTO/PRES criteria for classification of HSP. Validation was conducted retrieving data from individual patient clinical records, blinded with respect to drug and vaccine exposure. Only validated cases were analysed. | Vaccines MMR | Conclusions: the association between MMR vaccination and HSP confirms previous published findings and adds a risk estimate. Further studies are needed to increase our understanding of the role of drugs and vaccines in the aetiology of HSP, a disease with important effects on health of children for its potential, though rare, chronic outcomes. This article confirms that HSP is a rare condition (288 children hospitalised in 14 years). Furthermore, the number of vaccinated cases was only 8, suggesting a very low absolute risk of the condition in children vaccinated with MMR vaccine. The benefit/risk profile of MMR vaccine is thus not affected by our results, being that MMR vaccination is an effective and safe tool against serious diseases in childhood. | N cases vaccinated/ 8/228 versus 6/617 | OR (95% CI)(*) 3.4 (1.2 to 10.0) (*) Adjusted by age |
| CI: confidence interval | ||||||
| Study ID and design | Population | Outcome definition | Exposure | Findings | Crude data | Estimate (95% CI) |
|---|---|---|---|---|---|---|
| Cohort study | A cohort of children born from 1 January 1990 to 31 December 2000 from the Danish Civil Registration System (n = 739,694) | Type 1 diabetes: information on the diagnosis of type 1 diabetes from 1 January 1990 through 31 December 2000 was obtained from the Danish National Hospital Register. From 1990 through 1993, Denmark used a modified version of the ICD‐8. From 1994 through 2001, the ICD‐10 was used. The authors used codes 249 and E10 (the code 249 does not exist in the standard World Health Organization version of the ICD‐8) to identify all cases of type 1 diabetes. Beginning in 1995, visits to the emergency room and outpatient visits were included in the National Hospital Register. (n = 681 cases of type 1 diabetes) | MMR vaccine: measles Moraten strain, mumps Jeryl Lynn strain, rubella Wistar RA 27/3 strain. Schedule 15 months and 12 years of age; composition: (a1) 1 dose (a2) unknown (b) unvaccinated | Authors' conclusion: these results do not support a causal relation between childhood vaccination and type 1 | All children (a1) 499/293,428 (a2) 58/412,830 (b) 124/1,373,401 Children with at least 1 sibling with type 1 diabetes (a1) 20/2795 (a2) 0/361 (b) 6/1053 | rr (95% CI)(*) All children (a1) 1.14 (0.90 to 1.45) (a2) 1.04 (0.71 to 1.52) Children with at least 1 sibling with type 1 diabetes (a1) 0.86 (0.34 to 2.14) (a2) ‐ (‐ to ‐) (*) Poisson log linear regression |
| Cohort study | Cohort of children recruited: between 1989 and 2000, a total of 1650 offspring of patients with T1D were recruited for the BABYDIAB study and were followed for 23,856 patient years. Between 2000 and 2006, 791 additional offspring or siblings of patients with T1D were screened in the context of the BABYDIET study and were followed by using the BABYDIAB protocol for 6358 patient years. | Islet autoimmunity: type 1 diabetes: (T1D) is one of the most common chronic diseases in childhood. The disease is preceded by a preclinical period of islet autoimmunity, which most commonly develops in early infancy. Factors that induce a strong immune response in early life might thus be relevant for the development of T1D‐associated islet autoimmunity. Islet autoantibodies were measured in venous blood samples from scheduled visits. Children in the BABYDIAB study had scheduled visits at birth, at age 9 months, and at 2, 5, 8, 11, 14, 17, and 20 years of age, whereas children in the BABYDIET study had 3‐monthly visits from birth until the age of 3 years, and yearly until the age of 12 years. Measurement of islet autoantibodies in these studies has been described elsewhere. Islet autoimmunity was defined as the development of persistent autoantibodies to 1 or more of the antigens insulin, GAD65, IA‐2 or Zn‐T8, with sample values above the 99th percentile of published population control children classified as positive. In case of single positive antibodies against insulin or GAD65, affinity and epitope reactivity was determined and children with low‐affinity antibodies (< 109 L/mol) were not classified as islet autoantibody positive, as these isolated antibody signals are not T1D specific and are not associated with increased T1D risk. Persistence was defined as positive in at least 2 consecutive samples. Islet autoantibody assays were evaluated according to the Diabetes Autoantibody Standardization Program. | MMR vaccine not described Age (a) 0 to 24 months | Conclusions: the authors found no evidence that early vaccinations increase the risk of T1D‐associated islet | Total n = 1918 n = 1779 children without confirmed islet autoimmunity n = 139 confirmed islet autoimmunity | HR (95% CI)(*) (a) 1.08 (0.96 to 1.21) (*) Cox regression |
| CI: confidence interval | ||||||
| Study ID and design | Population | Outcome definition | Exposure | Findings | Crude data | Estimate (95% CI) |
|---|---|---|---|---|---|---|
| Cohort study | Children (0 to 6 years) enrolled in VSD project (4 HMOs) between 1991 and 1997 (n = 167,240) | Asthma: a child had to meet 1 of the following criteria: (1) at least 1 diagnosis of asthma ICD‐9 Code 493 and at least 1 prescription for an asthma medication; the first diagnosis and first prescription had to be within a 2‐year period. Asthma medications included oral or inhaled beta‐agonists, theophyllin, oral or inhaled corticosteroids, cromolyn sodium, adrenergic drugs not elsewhere specified, and unclassified asthma medications; (2) at least 1 prescription for an inhaled beta‐agonist and at least 1 prescription for cromolyn within a 2 year period; (3) at least 5 prescriptions for asthma medications during a 2‐year period. (Total asthma cases n = 18,407) | MMR vaccine: not reported Exposure to MMR vaccine (and other vaccines). Vaccinations were ascertained through computerised immunisation tracking systems, and onset of asthma was identified through computerised data on medical care encounters and medication dispensing. | Conclusion: there is no association between | Not reported | rr (95% CI)(*) 0.97 (0.91 to 1.04) (*) adjusted rr estimated from a proportional hazard regression model stratified by HMO and month and year of birth, gender, low birthweight status |
| Cohort study | Children (n = 16,470) aged from 20 months to 11 years, accounting for 69,602 person‐years n = 29,238 n = 20,845 vaccinated n = 8393 unvaccinated | Asthma: diagnoses of asthma/wheeze and eczema from the Oxford Medical Information System (which was derived from the ICD‐8) and Read codes (hierarchical codes commonly used in GP practices in England) diagnoses of asthma n = 1753 n = 28 (amongst unvaccinated) | MMR vaccine: not reported Vaccination status extracted from West Midlands General Practice Research Database. Data are presented (a1) 0 to 6 (a2) 7 to 10 (a3) 11 to 16 (a4) > 16 | Conclusion: the study data suggest that currently recommended routine vaccinations are not a risk factor for asthma or eczema. In this observational study analysing computerised primary care records, the authors found an association between MMR and DPT vaccination and the incidence of asthma and eczema, but these associations appeared to be limited to the minority of children who rarely seek care from a GP. This limited association is more likely to be the result of bias than a biological effect. | Cases vaccinated/PT‐years versus cases unvaccinated/PT‐years ‐‐‐‐‐‐‐‐‐‐‐‐All‐‐‐‐‐‐‐‐‐‐‐‐‐‐‐‐ (a) 1725/65,597 versus 28/4006 ‐‐‐‐‐‐‐‐‐‐‐‐‐‐‐‐‐‐‐‐‐‐‐‐‐‐‐‐‐‐‐ stratified by consulting frequency in first 18 months (a1) 165/12,462 versus 5/2843 (a2) 351/17,522 versus 7/425 (a3) 601/20,693 versus 8/452 (a4) 608 /14,920 versus 8/286 | rr (95% CI)(*) (a) 2.2 (1.50 to 3.21) (a1) 7.18 (2.95 to 17.49) (a2) 0.95 (0.45 to 2.01) (a3) 1.36 (0.68 to 2.73) (a4) 1.21 (0.60 to 2.43) (*) Adjusted rr estimated from a proportional hazard regression model stratified by consulting frequency, parental smoking, parental allergic disease, maternal age, number of older siblings, use of antibiotics early in life, year of birth, and GP practice. |
| Cohort study | Danish birth cohorts 1991 to 2003 followed up between 1 January 1991 and 31 December 2003, or between 1 and 5 years of age | Asthma hospitalisation: inpatient hospitalisation with asthma diagnosis (occurred between 1 January 1992 and 31 December 2004)
n = 871,234 children (vaccine coverage 85%) PT = 2,926,406 (person‐years) n = 26,880 hospitalisations amongst 17,885 children ‐‐‐‐‐‐‐‐‐‐‐‐‐‐‐‐‐‐‐‐‐‐‐‐‐‐‐‐‐‐‐ Anti‐asthma medication: prescription of the following cases of anti‐asthma medications have been considered:
n = 600,938 children (vaccine coverage 84%) PT = 1,858,199 (person‐years) n = 833,424 prescriptions anti‐asthma medication amongst 248,907 children | MMR vaccine: Measles Moraten strain, Mumps Jeryl Lynn strain, Rubella Wistar RA 27/3 strain. Dates of MMR vaccination were obtained from the National Board of Health. | Conclusion: these results are compatible not with an increased risk of asthma following MMR vaccination, but rather with the hypothesis that MMR vaccination is associated with a reduced risk of asthma‐like disease in young children. | (a) Asthma (b) Status asthmaticus (c) Anti‐asthma medication | rr (95% CI)(*) (a) 0.75 (0.73 to 0.78) (b) 0.63 (0.49 to 0.82) (c) 0.92 (0.91 to 0.92) (*) Adjusted for age, calendar period, hospitalisations propensity in infancy, birthweight, place of birth, mother’s country of birth, infant vaccine compliance, birth order, maternal age at birth, and child’s sex. Log‐linear Poisson regression. |
| Cohort study | Participants were aged between 22 and 44 years n = 309 | Participants were surveyed by a validated interviewer‐administered questionnaire covering: history of asthma; details of home and occupation environment; smoking history; medications; dietary information; and respiratory symptoms. The respiratory symptoms included wheezing or whistling in the chest, shortness of breath, chest tightness, and cough and phlegm during the previous 12 months. Atopy was assessed by skin prick testing to common aeroallergens. | MMR vaccine not described Questionnaire included vaccination history questions, which were not included in the questionnaire used by the other study centres. Vaccination history included measles or MMR vaccinations; hepatitis B; Bacille Calmette‐Guérin (BCG); oral polio vaccine (OPV); and diphtheria, tetanus, and whooping cough (DTP). | Conclusion: there was no significant association observed for participants diagnosed with asthma who had received measles or MMR vaccinations compared with those who did not receive measles or MMR vaccinations. | (a) Asthma (b) Atopy | RR (95% CI) (a) 1.33 (0.98 to 1.80) (b) 1.07 (0.88 to 1.30) |
| Cohort study | n = 640 children were followed from birth. Follow‐up examinations at ages 5, 7 and 13 years included a physical examination and a maternal questionnaire about the child’s health. | Asthma (and dermatitis eczema) At child's age 5, parents were asked whether the child was suspected to suffer from asthma or had been diagnosed with asthma, hypersensitivity, or allergy. At ages 5, 7, and 13 years, the same paediatrician determined the presence of current wheezing by auscultation. At the same ages, the paediatrician also examined all children for dermatitis/eczema. At age 13, the findings from this examination were graded according to a score for atopic dermatitis (SCORAD). At age 7, a blood sample was drawn and total IgE and grass‐specific IgE were quantified. At age 13, parents were asked whether the child had ever suffered from asthma. In accordance with the International Study of Asthma and Allergies in Childhood (ISAAC), they were also asked to | MMR vaccine: not described The Faroe Islands follow the Danish vaccination schedule, in which MMR vaccination, at the time of this study, was administered at age 15 months and 12 years (Fig. 1). There were no specific contraindications. At the 5‐year examination, the child’s vaccination card was inspected and all vaccination dates were registered. At child's age 13, the mothers were asked whether the child had received the MMR vaccination scheduled at 12 years of age. | Conclusion: the authors' findings support the notion that MMR vaccination may provide beneficial effects in preventing childhood allergy and asthma. | Asthma (a) 5 years old (b) 13 years old | OR (95% CI) (a) 0.33 (0.12 to 0.90)(*) (b) 0.22 (0.08 to 0.56)(*) (a) 0.32 (0.10 to 1.05)(*)(**) (b) 0.16 (0.05 to 0.53)(*)(**) RR (95% CI)(***) (a) 0.44 (0.18 to 0.93)(*) (b) 0.35 (0.14 to 0.71)(*) (*) Adjusted OR (logistic regression model) for birthweight and family history of chronic bronchitis/asthma. The analyses at age 13 years are additionally adjusted for whether the child had received the second MMR vaccine before the 13‐year examination. (**) Additional adjustment for sex, premature birth, maternal smoking during pregnancy, log (cord blood IgE), breastfeeding, number of older siblings, number of younger siblings, parental smoking in the home, day care, family history of eczema in children/allergic eczema/hay fever, family history of allergy, and age at the examination. (***) OR converted in RR (a) CER = 0.36 (b) CER = 0.47 |
| ACT: Asthma Control Test | ||||||
| Study ID and design | Population | Outcome definition | Exposure | Findings | Crude data | Estimate (95% CI) |
|---|---|---|---|---|---|---|
| Cohort study | Children (n = 14,353) aged from 20 months to 11 years, accounting for 59,520 person‐years | Eczema: diagnoses of asthma/wheeze and eczema from the Oxford Medical Information System (which was derived from the ICD‐8) and Read codes (hierarchical codes commonly used in GP in England) diagnoses of eczema n = 1884 | MMR vaccine: not reported Vaccination status extracted from West Midlands General Practice Research Database Data are presented (a1) 0 to 6 (a2) 7 to 10 (a3) 11 to 16 (a4) > 16 | Conclusion: the study data suggest that currently recommended routine vaccinations are not a risk factor for asthma or eczema. In this observational study analysing computerised primary care records, the authors found an association between MMR and DPPT vaccination and the incidence of asthma and eczema, but these associations appeared to be limited to the minority of children who rarely seek care from a GP. This limited association is more likely to be the result of bias than a biological effect. | Cases vaccinated/PT‐years versus Cases unvaccinated/PT‐years ‐‐‐‐‐‐‐‐‐‐‐‐‐‐‐All‐‐‐‐‐‐‐‐‐‐‐‐‐ (a) 1857/55,651 versus 27/3868 ‐‐‐‐‐‐‐‐‐‐‐‐‐‐‐‐‐‐‐‐‐‐‐‐‐‐‐‐‐‐ Stratified by consulting frequency in first 18 months (a1) 244/10,625 versus 6/2768 (a2) 457/14,293 versus 7/402 (a3) 601/17,427 versus 9/400 (a4) 555/13,306 versus 5/297 | rr (95% CI)(*) (a) 3.50 (2.38 to 5.15) (a1) 10.4 (4.61 to 23.29) (a2) 1.57 (0.75 to 3.32) (a3) 1.36 (0.71 to 2.64) (a4) 2.21 (0.92 to 5.33) (*) Adjusted rr estimated from a proportional hazard regression model stratified by consulting frequency, parental smoking, parental allergic disease, maternal age, number of older siblings, use of antibiotics early in life, year of birth, and GP practice. |
| Cohort study | n = 640 children were followed from birth. Follow‐up examinations at ages 5, 7, and 13 years included a physical examination and a maternal questionnaire about the child’s health. | Asthma and dermatitis eczema At age 5, parents were asked whether the child was suspected to suffer from asthma or had been diagnosed with asthma, hypersensitivity, or allergy. At ages 5, 7, and 13 years, the same paediatrician determined the presence of current wheezing by auscultation. At the same ages, the pediatrician also examined all children for dermatitis/eczema. At age 13, the findings from this examination were graded according to a score for atopic dermatitis (SCORAD). At age 7, a blood sample was drawn and total IgE and grass‐specific IgE were quantified. At child's age 13, parents were asked whether the child had ever suffered from asthma. In accordance with the International Study of Asthma and Allergies in Childhood (ISAAC), they were also asked to indicate whether the child had (i) suffered from wheezing in the past 12 months, (ii) suffered from sneezing, running, or blocked‐up nose except for when the child had a cold or was sick in the past 12 months, and, if so, whether it was accompanied by itching running/tearing eyes (current rhinoconjunctivitis symptoms), and (iii) whether the child had ever suffered from an itching rash that comes and goes for at least 6 months (eczema ever). At age 13, the children underwent a skin prick test with extracts of 5 common allergens (birch/grass pollen, dog/cat dander, and house dust mite (Dermatophagoides pteronyssinus)). | MMR vaccine: not described The Faroe Islands follow the Danish vaccination schedule, in which MMR vaccination, at the time of this study, was administered at age 15 months and 12 years (Fig. 1). There were no specific contraindications. At the 5‐year examination, the child’s vaccination card was inspected and all vaccination dates were registered. At child's age 13, the mothers were asked whether the child had received the MMR vaccination scheduled at 12 years of age. | Conclusion: there is no association between | Eczema (a) 5 years old (b) 13 years old | OR (95% CI) (a) no data (*) (b) 0.73 (0.26 to 2.10) (*) (a) no data (*) (**) (b) 0.46 (0.14 to 1.52) (*) (**) RR (95% CI) (***) (a) no data (*) (b) 0.75 (0.28 to 1.87) (*) (*) Adjusted OR (logistic regression model) for birthweight and family history of chronic bronchitis/asthma. The analyses at age 13 years are additionally adjusted for whether the child had received the second MMR vaccine before the 13‐year examination. (**) Additional adjustment for sex, premature birth, maternal smoking during pregnancy, log (cord blood IgE), breastfeeding, number of older siblings, number of younger siblings, parental smoking in the home, day care, family history of eczema in children/allergic eczema/hay fever, family history of allergy, and age at the examination. (***) OR converted in RR (a) no data (b) CER = 0.11 |
| CER: control event rate | ||||||
| Study ID and design | Population | Outcome definition | Exposure | Findings | Crude data | Estimate (95% CI) |
|---|---|---|---|---|---|---|
| Case‐control | n = 76,310 children from GPRD born between 1989 and 1993 from 464 general practices, and within a DIN cohort of n = 40,183 children born between 1989 and 1997 from 141 general practices. From GPRD cases = 3859 controls = 3859 From DIN cases = 2611 controls = 2611 | Hay fever Case certain (Definition I): a child with hay fever diagnosis before 24 months of age, and a second diagnosis of hay fever or a relevant therapy in a subsequent years and with a third diagnosis or a relevant therapy in a further year. Case certain (Definition II): a child without first diagnosis before 24 months of age, but with a second diagnosis of hay fever or a relevant therapy in subsequent year. Case less certain (Definition I): a child as a case certain (Definition I) without third diagnosis of hay fever or a relevant therapy in a further year. Case less certain (Definition II): a child with at least a hay fever diagnosis, even if there is not a second diagnosis or a relevant therapy in a subsequent year. The cases and controls were children with at least 5 years of follow‐up from birth and registered “within the practice within 3 months of birth”. Only codes synonymous with "allergic rhinitis” and with seasonal variation in recording were permitted. From GPRD and DIN database. | MMR vaccine: (first entries) MMR II The time categories for MMR immunisation: (a) 1st to 13th month (b) 14th month (c) 15th month (d) 16th month (e) 17th month (f) 18th to 24th month (g) ≥ 25th month (h) no MMR vaccine | Conclusions: this study shows that infants vaccinated with MMR are at no greater or lesser risk of developing hay fever than unvaccinated children. This should reassure parents and clinicians, and no opportunity should be missed to immunise. | n = (cases + controls) From GPRD (a) n = 1688 (b) n = 2311 (c) n = 1638 (d) n = 1183 (e) n = 510 (f) n = 618 (g) n = 234 (h) n = 210 From DIN (a) n = 1128 (b) n = 1769 (c) n = 1192 (d) n = 772 (e) n = 335 (f) n = 379 (g) n = 119 (h) n = 110 | OR (95% CI) From GPRD(*) (a) 0.97 (0.81 to 1.16) (b) 1.00 (1.00 to 1.00) (c) 0.89 (0.75 to 1.06) (d) 0.93 (0.75 to 1.14) (e) 0.96 (0.73 to 1.25) (f) 0.89 (0.70 to 1.14) (g) 0.83 (0.58 to 1.18) (h) 0.81 (0.53 to 1.24) From DIN(**) (a) 0.90 (0.71 to 1.16) (b) 1.00 (1.00 to 1.00) (c) 1.24 (1.00 to 1.53) (d) 0.96 (0.73 to 1.39) (e) 1.00 (0.69 to 1.45) (f) 1.01 (0.73 to 1.28) (g) 0.54 (0.31 to 0.95) (h) 0.82 (0.45 to 1.50) From GPRD‐DIN Pooled (fixed‐effect) 1.27 (0.93 to 1.72) (*) Adjusted for consultation (**) Adjusted for consultation frequency and restricted to |
| Case‐control | n = 76,310 children from GPRD born between 1989 and 1993 from 464 practices and within a DIN cohort of n = 40,183 children born between 1989 and 1997 from 141 general practices. case + controls = 13,523 | Hay fever risk in the first grass pollen season. Case of hay fever were children with diagnostic codes or treatment for hay fever, or both, after 2 years of age. Control was child that matched for general practice, sex, birth month, and follow‐up of control to at least date of diagnosis case. "Cases of hayfever were those who had diagnostic codes and/or treatment for hayfever, after 2 years of age”. From GPRD and DIN database. | MMR vaccine: MMR II exposure by 24 months in a grass pollen season (May, June, July) versus non‐pollen season exposure | Conclusion: in 2 population‐based birth cohorts, the authors have not Having MMR vaccine during grass pollen season by age 24 months (compared with MMR outside grass pollen season only) was not associated with an increased OR. | Cases + control out season = 9690 in season = 3833 | OR (95% CI)(*) 1.05 (0.94 to 1.18) (*) Odds ratios were pooled across databases (GPRD and DIN) using a fixed‐effect model. |
| Cohort study | n = 640 children were followed from birth. Follow‐up examinations at ages 5, 7, and 13 years included a physical examination and a maternal questionnaire about the child’s health. | Asthma (and dermatitis eczema) At child's age 5, parents were asked whether the child was suspected to suffer from asthma or had been diagnosed with asthma, hypersensitivity, or allergy. At ages 5, 7, and 13 years, the same paediatrician determined the presence of current wheezing by auscultation. At the same ages, the paediatrician also examined all children for dermatitis/eczema. At age 13, the findings from this examination were graded according to a score for atopic dermatitis (SCORAD). At age 7, a blood sample was drawn and total IgE and grass‐specific IgE were quantified. At age 13, parents were asked whether the child had ever suffered from asthma. In accordance with the International Study of Asthma and Allergies in Childhood (ISAAC), they were also asked to | MMR vaccine: not described. The Faroe Islands follow the Danish vaccination schedule, in which MMR vaccination, at the time of this study, was administered at age 15 months and 12 years (Fig. 1). There were no specific contraindications. At the 5‐year examination, the child’s vaccination card was inspected and all vaccination dates were registered. At child's age 13, the mothers were asked whether the child had received the MMR vaccination scheduled at 12 years of age. | Conclusion: the authors' findings support the notion that MMR vaccination may | Rhinoconjunctivitis (a) 5 years old (b) 13 years old Hypersensitivity/allergy (a) 5 years old (b) 13 years old | OR (95% CI) Rhinoconjunctivitis (a) no data (*) (b) 0.64 (0.19 to 2.07) (*) (a) no data (*)(**) (b) 0.63 (0.14 to 2.71) (*)(**) Hypersensitivity/allergy (a) 0.32 (0.11 to 0.88) (*) (b) no data (*) (a) 0.36 (0.11 to 1.21) (*)(**) (b) no data (*)(**) (*) Adjusted for birthweight and family history of chronic bronchitis/asthma. The analyses at age 13 years are additionally adjusted for whether the child had received the second MMR vaccine before the 13‐year examination. (**) Additional adjustment for sex, premature birth, maternal smoking during pregnancy, log (cord blood IgE), breastfeeding, number of older siblings, number of younger siblings, parental smoking in the home, day care, family history of eczema in children/allergic eczema/hay fever, family history of allergy, and age at the examination. |
| CI: confidence interval | ||||||
| Study ID and design | Population | Outcome definition | Exposure | Findings | Crude data | Estimate (95% CI) |
|---|---|---|---|---|---|---|
| case control | Cases: patients with leukaemia or acute lymphoblastic leukaemia, aged 0 to 14 years identified within the NCCLS between 1995 and 2002. Controls: matched to cases for date of birth, gender, Hispanic status (either parent Hispanic), maternal race (white, African‐American, or other), and maternal county of residence, by means of birth certificates. Population coverage initially includes 17 countries in the Greater San Francisco Bay Area, and since 1999 was expanded to a further 18 countries in Northern and Southern California. The present study relies on cases of leukaemia ascertained between 1995 and 2002. | Leukaemia Acute lymphoblastic leukaemia Within the NCCLS, incident leukaemia cases were ascertained from major paediatric clinical centres within 72 hours after diagnosis. To be eligible, each case or control had to:
| MMR vaccine: not reported Complete vaccination record was requested to primary caretakers of case or control participants. (d1) 1 dose (d2) ≥ 2 doses (d0) unvaccinated (a) Leukaemia (a1) born in or before 1995 (a2) born after 1995 (b) Acute lymphoblastic leukaemia (b1) born in or before 1995 (b2) born after 1995 | Conclusion: Each dose of Hib vaccination was associated with a significantly reduced risk of childhood leukaemia, whilst the history of DPT, poliomyelitis, and MMR vaccinations did not differ between cases and controls. | N cases vaccinated/ Leukaemia (0 to 14 years) (d1) 176/323 versus 219/409 (d2) 123/323 versus 162/409 (d0) 24/323 versus 28/409 Leukaemia (> 1 years) (d1) 175/308 versus 219/392 (d2) 123/308 versus 162/392 (d0) 10/308 versus 11/392 ‐‐‐‐‐‐‐‐‐‐‐‐‐‐‐‐‐‐‐‐‐‐‐‐‐‐‐‐‐‐‐‐‐‐‐‐‐‐‐ Acute lymphoblastic leukaemia (a) cases = 282; controls = 360 (b1) born in or before 1995 (b2) born after 1995 cases = 270; controls = 346 | OR (95% CI) leukaemia (*) (a) 1.06 (0.69 to 1.63) (a1) 0.94 (0.75 to 1.53) (a2) 0.79 (0.35 to 1.78) Acute lymphoblastic leukaemia(*) (b) 0.87 (0.55 to 1.37) (b1) 0.95 (0.56 to 1.60) (b2) 0.65 (0.24 to 1.72) (*) Adjusted for maternal education and household income |
| Case‐control | Cases: patients with acute lymphoblastic leukaemia aged 0 to 14, diagnosed between 1989 and 1993. Participants who resided in Illinois, Indiana, Iowa, Michigan, Minnesota, New Jersey, Ohio, Pennsylvania, or Wisconsin at the time of diagnosis were eligible for the vaccination component of the study. Controls: selected through random‐digit dialling were individually matched to the cases by age (within 25% of the corresponding case's age at diagnosis), the first 8 digits of the telephone number, and race (African‐American/white/other). | Acute lymphoblastic leukaemia | MMR vaccine: not reported | Conclusion: the MMR vaccine does not alter the risk of subsequent acute lymphoblastic leukaemia. | cases = 395; controls = 394 | OR (95% CI)(*) 1.19 (0.67 to 2.10) (*)conditional logistic regression adjusted for age at censoring, year of birth, sex, race, family income, parental education, and attendance at day care and/or preschool |
| Case‐control | Each case of acute leukaemia incident in 2003 to 2004 in a child aged < 15 years, residing in France at the time of diagnosis and with no previous history of malignancy, was eligible. Theleukaemia cases(n = 726) were recruited directly by investigators assigned to each French paediatric oncology hospital department, with the support of the French National Registry of Childhood Haematopoietic Malignancies. The controls (n = 1681) were randomly selected from the French population using quotas, a priori determined to make the control group representative of all cancer cases in terms of age and gender. | (a)Acute leukaemia (b)Acute lymphoblastic leukaemia (c)Acute myeloblastic leukaemia All the childhood leukaemia cases were confirmed by bone marrow analysis. Children whose mother did not speak French or who had been adopted were not eligible. | MMR vaccine: not reported Note: the study shows measle‐mumps‐rubella vaccination separately, probably because for the study each mother was asked to read out each page of the vaccination record, line by line. | Conclusion: no association between vaccination and the risk of childhood acute leukaemia: acute lymphoblastic leukaemia or acute myeloblastic leukaemia was observed. No relationship between the risk of leukaemia and the type of vaccine, number of doses of each vaccine, total number of injections, total number of vaccine doses, or number of early vaccinations was evidenced. No confounding factor was observed. The study did not show any evidence of a role of vaccination in the aetiology of childhood leukaemia. | N cases vaccinated/ (a) 541/618 versus 1110/1258 (b) 480/554 versus 1110/1258 (c) 50/62 versus 1110/1258 | OR (95% CI) (a) 0.94 (0.70 to 1.26) (b) 0.86 (0.64 to 1.17) (c) 0.56 (0.29 to 1.07) |
| Case‐control | The eligible cases were newly diagnosed with childhood leukaemia (aged 0 to 14 years) 1990 to 1993, and born and resident in New Zealand. Controls (matched 1:1 to cases on age and sex) were selected randomly from the New Zealand‐born and resident childhood population, using national birth records. Each control’s birth was registered in the same quarter of the same year as the matched case. Adopted children were not eligible. | Acute lymphoblastic leukaemia n = 97 matched pairs | MMR vaccine not described. Vaccination histories were supplemented with information from parent‐held ‘Health and Development’ records. | Conclusion: for MMR, no association was found with leukaemia. | N cases vaccinated/ 6/118 versus 15/272 | OR (95% CI) (*) 0.8 (0.26 to 2.42) (*)unconditional logistic regression adjusted for age, sex, child’s social class, child’s ethnic group, mother’s marital status, mother’s education, mother’s home ownership, household crowding, delay from reference date to interview, interview year. |
| CI: confidence interval | ||||||
| Study ID and design | Population | Outcome definition | Exposure | Findings | Crude data | Estimate (95% CI) |
|---|---|---|---|---|---|---|
| Cohort study | Residents in the great Gothenburg area (Sweden) born between 1959 and 1990. The study area was the greater Gothenburg area on the Swedish west coast, with 731,592 residents on 31 December 2000. | Multiple sclerosis (probable or definite) and clinically isolated syndromes. Incidence of multiple sclerosis (4 Poser's criteria) and clinically isolated syndrome with onset between 10 and 39 years of age was assessed in birth cohorts immunised within 4 vaccination programmes. The Gothenburg multiple sclerosis register was established from the 1950s. All records are reviewed with the following MS‐related diagnoses, according to the International Classification of Diseases (ICD) 10, 9, and 8: G359; 340; 340.99 multiple sclerosis; G368; G378; G379; 341W; 341.09 demyelinating disorders in the central nervous system; G360; 341A; 341.01 neuromyelitis optica; G369; 341X acute disseminated encephalomyelitis; G373 acute transverse myelitis: H46; 377D; 367.02 optic neuritis; H48,1; 367.03 retrobulbar neuritis. | MMR vaccine: not described. Different vaccination programmes carried out from 1971 with different vaccines (single‐component measle, mumps and rubella vaccine so as with MMR vaccine) having as target population children of different ages. 5 population birth cohorts were selected from the total incidence material: (0) born 1959 to 1961: the pre‐vaccine era; (1) born 1962 to 1966: monovalent rubella vaccine; (2) born 1970 to 1973: only received later dose of the MMR vaccine; (3) born 1974 to 1978: monovalent measles; (4) July 1981 to June 1984: combined MMR vaccine. | Conclusion: there was no significant change in the age‐ and gender‐specific incidence of MS in any of the selected cohorts compared with the incidence in the preceding selected birth cohorts. There was thus no significant change in MS incidence related to the implementation of the rubella vaccination programme in the 12‐year‐old female cohort born in 1962 to 1966 compared with the unvaccinated cohort born in 1959 to 1961. The incidence did not significantly change with all preceding selected cohorts as baseline, neither in the MMR‐vaccinated 12‐year‐old cohort born in 1970 to 1973, nor in the cohort born in 1974 to 1978, half of which were measles vaccinated in the preschool age and the majority MMR vaccinated at 12, nor in the cohort born in July 1981 to June 1984, which were MMR vaccinated at both 18 months and 12 years of age. Restricting the analyses to probable and definite MS cases did not change the results. | Incidence per 100,000 person‐years (‐) (male female) versus (male female) (*) (1) (14.98; 6.97) versus (17.61; 4.28) (*) including both the unvaccinated cohort 1959 to 1961 and the preceding vaccinated birth cohorts selected for this study, in the corresponding age groups | No data available for meta‐analysis |
| Case‐control study | Cases (n = 206): birth years 1959 to 1986, to be resident in the greater Gothenburg area (Sweden), MS onset from age of 10 years onwards, did attend the 6th school grade within study area, availability of CHSH records. Controls (n = 888): matched to cases for year of birth by random selection from the population register. Controls should have attended the 6th school grade within study area, and have available CHSH record. | Multiple sclerosis (probable or definite) and clinically isolated syndromes | MMR vaccine: not described MMR vaccination (vaccination with single‐component vaccines has also been considered). The second analysis was therefore restricted to the subgroup of the MMR vaccinations. The first analysis was restricted to the subgroup "MMR vaccination". 4 disjointed vaccination categories were defined: (0) no MMR vaccination; (1) early MMR vaccination only; (3) late MMR vaccination only; (4) both an early and a late MMR vaccination. Comparisons were made within the group of MMR vaccinations. | Conclusions: no significant association for vaccinated versus unvaccinated. | Cases = 206; controls = 888 | OR (95% CI) 1.13 (0.62 to 2.05) |
| Case‐control study | Case (n = 272): acute disseminated encephalomyelitis. Controls (n = 1096): for each ADEM case, 4 control individuals randomly selected from the same hospital with no history of ADEM were matched to the case according to year of birth (within 1 year), gender, and zip code (a surrogate measure for socioeconomic status) during the same period. The control participants were assigned the same index date as their matched case (symptom onset date). Controls were patients referred for headache (except trigeminal neuralgia), migraine, vascular, or other diseases which were thought not to modify the probability of vaccination. Patients with chronic severe neurological diseases or autoimmune diseases were excluded. | Acute disseminated encephalomyelitis: immune‐mediated From the Hospital Information Systems first mention of International Classification of Diseases, Tenth Revision (ICD‐10), diagnostic codes (G04.001, G04.002, G04.051, G04.903, and G04.912) for ADEM from 1 January 2011 to 31 December 2015, for individuals of any age. | MMR vaccine: not described | Conclusions: findings from the present study do not demonstrate an association of vaccines with an increased risk of ADEM and its recurrence among either paediatric (< 18 years) or adult (≥ 18 years) individuals within the 180 days after vaccinations. | 11/272 versus 36/1096 | OR (95% CI) adjusted estimate 1.03 (0.68 to 3.75) |
| ADEM: acute disseminated encephalomyelitis | ||||||
| Study ID and design | Population | Outcome definition | Exposure | Findings | Crude data | Estimate (95% CI) |
|---|---|---|---|---|---|---|
| Self‐controlled case series | Children hospitalised with gait disturbance between April 1995 and June 2001 (n = 127, age 12 to 24 months). Children with gait disturbance resulting from general practice visit General Practice Research Database. (GPRD archive), born between 1988 and 1997 (n = 1398, age 12 to 24 months) | (a) Hospitalisation for gait disturbance Review of hospital computerised records (April 1995 to June 2001, children aged 12 to 24 months) with ICD‐10 diagnoses related to acute gait disorder (G111, G112, G25, R26, R27, R29, H55, and F984). Cases were grouped into 5 categories, as follows: (1) presumptive viral/postviral ataxia (clinical history of ataxia and evidence of encephalomyelitis or cerebellitis with lymphocytosis in CSF or encephalographic changes); (2) probable postviral ataxia (history consistent with ataxia but CSF/other investigations inconclusive or not done and no other cause identified); (3) probably not postviral gait disturbance (vague symptoms not suggestive of cerebellar ataxia, e.g. unsteady gait associated with constipation or gastroenteritis); (4) non‐ataxic, non‐viral gait disturbance (including limp after trauma, septic bone or joint disease, unsteadiness following drug ingestion); (5) transient synovitis/‘‘irritable hip’’ (a transient condition described following viral illnesses and with no long‐term sequelae) ‐‐‐‐‐‐‐‐‐‐‐‐‐‐‐‐ (b) GP visits for gait disturbance For the analysis of gait disorders presenting in general practice, information on all children born from 1988 to 1997 with at least 2 years of continuous follow‐up from birth in a GPRD practice deemed as supplying data of research standard was obtained from the Office for National Statistics. Read and OXMIS codes that indicated a consultation for possible gait disturbance in children aged 12 to 24 months were identified by mapping to ICD‐9 codes and by searching on the following keywords: ataxia, gait, co‐ordination, mobility, movement. Read/OXMIS descriptive diagnoses cover a wide range, so were grouped into 6 categories for analysis: (A) ataxia (including cerebellar ataxia and ataxic gait); (B) unsteady/veering/shuffling gait; (C) gait abnormality ‐ unspecified; (D) limp/limping gait; (E) poor mobility; (F) abnormal /involuntary movements. | MMR vaccine: not reported (a) Risk period: after immunisation (a1) 0 to 30 days (a2) 31 to 60 days (a3) 0 to 60 days (b) Risk period after immunisation (b1) 0 to 5 days (b2) 6 to 30 days (b3) 31 to 60 days (b4) 6 to 60 days | Conclusion: this study provides no evidence that MMR vaccine causes acute ataxia or other gait disturbance and suggests that the cases observed were chance occurrences, reflecting background incidence. The increased incidence of consultation for any gait disturbance 0 to 5 days after MMR vaccination was attributable to an excess in categories of gait disturbance (B, unsteady; and C, unspecified) that was caused by a clear excess of consultations on the day that MMR was given. It is biologically implausible that any specific MMR effect would be manifest on the day of vaccination since the viraemia induced by the vaccine, which might produce symptoms, does not start until the end of the first week. | Hospitalisation for gait disturbance any (categories 2, 3, 5) n = 62 (a1) cases = 3 (a2) cases = 1 (a3) cases = 4 GP visits for gait disturbance All cases ((A) to (F)) (b1) cases = 31 (b2) cases = 69 (b3) cases = 102 (b4) cases = 171 | rr (95% CI) (*) (a1) 0.83 (0.24 to 2.84) (a2) 0.20 (0.03 to 1.47) (a3) 0.46 (0.16 to 1.35) ‐‐‐‐‐‐‐‐‐‐‐‐‐‐‐‐‐‐‐‐‐‐‐‐‐‐‐‐‐‐ (b1) 1.88 (1.30 to 2.72) (b2) 0.90 (0.70 to 1.17) (b3) 0.95 (0.77 to 1.19) (b4) 0.93 (0.78 to 1.12) (*) Poisson regression |
| CI: confidence interval | ||||||
| Study ID and design | Population | Outcome definition | Exposure | Findings | Crude data | Estimate (95% CI) |
|---|---|---|---|---|---|---|
| Self‐controlled case series | Infants aged 12 to 23 months hospitalised for viral or bacterial infection between April 1995 and May 2005 identified from hospital admission records (n = 2025 accounting for 2077 admissions) | Lobar pneumonia ICD‐9 codes: 481 ICD‐10 codes: J18.1 Invasive bacterial infections ICD‐9 codes: 036, 038, 320, 711.0, 730.0 ICD‐10 codes: A39, A40, A41, G00, M00, M86, J13X Encephalitis/meningitis ICD‐9 codes: not specified ICD‐10 codes: A85, A86, A87, A88, A89 Herpes ICD‐9 codes: not specified ICD‐10 codes: B00 Pneumonia ICD‐9 codes: not specified ICD‐10 codes: J12 Varicella zoster ICD‐9 codes: not specified ICD‐10 codes: B01, B02 Miscellaneous viral infections ICD‐9 codes: not specified ICD‐10 codes: B08, B09, B15, B17, B25, B27, B34 Review of computerised hospital admission records from North, East, and South London, Essex, East Anglia, Sussex, and Kent using ICD‐9 or ICD‐10 codes | MMR vaccine: not reported Excluded period from the background from −14 to −1 days before immunisation Risk period after immunisation (a1) 0 to 30 days (a2) 31 to 60 days (a3) 61 to 90 days (a4) 0 to 90 days | Conclusion: the study confirms that the MMR vaccine does not increase the risk of invasive bacterial or viral infection in the 90 days after the vaccination and does not support the hypothesis that there is an induced immune deficiency due to overload from multi‐antigen vaccines. | Total cases Lobar pneumonia (a1) cases = 57 Invasive bacterial infections (a1) cases = 30 Encephalitis/meningitis (a1) cases = 1 Herpes (a1) cases = 16 Pneumonia (a1) cases = 0 Varicella zoster (a1) cases = 17 Miscellaneous viral infections (a1) cases = 12 | rr (95% CI) (*) Lobar pneumonia (a1) 0.65 (0.48 to 0.86) Invasive bacterial infections (a1) 0.75 (0.51 to 1.12) Encephalitis/meningitis (a1) 0.54 (0.06 to 4.83) Herpes (a1) 1.00 (0.57 to 1.74) Pneumonia (a1) 0 (‐ to ‐) Varicella zoster (a1) 0.58 (0.34 to 0.99) Miscellaneous viral infections (a1) 0.71 (0.37 to1.37) (*)Poisson regression |
| Self‐controlled case series | Children aged 12 to 23 months admitted to hospital between April 1991 and March 1995 in selected districts in the Thames region of southern England. Total of 387 admissions with 1 or more of the bacterial infection codes and with a linked MMR vaccination record were identified; occurred in 387 children (169 in 165 females, and 226 in 222 males); 116 had a diagnosis of invasive bacterial infection and 279 had lobar pneumonia. | Lobar pneumonia Invasive bacterial infections Cases were identified from computerised discharge records using ICD‐9 codes 036 (meningococcal infection), 038 (septicaemia), 320 (bacterial meningitis), 711.0 (pyogenic arthritis), 730.0 (acute osteomyelitis), and 481 (lobar (pneumococcal) pneumonia). Hospital records were linked with computerised district immunisation records by sex, date of birth, and post code. Cases in children with additional diagnostic codes indicating an underlying disorder predisposing to bacterial infection, such as immunosuppression, malignancy, cystic fibrosis, congenital heart defect, or a cerebrospinal fluid shunt, were excluded. | MMR vaccine: not described Excluded period from the background from −14 to −1 days before immunisation Risk period after immunisation (a1) 0 to 30 days (a2) 31 to 60 days (a3) 61 to 90 days (a4) 0 to 90 days | Conclusion: combined measles, mumps, and rubella (MMR) vaccine did not increase the risk of hospitalisation with invasive bacterial infection in the 3 months after vaccination; rather there was a protective effect. These results provide no support for the concept of 'immunological overload' induced by multiple‐antigen vaccinations, nor calls for single‐antigen vaccines. | Total cases Lobar pneumonia (a1) cases = 23 Invasive bacterial infections (a1) cases = 12 Both codes (a1) cases = 35 | rr (95% CI) (*) Lobar pneumonia (a1) 0.77 (0.48 to 1.23) Invasive bacterial infections (a1) 1.00 (0.52 to 1.94) Both codes (a1) 0.81 (0.56 to 1.19) (*)Poisson regression |
| CI: confidence interval | ||||||
| Study design | Low risk of bias | Unclear risk of bias | High risk of bias | |||||
|---|---|---|---|---|---|---|---|---|
| n | Row % | n | Row % | n | Row % | n total | ||
| Effectiveness | RCT/CCT | 3 | 100% | 3 | ||||
| Case‐control | 8 | 57.1% | 4 | 28.6% | 2 | 14.3% | 14 | |
| Prospective/retrospective cohort | 4 | 13.0% | 21 | 67.7% | 6 | 19.4% | 31 | |
| Case‐only ecological method | 2 | 66.7% | 1 | 33.3% | 3 | |||
| Subtotal | 15 | 29.4% | 27 | 53.0% | 9 | 17.6% | 51 | |
| Study design | Low risk of bias | Unclear risk of bias | High risk of bias | |||||
| n | Row % | n | Row % | n | Row % | n total | ||
| Safety | RCT/CCT | 2 | 28.6% | 2 | 28.6% | 3 | 42.9% | 7 |
| Case‐control | 8 | 38.1% | 11 | 52.4% | 2 | 9.5% | 21 | |
| Prospective/retrospective cohort | 14 | 43.8% | 4 | 12.5% | 14 | 43.8% | 32 | |
| Self‐controlled case series/person‐time cohort | 11 | 68.8% | 5 | 31.2% | 16 | |||
| Case cross‐over | 1 | 33.3% | 2 | 66.7% | 3 | |||
| Case‐only ecological method | 2 | 25.0% | 4 | 50.0% | 2 | 25.0% | 8 | |
| Subtotal | 38 | 43.7% | 28 | 32.2% | 21 | 24.1% | 87 | |
| Total (all studies) | 53 | 38.4% | 55 | 39.9% | 30 | 21.7% | 138 | |
| Study design | Low risk of bias | Unclear risk of bias | High risk of bias | |||||
| n | Row % | n | Row % | n | Row % | n total | ||
| Safety studies | Case‐control | 8 | 38% | 11 | 52% | 2 | 10% | 21 |
| Prospective/retrospective cohort | 14 | 64% | 4 | 18% | 4 | 18% | 22 | |
| Self‐controlled case series/person‐time cohort | 11 | 69% | 5 | 31% | 16 | |||
| Case cross‐over | 1 | 33% | 2 | 67% | 3 | |||
| Case‐only ecological method | 2 | 25% | 4 | 50% | 2 | 25% | 8 | |
| Total | 36 | 51% | 26 | 37% | 8 | 11% | 70 | |
| CCT: controlled clinical trial | ||||||||
| All studies included | Low risk of bias | Unclear risk of bias | High risk of bias | Total | |||
|---|---|---|---|---|---|---|---|
| Publication year | N | Row % | N | Row % | N | Row % | |
| 1971 to 1980 | 0 | 0% | 1 | 20% | 4 | 80% | 5 |
| 1981 to 1990 | 2 | 29% | 0 | 0% | 5 | 71% | 7 |
| 1991 to 2000 | 3 | 20% | 6 | 40% | 5 | 40% | 15 |
| 2001 to 2010 | 21 | 39% | 23 | 43% | 10 | 18% | 54 |
| 2011 to 2019 | 27 | 47% | 24 | 42% | 6 | 11% | 57 |
| Total | 53 | 36% | 54 | 42% | 30 | 22% | 138 |
| Only safety studies | Low risk of bias | Unclear risk of bias | High risk of bias | Total | |||
| Publication year | N | Row % | N | Row % | N | Row % | |
| 1971 to 1980 | 1 | 20% | 4 | 80% | 5 | ||
| 1981 to 1990 | 2 | 29% | 5 | 71% | 7 | ||
| 1991 to 2000 | 2 | 20% | 4 | 40% | 4 | 40% | 10 |
| 2001 to 2010 | 17 | 40% | 17 | 41% | 8 | 19% | 43 |
| 2011 to 2019 | 17 | 74% | 5 | 22% | 1 | 4% | 22 |
| Total | 38 | 39% | 27 | 37% | 22 | 24% | 87 |
| Outcome or subgroup title | No. of studies | No. of participants | Statistical method | Effect size |
| 1.1 Cohort studies (vaccinated vs unvaccinated) Show forest plot | 8 | Risk Ratio (M‐H, Random, 95% CI) | Subtotals only | |
| 1.1.1 1 dose | 7 | 12039 | Risk Ratio (M‐H, Random, 95% CI) | 0.05 [0.02, 0.13] |
| 1.1.2 2 doses | 5 | 21604 | Risk Ratio (M‐H, Random, 95% CI) | 0.04 [0.01, 0.28] |
| 1.2 Cohort studies (household contacts: vaccinated vs unvaccinated) Show forest plot | 3 | Risk Ratio (M‐H, Random, 95% CI) | Subtotals only | |
| 1.2.1 1 dose | 3 | 151 | Risk Ratio (M‐H, Random, 95% CI) | 0.19 [0.04, 0.89] |
| 1.2.2 2 doses | 3 | 378 | Risk Ratio (M‐H, Random, 95% CI) | 0.15 [0.03, 0.75] |
| 1.2.3 3 doses | 2 | 151 | Risk Ratio (M‐H, Random, 95% CI) | 0.04 [0.01, 0.23] |
| 1.3 Cohort studies (postexposure prophylaxis: vaccinated vs unvaccinated) Show forest plot | 2 | 283 | Risk Ratio (M‐H, Fixed, 95% CI) | 0.26 [0.14, 0.50] |
| 1.4 Case‐control studies Show forest plot | 2 | Odds Ratio (IV, Random, 95% CI) | Subtotals only | |
| 1.4.1 1 dose | 1 | Odds Ratio (IV, Random, 95% CI) | 0.49 [0.41, 0.58] | |
| 1.4.2 2 doses | 1 | Odds Ratio (IV, Random, 95% CI) | 0.39 [0.26, 0.58] | |
| 1.4.3 Unspecified number or at least 1 dose | 1 | Odds Ratio (IV, Random, 95% CI) | 0.05 [0.01, 0.40] | |
| Outcome or subgroup title | No. of studies | No. of participants | Statistical method | Effect size |
| 2.1 Cohort studies ‐ Jeryl Lynn strain Show forest plot | 9 | Risk Ratio (M‐H, Random, 95% CI) | Subtotals only | |
| 2.1.1 1 dose | 6 | 9915 | Risk Ratio (M‐H, Random, 95% CI) | 0.28 [0.13, 0.62] |
| 2.1.2 2 doses | 5 | 7792 | Risk Ratio (M‐H, Random, 95% CI) | 0.14 [0.07, 0.27] |
| 2.1.3 Unspecified number of doses | 4 | 2011 | Risk Ratio (M‐H, Random, 95% CI) | 0.23 [0.14, 0.35] |
| 2.1.4 Household contacts | 3 | 1036 | Risk Ratio (M‐H, Random, 95% CI) | 0.26 [0.13, 0.49] |
| 2.2 Cohort studies ‐ Urabe strain Show forest plot | 4 | Risk Ratio (M‐H, Random, 95% CI) | Subtotals only | |
| 2.2.1 Unspecified numbers or at least 1 dose | 4 | 2721 | Risk Ratio (M‐H, Random, 95% CI) | 0.23 [0.12, 0.44] |
| 2.3 Cohort studies ‐ Rubini strain Show forest plot | 4 | Risk Ratio (M‐H, Random, 95% CI) | Subtotals only | |
| 2.3.1 Unspecified numbers or at least 1 dose | 4 | 4219 | Risk Ratio (M‐H, Random, 95% CI) | 0.96 [0.55, 1.65] |
| 2.4 Cohort studies ‐ mumps strain not reported or mixed Show forest plot | 2 | 769 | Risk Ratio (M‐H, Random, 95% CI) | 0.52 [0.29, 0.94] |
| 2.5 Cohort studies ‐ 3 doses vs 2 doses Show forest plot | 2 | Risk Ratio (M‐H, Random, 95% CI) | Subtotals only | |
| 2.5.1 3 doses vs 2 doses | 2 | 5417 | Risk Ratio (M‐H, Random, 95% CI) | 0.59 [0.33, 1.05] |
| 2.6 Case‐control studies ‐ Jeryl Lynn strain Show forest plot | 4 | Odds Ratio (IV, Random, 95% CI) | Subtotals only | |
| 2.6.1 1 dose | 3 | Odds Ratio (IV, Random, 95% CI) | 0.43 [0.27, 0.70] | |
| 2.6.2 2 doses | 2 | Odds Ratio (IV, Random, 95% CI) | 0.19 [0.09, 0.41] | |
| 2.6.3 At least 1 dose | 4 | Odds Ratio (IV, Random, 95% CI) | 0.35 [0.25, 0.48] | |
| 2.7 Case‐control studies ‐ Jeryl Lynn strain ‐ lab‐confirmed cases Show forest plot | 1 | Odds Ratio (IV, Random, 95% CI) | Subtotals only | |
| 2.7.1 1 dose | 1 | Odds Ratio (IV, Random, 95% CI) | 0.36 [0.22, 0.59] | |
| 2.7.2 2 doses | 1 | Odds Ratio (IV, Random, 95% CI) | 0.12 [0.04, 0.37] | |
| 2.7.3 At least 1 dose | 1 | Odds Ratio (IV, Random, 95% CI) | 0.35 [0.16, 0.76] | |
| 2.8 Case‐control studies ‐ Urabe strain Show forest plot | 1 | Odds Ratio (IV, Random, 95% CI) | Subtotals only | |
| 2.8.1 At least 1 dose | 1 | Odds Ratio (IV, Random, 95% CI) | 0.30 [0.12, 0.75] | |
| 2.9 Case‐control studies ‐ Rubini strain Show forest plot | 1 | Odds Ratio (IV, Random, 95% CI) | Subtotals only | |
| 2.9.1 At least 1 dose | 1 | Odds Ratio (IV, Random, 95% CI) | 0.90 [0.43, 1.89] | |
| 2.10 Case‐control studies ‐ strain type not reported or any strain Show forest plot | 2 | Odds Ratio (IV, Random, 95% CI) | Subtotals only | |
| 2.10.1 1 dose | 1 | Odds Ratio (IV, Random, 95% CI) | 0.70 [0.22, 2.21] | |
| 2.10.2 2 doses | 1 | Odds Ratio (IV, Random, 95% CI) | 0.52 [0.09, 3.16] | |
| 2.10.3 At least 1 dose | 2 | Odds Ratio (IV, Random, 95% CI) | 0.50 [0.31, 0.81] | |
| Outcome or subgroup title | No. of studies | No. of participants | Statistical method | Effect size |
| 3.1 Cohort studies secondary cases Show forest plot | 1 | Risk Ratio (IV, Random, 95% CI) | Subtotals only | |
| 3.1.1 Any strain | 1 | Risk Ratio (IV, Random, 95% CI) | 0.11 [0.03, 0.42] | |
| Outcome or subgroup title | No. of studies | No. of participants | Statistical method | Effect size |
| 4.1 MMRV randomised clinical trial ‐ any severity Show forest plot | 3 | Rate Ratio (IV, Random, 95% CI) | Subtotals only | |
| 4.1.1 2 doses ‐ follow up at 5 years | 1 | Rate Ratio (IV, Random, 95% CI) | 0.05 [0.03, 0.08] | |
| 4.1.2 2 doses ‐ follow up between 5 to 10 years | 1 | Rate Ratio (IV, Random, 95% CI) | 0.05 [0.04, 0.06] | |
| 4.1.3 2 doses ‐ follow up at 10 years | 1 | Rate Ratio (IV, Random, 95% CI) | 0.05 [0.04, 0.06] | |
| 4.2 MMRV randomised clinical trial ‐ moderate/severe cases Show forest plot | 3 | Rate Ratio (IV, Random, 95% CI) | Subtotals only | |
| 4.2.1 2 doses ‐ Follow up at 5 years | 1 | Rate Ratio (IV, Random, 95% CI) | 0.00 [0.00, 0.02] | |
| 4.2.2 2 doses ‐ Follow up between 5 to 10 years | 1 | Rate Ratio (IV, Random, 95% CI) | 0.01 [0.00, 0.02] | |
| 4.2.3 2 doses ‐ Follow up at 10 years | 1 | Rate Ratio (IV, Random, 95% CI) | 0.01 [0.00, 0.02] | |
| 4.3 MMR+V randomised clinical trial ‐ any severity Show forest plot | 3 | Rate Ratio (IV, Random, 95% CI) | 0.33 [0.30, 0.36] | |
| 4.3.1 2 doses ‐ follow up at 5 years | 1 | Rate Ratio (IV, Random, 95% CI) | 0.35 [0.28, 0.43] | |
| 4.3.2 2 doses ‐ follow up between 5 to 10 years | 1 | Rate Ratio (IV, Random, 95% CI) | 0.33 [0.29, 0.38] | |
| 4.3.3 2 doses ‐ follow up at 10 years | 1 | Rate Ratio (IV, Random, 95% CI) | 0.33 [0.29, 0.38] | |
| 4.4 MMR+V randomised clinical trial ‐ moderate/severe cases Show forest plot | 3 | Rate Ratio (IV, Fixed, 95% CI) | 0.10 [0.08, 0.12] | |
| 4.4.1 2 doses ‐ Follow up at 5 years | 1 | Rate Ratio (IV, Fixed, 95% CI) | 0.09 [0.06, 0.14] | |
| 4.4.2 2 doses ‐ Follow up between 5 to 10 years | 1 | Rate Ratio (IV, Fixed, 95% CI) | 0.10 [0.07, 0.13] | |
| 4.4.3 2 doses ‐ Follow up at 10 years | 1 | Rate Ratio (IV, Fixed, 95% CI) | 0.10 [0.08, 0.14] | |
| 4.5 MMR+V randomised clinical trial ‐ severe cases Show forest plot | 1 | Rate Ratio (IV, Fixed, 95% CI) | Subtotals only | |
| 4.5.1 2 doses ‐ follow up between 5 to 10 years | 1 | Rate Ratio (IV, Fixed, 95% CI) | 0.05 [0.01, 0.47] | |
| 4.6 MMRV cohort study Show forest plot | 4 | Risk Ratio (IV, Random, 95% CI) | Subtotals only | |
| 4.6.1 One dose ‐ any severity | 4 | Risk Ratio (IV, Random, 95% CI) | 0.25 [0.11, 0.59] | |
| 4.6.2 Two doses ‐ any severity | 2 | Risk Ratio (IV, Random, 95% CI) | 0.13 [0.13, 0.14] | |
| 4.7 MMRV case‐control Show forest plot | 1 | Odds Ratio (IV, Random, 95% CI) | Subtotals only | |
| 4.7.1 Any dose ‐ any severity | 1 | Odds Ratio (IV, Random, 95% CI) | 0.14 [0.07, 0.28] | |
| 4.7.2 Any dose ‐ moderate/severe cases | 1 | Odds Ratio (IV, Random, 95% CI) | 0.07 [0.03, 0.17] | |
| 4.8 MMR+V case control Show forest plot | 3 | Odds Ratio (IV, Random, 95% CI) | Subtotals only | |
| 4.8.1 1 dose ‐ any severity | 2 | Odds Ratio (IV, Random, 95% CI) | 0.14 [0.08, 0.22] | |
| 4.8.2 2 doses ‐ any severity | 2 | Odds Ratio (IV, Random, 95% CI) | 0.05 [0.01, 0.14] | |
| 4.8.3 Any dose ‐ any severity | 2 | Odds Ratio (IV, Random, 95% CI) | 0.12 [0.08, 0.18] | |
| 4.9 MMRV case only ecological method ‐ hospitalisation Show forest plot | 3 | Rate Ratio (IV, Random, 95% CI) | 0.43 [0.34, 0.55] | |
| 4.9.1 Age < 1 year ‐ any dose | 2 | Rate Ratio (IV, Random, 95% CI) | 0.52 [0.37, 0.74] | |
| 4.9.2 Age 1 to 4 years ‐ any dose | 2 | Rate Ratio (IV, Random, 95% CI) | 0.29 [0.10, 0.85] | |
| 4.9.3 Age 5 to 14 years ‐ any dose | 2 | Rate Ratio (IV, Random, 95% CI) | 0.37 [0.19, 0.72] | |
| 4.9.4 Age 0 to 14 years ‐ any doses | 1 | Rate Ratio (IV, Random, 95% CI) | 0.53 [0.44, 0.64] | |
| 4.10 MMRV case only ecological method ‐ incidence Show forest plot | 2 | Rate Ratio (IV, Random, 95% CI) | 0.24 [0.14, 0.43] | |
| 4.10.1 Age < 1 year | 1 | Rate Ratio (IV, Random, 95% CI) | 0.17 [0.12, 0.24] | |
| 4.10.2 Age 1 to 4 years ‐ any dose | 1 | Rate Ratio (IV, Random, 95% CI) | 0.08 [0.07, 0.09] | |
| 4.10.3 Age 5 to 14 years ‐ any dose | 1 | Rate Ratio (IV, Random, 95% CI) | 0.14 [0.12, 0.16] | |
| 4.10.4 Age 0 to 14 years ‐ any doses | 1 | Rate Ratio (IV, Random, 95% CI) | 0.65 [0.53, 0.80] | |
| Outcome or subgroup title | No. of studies | No. of participants | Statistical method | Effect size |
| 5.1 Temperature Show forest plot | 7 | Risk Ratio (M‐H, Random, 95% CI) | Subtotals only | |
| 5.1.1 RCT/CCT axillary | 1 | 420 | Risk Ratio (M‐H, Random, 95% CI) | 2.04 [1.09, 3.83] |
| 5.1.2 RCT/CCT rectal | 1 | 170 | Risk Ratio (M‐H, Random, 95% CI) | 0.84 [0.67, 1.06] |
| 5.1.3 RCT/CCT measurement site not reported | 2 | 520 | Risk Ratio (M‐H, Random, 95% CI) | 1.36 [0.83, 2.23] |
| 5.1.4 Cohort studies orally | 1 | 334 | Risk Ratio (M‐H, Random, 95% CI) | 1.37 [1.04, 1.81] |
| 5.1.5 Cohort studies measurement site not reported | 4 | 457123 | Risk Ratio (M‐H, Random, 95% CI) | 1.12 [0.84, 1.49] |
| 5.2 Rash Show forest plot | 6 | Risk Ratio (M‐H, Random, 95% CI) | Subtotals only | |
| 5.2.1 RCT/CCT | 3 | 1156 | Risk Ratio (M‐H, Random, 95% CI) | 2.05 [1.21, 3.48] |
| 5.2.2 Cohort studies | 3 | 457261 | Risk Ratio (M‐H, Random, 95% CI) | 1.49 [0.73, 3.04] |
| 5.3 Lymphadenopathy Show forest plot | 5 | Risk Ratio (M‐H, Random, 95% CI) | Subtotals only | |
| 5.3.1 RCT/CCT | 3 | 1156 | Risk Ratio (M‐H, Random, 95% CI) | 1.32 [0.52, 3.33] |
| 5.3.2 Cohort studies | 2 | 454085 | Risk Ratio (M‐H, Random, 95% CI) | 1.98 [0.19, 20.97] |
| 5.4 Coryza Show forest plot | 3 | Risk Ratio (M‐H, Random, 95% CI) | Subtotals only | |
| 5.4.1 RCT/CCT | 2 | 831 | Risk Ratio (M‐H, Random, 95% CI) | 0.45 [0.12, 1.63] |
| 5.4.2 Cohort studies | 1 | 3176 | Risk Ratio (M‐H, Random, 95% CI) | 1.13 [1.05, 1.20] |
| 5.5 URTI (rhinitis, pharyngitis) Show forest plot | 3 | Risk Ratio (M‐H, Random, 95% CI) | Subtotals only | |
| 5.5.1 RCT/CCT | 2 | 831 | Risk Ratio (M‐H, Random, 95% CI) | 0.31 [0.06, 1.56] |
| 5.5.2 Cohort studies | 1 | 966 | Risk Ratio (M‐H, Random, 95% CI) | 1.44 [1.26, 1.64] |
| 5.6 Cough Show forest plot | 2 | Risk Ratio (M‐H, Random, 95% CI) | Subtotals only | |
| 5.6.1 RCT/CCT | 2 | 831 | Risk Ratio (M‐H, Random, 95% CI) | 1.99 [0.45, 8.81] |
| Outcome or subgroup title | No. of studies | No. of participants | Statistical method | Effect size |
| 6.1 Case‐control: MMR (risk interval from 0 to 90 days) Show forest plot | 1 | Odds Ratio (IV, Random, 95% CI) | Subtotals only | |
| 6.2 Self‐controlled case series/person‐time cohort Show forest plot | 2 | Rate Ratio (IV, Random, 95% CI) | Subtotals only | |
| 6.2.1 Self‐controlled case series: MMR | 1 | Rate Ratio (IV, Random, 95% CI) | 1.34 [0.52, 3.46] | |
| 6.2.2 Person‐time cohort: MMR | 1 | Rate Ratio (IV, Random, 95% CI) | 0.72 [0.36, 1.43] | |
| Outcome or subgroup title | No. of studies | No. of participants | Statistical method | Effect size |
| 7.1 Case‐control ‐ case cross‐over Show forest plot | 3 | Odds Ratio (IV, Random, 95% CI) | Subtotals only | |
| 7.1.1 Case control ‐ Jeryl Lynn ‐ risk interval 0 to 30 days | 1 | Odds Ratio (IV, Random, 95% CI) | 0.85 [0.21, 3.41] | |
| 7.1.2 Case crossover ‐ Urabe or Hoshino | 2 | Odds Ratio (IV, Random, 95% CI) | 4.00 [2.23, 7.20] | |
| 7.1.3 Case crossover ‐ Jeryl Lynn or Rubini | 1 | Odds Ratio (IV, Random, 95% CI) | 0.60 [0.18, 1.99] | |
| 7.2 Self‐controlled case series (SCCS)/person‐time cohort (PT) Show forest plot | 5 | Rate Ratio (IV, Random, 95% CI) | Subtotals only | |
| 7.2.1 SCCS ‐ any strain | 1 | Rate Ratio (IV, Random, 95% CI) | 12.40 [3.12, 49.35] | |
| 7.2.2 SCCS ‐ Urabe | 3 | Rate Ratio (IV, Random, 95% CI) | 30.71 [13.45, 70.10] | |
| 7.2.3 SCCS ‐ Leningrad‐Zageb | 1 | Rate Ratio (IV, Random, 95% CI) | 6.40 [0.78, 52.47] | |
| 7.2.4 PT ‐ Jeryl Lynn | 1 | Rate Ratio (IV, Random, 95% CI) | 1.30 [0.66, 2.56] | |
| 7.3 Case only ecological method (COEM) Show forest plot | 3 | Rate Ratio (IV, Random, 95% CI) | Subtotals only | |
| 7.3.1 COEM ‐ Urabe | 1 | Rate Ratio (IV, Random, 95% CI) | 9.12 [5.73, 14.52] | |
| 7.3.2 COEM ‐ Leningrad‐Zagreb | 2 | Rate Ratio (IV, Random, 95% CI) | 18.56 [12.09, 28.51] | |
| Outcome or subgroup title | No. of studies | No. of participants | Statistical method | Effect size |
| 8.1 Cohort studies Show forest plot | 2 | Rate Ratio (IV, Random, 95% CI) | Subtotals only | |
| 8.1.1 Within 1 week after vaccination MMR | 2 | Rate Ratio (IV, Random, 95% CI) | 2.45 [2.21, 2.71] | |
| 8.1.2 Between 1 to 2 weeks after vaccination MMR | 2 | Rate Ratio (IV, Random, 95% CI) | 3.16 [2.89, 3.46] | |
| 8.1.3 > 2 weeks after vaccination MMR | 1 | Rate Ratio (IV, Random, 95% CI) | 0.97 [0.49, 1.94] | |
| 8.2 Self‐controlled case series/person‐time cohort Show forest plot | 6 | Rate Ratio (IV, Random, 95% CI) | Subtotals only | |
| 8.2.1 Between 1 to 2 weeks after vaccination MMR | 5 | Rate Ratio (IV, Random, 95% CI) | 3.36 [2.65, 4.24] | |
| 8.2.2 > 2 weeks after vaccination MMR | 3 | Rate Ratio (IV, Random, 95% CI) | 1.18 [0.93, 1.50] | |
| 8.2.3 Between 1 to 2 weeks after vaccination; MMRV | 2 | Rate Ratio (IV, Random, 95% CI) | 6.08 [4.95, 7.47] | |
| 8.2.4 between 1 to 2 weeks after vaccination MMR+V | 1 | Rate Ratio (IV, Random, 95% CI) | 3.13 [2.38, 4.10] | |
| 8.3 MMRV versus MMR+V Show forest plot | 5 | Risk Ratio (IV, Random, 95% CI) | Subtotals only | |
| 8.3.1 from 0 to 42 days after vaccination | 5 | Risk Ratio (IV, Random, 95% CI) | 1.31 [1.19, 1.45] | |
| 8.3.2 from 7 to 10 days after vaccination | 5 | Risk Ratio (IV, Random, 95% CI) | 1.98 [1.69, 2.33] | |
| 8.4 MMRV versus MMR+V ‐ by brand Show forest plot | 5 | Risk Ratio (IV, Random, 95% CI) | Subtotals only | |
| 8.4.1 From 0 to 42 days after vaccination (Priorix) | 1 | Risk Ratio (IV, Random, 95% CI) | 1.95 [0.85, 4.48] | |
| 8.4.2 From 7 to 10 days after vaccination (Priorix) | 1 | Risk Ratio (IV, Random, 95% CI) | 1.69 [0.93, 3.07] | |
| 8.4.3 From 0 to 42 days after vaccination (ProQuad) | 4 | Risk Ratio (IV, Random, 95% CI) | 1.30 [1.17, 1.44] | |
| 8.4.4 From 7 to 10 days after vaccination (ProQuad) | 4 | Risk Ratio (IV, Random, 95% CI) | 2.01 [1.70, 2.38] | |
| 8.5 MMRV versus MMR Show forest plot | 6 | Risk Ratio (IV, Fixed, 95% CI) | Subtotals only | |
| 8.5.1 From 0 to 42 days after vaccination | 5 | Risk Ratio (IV, Fixed, 95% CI) | 1.53 [1.37, 1.71] | |
| 8.5.2 From 7 to 10 days after vaccination | 6 | Risk Ratio (IV, Fixed, 95% CI) | 1.50 [1.36, 1.66] | |
| 8.6 MMRV versus MMR ‐ by brand Show forest plot | 6 | Risk Ratio (IV, Fixed, 95% CI) | Subtotals only | |
| 8.6.1 From 0 to 42 days after vaccination (Priorix) | 2 | Risk Ratio (IV, Fixed, 95% CI) | 1.28 [1.00, 1.64] | |
| 8.6.2 From 7 to 10 days after vaccination (Priorix) | 2 | Risk Ratio (IV, Fixed, 95% CI) | 2.49 [1.66, 3.74] | |
| 8.6.3 From 0 to 42 days after vaccination (ProQuad) | 3 | Risk Ratio (IV, Fixed, 95% CI) | 1.60 [1.42, 1.82] | |
| 8.6.4 From 7 to 10 days after vaccination (ProQuad) | 4 | Risk Ratio (IV, Fixed, 95% CI) | 1.46 [1.32, 1.61] | |
| Outcome or subgroup title | No. of studies | No. of participants | Statistical method | Effect size |
| 9.1 Cohort studies Show forest plot | 3 | Rate Ratio (IV, Random, 95% CI) | Subtotals only | |
| 9.1.1 All children MMR | 2 | Rate Ratio (IV, Random, 95% CI) | 0.93 [0.85, 1.01] | |
| 9.1.2 Autism risk (low) MMR | 1 | Rate Ratio (IV, Random, 95% CI) | 1.00 [0.89, 1.14] | |
| 9.1.3 Autism risk (moderate/high) MMR | 1 | Rate Ratio (IV, Random, 95% CI) | 0.80 [0.64, 0.98] | |
| 9.2 Case‐control Show forest plot | 4 | Odds Ratio (IV, Random, 95% CI) | Subtotals only | |
| 9.2.1 Any age MMR | 3 | Odds Ratio (IV, Random, 95% CI) | 0.62 [0.36, 1.09] | |
| 9.2.2 Before age 18 months MMR | 2 | Odds Ratio (IV, Random, 95% CI) | 0.91 [0.75, 1.11] | |
| 9.2.3 After age 18 months MMR | 1 | Odds Ratio (IV, Random, 95% CI) | 0.80 [0.61, 1.05] | |
| 9.2.4 Before age 36 months MMR | 2 | Odds Ratio (IV, Random, 95% CI) | 0.94 [0.74, 1.18] | |
| 9.2.5 After age 36 months MMR | 1 | Odds Ratio (IV, Random, 95% CI) | 0.77 [0.55, 1.08] | |
| 9.3 Self‐controlled case series/person‐time cohort Show forest plot | 1 | Rate Ratio (IV, Random, 95% CI) | Subtotals only | |
| 9.3.1 ASD diagnosis < 12 months MMR | 1 | Rate Ratio (IV, Random, 95% CI) | 0.94 [0.60, 1.47] | |
| 9.3.2 ASD diagnosis < 24 months MMR | 1 | Rate Ratio (IV, Random, 95% CI) | 1.09 [0.79, 1.51] | |
| 9.3.3 Regression < 2 months MMR | 1 | Rate Ratio (IV, Random, 95% CI) | 0.92 [0.38, 2.22] | |
| 9.3.4 Regression < 4 months MMR | 1 | Rate Ratio (IV, Random, 95% CI) | 1.00 [0.52, 1.94] | |
| 9.3.5 Regression < 6 months MMR | 1 | Rate Ratio (IV, Random, 95% CI) | 0.85 [0.45, 1.60] | |
| 9.4 Case only ecological method Show forest plot | 1 | Rate Ratio (IV, Random, 95% CI) | Subtotals only | |
| 9.4.1 Childhood autism MMR | 1 | Rate Ratio (IV, Random, 95% CI) | 0.45 [0.33, 0.62] | |
| 9.4.2 Other ASD. MMR | 1 | Rate Ratio (IV, Random, 95% CI) | 0.55 [0.39, 0.80] | |
| 9.4.3 Definite regression. MMR | 1 | Rate Ratio (IV, Random, 95% CI) | 0.73 [0.44, 1.20] | |
| 9.4.4 Definite + probable regression. MMR | 1 | Rate Ratio (IV, Random, 95% CI) | 0.73 [0.46, 1.16] | |
| 9.4.5 All ASD. MMR | 1 | Rate Ratio (IV, Random, 95% CI) | 0.49 [0.39, 0.63] | |
| Outcome or subgroup title | No. of studies | No. of participants | Statistical method | Effect size |
| 10.1 Case‐control Show forest plot | 4 | Odds Ratio (IV, Fixed, 95% CI) | Subtotals only | |
| 10.1.1 All IBD. MMR | 3 | Odds Ratio (IV, Fixed, 95% CI) | 1.42 [0.93, 2.16] | |
| 10.1.2 Ulcerative colitis. MMR | 2 | Odds Ratio (IV, Fixed, 95% CI) | 1.35 [0.81, 2.23] | |
| 10.1.3 Crohn's disease. MMR | 3 | Odds Ratio (IV, Fixed, 95% CI) | 0.64 [0.42, 0.98] | |
| 10.2 Case‐only ecological method (rate ratio) Show forest plot | 1 | Rate Ratio (IV, Random, 95% CI) | Subtotals only | |
| 10.2.1 Crohn's disease. MMR | 1 | Rate Ratio (IV, Random, 95% CI) | 0.95 [0.84, 1.08] | |
| 10.3 Case only ecological method (odds ratio) Show forest plot | 1 | Odds Ratio (IV, Fixed, 95% CI) | Subtotals only | |
| 10.3.1 All IBD. MMR | 1 | Odds Ratio (IV, Fixed, 95% CI) | 0.98 [0.89, 1.07] | |
| Outcome or subgroup title | No. of studies | No. of participants | Statistical method | Effect size |
| 11.1 Cohort study Show forest plot | 1 | Odds Ratio (IV, Random, 95% CI) | Subtotals only | |
| 11.1.1 MDI‐BSID II 24th month. MMR | 1 | Odds Ratio (IV, Random, 95% CI) | 1.35 [0.15, 12.07] | |
| 11.1.2 MDI‐BSID II 36th month. MMR | 1 | Odds Ratio (IV, Random, 95% CI) | 0.37 [0.03, 4.28] | |
| 11.1.3 Raven 5th year. MMR | 1 | Odds Ratio (IV, Random, 95% CI) | 1.22 [0.23, 6.51] | |
| 11.1.4 WISC‐R verbal 6th year. MMR | 1 | Odds Ratio (IV, Random, 95% CI) | 1.23 [0.09, 16.92] | |
| Outcome or subgroup title | No. of studies | No. of participants | Statistical method | Effect size |
| 12.1 Case‐control ‐ case cross‐over Show forest plot | 3 | Odds Ratio (IV, Fixed, 95% CI) | Subtotals only | |
| 12.1.1 Case‐controls MMR | 2 | Odds Ratio (IV, Fixed, 95% CI) | 2.80 [1.50, 5.23] | |
| 12.1.2 Case cross‐over MMR | 1 | Odds Ratio (IV, Fixed, 95% CI) | 1.62 [1.21, 2.16] | |
| 12.2 Self‐controlled case series Show forest plot | 5 | Rate Ratio (IV, Random, 95% CI) | Subtotals only | |
| 12.2.1 MMR vaccine ‐ aged from 9 to 23 months | 5 | Rate Ratio (IV, Random, 95% CI) | 4.21 [2.28, 7.78] | |
| 12.2.2 MMR vaccine ‐ aged from 4 to 6 years | 1 | Rate Ratio (IV, Random, 95% CI) | 3.06 [0.42, 22.30] | |
| 12.2.3 MMRV vaccine ‐ aged from 9 to 23 months | 1 | Rate Ratio (IV, Random, 95% CI) | 2.87 [0.78, 10.56] | |
| Outcome or subgroup title | No. of studies | No. of participants | Statistical method | Effect size |
| 13.1 Case‐control Show forest plot | 1 | Odds Ratio (IV, Fixed, 95% CI) | Subtotals only | |
| 13.1.1 MMR vaccine | 1 | Odds Ratio (IV, Fixed, 95% CI) | 3.40 [1.18, 9.81] | |
| Outcome or subgroup title | No. of studies | No. of participants | Statistical method | Effect size |
| 14.1 Cohort study MMR Show forest plot | 2 | Rate Ratio (IV, Random, 95% CI) | Subtotals only | |
| 14.1.1 All children | 2 | Rate Ratio (IV, Random, 95% CI) | 1.09 [0.98, 1.21] | |
| 14.1.2 Children with at least 1 sibling with type 1 diabetes | 1 | Rate Ratio (IV, Random, 95% CI) | 0.86 [0.34, 2.16] | |
| Outcome or subgroup title | No. of studies | No. of participants | Statistical method | Effect size |
| 15.1 Cohort study (rate ratio) Show forest plot | 3 | Rate Ratio (IV, Random, 95% CI) | Subtotals only | |
| 15.1.1 All ages | 3 | Rate Ratio (IV, Random, 95% CI) | 1.05 [0.80, 1.39] | |
| 15.2 Cohort study (risk ratio) Show forest plot | 2 | Risk Ratio (IV, Random, 95% CI) | Subtotals only | |
| 15.2.1 All ages | 1 | Risk Ratio (IV, Random, 95% CI) | 1.33 [0.98, 1.80] | |
| 15.2.2 Age ≤ 6 years | 1 | Risk Ratio (IV, Random, 95% CI) | 0.44 [0.19, 1.00] | |
| 15.2.3 Age between 11 and 16 years | 1 | Risk Ratio (IV, Random, 95% CI) | 0.35 [0.16, 0.79] | |
| Outcome or subgroup title | No. of studies | No. of participants | Statistical method | Effect size |
| 16.1 Cohort study (rate ratio) Show forest plot | 1 | Rate Ratio (IV, Random, 95% CI) | Subtotals only | |
| 16.1.1 All ages | 1 | Rate Ratio (IV, Random, 95% CI) | 3.50 [2.38, 5.15] | |
| 16.2 Cohort study (risk ratio) Show forest plot | 1 | Risk Ratio (IV, Random, 95% CI) | Subtotals only | |
| 16.2.1 Age between 11 and 16 years | 1 | Risk Ratio (IV, Random, 95% CI) | 0.75 [0.29, 1.94] | |
| Outcome or subgroup title | No. of studies | No. of participants | Statistical method | Effect size |
| 17.1 Cohort study ‐ rhinoconjunctivitis Show forest plot | 1 | Odds Ratio (IV, Fixed, 95% CI) | 0.64 [0.19, 2.11] | |
| 17.2 Cohort study ‐ hypersensitivity/allergy Show forest plot | 1 | Odds Ratio (IV, Fixed, 95% CI) | 0.63 [0.14, 2.77] | |
| 17.3 Case‐control ‐ hay fever Show forest plot | 2 | Odds Ratio (IV, Random, 95% CI) | 1.16 [0.92, 1.45] | |
| Outcome or subgroup title | No. of studies | No. of participants | Statistical method | Effect size |
| 18.1 Case‐control Show forest plot | 4 | Odds Ratio (IV, Random, 95% CI) | Subtotals only | |
| 18.1.1 Acute leukaemia | 2 | Odds Ratio (IV, Random, 95% CI) | 0.97 [0.76, 1.24] | |
| 18.1.2 Acute lymphoblastic leukaemia | 4 | Odds Ratio (IV, Random, 95% CI) | 0.91 [0.72, 1.14] | |
| 18.1.3 Acute myeloblastic leukaemia | 1 | Odds Ratio (IV, Random, 95% CI) | 0.56 [0.29, 1.07] | |
| Outcome or subgroup title | No. of studies | No. of participants | Statistical method | Effect size |
| 19.1 Case‐control Show forest plot | 2 | Odds Ratio (IV, Fixed, 95% CI) | Subtotals only | |
| 19.1.1 Multiple sclerosis | 1 | Odds Ratio (IV, Fixed, 95% CI) | 1.13 [0.62, 2.05] | |
| 19.1.2 Acute disseminated encephalomyelitis | 1 | Odds Ratio (IV, Fixed, 95% CI) | 1.03 [0.44, 2.42] | |
| Outcome or subgroup title | No. of studies | No. of participants | Statistical method | Effect size |
| 20.1 Self‐controlled case series (hospitalisations) Show forest plot | 1 | Rate Ratio (IV, Fixed, 95% CI) | Subtotals only | |
| 20.1.1 Hospitalisation ‐ risk period: (0 to 30 days) | 1 | Rate Ratio (IV, Fixed, 95% CI) | 0.83 [0.24, 2.86] | |
| 20.1.2 Hospitalisations ‐ risk period: (31 to 60 days) | 1 | Rate Ratio (IV, Fixed, 95% CI) | 0.20 [0.03, 1.40] | |
| 20.1.3 Hospitalisations ‐ risk period: (0 to 60 days) | 1 | Rate Ratio (IV, Fixed, 95% CI) | 0.46 [0.16, 1.34] | |
| 20.2 Self‐controlled case series (GP visits) Show forest plot | 1 | Rate Ratio (IV, Fixed, 95% CI) | Subtotals only | |
| 20.2.1 GP visit ‐ risk period: (0 to 5 days) | 1 | Rate Ratio (IV, Fixed, 95% CI) | 1.88 [1.30, 2.72] | |
| 20.2.2 GP visit ‐ risk period: (6 to 30 days) | 1 | Rate Ratio (IV, Fixed, 95% CI) | 0.90 [0.70, 1.16] | |
| 20.2.3 GP visit ‐ risk period: (31 to 60 days) | 1 | Rate Ratio (IV, Fixed, 95% CI) | 0.95 [0.76, 1.18] | |
| 20.2.4 GP visit ‐ risk period: (6 to 60 days) | 1 | Rate Ratio (IV, Fixed, 95% CI) | 0.93 [0.78, 1.11] | |
| Outcome or subgroup title | No. of studies | No. of participants | Statistical method | Effect size |
| 21.1 Self‐controlled case series ‐ lobar pneumonia Show forest plot | 2 | Rate Ratio (IV, Fixed, 95% CI) | Subtotals only | |
| 21.1.1 Lobar pneumonia risk period (0 to 30 days) | 2 | Rate Ratio (IV, Fixed, 95% CI) | 0.68 [0.53, 0.87] | |
| 21.1.2 Lobar pneumonia risk period (31 to 60 days) | 2 | Rate Ratio (IV, Fixed, 95% CI) | 0.80 [0.63, 1.01] | |
| 21.1.3 Lobar pneumonia risk period (61 to 90 days) | 2 | Rate Ratio (IV, Fixed, 95% CI) | 0.81 [0.64, 1.03] | |
| 21.1.4 Lobar pneumonia risk period (0 to 90 days) | 2 | Rate Ratio (IV, Fixed, 95% CI) | 0.75 [0.64, 0.89] | |
| 21.2 Self‐controlled case series ‐ invasive bacterial infections Show forest plot | 2 | Rate Ratio (IV, Fixed, 95% CI) | Subtotals only | |
| 21.2.1 Invasive bacterial infections risk period (0 to 30 days) | 2 | Rate Ratio (IV, Fixed, 95% CI) | 0.81 [0.58, 1.13] | |
| 21.2.2 Invasive bacterial infections risk period (31 to 60 days) | 2 | Rate Ratio (IV, Fixed, 95% CI) | 1.07 [0.77, 1.48] | |
| 21.2.3 Invasive bacterial infections risk period (61 to 90 days) | 2 | Rate Ratio (IV, Fixed, 95% CI) | 0.85 [0.58, 1.23] | |
| 21.2.4 Invasive bacterial infections risk period (0 to 90 days) | 2 | Rate Ratio (IV, Fixed, 95% CI) | 0.90 [0.71, 1.13] | |
| 21.3 Self‐controlled case series ‐ encephalitis meningitis Show forest plot | 1 | Rate Ratio (IV, Fixed, 95% CI) | Subtotals only | |
| 21.3.1 Encephalitis ‐ meningitis risk period (0 to 30 days) | 1 | Rate Ratio (IV, Fixed, 95% CI) | 0.54 [0.06, 4.84] | |
| 21.3.2 Encephalitis ‐ meningitis risk period (31 to 60 days) | 1 | Rate Ratio (IV, Fixed, 95% CI) | 0.74 [0.07, 7.64] | |
| 21.3.3 Encephalitis ‐ meningitis risk period (61 to 90 days) | 1 | Rate Ratio (IV, Fixed, 95% CI) | 1.46 [0.23, 9.28] | |
| 21.3.4 Encephalitis ‐ meningitis risk period (0 to 90 days) | 1 | Rate Ratio (IV, Fixed, 95% CI) | 0.84 [0.20, 3.51] | |
| 21.4 Self‐controlled case series ‐ herpes Show forest plot | 1 | Rate Ratio (IV, Fixed, 95% CI) | Subtotals only | |
| 21.4.1 Herpes risk period (0 to 30 days) | 1 | Rate Ratio (IV, Fixed, 95% CI) | 1.00 [0.57, 1.75] | |
| 21.4.2 Herpes risk period (31 to 60 days) | 1 | Rate Ratio (IV, Fixed, 95% CI) | 1.69 [1.06, 2.70] | |
| 21.4.3 Herpes risk period (61 to 90 days) | 1 | Rate Ratio (IV, Fixed, 95% CI) | 0.89 [0.50, 1.59] | |
| 21.4.4 Herpes risk period (0 to 90 days) | 1 | Rate Ratio (IV, Fixed, 95% CI) | 1.17 [0.56, 2.46] | |
| 21.5 Self‐controlled case series ‐ pneumonia Show forest plot | 1 | Rate Ratio (IV, Fixed, 95% CI) | Subtotals only | |
| 21.5.1 Pneumonia risk period (0 to 30 days) | 1 | Rate Ratio (IV, Fixed, 95% CI) | Not estimable | |
| 21.5.2 Pneumonia risk period (31 to 60 days) | 1 | Rate Ratio (IV, Fixed, 95% CI) | 1.39 [0.49, 3.92] | |
| 21.5.3 Pneumonia risk period (61 to 90 days) | 1 | Rate Ratio (IV, Fixed, 95% CI) | 1.27 [0.41, 3.94] | |
| 21.5.4 Pneumonia risk period (0 to 90 days) | 1 | Rate Ratio (IV, Fixed, 95% CI) | 0.72 [0.32, 1.60] | |
| 21.6 Self‐controlled case series ‐ varicella zoster Show forest plot | 1 | Rate Ratio (IV, Fixed, 95% CI) | Subtotals only | |
| 21.6.1 Varicella zoster risk period (0 to 30 days) | 1 | Rate Ratio (IV, Fixed, 95% CI) | 0.58 [0.34, 0.99] | |
| 21.6.2 Varicella zoster risk period (31 to 60 days) | 1 | Rate Ratio (IV, Fixed, 95% CI) | 1.23 [0.81, 1.87] | |
| 21.6.3 Varicella zoster risk period (61 to 90 days) | 1 | Rate Ratio (IV, Fixed, 95% CI) | 1.05 [0.66, 1.67] | |
| 21.6.4 Varicella zoster risk period (0 to 90 days) | 1 | Rate Ratio (IV, Fixed, 95% CI) | 0.93 [0.68, 1.27] | |
| 21.7 Self‐controlled case series ‐ miscellaneous viral infections Show forest plot | 1 | Rate Ratio (IV, Fixed, 95% CI) | Subtotals only | |
| 21.7.1 Miscellaneous viral infections risk period (0 to 30 days) | 1 | Rate Ratio (IV, Fixed, 95% CI) | 0.71 [0.37, 1.37] | |
| 21.7.2 Miscellaneous viral infections risk period (31 to 60 days) | 1 | Rate Ratio (IV, Fixed, 95% CI) | 0.73 [0.42, 1.28] | |
| 21.7.3 Miscellaneous viral infections risk period (61 to 90 days) | 1 | Rate Ratio (IV, Fixed, 95% CI) | 0.61 [0.29, 1.28] | |
| 21.7.4 Miscellaneous viral infections risk period (0 to 90 days) | 1 | Rate Ratio (IV, Fixed, 95% CI) | 0.68 [0.43, 1.08] | |