Ejercicio para la osteoartritis de rodilla
Appendices
Appendix 1. MEDLINE search strategy
-
exp osteoarthritis/
-
osteoarthr$.tw.
-
(degenerative adj2 arthritis).tw.
-
arthrosis.tw.
-
or/1‐4
-
Knee/
-
exp Knee Joint/
-
knee$.tw.
-
or/6‐8
-
exp EXERCISE/
-
exp exertion/
-
exp Physical Fitness/
-
exp Exercise Test/
-
exp Exercise Tolerance/
-
exp Sports/
-
exp PLIABILITY/
-
exp Physical Endurance/
-
exertion$.tw.
-
exercis$.tw.
-
sport$.tw.
-
((physical or motion) adj5 (fitness or therap$)).tw.
-
(physical$ adj2 endur$).tw.
-
((strength$ or isometric$ or isotonic$ or isokinetic$ or aerobic$ or endurance or weight$) adj5 (exercis$ or train$)).tw.
-
exp physical therapy modalities/
-
physiotherap$.tw.
-
manipulat$.tw.
-
kinesiotherap$.tw.
-
exp Rehabilitation/
-
rehab$.tw.
-
(skate$ or skating).tw.
-
run$.tw.
-
jog$.tw.
-
treadmill$.tw.
-
swim$.tw.
-
bicycl$.tw.
-
(cycle$ or cycling).tw.
-
walk$.tw.
-
(row or rows or rowing).tw.
-
muscle strength$.tw.
-
or/10‐39
-
randomized controlled trial.pt.
-
controlled clinical trial.pt.
-
randomized.ab.
-
placebo.ab.
-
drug therapy.fs.
-
randomly.ab.
-
trial.ab.
-
groups.ab.
-
41 or 42 or 43 or 44 or 45 or 46 or 47 or 48
-
humans.sh.
-
49 and 50
-
and/5,9,40,51
Appendix 2. EMBASE (Ovid) search strategy
-
exp osteoarthritis/
-
osteoarthr$.tw.
-
(degenerative adj2 arthritis).tw.
-
arthrosis.tw.
-
or/1‐4
-
Knee/
-
knee$.tw.
-
6 or 7
-
exp EXERCISE/
-
fitness/
-
exercise test/
-
exercise tolerance/
-
exp Sport/
-
pliability/
-
exp "physical activity, capacity and performance"/
-
exertion$.tw.
-
exercis$.tw.
-
sport$.tw.
-
((physical or motion) adj5 (fitness or therap$)).tw.
-
(physical$ adj2 endur$).tw.
-
((strength$ or isometric$ or isotonic$ or isokinetic$ or aerobic$ or endurance or weight$) adj5 (exercis$ or train$)).tw.
-
exp physiotherapy/
-
physiotherap$.tw.
-
manipulat$.tw.
-
kinesiotherap$.tw.
-
exp REHABILITATION/
-
rehab$.tw.
-
(skate$ or skating).tw.
-
run$.tw.
-
jog$.tw.
-
treadmill$.tw.
-
swim$.tw.
-
bicycl$.tw.
-
(cycle$ or cycling).tw.
-
walk$.tw.
-
(row or rows or rowing).tw.
-
muscle strength$.tw.
-
or/9‐37
-
and/5,8,38
-
random$.ti,ab.
-
factorial$.ti,ab.
-
(crossover$ or cross over$ or cross‐over$).ti,ab.
-
placebo$.ti,ab.
-
(doubl$ adj blind$).ti,ab.
-
(singl$ adj blind$).ti,ab.
-
assign$.ti,ab.
-
allocat$.ti,ab.
-
volunteer$.ti,ab.
-
crossover procedure.sh.
-
double blind procedure.sh.
-
randomized controlled trial.sh.
-
single blind procedure.sh.
-
or/40‐52
-
exp animal/ or nonhuman/ or exp animal experiment/
-
exp human/
-
54 and 55
-
54 not 56
-
53 not 57
-
39 and 58
Appendix 3. The Cochrane Library (Wiley Interscience) search strategy
-
MeSH descriptor Osteoarthritis explode all trees
-
osteoarthr*:ti,ab
-
(degenerative next arthritis):ti,ab
-
arthrosis:ti,ab
-
(#1 OR #2 OR #3 OR #4)
-
MeSH descriptor Knee explode all trees
-
MeSH descriptor Knee Joint explode all trees
-
knee*:ti,ab
-
(#6 OR #7 OR #8)
-
MeSH descriptor Exercise explode all trees
-
MeSH descriptor Exertion explode all trees
-
MeSH descriptor Physical Fitness explode all trees
-
MeSH descriptor Exercise Test explode all trees
-
MeSH descriptor Exercise Tolerance explode all trees
-
MeSH descriptor Sports explode all trees
-
MeSH descriptor Pliability explode all trees
-
MeSH descriptor Physical Endurance explode all trees
-
exertion*:ti,ab
-
exercis*:ti,ab
-
sport*:ti,ab
-
((physical or motion) near/5 (fitness or therap*)):ti,ab
-
(physical* near/2 endur*):ti,ab
-
((strength* or isometric* or isotonic* or isokinetic* or aerobic* or endurance or weight*) near/5 (exercis* or train*)):ti,ab
-
MeSH descriptor Physical Therapy Modalities explode all trees
-
(physical next therap*):ti,ab
-
physiotherap*:ti,ab
-
manipulat*:ti,ab
-
kinesiotherap*:ti,ab
-
MeSH descriptor Rehabilitation explode all trees
-
rehab*:ti,ab
-
(skate* or skating):ti,ab
-
run*:ti,ab
-
jog*:ti,ab
-
treadmill*:ti,ab
-
swim*:ti,ab
-
bicycl*:ti,ab
-
(cycle* or cycling):ti,ab
-
walk*:ti,ab
-
(row or rows or rowing):ti,ab
-
muscle next strength:ti,ab
-
(#10 OR #11 OR #12 OR #13 OR #14 OR #15 OR #16 OR #17 OR #18 OR #19 OR #20 OR #21 OR #22 OR #23 OR #24 OR #25 OR #26 OR #27 OR #28 OR #29 OR #30 OR #31 OR #32 OR #33 OR #34 OR #35 OR #36 OR #37 OR #38 OR #39 OR #40)
-
(#5 AND #9 AND #41)
Appendix 4. CINAHL (EBSCOhost) search strategy
-
S56 S55 and S42
-
S55 S54 or S53 or S52 or S51 or S50 or S49 or S48 or S47 or S46 or S45 or S44 or S43 S54 TI Allocat* random* or AB Allocat* random*
-
S53 (MH "Quantitative Studies")
-
S52 (MH "Placebos")
-
S51 TI Placebo* or AB Placebo*
-
S50 TI Random* allocat* or AB Random* allocat*
-
S49 (MH "Random Assignment")
-
S48 TI Randomi?ed control* trial* or AB Randomi?ed control* trial*
-
S47 TI singl* mask* or TI doubl* mask* or TI treb* mask* or TI tripl* mask* or AB singl* mask* or AB doubl* mask* or AB treb* mask* or AB tripl* mask*
-
S46 TI singl* blind* or TI doubl* blind* or TI treb* blind* or TI tripl* blind* or AB singl* blind* or AB doubl* blind* or AB treb* blind* or AB tripl* blind*
-
S45 TI "clinic* trial*" or AB "clinic* trial*"
-
S44 PT Clinical Trial
-
S43 (MH "Clinical Trials+")
-
S42 S41 and S40 and S5
-
S41 S39 or S38 or S37 or S36 or S35 or S34 or S33 or S32 or S31 or S30 or S29 or S28 or S27 or S26 or S25 or S24 or S23 or S22 or S21 or S20 or S19 or S18 or S17 or S16 or S15 or S14 or S13 or S12 or S11 or S10 or S9 or S8 or S7 or S6
-
S40 S8 or S7 or S6
-
S39 (ti "muscle strength*") or (ab "muscle strength*")
-
S38 (ti row or rows or rowing) or (ab row or rows or rowing)
-
S37 (ti walk*) or (ab walk*)
-
S36 (ti cycle* or cycling) or (ab cycle* or cycling)
-
S35 (ti bicycl*) or (ab bicycl*)
-
S34 (ti swim*) or (ab swim*)
-
S33 (ti swim*) or (ab swim*)
-
S32 (ti treadmill*) or (ab treadmill*)
-
S31 (ti jog*) or (ab jog*)
-
S30 (ti run*) or (ab run*)
-
S29 (ti skate* or skating) or (ab skate* or skating)
-
S28 (ti rehab*) or (ab rehab*)
-
S27 (MH "Rehabilitation+")
-
S26 (ti kinesiotherap*) or (ab kinesiotherap*)
-
S25 (ti manipulat*) or (ab manipulat*)
-
S24 (ti physiotherap*) or (ab physiotherap*)
-
S23 (MH "Physical Therapy+")
-
S22 TI ( strength* or isometric* or isotonic* or isokinetic*or aerobic* or endurance or weight* ) or AB ( strength* or isometric* or isotonic* or isokinetic*or aerobic* or endurance or weight* )
-
S21 TI physical* n2 endur* or AB physical* n2 endur*
-
S20 TI physical N5 fitness or TI physical N5 therap* or AB physical N5 fitness or AB physical N5 therap* or TI motion n5 therap* or AB motion n5 therap*
-
S19 (ti sport*) or (ab sport*)
-
S18 (ti exercis*) or (ab exercis*)
-
S17 (ti exertion*) or (ab exertion*)
-
S16 (MH "Physical Endurance+")
-
S15 (MH "Pliability
-
S14 (MH "Sports+")
-
S13 (MH "Exercise Tolerance+")
-
S12 (MH "Exercise Test+")
-
S11 (MH "Physical Fitness")
-
S10 (MH "Exertion+")
-
S9 (MH "Exercise+")
-
S8 (ti knee*) or (ab knee*)
-
S7 (MH "Knee Joint
-
S6 (MH "Knee")
-
S5 S4 or S3 or S2 or S1
-
S4 (ti arthrosis) or (ab arthrosis)
-
S3 (ti degenerative N2 arthritis) or (ab degenerative N2 arthritis)
-
S2 (ti osteoarthr*) or (ab osteoarthr*)
-
S1 (MH "Osteoarthritis+")
Appendix 5. PEDro search strategy
-
Advanced search
-
Therapy: Fitness training OR Strength training
-
Body Part: Lower leg or knee
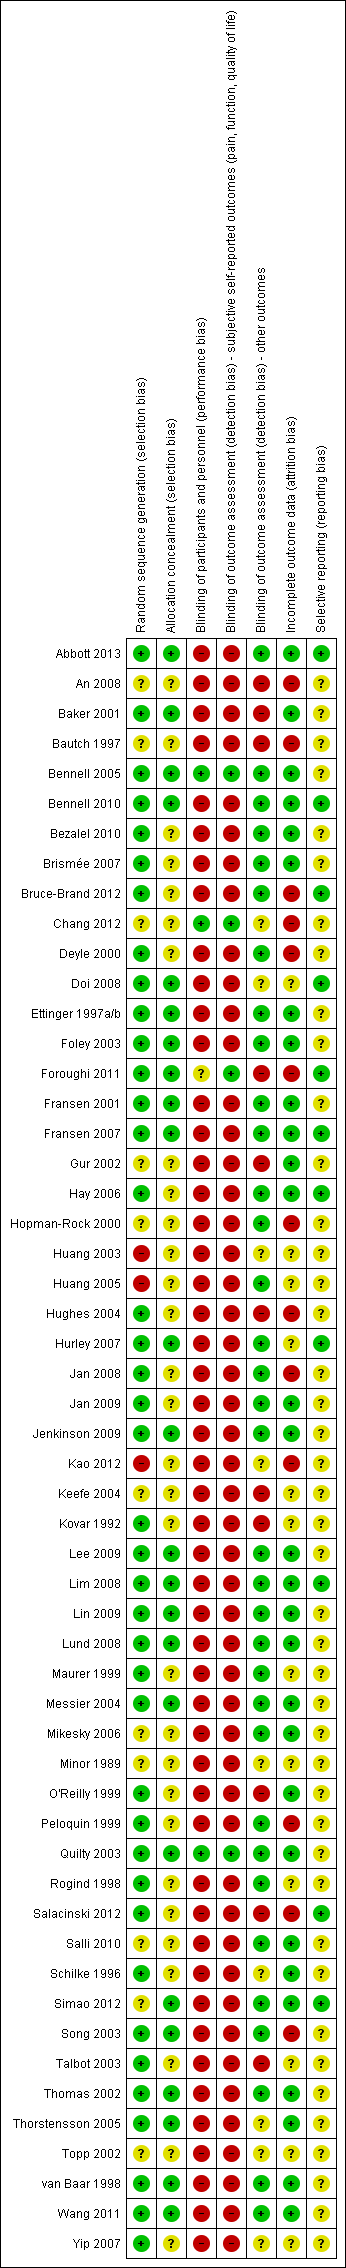
Risk of bias summary: review authors' judgements about each risk of bias item for each included study.

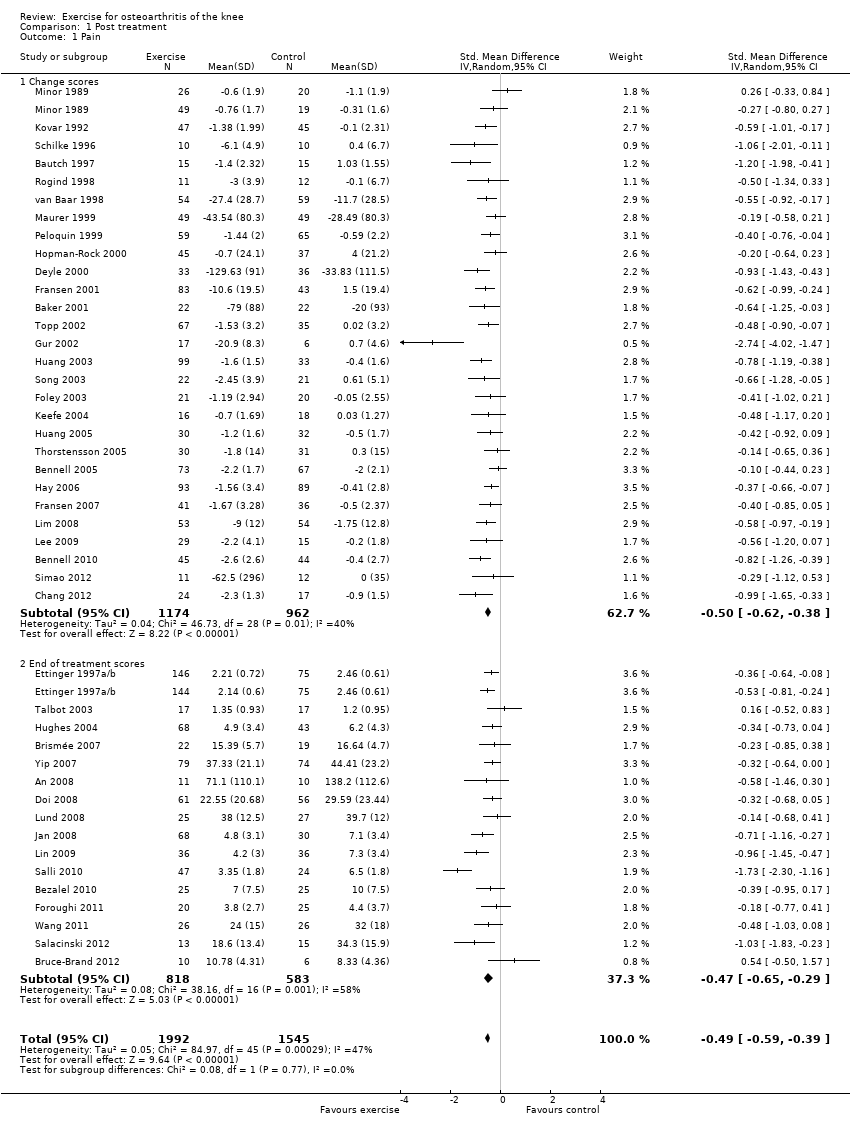
Forest plot of comparison: 1 Post treatment, outcome: 1.1 Pain.

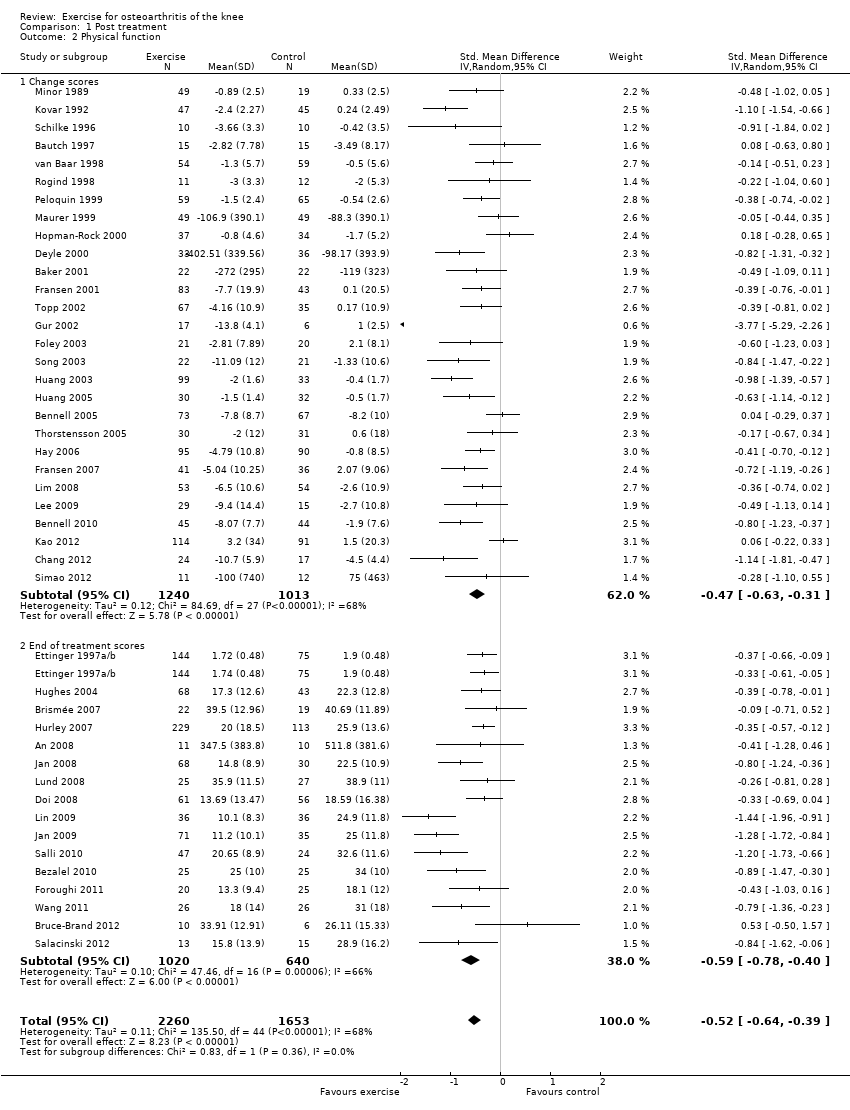
Forest plot of comparison: 1 Post treatment, outcome: 1.2 Physical function.
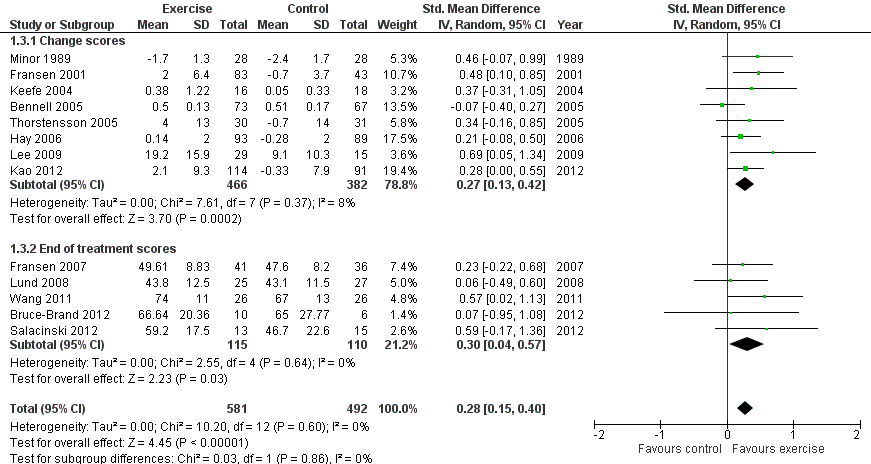
Forest plot of comparison: 1 Post treatment, outcome: 1.3 Quality of life.
Comparison 1 Post treatment, Outcome 1 Pain.
Comparison 1 Post treatment, Outcome 2 Physical function.

Comparison 1 Post treatment, Outcome 3 Quality of Life.

Comparison 1 Post treatment, Outcome 4 Study withdrawals.
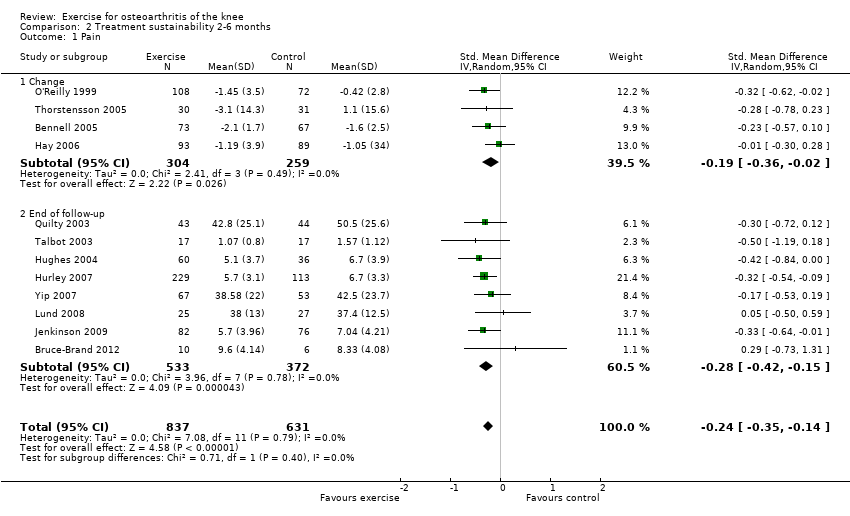
Comparison 2 Treatment sustainability 2‐6 months, Outcome 1 Pain.
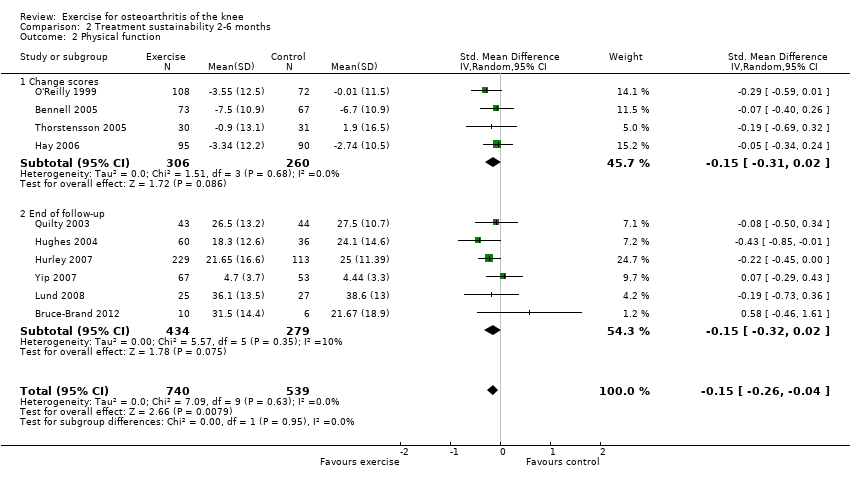
Comparison 2 Treatment sustainability 2‐6 months, Outcome 2 Physical function.
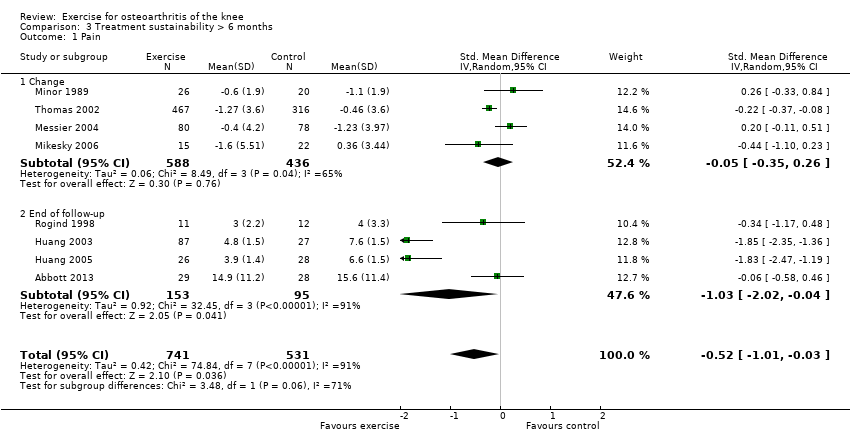
Comparison 3 Treatment sustainability > 6 months, Outcome 1 Pain.
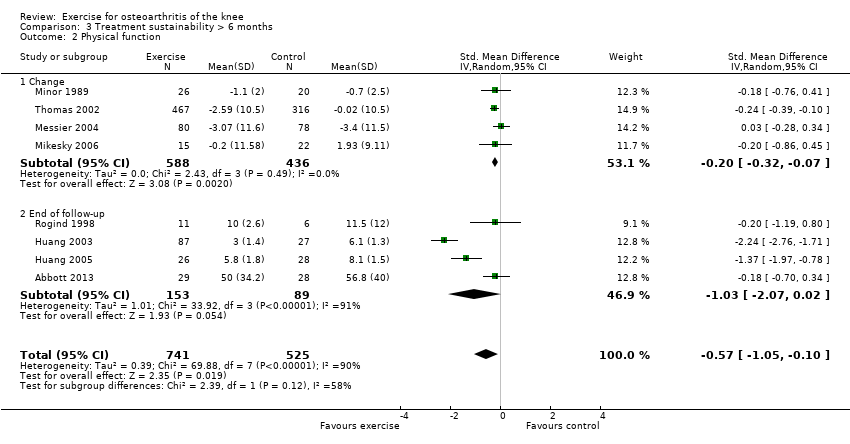
Comparison 3 Treatment sustainability > 6 months, Outcome 2 Physical function.

Comparison 4 Treatment content, Outcome 1 Pain.
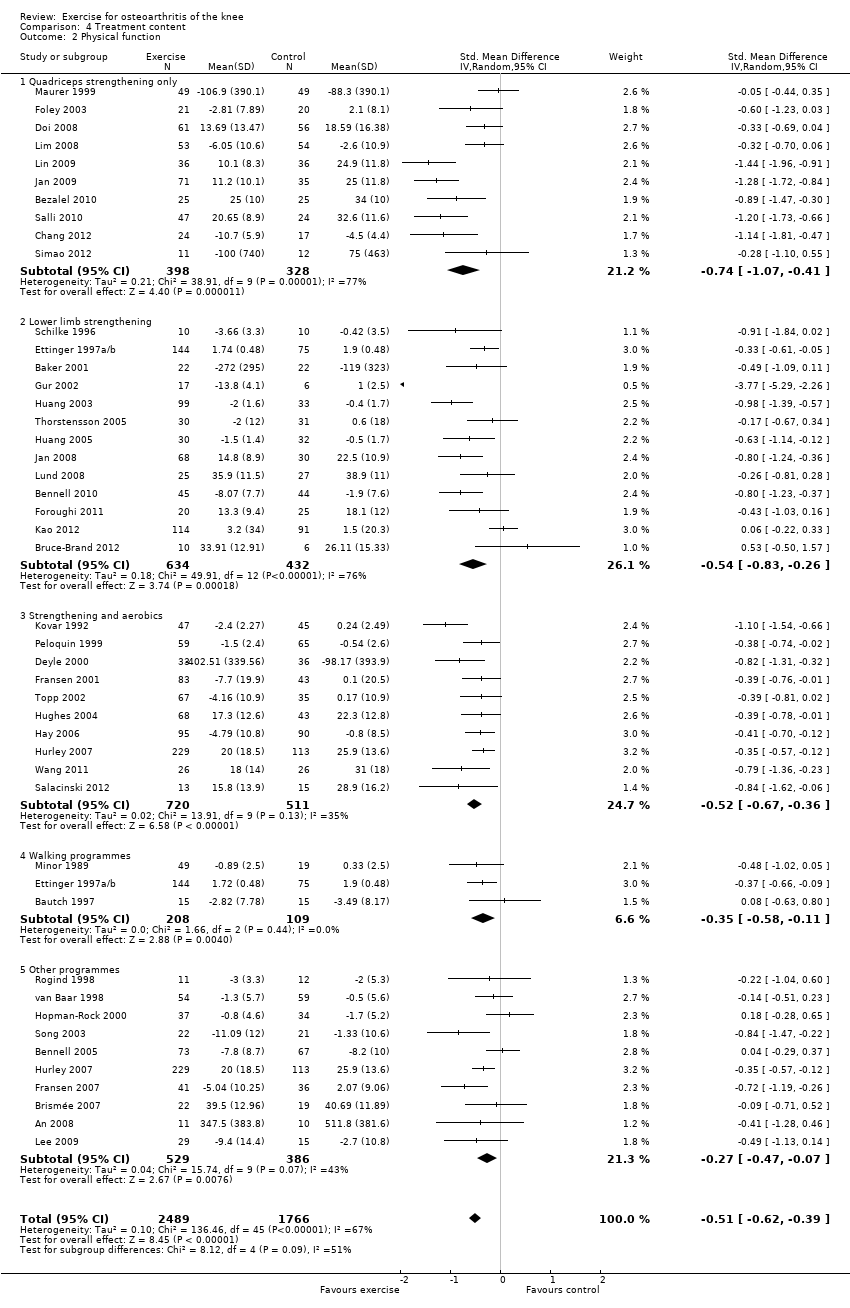
Comparison 4 Treatment content, Outcome 2 Physical function.
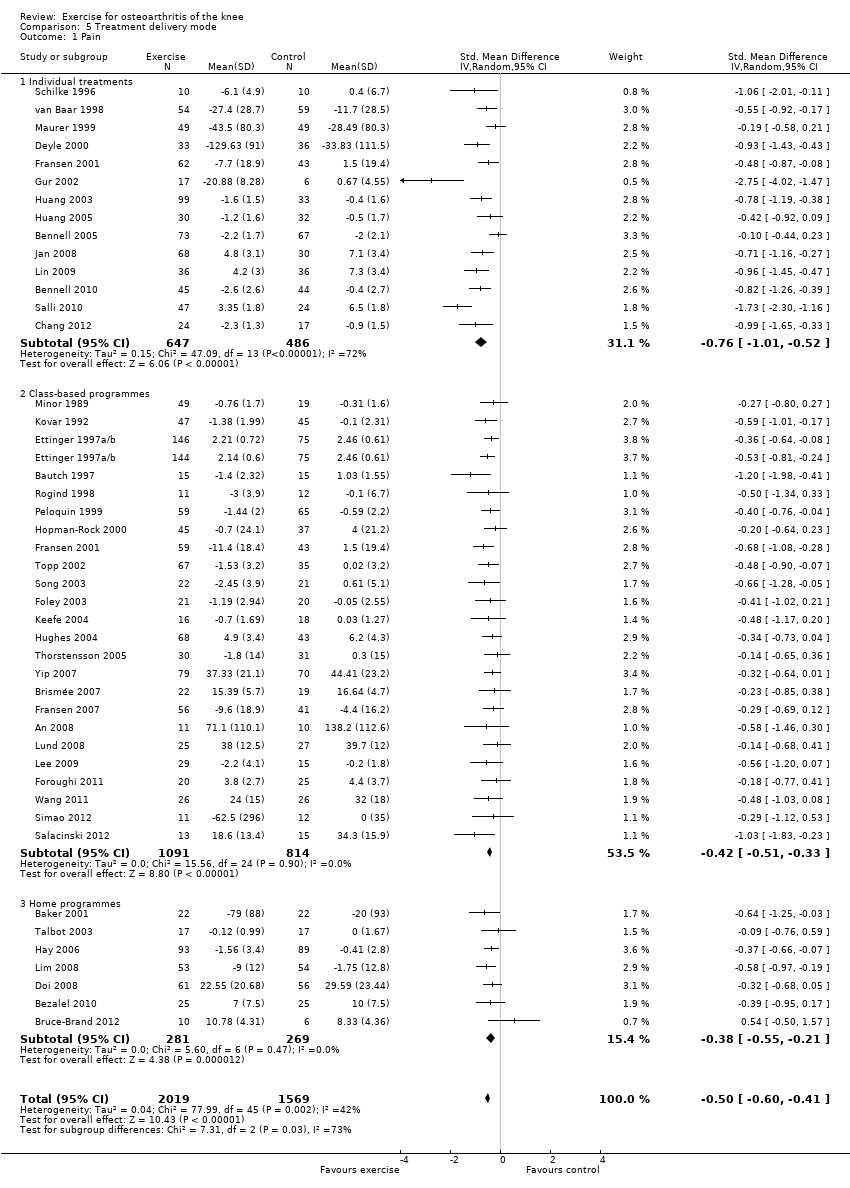
Comparison 5 Treatment delivery mode, Outcome 1 Pain.

Comparison 5 Treatment delivery mode, Outcome 2 Physical Function.

Comparison 6 Number of contact occasions, Outcome 1 Pain.
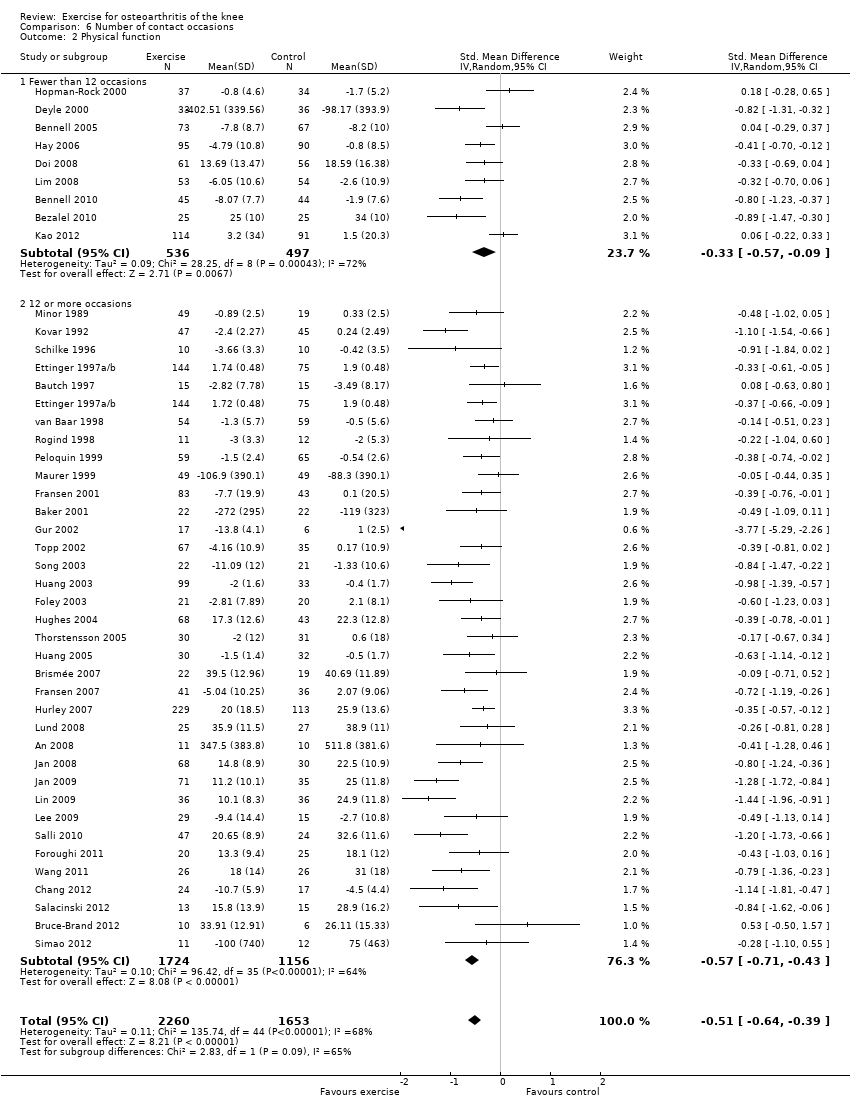
Comparison 6 Number of contact occasions, Outcome 2 Physical function.

Comparison 7 Sensitivity Analyses, Outcome 1 Selection and attrition bias: pain.
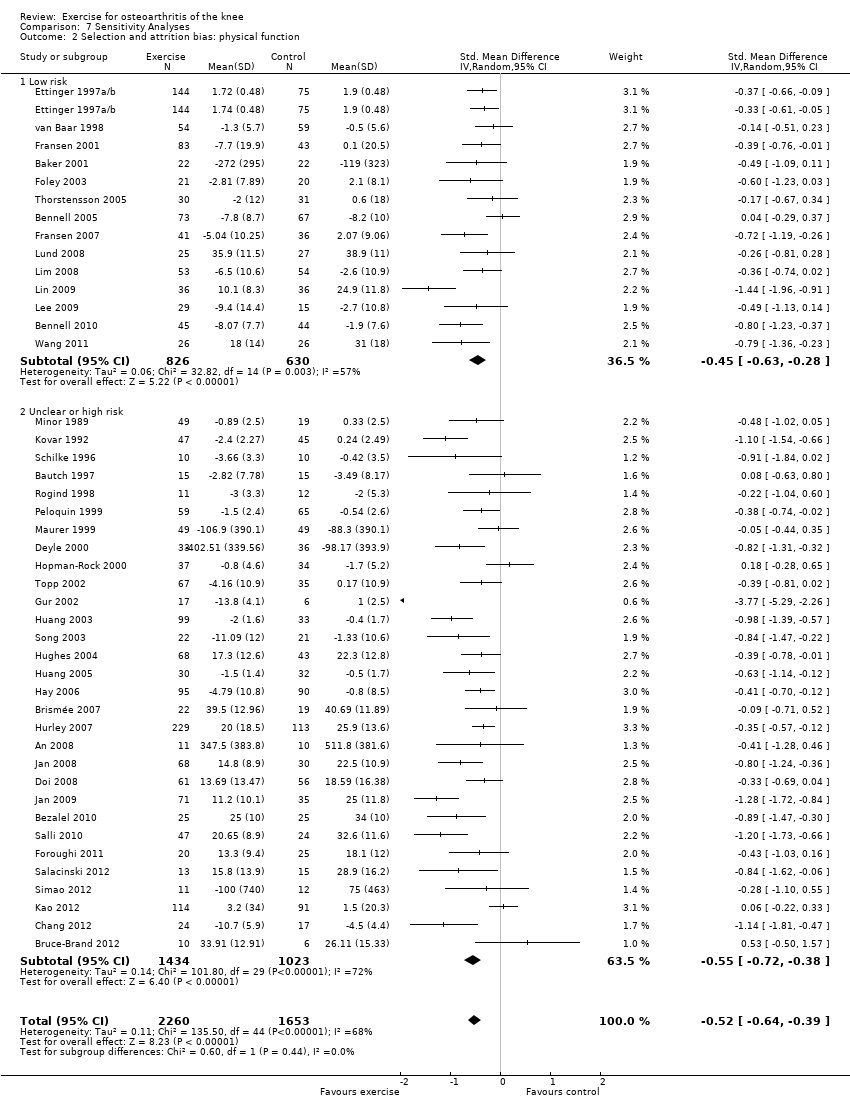
Comparison 7 Sensitivity Analyses, Outcome 2 Selection and attrition bias: physical function.

Comparison 7 Sensitivity Analyses, Outcome 3 Detection bias: pain.
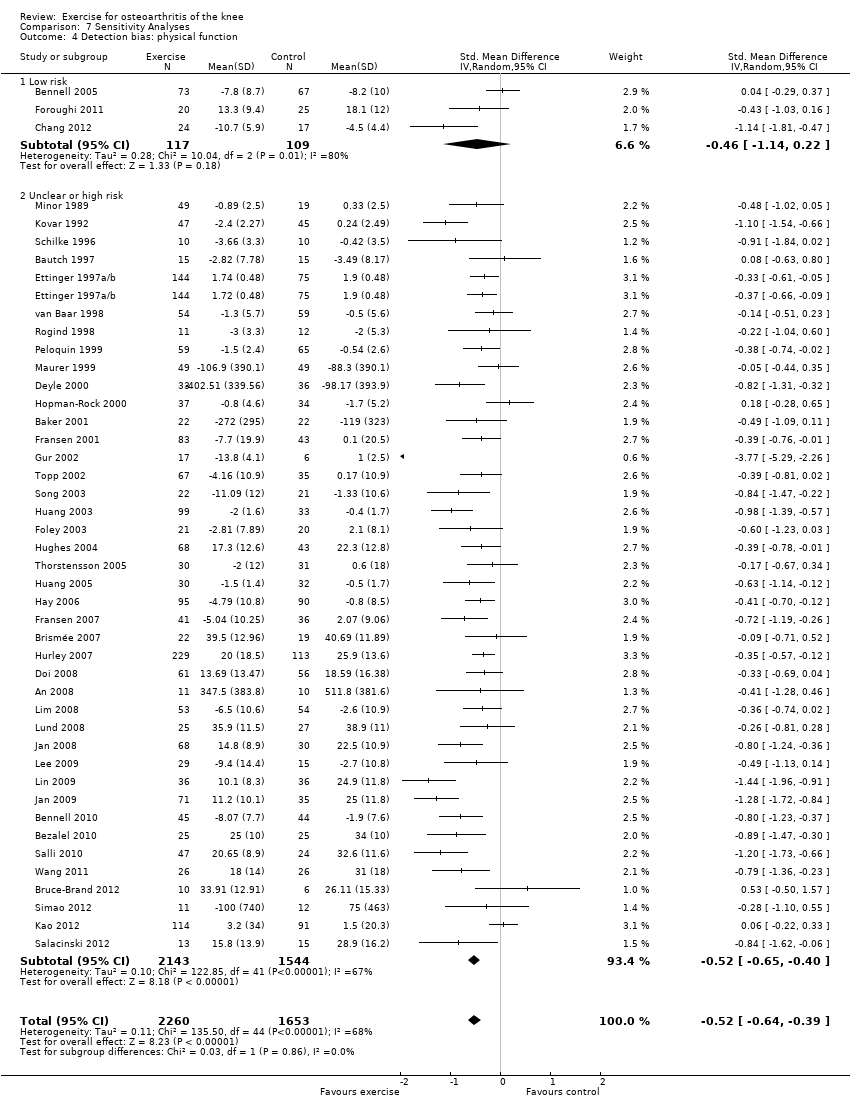
Comparison 7 Sensitivity Analyses, Outcome 4 Detection bias: physical function.
| Immediate post‐treatment effects of exercise for osteoarthritis of the knee | ||||||
| Patient or population: patients with knee OA | ||||||
| Outcomes | Illustrative comparative risks* (95% CI) | Relative effect | Number of participants | Quality of the evidence | Comments | |
| Assumed risk | Corresponding risk | |||||
| No exercise | Land‐based exercise | |||||
| Pain | Mean pain in the control groups was | Mean pain in intervention groups was This translates to an absolute mean reduction of 12 (10‐15) points compared with control group on a 0‐100 scalea | 3537 | ⊕⊕⊕⊕ | SMD ‐0.49 (‐0.39 to ‐0.59) Absolute reduction in pain 12% (10%‐15%); relative change 27% (21%‐32%)a NNTB 4 (3‐5)b | |
| Physical function | Mean physical function in control groups was | Mean physical function in intervention groups was This translates to an absolute mean improvement of 10 (8‐13) points on a 0‐100 scalec | 3913 | ⊕⊕⊕⊝ | SMD ‐0.52 (‐0.39 to ‐0.64) Absolute improvement 10% (8%‐13%); relative improvement 26% (20%‐32%)c NNTB 4 (3‐5)b | |
| Quality of life | Mean quality of life in control groups was | Mean quality of life in intervention groups was This translates to an absolute improvement of 4 (2‐5) points on a 0‐100 scalee | 1073 | ⊕⊕⊕⊕ | SMD 0.28 (0.15‐0.40) Absolute improvement 4% (2%‐5%); relative improvement 9% (5%‐13%)e NNTB 8 (5‐14)b | |
| Study withdrawals or dropouts | 153 per 1000 | 137 per 1000 | 4607 (44 studies) | ⊕⊕⊕⊕ | OR 0.93 (0.75‐1.15) Absolute risk reduction: 1% fewer events with exercise (2% fewer‐2% more); relative risk reduction 6% fewer events with exercise (21% fewer‐12% more) NNTH n/ab | |
| *The basis for the assumed risk (e.g. median control group risk across studies) is provided in footnotes. The corresponding risk (and its 95% confidence interval) is based on the assumed risk in the comparison group and the relative effect of the intervention (and its 95% CI). | ||||||
| GRADE Working Group grades of evidence. | ||||||
| aCalculations based on the control group baseline mean (SD) pain: 44.3 (24.4) points on 0‐100 scale (from Yip 2007). bNumber needed to treat for an additional beneficial outcome (NNTB) or harmful outcome (NNTH) not applicable (n/a) when result was not statistically significant. Number needed to treat (NNT) for continuous outcomes calculated using the Wells calculator (from the CMSG Editorial office; http://musculoskeletal.cochrane.org/), and for dichotomous outcomes using the Cates NNT calculator (www.nntonline.net/visualrx/). cCalculations based on the control group baseline mean (SD) function: 40.0 (20.0) points on 0‐100 scale (from Hurley 2007). dPhysical function downgraded for inconsistency (heterogeneity, I2 = 68%). eCalculated on the basis of the control group baseline mean (SD): 39.2 (13.1) points on 0‐100 KOOS subscale (from Lund 2008). | ||||||
| Outcome or subgroup title | No. of studies | No. of participants | Statistical method | Effect size |
| 1 Pain Show forest plot | 44 | 3537 | Std. Mean Difference (IV, Random, 95% CI) | ‐0.49 [‐0.59, ‐0.39] |
| 1.1 Change scores | 28 | 2136 | Std. Mean Difference (IV, Random, 95% CI) | ‐0.50 [‐0.62, ‐0.38] |
| 1.2 End of treatment scores | 16 | 1401 | Std. Mean Difference (IV, Random, 95% CI) | ‐0.47 [‐0.65, ‐0.29] |
| 2 Physical function Show forest plot | 44 | 3913 | Std. Mean Difference (IV, Random, 95% CI) | ‐0.52 [‐0.64, ‐0.39] |
| 2.1 Change scores | 28 | 2253 | Std. Mean Difference (IV, Random, 95% CI) | ‐0.47 [‐0.63, ‐0.31] |
| 2.2 End of treatment scores | 16 | 1660 | Std. Mean Difference (IV, Random, 95% CI) | ‐0.59 [‐0.78, ‐0.40] |
| 3 Quality of Life Show forest plot | 13 | 1073 | Std. Mean Difference (IV, Random, 95% CI) | 0.28 [0.15, 0.40] |
| 3.1 Change scores | 8 | 848 | Std. Mean Difference (IV, Random, 95% CI) | 0.27 [0.13, 0.42] |
| 3.2 End of treatment scores | 5 | 225 | Std. Mean Difference (IV, Random, 95% CI) | 0.30 [0.04, 0.57] |
| 4 Study withdrawals Show forest plot | 45 | 4607 | Odds Ratio (M‐H, Random, 95% CI) | 0.93 [0.75, 1.15] |
| Outcome or subgroup title | No. of studies | No. of participants | Statistical method | Effect size |
| 1 Pain Show forest plot | 12 | 1468 | Std. Mean Difference (IV, Random, 95% CI) | ‐0.24 [‐0.35, ‐0.14] |
| 1.1 Change | 4 | 563 | Std. Mean Difference (IV, Random, 95% CI) | ‐0.19 [‐0.36, ‐0.02] |
| 1.2 End of follow‐up | 8 | 905 | Std. Mean Difference (IV, Random, 95% CI) | ‐0.28 [‐0.42, ‐0.15] |
| 2 Physical function Show forest plot | 10 | 1279 | Std. Mean Difference (IV, Random, 95% CI) | ‐0.15 [‐0.26, ‐0.04] |
| 2.1 Change scores | 4 | 566 | Std. Mean Difference (IV, Random, 95% CI) | ‐0.15 [‐0.31, 0.02] |
| 2.2 End of follow‐up | 6 | 713 | Std. Mean Difference (IV, Random, 95% CI) | ‐0.15 [‐0.32, 0.02] |
| Outcome or subgroup title | No. of studies | No. of participants | Statistical method | Effect size |
| 1 Pain Show forest plot | 8 | 1272 | Std. Mean Difference (IV, Random, 95% CI) | ‐0.52 [‐1.01, ‐0.03] |
| 1.1 Change | 4 | 1024 | Std. Mean Difference (IV, Random, 95% CI) | ‐0.05 [‐0.35, 0.26] |
| 1.2 End of follow‐up | 4 | 248 | Std. Mean Difference (IV, Random, 95% CI) | ‐1.03 [‐2.02, ‐0.04] |
| 2 Physical function Show forest plot | 8 | 1266 | Std. Mean Difference (IV, Random, 95% CI) | ‐0.57 [‐1.05, ‐0.10] |
| 2.1 Change | 4 | 1024 | Std. Mean Difference (IV, Random, 95% CI) | ‐0.20 [‐0.32, ‐0.07] |
| 2.2 End of follow‐up | 4 | 242 | Std. Mean Difference (IV, Random, 95% CI) | ‐1.03 [‐2.07, 0.02] |
| Outcome or subgroup title | No. of studies | No. of participants | Statistical method | Effect size |
| 1 Pain Show forest plot | 44 | 3487 | Std. Mean Difference (IV, Random, 95% CI) | ‐0.51 [‐0.60, ‐0.41] |
| 1.1 Quads strengthening only | 9 | 620 | Std. Mean Difference (IV, Random, 95% CI) | ‐0.64 [‐0.95, ‐0.33] |
| 1.2 Lower limb strengthening | 12 | 863 | Std. Mean Difference (IV, Random, 95% CI) | ‐0.53 [‐0.78, ‐0.28] |
| 1.3 Strengthening and aerobics | 10 | 920 | Std. Mean Difference (IV, Random, 95% CI) | ‐0.50 [‐0.64, ‐0.37] |
| 1.4 Walking programmes | 4 | 351 | Std. Mean Difference (IV, Random, 95% CI) | ‐0.48 [‐0.83, ‐0.13] |
| 1.5 Other programmes | 10 | 733 | Std. Mean Difference (IV, Random, 95% CI) | ‐0.35 [‐0.49, ‐0.20] |
| 2 Physical function Show forest plot | 44 | 4255 | Std. Mean Difference (IV, Random, 95% CI) | ‐0.51 [‐0.62, ‐0.39] |
| 2.1 Quadriceps strengthening only | 10 | 726 | Std. Mean Difference (IV, Random, 95% CI) | ‐0.74 [‐1.07, ‐0.41] |
| 2.2 Lower limb strengthening | 13 | 1066 | Std. Mean Difference (IV, Random, 95% CI) | ‐0.54 [‐0.83, ‐0.26] |
| 2.3 Strengthening and aerobics | 10 | 1231 | Std. Mean Difference (IV, Random, 95% CI) | ‐0.52 [‐0.67, ‐0.36] |
| 2.4 Walking programmes | 3 | 317 | Std. Mean Difference (IV, Random, 95% CI) | ‐0.35 [‐0.58, ‐0.11] |
| 2.5 Other programmes | 10 | 915 | Std. Mean Difference (IV, Random, 95% CI) | ‐0.27 [‐0.47, ‐0.07] |
| Outcome or subgroup title | No. of studies | No. of participants | Statistical method | Effect size |
| 1 Pain Show forest plot | 44 | 3588 | Std. Mean Difference (IV, Random, 95% CI) | ‐0.50 [‐0.60, ‐0.41] |
| 1.1 Individual treatments | 14 | 1133 | Std. Mean Difference (IV, Random, 95% CI) | ‐0.76 [‐1.01, ‐0.52] |
| 1.2 Class‐based programmes | 24 | 1905 | Std. Mean Difference (IV, Random, 95% CI) | ‐0.42 [‐0.51, ‐0.33] |
| 1.3 Home programmes | 7 | 550 | Std. Mean Difference (IV, Random, 95% CI) | ‐0.38 [‐0.55, ‐0.21] |
| 2 Physical Function Show forest plot | 45 | 4344 | Std. Mean Difference (IV, Random, 95% CI) | ‐0.49 [‐0.61, ‐0.38] |
| 2.1 Individual treatments | 16 | 1493 | Std. Mean Difference (IV, Random, 95% CI) | ‐0.76 [‐1.03, ‐0.50] |
| 2.2 Class‐based programmes | 24 | 2152 | Std. Mean Difference (IV, Random, 95% CI) | ‐0.38 [‐0.49, ‐0.26] |
| 2.3 Home programmes | 7 | 699 | Std. Mean Difference (IV, Random, 95% CI) | ‐0.37 [‐0.53, ‐0.21] |
| Outcome or subgroup title | No. of studies | No. of participants | Statistical method | Effect size |
| 1 Pain Show forest plot | 44 | 3487 | Std. Mean Difference (IV, Random, 95% CI) | ‐0.51 [‐0.60, ‐0.41] |
| 1.1 Fewer than 12 occasions | 10 | 1019 | Std. Mean Difference (IV, Random, 95% CI) | ‐0.40 [‐0.56, ‐0.24] |
| 1.2 12 or more occasions | 34 | 2468 | Std. Mean Difference (IV, Random, 95% CI) | ‐0.55 [‐0.66, ‐0.43] |
| 2 Physical function Show forest plot | 44 | 3913 | Std. Mean Difference (IV, Random, 95% CI) | ‐0.51 [‐0.64, ‐0.39] |
| 2.1 Fewer than 12 occasions | 9 | 1033 | Std. Mean Difference (IV, Random, 95% CI) | ‐0.33 [‐0.57, ‐0.09] |
| 2.2 12 or more occasions | 35 | 2880 | Std. Mean Difference (IV, Random, 95% CI) | ‐0.57 [‐0.71, ‐0.43] |
| Outcome or subgroup title | No. of studies | No. of participants | Statistical method | Effect size |
| 1 Selection and attrition bias: pain Show forest plot | 44 | 3487 | Std. Mean Difference (IV, Random, 95% CI) | ‐0.51 [‐0.60, ‐0.41] |
| 1.1 Low risk | 14 | 1458 | Std. Mean Difference (IV, Random, 95% CI) | ‐0.47 [‐0.59, ‐0.36] |
| 1.2 Unclear or high risk | 30 | 2029 | Std. Mean Difference (IV, Random, 95% CI) | ‐0.53 [‐0.67, ‐0.39] |
| 2 Selection and attrition bias: physical function Show forest plot | 44 | 3913 | Std. Mean Difference (IV, Random, 95% CI) | ‐0.52 [‐0.64, ‐0.39] |
| 2.1 Low risk | 14 | 1456 | Std. Mean Difference (IV, Random, 95% CI) | ‐0.45 [‐0.63, ‐0.28] |
| 2.2 Unclear or high risk | 30 | 2457 | Std. Mean Difference (IV, Random, 95% CI) | ‐0.55 [‐0.72, ‐0.38] |
| 3 Detection bias: pain Show forest plot | 44 | 3487 | Std. Mean Difference (IV, Random, 95% CI) | ‐0.51 [‐0.60, ‐0.41] |
| 3.1 Low risk | 3 | 226 | Std. Mean Difference (IV, Random, 95% CI) | ‐0.37 [‐0.87, 0.13] |
| 3.2 Unclear or high risk | 41 | 3261 | Std. Mean Difference (IV, Random, 95% CI) | ‐0.52 [‐0.61, ‐0.42] |
| 4 Detection bias: physical function Show forest plot | 44 | 3913 | Std. Mean Difference (IV, Random, 95% CI) | ‐0.52 [‐0.64, ‐0.39] |
| 4.1 Low risk | 3 | 226 | Std. Mean Difference (IV, Random, 95% CI) | ‐0.46 [‐1.14, 0.22] |
| 4.2 Unclear or high risk | 41 | 3687 | Std. Mean Difference (IV, Random, 95% CI) | ‐0.52 [‐0.65, ‐0.40] |