Toxina botulínica tipo B para la distonía cervical
Referencias
Referencias de los estudios incluidos en esta revisión
Referencias de los estudios excluidos de esta revisión
Referencias adicionales
Referencias de otras versiones publicadas de esta revisión
Characteristics of studies
Characteristics of included studies [ordered by study ID]
Ir a:
| Methods | Randomised, multi‐centre, double‐blind, three‐arm, parallel, phase III study Method of randomisation: master randomisation tables generated by an independent organisation Data analysed on intention‐to‐treat basis Location: multiple centres in the USA Duration: 16 weeks | |
| Participants | 109 participants were enrolled Placebo arm: 36 participants (2 withdrawals: 5.5%), 21 participants were female and 15 were male, mean age was 54.3 ± 12.2 (SD) years, ethnicity: 32 white and 4 black, mean duration of symptoms not stated, mean TWSTRS‐Total score at baseline: 43.6 ± 9 (SD) BtB 5000 U arm: 36 participants (1 withdrawal: 2.7%), 18 participants were female and 18 were male, mean age was 57.6 ± 12.3 (SD) years, ethnicity: 35 white and 1 black, mean duration of symptoms not stated, mean TWSTRS‐Total score at baseline: 46.4 ± 10.4 (SD) BtB 10,000 U arm: 37 participants (1 withdrawal: 2.7%), 28 participants were female and 9 were male, mean age was 56.2 ± 11.8 (SD), ethnicity: 33 white and 4 black, mean duration of symptoms not stated, mean TWSTRS‐Total score at baseline: 46.9 ± 9.6 (SD). Inclusion criteria: Cervical Dystonia (CD) for at least 1 year with involvement of two or more neck muscles and responsive to BtA treatment; TWSTRS‐Total score at baseline of at least 20 with a TWSTRS‐Severity score of at least 10, a TWSTRS‐Disability score of at least 3, and a TWSTRS‐Pain score of at least 1. Age more than 17 years‐old Weight more than 45 Kg Physical and neurological examinations and laboratory tests acceptable clinically Informed consent. Exclusion criteria: Bt injections in the previous 4 months for CD; previous participation in BtB trial; neck contractures or cervical spine disease; pure retrocollis or anterocollis; use of drugs that could interfere with efficacy and security evaluations (e.g., narcotics, benzodiazepines); acute or chronic medical condition or known drug hypersensitivity to the study drug; history of myotomy or denervation surgery of the neck; previous tetanus toxoid in the last 4 months; history of clinically persistent neurological or neuromuscular disorder; and women of child‐bearing potential who were pregnant or breast‐feeding | |
| Interventions | The study drug (BtB) was provided by Athenas Neurociences, Inc in vials that contained placebo or 5000 U in a 1 ml sterile solution, buffered to a pH of 5.5, and refrigerated. Each participant was randomly assigned to one of the three groups: placebo, 5000 U of BtB or 10,000 U BtB. A total of 2 ml of the study drug was injected into two to four involved CD muscles selected by the investigator with or without the use of electromyography. Based on the investigator's judgement, the proportionate volume per muscle was divided and injected into one to five sites. Each participant received only one treatment | |
| Outcomes | The primary efficacy outcome was the change in TWSTRS‐Total score at week 4 Secondary efficacy outcomes included changes in two visual analogue scales (Patient Global Assessment of Change and Principal investigator Global Assessment of Change) at week 4, and change in TWSTRS‐Total score at weeks 8 and 12 Tertiary efficacy outcomes included change in visual analogue scale Patient Analog Pain Assessment at week 4, and changes in the TWSTRS sub‐scales scores at weeks 4 and 16. For all outcomes data were collected at treatment visit (day 1), and at weeks 2, 4, 8, 12, and 16 (termination). Adverse events data were collected at each visit | |
| Notes | Reasons for withdrawal: in the placebo group one discontinued the study because of lack of effect and one participant due to request related to a new job; in the 5000 U group one participant discontinued because of lack of effect; in the 10,000 U group one participant discontinued because of a serious adverse effect (death following coronary artery bypass surgery). Results were presented as variance of the means of the various outcome scales scores without individual data. An estimation of duration of treatment effect was made based on time to return to baseline TWSTRS‐Total score | |
| Risk of bias | ||
| Bias | Authors' judgement | Support for judgement |
| Random sequence generation (selection bias) | Low risk | "Master randomisation tables were generated by an independent organisation (Pharmaceutical Research Associates)." Method of randomisation not specified |
| Allocation concealment (selection bias) | Low risk | "Investigators, patients, and the sponsor were blinded to drug assignment until after the database was locked and analyzed." |
| Blinding of participants and personnel (performance bias) | Low risk | "The study drug was provided by Athena Neurosciences, Inc. in 3.5‐mL vials containing either 5000U of NeurBloc or placebo (same solution without toxin)." Study described as double blind |
| Blinding of outcome assessment (detection bias) | Low risk | "The principal investigator (PI) completed all screening, day 1 activities, and subsequently completed only the TWSTRS and PI Global Assessment of Change. After study‐drug injection, no other information about the patient was provided to or discussed with the PI." |
| Blinding of outcome assessment (detection bias) | Unclear risk | "The administrative investigator (...) conducted all other activities for weeks 1 to 12 and termination visit." |
| Incomplete outcome data (attrition bias) | Low risk | Post‐randomisation exclusions were low and distributed evenly between groups (BTB 5000 U group = 1; BTB 10,000 U group = 1; Placebo group = 2), and the reasons were described |
| Selective reporting (reporting bias) | Low risk | "The ITT dataset was used for all analyses." |
| Enriched population – preferential enrolment of positive responders | High risk | "Patients were eligible (...) if their CD continued to respond to BoNT/A treatment." |
| Enriched population – exclusion of poor responders | High risk | "Patients were excluded if they (...) had pure anterocollis or retrocollis." |
| Other issues | High risk | "Supported by a grant from Athena Neurosciences, Inc." |
| Methods | Randomised, multicenter, placebo‐controlled, double‐blind, two‐arm, parallel, phase III study Method of randomisation: master randomisation tables generated by an independent organisation Data analysed on an intention‐to‐treat basis Location: seven centres in the USA Duration: 16 weeks | |
| Participants | 77 participants were enrolled Placebo arm: 38 participants (1 withdrawal: 2.6%); 26 participants were female and 12 were male; mean age was 52.6 ± 13.3 (SD) years; ethnicity: all participants were White; mean duration of symptoms not stated; mean TWSTRS‐Total score at baseline: 51.2 ± 9.5 (SD). BtB 10,000 U arm: 39 participants (0 withdrawals); 27 participants were female and 12 were male; mean age was 56.6 ± 11.7 (SD); ethnicity: all participants were White; mean duration of symptoms not stated; mean TWSTRS‐Total score at baseline: 52.8 ± 8.6 (SD). Inclusion criteria: Cervical Dystonia (CD) for at least one year of duration with involvement of two or more neck muscles, and considered clinically non‐responsive to BtA treatment with an appropriate frontalis‐type A test result; TWSTRS‐Total score at baseline of at least 20 with a TWSTRS‐Severity score of at least 10, a TWSTRS‐Disability score of at least 3, and a TWSTRS‐Pain score of at least 1 Age more than 17 years‐old Weight more than 45 Kg Physical and neurological examinations and laboratory tests acceptable clinically Informed consent Exclusion criteria: Bt injections in the previous four months for CD; previous participation in a BtB trial; neck contractures or cervical spine disease that limit range of motion; pure retrocollis or anterocollis; use of drugs that could interfere with efficacy and security evaluations (e.g., narcotics, benzodiazepines); previous tetanus toxoid in the last 4 months; use of any investigational drug or device within 30 days of entry into the study; current acute or chronic medical condition or known drug hypersensitivity to the study drug that would preclude Bt injections; history of myotomy or denervation surgery of the neck; history of clinically persistent neurological or neuromuscular disorder; and women of child‐bearing potential who were pregnant or breast‐feeding | |
| Interventions | The study drug (BtB) was provided by Athenas Neurociences, Inc in vials that contained placebo or 5000 U of BtB in a 1 ml sterile solution. Each participant was randomly assigned to one of the 2 groups: placebo or 10,000 U BtB. A total of 2 ml of the study drug was injected into 2 to 4 involved CD muscles selected by the investigator with or without the use of electromyography. Based on the investigator judgement, the proportionate volume per muscle was divided and injected into one to five sites. Each participant received only one treatment | |
| Outcomes | The primary efficacy outcome was the change in TWSTRS‐Total score at week 4 Secondary efficacy outcomes included changes in two visual analogue scales (Patient Global Assessment of Change and Principal investigator Global Assessment of Change) at week 4, and change in TWSTRS‐Total score at weeks 8 and 12 Tertiary efficacy outcomes included change in visual analogue scale Patient Analog Pain Assessment at week 4, changes in the TWSTRS subscales scores at week 4, and change in TWSTRS‐Total score at week 16 All outcomes data were collected at treatment visit (day 1), and at weeks 2, 4, 8, 12, and 16 (termination). The results of the primary outcome were used to assess the duration of clinical benefit. Adverse events data were collected at each visit | |
| Notes | Reasons for withdrawal: in the placebo group 1 discontinued the study because of an adverse effect Results are presented as variance of the means of the various outcome scales scores without individual data. An estimation of duration of treatment effect was made based on time to return to baseline TWSTRS‐Total score | |
| Risk of bias | ||
| Bias | Authors' judgement | Support for judgement |
| Random sequence generation (selection bias) | Low risk | "Master randomisation tables were generated by an independent organisation (Pharmaceutical Research Associates)." |
| Allocation concealment (selection bias) | Low risk | "Investigators, patients, and the sponsor were blinded to drug assignment until after the database was locked and analyzed" |
| Blinding of participants and personnel (performance bias) | Low risk | "The study drug, provided by Athena Neurosciences, Inc. in 3.5‐mL vials containing either 5000 U of NeurBloc or placebo (same solution without toxin)." |
| Blinding of outcome assessment (detection bias) | Low risk | "The principal investigator (PI) performed all screening assessments, (...) and performed the injection, in addition to acquiring all TWSTRS scores and the PI Global Assessment of Change." |
| Blinding of outcome assessment (detection bias) | Unclear risk | "The administrative investigator (...) performed all other activities for each visit (including adverse events collection and assessment. Patients were instructed not to divulge any AE information to the principal investigator." |
| Incomplete outcome data (attrition bias) | Low risk | Post‐randomisation exclusions were low (Placebo group = 1), and the reasons were described. |
| Selective reporting (reporting bias) | Low risk | "The ITT dataset was used for all analyses." |
| Enriched population – preferential enrolment of positive responders | Low risk | Trial in botulinum toxin type A‐non‐responsive CD |
| Enriched population – exclusion of poor responders | High risk | "Patients were excluded if they (...) had pure anterocollis or retrocollis." |
| Other issues | High risk | “Supported by a grant from Athena Neurosciences, Inc.” |
| Methods | Randomised, double‐blind, four‐arm, parallel, study Method of randomisation: random sequence was generated by independent organisation, but randomisation sequence was not described Data analysed on an intention‐to‐treat basis Location: Japan Duration: 16 weeks | |
| Participants | 130 participants were administered Bt Placebo arm: 33 participants (4 withdrawals, 2 of them before the study medication: 12.1%), 12 participants were female and 21 were male, mean age was 49.7 ± 13.6 (SD) years, ethnicity not stated, mean duration of symptoms: 7.84 ± 7.1 (SD) years, mean TWSTRS‐Total score at baseline: 44.0 ± 8.8 (SD) BtB 2500 U arm: 34 participants (1 withdrawal: 1.94%), 11 participants were female and 23 were male, mean age was 50.8 ± 14.7 (SD) years, ethnicity not stated, mean duration of symptoms: 8.53 ± 7.41 (SD) years, mean TWSTRS‐Total score at baseline: 43.9 ± 7.5 (SD) BtB 5000 U arm: 32 participants (2 withdrawals, 1 of them before study medication: 6.25%), 15 participants were female and 17 were male, mean age was 46.8 ± 12.5 (SD) years, ethnicity not stated, mean duration of symptoms: 5.58 ± 5.90 (SD) years, mean TWSTRS‐Total score at baseline: 43.2 ± 9.7 (SD) BtB 10,000 U arm: 31 participants (2 withdrawals: 6.45%), 14 participants were female and 17 were male, mean age was 50.0 ± 12.6 (SD) years, ethnicity not stated, mean duration of symptoms: 6.76 ± 5.10 (SD) years, mean TWSTRS‐Total score at baseline: 42.4 ± 8.8 (SD) | |
| Interventions | Study drug (BtB) and placebo were prepared by mixing three unlabelled vials. Each participant was randomly assigned to one of the 4 groups: placebo, 2500 U of BtB, 5000 U of BtB, or 10,000 U BtB. Each participant received only one treatment The provider of the study drug is not stated, though members of Eisai Co., Ltd were included as authors | |
| Outcomes | The primary efficacy outcome was the change in TWSTRS‐Total score from baseline at week 4 Secondary efficacy outcomes included changes in two visual analogue scales (Patient Global and Pain Assessment of Change, and Principal investigator Global Assessment of Change), and change in TWSTRS severity, disability and pain score at week 4. Adverse effects were collected | |
| Notes | Reasons for withdrawals: 3 of the 133 participants withdrew before the start of study medication (2 participants in placebo group and 1 participant in 5000 U group). Two of these withdrawals were due to participant request, and the other participant did not attend hospital The motive of each participant was not reported After medication, 2 participants in placebo group, 1 participant in 2500 U group and 1 participant in 5000 U group requested to discontinue the study; and 2 participants in 10,000 U group moved to another treatment because of lack of effect There were no adverse events that led to death, serious disorders or study withdrawal. Results are presented as variance of the means of the various outcome scales scores without individual data | |
| Risk of bias | ||
| Bias | Authors' judgement | Support for judgement |
| Random sequence generation (selection bias) | Unclear risk | Random sequence was not described |
| Allocation concealment (selection bias) | Low risk | Randomisation was generated by an independent organisation |
| Blinding of participants and personnel (performance bias) | Low risk | Placebo and active drug were prepared by mixing three unlabelled vials |
| Blinding of outcome assessment (detection bias) | Unclear risk | No description of the process |
| Blinding of outcome assessment (detection bias) | Unclear risk | No description of the process |
| Incomplete outcome data (attrition bias) | Low risk | The missing data maximum ratio was 11% in placebo group and balanced across group |
| Selective reporting (reporting bias) | Low risk | All outcomes in methods were reported |
| Enriched population – preferential enrolment of positive responders | Low risk | The study allowed the entrance of BtA‐naive and ‐non‐responsive patients |
| Enriched population – exclusion of poor responders | Low risk | Enrolled participants were consistent with review protocol |
| Other issues | High risk | No description of funding, but members of Eisai Co., Ltd were included as authors |
| Methods | Randomised, multicenter, placebo‐controlled, double‐blind, four‐arm, parallel, phase II study Method of randomisation: not described Data analysed on an intention‐to‐treat basis Location: multiple centres in the USA Duration: 16 weeks | |
| Participants | 122 participants aged 19 to 81 years were enrolled. 67% of the participants were female. 97% were White, 1.6% were Hispanic and 1.6% were Afro‐American. 79% were responsive to BtA treatment and 21% were BtA‐non‐responsive. Placebo arm: 30 participants, mean duration of symptoms not stated, mean TWSTRS‐Total score was 45.5 BtB 2500 U arm: 31 participants, mean duration of symptoms not stated, mean TWSTRS‐Total score at baseline was 45.6 BtB 5000 U arm: 31 participants, mean duration of symptoms not stated, mean TWSTRS‐Total score at baseline was 45.2. BtB 10,000 U arm: 30 participants, mean duration of symptoms not stated, mean TWSTRS‐Total score at baseline was 47.5. Inclusion criteria: Idiopathic Cervical Dystonia (CD) of 1 to 10 years' duration with involvement of 2 or more neck muscles, either responsive or non‐‐responsive to BtA treatment; TWSTRS‐Total score at baseline of at least 20 with a TWSTRS‐Severity score of at least 10, a TWSTRS‐Disability score of at least 3, and a TWSTRS‐Pain score of at least 1 Age more than 17 years‐old Weight more than 45 Kg Physical and neurological examinations and laboratory tests acceptable clinically Informed consent Exclusion criteria: Primary nonresponder to BtA injection; Bt injections in the previous 4 months for CD; no return to inter‐treatment baseline clinical dystonia status; neck contractures or cervical spine disease that limit range of motion; pure retrocollis or anterocollis; use of drugs that could interfere with efficacy and security evaluations (e.g., narcotics, benzodiazepines); use of aminoglycosides or any investigational drug or device within 30 days of entry into the study; current acute or chronic medical condition or known drug hypersensitivity to the study drug that would preclude Bt injections; history of myotomy or denervation surgery of the neck; history of clinically persistent neurological or neuromuscular disorder; and women pregnant or nursing | |
| Interventions | The study drug (BtB) was provided by Athenas Neurociences, Inc in vials that contained placebo, 2500 U or 5000 U of BtB in a 1 ml sterile solution. Each participant was randomly assigned to one of the 4 groups: placebo, 2500 U, 5000 U or 10,000 U BtB. A total of 2 ml of the study drug was injected into 2 to 4 involved CD muscles selected by the investigator with or without the use of electromyography. The study drug (in a volume of 2 ml) could be further diluted by adding 0.9% sterile normal saline without preservative up to a maximal final volume of 5 ml. Each participant received only one treatment | |
| Outcomes | The primary efficacy outcome was the change in TWSTRS‐Total score at week 4 Secondary efficacy outcomes included changes in three visual analogue scales (Patient Global Assessment of Change, Patient Analog Pain Assessment, and Principal investigator Global Assessment of Change) at week 4, changes in the TWSTRS subscales scores at week 4, change in TWSTRS‐Total score at week 8, 12 and 16, and change in Sickness Impact Profile (SIP) at week 4. With the exception of SIP all outcomes data were collected at treatment visit (day 1), and at weeks 2, 4, 8, 12, and 16 (termination). The results of the primary outcome were used to assess the duration of clinical benefit. Adverse events data were either spontaneously reported by participants or elicited by the investigators at each visit. BtB antibodies were determined by ELISA at baseline and week 4 | |
| Notes | All participants completed the study per the protocol | |
| Risk of bias | ||
| Bias | Authors' judgement | Support for judgement |
| Random sequence generation (selection bias) | Unclear risk | Method of randomisation not specified |
| Allocation concealment (selection bias) | Unclear risk | Method of concealment not specified |
| Blinding of participants and personnel (performance bias) | Low risk | "The study drug was provided by Athena Neurosciences, Inc. in 5‐mL vials containing either 2500U or 5000U of NeurBloc in 1‐mL sterile solution. The same sterile solution (without toxin) was used as placebo." |
| Blinding of outcome assessment (detection bias) | Unclear risk | Blinding not specified although study described as double blind |
| Blinding of outcome assessment (detection bias) | Unclear risk | Blinding not specified although study described as double blind Although placebo was identical to intervention, the fact that all of the participants had previously been treated with botulinum toxin could have led to a degree of bias |
| Incomplete outcome data (attrition bias) | Low risk | "All patients completed the study per protocol." |
| Selective reporting (reporting bias) | Low risk | "The primary analyses included all patients who entered the study, received the study drug, and had at least one visit during which efficacy data were obtained." |
| Enriched population – preferential enrolment of positive responders | Low risk | "Patients were excluded if they were a primary nonresponder to type A toxin injection." |
| Enriched population – exclusion of poor responders | High risk | "Patients were excluded if they (...) had pure anterocollis or retrocollis." |
| Other issues | Unclear risk | Not stated |
SD: Standard deviation.
Characteristics of excluded studies [ordered by study ID]
Ir a:
| Study | Reason for exclusion |
| This is a randomised, multicentre (USA), double‐blind, placebo‐controlled, single dose, four‐arm, dose‐finding parallel group design study. The follow‐up was 16 weeks. 85 participants were enrolled. Mean age was 53.2 years (18‐80). 38% of the participants were male and 62% were female. 95% were White. The study included both BtA‐responsive and ‐non‐responsive participants. The study drug (BtB) was provided by Athenas Neurociences, Inc. Each participant was randomly assigned to one of the 4 groups: placebo, 400 U, 1200 U or 2400 U of BtB. The study drug was injected into 2 to 4 superficial neck and/or shoulder muscle groups. Each participant received only one treatment. The primary efficacy outcome was the change in TWSTRS‐Total score (range 0 to 87). One participant in the placebo group withdrew because of an adverse effect. This study was excluded because data was not available | |
| This trial was a sequential dose‐escalation, safety, and tolerability study of BtB in subjects with cervical dystonia. Participants were assigned to one of three doses of BtB: 10,000 U, 12,500 U, and 15,000 U. Efficacy was evaluated using TWSTRS total and subscale scores and three VAS. The study was excluded for being open‐label and not having a placebo group | |
| 145 participants with cervical dystonia were enrolled. The study was open‐label and compared three different doses of BtB without a placebo group | |
| This was a non‐randomised, non‐controlled study enrolling 9 participants with cervical dystonia aiming to test the immunogenicity of botulinum toxin type B in patients naïve to botulinum toxin treatment | |
| This was a double‐blind study evaluating botulinum toxin type B diluted with preserved versus nonpreserved isotonic saline. Ten participants were treated on each half of the frontalis muscle with a total of 2400 units of botulinum toxin type B diluted either with preserved or nonpreserved saline. In addition to studying a different population, the study is not placebo‐controlled as both arms are treated with BtB | |
| This was a non‐randomised, non‐controlled, multicenter study enrolling 100 participants with cervical dystonia aiming to test the immunogenicity of botulinum toxin type B | |
| This paper describes an analysis of a subset of efficacy data from two randomised, double blind, placebo‐controlled clinical trials already included in this systematic review (Brashear 1999; Brin 1999) | |
| 12 participants with cervical dystonia were enrolled. The study was open‐label and compared different doses of BtB without a placebo group |
Data and analyses
| Outcome or subgroup title | No. of studies | No. of participants | Statistical method | Effect size |
| 1 Overall cervical dystonia improvement as assessed with TWSTRS: change from baseline to week 4 Show forest plot | 3 | Mean Difference (Fixed, 95% CI) | 6.78 [4.54, 9.01] | |
| Analysis 1.1  Comparison 1 Botulinum toxin type B vs Placebo, Outcome 1 Overall cervical dystonia improvement as assessed with TWSTRS: change from baseline to week 4. | ||||
| 2 Overall cervical dystonia improvement as assessed with TWSTRS: change from baseline to week 4 ‐ Doses subgroup analysis Show forest plot | 4 | Mean Difference (Fixed, 95% CI) | Subtotals only | |
| Analysis 1.2  Comparison 1 Botulinum toxin type B vs Placebo, Outcome 2 Overall cervical dystonia improvement as assessed with TWSTRS: change from baseline to week 4 ‐ Doses subgroup analysis. | ||||
| 2.1 2500 units | 2 | Mean Difference (Fixed, 95% CI) | 6.95 [3.70, 10.21] | |
| 2.2 5000 units | 3 | Mean Difference (Fixed, 95% CI) | 6.10 [3.40, 8.81] | |
| 2.3 10,000 units | 4 | Mean Difference (Fixed, 95% CI) | 8.72 [6.35, 11.10] | |
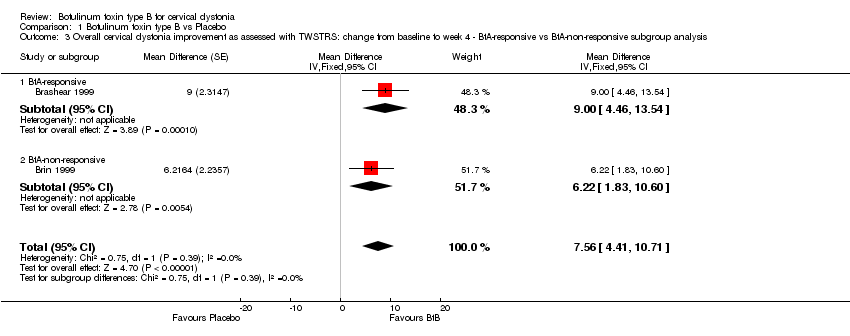
| 3 Overall cervical dystonia improvement as assessed with TWSTRS: change from baseline to week 4 ‐ BtA‐responsive vs BtA‐non‐responsive subgroup analysis Show forest plot | 2 | Mean Difference (Fixed, 95% CI) | 7.56 [4.41, 10.71] | |
| Analysis 1.3  Comparison 1 Botulinum toxin type B vs Placebo, Outcome 3 Overall cervical dystonia improvement as assessed with TWSTRS: change from baseline to week 4 ‐ BtA‐responsive vs BtA‐non‐responsive subgroup analysis. | ||||
| 3.1 BtA‐responsive | 1 | Mean Difference (Fixed, 95% CI) | 9.0 [4.46, 13.54] | |
| 3.2 BtA‐non‐responsive | 1 | Mean Difference (Fixed, 95% CI) | 6.22 [1.83, 10.60] | |
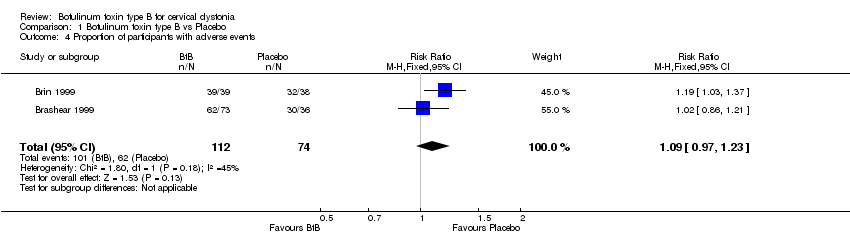
| 4 Proportion of participants with adverse events Show forest plot | 2 | 186 | Risk Ratio (M‐H, Fixed, 95% CI) | 1.09 [0.97, 1.23] |
| Analysis 1.4  Comparison 1 Botulinum toxin type B vs Placebo, Outcome 4 Proportion of participants with adverse events. | ||||
| 5 Proportion of participants with adverse events ‐ doses subgroup analysis Show forest plot | 2 | Risk Ratio (M‐H, Random, 95% CI) | Subtotals only | |
| Analysis 1.5  Comparison 1 Botulinum toxin type B vs Placebo, Outcome 5 Proportion of participants with adverse events ‐ doses subgroup analysis. | ||||
| 5.1 5000 U | 1 | 72 | Risk Ratio (M‐H, Random, 95% CI) | 1.07 [0.89, 1.29] |
| 5.2 10,000 U | 2 | 150 | Risk Ratio (M‐H, Random, 95% CI) | 1.09 [0.89, 1.33] |
| 6 Proportion of participants with adverse events ‐ BtA‐responsive vs BtA‐non‐responsive subgroup analysis Show forest plot | 2 | Risk Ratio (M‐H, Random, 95% CI) | Subtotals only | |
| Analysis 1.6  Comparison 1 Botulinum toxin type B vs Placebo, Outcome 6 Proportion of participants with adverse events ‐ BtA‐responsive vs BtA‐non‐responsive subgroup analysis. | ||||
| 6.1 BtA‐responsive | 1 | 73 | Risk Ratio (M‐H, Random, 95% CI) | 0.97 [0.79, 1.20] |
| 6.2 BtA‐non‐responsive | 1 | 77 | Risk Ratio (M‐H, Random, 95% CI) | 1.19 [1.03, 1.37] |
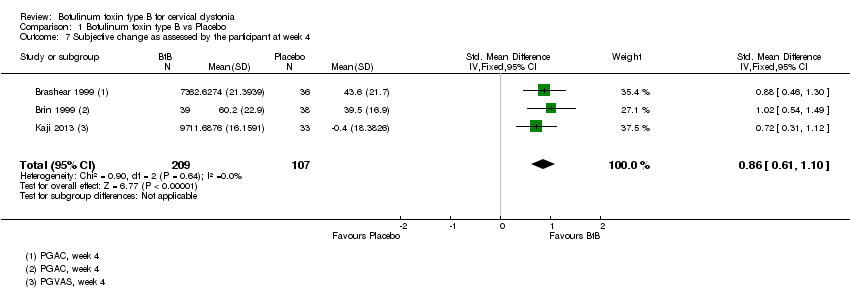
| 7 Subjective change as assessed by the participant at week 4 Show forest plot | 3 | 316 | Std. Mean Difference (IV, Fixed, 95% CI) | 0.86 [0.61, 1.10] |
| Analysis 1.7  Comparison 1 Botulinum toxin type B vs Placebo, Outcome 7 Subjective change as assessed by the participant at week 4. | ||||
| 8 Subjective change as assessed by the clinician at week 4 Show forest plot | 3 | 316 | Std. Mean Difference (IV, Fixed, 95% CI) | 0.80 [0.55, 1.04] |
| Analysis 1.8  Comparison 1 Botulinum toxin type B vs Placebo, Outcome 8 Subjective change as assessed by the clinician at week 4. | ||||
| 9 Subjective change as assessed by the participant at week 4 ‐ doses subgroup analysis Show forest plot | 3 | Mean Difference (IV, Fixed, 95% CI) | Subtotals only | |
| Analysis 1.9  Comparison 1 Botulinum toxin type B vs Placebo, Outcome 9 Subjective change as assessed by the participant at week 4 ‐ doses subgroup analysis. | ||||
| 9.1 2500 U | 1 | 67 | Mean Difference (IV, Fixed, 95% CI) | 12.30 [4.21, 20.39] |
| 9.2 5000 U | 2 | 137 | Mean Difference (IV, Fixed, 95% CI) | 9.71 [4.05, 15.37] |
| 9.3 10,000 U | 3 | 214 | Mean Difference (IV, Fixed, 95% CI) | 15.12 [10.32, 19.91] |
| 10 Subjective change as assessed by the clinician at week 4 ‐ doses subgroup analysis Show forest plot | 3 | Mean Difference (IV, Fixed, 95% CI) | Subtotals only | |
| Analysis 1.10  Comparison 1 Botulinum toxin type B vs Placebo, Outcome 10 Subjective change as assessed by the clinician at week 4 ‐ doses subgroup analysis. | ||||
| 10.1 2500 U | 1 | 67 | Mean Difference (IV, Fixed, 95% CI) | 8.60 [1.46, 15.74] |
| 10.2 5000 U | 2 | 137 | Mean Difference (IV, Fixed, 95% CI) | 10.84 [5.65, 16.04] |
| 10.3 10,000 U | 3 | 214 | Mean Difference (IV, Fixed, 95% CI) | 13.22 [9.39, 17.05] |
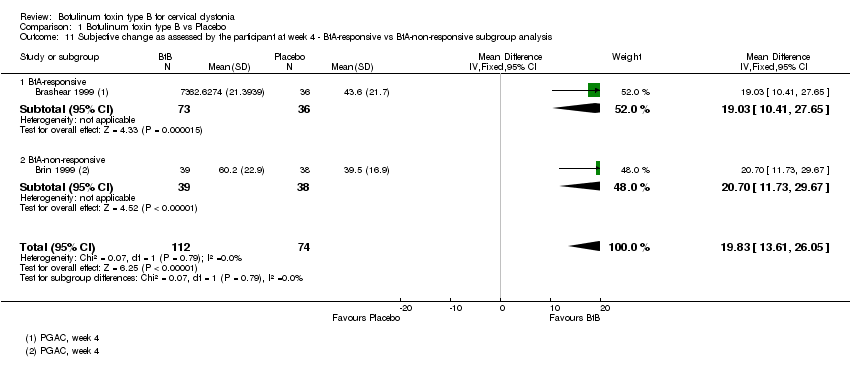
| 11 Subjective change as assessed by the participant at week 4 ‐ BtA‐responsive vs BtA‐non‐responsive subgroup analysis Show forest plot | 2 | 186 | Mean Difference (IV, Fixed, 95% CI) | 19.83 [13.61, 26.05] |
| Analysis 1.11  Comparison 1 Botulinum toxin type B vs Placebo, Outcome 11 Subjective change as assessed by the participant at week 4 ‐ BtA‐responsive vs BtA‐non‐responsive subgroup analysis. | ||||
| 11.1 BtA‐responsive | 1 | 109 | Mean Difference (IV, Fixed, 95% CI) | 19.03 [10.41, 27.65] |
| 11.2 BtA‐non‐responsive | 1 | 77 | Mean Difference (IV, Fixed, 95% CI) | 20.70 [11.73, 29.67] |
| 12 Subjective change as assessed by the clinician at week 4 ‐ BtA‐non‐responsive vs ‐responsive subgroup analysis Show forest plot | 2 | Mean Difference (IV, Fixed, 95% CI) | Subtotals only | |
| Analysis 1.12  Comparison 1 Botulinum toxin type B vs Placebo, Outcome 12 Subjective change as assessed by the clinician at week 4 ‐ BtA‐non‐responsive vs ‐responsive subgroup analysis. | ||||
| 12.1 BtA‐responsive | 1 | 109 | Mean Difference (IV, Fixed, 95% CI) | 12.74 [5.83, 19.65] |
| 12.2 BtA‐non‐responsive | 1 | 77 | Mean Difference (IV, Fixed, 95% CI) | 12.70 [7.04, 18.36] |
| 13 Cervical dystonia associated pain: change from baseline to week 4 as assessed with TWSTRS Show forest plot | 2 | Mean Difference (Fixed, 95% CI) | 2.20 [1.25, 3.15] | |
| Analysis 1.13  Comparison 1 Botulinum toxin type B vs Placebo, Outcome 13 Cervical dystonia associated pain: change from baseline to week 4 as assessed with TWSTRS. | ||||
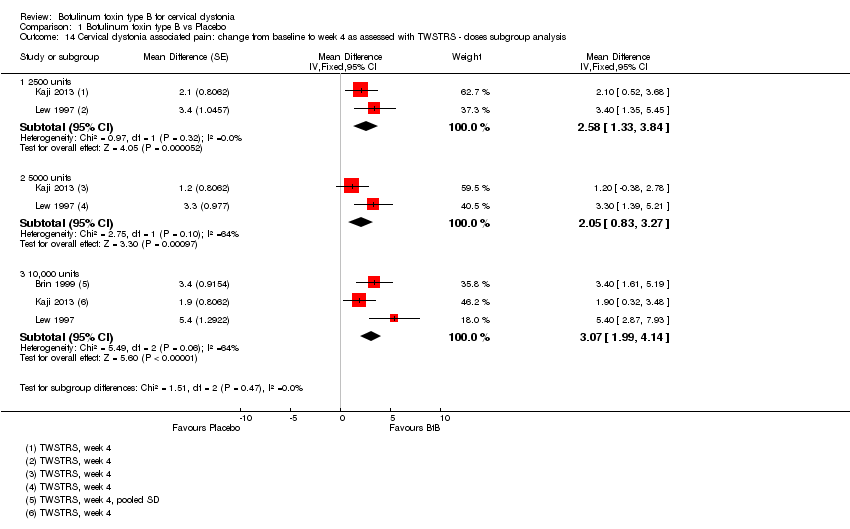
| 14 Cervical dystonia associated pain: change from baseline to week 4 as assessed with TWSTRS ‐ doses subgroup analysis Show forest plot | 3 | Mean Difference (Fixed, 95% CI) | Subtotals only | |
| Analysis 1.14  Comparison 1 Botulinum toxin type B vs Placebo, Outcome 14 Cervical dystonia associated pain: change from baseline to week 4 as assessed with TWSTRS ‐ doses subgroup analysis. | ||||
| 14.1 2500 units | 2 | Mean Difference (Fixed, 95% CI) | 2.58 [1.33, 3.84] | |
| 14.2 5000 units | 2 | Mean Difference (Fixed, 95% CI) | 2.05 [0.83, 3.27] | |
| 14.3 10,000 units | 3 | Mean Difference (Fixed, 95% CI) | 3.07 [1.99, 4.14] | |
| 15 Cervical dystonia associated pain: change from baseline to week 4 as assessed with validated scales ‐ BtA‐responsive vs BtA‐non‐responsive subgroup analysis Show forest plot | 2 | Std. Mean Difference (Fixed, 95% CI) | 0.96 [0.65, 1.27] | |
| Analysis 1.15  Comparison 1 Botulinum toxin type B vs Placebo, Outcome 15 Cervical dystonia associated pain: change from baseline to week 4 as assessed with validated scales ‐ BtA‐responsive vs BtA‐non‐responsive subgroup analysis. | ||||
| 15.1 BtA‐responsive | 1 | Std. Mean Difference (Fixed, 95% CI) | 0.92 [0.50, 1.34] | |
| 15.2 BtA‐non‐responsive | 1 | Std. Mean Difference (Fixed, 95% CI) | 1.01 [0.53, 1.48] | |
| 16 Cervical dystonia severity: change from baseline to week 4 as assessed with TWSTRS Show forest plot | 2 | Mean Difference (Fixed, 95% CI) | 2.43 [1.24, 3.63] | |
| Analysis 1.16  Comparison 1 Botulinum toxin type B vs Placebo, Outcome 16 Cervical dystonia severity: change from baseline to week 4 as assessed with TWSTRS. | ||||
| 17 Cervical dystonia severity: change from baseline to week 4 as assessed with TWSTRS ‐ doses subgroup analysis Show forest plot | 3 | Mean Difference (Fixed, 95% CI) | Subtotals only | |
| Analysis 1.17  Comparison 1 Botulinum toxin type B vs Placebo, Outcome 17 Cervical dystonia severity: change from baseline to week 4 as assessed with TWSTRS ‐ doses subgroup analysis. | ||||
| 17.1 2500 units | 2 | Mean Difference (Fixed, 95% CI) | 1.9 [0.55, 3.25] | |
| 17.2 5000 units | 2 | Mean Difference (Fixed, 95% CI) | 2.51 [1.25, 3.77] | |
| 17.3 10,000 units | 3 | Mean Difference (Fixed, 95% CI) | 2.96 [1.87, 4.05] | |
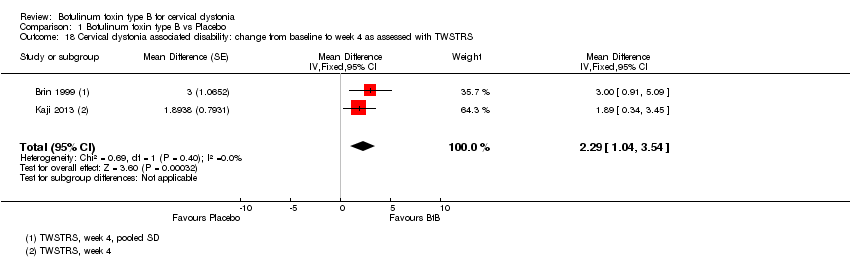
| 18 Cervical dystonia associated disability: change from baseline to week 4 as assessed with TWSTRS Show forest plot | 2 | Mean Difference (Fixed, 95% CI) | 2.29 [1.04, 3.54] | |
| Analysis 1.18  Comparison 1 Botulinum toxin type B vs Placebo, Outcome 18 Cervical dystonia associated disability: change from baseline to week 4 as assessed with TWSTRS. | ||||
| 19 Cervical dystonia associated disability: change from baseline to week 4 as assessed with TWSTRS ‐ doses subgroup analysis Show forest plot | 3 | Mean Difference (Fixed, 95% CI) | Subtotals only | |
| Analysis 1.19  Comparison 1 Botulinum toxin type B vs Placebo, Outcome 19 Cervical dystonia associated disability: change from baseline to week 4 as assessed with TWSTRS ‐ doses subgroup analysis. | ||||
| 19.1 2500 units | 2 | Mean Difference (Fixed, 95% CI) | 2.32 [0.86, 3.78] | |
| 19.2 5000 units | 2 | Mean Difference (Fixed, 95% CI) | 2.06 [0.55, 3.57] | |
| 19.3 10,000 units | 3 | Mean Difference (Fixed, 95% CI) | 3.22 [2.09, 4.35] | |
| 20 Proportion of withdrawals due to adverse events Show forest plot | 4 | 440 | Risk Ratio (M‐H, Fixed, 95% CI) | 0.88 [0.19, 4.06] |
| Analysis 1.20  Comparison 1 Botulinum toxin type B vs Placebo, Outcome 20 Proportion of withdrawals due to adverse events. | ||||
| 21 Adverse events: dry mouth Show forest plot | 4 | 438 | Risk Ratio (M‐H, Fixed, 95% CI) | 7.65 [2.75, 21.32] |
| Analysis 1.21  Comparison 1 Botulinum toxin type B vs Placebo, Outcome 21 Adverse events: dry mouth. | ||||
| 22 Adverse events: dysphagia Show forest plot | 4 | 438 | Risk Ratio (M‐H, Fixed, 95% CI) | 6.78 [2.42, 19.05] |
| Analysis 1.22  Comparison 1 Botulinum toxin type B vs Placebo, Outcome 22 Adverse events: dysphagia. | ||||
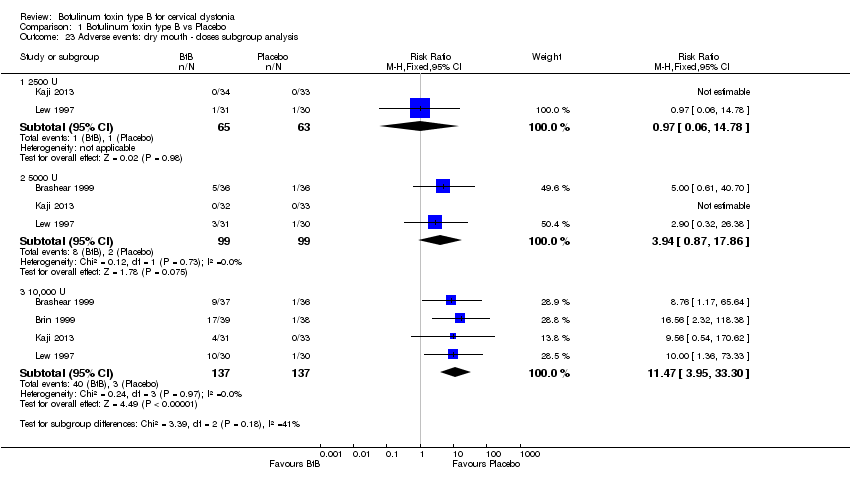
| 23 Adverse events: dry mouth ‐ doses subgroup analysis Show forest plot | 4 | Risk Ratio (M‐H, Fixed, 95% CI) | Subtotals only | |
| Analysis 1.23  Comparison 1 Botulinum toxin type B vs Placebo, Outcome 23 Adverse events: dry mouth ‐ doses subgroup analysis. | ||||
| 23.1 2500 U | 2 | 128 | Risk Ratio (M‐H, Fixed, 95% CI) | 0.97 [0.06, 14.78] |
| 23.2 5000 U | 3 | 198 | Risk Ratio (M‐H, Fixed, 95% CI) | 3.94 [0.87, 17.86] |
| 23.3 10,000 U | 4 | 274 | Risk Ratio (M‐H, Fixed, 95% CI) | 11.47 [3.95, 33.30] |
| 24 Adverse events: dysphagia ‐ doses subgroup analysis Show forest plot | 4 | Risk Ratio (M‐H, Fixed, 95% CI) | Subtotals only | |
| Analysis 1.24  Comparison 1 Botulinum toxin type B vs Placebo, Outcome 24 Adverse events: dysphagia ‐ doses subgroup analysis. | ||||
| 24.1 2500 U | 2 | 128 | Risk Ratio (M‐H, Fixed, 95% CI) | 6.79 [0.86, 53.63] |
| 24.2 5000 U | 3 | 198 | Risk Ratio (M‐H, Fixed, 95% CI) | 5.50 [1.25, 24.17] |
| 24.3 10,000 U | 4 | 274 | Risk Ratio (M‐H, Fixed, 95% CI) | 9.19 [3.38, 25.01] |
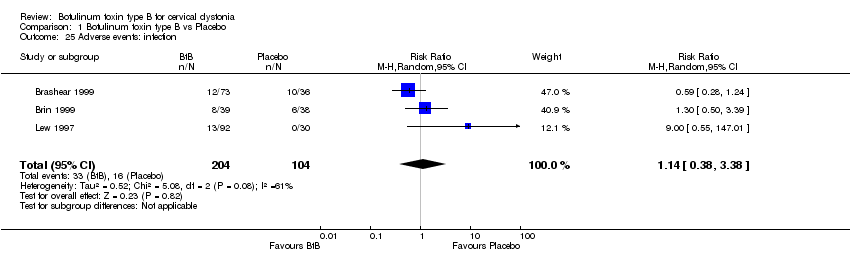
| 25 Adverse events: infection Show forest plot | 3 | 308 | Risk Ratio (M‐H, Random, 95% CI) | 1.14 [0.38, 3.38] |
| Analysis 1.25  Comparison 1 Botulinum toxin type B vs Placebo, Outcome 25 Adverse events: infection. | ||||
| 26 Adverse events: neck pain secondary to CD Show forest plot | 3 | 308 | Risk Ratio (M‐H, Fixed, 95% CI) | 1.08 [0.67, 1.73] |
| Analysis 1.26  Comparison 1 Botulinum toxin type B vs Placebo, Outcome 26 Adverse events: neck pain secondary to CD. | ||||
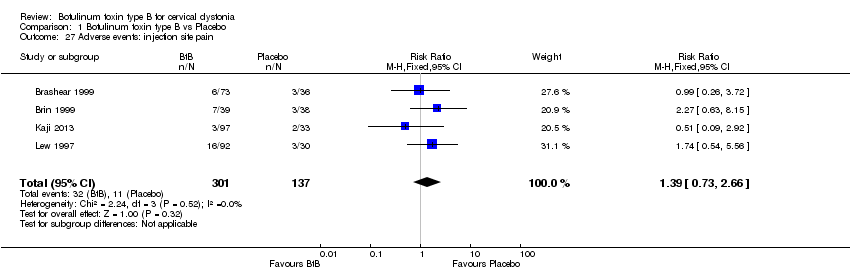
| 27 Adverse events: injection site pain Show forest plot | 4 | 438 | Risk Ratio (M‐H, Fixed, 95% CI) | 1.39 [0.73, 2.66] |
| Analysis 1.27  Comparison 1 Botulinum toxin type B vs Placebo, Outcome 27 Adverse events: injection site pain. | ||||
| 28 Adverse events: nausea Show forest plot | 2 | 199 | Risk Ratio (M‐H, Fixed, 95% CI) | 2.06 [0.68, 6.28] |
| Analysis 1.28  Comparison 1 Botulinum toxin type B vs Placebo, Outcome 28 Adverse events: nausea. | ||||
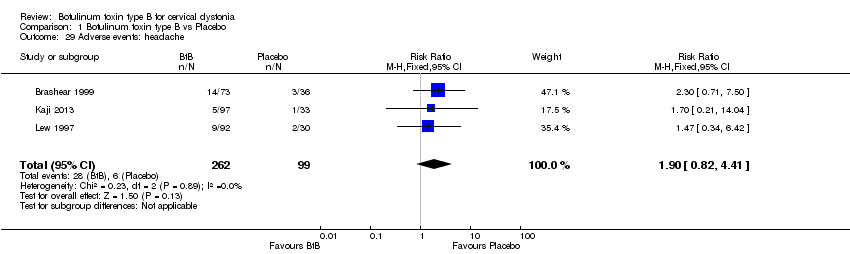
| 29 Adverse events: headache Show forest plot | 3 | 361 | Risk Ratio (M‐H, Fixed, 95% CI) | 1.90 [0.82, 4.41] |
| Analysis 1.29  Comparison 1 Botulinum toxin type B vs Placebo, Outcome 29 Adverse events: headache. | ||||
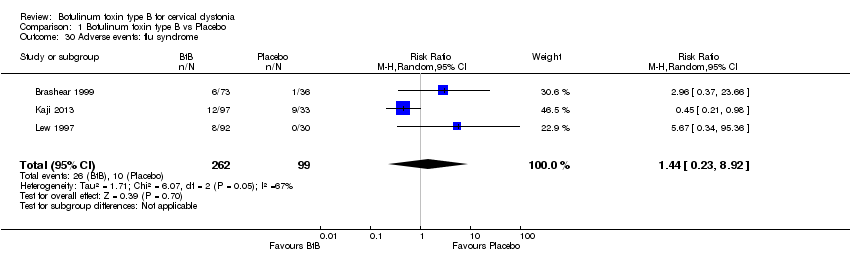
| 30 Adverse events: flu syndrome Show forest plot | 3 | 361 | Risk Ratio (M‐H, Random, 95% CI) | 1.44 [0.23, 8.92] |
| Analysis 1.30  Comparison 1 Botulinum toxin type B vs Placebo, Outcome 30 Adverse events: flu syndrome. | ||||
| 31 Adverse events: pain Show forest plot | 2 | 231 | Risk Ratio (M‐H, Fixed, 95% CI) | 1.15 [0.51, 2.62] |
| Analysis 1.31  Comparison 1 Botulinum toxin type B vs Placebo, Outcome 31 Adverse events: pain. | ||||
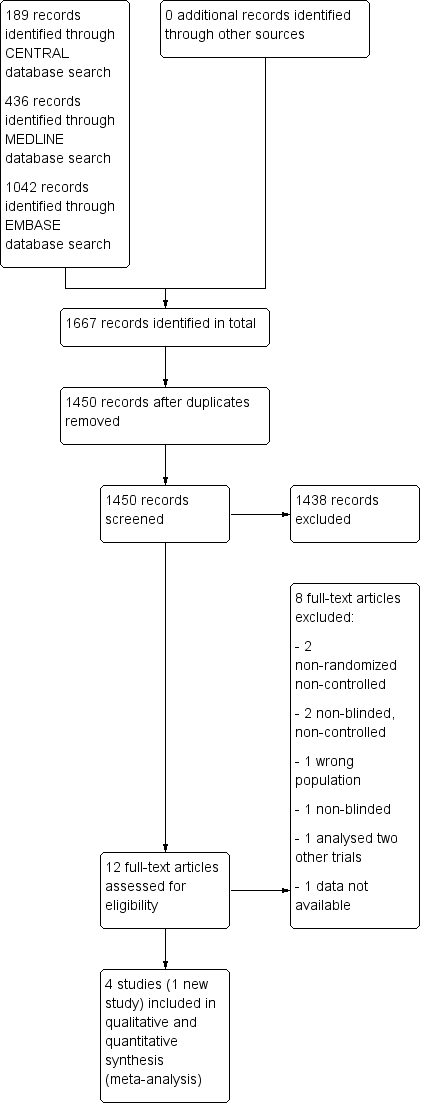
Study flow diagram
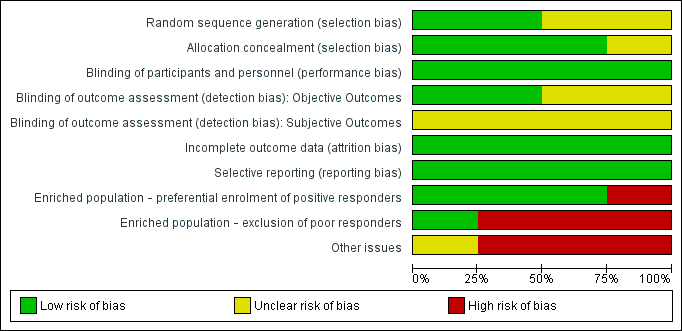
Risk of bias graph: review authors' judgements about each risk of bias item presented as percentages across all included studies.

Risk of bias summary: review authors' judgements about each risk of bias item for each included study.

Comparison 1 Botulinum toxin type B vs Placebo, Outcome 1 Overall cervical dystonia improvement as assessed with TWSTRS: change from baseline to week 4.

Comparison 1 Botulinum toxin type B vs Placebo, Outcome 2 Overall cervical dystonia improvement as assessed with TWSTRS: change from baseline to week 4 ‐ Doses subgroup analysis.
Comparison 1 Botulinum toxin type B vs Placebo, Outcome 3 Overall cervical dystonia improvement as assessed with TWSTRS: change from baseline to week 4 ‐ BtA‐responsive vs BtA‐non‐responsive subgroup analysis.
Comparison 1 Botulinum toxin type B vs Placebo, Outcome 4 Proportion of participants with adverse events.

Comparison 1 Botulinum toxin type B vs Placebo, Outcome 5 Proportion of participants with adverse events ‐ doses subgroup analysis.

Comparison 1 Botulinum toxin type B vs Placebo, Outcome 6 Proportion of participants with adverse events ‐ BtA‐responsive vs BtA‐non‐responsive subgroup analysis.
Comparison 1 Botulinum toxin type B vs Placebo, Outcome 7 Subjective change as assessed by the participant at week 4.

Comparison 1 Botulinum toxin type B vs Placebo, Outcome 8 Subjective change as assessed by the clinician at week 4.

Comparison 1 Botulinum toxin type B vs Placebo, Outcome 9 Subjective change as assessed by the participant at week 4 ‐ doses subgroup analysis.

Comparison 1 Botulinum toxin type B vs Placebo, Outcome 10 Subjective change as assessed by the clinician at week 4 ‐ doses subgroup analysis.
Comparison 1 Botulinum toxin type B vs Placebo, Outcome 11 Subjective change as assessed by the participant at week 4 ‐ BtA‐responsive vs BtA‐non‐responsive subgroup analysis.

Comparison 1 Botulinum toxin type B vs Placebo, Outcome 12 Subjective change as assessed by the clinician at week 4 ‐ BtA‐non‐responsive vs ‐responsive subgroup analysis.

Comparison 1 Botulinum toxin type B vs Placebo, Outcome 13 Cervical dystonia associated pain: change from baseline to week 4 as assessed with TWSTRS.
Comparison 1 Botulinum toxin type B vs Placebo, Outcome 14 Cervical dystonia associated pain: change from baseline to week 4 as assessed with TWSTRS ‐ doses subgroup analysis.

Comparison 1 Botulinum toxin type B vs Placebo, Outcome 15 Cervical dystonia associated pain: change from baseline to week 4 as assessed with validated scales ‐ BtA‐responsive vs BtA‐non‐responsive subgroup analysis.

Comparison 1 Botulinum toxin type B vs Placebo, Outcome 16 Cervical dystonia severity: change from baseline to week 4 as assessed with TWSTRS.

Comparison 1 Botulinum toxin type B vs Placebo, Outcome 17 Cervical dystonia severity: change from baseline to week 4 as assessed with TWSTRS ‐ doses subgroup analysis.
Comparison 1 Botulinum toxin type B vs Placebo, Outcome 18 Cervical dystonia associated disability: change from baseline to week 4 as assessed with TWSTRS.

Comparison 1 Botulinum toxin type B vs Placebo, Outcome 19 Cervical dystonia associated disability: change from baseline to week 4 as assessed with TWSTRS ‐ doses subgroup analysis.

Comparison 1 Botulinum toxin type B vs Placebo, Outcome 20 Proportion of withdrawals due to adverse events.

Comparison 1 Botulinum toxin type B vs Placebo, Outcome 21 Adverse events: dry mouth.

Comparison 1 Botulinum toxin type B vs Placebo, Outcome 22 Adverse events: dysphagia.
Comparison 1 Botulinum toxin type B vs Placebo, Outcome 23 Adverse events: dry mouth ‐ doses subgroup analysis.

Comparison 1 Botulinum toxin type B vs Placebo, Outcome 24 Adverse events: dysphagia ‐ doses subgroup analysis.
Comparison 1 Botulinum toxin type B vs Placebo, Outcome 25 Adverse events: infection.

Comparison 1 Botulinum toxin type B vs Placebo, Outcome 26 Adverse events: neck pain secondary to CD.
Comparison 1 Botulinum toxin type B vs Placebo, Outcome 27 Adverse events: injection site pain.

Comparison 1 Botulinum toxin type B vs Placebo, Outcome 28 Adverse events: nausea.
Comparison 1 Botulinum toxin type B vs Placebo, Outcome 29 Adverse events: headache.
Comparison 1 Botulinum toxin type B vs Placebo, Outcome 30 Adverse events: flu syndrome.

Comparison 1 Botulinum toxin type B vs Placebo, Outcome 31 Adverse events: pain.
| Botulinum Neurotoxin B compared to placebo for cervical dystonia | ||||||
| Patient or population: adults with cervical dystonia | ||||||
| Outcomes | Illustrative comparative risks* (95% CI) | Relative effect | No of Participants | Quality of the evidence | Comments | |
| Assumed risk | Corresponding risk | |||||
| Placebo | Botulinum Neurotoxin B | |||||
| Overall cervical dystonia improvement as assessed with TWSTRS: change from baseline to week 4 (range, 0 to 85; more is worst) | ‐7 | ‐7 | The mean change from baseline to week 4 in the BtB group was 6.78 TWSTRS units higher (4.54 higher to 9.01 higher) compared to the placebo group | 316 | ⊕⊕⊕⊝ | |
| Proportion of withdrawals due to adverse events | Study population | RR 0.88 | 440 | ⊕⊕⊝⊝ | ||
| 14 per 1000 | 13 per 1000 | |||||
| Cervical dystonia associated pain: change from baseline to week 4 as assessed with TWSTRS (range, 0 to 20; more is worst) | ‐7 | ‐7 | The mean change from baseline to week 4 in the BtB group was 2.41 TWSTRS units higher (0.82 higher to 4.01 higher) compared to the placebo group | 207 | ⊕⊕⊝⊝ | |
| Subjective change as assessed by the patient at week 4 | ‐7 | ‐7 | The mean change at week 4 in the BtB group was 0.86 standard deviations higher (0.61 higher to 1.1 higher) compared to the placebo group | 316 | ⊕⊕⊕⊕ | |
| Proportion of participants with adverse events | Study population | RR 1.09 | 186 | ⊕⊝⊝⊝ | ||
| 838 per 1000 | 930 per 1000 | |||||
| Adverse events: dry mouth | Study population | RR 7.65 | 438 | ⊕⊕⊕⊕ | ||
| 22 per 1000 | 168 per 1000 | |||||
| Adverse events: dysphagia | Study population | RR 6.78 | 438 | ⊕⊕⊕⊕ | ||
| 22 per 1000 | 148 per 1000 | |||||
| *The basis for the assumed risk (e.g. the median control group risk across studies) is provided in footnotes. The corresponding risk (and its 95% confidence interval) is based on the assumed risk in the comparison group and the relative effect of the intervention (and its 95% CI). | ||||||
| GRADE Working Group grades of evidence | ||||||
| 1Two of 3 studies enrolled an enriched population; none of the included studies had independent funding; blinding of outcome assessment was unclear in all studies 2Three of 4 studies enrolled an enriched population; none of the studies had a clearly stated independent funding; blinding of outcome assessment was unclear in all studies; two out of 4 had an unclear random sequence generation 3The total number of participants included was less than the number generated by a conventional sample size calculation for a single adequately powered trial 4I‐squared of 58% and small overlap between confidence intervals 5Both studies had an enriched population and non‐independent funding; blinding of outcome assessment was unclear in all studies 6I‐squared of 45% and there is a wide variance of point estimates between studies 7 Data were only available as the difference between the BtB and placebo groups | ||||||
| Term | Definition |
| BtA‐non‐responsive | People who do not experience the expected benefit from treatment with botulinum toxin type A |
| Cervical dystonia or spasmodic toricollis | It is a common movement disorder in which people have abnormal movements or postures of the head and neck that they cannot control. It is frequently accompanied by social embarrassment and pain. |
| Chemodenervation | It is the process by which botulinum toxin causes muscular paralysis. Altought all the anatomical elements necessary for muscular control are intact (i.e. nerve, synapse and muscle), there is a chemical process that disables the transmission of the transmission of the electrical signal from the nerve to the muscle. |
| Dysphagia | A discomfort or difficulty when swallowing. |
| Electromyography | It is an exam that displays the electrical activity of muscles using pieces of metal attached to the skin or inserted into the muscle. |
| Non‐naive | People who have been treated in the past with botulinum toxin. |
| Voluntary action | Movements that we are able to control, start and stop when we want to. |
| Outcome or subgroup title | No. of studies | No. of participants | Statistical method | Effect size |
| 1 Overall cervical dystonia improvement as assessed with TWSTRS: change from baseline to week 4 Show forest plot | 3 | Mean Difference (Fixed, 95% CI) | 6.78 [4.54, 9.01] | |
| 2 Overall cervical dystonia improvement as assessed with TWSTRS: change from baseline to week 4 ‐ Doses subgroup analysis Show forest plot | 4 | Mean Difference (Fixed, 95% CI) | Subtotals only | |
| 2.1 2500 units | 2 | Mean Difference (Fixed, 95% CI) | 6.95 [3.70, 10.21] | |
| 2.2 5000 units | 3 | Mean Difference (Fixed, 95% CI) | 6.10 [3.40, 8.81] | |
| 2.3 10,000 units | 4 | Mean Difference (Fixed, 95% CI) | 8.72 [6.35, 11.10] | |
| 3 Overall cervical dystonia improvement as assessed with TWSTRS: change from baseline to week 4 ‐ BtA‐responsive vs BtA‐non‐responsive subgroup analysis Show forest plot | 2 | Mean Difference (Fixed, 95% CI) | 7.56 [4.41, 10.71] | |
| 3.1 BtA‐responsive | 1 | Mean Difference (Fixed, 95% CI) | 9.0 [4.46, 13.54] | |
| 3.2 BtA‐non‐responsive | 1 | Mean Difference (Fixed, 95% CI) | 6.22 [1.83, 10.60] | |
| 4 Proportion of participants with adverse events Show forest plot | 2 | 186 | Risk Ratio (M‐H, Fixed, 95% CI) | 1.09 [0.97, 1.23] |
| 5 Proportion of participants with adverse events ‐ doses subgroup analysis Show forest plot | 2 | Risk Ratio (M‐H, Random, 95% CI) | Subtotals only | |
| 5.1 5000 U | 1 | 72 | Risk Ratio (M‐H, Random, 95% CI) | 1.07 [0.89, 1.29] |
| 5.2 10,000 U | 2 | 150 | Risk Ratio (M‐H, Random, 95% CI) | 1.09 [0.89, 1.33] |
| 6 Proportion of participants with adverse events ‐ BtA‐responsive vs BtA‐non‐responsive subgroup analysis Show forest plot | 2 | Risk Ratio (M‐H, Random, 95% CI) | Subtotals only | |
| 6.1 BtA‐responsive | 1 | 73 | Risk Ratio (M‐H, Random, 95% CI) | 0.97 [0.79, 1.20] |
| 6.2 BtA‐non‐responsive | 1 | 77 | Risk Ratio (M‐H, Random, 95% CI) | 1.19 [1.03, 1.37] |
| 7 Subjective change as assessed by the participant at week 4 Show forest plot | 3 | 316 | Std. Mean Difference (IV, Fixed, 95% CI) | 0.86 [0.61, 1.10] |
| 8 Subjective change as assessed by the clinician at week 4 Show forest plot | 3 | 316 | Std. Mean Difference (IV, Fixed, 95% CI) | 0.80 [0.55, 1.04] |
| 9 Subjective change as assessed by the participant at week 4 ‐ doses subgroup analysis Show forest plot | 3 | Mean Difference (IV, Fixed, 95% CI) | Subtotals only | |
| 9.1 2500 U | 1 | 67 | Mean Difference (IV, Fixed, 95% CI) | 12.30 [4.21, 20.39] |
| 9.2 5000 U | 2 | 137 | Mean Difference (IV, Fixed, 95% CI) | 9.71 [4.05, 15.37] |
| 9.3 10,000 U | 3 | 214 | Mean Difference (IV, Fixed, 95% CI) | 15.12 [10.32, 19.91] |
| 10 Subjective change as assessed by the clinician at week 4 ‐ doses subgroup analysis Show forest plot | 3 | Mean Difference (IV, Fixed, 95% CI) | Subtotals only | |
| 10.1 2500 U | 1 | 67 | Mean Difference (IV, Fixed, 95% CI) | 8.60 [1.46, 15.74] |
| 10.2 5000 U | 2 | 137 | Mean Difference (IV, Fixed, 95% CI) | 10.84 [5.65, 16.04] |
| 10.3 10,000 U | 3 | 214 | Mean Difference (IV, Fixed, 95% CI) | 13.22 [9.39, 17.05] |
| 11 Subjective change as assessed by the participant at week 4 ‐ BtA‐responsive vs BtA‐non‐responsive subgroup analysis Show forest plot | 2 | 186 | Mean Difference (IV, Fixed, 95% CI) | 19.83 [13.61, 26.05] |
| 11.1 BtA‐responsive | 1 | 109 | Mean Difference (IV, Fixed, 95% CI) | 19.03 [10.41, 27.65] |
| 11.2 BtA‐non‐responsive | 1 | 77 | Mean Difference (IV, Fixed, 95% CI) | 20.70 [11.73, 29.67] |
| 12 Subjective change as assessed by the clinician at week 4 ‐ BtA‐non‐responsive vs ‐responsive subgroup analysis Show forest plot | 2 | Mean Difference (IV, Fixed, 95% CI) | Subtotals only | |
| 12.1 BtA‐responsive | 1 | 109 | Mean Difference (IV, Fixed, 95% CI) | 12.74 [5.83, 19.65] |
| 12.2 BtA‐non‐responsive | 1 | 77 | Mean Difference (IV, Fixed, 95% CI) | 12.70 [7.04, 18.36] |
| 13 Cervical dystonia associated pain: change from baseline to week 4 as assessed with TWSTRS Show forest plot | 2 | Mean Difference (Fixed, 95% CI) | 2.20 [1.25, 3.15] | |
| 14 Cervical dystonia associated pain: change from baseline to week 4 as assessed with TWSTRS ‐ doses subgroup analysis Show forest plot | 3 | Mean Difference (Fixed, 95% CI) | Subtotals only | |
| 14.1 2500 units | 2 | Mean Difference (Fixed, 95% CI) | 2.58 [1.33, 3.84] | |
| 14.2 5000 units | 2 | Mean Difference (Fixed, 95% CI) | 2.05 [0.83, 3.27] | |
| 14.3 10,000 units | 3 | Mean Difference (Fixed, 95% CI) | 3.07 [1.99, 4.14] | |
| 15 Cervical dystonia associated pain: change from baseline to week 4 as assessed with validated scales ‐ BtA‐responsive vs BtA‐non‐responsive subgroup analysis Show forest plot | 2 | Std. Mean Difference (Fixed, 95% CI) | 0.96 [0.65, 1.27] | |
| 15.1 BtA‐responsive | 1 | Std. Mean Difference (Fixed, 95% CI) | 0.92 [0.50, 1.34] | |
| 15.2 BtA‐non‐responsive | 1 | Std. Mean Difference (Fixed, 95% CI) | 1.01 [0.53, 1.48] | |
| 16 Cervical dystonia severity: change from baseline to week 4 as assessed with TWSTRS Show forest plot | 2 | Mean Difference (Fixed, 95% CI) | 2.43 [1.24, 3.63] | |
| 17 Cervical dystonia severity: change from baseline to week 4 as assessed with TWSTRS ‐ doses subgroup analysis Show forest plot | 3 | Mean Difference (Fixed, 95% CI) | Subtotals only | |
| 17.1 2500 units | 2 | Mean Difference (Fixed, 95% CI) | 1.9 [0.55, 3.25] | |
| 17.2 5000 units | 2 | Mean Difference (Fixed, 95% CI) | 2.51 [1.25, 3.77] | |
| 17.3 10,000 units | 3 | Mean Difference (Fixed, 95% CI) | 2.96 [1.87, 4.05] | |
| 18 Cervical dystonia associated disability: change from baseline to week 4 as assessed with TWSTRS Show forest plot | 2 | Mean Difference (Fixed, 95% CI) | 2.29 [1.04, 3.54] | |
| 19 Cervical dystonia associated disability: change from baseline to week 4 as assessed with TWSTRS ‐ doses subgroup analysis Show forest plot | 3 | Mean Difference (Fixed, 95% CI) | Subtotals only | |
| 19.1 2500 units | 2 | Mean Difference (Fixed, 95% CI) | 2.32 [0.86, 3.78] | |
| 19.2 5000 units | 2 | Mean Difference (Fixed, 95% CI) | 2.06 [0.55, 3.57] | |
| 19.3 10,000 units | 3 | Mean Difference (Fixed, 95% CI) | 3.22 [2.09, 4.35] | |
| 20 Proportion of withdrawals due to adverse events Show forest plot | 4 | 440 | Risk Ratio (M‐H, Fixed, 95% CI) | 0.88 [0.19, 4.06] |
| 21 Adverse events: dry mouth Show forest plot | 4 | 438 | Risk Ratio (M‐H, Fixed, 95% CI) | 7.65 [2.75, 21.32] |
| 22 Adverse events: dysphagia Show forest plot | 4 | 438 | Risk Ratio (M‐H, Fixed, 95% CI) | 6.78 [2.42, 19.05] |
| 23 Adverse events: dry mouth ‐ doses subgroup analysis Show forest plot | 4 | Risk Ratio (M‐H, Fixed, 95% CI) | Subtotals only | |
| 23.1 2500 U | 2 | 128 | Risk Ratio (M‐H, Fixed, 95% CI) | 0.97 [0.06, 14.78] |
| 23.2 5000 U | 3 | 198 | Risk Ratio (M‐H, Fixed, 95% CI) | 3.94 [0.87, 17.86] |
| 23.3 10,000 U | 4 | 274 | Risk Ratio (M‐H, Fixed, 95% CI) | 11.47 [3.95, 33.30] |
| 24 Adverse events: dysphagia ‐ doses subgroup analysis Show forest plot | 4 | Risk Ratio (M‐H, Fixed, 95% CI) | Subtotals only | |
| 24.1 2500 U | 2 | 128 | Risk Ratio (M‐H, Fixed, 95% CI) | 6.79 [0.86, 53.63] |
| 24.2 5000 U | 3 | 198 | Risk Ratio (M‐H, Fixed, 95% CI) | 5.50 [1.25, 24.17] |
| 24.3 10,000 U | 4 | 274 | Risk Ratio (M‐H, Fixed, 95% CI) | 9.19 [3.38, 25.01] |
| 25 Adverse events: infection Show forest plot | 3 | 308 | Risk Ratio (M‐H, Random, 95% CI) | 1.14 [0.38, 3.38] |
| 26 Adverse events: neck pain secondary to CD Show forest plot | 3 | 308 | Risk Ratio (M‐H, Fixed, 95% CI) | 1.08 [0.67, 1.73] |
| 27 Adverse events: injection site pain Show forest plot | 4 | 438 | Risk Ratio (M‐H, Fixed, 95% CI) | 1.39 [0.73, 2.66] |
| 28 Adverse events: nausea Show forest plot | 2 | 199 | Risk Ratio (M‐H, Fixed, 95% CI) | 2.06 [0.68, 6.28] |
| 29 Adverse events: headache Show forest plot | 3 | 361 | Risk Ratio (M‐H, Fixed, 95% CI) | 1.90 [0.82, 4.41] |
| 30 Adverse events: flu syndrome Show forest plot | 3 | 361 | Risk Ratio (M‐H, Random, 95% CI) | 1.44 [0.23, 8.92] |
| 31 Adverse events: pain Show forest plot | 2 | 231 | Risk Ratio (M‐H, Fixed, 95% CI) | 1.15 [0.51, 2.62] |