Toxina botulínica tipo B para la distonía cervical
Información
- DOI:
- https://doi.org/10.1002/14651858.CD004315.pub3Copiar DOI

- Base de datos:
-
- Cochrane Database of Systematic Reviews
- Versión publicada:
-
- 13 mayo 2016see what's new
- Tipo:
-
- Intervention
- Etapa:
-
- Review
- Grupo Editorial Cochrane:
-
Grupo Cochrane de Trastornos del movimiento
- Copyright:
-
- Copyright © 2016 The Cochrane Collaboration. Published by John Wiley & Sons, Ltd.
Cifras del artículo
Altmetric:
Citado por:
Autores
Contributions of authors
A Peter Moore ‐ APM; Cristina Sampaio ‐ CS; Filipe Brogueira Rodrigues ‐ FBR; Gonçalo S Duarte ‐ GSD; João Costa ‐ JC; Joaquim Ferreira ‐ JJF; Mafalda Castelão ‐ MC; Raquel E Marques ‐ REM.
Conceiving the review ‐ APM, CS, JC, JJF
Designing the review ‐ APM, CS, JC, JJF
Co‐ordinating the review ‐ JC
Designing search strategies – FBR, JC
Undertaking searches – FBR, GSD
Screening search results – FRB, GSD, MF, REM
Organising retrieval of papers ‐ FRB, GSD, JC, MF, REM
Screening retrieved papers against eligibility criteria ‐ FRB, GSD, MF, REM
Appraising quality of papers ‐ FRB, GSD, JC, MF, REM
Extracting data from papers ‐ FRB, GSD, JC, MF, REM
Writing to authors of papers for additional information – GSD, JC, REM
Data management for the review – FRB, GSD, MF, REM
Entering data into RevMan ‐ FRB, GSD, MF, REM
Analysis of data ‐ FRB, GSD, JC, MF, REM
Interpretation of data ‐ APM, CS, FRB, GSD, JC, JJF, MF, REM
Writing the review ‐ FRB, GSD, JC, MF, REM
Providing general advice on the review – CS, JC, JJF
Performing previous work that was the foundation of the current review – Ana Borges, Claudia Espírito Santo, Miguel Coelho.
Sources of support
Internal sources
-
Cochrane Movement Disorders, Portugal.
-
The Walton Centre for Neurology and Neurosurgery, UK.
External sources
-
No sources of support supplied
Declarations of interest
Costa J, Ferreira JJ, Sampaio C have been investigators in clinical trials sponsored by Elan, Allergan, and Ipsen. Ferreira JJ and Sampaio C were speakers in symposia promoted by Elan, Allergan, and Ipsen.
Moore AP has received fees from various companies marketing botulinum toxin for speaking at meetings and for advice. His unit has received funds for research.
Acknowledgements
We would like to sincerely thank Ema Roque (Cochrane Movement Disorders), Daisy Abreu (Clinical Pharmacology Unit, Faculty of Medicine of Lisbon), Francesca Fiorentino (CEMBE), Nate J. Kosher (American Academy of Neurology) and Masao Kaneshige (Department of Clinical Neuroscience, Tokushima University Graduate School) for their contribution to this review.
Version history
| Published | Title | Stage | Authors | Version |
| 2016 May 13 | Botulinum toxin type B for cervical dystonia | Review | Raquel E Marques, Gonçalo S Duarte, Filipe B Rodrigues, Mafalda Castelão, Joaquim Ferreira, Cristina Sampaio, A Peter Moore, João Costa | |
| 2004 Oct 18 | Botulinum toxin type B for cervical dystonia | Review | João Costa, Cláudia C Espírito‐Santo, Ana A Borges, Joaquim Ferreira, Miguel M Coelho, Peter Moore, Cristina Sampaio | |
| 2003 Jul 21 | Botulinum toxin type B for cervical dystonia | Protocol | João Costa, Cláudia C Espírito‐Santo, Ana A Borges, Joaquim Ferreira, Miguel M Coelho, Peter Moore, Cristina C Sampaio | |
Differences between protocol and review
For this updated review the study designs accepted were restricted to parallel‐group. No changes were made in the type of participants included or in the interventions allowed.
Adverse events, which were originally a secondary outcome, were included in this updated review as a primary safety outcome. In this safety analysis we considered also the proportion of participants with the most frequent adverse events, not stated in the original protocol. Assessments of the duration of effect and proportion of withdrawals due to adverse drug reactions were included as new secondary outcomes measures.
The search strategy was prolonged from the inception to October 2015.
New approaches were assumed to deal with missing data and unit of analysis issue.
The latest recommended Cochrane tool for assessing risk of bias was used in this review, which was expanded to include two additional criteria, added by the review authors. Blinding of outcome assessment was analysed in two new subcategories: subjective and objective assessment.
A ‘summary of findings Table for the main comparison’ table was also added.
Keywords
MeSH
Medical Subject Headings (MeSH) Keywords
Medical Subject Headings Check Words
Female; Humans; Male; Middle Aged;
PICO
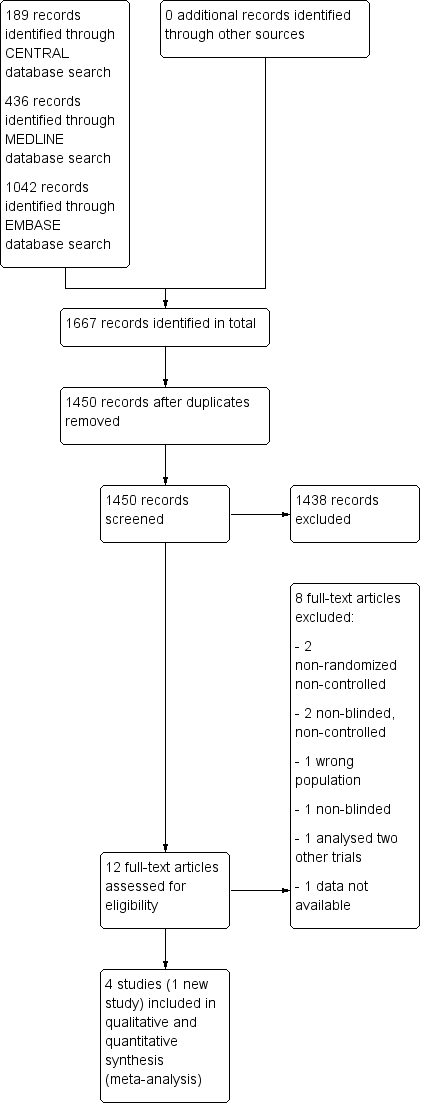
Study flow diagram
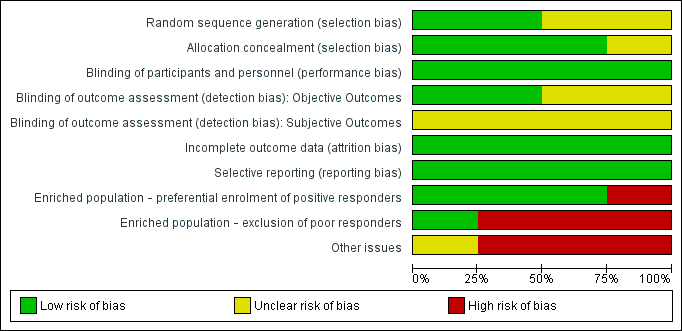
Risk of bias graph: review authors' judgements about each risk of bias item presented as percentages across all included studies.

Risk of bias summary: review authors' judgements about each risk of bias item for each included study.

Comparison 1 Botulinum toxin type B vs Placebo, Outcome 1 Overall cervical dystonia improvement as assessed with TWSTRS: change from baseline to week 4.

Comparison 1 Botulinum toxin type B vs Placebo, Outcome 2 Overall cervical dystonia improvement as assessed with TWSTRS: change from baseline to week 4 ‐ Doses subgroup analysis.
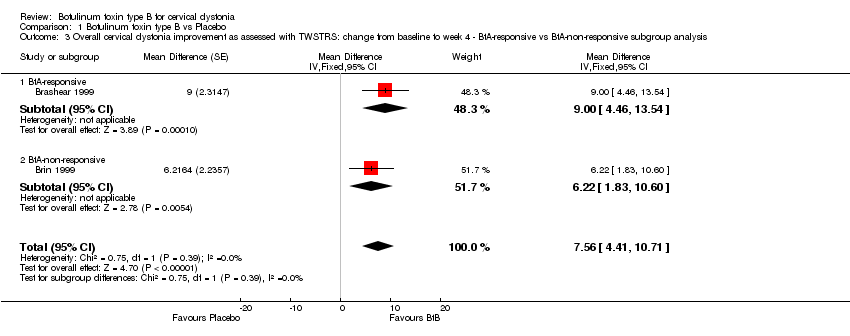
Comparison 1 Botulinum toxin type B vs Placebo, Outcome 3 Overall cervical dystonia improvement as assessed with TWSTRS: change from baseline to week 4 ‐ BtA‐responsive vs BtA‐non‐responsive subgroup analysis.
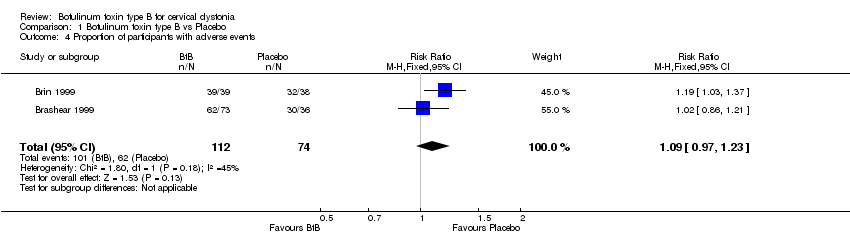
Comparison 1 Botulinum toxin type B vs Placebo, Outcome 4 Proportion of participants with adverse events.

Comparison 1 Botulinum toxin type B vs Placebo, Outcome 5 Proportion of participants with adverse events ‐ doses subgroup analysis.

Comparison 1 Botulinum toxin type B vs Placebo, Outcome 6 Proportion of participants with adverse events ‐ BtA‐responsive vs BtA‐non‐responsive subgroup analysis.
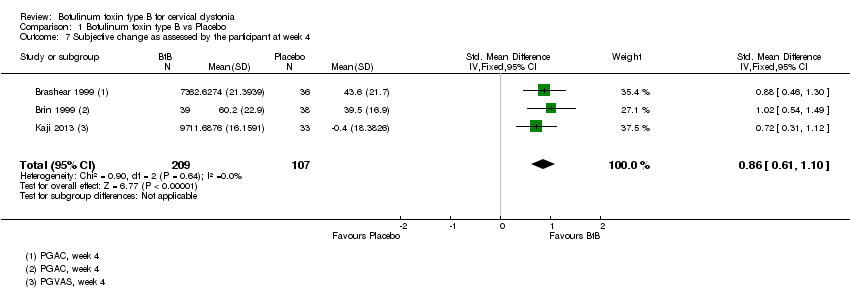
Comparison 1 Botulinum toxin type B vs Placebo, Outcome 7 Subjective change as assessed by the participant at week 4.

Comparison 1 Botulinum toxin type B vs Placebo, Outcome 8 Subjective change as assessed by the clinician at week 4.

Comparison 1 Botulinum toxin type B vs Placebo, Outcome 9 Subjective change as assessed by the participant at week 4 ‐ doses subgroup analysis.

Comparison 1 Botulinum toxin type B vs Placebo, Outcome 10 Subjective change as assessed by the clinician at week 4 ‐ doses subgroup analysis.
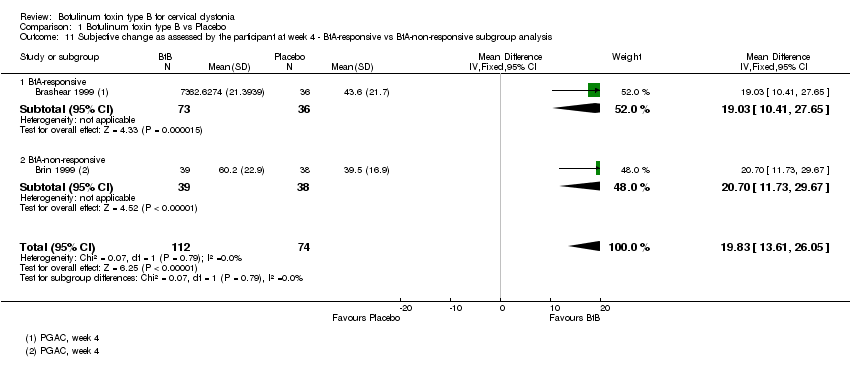
Comparison 1 Botulinum toxin type B vs Placebo, Outcome 11 Subjective change as assessed by the participant at week 4 ‐ BtA‐responsive vs BtA‐non‐responsive subgroup analysis.

Comparison 1 Botulinum toxin type B vs Placebo, Outcome 12 Subjective change as assessed by the clinician at week 4 ‐ BtA‐non‐responsive vs ‐responsive subgroup analysis.

Comparison 1 Botulinum toxin type B vs Placebo, Outcome 13 Cervical dystonia associated pain: change from baseline to week 4 as assessed with TWSTRS.
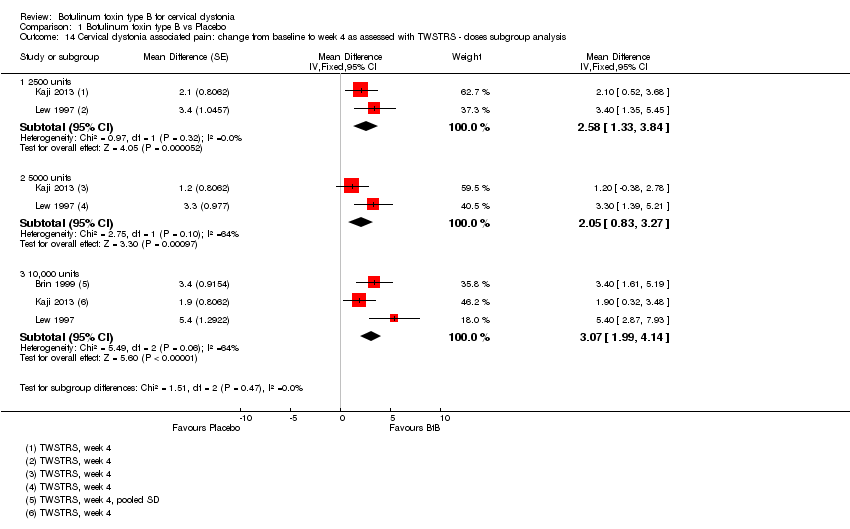
Comparison 1 Botulinum toxin type B vs Placebo, Outcome 14 Cervical dystonia associated pain: change from baseline to week 4 as assessed with TWSTRS ‐ doses subgroup analysis.

Comparison 1 Botulinum toxin type B vs Placebo, Outcome 15 Cervical dystonia associated pain: change from baseline to week 4 as assessed with validated scales ‐ BtA‐responsive vs BtA‐non‐responsive subgroup analysis.

Comparison 1 Botulinum toxin type B vs Placebo, Outcome 16 Cervical dystonia severity: change from baseline to week 4 as assessed with TWSTRS.

Comparison 1 Botulinum toxin type B vs Placebo, Outcome 17 Cervical dystonia severity: change from baseline to week 4 as assessed with TWSTRS ‐ doses subgroup analysis.
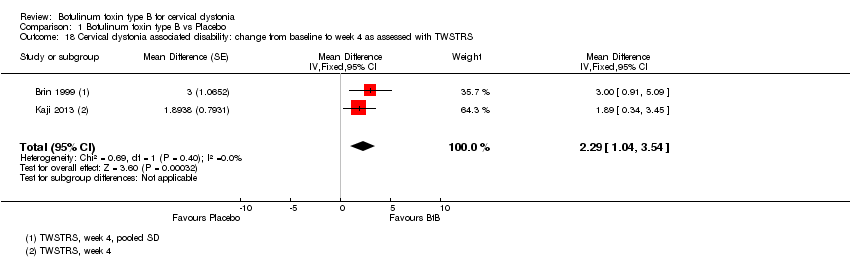
Comparison 1 Botulinum toxin type B vs Placebo, Outcome 18 Cervical dystonia associated disability: change from baseline to week 4 as assessed with TWSTRS.

Comparison 1 Botulinum toxin type B vs Placebo, Outcome 19 Cervical dystonia associated disability: change from baseline to week 4 as assessed with TWSTRS ‐ doses subgroup analysis.

Comparison 1 Botulinum toxin type B vs Placebo, Outcome 20 Proportion of withdrawals due to adverse events.

Comparison 1 Botulinum toxin type B vs Placebo, Outcome 21 Adverse events: dry mouth.

Comparison 1 Botulinum toxin type B vs Placebo, Outcome 22 Adverse events: dysphagia.
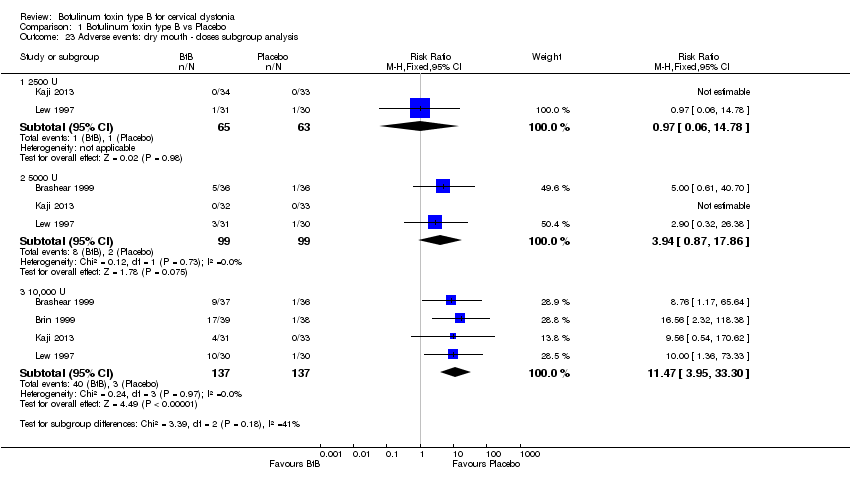
Comparison 1 Botulinum toxin type B vs Placebo, Outcome 23 Adverse events: dry mouth ‐ doses subgroup analysis.

Comparison 1 Botulinum toxin type B vs Placebo, Outcome 24 Adverse events: dysphagia ‐ doses subgroup analysis.
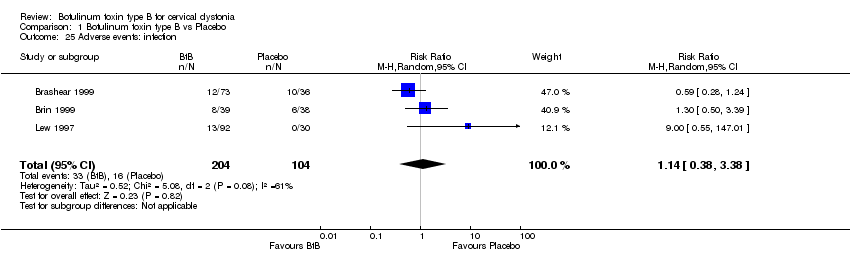
Comparison 1 Botulinum toxin type B vs Placebo, Outcome 25 Adverse events: infection.

Comparison 1 Botulinum toxin type B vs Placebo, Outcome 26 Adverse events: neck pain secondary to CD.
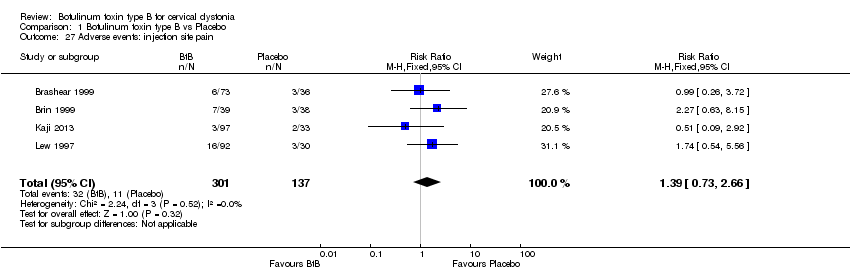
Comparison 1 Botulinum toxin type B vs Placebo, Outcome 27 Adverse events: injection site pain.

Comparison 1 Botulinum toxin type B vs Placebo, Outcome 28 Adverse events: nausea.
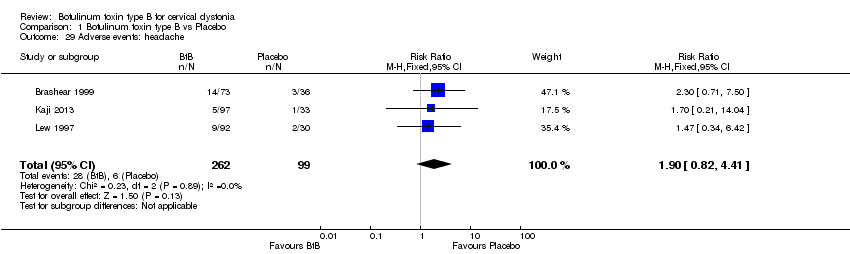
Comparison 1 Botulinum toxin type B vs Placebo, Outcome 29 Adverse events: headache.
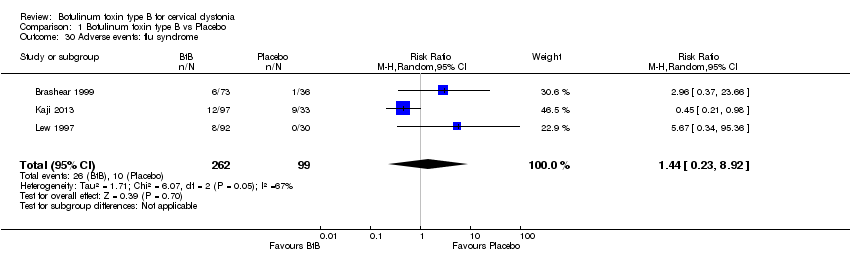
Comparison 1 Botulinum toxin type B vs Placebo, Outcome 30 Adverse events: flu syndrome.

Comparison 1 Botulinum toxin type B vs Placebo, Outcome 31 Adverse events: pain.
| Botulinum Neurotoxin B compared to placebo for cervical dystonia | ||||||
| Patient or population: adults with cervical dystonia | ||||||
| Outcomes | Illustrative comparative risks* (95% CI) | Relative effect | No of Participants | Quality of the evidence | Comments | |
| Assumed risk | Corresponding risk | |||||
| Placebo | Botulinum Neurotoxin B | |||||
| Overall cervical dystonia improvement as assessed with TWSTRS: change from baseline to week 4 (range, 0 to 85; more is worst) | ‐7 | ‐7 | The mean change from baseline to week 4 in the BtB group was 6.78 TWSTRS units higher (4.54 higher to 9.01 higher) compared to the placebo group | 316 | ⊕⊕⊕⊝ | |
| Proportion of withdrawals due to adverse events | Study population | RR 0.88 | 440 | ⊕⊕⊝⊝ | ||
| 14 per 1000 | 13 per 1000 | |||||
| Cervical dystonia associated pain: change from baseline to week 4 as assessed with TWSTRS (range, 0 to 20; more is worst) | ‐7 | ‐7 | The mean change from baseline to week 4 in the BtB group was 2.41 TWSTRS units higher (0.82 higher to 4.01 higher) compared to the placebo group | 207 | ⊕⊕⊝⊝ | |
| Subjective change as assessed by the patient at week 4 | ‐7 | ‐7 | The mean change at week 4 in the BtB group was 0.86 standard deviations higher (0.61 higher to 1.1 higher) compared to the placebo group | 316 | ⊕⊕⊕⊕ | |
| Proportion of participants with adverse events | Study population | RR 1.09 | 186 | ⊕⊝⊝⊝ | ||
| 838 per 1000 | 930 per 1000 | |||||
| Adverse events: dry mouth | Study population | RR 7.65 | 438 | ⊕⊕⊕⊕ | ||
| 22 per 1000 | 168 per 1000 | |||||
| Adverse events: dysphagia | Study population | RR 6.78 | 438 | ⊕⊕⊕⊕ | ||
| 22 per 1000 | 148 per 1000 | |||||
| *The basis for the assumed risk (e.g. the median control group risk across studies) is provided in footnotes. The corresponding risk (and its 95% confidence interval) is based on the assumed risk in the comparison group and the relative effect of the intervention (and its 95% CI). | ||||||
| GRADE Working Group grades of evidence | ||||||
| 1Two of 3 studies enrolled an enriched population; none of the included studies had independent funding; blinding of outcome assessment was unclear in all studies 2Three of 4 studies enrolled an enriched population; none of the studies had a clearly stated independent funding; blinding of outcome assessment was unclear in all studies; two out of 4 had an unclear random sequence generation 3The total number of participants included was less than the number generated by a conventional sample size calculation for a single adequately powered trial 4I‐squared of 58% and small overlap between confidence intervals 5Both studies had an enriched population and non‐independent funding; blinding of outcome assessment was unclear in all studies 6I‐squared of 45% and there is a wide variance of point estimates between studies 7 Data were only available as the difference between the BtB and placebo groups | ||||||
| Term | Definition |
| BtA‐non‐responsive | People who do not experience the expected benefit from treatment with botulinum toxin type A |
| Cervical dystonia or spasmodic toricollis | It is a common movement disorder in which people have abnormal movements or postures of the head and neck that they cannot control. It is frequently accompanied by social embarrassment and pain. |
| Chemodenervation | It is the process by which botulinum toxin causes muscular paralysis. Altought all the anatomical elements necessary for muscular control are intact (i.e. nerve, synapse and muscle), there is a chemical process that disables the transmission of the transmission of the electrical signal from the nerve to the muscle. |
| Dysphagia | A discomfort or difficulty when swallowing. |
| Electromyography | It is an exam that displays the electrical activity of muscles using pieces of metal attached to the skin or inserted into the muscle. |
| Non‐naive | People who have been treated in the past with botulinum toxin. |
| Voluntary action | Movements that we are able to control, start and stop when we want to. |
| Outcome or subgroup title | No. of studies | No. of participants | Statistical method | Effect size |
| 1 Overall cervical dystonia improvement as assessed with TWSTRS: change from baseline to week 4 Show forest plot | 3 | Mean Difference (Fixed, 95% CI) | 6.78 [4.54, 9.01] | |
| 2 Overall cervical dystonia improvement as assessed with TWSTRS: change from baseline to week 4 ‐ Doses subgroup analysis Show forest plot | 4 | Mean Difference (Fixed, 95% CI) | Subtotals only | |
| 2.1 2500 units | 2 | Mean Difference (Fixed, 95% CI) | 6.95 [3.70, 10.21] | |
| 2.2 5000 units | 3 | Mean Difference (Fixed, 95% CI) | 6.10 [3.40, 8.81] | |
| 2.3 10,000 units | 4 | Mean Difference (Fixed, 95% CI) | 8.72 [6.35, 11.10] | |
| 3 Overall cervical dystonia improvement as assessed with TWSTRS: change from baseline to week 4 ‐ BtA‐responsive vs BtA‐non‐responsive subgroup analysis Show forest plot | 2 | Mean Difference (Fixed, 95% CI) | 7.56 [4.41, 10.71] | |
| 3.1 BtA‐responsive | 1 | Mean Difference (Fixed, 95% CI) | 9.0 [4.46, 13.54] | |
| 3.2 BtA‐non‐responsive | 1 | Mean Difference (Fixed, 95% CI) | 6.22 [1.83, 10.60] | |
| 4 Proportion of participants with adverse events Show forest plot | 2 | 186 | Risk Ratio (M‐H, Fixed, 95% CI) | 1.09 [0.97, 1.23] |
| 5 Proportion of participants with adverse events ‐ doses subgroup analysis Show forest plot | 2 | Risk Ratio (M‐H, Random, 95% CI) | Subtotals only | |
| 5.1 5000 U | 1 | 72 | Risk Ratio (M‐H, Random, 95% CI) | 1.07 [0.89, 1.29] |
| 5.2 10,000 U | 2 | 150 | Risk Ratio (M‐H, Random, 95% CI) | 1.09 [0.89, 1.33] |
| 6 Proportion of participants with adverse events ‐ BtA‐responsive vs BtA‐non‐responsive subgroup analysis Show forest plot | 2 | Risk Ratio (M‐H, Random, 95% CI) | Subtotals only | |
| 6.1 BtA‐responsive | 1 | 73 | Risk Ratio (M‐H, Random, 95% CI) | 0.97 [0.79, 1.20] |
| 6.2 BtA‐non‐responsive | 1 | 77 | Risk Ratio (M‐H, Random, 95% CI) | 1.19 [1.03, 1.37] |
| 7 Subjective change as assessed by the participant at week 4 Show forest plot | 3 | 316 | Std. Mean Difference (IV, Fixed, 95% CI) | 0.86 [0.61, 1.10] |
| 8 Subjective change as assessed by the clinician at week 4 Show forest plot | 3 | 316 | Std. Mean Difference (IV, Fixed, 95% CI) | 0.80 [0.55, 1.04] |
| 9 Subjective change as assessed by the participant at week 4 ‐ doses subgroup analysis Show forest plot | 3 | Mean Difference (IV, Fixed, 95% CI) | Subtotals only | |
| 9.1 2500 U | 1 | 67 | Mean Difference (IV, Fixed, 95% CI) | 12.30 [4.21, 20.39] |
| 9.2 5000 U | 2 | 137 | Mean Difference (IV, Fixed, 95% CI) | 9.71 [4.05, 15.37] |
| 9.3 10,000 U | 3 | 214 | Mean Difference (IV, Fixed, 95% CI) | 15.12 [10.32, 19.91] |
| 10 Subjective change as assessed by the clinician at week 4 ‐ doses subgroup analysis Show forest plot | 3 | Mean Difference (IV, Fixed, 95% CI) | Subtotals only | |
| 10.1 2500 U | 1 | 67 | Mean Difference (IV, Fixed, 95% CI) | 8.60 [1.46, 15.74] |
| 10.2 5000 U | 2 | 137 | Mean Difference (IV, Fixed, 95% CI) | 10.84 [5.65, 16.04] |
| 10.3 10,000 U | 3 | 214 | Mean Difference (IV, Fixed, 95% CI) | 13.22 [9.39, 17.05] |
| 11 Subjective change as assessed by the participant at week 4 ‐ BtA‐responsive vs BtA‐non‐responsive subgroup analysis Show forest plot | 2 | 186 | Mean Difference (IV, Fixed, 95% CI) | 19.83 [13.61, 26.05] |
| 11.1 BtA‐responsive | 1 | 109 | Mean Difference (IV, Fixed, 95% CI) | 19.03 [10.41, 27.65] |
| 11.2 BtA‐non‐responsive | 1 | 77 | Mean Difference (IV, Fixed, 95% CI) | 20.70 [11.73, 29.67] |
| 12 Subjective change as assessed by the clinician at week 4 ‐ BtA‐non‐responsive vs ‐responsive subgroup analysis Show forest plot | 2 | Mean Difference (IV, Fixed, 95% CI) | Subtotals only | |
| 12.1 BtA‐responsive | 1 | 109 | Mean Difference (IV, Fixed, 95% CI) | 12.74 [5.83, 19.65] |
| 12.2 BtA‐non‐responsive | 1 | 77 | Mean Difference (IV, Fixed, 95% CI) | 12.70 [7.04, 18.36] |
| 13 Cervical dystonia associated pain: change from baseline to week 4 as assessed with TWSTRS Show forest plot | 2 | Mean Difference (Fixed, 95% CI) | 2.20 [1.25, 3.15] | |
| 14 Cervical dystonia associated pain: change from baseline to week 4 as assessed with TWSTRS ‐ doses subgroup analysis Show forest plot | 3 | Mean Difference (Fixed, 95% CI) | Subtotals only | |
| 14.1 2500 units | 2 | Mean Difference (Fixed, 95% CI) | 2.58 [1.33, 3.84] | |
| 14.2 5000 units | 2 | Mean Difference (Fixed, 95% CI) | 2.05 [0.83, 3.27] | |
| 14.3 10,000 units | 3 | Mean Difference (Fixed, 95% CI) | 3.07 [1.99, 4.14] | |
| 15 Cervical dystonia associated pain: change from baseline to week 4 as assessed with validated scales ‐ BtA‐responsive vs BtA‐non‐responsive subgroup analysis Show forest plot | 2 | Std. Mean Difference (Fixed, 95% CI) | 0.96 [0.65, 1.27] | |
| 15.1 BtA‐responsive | 1 | Std. Mean Difference (Fixed, 95% CI) | 0.92 [0.50, 1.34] | |
| 15.2 BtA‐non‐responsive | 1 | Std. Mean Difference (Fixed, 95% CI) | 1.01 [0.53, 1.48] | |
| 16 Cervical dystonia severity: change from baseline to week 4 as assessed with TWSTRS Show forest plot | 2 | Mean Difference (Fixed, 95% CI) | 2.43 [1.24, 3.63] | |
| 17 Cervical dystonia severity: change from baseline to week 4 as assessed with TWSTRS ‐ doses subgroup analysis Show forest plot | 3 | Mean Difference (Fixed, 95% CI) | Subtotals only | |
| 17.1 2500 units | 2 | Mean Difference (Fixed, 95% CI) | 1.9 [0.55, 3.25] | |
| 17.2 5000 units | 2 | Mean Difference (Fixed, 95% CI) | 2.51 [1.25, 3.77] | |
| 17.3 10,000 units | 3 | Mean Difference (Fixed, 95% CI) | 2.96 [1.87, 4.05] | |
| 18 Cervical dystonia associated disability: change from baseline to week 4 as assessed with TWSTRS Show forest plot | 2 | Mean Difference (Fixed, 95% CI) | 2.29 [1.04, 3.54] | |
| 19 Cervical dystonia associated disability: change from baseline to week 4 as assessed with TWSTRS ‐ doses subgroup analysis Show forest plot | 3 | Mean Difference (Fixed, 95% CI) | Subtotals only | |
| 19.1 2500 units | 2 | Mean Difference (Fixed, 95% CI) | 2.32 [0.86, 3.78] | |
| 19.2 5000 units | 2 | Mean Difference (Fixed, 95% CI) | 2.06 [0.55, 3.57] | |
| 19.3 10,000 units | 3 | Mean Difference (Fixed, 95% CI) | 3.22 [2.09, 4.35] | |
| 20 Proportion of withdrawals due to adverse events Show forest plot | 4 | 440 | Risk Ratio (M‐H, Fixed, 95% CI) | 0.88 [0.19, 4.06] |
| 21 Adverse events: dry mouth Show forest plot | 4 | 438 | Risk Ratio (M‐H, Fixed, 95% CI) | 7.65 [2.75, 21.32] |
| 22 Adverse events: dysphagia Show forest plot | 4 | 438 | Risk Ratio (M‐H, Fixed, 95% CI) | 6.78 [2.42, 19.05] |
| 23 Adverse events: dry mouth ‐ doses subgroup analysis Show forest plot | 4 | Risk Ratio (M‐H, Fixed, 95% CI) | Subtotals only | |
| 23.1 2500 U | 2 | 128 | Risk Ratio (M‐H, Fixed, 95% CI) | 0.97 [0.06, 14.78] |
| 23.2 5000 U | 3 | 198 | Risk Ratio (M‐H, Fixed, 95% CI) | 3.94 [0.87, 17.86] |
| 23.3 10,000 U | 4 | 274 | Risk Ratio (M‐H, Fixed, 95% CI) | 11.47 [3.95, 33.30] |
| 24 Adverse events: dysphagia ‐ doses subgroup analysis Show forest plot | 4 | Risk Ratio (M‐H, Fixed, 95% CI) | Subtotals only | |
| 24.1 2500 U | 2 | 128 | Risk Ratio (M‐H, Fixed, 95% CI) | 6.79 [0.86, 53.63] |
| 24.2 5000 U | 3 | 198 | Risk Ratio (M‐H, Fixed, 95% CI) | 5.50 [1.25, 24.17] |
| 24.3 10,000 U | 4 | 274 | Risk Ratio (M‐H, Fixed, 95% CI) | 9.19 [3.38, 25.01] |
| 25 Adverse events: infection Show forest plot | 3 | 308 | Risk Ratio (M‐H, Random, 95% CI) | 1.14 [0.38, 3.38] |
| 26 Adverse events: neck pain secondary to CD Show forest plot | 3 | 308 | Risk Ratio (M‐H, Fixed, 95% CI) | 1.08 [0.67, 1.73] |
| 27 Adverse events: injection site pain Show forest plot | 4 | 438 | Risk Ratio (M‐H, Fixed, 95% CI) | 1.39 [0.73, 2.66] |
| 28 Adverse events: nausea Show forest plot | 2 | 199 | Risk Ratio (M‐H, Fixed, 95% CI) | 2.06 [0.68, 6.28] |
| 29 Adverse events: headache Show forest plot | 3 | 361 | Risk Ratio (M‐H, Fixed, 95% CI) | 1.90 [0.82, 4.41] |
| 30 Adverse events: flu syndrome Show forest plot | 3 | 361 | Risk Ratio (M‐H, Random, 95% CI) | 1.44 [0.23, 8.92] |
| 31 Adverse events: pain Show forest plot | 2 | 231 | Risk Ratio (M‐H, Fixed, 95% CI) | 1.15 [0.51, 2.62] |