Incentivos para el abandono del hábito de fumar
Resumen
Antecedentes
Los incentivos económicos, monetarios o de cupones, son un recurso muy utilizado para tratar de provocar, reforzar y mantener un cambio de comportamiento, incluido el abandono del hábito de fumar. Se han utilizado en lugares de trabajo, en clínicas y hospitales, y en programas comunitarios.
Objetivos
Determinar el efecto a largo plazo de los programas de tratamiento con incentivos e independientes para el abandono del hábito de fumar.
Métodos de búsqueda
Se realizaron búsquedas en el Registro de Ensayos del Grupo Cochrane de Adicción al Tabaco (Cochrane Tobacco Addiction Group Trials Register), clinicaltrials.gov y en la Plataforma de registros internacionales de ensayos clínicos (ICTRP). Las búsquedas más recientes se realizaron en julio de 2018.
Criterios de selección
Sólo se consideraron los ensayos controlados aleatorios que asignaron al azar a individuos, lugares de trabajo, grupos dentro de los lugares de trabajo o comunidades a programas de incentivos para el abandono del hábito de fumar o a condiciones de control. Se incluyeron estudios en un contexto de población mixta (p.ej., en la comunidad, en el trabajo, en clínicas o en instituciones), y también estudios en fumadoras embarazadas.
Obtención y análisis de los datos
Se utilizaron los métodos Cochrane estándar. La medida de resultado primario en los estudios de población mixta fue la abstinencia del hábito de fumar en el seguimiento más largo (al menos seis meses a partir del inicio de la intervención). En los ensayos de fumadoras embarazadas, se usó la abstinencia medida en el seguimiento más largo, y al menos hasta el final del embarazo. Cuando estuvieron disponibles, se combinaron los datos de resultado mediante un modelo de efectos aleatorios de Mantel‐Haenzel y los resultados se informaron como cocientes de riesgos (CR) e intervalos de confianza (IC) del 95%, mediante estimaciones ajustadas para los ensayos con asignación al azar grupal. Los estudios realizados en poblaciones mixtas se analizaron por separado de los realizados en poblaciones de embarazadas.
Resultados principales
Treinta y tres estudios de población mixta cumplieron con los criterios de inclusión y cubrieron a más de 21 600 participantes; 16 de ellos son nuevos en esta versión de la revisión. Los estudios se realizaron en diversos lugares, incluidos los ámbitos comunitarios, las clínicas o los centros de salud, los lugares de trabajo y las clínicas de medicamentos para pacientes ambulatorios. Se consideró que ocho estudios estuvieron en bajo riesgo de sesgo y diez en alto riesgo de sesgo, mientras que el resto presentó un riesgo incierto. Veinticuatro de los ensayos se realizaron en los Estados Unidos, dos en Tailandia y uno en Filipinas. El resto eran europeos. Los incentivos ofrecidos incluían pagos en efectivo o cupones para bienes y comestibles, ofrecidos directamente o cobrados y canjeables en línea. El CR agrupado para el abandono con incentivos durante el seguimiento más largo (seis meses o más) en comparación con los controles fue de 1,49 (IC del 95%: 1,28 a 1,73; 31 ECA, N ajustada = 20 097; I2 = 33%). Los resultados no fueron sensibles a la exclusión de seis estudios en los que se ofreció un incentivo para el abandono durante el seguimiento a largo plazo (resultado con la exclusión de dichos estudios): CR 1,40; IC del 95%: 1,16 a 1,69; 25 ECA; N ajustada = 17 058; I2 = 36%), lo que sugiere que la repercusión de los incentivos continúa al menos durante algún tiempo después de que los mismos cesan.
Aunque no siempre se informa con claridad, el importe económico total de los incentivos varió de forma considerable entre los ensayos, desde cero (autodepósitos) hasta un rango de entre 45 y 1185 dólares estadounidenses. No hubo una dirección clara del efecto entre los ensayos que ofrecían un valor total bajo o alto de los incentivos, ni entre los que fomentaban los autodepósitos reembolsables.
Se incluyeron diez estudios de 2571 mujeres embarazadas. Se consideró que dos estudios estuvieron en bajo riesgo de sesgo, uno en alto riesgo de sesgo y siete en riesgo incierto. Cuando se agruparon, los nueve ensayos con datos utilizables (ocho realizados en los EE.UU. y uno en el Reino Unido), proporcionaron un CR en el seguimiento más largo (hasta 24 semanas después del parto) de 2,38 (IC del 95%: 1,54 a 3,69; N = 2273; I2 = 41%), a favor de los incentivos.
Conclusiones de los autores
En general, hay evidencia de alta certeza de que los incentivos mejoran las tasas de abandono del hábito de fumar durante el seguimiento a largo plazo en los estudios de población mixta. La efectividad de los incentivos parece mantenerse incluso cuando el último seguimiento tiene lugar después del retiro de los incentivos. También hay evidencia de certeza moderada, limitada por algunas inquietudes acerca de los riesgos de sesgo, de que los programas de incentivos realizados entre fumadoras embarazadas mejoran las tasas de abandono del hábito de fumar, tanto al final del embarazo como después del parto. La investigación actual y futura podría explorar con mayor precisión las diferencias entre los ensayos que ofrecen incentivos en efectivo bajos o altos y los autoincentivos (depósitos), dentro de una variedad de poblaciones de fumadores.
PICO
Resumen en términos sencillos
Las recompensas, ¿pueden ayudar a los fumadores a dejar de fumar a largo plazo?
Antecedentes
El tabaquismo es la principal causa de enfermedad y muerte en todo el mundo. La mayoría de los fumadores desean dejar el tabaco, pero dejar de fumar puede ser un desafío muy grande. Dejar de fumar puede mejorar enormemente la salud de las personas. Se pueden utilizar recompensas, como dinero o cupones, para alentar a los fumadores a dejar de fumar y para recompensarlos si se mantienen en abstinencia. Dichos programas se pueden ofrecer en lugares de trabajo, consultorios y a veces como programas comunitarios.
Tipos de estudios
La búsqueda de estudios más reciente se realizó en julio de 2018.
Ensayos generales: Se hallaron 33 ensayos, que cubrieron a más de 21 600 personas y analizaron diferentes esquemas de recompensas para ayudar a los fumadores a abandonar el hábito. Dos estudios incluyeron a fumadores de clínicas de salud mental, dos de clínicas de atención primaria, dos de clínicas de tratamiento de cáncer de cabeza y cuello, dos de colegios o universidades y uno en pueblos tailandeses. Veinticuatro de los ensayos se realizaron en los EE.UU. Todos los ensayos hicieron un seguimiento de los participantes durante al menos seis meses. Los que habían dejado de fumar fueron examinados por medio de pruebas del aliento o de líquidos corporales. Las recompensas eran pagos en efectivo, cupones o la devolución del dinero depositado por los participantes.
Ensayos en embarazadas: Los estudios en embarazadas se analizaron por separado. Se hallaron diez ensayos, nueve realizados en los EE.UU. y uno en el Reino Unido, que incluyeron a 2571 embarazadas que fumaban. Las recompensas fueron cupones y a veces se les aumentó el valor, según la cantidad de tiempo que la embarazada se abstuvo de fumar.
Resultados clave
Ensayos generales: Seis meses o más después del comienzo del ensayo, las personas que recibieron incentivos tuvieron más probabilidades de haber abandonado el hábito de fumar que los participantes de los grupos de control. Las tasas de éxito continuaron luego de haber finalizado la provisión de los incentivos. Los estudios variaron en los montos totales de las recompensas que se pagaron. No hubo diferencias notables entre los ensayos que pagaron montos menores (menos de USD 100 [dólares estadounidenses]) en comparación con los que pagaron montos mayores (más de USD 700).
Ensayos en embarazadas: La combinación de los datos de nueve ensayos mostró que las mujeres de los grupos de recompensa tuvieron más probabilidades de dejar de fumar que las de los grupos control, tanto al final del embarazo como después del nacimiento del recién nacido.
Calidad los estudios
Algunos de los estudios no proporcionaron suficientes datos para que se pudiera evaluar completamente su calidad. La extracción de los ensayos de menor calidad del análisis no modificó los resultados. La certeza en cuanto a los principales hallazgos es alta. La certeza de los hallazgos en mujeres embarazadas es moderada, debido a que algunos estudios fueron de menor calidad.
Conclusiones de los autores
Summary of findings
| Smoking cessation: incentives compared to no incentives in mixed populations | ||||||
| Patient or population: Adult smokers | ||||||
| Outcomes | Anticipated absolute effects* (95% CI) | Relative effect | № of participants | Certainty of the evidence | Comments | |
| Risk with control | Risk with incentives: mixed populations | |||||
| Smoking cessation in mixed populations ‐ Longest follow‐up Follow‐up: 6 months to 24 months) | 71 per 1000 | 106 per 1000 | RR 1.49 | 21,627 (adjusted n = 20,097) | ⊕⊕⊕⊕ | For 1 included study extractable data were available but did not contribute anything to the analysis as no events (episodes of smoking cessation) occurred in either arm; we excluded a further two studies from the formal analysis, since no extractable data were available on programme participants at follow‐up. More recent studies were higher quality and routinely included longer‐term follow up beyond 6 months assessment |
| *The risk in the intervention group (and its 95% confidence interval) is based on the assumed risk in the comparison group and the relative effect of the intervention (and its 95% CI). | ||||||
| GRADE Working Group grades of evidence | ||||||
| aOverall we rate the quality of evidence as high, despite some of the included studies being considered at high risk of bias. This is because when analyses were restricted to only those studies at low risk of overall bias there was still a significant effect in favour of the intervention. Similarly, when we removed studies at high risk of bias from analyses, leaving only those at low and unclear risk of bias, there remained an effect estimate clearly in favour of the intervention. We are therefore very confident that the true effect lies close to that of the estimate of the effect. | ||||||
| Smoking cessation: incentives compared to no incentives in pregnant women | ||||||
| Patient or population: Pregnant women who smoke Comparison: No incentives | ||||||
| Outcomes | Anticipated absolute effects* (95% CI) | Relative effect | № of participants | Certainty of the evidence | Comments | |
| Risk with control | Risk with incentives: pregnancy | |||||
| Smoking cessation in pregnancy at longest follow‐up Follow‐up: 10 to 24 weeks post‐partum | 72 per 1000 | 170 per 1000 | RR 2.38 | 2273 | ⊕⊕⊕⊕ | 1 included study did not contribute to the analysis because of lack of usable data |
| *The risk in the intervention group (and its 95% confidence interval) is based on the assumed risk in the comparison group and the relative effect of the intervention (and its 95% CI). | ||||||
| GRADE Working Group grades of evidence | ||||||
| aOverall we rate the quality of evidence as moderate, as we judged only two of the included studies to be at low risk of bias (one study at high risk; the rest at unclear risk). When we restricted analyses to only those studies at low risk of overall bias, there was still a significant effect in favour of the intervention, but this represents only two studies with fewer than 100 events overall. | ||||||
Antecedentes
Descripción de la afección
El hábito de fumar es la causa principal de muerte y enfermedad prevenible en todo el mundo. La mayoría de los adultos que fuman desean dejar de fumar, aunque dejar de fumar es un reto y, a pesar de la presencia de métodos efectivos basados en la evidencia para el abandono, las tasas siguen siendo bajas. Dejar de fumar puede dar lugar a beneficios considerables en la salud, incluso en etapas posteriores de la vida. Cuanto antes se deja de fumar, más se reduce el riesgo de desarrollar enfermedades relacionadas con el tabaquismo (OMS 2018).
Descripción de la intervención
Existe interés y apoyo a los programas basados en incentivos para cambiar los comportamientos poco saludables, incluido el hábito de fumar, la pérdida de peso y el consumo de alcohol, y para aumentar los niveles de actividad física (Giles 2014; NICE 2010). Sin embargo, los incentivos económicos para promover el cambio de comportamiento son polémicos. La investigación cualitativa demuestra que la aceptabilidad pública de los incentivos varía (Giles 2015), tal vez debido a la desinformación o a la falta de educación (Robertson 2018), y a la preocupación por la puesta en marcha (financiamiento) de los planes basados en incentivos. También ha existido la preocupación de que los programas de incentivos sólo pueden ser efectivos durante el tiempo que se ofrecen los mismos. Puede haber variaciones culturales en la aceptabilidad, por lo que la implementación de programas basados en incentivos puede resultar más difícil en algunos ámbitos (Berlín 2018).
Muchos países en desarrollo, en particular en América Latina, ofrecen programas nacionales o regionales de transferencia condicional de dinero en efectivo como recompensas monetarias para el cambio de comportamiento o el cumplimiento, a menudo orientados a mejorar la salud materna e infantil (Lagarde 2009; Paes‐Sousa 2011; Powell‐Jackson 2011). En el Reino Unido, los programas de incentivos a menudo se centran en animar a las mujeres embarazadas a dejar de fumar, con programas bien establecidos como 'Give It Up For Baby' (Ballard 2009; Radley 2013), realizado en Tayside (Escocia) y la concesión de cupones de supermercado por la abstinencia comprobada. Una serie de estudios incluidos en la última actualización de esta revisión, realizados en los EE.UU. (Donatelle 2000a; Donatelle 2000b; Donatelle 2002; Heil 2008; Higgins 2004; Higgins 2014) y un gran ensayo aleatorio en el Reino Unido (Tappin 2015a) también atestiguan el interés de la comunidad por el control del tabaco en la factibilidad de recompensar a las mujeres embarazadas que fuman por haber logrado la abstinencia.
De qué manera podría funcionar la intervención
Los incentivos y las recompensas (términos utilizados de forma indistinta en los estudios que aportan información para esta revisión) figuran habitualmente en los programas de abandono del hábito de fumar. La teoría sugiere que podrían funcionar de acuerdo con los procesos conductuales de condicionamiento operante (recompensa positiva del comportamiento deseado), o proporcionando una ganancia a corto plazo por el cambio de comportamiento que, en última instancia, resulta en una ganancia a largo plazo, pero que se percibe como menos próxima para el individuo (descuento por retraso) (Gneezy 2011; Miglin 2017). Se pueden utilizar incentivos para fomentar el reclutamiento en el programa, para recompensar el cumplimiento del proceso y para recompensar el abandono logrado en etapas predefinidas, que normalmente dependen de la producción de un resultado del abandono confirmado bioquímicamente. Se utilizaron diversas recompensas para estos objetivos, incluidos los pagos de dinero en efectivo, cupones para canjear por productos (excepto alcohol y cigarrillos), actividades recreativas, bonos salariales, productos promocionales como camisetas, lapiceros y bolsas.
Las recompensas se pueden dar por la asistencia al programa y a las citas de seguimiento, independientemente de la situación posterior con relación al tabaquismo (es decir, garantizado o independientes), o se puede pagar y aumentar en relación con el éxito del participante en el abandono del hábito de fumar (es decir, dependiente) (Higgins 2002). Ensayos y revisiones sistemáticas recientes han explorado las variaciones en el tipo, la escala y la programación de las recompensas (Adams 2014; Crossland 2015; Giles 2014; Jochelson 2007; Leeks 2010; Sigmon 2012b), y en su aceptabilidad como mecanismo para el cambio de comportamiento (Hoddinott 2014; Thomson 2014). Esta revisión se centra en las recompensas por abstinencia (a diferencia de la asistencia, etc.).
Por qué es importante realizar esta revisión
Esta revisión actualizada es una versión modificada de nuestra revisión anterior (Cahill 2015). A lo largo de los trece años desde la realización de esta revisión, el debate sobre los programas para dejar de fumar basados en incentivos ha cambiado desde su viabilidad (es decir, ¿pueden funcionar?) a su efectividad (es decir, ¿funcionan?), el éxito relativo o las limitaciones de los mecanismos desplegados (Higgins 2012; Promberger 2012), los méritos de las recompensas ("premios") frente a las penalizaciones ("sanciones") (Adams 2014; Lynagh 2013; Volpp 2014), la medida en que los cambios logrados se pueden mantener (Jochelson 2007; Strickland 2014), las posibilidades de consecuencias no intencionales (Marteau 2009; Thomson 2014) y la aceptabilidad e implementación de programas basados en incentivos (Berlin 2018). Aunque muchos de los estudios más antiguos incluidos pueden no abordar estos temas, la revisión contribuye a una base creciente de pruebas que define el fundamento de los programas basados en incentivos e identifica las áreas para investigación adicional. En esta actualización también se explora el uso de incentivos en subpoblaciones de participantes, se considera la longevidad de los efectos de los incentivos y el valor acumulativo de los incentivos óptimos para los resultados del abandono.
Objetivos
Determinar el efecto a largo plazo de los programas de tratamiento con incentivos e independientes para el abandono del hábito de fumar. Se trataron los siguientes temas:
1. ¿Los incentivos reducen la prevalencia del tabaquismo durante el seguimiento más largo?
2. ¿Cuál es la cantidad y el tipo de incentivos óptimos que podrían ofrecerse para influir en los resultados de la cesación?
3. ¿Cuáles son las implicaciones de costo de los incentivos para los empleadores y la comunidad?
4. ¿Cuál es el riesgo de desventajas que surge del uso de los incentivos, p.ej. las reclamaciones falsas, los aspirantes no elegibles?
Métodos
Criterios de inclusión de estudios para esta revisión
Tipos de estudios
Ensayos controlados aleatorios (ECA) o ECA grupales que asignaran al azar a individuos, comunidades, lugares de trabajo o grupos dentro de lugares de trabajo a la intervención o al control.
Tipos de participantes
Fumadores adultos, de cualquier sexo, en cualquier ámbito, incluidos los ensayos realizados en mujeres embarazadas que fuman. No se incluyeron ensayos dirigidos exclusivamente a adolescentes, debido a que están cubiertos por una revisión Cochrane separada (Fanshawe 2017).
Tipos de intervenciones
Regímenes de incentivos para recompensar a los participantes por el abandono del hábito de fumar y la abstinencia en programas de abandono del hábito de fumar. No se incluyeron informes sobre la efectividad de los incentivos o las recompensas para los trabajadores sanitarios (médicos, enfermeras) por proporcionar las intervenciones de abandono del hábito de fumar, o del reembolso a los pacientes por los costos del tratamiento para dejar de fumar, debido a que los mismos son considerados en otra revisión Cochrane (Van den Brand 2017). Se incluyen en esta revisión los estudios que ofrecieron la participación en sorteos de premios junto con otros incentivos garantizados, aunque los estudios que sólo ofrecen recompensas no garantizadas (p.ej. sólo sorteos) están cubiertos por una revisión separada de «Competiciones para el abandono del hábito de fumar" (Fanshawe 2019).
Los grupos de control podrían ser la atención habitual o una intervención para dejar de fumar similar a la proporcionada en el grupo experimental, pero sin incentivos. También fueron elegibles los estudios que compararon dos intervenciones que proporcionaban incentivos, pero que variaban según la cantidad o el tipo de incentivo.
Tipos de medida de resultado
El resultado primario para esta revisión es el abandono del hábito de fumar a largo plazo. El mismo podría medirse como prevalencia puntual, abstinencia sostenida o continua; sin embargo, cuando se utilizaron medidas múltiples en un estudio, se tomó la medida más estricta. Para los ensayos en poblaciones mixtas, la abstinencia debía evaluarse en un mínimo de seis meses desde el inicio de la intervención. Para los ensayos en embarazadas, se extrajeron los resultados del abandono del hábito de fumar desde el seguimiento más cercano hasta el final del embarazo y también del seguimiento más largo después del parto, si se informó. No se requirió el período mínimo de seguimiento de seis meses para las fumadoras embarazadas debido a la naturaleza limitada del embarazo en cuanto al tiempo. La abstinencia puede ser autoinformada o validada bioquímicamente, aunque se prefieren las tasas validadas bioquímicamente sobre las autoinformadas.
También se analizaron las desventajas y los costos, cuando se informaron.
Métodos de búsqueda para la identificación de los estudios
We ran the most recent literature searches on 30th July 2018. For this update we searched the Cochrane Tobacco Addiction Group Specialised Register, using the search strategy in Appendix 1. The Specialised Register includes studies identified by systematic electronic searches of multiple databases, handsearching of specialist journals, and 'grey' literature, i.e. conference proceedings and unpublished reports not normally covered by most electronic indexing systems. At the time of the search the Register included the results of searches of the Cochrane Central Register of Controlled Trials (CENTRAL), issue 1, 2018; MEDLINE (via OVID) to update 20180726; Embase (via OVID) to week 201836; PsycINFO (via OVID) to update 201800820. See the Cochrane Tobacco Addiction Group website for full search strategies and a list of other resources searched.
We also conducted searches of the trial registers, clinicaltrials.gov, and the WHO International Clinical Trials Registry Platform (ICTRP). We checked reference lists of eligible papers, and consulted with experts in the field to identify any relevant forthcoming or unpublished research. We have contacted the authors of ongoing and included studies where necessary, and have recorded their co‐operation in the Acknowledgements section.
Obtención y análisis de los datos
Selección de los estudios
Two review authors (CN and SG) independently screened all search results (titles and abstracts) for possible inclusion, resolving any discrepancies through discussion. The same two review authors then independently assessed the full text of potentially relevant studies, again resolving discrepancies through discussion or through referral to a third review author (JHB). We noted reasons for the non‐inclusion of key studies, and report these in the Characteristics of excluded studies tables.
Extracción y manejo de los datos
Two review authors independently extracted and summarised study data for each study, using a tailored data extraction form (CN, JHB, SG, CM). We resolved any discrepancies through discussion or referral to a third review author. Where available, we recorded the following information in the Characteristics of included studies table:
-
Methods: study design, study name (if applicable), study recruitment period, country, number of study centres, study setting, study recruitment procedure.
-
Participants: N (intervention/control), definition of smoker used, specific demographic characteristics (e.g. age, gender), mean cigarettes per day, mean Fagerström Test for Nicotine Dependence (FTND), inclusion criteria, and any relevant exclusion criteria.
-
Interventions: Description of intervention(s) (treatment, dosage, regimen, behavioural support, duration of intervention, monetary value of incentives), description of control (treatment, dosage, regimen, behavioural support); what comparisons were constructed between which groups, and any concomitant interventions received by intervention and control groups.
-
Outcomes: primary and secondary outcomes specified and collected, time points reported, biochemical validation, definitions of abstinence, adverse events, costs.
-
Notes: we recorded trial funding and declarations of interest of trial authors where reported.
Evaluación del riesgo de sesgo de los estudios incluidos
We evaluated each included study for risks of bias, using the methods described in the Cochrane Handbook for Systematic Reviews of Interventions (Cochrane Handbook, Higgins 2017, Chapter 8). The domains examined for this review include:
-
Random sequence generation (selection bias)
-
Allocation concealment (selection bias)
-
Biochemical validation of abstinence (detection bias)
-
Incomplete outcome data (attrition bias)
-
Other potential risks of bias
Two review authors independently rated each domain as being at low, unclear, or high risk of bias, with quotations from the study report and reasons to justify our judgements. We have summarised the consensus‐agreed 'Risk of bias' judgements across different studies for each of the domains listed, and display the summary results in a 'Risk of bias' figure. As blinding of participants is not feasible due to the nature of intervention, we do not assess performance bias, as in the standard methods of the Cochrane Tobacco Addiction Review Group.
Medidas del efecto del tratamiento
We report results as risk ratios (RRs) with 95% confidence intervals (CIs), calculated as (number quit in intervention group/number randomised to intervention group)/(number quit in control group/number randomised to control group).
Cuestiones relativas a la unidad de análisis
Several mixed‐population studies were cluster‐randomised, i.e. allocated by group, community, or workplace. We have used the intraclass correlation coefficient (ICC) reported by Martinson 1999 (unadjusted ICC for percentage quit smoking in a worksite) to obtain an adjusted estimate of the effect size for the studies that were cluster‐randomised and that contributed to our analyses.
Manejo de los datos faltantes
We contacted investigators or study sponsors in order to verify key study characteristics and to obtain missing numerical outcome data where possible (e.g. when a study is reported as abstract only).
Where possible, we conducted an intention‐to‐treat analysis, including all smokers randomised. Where possible we have treated participants who dropped out or who were lost to follow‐up after randomisation as being continuing smokers. We note the proportion of participants for whom the outcome was imputed in this way, and whether there was either high or differential loss to follow‐up between the groups.
In trials of pregnant women, we have followed the convention observed in most of the trials, and not included in the denominator women whose pregnancies were uncompleted because of termination or foetal death.
Evaluación de los sesgos de notificación
As there are a sufficient number of included studies (10 or more contributing to the outcome), we have created a funnel plot for the analysis in mixed‐population studies to assist in identifying possible publication bias, methodological flaws, or small‐study effects. We have searched for and report on studies we know to have been completed, but for which results are unavailable.
Síntesis de los datos
For our primary outcome of smoking cessation, we have combined eligible studies using a Mantel‐Haenzel random‐effects model. We have combined studies carried out in mixed populations separately from those carried out in pregnant women. In both cases we include an analysis with smoking cessation at longest follow‐up as the outcome. For the pregnancy studies we also include an analysis with smoking cessation at end of pregnancy as an outcome.
We have not combined data on costs or disbenefits, as this information was sparsely and heterogeneously reported. Where reported, we summarise results narratively in the text.
Análisis de subgrupos e investigación de la heterogeneidad
We have used the I2 statistic to assess statistical heterogeneity, given by the formula ((Q ‐ df)/Q) x 100%, where Q is the Chi2 statistic and df is its degrees of freedom (Higgins 2003). This describes the percentage of the variability in effect estimates that is due to heterogeneity rather than to sampling error (chance). A value greater than 50% may be considered to indicate substantial heterogeneity.
Nine included studies involved participants who misused substances. We included this group in the mixed‐population analyses, but we also investigated them separately through subgroup analysis, new to this version of the review, as they have been shown to have different barriers and facilitators to smoking cessation from the general population (Gentry 2017).
We analysed nine pregnancy trials separately from the studies in mixed populations, due to different outcome data. These analyses did not require six‐month follow‐up and explored smoking cessation at longest follow‐up, and at least until the end of pregnancy.
For this update, we also ran an exploratory meta‐regression comparing incentive amount to effect estimate.
We conducted sensitivity analyses removing studies at high risk of bias and removing studies where incentives were provided at longest follow‐up.
'Summary of findings' tables
We have created 'Summary of findings' tables using the following outcomes:
-
Mixed‐population studies: smoking cessation at longest follow‐up (Summary of findings table 1).
-
Pregnancy trials: smoking cessation at longest follow‐up (post‐partum where available) (Summary of findings table 2).
We have used the five GRADE considerations (study limitations, consistency of effect, imprecision, indirectness, and publication bias) to assess the quality of the body of evidence as it relates to the studies which contribute data to the prespecified outcomes. We have used methods and recommendations described in Chapter 11 of the Cochrane Handbook (Schünemann 2017), using GRADEpro software. We justify all decisions to down‐ or upgrade the quality of the evidence using footnotes, and have made comments to aid readers' understanding of the review where necessary.
Results
Description of studies
We included RCTs, allocating individuals, workplaces, groups within workplaces, or communities to experimental or control conditions. Included trials recruited from diverse populations, internationally, using a broad range of incentive interventions, from self‐incentives/deposits to modest or large‐value financial incentives.
Results of the search
For this update we screened the titles/abstracts of 279 studies, and 129 full texts. We included 19 new studies in this update, giving a total of 43 studies, across all populations. We excluded four studies included in the previous review update because they were not randomised (three mixed population studies: Paxton 1980; Paxton 1981; Paxton 1983, and one pregnancy study: Higgins 2004), and one because it did not evaluate guaranteed incentives (Crowley 1995, which is now covered in Fanshawe 2019). We identified 27 ongoing trials. The flow of studies for this update is recorded in Figure 1.

Study flow diagram for 2019 update
Included studies
Interventions in mixed populations
We retain 17 studies which had met our inclusion criteria and were included in the 2015 version of this review. The previous version of the review included non‐randomised studies, which we exclude for this update of the review (Paxton 1980;Paxton 1981;Paxton 1983). From our latest searches, we included 16 new trials recruiting mixed populations. These include four further community‐based studies (Cheung 2017; Etter 2016; Fraser 2017; White 2018), four trials recruiting from substance misusing populations (community or residential settings) (Ainscough 2017;Cooney 2017; Rohsenow 2015; Rohsenow 2017), three workplace‐based studies (Halpern 2018; Romanowich 2015; Van den Brand 2018), four recruiting via clinics (mental health, head and neck cancer or primary care) (Brunette 2017; Ghosh 2016; Lasser 2017; Rettig 2018), and one trial recruiting an online community population (Dallery 2016). We include White 2018, which was not published at the time of conducting our searches, because the authors kindly provided data. Romanowich 2015 was borderline include, as the trial initially recruited smokers willing to quit, but randomisation did not take place until a brief incentivised five‐day abstinence phase had been completed ('Early success' participants were randomised to the trial). As this may have skewed results, we excluded the study from our meta‐analysis in a sensitivity analysis, which did not substantially alter the findings, hence our decision to include the study despite the strict inclusion criteria of 'smokers' not being met. In total, we included 33 mixed‐population studies (21,627 participants) for this update. We identified 78 excluded studies (from all versions of the review), three ongoing studies in published protocols and 19 ongoing studies from trials registries.
Settings
Five studies were set in community settings (Cheung 2017; Etter 2016; Fraser 2017; Giné 2010; White 2013), with one additional study recruiting a community sample but delivering online‐only support (Dallery 2016). Six studies delivered smoking cessation support in clinics (mental health, head and neck cancer, or primary care) (Brunette 2017; Gallagher 2007; Ghosh 2016; Lasser 2017; Rettig 2018; Volpp 2006), and eight delivered interventions in substance misuse clinics, representing a large subgroup (Ainscough 2017; Alessi 2014; Cooney 2017; Drummond 2014; Rohsenow 2015; Rohsenow 2017; Secades‐Villa 2014; Shoptaw 2002). Type of substance misuse was mixed where specified. Three of the older studies delivered the intervention in an academic institution (Ledgerwood 2014; Tevyaw 2009; Windsor 1988), and the rest were delivered in worksites, including White 2018. Twenty‐four of the trials were run in the USA, two in Thailand (White 2013; White 2018), one in the Phillipines (Giné 2010) and one in Hong Kong (Cheung 2017). Five were European.
Incentives
Approximately half of studies (16 in total) offered cash for abstinence (contingent rewards), or monetary incentives in the form of vouchers (seven studies). Four studies used entry into a prize draw alongside a guaranteed reward (Cheung 2017; Glasgow 1993; Hennrikus 2002; Ledgerwood 2014). Two studies used self‐deposited money as the reward incentive (Dallery 2016; Giné 2010) and a further four studies used a combination of deposit arms with cash rewards or mixed‐rewards arms for abstinence at fixed time points (Halpern 2015; Halpern 2018; White 2013; White 2018). Seven studies included more complex payment schedules, especially with a 'reset' option, meaning that a non‐abstinent biochemically‐confirmed outcome at any time point would reset the escalating schedule of reinforcement to a lower level, thus reinforcing continued abstinence (Ainscough 2017; Cooney 2017; Drummond 2014; Rohsenow 2017; Secades‐Villa 2014; Shoptaw 2002; Tevyaw 2009).
Most of the studies (Ainscough 2017; Alessi 2014; Cooney 2017; De Paul 1994; Drummond 2014; Etter 2016; Gallagher 2007; Ghosh 2016; Giné 2010; Glasgow 1993; Hennrikus 2002; Lasser 2017; Rettig 2018; Secades‐Villa 2014; Shoptaw 2002; Van den Brand 2018; Volpp 2006; Windsor 1988) compared the incentive intervention arm to 'usual care', or to another intervention arm with different support options (non‐incentives). We combined these controls in our analyses. White 2013 and White 2018 examined different arms offering deposits and varying schedules of bonus payments (individual and team bonuses).
Brunette 2017 compared 'usual care' to quitline support or cognitive behavioural therapy (CBT). Approximately half within each experimental group received incentives. As exact numbers could not be calculated from reported results, we excluded this study from our analysis.
Nine studies (Dallery 2016; Fraser 2017; Ledgerwood 2014; Rand 1989; Rohsenow 2015; Rohsenow 2017; Romanowich 2015; Tevyaw 2009; Volpp 2009) compared non‐contingent incentives against contingent (outcome‐related) incentives.
Cheung 2017 compared 'usual care' with two incentive groups – those who were ‘early informed’ about the incentive intervention, and those who were ‘late informed', so were not initially aware they would receive rewards for abstinence.
Halpern 2015 compared 'usual care', including non‐contingent rewards, to individual rewards, as well as to collaborative awards (where rewards were given for peer/buddy abstinence in addition to individual abstinence) and to deposits and team deposits. Halpern 2018 compared 'usual care' and text message support to rewards and redeemable deposits.
Cessation methods
Only one trial did not deploy any kind of cessation support programme (Glasgow 1993). Most of the trials included self‐help support of brief advice at a minimum for the usual‐care control group. Eleven trials included nicotine replacement therapy or pharmacotherapy to support their participants (Ainscough 2017; Brunette 2017; Cooney 2017; Gallagher 2007; Halpern 2015; Halpern 2018; Rohsenow 2015; Rohsenow 2017; Romanowich 2015Shoptaw 2002; Volpp 2006). The most recent published trial also offered an electronic cigarette option to some participants as part of the smoking cessation intervention (Halpern 2018).
Most of the included studies used some form of multicomponent support programme, by combining, for example, self‐help and brief advice, with pharmacotherapy. Dallery 2016 and Etter 2016 offered online support, and Halpern 2018 used motivational text messages to offer digital support to trial participants. De Paul 1994 combined self‐help with a buddy system. Drummond 2014 provided motivational feedback on 'lung age' to promote cessation. Van den Brand 2018, White 2013, and White 2018, which were workplace or community‐based studies, used group intervention including group‐based 'pledges' for abstinence or peer pairing, thus employing peer pressure/motivation as part of the intervention. However, White 2018 reported that the size of the worksites did not lend itself to the strategy for pairing teammates. Many teammates did not know each other, and did not interact during the study period.
Outcomes
All the included studies rewarded smoking cessation, either alone or in combination with recruitment, participation or both (see the Characteristics of included studies table for full details).
As reported in the previous review update, raw outcome data, particularly in the older studies, were often difficult to extract. For this update we found the new included trials to be more clearly reported. Fifteen trials followed up participants for a maximum of six months (Ainscough 2017; Alessi 2014; Cheung 2017; Cooney 2017; Dallery 2016; Drummond 2014; Fraser 2017; Ghosh 2016; Ledgerwood 2014; Rand 1989; Romanowich 2015; Secades‐Villa 2014; Tevyaw 2009; Volpp 2006; White 2013), one for nine months (Gallagher 2007), 12 for 12 months (Brunette 2017; Giné 2010; Halpern 2015; Halpern 2018; Lasser 2017; Rettig 2018; Rohsenow 2015; Rohsenow 2017; Shoptaw 2002; Van den Brand 2018; Windsor 1988; White 2018), two for 18 months (Etter 2016; Volpp 2009), and three for 24 months (De Paul 1994; Glasgow 1993; Hennrikus 2002). Most of the more recent studies included 12‐month follow‐up as the standard primary outcome time point.
Few studies formally reported on harms or costs; where reported, we present them narratively below.
Interventions in pregnancy
We include trials conducted in pregnant women as a separate group. We retain eight of the nine studies included in the last update (Cahill 2015), with Higgins 2004 now excluded as it was not randomised. We identified 10 excluded studies (from all versions of the review), two ongoing studies in published protocols and three ongoing studies from trials registries. IN our updated searches we found two new completed pregnancy trials that met our inclusion criteria (Baker 2018; Harris 2015). Baker 2018 is the largest pregnancy trial of incentives for cessation in pregnancy yet reported, recruiting 1014 US pregnant women, and so considerably contributes to the growing evidence base. We include a total of 10 trials recruiting pregnant smokers (2273 women) in this update.
Settings
Nine studies were conducted in the USA, mostly in public or private antenatal clinics, obstetric practices, and community antenatal programmes. One trial (Tuten 2012) in methadone‐maintained pregnant women, was conducted in the Center for Addiction and Pregnancy in Baltimore. The only included UK‐based study (Tappin 2015a; the Cessation in Pregnancy Incentives Trial) with 612 participants, was mediated through the pregnancy referral pathway to the UK NHS stop‐smoking service.
Incentives
The largest pregnancy trial (Baker 2018) provided cash payments as the incentive. In all other cases the rewards were vouchers for goods or services. Three trials (Donatelle 2000a; Donatelle 2000b; Donatelle 2002) delivered monthly rewards contingent upon proven abstinence. Four trials evaluated the allocation of incremental rewards, with the voucher reset to baseline value in the case of relapse or missed visits, but restored to previous levels if abstinence was re‐established (Harris 2015; Heil 2008; Higgins 2014; Tuten 2012). Ondersma 2012, using a computer‐based intervention, shifted the onus of testing to the participants, who could present themselves as often as they wished for verification of abstinence, and could win up to five USD 50 gift cards over the course of the programme. Harris 2015 also offered the option of web‐based confirmation of biochemical validation of abstinence. Tappin 2015a awarded vouchers up to a value of GBP 350 (pounds sterling) for achieving staged cessation targets, and a further GBP 50 for engaging with the programme and setting a quit date. Donatelle 2000a also rewarded a social supporter, in tandem with the participant smoker. Non‐contingent rewards, roughly equivalent to the value available to the intervention group, were given to control participants in three trials (Baker 2018; Heil 2008; Higgins 2014), while Tuten 2012 incorporated a group on a schedule of non‐contingent rewards generated from an earlier pilot study. Donatelle 2000a gave a USD 5 voucher to all participants for each of three attendances during the trial. Tappin 2015a gave all participants in both arms of the trial a GBP 25 shopping voucher for supplying primary outcome information (34 to 38 weeks gestation) and a biological sample for those who self‐reported as quitters.
Cessation methods
All the trials offered a programme of practical cessation support, in addition to the routine care delivered by the host clinics. Three trials (Donatelle 2000b; Donatelle 2002; Ondersma 2012) used the 5As approach (Ask, Advise, Assess, Assist, Arange), while five trials offered self‐help materials. Tuten 2012 also included a brief motivational interviewing feedback session for all participants. Harris 2015 offered a web‐based smoking cessation programme in addition to telephone support. The UK trial (Tappin 2015a) referred all participants to UK stop smoking services, that routinely conducted a one‐hour cessation session, four weekly phone calls, and provided free NRT if the women chose to use it.
Outcomes
All the included studies reported abstinence at the end of pregnancy, with seven of the 10 tracking participants into the post‐partum stage. Two trials (Donatelle 2000b; Donatelle 2002) referred simply to "abstinence", without further definition of the type or duration. In all cases, rewards were available only for biochemically‐verified abstinence. Two trials rewarded smoking reduction as well as complete abstinence, with Tuten 2012 setting percentage reduction targets to be met for rewards, while Higgins 2014 allocated higher‐value vouchers for breath samples below 4 ppm rather than 6 ppm in the early stages of the trial. Our primary outcome of interest for this group is abstinence at the longest available assessment point (which allows us to be the most inclusive in terms of studies included in the analysis); we also report abstinence rates at or around the end of pregnancy for all the trials which had these data.
Few studies formally reported on harms or costs; where reported, we describe these below.
Excluded studies
We list 90 excluded studies in the Characteristics of excluded studies table. The main reasons for exclusion were ineligible study design, not meeting our definition of the intervention, or not following up participants for at least six months.
Risk of bias in included studies
Overall, we judged eight studies to be at low risk of bias (low risk of bias across all domains) and 10 studies to be at high risk of bias (high risk of bias in at least one domain), with the remaining studies at unclear risk of bias. Assessments of the risk of bias domains for each study are shown in Figure 2.

Risk of bias summary: review authors' judgements about each risk of bias item for each included study.
Mixed‐populations studies
In the mixed‐population studies, we judged eight studies to be at low risk of bias and seven to be at high risk of bias, with the remaining 18 at unclear risk of bias.
Selection bias
Of the 33 mixed‐population studies, we judged 13 to be at low risk of selection bias (low risk of both random sequence generation and allocation concealment). We judged four to be at high risk of selection bias, due to issues with either random sequence generation, allocation concealment, or both (Brunette 2017; Gallagher 2007; Ghosh 2016; Giné 2010). We judged the remainder to be at unclear risk of selection bias, due to insufficient information on which to judge.
Detection bias
Of the mixed‐population studies we rated 30 at low risk of detection bias, because biochemical measures were used to verify abstinence. Because of the explicit mechanism of rewards, most of the reported trials did not attempt to blind participants, trialists or assessors. In Ainscough 2017, major study problems were encountered and no participants were followed up at the primary endpoint. Hennrikus 2002 did not validate the abstinence of all participants claiming abstinence. We judged these two trials to be at high risk of bias for this domain. We judged Ghosh 2016 to be at unclear risk, as limited detail was provided on the method of validation used.
Incomplete outcome data
In our analysis of all of the included studies, we treated programme dropouts and losses to follow‐up as continuing smokers, whether or not the trial reported results in this way, and conducted the analyses on an intention‐to‐treat basis, i.e. the denominator included all persons randomised at the start of the trial in their original groups. Of the mixed‐population studies, we considered 22 to be at low risk of bias for this domain.
In accordance with standard Cochrane Tobacco Addiction Group methods for assessing attrition bias, we rated five studies at high risk of bias in this domain, due to high or differential rates of dropout (Ainscough 2017; De Paul 1994; Ghosh 2016; Halpern 2018; Rand 1989), and six as unclear, as there were not sufficient details available on which to make a judgement for this domain (Brunette 2017; Giné 2010; Halpern 2015; Secades‐Villa 2014; Volpp 2006; Windsor 1988).
Other risk of bias
We judged two studies to be at high risk of other biases. We rated Ghosh 2016 at high risk of bias due to inconsistent reporting of length of follow‐up, and Hennrikus 2002 at high risk of bias as group dropouts were not followed up.
In order to test the robustness of the cessation interventions we have included in our review only those studies which followed up participants for at least six months from the beginning of the intervention. Six of the trials, however, (Drummond 2014; Fraser 2017; Gallagher 2007; Ghosh 2016; Lasser 2017; Van den Brand 2018) delivered their final cessation rewards at the same time point as the end of the designated follow‐up period, thereby potentially confounding the intervention rewards with testing at the longest follow‐up. A sensitivity analysis considering these trials separately made no relevant difference to the overall combined outcomes.
Pregnancy studies
In the pregnancy studies, we judged two studies to be at low risk of bias, one at high risk of bias, and seven at unclear risk of bias.
Selection bias
Of the included pregnancy studies, we judged two to be at low risk of selection bias (low risk for both random sequence generation and allocation concealment). We judged the remainder to be at unclear risk due to insufficient detail reported.
Detection bias
We judged all of the studies of pregnant women to be at low risk of detection bias, because each study used biochemical validation of abstinence.
Incomplete outcome data
Of the included pregnancy studies, we rated six at low risk of bias for incomplete outcome data. Two were unclear due to insufficient detail. We ranked Donatelle 2000a at high risk of attrition bias, as it had lost 36% of the intervention group by two months post‐partum, and 52% of the control group, although the authors report that this level of depletion was not unusual for the antenatal clinic in question.
Although we routinely prefer to conduct an intention‐to‐treat analysis (including all participants randomised), for these trials we have excluded from the denominators any predefined withdrawals due to termination or foetal demise, where these were reported. Tappin 2015a excluded three control participants from the denominator, as they had withdrawn immediately after randomisation and had withheld their data from inclusion in analyses; we have adjusted our calculations accordingly.
Other risk of bias
We found no other risks of bias in the included pregnancy studies.
Effects of interventions
See: Summary of findings for the main comparison Incentives vs no incentives for smoking cessation in mixed populations; Summary of findings 2 Incentives vs no incentives for smoking cessation in pregnant women at longest follow‐up
Mixed populations
Cessation
Details of the results for the 33 mixed‐population included studies in this review are tabulated in Table 1, and are displayed graphically where data were available in Analysis 1.1. In our analyses results for the two intervention arms (early‐ and late‐informed incentives) of Cheung 2017 are collapsed and compared with the control arm. Results of two incentive groups in Halpern 2018 are collapsed and compared to a control group. Results of incentives arms in Romanowich 2015 are also collapsed and compared to a control group.
| Study ID | Denominator | Abstinence | Time point | Biological criterion | Quit rate | Stat sig? | Other outcomes | Comment |
| Ainscough 2017 | 19 (IG) 18 (CG) | PPA | 6 months | CO < 10 ppm | 1 (IG) | N.S. | N of participants completing the smoking cessation intervention; opioid treatment outcomes (opioid treatment adherence, drug types, treatment schedule); illicit drug use. | Only 1 participant followed up, not CO verified |
| Alessi 2014 | 24 (CM) 21 (control) | 7‐day PPA | 24 weeks | CO < 6 ppm cotinine < 30 ng/ml | 12.5% (I) 23.8% (C) | N.S. | % reduction in cpd; self‐efficacy | Raw data supplied by the author |
| Brunette 2017 | "approximately half of 146" (CG) "approximately half of 146" (PV+incentives) "approximately half of 303" (PV+Q) "approximately half of 303" (PV+Q+incentives) "approximately half of 212" (PV+CBT) "approximately half of 212" (PV+CBT+incentives) | PPA | 12 months | CO < 4 ppm; cotinine 100 ng/mL | 8% (PV) 6% (PV + incentives) 3.5% (PV+Q) 14% (PV+Q+incentives) 5% (PV+CBT) 12.5% (PV+CBT+incentives) | N.S. | Treatment programme participation, medications | ‐ |
| Cheung 2017 | 379 (early infomed) 385 (Late informed) 379 (Control) | PPA | 6 months | CO < 4 ppm cotinine < 10 ng/ml | 19 (5%) EI 11 (2.9%) LI 17 (4.5%) CG | N.S. | Quit attempts (longest duration and number of quit attempts , mean number of quit attempts, no smoking for at least 24 hours); cessation aids | ‐ |
| Cooney 2017 | 42 CM 41 CG | PPA | 6 months | CO ≤ 5 ppm | 5 (12%) CM 2 (5%) CG | P = 0.004 | Smoking at 1.5 weeks after quit date, 1 month. Alcohol use, drug use | ‐ |
| Dallery 2016 | 48 AC 46 SC (CG) | PPA | 6 months | CO ≤ 4 ppm | 11 (22.9%) AC 6 (13%) SC | N.S. | PP at week 4 and 3‐month follow‐up. Treatment acceptability, behavioural change | CO results were video recorded and submitted remotely |
| De Paul 1994 | 281 (I) | PPA | 24 months | CO < 9 ppm | 13.2% (I) | N.S. | PP, ITT and continuous quit rates reported at all time points | Comparison confined to I and SH groups in this review. Cluster‐randomised so adjusted in main analyses; unadjusted data presented here |
| Drummond 2014 | 50 (UC/LA) 50 (CM x 2) | 7‐day PPA | 6 months | cotinine, eCO | UC/LA 1/50 CM 3/50 | N.S. | CO values, Fagerström score, N of visits wanting to quit, trying to quit, reporting cessation, eCO‐confirmed quitting | Groupings collapsed, as lung age alone or combined with CM produced no quitters |
| Etter 2016 | 401 (IG) 404 (CG) | Continuouse abstinence from months 6 ‐ 18 verified by PPA | 18 months | CO to 3 ppm; cotinine < 10 ng/ml | 39 (9.7%) IG 19 (4.7) CG | P = 0.001 | Quit attempts during the intervention phase (number, duration and dates) | ‐ |
| Fraser 2017 | 948 (IG) 952 (CG) | PPA | 6 months | CO ≥ 7 ppm contine | 205 (21.62%) IG 131 (13.76%) CG | P < 0.001 | Treatment engagement, medications | Continine testing: value that exceeded either 50 ng/mL, 100 ng/mL, or 200 ng/mL, depending on the clinic. 4 clinics used 300 ng/mL as the smoking cut‐score |
| Gallagher 2007 | 60 (CR) | PPA | 36 weeks | CO ≤ 10 ppm | 7% (CR) | N.S. | CO‐validated rates higher, i.e. 37% (CR), 8% (Cont). | CR+NRT group not used in our comparison |
| Ghosh 2016 | 6 (IG) 8 (CG) | PPA | 6 months | Not defined | 2 (IG) 0 (CG) | N.S. | Quality of life (SF12) | 6‐month follow‐up but methods state 12 months. Attempted to contact author to clarify but no reply |
| Giné 2010 | 781 (CARES) 603 (Cards) 616 (Control) | PPA | 12 months | NicCheck strip (urinary cotinine) = 0 | 11% (CARES) 9.3% (Cards) 8.9% (Cont) | P = 0.05 | 6‐month PPA: CARES 9.7%, Cards 10%, Control 8.3%. Cost effectiveness: USD 700 per quitter | 12‐month assessment was 'sprung' on participants |
| Glasgow 1993 | 344 (I) | 7‐day | 2 years | CO ≤ 9 ppm | 14.2% (I) | N.S. | Incentives had a sig. effect (P < 0.03) on less educated participants (18.6% vs 8.8% at 2 years 'probably chance'). | 27% of all abstinent claims could not be biochemically verified. Cluster‐randomised so adjusted in main analyses; unadjusted data presented here |
| Halpern 2015 | 498 (Ind R) 519 (Coll R) 582 (Ind D) 471 (Com D) 468 (UC) | sustained | 12 months | Cotinine < 10 ng/ml anabasine/anabitine < 3 ng/ml | 7.4% (Ind R) 8.7% (Coll R) 3.6% (Ind D) 6.2% (Com D) 3.4% (UC) | vs UC: 0.007 0.001 0.94 0.052 | Sustained verified abstinence @ 14 days, 30 days, 6m; Self‐reported abstinence at 12m; per protocol analyses; Uptake rates of assigned intervention | No differences between individual and group interventions, so both reward arms versus both deposit arms combined for analysis |
| Halpern 2018 | 1198 (rewards) 1208 (redeemable) 1599 (Control) | PPA | 12 months | Cotinine < 20 ng per milliliter, anabasine level of less than 3 ng per milliliter or CO less than 4%. | 13 (rewards) 16 (redeemable) 5 (control) | Deposits: P ≥ 0.001 Rewards P ≥ 0.006 | Point prevalence for quitting at 1 month and sustained abstinence rates at 3 months and 6 months | ‐ |
| Hennrikus 2002 | 407 | 7‐day PPA | 24 months | Saliva from 149 random sample of quitters at 24 months | 19.4% | Not stated | Cohort prevalence and cessation rates (PP and continuous) | Programme registrants' outcomes not available. Unadjusted data presented here |
| Lasser 2017 | 177 IG 175 CG | Continuous verified at 6 and 12 months | 12 months | Saliva or urine cotinine (≤ 10 ng/ml) or anabasine < 3 ng/mL) | 21 (12%) IG 4 (2%) | P ≤ 0.001 | Receipt of counselling, medications | ‐ |
| Ledgerwood 2014 | ECM: 36 TCM: 28 SC (Control): 17 | PPA | 6 months | Urinary cotinine ≤ 100 ng/mL CO ≤ 6 ppm | 4/64 (TCM+ECM) 1/17 | N.S. | Prize money won; 81% CM participants earned prizes (median USD 120.56); Differences between TCM and ECM in week 1 non‐significant | Both CM arms combined for analysis |
| Rand 1989 | 17 contingent | Continuous | 6 months | CO ≤ 11 ppm | 1/17 contingent | N.S. | Numbers of abstinent CO samples and missed samples | Pairwise comparisons gave sig diffs at 11 ppm, but not at 8 ppm |
| Rettig 2018 | 8 (CG) 13 (IG) | PPA | 12 months | 8 ppm | 0 (CG) 4 (31%) (!G) | P = 0.05 | Smoking abstinence at 1, 2, 3,4,5,6,7 and 8 weeks, and at 3 and 6 months. Smoking intensity (total cigarettes per previous 7 days), the reduction from baseline, and total cigarettes smoked | ‐ |
| Rohsenow 2015 | 44 Control (BA/CV) 42 Control (BA/NCV) 53 Intervention (MI/CV) 44 Intervention (MI/NCV) | PPA | 12 months | CO ≤ 4 ppm and salivary cotinine ≤ 15 ng/ml | 0 Control (BA/CV) 2 Control (BA/NCV) (4.8) 4 (7.5) Intervention (MI/CV) 2 (4.5) Intervention (MI/NCV) | N.S. | Cigarette reduction (CPD), number of heavy drinking days, number of drug use days, relapse to any heavy drinking or drug use over the 12 months | ‐ |
| Rohsenow 2017 | 166 CG (NV) 163 IG (CV) | PPA | 12 months | CO l ≤ 4 ppm and salivary cotinine ≤ 15 ng/ml | 3 (1.8%) CG (NV) 6 (3.7%) IG (CV) | N.S. | CPD at 1, 3, 6 months. Number of heavy drinking days Smoking Self‐Efficacy Questionnaire pretreatment and at 1 month. | ‐ |
| Romanowich 2015 | 32 HTT percentile criterion 27 HTT fixed criterion 14 HTT random payments 44 ES escalating payments 43 ES fixed payments 23 ES random payments | Continuous | 6 months | CO < 4 ppm. Cotinine < 20 ng/ml | 3 (8.3%) HTT percentile criterion 2 (5.0%) HTT fixed criterion 1 (5.6%) HTT random payments 4 (6.8%) ES escalating payments 6 (10.3%) ES fixed payments 5 (17.2%) ES random payments | ‐ | Use of smoking cessation medication. CPD in past 6 weeks at 6 months | Results confirmed by authors by email. CO < 3 ppm Stated in NCT entry but < 4 ppm stated in email correspondence. HTT are participants who did not deliver a breath CO level < 4 ppm during the first 5 study days when they could earn USD 5 for doing so and were randomised to 1 set of conditions. ES did deliver at least 1 CO sample < 4, and were randomised to another set of conditions |
| Secades‐Villa 2014 | 43 CBT + CM 49 CBT | Continuous | 6 months | CO < 4 ppm; | 17/43 CM 13/49 CBT | N.S. | Treatment retention; % attending all sessions for 6 months | ‐ |
| Shoptaw 2002 | 42 (P) | PPA | 12 months | CO ≤ 8 ppm | 4/36 (P) | N.S. | Treatment group and cocaine and opiate abuse | Quit rates supplied by authors. |
| Tevyaw 2009 | 28 (CM+MET) | 7‐day PPA | 6 months | CO < 5 ppm | 1/55 (CM) | N.S. | Attendance, sample returns. | ‐ |
| Tuten 2012 | ||||||||
| Van den Brand 2018 | 319 (IG) 284 (CG) | Continuous | 12 months | CO 9 ppm | 131 (41%) IG 75 (26%) CG | P < 0.001 | 3‐ and 6‐month biochemically validated abstinence, and self‐reported abstinence | Cluster‐randomised so adjusted in main analyses; unadjusted data presented here |
| Volpp 2006 | 92 (I) | 7‐day PPA | 6 months post‐completion (˜7.5 months) post‐quit date | Urinary cotinine < 500 ng/mL | 6/92 (I) | N.S. | Enrolment attendance programme completion | Denominators could be Ns enrolled (I:38, C:17). No quitters outside the enrollers |
| Volpp 2009 | 436 (I) | Prolonged | 15 or 18 months | Salivary cotinine < 15 ng/ml | 41/436 (I) 16/442 (C) | P < 0.001 | Enrolment in SC course, completion of SC course | 15 to 18 months results shown in 12‐month forest plot |
| White 2013 | 131 (I) 69 (C) | 7‐day PPA | 6 months | Urinary cotinine | 58/131 (I) 13/69 (C) | P < 0.001 | PPA at 3 months (verified), 14 months (self‐report). Relative success of teams vs individuals? Yes Choosing team partner vs random assignment? No Did text messages help? No Cost effectiveness; No figures given | ‐ |
| White 2018 | 508 (USD 20 individual bonus) 481 (USD 40 individual bonus) 491 (team bonus) 396 (deposits) 363 (deposits plus teammate (no bonus)) 514 (deposits plus $20 individual bonus) 489 (deposits plus USD 40 individual bonus) 496 (deposits plus team bonus) 444 (CG) | 7‐day PPA | 12 months | Cotinine cut‐off level of 200 ng/mL | 74 (14.6%) (USD 20 individual bonus) 104 (21.6%) (USD 40 individual bonus) 60 (12.2%) (team bonus) 57 (14.4%) (deposits) 49 (13.5%) (deposits plus teammate (no bonus)) 72 (14%) (deposits plus USD 20 individual bonus) 91 (18.6%) (deposits plus USD 40 individual bonus) 67 (13.5%) (deposits plus team bonus) 42 (9.5%) (CG) | Significantly higher for all other comparisons NS | PPA at 3 and 6 months. | Cluster‐randomised so adjusted in main analyses; unadjusted data presented here |
| Windsor 1988 | 95 (A) | Continuous | 12 months | SCN ≤ 100 ng/mL | ≃ 6% (A) | Not reported | Social enhancement vs self‐help manual (± incentives) gave a continuous quit rate of 14.4% at 12 months, vs 5.8% | Incentives comparison was abandoned at 6 weeks |
We conducted a meta‐analysis of 30 of the included studies for which there were sufficient data (33 comparisons) (Analysis 1.1). We excluded Ainscough 2017, Brunette 2017,and Hennrikus 2002 from formal analyses because no extractable data were available on programme participants at follow‐up.The primary result at longest follow‐up (six months or more) gave an RR for quitting with incentives compared with controls of 1.49 (95% CI 1.28 to 1.73; 30 RCTs (33 comparisons), adjusted N = 20,097, I2 = 33%). We also present this analysis in summary of findings Table for the main comparison, with a grading of the certainty of the evidence.
To explore the effect of incentives offered up until the long‐term follow‐up point (six months or more) compared to those where longest follow‐up occurred after the incentive schedule had ended, we carried out a subgroup analysis. There was no significant difference in the results found between groups (P = 0.25, I2 = 24%, Analysis 1.1). Restricting results to only those studies which followed up beyond the provision of incentives yielded a statistically and clinically significant effect in favour of the intervention (RR 1.40, 95% CI 1.17 to 1.69; 28 RCTs; adjusted N = 17,058; I2 = 36%), suggesting that the impact of incentives continues for at least some time after incentives are no longer provided. In the group of studies where incentives were provided at longest follow‐up, the result was similar (RR 1.66, 95% CI 1.33 to 2.07; 6 RCTs; adjusted N = 3039; I2 = 20%).
In a subgroup analysis of trials recruiting participants in substance misuse treatment, results also suggested a favourable benefit of incentives for smoking cessation at longest follow‐up (no significant subgroup difference (P = 0.38; I2 = 0%; RR in substance abuse subgroup 1.24, 95% CI 0.81 to 1.89; 8 studies; N = 1055; I2 = 0%; Analysis 1.2.1). Although confidence intervals are wide, this reflects the smaller number of studies and participants in this group; the point estimate was consistent with the overall meta‐analysis which found a beneficial effect of the intervention.
Although not always clearly reported, the financial amounts of incentives varied between trials, from zero (self‐deposits), to a range of between USD 45 up to USD 1185. There was no clear direction of effect between trials offering low or high total amounts of incentives, nor those encouraging redeemable self‐deposits. We ran an exploratory meta‐regression and found no significant association between the outcome and the total value of financial incentive (P = 0.180, Figure 3). Any such indirect comparison is particularly crude in this context, due to differences in the cultural significance of financial amounts (e.g. USD 50 might have different significance in different contexts).

Exploratory meta‐regression testing association between incentive amount and effect estimate
Cheung 2017, a large trial recruiting from a community sample in Hong King as part of the 'Quit to win' contests, specifically examined the effect of small‐value financial incentives. They tested incentives where participants were 'early informed' against a group of participants who were 'late informed' about the incentive offer. There was no statistically significant difference in biochemically‐validated abstinence rates between the early‐informed and late‐informed groups. Overall there was a beneficial effect of the small financial incentive offer across both intervention groups when compared to a control group who were not offered an incentive.
The two largest trials included in this review update specifically evaluated financial incentives against deposit‐based incentives. Halpern 2018 found both deposits and incentives to be effective for long‐term smoking cessation, but no significant differences between the two forms of incentivisation (2% in the rewards group (95% CI 1.2 to 2.8) versus 2.9% in the redeemable deposit group (95% CI 2.0 to 3.8)) and a very high loss to follow‐up. Similarly, White 2018 found that both were effective and reported that "Deposit programs had a negligible effect on abstinence compared with no‐deposit programs" (reporting a 1.1 point increase, P = 0.53).
By far the largest trial among the included studies is White 2018, a nine‐arm cluster‐RCT recruiting 4190 participants drawn from employees at large workplaces in the Bangkok metropolitan area (101 worksites from 84 Bangkok area companies). The interventions were individual bonuses, team bonuses, self‐deposits and deposits plus bonuses (individual and team). The total incentive available varied by arm, and was equivalent to USD 20 (TBH 600 (Thai baht)) in arms that offered a smaller bonus (including the arm that combined a smaller bonus with deposits), and USD 40 (THB 1200) in the arms that offered a larger bonus (including the arm that combined a larger bonus with deposits and the arms with a team bonus). Bearing in mind that Thailand is a middle‐income country, the amounts given were relatively small compared to some of the other studies. Incentives were provided up until the end of the three‐month intervention period. All incentive arms did significantly better than the usual‐care control group at the study's 12‐month primary endpoint of validated sustained abstinence. As there were no significant differences between the individual‐ and group‐based arms, and no significant differences between deposit‐ or reward‐based arms, we combined the eight intervention arms into two groups (incentives versus control) for our analyses.
We conducted a sensitivity analysis removing studies at high risk of bias from the overall meta‐analysis for mixed populations. This resulted in an RR of 1.48 (95% CI 1.25 to 1.76; 25 RCTs; adjusted N = 13,986; I2 = 37%), which still clearly favours incentives. Removing both those studies at high and at unclear risk also yielded a statistically significant benefit in favour of the intervention (RR 1.97, 95% CI 1.57 to 2.57; 8 studies; adjusted N = 5037; I2 = 34%).
We constructed an exploratory funnel plot for the main meta‐analysis (Figure 4; Analysis 1.1, abstinence at longest follow‐up), but did not detect indications of publication bias, i.e. that small studies with negative findings might be under‐represented.

Funnel plot of comparison: 1 Incentives in mixed populations, outcome: 1.1 Smoking cessation (subgrouped by when incentives were provided).
Costs
Few studies reported on costs. Among all participants in Halpern 2015 achieving sustained abstinence at six months, the average cost per quitter ranged from USD 800 to USD 890. The trialists compared this outlay, even without any deposit contribution from the participant, to the estimated USD 5816 additional cost to employers of hiring a smoker rather than a non‐smoker in the USA (Berman 2014), and rated the intervention highly cost‐effective. Volpp 2009 offered no comment on potential cost benefits of incentive programmes, other than to report an estimate of savings per quitter to an employer (USD 3400 per year, MMWR 2002). White 2013 reported that the intervention, if rolled out to the smoking population in the study area, could translate to a decrease in smoking prevalence of 2% to 5%, and offered an incremental cost‐effectiveness analysis. The authors estimate that the cost per quitter from the intervention was USD 281 (95% CI USD 187 to USD 562), compared with quitting with nicotine gum (USD 1780, 95% CI USD 1414 to USD 2401) or with varenicline (USD 2073, 95% CI USD 1357 to USD 4388) in Thailand. The authors note that the intervention complies with the World Health Organization's ranking of "very cost‐effective" in Thailand, i.e. less than gross domestic product (USD 8600, purchasing power parity‐adjusted in 2011; World Bank 2012). Fraser 2017 reported that the overall cost per quitter for control group participants was on average USD 4268.26 while incentive group participants averaged USD 3601.37 per quit. Halpern 2018 reported the cost per successful quitter to be USD 7797.52 where free cessation aids were provided, compared to USD 3623.13 per quitter for the incentive group participants, and USD 3461.47 for the redeemable deposit group. Rettig 2018 did not report formal cost‐effectiveness data, but reported that “Over‐the‐counter nicotine replacement therapy was provided for free (estimated cost per participant USD240)” compared with low‐cost overall incentives (exact cost not reported).
Harms, disbenefits
Few studies formally evaluated harms or disbenefits of incentives specifically. Potential harms evaluated were attributable to smoking cessation itself or judged not attributable to the intervention. Gallagher 2007, reporting on an intervention in 180 people with schizophrenia or other serious mental illness, briefly considered whether smoking cessation may have worsened the participants' psychiatric symptoms, but found no evidence for this at end of intervention or at 36‐week follow‐up, using the Brief Symptom Inventory. However, the authors caution against placing too much weight on this finding, because of low power within the study to detect such differences. Alessi 2014 reported one participant was hospitalised for alcohol‐related heart, liver and lung problems, considered by the trialists not to be associated with the intervention programme. Brunette 2017, recruiting from a community mental health clinic, reported that 25 participants (4%) experienced a serious adverse event: 16 were hospitalised for psychiatric exacerbations, seven were hospitalised for medical reasons (pneumonia, lung cancer, and heart attack), and five study participants died. However it is not clear whether these events were related in any way to the intervention. Cheung 2017 speculated that incentive‐based interventions leading to 'cheating' or 'gaming' by participants may have occurred, in an attempt to ‘play the system’ to receive financial rewards. They suggest that 'loose' inclusion criteria for the study might have led to the inclusion of low‐rate/non‐daily/light smokers who might simply stop smoking for a day in order to win. Such 'cheating' was possible, but was not evaluated. None of the other included studies reported on any harms, unintended consequences or adverse events associated with the interventions; however, we consider in the Discussion section the implications of systematic deception in participants seeking to obtain unmerited rewards for abstinence, and other potential disbenefits of incentives interventions.
Pregnancy
Cessation
Details of the results at longest follow‐up (up to 24 weeks post‐partum) for nine of the 10 included studies in pregnant women in this review are tabulated in Table 2, and are displayed graphically where data were available in Analysis 2.1; Figure 4. One trial could not be included in the meta‐analysis: the MISS Project (Donatelle 2002) reported interim results only, i.e. for 298 women from a projected total of 600. We were unable to obtain further information on final numbers, or on quit rates achieved at any point.
| Study ID | Denominator | Abstinence | Time point | Biological criteria | Quit rate | Stat sig? | Other outcomes | Comment |
| Baker 2018 | 505 (IG) 509 (CG) | 7‐day PPA | 6 months | CO < 7 ppm | 74 (14.65%) (IG) | P ≤ 0.01 | N of post‐birth home visits and phone calls taken; biochemically confirmed abstinence at the post‐birth week 1 visit; and self‐reported smoking status at the 2‐ and 4‐month visits | Engagement in treatment and cost effectiveness also cited on NCT record but NR |
| Donatelle 2000a | 112 (I) 108 (C) | 7‐day PPA | 8‐month gestation | Salivary cotinine < 30 ng/ml | 34/105; 32% (I) 9/102; 9% (C) | Chi² = 18.4; P < 0.0001 | None stated | Differential losses to follow‐up; (I) 32% at 8m, vs (C) 51.5%. |
| 112 (I) 108 (C) | 7‐day PPA | 2m post‐partum | Salivary cotinine < 30 ng/ml | 22/103; 21% (I) 6/102; 5.9% (C) | Chi2 = 11; | None stated | Differential losses to follow‐up; (I) 36% at 2 months post‐partum, vs (C) 52% | |
| Donatelle 2000b | 67 (E1) | "biochemically confirmed abstinence" | End of pregnancy | Salivary cotinine < 30 ng/ml | 19% (E1) 22% (E2) 12% (C) | Not stated | None stated | Very little information available |
| Donatelle 2002 | 102 (E1) 96 (E2) 95 (C) | Self‐report (telephone call) | 8 months gestation | Salivary cotinine < 30 ng/ml | N.S. | Not stated. | High vs low incentives; cost per quitter | Results are interim analysis only, based on 298 enrolled; target was 600. |
| Harris 2015 | 7 IG (CM) 10 CG (SCHB) | PPA | Approximately 6 months | Urinary cotinine (cut‐off not defined) | 1 IG (CM) 3 CG (SCHB) | Not stated but assume NS | Smoking reduction (time line follow‐back method), Stages of Change Ladder (SCL), Modified Fagerström Test ¨ of Nicotine Dependence (mFTND); Post‐treatment assessments measured birth outcomes (e.g. gestational age at birth, birth weight, and time spent in NICU) and smoking‐related variables | Follow‐up time point reported as 8.75 months pregnant (IG) and 8.19 months pregnant (CG). Randomised at (mean = 10.75 weeks pregnant), so follow‐up approximately 6 months |
| Heil 2008 | 37 (I) 40 (C) | PPA | End of pregnancy | Urine cotinine < 80 ng/ml CO ≤ 6 ppm | 15/37; 41% (I) 4/40; 10% (C) | P = 0.003 | Foetal growth | ‐ |
| antepartum CA; 24 weeks post‐partum | Urine cotinine < 80 ng/ml CO ≤ 6 ppm | 3/37; 8% (I) 1/40; 3% (C) | N.S. | Baby health Total voucher earnings | ‐ | |||
| Higgins 2014 | 44 (RCV; E1) 44 (CV; E2 42 (NCV; C) | 7‐day PPA | 28 wks gestation | Urinary cotinine ≤ 80 ng/ml CO < 4 ppm or 6 ppm | 18/40; 45% (E1) 14/39; 36% (E2) 7/39; 18% (C) | N.S. | Foetal growth | ‐ |
| 44 (RCV; E1) 44 (CV; E2 42 (NCV; C) | 7‐day PPA | 24 weeks post‐partum | Urinary cotinine ≤ 80 ng/ml CO < 4 ppm or 6 ppm | 7/40; 18% (E1) 6/39; 15% (E2) 3/39; 8% (C) | ‐ | Foetal growth Birth outcomes | ‐ | |
| Ondersma 2012 | 26 (E1) 28 (E2) 30 (E3) 26 (C) | 7‐day PPA | 30‐day CA 7‐day PPA | Urinary cotinine ≤ 100 ng/ml CO < 4 ppm | 6/23: 26% (E1) 2/22: 10% (E2) 5/26: 19% (E3) 1/23: 4% (C) | E1 P < 0.05 | ‐ | ‐ |
| 42 (E1) 28 (E2) 32 (C) | PPA | 12 weeks | CO < 4 ppm Urine sample (for cocaine) | 13/42; 31% (E1) 0/28; 0% (E2) 0/32; 0% (C) | ‐ | ‐ | ‐ | |
| Tappin 2015a | 306 (I) 306 (C) | "even a puff" in past 2 weeks "even a puff" in past 4 weeks < 5 cigs in past 8 weeks | 4 weeks 12 weeks (if quit at 4) 34 ‐ 38 weeks gest (all participants) | CO < 10 ppm Cotinine: Urine 44.7 ng/ml; saliva 14.2 ng/ml | 69/306 (I) 26/303 (C) | P < 0.001 | Adverse events engagement birth weight cost effectiveness | 3 controls dropped out after randomisation ‐ not included in denominators |
| 306 (I) 306 (C) | still quit or < 5 cigs for since TQD | 6 months post‐natal (for 34/38‐week quitters) | Cotinine: Urine 44.7 ng/ml; saliva 14.2 ng/ml | 47/306 (I) 12/303 (C) | P < 0.001 | ‐ | 3 controls dropped out after randomisation ‐ not included in denominators | |
| Tuten 2012 | 42 (E1) 28 (E2) 32 (C) | Self‐reported 24‐hour PPA | 6 weeks PPA | None | 13/42; 31% (E1) 0/28; 0% (E2) 0/32; 0% (C) | N.S. | Mean CPD | ‐ |
| 42 (E1) 28 (E2) 32 (C) | Self‐reported 24‐hour PPA | 6 weeks PPA | None | 13/42; 31% (E1) 0/28; 0% (E2) 0/32; 0% (C) | N.S. | Mean CPD | Abstinence not reported for this time point |
The trials demonstrated a clear benefit for the incentives groups over the controls. Taken together, nine trials in pregnant smokers (eight conducted in the USA and one in the UK) delivered an RR at longest follow‐up (up to 24 weeks post‐partum) of 2.38, 95% CI 1.54 to 3.69; 9 RCTs; N = 2273; I2 = 41%) in favour of incentives. This effect persisted in a sensitivity analysis removing the one study at high risk of bias (Donatelle 2000a) (RR 2.22, 95% CI 1.37 to 3.59; 8 RCTs; N = 2068; I2 = 41%).
We were unable to ascertain with any certainty whether the size of the rewards made a difference to outcomes, due to a paucity of relevant data. Three trials addressed the question of whether contingent rewards were more effective than non‐contingent fixed payments (Heil 2008; Higgins 2014; Tuten 2012). In these trials, scaled payments were given only as a reward for validated abstinence (contingent), while fixed payments were guaranteed provided that the participant attended and gave a biological sample, irrespective of her smoking status. All three trials favoured conditional over non‐conditional payments, with an RR of 3.33, 95% CI 0.97 to 11.38; 3 RCTs; N = 225; I2 = 18%; Analysis 2.3. None of the included trials compared an incremental with a fixed schedule, but with both payable only for validated abstinence, i.e. testing the role of variable rewards rather than contingency.
Costs
While confirming that they had not conducted a cost‐benefit analysis, Heil 2008 reported that the average cost of the incentives per participant was USD 334. Tappin 2015a reports that the short‐term incremental cost per quitter was GBP 1127, with an incremental cost per quality‐adjusted life year of GBP 482. The NHS lower threshold is GBP 20,000, designated by the National Institute for Health and Care Excellence (NICE 2018) as an indicator of cost effectiveness (Tappin 2015b), suggesting that "financial incentives for smoking cessation in pregnancy are highly cost‐effective" (Boyd 2016). The remaining included studies in pregnancy did not report on costs.
Harms, disbenefits
None of the included pregnancy trials reported on harms or unintended consequences of the interventions, although Tappin 2015a offered some evidence on the likelihood of the participants 'gaming' to receive unmerited rewards. We consider this further in the Discussion section below.
Discusión
Resumen de los resultados principales
En general, hay evidencia de alta certeza de que los incentivos mejoran las tasas de abandono del hábito de fumar durante el seguimiento más largo en los estudios de población mixta (Resumen de resultados, tabla 1). Los nueve ensayos en 2273 mujeres embarazadas que contribuyeron con los metanálisis confirmaron la eficacia de los incentivos en el seguimiento más prolongado, al final del embarazo o alrededor del mismo con evidencia de certeza moderada (Resumen de resultados, tabla 2).
Las revisiones anteriores de las intervenciones basadas en incentivos para el abandono del hábito de fumar han expresado preocupación en cuanto a que el efecto de los incentivos pueda ser limitado en el tiempo. Esto se ajustaría a una explicación basada en la teoría del aprendizaje, según la cual las recompensas son efectivas cuando se ofrecen de manera consistente, pero que el efecto de la recompensa puede `extinguirse' cuando cesan las recompensas. Con respecto al abandono del hábito de fumar, donde los individuos inicialmente pueden encontrar difícil dejar de fumar pero pueden adaptarse con el tiempo a este cambio, ofrecer recompensas que puedan iniciar el abandono parece sugerir que el efecto general a largo plazo puede mantenerse. Esto es posible, debido a que los incentivos sirven para apoyar las semanas (o meses) iniciales más difíciles de un intento de dejar de fumar y el riesgo de recaída se reduce con el tiempo. Los resultados del meta‐análisis en poblaciones mixtas sugieren que los incentivos continúan teniendo un impacto significativo en el abandono del hábito de fumar, incluso después de haber terminado. En la próxima actualización, en la que se anticipa que habrá más evidencia disponible y por lo tanto se contribuirá con más puntos de datos, se planea llevar a cabo un análisis que compare las tasas de abandono del hábito en el último punto del incentivo con las tasas de abandono del hábito en los seguimientos subsiguientes en los que no se proporcionen incentivos, lo cual proporcionaría una prueba más directa del efecto duradero de los incentivos.
En las búsquedas actualizadas se identificaron cuatro ensayos nuevos que reclutaron a personas que abusaban de sustancias (Ainscough 2017; Cooney 2017; Rohsenow 2015; Rohsenow 2017). Lo anterior sugiere que cada vez se presta más atención y el interés se centra más en la importancia de dejar de fumar para esta población, y los incentivos pueden ofrecer una estrategia de intervención prometedora para este grupo en el que las tasas de tabaquismo siguen siendo altas (Gentry 2017). Junto con los cuatro ensayos más antiguos que reclutaron a participantes de esta población, el análisis de subgrupos sugirió un beneficio positivo de los incentivos; los intervalos de confianza fueron amplios, aunque los resultados fueron consistentes con el hallazgo general de un efecto positivo. Sin embargo, estos hallazgos se informan con cautela, debido a que es probable que el análisis tenga poco poder estadístico y se necesitan más estudios.
Se exploró de forma narrativa el valor de los incentivos ofrecidos a través de los estudios y se consideró el análisis de subgrupos. Se establece la conclusión de que el mismo no sería posible, debido a que las cantidades ofrecidas variaron de manera considerable, y no fue posible agrupar ampliamente los ensayos en incentivos de "bajo valor" o de "alto valor", ya que no se pueden predecir los diversos contextos culturales de los estudios y el "significado" de la cantidad total de incentivos ofrecidos a los participantes. Incluso un pequeño incentivo económico ofrecido a un trabajador de una fábrica en una zona rural de Tailandia puede ser muy valioso y significativo para los participantes individuales. A partir de la evidencia disponible, no es posible establecer la conclusión de si el valor del incentivo económico tiene un impacto discernible sobre la efectividad de la intervención; por lo tanto, las futuras iteraciones de esta revisión deberían tratar de explorar más a fondo esta cuestión. Un enfoque posible sería evaluar el tamaño del incentivo como un porcentaje de los ingresos medios de los participantes del estudio, aunque los datos más valiosos provendrían de los estudios que comparan directamente los diferentes montos de los incentivos, ya que entonces la población no sería un factor de confusión.
Los ensayos del depósito‐reembolso merecen especial atención, en vista de los debates que han surgido del estudio de Volpp de 2009 sobre si el programa podría aplicarse en un ámbito real. Si la implementación de un programa de incentivos está comprometida por los costos incurridos, entonces el modelo de participantes que depositan y que pierden su propio dinero es probable que sea más atractivo para los empleadores y las instituciones que buscan intervenciones asequibles de cambios de comportamientos. Aunque las estimaciones del efecto parecen ser consistentes entre los esquemas de recompensa basados en depósitos y los tradicionales, las tasas bajas de captación en comparación con las intervenciones basadas en recompensas pueden limitar el atractivo y la eficacia de dichos programas (Volpp 2014). White 2013 informó una tasa de participación del 10,5% entre los fumadores elegibles, mientras Giné 2010 informó una tasa del 10,6%. Halpern 2015 compara directamente las intervenciones financiadas en su totalidad con recursos de los ensayos con las financiadas en parte por los propios participantes (150 USD). Como se analiza anteriormente, las tasas de captación resultaron una barrera, el 90% de las personas a las que se les ofrecieron recompensas aceptaron la intervención en comparación con solamente el 13,7% de los que se les ofreció realizar un depósito, lo que obligó a los autores del ensayo a desarrollar un modelo adaptativo de asignación al azar para poblar los brazos con depósito. Sobre la base de un análisis de intención de tratar (intention‐to‐treat), los brazos de recompensa produjeron de manera sistemática más abandonos que los brazos de depósito en todos los puntos temporales; sin embargo, en el análisis de la variable instrumental que toma en cuenta las diferentes tasas de captación (equivalente a un análisis por protocolo), entre los participantes dispuestos a aceptar cualquiera de las dos intervenciones, los brazos de depósito superaron a los brazos de recompensa, con tasas de abandono a los seis meses del 53,4% y 17,1% respectivamente, y tasas de abandono del hábito de fumar a los 12 meses del 18,5% y del 8,8%, respectivamente.
White 2013 utilizó trabajadores sanitarios comunitarios para apoyar a los fumadores que intentaban el abandono del hábito en una región de pueblos tailandeses, mediante una intervención de depósito‐reembolso. Las tasas de éxito a los seis meses fueron impresionantes, con un 44,3% para el grupo de intervención en comparación con el 18,8% entre los controles; sin embargo, la tasa de abandono inusualmente alta para el grupo de control sugiere que esta población puede haber representado "los primeros beneficios" (personas que dejan de fumar con facilidad y que nunca antes han recibido apoyo para dejar de fumar), y que estos hallazgos no son fácilmente generalizables a las áreas con programas de control del tabaco de larga data y establecidos. Los dos ensayos más grandes incluidos en esta actualización de la revisión evaluaron específicamente los incentivos económicos en comparación con los incentivos basados en depósitos. White 2018 y Halpern 2018 encontraron que tanto los depósitos como los incentivos son efectivos para el abandono del hábito de fumar a largo plazo, pero ninguna diferencia significativa entre las dos formas de incentivación. Lo anterior indica que, aunque puede ser más difícil reclutar a fumadores en programas basados en depósitos, una vez que ingresan parecen comprometerse firmemente con el proceso y pueden lograr tasas altas de abandono del hábito de fumar.
Si bien los resultados de esta revisión son alentadores, es importante señalar que puede haber barreras considerables para la implementación de incentivos en la atención habitual o como parte de los servicios generales. La opinión pública con respecto a los incentivos a es menudo negativa (Berlin 2018; Giles 2015; Hoddinott 2014), y los incentivos son considerados como un cambio de comportamiento "gratificante" para un "hábito" que se percibe como autoinfligido (fumar). Lo anterior puede limitar la medida en que los resultados de los ensayos pueden informar los cambios en la política y la práctica. Un problema adicional son las limitaciones de recursos. La implementación en el mundo real requiere que los financiadores (como el NHS o el gobierno local en el Reino Unido que financian los servicios para dejar de fumar) den prioridad a estos esquemas sobre otros enfoques al abandono del hábito de fumar. Deben considerarse de forma adicional los posibles daños y desventajas de los esquemas de incentivos. Los que recaen en el hábito de fumar y no reciben un incentivo económico pueden posiblemente desentenderse de los intentos subsiguientes para dejar de fumar. Este daño potencial merece ser controlado en los ensayos futuros.
Engaño
Sólo seis de los ensayos incluidos evaluaron el estado del hábito de fumar al inicio, de acuerdo a la cotinina o al monóxido de carbono (CO) exhalado (Brunette 2017; Cheung 2017; Etter 2016; Halpern 2015; Harris 2015; Romanowich 2015). Halpern 2015 sólo evaluó la elegibilidad en una muestra del 5% de los participantes incluidos, a los que se les pagó USD 100 por el suministro de una prueba de cotinina. De los participantes a los que se les solicitó presentar una muestra inicial, nueve (6%) devolvieron una prueba negativa y 21 (14%) no devolvieron la muestra, lo que indica que hasta el 20% de los participantes podrían haber sido no fumadores. Sin embargo, debido a que las tasas fueron comparables en todos los brazos del ensayo y los análisis de sensibilidad que se ajustaron a este posible nivel de engaño no dieron lugar a ninguna diferencia en las estimaciones del efecto, se estableció la conclusión de que la validación bioquímica del estado del tabaquismo al inicio del estudio puede no tener impacto en los resultados del ensayo en general, debido a que es probable que el engaño sobre el estado de tabaquismo al inicio del estudio se distribuya equitativamente a través de la asignación al azar.
Fue una condición para la inclusión en esta revisión que los estudios utilizaran alguna forma de verificación bioquímica para confirmar el estado de tabaquismo de los que declaraban abstinencia cuando las recompensas estaban pendientes. Este procedimiento es el estándar de referencia recomendado para un diseño de ensayo adecuado en los estudios sobre el abandono del hábito de fumar (SRNT 2002). También puede ser particularmente importante que los que dejan de fumar en un ensayo basado en incentivos demuestren ser verdaderamente abstinentes en los puntos de evaluación, ya que el engaño puede ser una crítica justificable dirigida a las intervenciones basadas en incentivos. Volpp 2006 analizó la probabilidad de que los participantes modificaran su comportamiento de fumadores en previsión al contacto para la evaluación de seguimiento y la prueba de cotinina, y concluyó que fue poco probable, ya que aunque los participantes sabían que se probarían biológicamente, desconocían por cuánto tiempo los metabolitos de nicotina serían detectables o la fecha exacta en qué se comprobarían. Cuando se informaron, la mayoría de los estudios incluidos demostraron una buena correspondencia entre las declaraciones de abstinencia autoinformadas y la verificación bioquímica. Debido a que los incentivos dependían de la abstinencia confirmada bioquímicamente y que el resultado de la revisión del seguimiento más largo fue sólido en cuanto a la eliminación de los estudios sin verificación bioquímica en el seguimiento más largo (p.ej. estudios en alto riesgo de sesgo de detección), es poco probable que el engaño afectara los hallazgos.
El trabajo sobre los incentivos para las fumadoras embarazadas que intentan abandonar el hábito ha dirigido la atención a los riesgos del engaño o "juego", en particular la probabilidad de demorar un intento de abandono del hábito para que coincida con un programa de recompensas y la probabilidad de tergiversar la situación con respecto al tabaquismo, ya sea para poder ingresar a un programa con incentivos o para recibir recompensas no merecidas por la abstinencia (Marteau 2013). Ierfino 2015 en un estudio de cohorte longitudinal de 239 fumadoras embarazadas, no encontró evidencia de juego para entrar en un programa de incentivos, pero detectó un nivel de engaño del 4% para ganar cupones de abstinencia (por ejemplo, reporte falso de la abstinencia). Tappin 2015a utilizó muestras de sangre residuales para análisis de rutina (es decir, tomadas con objetivos no relacionados con el estudio) obtenidas de las últimas 200 mujeres reclutadas en el estudio, para la verificación cruzada de la situación del tabaquismo del autoinforme de las exfumadoras. Hubo sangre residual disponible para 18 de las 69 mujeres de la intervención que autoinformaron de la abstinencia a las 34/38 semanas, lo cual se confirmó con pruebas de saliva o cotinina urinaria; el 78% de estas muestras (14/18) confirmaron su condición de no fumadora. De manera similar, cinco muestras residuales de las 26 participantes del grupo control con abstinencia confirmada a las 34/38 semanas corroboraron el 80% (4/5) de los resultados. Aunque lo anterior indica cierta sobrestimación de las verdaderas tasas de abandono del hábito de fumar, el nivel de engaño pareció ser similar entre ambos grupos, y confirmó la veracidad del 80% de los exfumadores autoinformados. Un gran ensayo del embarazo incluido en esta nueva actualización de la revisión (Baker 2018) informó que "es posible que algunas participantes abandonaran o redujeran su hábito de fumar justo antes de la visita a los seis meses. El CO espirado, que se utilizó en este ensayo, tiene una vida media relativamente breve; la cotinina sérica podría haber sido más sensible a la detección del tabaquismo remoto temporal. Un ensayo del embarazo mucho más pequeño (Harris 2015) combinó de manera más robusta tanto la prueba de CO como la de cotinina urinaria para confirmar la abstinencia. Tomados en conjunto, estos resultados sugieren que la probabilidad de engaño en los ensayos de incentivos en el embarazo también es baja.
Compleción y aplicabilidad general de las pruebas
Esta revisión incluye varios estudios de diversos ámbitos culturales (White 2018 reclutó a participantes en lugares de trabajo en Bangkok, Giné 2010 se acercó a personas que fumaban en la calle en ciudades de Filipinas, Van den Brand 2018 reclutó a participantes en lugares de trabajo en los Países Bajos, Etter 2016 reclutó una muestra de la comunidad en Suiza, y Fraser 2017 aporta nueva evidencia de 1900 fumadores de la comunidad de EE.UU.), lo que sugiere que el impacto de los incentivos puede considerarse generalizable a través de estas poblaciones, aunque se necesita más evidencia de países de ingresos bajos y medios. Las revisiones futuras podrían considerar el análisis de los resultados por contexto poblacional. La comparación de las poblaciones clínicas versus las poblaciones basadas en la comunidad puede ser significativa, ya que las diferentes poblaciones pueden estar más o menos motivadas para dejar de fumar y tener un acceso diferencial al apoyo complementario. El contexto poblacional también puede tener relevancia para la escalabilidad de las intervenciones basadas en incentivos.
Se siguieron los métodos Cochrane estándar para identificar y evaluar los estudios que contribuyen con esta revisión y estar seguros de que no se pasó por alto ningún ensayo publicado importante. Se solicitaron los datos faltantes o incompletos y se estableció contacto con los autores cuando fue posible para aclarar la interpretación que se hizo de su trabajo. La mayor diversidad de las poblaciones incluidas en esta revisión, desde diversos contextos culturales, a través de diferentes sistemas de asistencia sanitaria, e incluyendo poblaciones únicas como las mujeres embarazadas y las que están en tratamiento por abuso de sustancias y poblaciones clínicas distintas, ha ampliado la aplicabilidad de esta revisión, de acuerdo con las tendencias recientes de los enfoques de salud pública para incentivar el cambio de comportamiento.
Certeza de la evidencia
Estudios en poblaciones mixtas:
La certeza general de la evidencia se calificó como alta en este grupo de ensayos (ver Resumen de resultados, tabla 1). Aunque hubo inquietudes acerca del riesgo de sesgo, en particular en los ensayos más antiguos, los análisis de sensibilidad que excluyeron los ensayos en alto riesgo de sesgo y los estudios en riesgo de sesgo alto y poco claro no cambiaron el efecto positivo de los incentivos sobre las tasas de abstinencia. Se aumentó la calidad de la evidencia en cuanto a la versión anterior de esta revisión, lo que sugiere que se puede tener una mayor confianza en los resultados informados y en la estimación del efecto. Debido a la inclusión de varios ECA grandes de alta calidad que detectaron efectos significativos a favor de la intervención, la estimación del efecto ha aumentado en general.
Estudios en el embarazo:
Los ensayos incluidos que cubrían a fumadoras embarazadas se calificaron como de certeza moderada (Resumen de los resultados, tabla 2), lo que sugiere que es probable que el efecto verdadero sea similar al que se ha encontrado, aunque la investigación adicional puede tener un impacto en la estimación del efecto. La certeza estuvo limitada por las preocupaciones acerca del riesgo de sesgo, y la mayoría de los estudios se consideró en riesgo incierto. Todos los ensayos se realizaron en los últimos 19 años y se han beneficiado con los adelantos en la metodología de los ensayos y las expectativas de los informes. Se consideró que sólo cuatro ensayos (Baker 2018; Harris 2015; Ondersma 2012; Tappin 2015a) informaron procedimientos de asignación al azar adecuados.
Sesgos potenciales en el proceso de revisión
Se siguieron los métodos Cochrane estándar que están diseñados para reducir los riesgos de sesgo. El gráfico en embudo para el análisis principal en poblaciones mixtas no sugirió evidencia de asimetría. Se realizaron búsquedas en los registros de ensayos, aunque no es posible descartar la posibilidad de que se hayan omitido estudios no publicados y no registrados.
Acuerdos y desacuerdos con otros estudios o revisiones
En años recientes se han publicado varias revisiones sistemáticas que abordan los incentivos para el abandono del hábito de fumar. Dos revisiones analizan el tabaquismo entre otras intervenciones de salud pública basadas en incentivos: Giles 2014 evaluó 16 estudios de cambios en el comportamiento de salud incentivados, 10 de los cuales se centraron en el abandono del hábito de fumar. Al utilizar la mayoría de los mismos estudios que las versiones anteriores, estos ensayos demostraron un efecto beneficioso en el abandono del hábito de fumar hasta los seis meses de seguimiento (CR 2,48; IC del 95%: 1,77 a 3,46) y en un seguimiento posterior (más de seis meses) (CR 1,50; IC del 95%: 1,05 a 2,14), aunque tienen una heterogeneidad alta (I2 = 76%). Dos revisiones adicionales se limitaron al abandono del hábito de fumar solamente: Leeks 2010 demostró un beneficio del 4,4% en una mediana de 12 meses de seguimiento para los programas de cesación en el lugar de trabajo que incluían incentivos o competiciones. Sigmon 2012b analizó programas de incentivo dentro de determinados subgrupos de población de alto riesgo, incluidos los consumidores de sustancias, los adolescentes y los adultos jóvenes y los pacientes con diagnóstico de enfermedades pulmonares, y también destacaron el uso de procedimientos de acondicionamiento para los fumadores difíciles de tratar, la promesa de desarrollar tecnologías para proporcionar la intervención y la variación en la escala de incentivos.
Se conocen dos revisiones que sintetizan la evidencia sobre los esquemas de incentivos en mujeres embarazadas. Higgins 2012 resumió una serie de seis ensayos de incentivos en fumadoras embarazadas, fue realizada por dos grupos de investigación en los EE.UU. y en particular abordó resultados del parto. Los resultados son similares, al afirmar que dichas intervenciones "son prometedoras" como mecanismo para aumentar las tasas de abandono en esta población de fumadores. Sin embargo, como se ha señalado anteriormente, los estudios sugieren que la implementación de incentivos puede ser difícil, independientemente de la evidencia. Los resultados en mujeres embarazadas son similares a los informados en la Revisión Cochrane de Embarazo y Parto (Chamberlain 2017), aunque existen algunas diferencias clave. La revisión Chamberlain 2017 evaluó la efectividad de las intervenciones psicosociales para el abandono del hábito de fumar en el embarazo e incluyó un subconjunto de estudios que utilizaron incentivos. Su resultado primario fue la abstinencia alrededor del final del embarazo, mientras que aquí es la abstinencia al momento del seguimiento más largo, es decir, luego del parto cuando estuvo disponible. A diferencia de la revisión, no excluyeron del denominador los retiros preespecificados (interrupción, muerte fetal). El metanálisis de Chamberlain 2017 incluyó sólo datos que comparaban los incentivos contingentes con intervenciones alternativas. Identificaron datos insuficientes para las comparaciones con la atención habitual y heterogeneidad sustancial (2 = 93%) al evaluar los incentivos en comparación con las intervenciones menos intensivas, lo que impide el agrupamiento de los datos. Se incluyen seis ensayos que no aparecen en el metanálisis de Chamberlain 2017. Su resultado principal (incentivos versus intervenciones alternativas para la abstinencia del hábito de fumar alrededor del final del embarazo) abarca a 212 mujeres, lo que resulta en un cociente de riesgos de 2,26 (IC del 95%: 1,36 a 4,09) (Chamberlain 2017). El análisis del mismo resultado (secundario) en 1244 mujeres proporciona un CR de 2,79 (IC del 95%: 2,10 a 3,72) (Análisis 2,2).

Study flow diagram for 2019 update
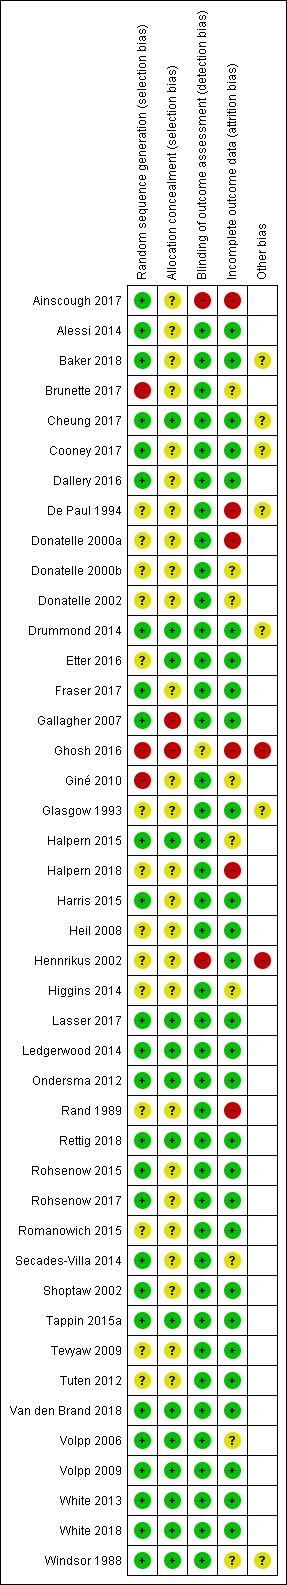
Risk of bias summary: review authors' judgements about each risk of bias item for each included study.

Exploratory meta‐regression testing association between incentive amount and effect estimate

Funnel plot of comparison: 1 Incentives in mixed populations, outcome: 1.1 Smoking cessation (subgrouped by when incentives were provided).

Comparison 1 Incentives in mixed populations, Outcome 1 Smoking cessation (subgrouped by when incentives were provided).

Comparison 1 Incentives in mixed populations, Outcome 2 Smoking cessation (grouped by substance misuse).

Comparison 2 Incentives in pregnant women, Outcome 1 Smoking cessation at longest follow‐up.

Comparison 2 Incentives in pregnant women, Outcome 2 Abstinence at end of pregnancy.

Comparison 2 Incentives in pregnant women, Outcome 3 Contingent rewards vs guaranteed payments.
| Smoking cessation: incentives compared to no incentives in mixed populations | ||||||
| Patient or population: Adult smokers | ||||||
| Outcomes | Anticipated absolute effects* (95% CI) | Relative effect | № of participants | Certainty of the evidence | Comments | |
| Risk with control | Risk with incentives: mixed populations | |||||
| Smoking cessation in mixed populations ‐ Longest follow‐up Follow‐up: 6 months to 24 months) | 71 per 1000 | 106 per 1000 | RR 1.49 | 21,627 (adjusted n = 20,097) | ⊕⊕⊕⊕ | For 1 included study extractable data were available but did not contribute anything to the analysis as no events (episodes of smoking cessation) occurred in either arm; we excluded a further two studies from the formal analysis, since no extractable data were available on programme participants at follow‐up. More recent studies were higher quality and routinely included longer‐term follow up beyond 6 months assessment |
| *The risk in the intervention group (and its 95% confidence interval) is based on the assumed risk in the comparison group and the relative effect of the intervention (and its 95% CI). | ||||||
| GRADE Working Group grades of evidence | ||||||
| aOverall we rate the quality of evidence as high, despite some of the included studies being considered at high risk of bias. This is because when analyses were restricted to only those studies at low risk of overall bias there was still a significant effect in favour of the intervention. Similarly, when we removed studies at high risk of bias from analyses, leaving only those at low and unclear risk of bias, there remained an effect estimate clearly in favour of the intervention. We are therefore very confident that the true effect lies close to that of the estimate of the effect. | ||||||
| Smoking cessation: incentives compared to no incentives in pregnant women | ||||||
| Patient or population: Pregnant women who smoke Comparison: No incentives | ||||||
| Outcomes | Anticipated absolute effects* (95% CI) | Relative effect | № of participants | Certainty of the evidence | Comments | |
| Risk with control | Risk with incentives: pregnancy | |||||
| Smoking cessation in pregnancy at longest follow‐up Follow‐up: 10 to 24 weeks post‐partum | 72 per 1000 | 170 per 1000 | RR 2.38 | 2273 | ⊕⊕⊕⊕ | 1 included study did not contribute to the analysis because of lack of usable data |
| *The risk in the intervention group (and its 95% confidence interval) is based on the assumed risk in the comparison group and the relative effect of the intervention (and its 95% CI). | ||||||
| GRADE Working Group grades of evidence | ||||||
| aOverall we rate the quality of evidence as moderate, as we judged only two of the included studies to be at low risk of bias (one study at high risk; the rest at unclear risk). When we restricted analyses to only those studies at low risk of overall bias, there was still a significant effect in favour of the intervention, but this represents only two studies with fewer than 100 events overall. | ||||||
| Study ID | Denominator | Abstinence | Time point | Biological criterion | Quit rate | Stat sig? | Other outcomes | Comment |
| Ainscough 2017 | 19 (IG) 18 (CG) | PPA | 6 months | CO < 10 ppm | 1 (IG) | N.S. | N of participants completing the smoking cessation intervention; opioid treatment outcomes (opioid treatment adherence, drug types, treatment schedule); illicit drug use. | Only 1 participant followed up, not CO verified |
| Alessi 2014 | 24 (CM) 21 (control) | 7‐day PPA | 24 weeks | CO < 6 ppm cotinine < 30 ng/ml | 12.5% (I) 23.8% (C) | N.S. | % reduction in cpd; self‐efficacy | Raw data supplied by the author |
| Brunette 2017 | "approximately half of 146" (CG) "approximately half of 146" (PV+incentives) "approximately half of 303" (PV+Q) "approximately half of 303" (PV+Q+incentives) "approximately half of 212" (PV+CBT) "approximately half of 212" (PV+CBT+incentives) | PPA | 12 months | CO < 4 ppm; cotinine 100 ng/mL | 8% (PV) 6% (PV + incentives) 3.5% (PV+Q) 14% (PV+Q+incentives) 5% (PV+CBT) 12.5% (PV+CBT+incentives) | N.S. | Treatment programme participation, medications | ‐ |
| Cheung 2017 | 379 (early infomed) 385 (Late informed) 379 (Control) | PPA | 6 months | CO < 4 ppm cotinine < 10 ng/ml | 19 (5%) EI 11 (2.9%) LI 17 (4.5%) CG | N.S. | Quit attempts (longest duration and number of quit attempts , mean number of quit attempts, no smoking for at least 24 hours); cessation aids | ‐ |
| Cooney 2017 | 42 CM 41 CG | PPA | 6 months | CO ≤ 5 ppm | 5 (12%) CM 2 (5%) CG | P = 0.004 | Smoking at 1.5 weeks after quit date, 1 month. Alcohol use, drug use | ‐ |
| Dallery 2016 | 48 AC 46 SC (CG) | PPA | 6 months | CO ≤ 4 ppm | 11 (22.9%) AC 6 (13%) SC | N.S. | PP at week 4 and 3‐month follow‐up. Treatment acceptability, behavioural change | CO results were video recorded and submitted remotely |
| De Paul 1994 | 281 (I) | PPA | 24 months | CO < 9 ppm | 13.2% (I) | N.S. | PP, ITT and continuous quit rates reported at all time points | Comparison confined to I and SH groups in this review. Cluster‐randomised so adjusted in main analyses; unadjusted data presented here |
| Drummond 2014 | 50 (UC/LA) 50 (CM x 2) | 7‐day PPA | 6 months | cotinine, eCO | UC/LA 1/50 CM 3/50 | N.S. | CO values, Fagerström score, N of visits wanting to quit, trying to quit, reporting cessation, eCO‐confirmed quitting | Groupings collapsed, as lung age alone or combined with CM produced no quitters |
| Etter 2016 | 401 (IG) 404 (CG) | Continuouse abstinence from months 6 ‐ 18 verified by PPA | 18 months | CO to 3 ppm; cotinine < 10 ng/ml | 39 (9.7%) IG 19 (4.7) CG | P = 0.001 | Quit attempts during the intervention phase (number, duration and dates) | ‐ |
| Fraser 2017 | 948 (IG) 952 (CG) | PPA | 6 months | CO ≥ 7 ppm contine | 205 (21.62%) IG 131 (13.76%) CG | P < 0.001 | Treatment engagement, medications | Continine testing: value that exceeded either 50 ng/mL, 100 ng/mL, or 200 ng/mL, depending on the clinic. 4 clinics used 300 ng/mL as the smoking cut‐score |
| Gallagher 2007 | 60 (CR) | PPA | 36 weeks | CO ≤ 10 ppm | 7% (CR) | N.S. | CO‐validated rates higher, i.e. 37% (CR), 8% (Cont). | CR+NRT group not used in our comparison |
| Ghosh 2016 | 6 (IG) 8 (CG) | PPA | 6 months | Not defined | 2 (IG) 0 (CG) | N.S. | Quality of life (SF12) | 6‐month follow‐up but methods state 12 months. Attempted to contact author to clarify but no reply |
| Giné 2010 | 781 (CARES) 603 (Cards) 616 (Control) | PPA | 12 months | NicCheck strip (urinary cotinine) = 0 | 11% (CARES) 9.3% (Cards) 8.9% (Cont) | P = 0.05 | 6‐month PPA: CARES 9.7%, Cards 10%, Control 8.3%. Cost effectiveness: USD 700 per quitter | 12‐month assessment was 'sprung' on participants |
| Glasgow 1993 | 344 (I) | 7‐day | 2 years | CO ≤ 9 ppm | 14.2% (I) | N.S. | Incentives had a sig. effect (P < 0.03) on less educated participants (18.6% vs 8.8% at 2 years 'probably chance'). | 27% of all abstinent claims could not be biochemically verified. Cluster‐randomised so adjusted in main analyses; unadjusted data presented here |
| Halpern 2015 | 498 (Ind R) 519 (Coll R) 582 (Ind D) 471 (Com D) 468 (UC) | sustained | 12 months | Cotinine < 10 ng/ml anabasine/anabitine < 3 ng/ml | 7.4% (Ind R) 8.7% (Coll R) 3.6% (Ind D) 6.2% (Com D) 3.4% (UC) | vs UC: 0.007 0.001 0.94 0.052 | Sustained verified abstinence @ 14 days, 30 days, 6m; Self‐reported abstinence at 12m; per protocol analyses; Uptake rates of assigned intervention | No differences between individual and group interventions, so both reward arms versus both deposit arms combined for analysis |
| Halpern 2018 | 1198 (rewards) 1208 (redeemable) 1599 (Control) | PPA | 12 months | Cotinine < 20 ng per milliliter, anabasine level of less than 3 ng per milliliter or CO less than 4%. | 13 (rewards) 16 (redeemable) 5 (control) | Deposits: P ≥ 0.001 Rewards P ≥ 0.006 | Point prevalence for quitting at 1 month and sustained abstinence rates at 3 months and 6 months | ‐ |
| Hennrikus 2002 | 407 | 7‐day PPA | 24 months | Saliva from 149 random sample of quitters at 24 months | 19.4% | Not stated | Cohort prevalence and cessation rates (PP and continuous) | Programme registrants' outcomes not available. Unadjusted data presented here |
| Lasser 2017 | 177 IG 175 CG | Continuous verified at 6 and 12 months | 12 months | Saliva or urine cotinine (≤ 10 ng/ml) or anabasine < 3 ng/mL) | 21 (12%) IG 4 (2%) | P ≤ 0.001 | Receipt of counselling, medications | ‐ |
| Ledgerwood 2014 | ECM: 36 TCM: 28 SC (Control): 17 | PPA | 6 months | Urinary cotinine ≤ 100 ng/mL CO ≤ 6 ppm | 4/64 (TCM+ECM) 1/17 | N.S. | Prize money won; 81% CM participants earned prizes (median USD 120.56); Differences between TCM and ECM in week 1 non‐significant | Both CM arms combined for analysis |
| Rand 1989 | 17 contingent | Continuous | 6 months | CO ≤ 11 ppm | 1/17 contingent | N.S. | Numbers of abstinent CO samples and missed samples | Pairwise comparisons gave sig diffs at 11 ppm, but not at 8 ppm |
| Rettig 2018 | 8 (CG) 13 (IG) | PPA | 12 months | 8 ppm | 0 (CG) 4 (31%) (!G) | P = 0.05 | Smoking abstinence at 1, 2, 3,4,5,6,7 and 8 weeks, and at 3 and 6 months. Smoking intensity (total cigarettes per previous 7 days), the reduction from baseline, and total cigarettes smoked | ‐ |
| Rohsenow 2015 | 44 Control (BA/CV) 42 Control (BA/NCV) 53 Intervention (MI/CV) 44 Intervention (MI/NCV) | PPA | 12 months | CO ≤ 4 ppm and salivary cotinine ≤ 15 ng/ml | 0 Control (BA/CV) 2 Control (BA/NCV) (4.8) 4 (7.5) Intervention (MI/CV) 2 (4.5) Intervention (MI/NCV) | N.S. | Cigarette reduction (CPD), number of heavy drinking days, number of drug use days, relapse to any heavy drinking or drug use over the 12 months | ‐ |
| Rohsenow 2017 | 166 CG (NV) 163 IG (CV) | PPA | 12 months | CO l ≤ 4 ppm and salivary cotinine ≤ 15 ng/ml | 3 (1.8%) CG (NV) 6 (3.7%) IG (CV) | N.S. | CPD at 1, 3, 6 months. Number of heavy drinking days Smoking Self‐Efficacy Questionnaire pretreatment and at 1 month. | ‐ |
| Romanowich 2015 | 32 HTT percentile criterion 27 HTT fixed criterion 14 HTT random payments 44 ES escalating payments 43 ES fixed payments 23 ES random payments | Continuous | 6 months | CO < 4 ppm. Cotinine < 20 ng/ml | 3 (8.3%) HTT percentile criterion 2 (5.0%) HTT fixed criterion 1 (5.6%) HTT random payments 4 (6.8%) ES escalating payments 6 (10.3%) ES fixed payments 5 (17.2%) ES random payments | ‐ | Use of smoking cessation medication. CPD in past 6 weeks at 6 months | Results confirmed by authors by email. CO < 3 ppm Stated in NCT entry but < 4 ppm stated in email correspondence. HTT are participants who did not deliver a breath CO level < 4 ppm during the first 5 study days when they could earn USD 5 for doing so and were randomised to 1 set of conditions. ES did deliver at least 1 CO sample < 4, and were randomised to another set of conditions |
| Secades‐Villa 2014 | 43 CBT + CM 49 CBT | Continuous | 6 months | CO < 4 ppm; | 17/43 CM 13/49 CBT | N.S. | Treatment retention; % attending all sessions for 6 months | ‐ |
| Shoptaw 2002 | 42 (P) | PPA | 12 months | CO ≤ 8 ppm | 4/36 (P) | N.S. | Treatment group and cocaine and opiate abuse | Quit rates supplied by authors. |
| Tevyaw 2009 | 28 (CM+MET) | 7‐day PPA | 6 months | CO < 5 ppm | 1/55 (CM) | N.S. | Attendance, sample returns. | ‐ |
| Tuten 2012 | ||||||||
| Van den Brand 2018 | 319 (IG) 284 (CG) | Continuous | 12 months | CO 9 ppm | 131 (41%) IG 75 (26%) CG | P < 0.001 | 3‐ and 6‐month biochemically validated abstinence, and self‐reported abstinence | Cluster‐randomised so adjusted in main analyses; unadjusted data presented here |
| Volpp 2006 | 92 (I) | 7‐day PPA | 6 months post‐completion (˜7.5 months) post‐quit date | Urinary cotinine < 500 ng/mL | 6/92 (I) | N.S. | Enrolment attendance programme completion | Denominators could be Ns enrolled (I:38, C:17). No quitters outside the enrollers |
| Volpp 2009 | 436 (I) | Prolonged | 15 or 18 months | Salivary cotinine < 15 ng/ml | 41/436 (I) 16/442 (C) | P < 0.001 | Enrolment in SC course, completion of SC course | 15 to 18 months results shown in 12‐month forest plot |
| White 2013 | 131 (I) 69 (C) | 7‐day PPA | 6 months | Urinary cotinine | 58/131 (I) 13/69 (C) | P < 0.001 | PPA at 3 months (verified), 14 months (self‐report). Relative success of teams vs individuals? Yes Choosing team partner vs random assignment? No Did text messages help? No Cost effectiveness; No figures given | ‐ |
| White 2018 | 508 (USD 20 individual bonus) 481 (USD 40 individual bonus) 491 (team bonus) 396 (deposits) 363 (deposits plus teammate (no bonus)) 514 (deposits plus $20 individual bonus) 489 (deposits plus USD 40 individual bonus) 496 (deposits plus team bonus) 444 (CG) | 7‐day PPA | 12 months | Cotinine cut‐off level of 200 ng/mL | 74 (14.6%) (USD 20 individual bonus) 104 (21.6%) (USD 40 individual bonus) 60 (12.2%) (team bonus) 57 (14.4%) (deposits) 49 (13.5%) (deposits plus teammate (no bonus)) 72 (14%) (deposits plus USD 20 individual bonus) 91 (18.6%) (deposits plus USD 40 individual bonus) 67 (13.5%) (deposits plus team bonus) 42 (9.5%) (CG) | Significantly higher for all other comparisons NS | PPA at 3 and 6 months. | Cluster‐randomised so adjusted in main analyses; unadjusted data presented here |
| Windsor 1988 | 95 (A) | Continuous | 12 months | SCN ≤ 100 ng/mL | ≃ 6% (A) | Not reported | Social enhancement vs self‐help manual (± incentives) gave a continuous quit rate of 14.4% at 12 months, vs 5.8% | Incentives comparison was abandoned at 6 weeks |
| Study ID | Denominator | Abstinence | Time point | Biological criteria | Quit rate | Stat sig? | Other outcomes | Comment |
| Baker 2018 | 505 (IG) 509 (CG) | 7‐day PPA | 6 months | CO < 7 ppm | 74 (14.65%) (IG) | P ≤ 0.01 | N of post‐birth home visits and phone calls taken; biochemically confirmed abstinence at the post‐birth week 1 visit; and self‐reported smoking status at the 2‐ and 4‐month visits | Engagement in treatment and cost effectiveness also cited on NCT record but NR |
| Donatelle 2000a | 112 (I) 108 (C) | 7‐day PPA | 8‐month gestation | Salivary cotinine < 30 ng/ml | 34/105; 32% (I) 9/102; 9% (C) | Chi² = 18.4; P < 0.0001 | None stated | Differential losses to follow‐up; (I) 32% at 8m, vs (C) 51.5%. |
| 112 (I) 108 (C) | 7‐day PPA | 2m post‐partum | Salivary cotinine < 30 ng/ml | 22/103; 21% (I) 6/102; 5.9% (C) | Chi2 = 11; | None stated | Differential losses to follow‐up; (I) 36% at 2 months post‐partum, vs (C) 52% | |
| Donatelle 2000b | 67 (E1) | "biochemically confirmed abstinence" | End of pregnancy | Salivary cotinine < 30 ng/ml | 19% (E1) 22% (E2) 12% (C) | Not stated | None stated | Very little information available |
| Donatelle 2002 | 102 (E1) 96 (E2) 95 (C) | Self‐report (telephone call) | 8 months gestation | Salivary cotinine < 30 ng/ml | N.S. | Not stated. | High vs low incentives; cost per quitter | Results are interim analysis only, based on 298 enrolled; target was 600. |
| Harris 2015 | 7 IG (CM) 10 CG (SCHB) | PPA | Approximately 6 months | Urinary cotinine (cut‐off not defined) | 1 IG (CM) 3 CG (SCHB) | Not stated but assume NS | Smoking reduction (time line follow‐back method), Stages of Change Ladder (SCL), Modified Fagerström Test ¨ of Nicotine Dependence (mFTND); Post‐treatment assessments measured birth outcomes (e.g. gestational age at birth, birth weight, and time spent in NICU) and smoking‐related variables | Follow‐up time point reported as 8.75 months pregnant (IG) and 8.19 months pregnant (CG). Randomised at (mean = 10.75 weeks pregnant), so follow‐up approximately 6 months |
| Heil 2008 | 37 (I) 40 (C) | PPA | End of pregnancy | Urine cotinine < 80 ng/ml CO ≤ 6 ppm | 15/37; 41% (I) 4/40; 10% (C) | P = 0.003 | Foetal growth | ‐ |
| antepartum CA; 24 weeks post‐partum | Urine cotinine < 80 ng/ml CO ≤ 6 ppm | 3/37; 8% (I) 1/40; 3% (C) | N.S. | Baby health Total voucher earnings | ‐ | |||
| Higgins 2014 | 44 (RCV; E1) 44 (CV; E2 42 (NCV; C) | 7‐day PPA | 28 wks gestation | Urinary cotinine ≤ 80 ng/ml CO < 4 ppm or 6 ppm | 18/40; 45% (E1) 14/39; 36% (E2) 7/39; 18% (C) | N.S. | Foetal growth | ‐ |
| 44 (RCV; E1) 44 (CV; E2 42 (NCV; C) | 7‐day PPA | 24 weeks post‐partum | Urinary cotinine ≤ 80 ng/ml CO < 4 ppm or 6 ppm | 7/40; 18% (E1) 6/39; 15% (E2) 3/39; 8% (C) | ‐ | Foetal growth Birth outcomes | ‐ | |
| Ondersma 2012 | 26 (E1) 28 (E2) 30 (E3) 26 (C) | 7‐day PPA | 30‐day CA 7‐day PPA | Urinary cotinine ≤ 100 ng/ml CO < 4 ppm | 6/23: 26% (E1) 2/22: 10% (E2) 5/26: 19% (E3) 1/23: 4% (C) | E1 P < 0.05 | ‐ | ‐ |
| 42 (E1) 28 (E2) 32 (C) | PPA | 12 weeks | CO < 4 ppm Urine sample (for cocaine) | 13/42; 31% (E1) 0/28; 0% (E2) 0/32; 0% (C) | ‐ | ‐ | ‐ | |
| Tappin 2015a | 306 (I) 306 (C) | "even a puff" in past 2 weeks "even a puff" in past 4 weeks < 5 cigs in past 8 weeks | 4 weeks 12 weeks (if quit at 4) 34 ‐ 38 weeks gest (all participants) | CO < 10 ppm Cotinine: Urine 44.7 ng/ml; saliva 14.2 ng/ml | 69/306 (I) 26/303 (C) | P < 0.001 | Adverse events engagement birth weight cost effectiveness | 3 controls dropped out after randomisation ‐ not included in denominators |
| 306 (I) 306 (C) | still quit or < 5 cigs for since TQD | 6 months post‐natal (for 34/38‐week quitters) | Cotinine: Urine 44.7 ng/ml; saliva 14.2 ng/ml | 47/306 (I) 12/303 (C) | P < 0.001 | ‐ | 3 controls dropped out after randomisation ‐ not included in denominators | |
| Tuten 2012 | 42 (E1) 28 (E2) 32 (C) | Self‐reported 24‐hour PPA | 6 weeks PPA | None | 13/42; 31% (E1) 0/28; 0% (E2) 0/32; 0% (C) | N.S. | Mean CPD | ‐ |
| 42 (E1) 28 (E2) 32 (C) | Self‐reported 24‐hour PPA | 6 weeks PPA | None | 13/42; 31% (E1) 0/28; 0% (E2) 0/32; 0% (C) | N.S. | Mean CPD | Abstinence not reported for this time point |
| Outcome or subgroup title | No. of studies | No. of participants | Statistical method | Effect size |
| 1 Smoking cessation (subgrouped by when incentives were provided) Show forest plot | 30 | 20060 | Risk Ratio (M‐H, Random, 95% CI) | 1.49 [1.28, 1.73] |
| 1.1 Incentives provided at longest follow‐up | 6 | 3039 | Risk Ratio (M‐H, Random, 95% CI) | 1.66 [1.33, 2.07] |
| 1.2 Incentives not provided at longest follow‐up | 24 | 17021 | Risk Ratio (M‐H, Random, 95% CI) | 1.40 [1.16, 1.69] |
| 2 Smoking cessation (grouped by substance misuse) Show forest plot | 31 | 20097 | Risk Ratio (M‐H, Random, 95% CI) | 1.49 [1.28, 1.73] |
| 2.1 Substance misusers | 8 | 1055 | Risk Ratio (M‐H, Random, 95% CI) | 1.24 [0.81, 1.89] |
| 2.2 Non‐substance misusers | 23 | 19042 | Risk Ratio (M‐H, Random, 95% CI) | 1.52 [1.29, 1.80] |
| Outcome or subgroup title | No. of studies | No. of participants | Statistical method | Effect size |
| 1 Smoking cessation at longest follow‐up Show forest plot | 9 | 2273 | Risk Ratio (M‐H, Random, 95% CI) | 2.38 [1.54, 3.69] |
| 2 Abstinence at end of pregnancy Show forest plot | 7 | 1244 | Risk Ratio (M‐H, Random, 95% CI) | 2.79 [2.10, 3.72] |
| 3 Contingent rewards vs guaranteed payments Show forest plot | 3 | 225 | Risk Ratio (M‐H, Random, 95% CI) | 3.33 [0.97, 11.38] |