Efavirenz or nevirapine in three‐drug combination therapy with two nucleoside or nucleotide‐reverse transcriptase inhibitors for initial treatment of HIV infection in antiretroviral‐naïve individuals
Abstract
Background
The advent of highly active antiretroviral therapy (ART) has reduced the morbidity and mortality due to HIV infection. The World Health Organization (WHO) ART guidelines focus on three classes of antiretroviral drugs, namely nucleoside or nucleotide reverse transcriptase inhibitors (NRTI), non‐nucleoside reverse transcriptase inhibitors (NNRTI) and protease inhibitors. Two of the most common medications given as first‐line treatment are the NNRTIs, efavirenz (EFV) and nevirapine (NVP). It is unclear which NNRTI is more efficacious for initial therapy. This systematic review was first published in 2010.
Objectives
To determine which non‐nucleoside reverse transcriptase inhibitor, either EFV or NVP, is more effective in suppressing viral load when given in combination with two nucleoside reverse transcriptase inhibitors as part of initial antiretroviral therapy for HIV infection in adults and children.
Search methods
We attempted to identify all relevant studies, regardless of language or publication status, in electronic databases and conference proceedings up to 12 August 2016. We searched MEDLINE, Embase, the Cochrane Central Register of Controlled Trials (CENTRAL), the World Health Organization (WHO) International Clinical Trials Registry Platform (ICTRP) and ClinicalTrials.gov to 12 August 2016. We searched LILACS (Latin American and Caribbean Health Sciences Literature) and the Web of Science from 1996 to 12 August 2016. We checked the National Library of Medicine (NLM) Gateway from 1996 to 2009, as it was no longer available after 2009.
Selection criteria
We included all randomized controlled trials (RCTs) that compared EFV to NVP in people with HIV without prior exposure to ART, irrespective of the dosage or NRTI's given in combination.
The primary outcome of interest was virological success. Other primary outcomes included mortality, clinical progression to AIDS, severe adverse events, and discontinuation of therapy for any reason. Secondary outcomes were change in CD4 count, treatment failure, development of ART drug resistance, and prevention of sexual transmission of HIV.
Data collection and analysis
Two review authors assessed each reference for inclusion using exclusion criteria that we had established a priori. Two review authors independently extracted data from each included trial using a standardized data extraction form. We analysed data on an intention‐to‐treat basis. We performed subgroup analyses for concurrent treatment for tuberculosis and dosage of NVP. We followed standard Cochrane methodological procedures.
Main results
Twelve RCTs, which included 3278 participants, met our inclusion criteria. None of these trials included children. The length of follow‐up time, study settings, and NRTI combination drugs varied greatly. In five included trials, participants were receiving concurrent treatment for tuberculosis.
There was little or no difference between EFV and NVP in virological success (RR 1.04, 95% CI 0.99 to 1.09; 10 trials, 2438 participants; high quality evidence), probably little or no difference in mortality (RR 0.84, 95% CI 0.59 to 1.19; 8 trials, 2317 participants; moderate quality evidence) and progression to AIDS (RR 1.23, 95% CI 0.72 to 2.11; 5 trials, 2005 participants; moderate quality evidence). We are uncertain whether there is a difference in all severe adverse events (RR 0.91, 95% CI 0.71 to 1.18; 8 trials, 2329 participants; very low quality evidence). There is probably little or no difference in discontinuation rate (RR 0.93, 95% CI 0.69 to 1.25; 9 trials, 2384 participants; moderate quality evidence) and change in CD4 count (MD −3.03; 95% CI −17.41 to 11.35; 9 trials, 1829 participants; moderate quality evidence). There may be little or no difference in treatment failure (RR 0.97, 95% CI 0.76 to 1.24; 5 trials, 737 participants; low quality evidence). Development of drug resistance is probably slightly less in the EFV arms (RR 0.76, 95% CI 0.60 to 0.95; 4 trials, 988 participants; moderate quality evidence). No studies were found that looked at sexual transmission of HIV.
When we examined the adverse events individually, EFV probably is associated with more people with impaired mental function (7 per 1000) compared to NVP (2 per 1000; RR 4.46, 95% CI 1.65 to 12.03; 6 trials, 2049 participants; moderate quality evidence) but fewer people with elevated transaminases (RR 0.52, 95% CI 0.35 to 0.78; 3 trials, 1299 participants; high quality evidence), fewer people with neutropenia (RR 0.48, 95% CI 0.28 to 0.82; 3 trials, 1799 participants; high quality evidence), and probably fewer people withrash (229 per 100 with NVP versus 133 per 1000 with EFV; RR 0.58, 95% CI 0.34 to 1.00; 7 trials, 2277 participants; moderate quality evidence). We found that there may be little or no difference in gastrointestinal adverse events (RR 0.76, 95% CI 0.48 to 1.21; 6 trials, 2049 participants; low quality evidence), pyrexia (RR 0.65, 95% CI 0.15 to 2.73; 3 trials, 1799 participants; low quality evidence), raised alkaline phosphatase (RR 0.65, 95% CI 0.17 to 2.50; 1 trial, 1007 participants; low quality evidence), raised amylase (RR 1.40, 95% CI 0.72 to 2.73; 2 trials, 1071 participants; low quality evidence) and raised triglycerides (RR 1.10, 95% CI 0.39 to 3.13; 2 trials, 1071 participants; low quality evidence). There was probably little or no difference in serum glutamic oxaloacetic transaminase (SGOT; MD 3.3, 95% CI ‐2.06 to 8.66; 1 trial, 135 participants; moderate quality evidence), serum glutamic‐ pyruvic transaminase (SGPT; MD 5.7, 95% CI ‐4.23 to 15.63; 1 trial, 135 participants; moderate quality evidence) and raised cholesterol (RR 6.03, 95% CI 0.75 to 48.78; 1 trial, 64 participants; moderate quality evidence).
Our subgroup analyses revealed that NVP slightly increases mortality when given once daily (RR 0.34, 95% CI 0.13 to 0.90; 3 trials, 678 participants; high quality evidence). There were little or no differences in the primary outcomes for patients who were concurrently receiving treatment for tuberculosis.
Authors' conclusions
Both drugs have similar benefits in initial treatment of HIV infection when combined with two NRTIs. The adverse events encountered affect different systems, with EFV more likely to cause central nervous system adverse events and NVP more likely to raise transaminases, cause neutropenia and rash.
PICO
Plain language summary
Effectiveness of EFV compared to NVP in the suppression of HIV infection when used as part of initial three‐drug combination
Research question
For people living with HIV who have never received antiretroviral therapy (ART), which drug is more effective in suppressing HIV infection in combination with two nucleoside reverse transcriptase inhibitors (NRTI): efavirenz (EFV) or nevirapine (NVP)?
Background
The introduction of highly active ART as treatment for HIV infection has greatly reduced mortality and morbidity for adults and adolescents living with HIV around the world. The recommended initial treatments for HIV infection include two drugs from a class of drugs known as NRTI and one from a related class of drugs called non‐nucleoside reverse transcriptase inhibitors (NNRTI). The two NNRTIs most commonly used are NVP and EFV. However, NVP can cause liver damage and severe rash, both of which can be fatal. EFV may also cause a rash, impair mental function, and cause foetal malformations.
Main results
Cochrane researchers examined the available literature up to 12 August 2016 and identified 12 randomized controlled trials, with a total of 3278 people, that met the inclusion criteria of this review. None of the included trials included children. Four trials included people who were also receiving treatment for tuberculosis. There was little or no difference in suppression of HIV infection (high quality evidence), probably little or no difference in mortality, progression to AIDS, stopping treatment early and changes in blood cells affected by HIV (moderate quality evidence). There may be little or no difference in treatment failure (low quality evidence). We are uncertain whether there is a difference in side‐effects (very low quality evidence). No studies were found that looked at sexual transmission of HIV. Development of drug resistance is probably slightly less in the EFV group (moderate quality evidence). When the side effects were examined individually, EFV probably caused more impaired mental function (6% in the EFV group and 2% in the NVP group; moderate quality evidence), while NVP probably caused more people to have a rash (3% in the EFV group and 6% in the NVP group; moderate quality evidence), caused more people to have reduced white blood cells (2% in the EFV group and 5% in the NVP group; high quality evidence), and signs of liver damage (6% in the EFV group and 11% in the NVP group; high quality evidence). There was probably little or no difference in increases in liver enzymes and levels of cholesterol (moderate quality evidence). There may be little or no difference in digestive side‐effects, fever, enzymes from the liver and pancreas, and fat in the blood (low quality evidence). People on NVP were probably more likely to die when given a once‐daily regimen (2% in the EFV group and 4% in the NVP group; moderate quality evidence). In people who were taking treatment for tuberculosis compared to those who were not, there was probably little or no difference in suppression of HIV, deaths, progression to AIDS or stopping treatment early (moderate to high quality evidence).
Conclusion
EFV and NVP are similarly effective in viral suppression, preventing HIV progression and reducing mortality. EFV is more likely to affect mental function, while NVP is more likely to cause signs of liver damage, reduced white blood cells and rash.
Authors' conclusions
Summary of findings
| Efavirenz (600 mg) versus nevirapine (all doses) for three‐drug combination therapy with two nucleoside‐reverse transcriptase inhibitors for initial treatment of HIV infection in antiretroviral‐naïveindividuals | |||||
| Patient or population: antiretroviral‐naïve individuals | |||||
| Outcomes | Anticipated absolute effects* (95% CI) | Relative effect | Number of participants | Quality of the evidence | |
| Risk with nevirapine all doses | Risk with efavirenz 600 mg | ||||
| Virological success | 688 per 1000 | 715 per 1000 | RR 1.04 | 2438 | ⊕⊕⊕⊕ |
| Mortality | 64 per 1000 | 54 per 1000 | RR 0.84 | 2317 | ⊕⊕⊕⊝ |
| Progression to AIDS | 41 per 1000 | 50 per 1000 | RR 1.23 | 2005 | ⊕⊕⊕⊝ |
| All severe adverse events | 192 per 1000 | 216 per 1000 | RR 0.91 | 2329 | ⊕⊝⊝⊝ |
| Discontinuation rate | 176 per 1000 | 164 per 1000 | RR 0.93 | 2384 | ⊕⊕⊕⊝ |
| Change in CD4 count | The mean change in CD4 count was 0 | MD 3.03 lower | — | 1829 | ⊕⊕⊕⊝ |
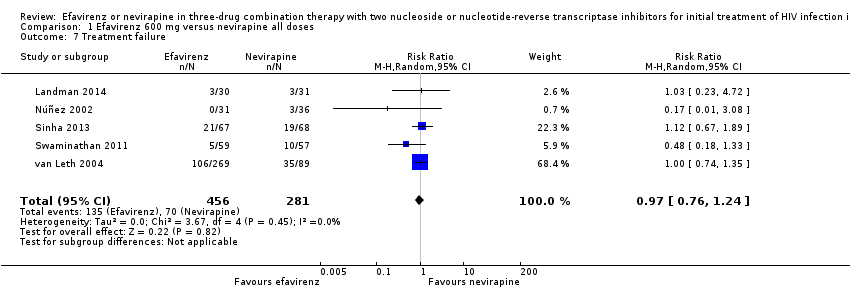
| Treatment failure | 249 per 1000 | 242 per 1000 | RR 0.97 | 737 | ⊕⊕⊝⊝ |
| *The risk in the intervention group (and its 95% CI) is based on the assumed risk in the comparison group and the relative effect of the intervention (and its 95% CI). | |||||
| GRADE Working Group grades of evidence | |||||
| 1Three trials used a cut‐off point of 400 copies/mL (Ayala Gaytán 2004; Swaminathan 2011; Sinha 2013), but we did not downgrade for this. | |||||
| Efavirenz (600 mg) versus nevirapine (all doses): adverse events for three‐drug combination therapy with two nucleoside‐reverse transcriptase inhibitors for initial treatment of HIV infection in antiretroviral‐naïveindividuals | |||||
| Patient or population: antiretroviral‐naïve individuals | |||||
| Outcomes | Anticipated absolute effects* (95% CI) | Relative effect | Number of participants | Quality of the evidence | |
| Risk with nevirapine all doses: adverse events | Risk with efavirenz 600 mg | ||||
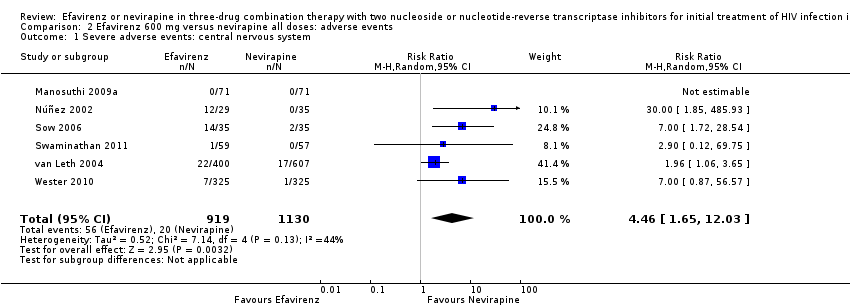
| Severe adverse events: central nervous system | 2 per 1000 | 7 per 1000 | RR 4.46 | 2049 | ⊕⊕⊕⊝ |
| Severe adverse events: gastrointestinal | 18 per 1000 | 14 per 1000 | RR 0.76 | 2049 | ⊕⊕⊝⊝ |
| Severe adverse events: pyrexia | 0 per 1000 | 0 per 1000 | RR 0.65 | 1799 | ⊕⊕⊝⊝ |
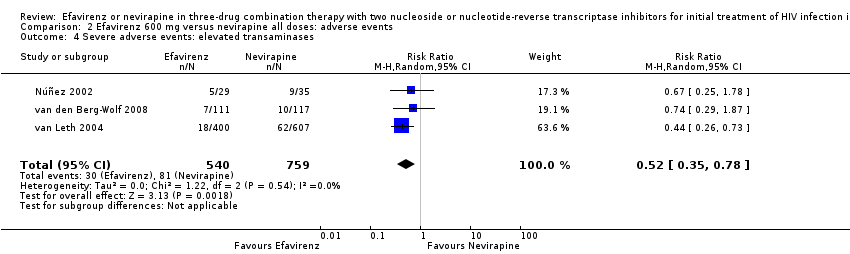
| Severe adverse events: raised transaminases | 257 per 1000 | 134 per 1000 | RR 0.52 | 1299 | ⊕⊕⊕⊕ |
| Severe adverse events: raised alkaline phosphatase | 12 per 1000 | 7 per 1000 | RR 0.65 | 1007 | ⊕⊕⊝⊝ |
| Severe adverse events: raised amylase | 14 per 1000 | 20 per 1000 | RR 1.40 | 1071 | ⊕⊕⊝⊝ |
| Severe adverse events: raised triglycerides | 7 per 1000 | 7 per 1000 | RR 1.10 | 1071 | ⊕⊕⊝⊝ |
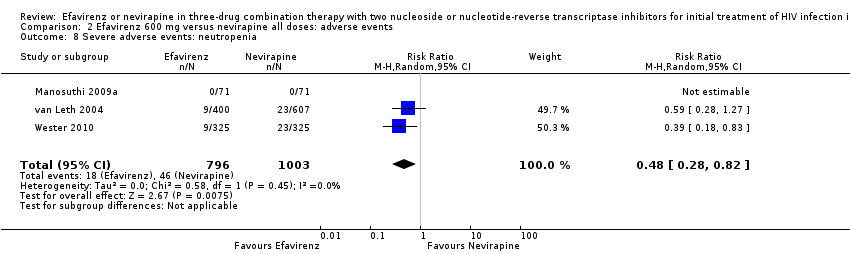
| Severe adverse events: neutropenia | 38 per 1000 | 18 per 1000 | RR 0.48 | 1799 | ⊕⊕⊕⊕ |
| Severe adverse events: rash | 229 per 1000 | 133 per 1000 | RR 0.58 | 2277 | ⊕⊕⊕⊝ |
| Severe adverse events: serum glutamic oxaloacetic transaminase (SGOT) | The mean severe adverse events: SGOT was 0 | MD 3.3 higher | — | 135 | ⊕⊕⊕⊝ |
| Severe adverse events: serum glutamic‐ pyruvic transaminase (SGPT) | The mean severe adverse events: SGPT was 0 | MD 5.7 higher | — | 135 | ⊕⊕⊕⊝ |
| Raised cholesterol | 29 per 1000 | 172 per 1000 | RR 6.03 | 64 | ⊕⊕⊕⊝ |
| *The risk in the intervention group (and its 95% CI) is based on the assumed risk in the comparison group and the relative effect of the intervention (and its 95% CI). | |||||
| GRADE Working Group grades of evidence | |||||
| 1Five trials (Manosuthi 2009a; Núñez 2002; Swaminathan 2011; van Leth 2004; Wester 2010) were open‐label. One trial did not report blinding (Sow 2006). We downgraded by 1 for this. | |||||
Background
Description of the condition
A total of 36.7 million people were living with HIV in 2015. This is an increase from previous years, mostly due to the use of antiretroviral therapy (ART) (UNAIDS 2016). In many countries, ART has reduced hospitalization, morbidity, and mortality among people living with HIV (Gilks 2006; Hogg 1997; Mocroft 1998).
Significant public and private resources have been devoted to rapidly scale up efforts in low‐ and middle‐income countries (LMICs) to provide access to first‐line ART. In 2014, only 40% of eligible people in LMICs were receiving ART. These efforts to scale‐up access to ART should be accompanied by initiatives to determine the most effective first‐line therapy (UNAIDS 2016), which can be used in diverse populations.
ART guidelines were first published by the World Health Organization (WHO) in 2002 (WHO 2002), and were updated in 2006, 2010, 2013, 2014, and 2015 (WHO 2015b). For countries with limited resources, the WHO recommends a public health approach to ART to improve access, simplify clinical decision making, standardize regimens, and standardize the monitoring and management of toxicity and drug interactions (Gilks 2006). For any initial regimen, the potency, durability of efficacy, ease of administration and storage, tolerability, and toxicity need to be balanced with cost and availability (Gilks 2006). These guidelines provide a framework for choice of medication in most countries. However, when the recommended drugs have different costs and toxicity profiles, head‐to head comparisons are necessary to determine which medication should be the choice of preference for clinicians. The more recent guidelines integrate more evidence and are in favour of an earlier start to ART (CD4 cell count of 500 cells/mm3 or less as opposed to the previous threshold of 350 cells/mm3) in active tuberculosis, hepatitis B co‐infection with severe liver disease, pregnant and breastfeeding women, children under five years of age, and sero‐discordant couples (WHO 2014).
Description of the intervention
The WHO Model List of Essential Medicines describes three classes of antiretroviral drugs for treatment and prevention of HIV infection: Nucleoside reverse transcriptase inhibitors (NRTI), non‐nucleoside reverse transcriptase inhibitors (NNRTI) and protease inhibitors (WHO 2015a). In 2006 the WHO recommended that initial ART should be with one of three regimens: two NRTIs plus efavirenz (EFV), two NRTIs plus nevirapine (NVP), or two NRTIs plus abacavir (ABC) (Gilks 2006; WHO 2006). ABC is not a NNRTI and didn't qualify for evaluation in this review. The NRTI combination drugs could either be zidovudine (AZT) plus lamivudine (3TC), or stavudine (d4T) plus 3TC. Stavudine is no longer recommended as a first‐line regimen, given its known metabolic toxicities and should be used only when no other drug can be offered (WHO 2015b). The current recommendations suggest that the preferred first‐line regimen be composed of tenofovir (TDF) and 3TC or emcitrabine (FTC) with EFV. TDF could be replaced with AZT and EFV with NVP in the event that drugs in the preferred regimen are unavailable or contraindicated (WHO 2015b). Protease inhibitors can also be used in special circumstances (WHO 2015b).
How the intervention might work
Protease inhibitors cost more, have higher pill burdens, and have dietary constraints associated with their use. Protease inhibitors are also linked to serious long‐term metabolic disorders, most notably an increased risk of lipodystrophy and hyperlipidaemia (Moyle 2000; BHIVA 2001). Moreover, a meta‐analysis of 12 trials revealed that NNRTI‐based regimens were better than protease inhibitor‐based regimens for virologic suppression (Chou 2006).
NNRTIs have a more favourable adverse effect profile than protease inhibitors, are cheaper, and are easier to administer. They are also more cost‐effective (Beck 2008). Their main disadvantage is that a single mutation may confer resistance to the entire class of NNRTIs, since cross‐resistance among agents of this class is nearly universal (Deeks 2001; Dybul 2002).
NVP may be responsible for severe or fatal hepatotoxicity, and a rash which may present in severe form as Stevens‐Johnson syndrome. Nevertheless, NVP is the NNRTI of choice for pregnant women because EFV may be teratogenic(DHHS 2001a). EFV may cause a rash and central nervous system symptoms such as dizziness, somnolence, insomnia, drowsiness, nightmares, hallucinations, and poor concentration (DHHS 2001b).
Why it is important to do this review
Providing evidence on the more appropriate choice of NNRTI with respect to efficacy, durability, and tolerability, is important to patients, caregivers, and policymakers worldwide. In the previous version of our review we found that EFV and NVP had similar efficacies, but different toxicity profiles (Mbuagbaw 2010).
The current review update represents a collaborative effort between the Cochrane Infectious Diseases Group, the University of California, San Francisco (UCSF), the School of Public Health of the University of Minnesota, the U.S. Centers for Disease Control and Prevention (CDC), the University of Cape Town, and the WHO to address questions through systematic reviews regarding the optimum first‐line ART regimen in patients living with HIV in low‐ and middle‐income countries. The previous review was used in the development of the 2009 WHO ART treatment guidelines (WHO 2009).
In the past five years, the body of evidence on NNRTI's has grown, especially among people co‐infected with tuberculosis. This Cochrane Review update responds to the need for evidence‐based recommendations for managing HIV and tuberculosis co‐morbidity.
Objectives
To determine which non‐nucleoside reverse transcriptase inhibitor, either EFV or NVP, is more effective in suppressing viral load when given in combination with two nucleoside reverse transcriptase inhibitors as part of initial antiretroviral therapy for HIV infection in adults and children.
Methods
Criteria for considering studies for this review
Types of studies
Randomized controlled trials (RCTs)
Types of participants
We included adults and children infected with HIV and without prior exposure to antiretroviral therapy (ART), and women who had received short courses of NNRTIs for the prevention of mother‐to‐child transmission. We excluded pregnant or lactating women and children under five years of age.
Relevant subpopulations of interest were participants with the following:
-
concurrent hepatitis B virus infection;
-
concurrent hepatitis C virus infection;
-
concurrent tuberculosis.
Types of interventions
We considered triple‐drug antiretroviral combination regimens for initial therapy containing two NRTIs plus either EFV or NVP at any dose (EFV + 2NRTIs versus NVP + 2NRTIs). The NRTIs in each combination did not need to be specified, but if they were specified, they must have been the same in both the EFV and NVP arms, such that the only difference in the regimens was the NNRTI. We included trials with additional trial arms, but we only evaluated the EFV‐containing and NVP‐containing trial arms in this review.
We compared EFV‐containing and NVP‐containing triple‐drug regimens with regard to therapeutic efficacy, using plasma HIV ribonucleic acid (RNA) concentration as a surrogate marker for clinical progression. Plasma HIV RNA has been demonstrated to be a reliable predictor of HIV disease progression (Lau 2007; Mellors 2007).
An earlier Cochrane review of stavudine (d4T), lamivudine (3TC) and NVP, Siegfried 2006, analysed studies that compared this regimen to any other available regimen used in the treatment of HIV/AIDS in treatment‐naïve or previously‐treated adults and adolescents. We included one trial in this review, van Leth 2004, which was also included in Siegfried 2006 as it compared this regimen to another that contained d4T, 3TC, and EFV in participants who had never received ART.
We planned to extract data from trials that included participants irrespective of their exposure to ART, but provided separate reporting and analysis of the ART‐naïve group. By so doing, we could analyse the data for participants of interest from papers that included both ART‐naïve and ART‐exposed populations.
Types of outcome measures
Primary outcomes
-
The percentage of participants achieving undetectable plasma HIV RNA concentration (viral load) over time (virological success). For this outcome we used the lower limit of HIV RNA detection, and the time frame reported by the trial authors.
-
Mortality.
-
Progression to AIDS (clinical). We assessed clinical progression by the proportion of participants that progressed either to the Centers for Disease Control and Prevention (CDC)‐defined AIDS (stage III to stage IV disease) or who developed a second opportunistic infection or malignancy.
-
All severe adverse events. We classified these according to grade 1 to 4 of the Adverse Event Toxicity Scale (NIAID/NIH 2004), and reported them as the proportion of participants that experienced grade 3 and 4 clinical or laboratory adverse events. Using this scale, grade 1 and 2 denote mild to moderate symptoms, grade 3 denotes serious symptoms, and grade 4 denotes life‐threatening events requiring significant clinical intervention.
-
Discontinuation rate. We defined this variable as the proportion of study participants who either stopped their treatment regimens totally or switched for any reason associated with the regimen.
Secondary outcomes
-
Change in mean CD4 cell count (immunological response).
-
Treatment failure. We defined this variable as the proportion of participants with incomplete viral load suppression or who experienced a virological rebound in the time frame reported by the trial authors.
-
Prevention of sexual transmission of HIV. We defined this as the risk of sexual partners not acquiring HIV from the study participant.
-
Development of ART drug resistance. We defined this as the acquisition of major genotypic resistance mutations as reported by the trial authors.
-
Individual adverse events
Search methods for identification of studies
We performed the literature searches with the assistance of the HIV/AIDS Review Group Information Specialist. We formulated a comprehensive and exhaustive search strategy in an attempt to identify all relevant studies, regardless of language or publication status (published, unpublished, in press, or in progress).
Electronic searches
Our initial search included the following electronic databases.
-
MEDLINE from 1996 to 12 August 2016 (Appendix 1).
-
Embase from 1996 to 12 August 2016 (Appendix 2).
-
The Cochrane Central Register of Controlled Trials (CENTRAL) from 1996 to 12 August 2016 (Appendix 3).
-
National Library of Medicine (NLM) Gateway from 1996 to 2009 (Appendix 4).
-
The World Health Organization (WHO) International Clinical Trials Registry Platform (ICTRP) and ClinicalTrials.gov for ongoing trials (inception to 12 August 2016).
-
LILACS (Latin American and Caribbean Health Sciences Literature) from 1996 to 12 August 2016.
-
Web of Science from 1996 to 12 August 2016.
The search strategy included text terms such as efavirenz, EFV, EFZ , Sustiva, Stocrin, nevirapine, NVP, Viramune, Nevimune, non‐nucleoside reverse transcriptase inhibitor, NNRTI, protease inhibitor‐sparing, non‐protease inhibitor‐ containing.
Searching other resources
We handsearched the reference lists of all pertinent reviews and studies found. We contacted research organizations and experts in the field for unpublished and ongoing studies. We conducted literature searches from 1996 to 2016 the years during which NNRTIs have been approved and been available on the market.
Limits
We performed the literature searches without limits to language or setting. The searches were limited to human studies published from 1996 (start of the triple‐drug combination ART era) to the present.
Inclusion criteria
-
RCTs
-
Trials evaluating first‐line ART regimens that compared EFV to NVP as part of a three‐drug treatment regimen.
-
Trials that provided sufficient regimen‐specific information (dosage, presentation, NRTI combination drugs) about first‐line drugs to compare regimens and outcomes of interest.
Exclusion criteria
-
Non‐RCTs.
-
Studies evaluating first‐line single or double antiretroviral regimens.
-
Studies evaluating first‐line ART with more than three antiretroviral drugs.
Data collection and analysis
Selection of studies
At least two review authors screened all identified citations from the literature search results by title/abstract to identify articles for inclusion in the review (LM, SM, JI, AS, NS). We retrieved the full‐text articles of citations that potentially met the inclusion criteria of the review. We assessed the articles for inclusion based on study design, types of participants, interventions, and outcome measures. We resolved any disagreements by discussion or by consulting a third review author. If we were unable to resolve disagreements because we required further information, we allocated the study to the list of studies awaiting classification. We listed all excluded studies and the reasons for exclusion in a 'Characteristics of excluded studies' table. In addition, we constructed a PRISMA flow diagram to illustrate the study selection process (Figure 1).

Flow diagram of study screening and selection
Data extraction and management
We designed and tested a data extraction form. Two review authors independently extracted data from each included trial using the data extraction form (AS, LM, SM). Both review authors verified the extracted data, which included methods, participant characteristics, interventions, and outcomes. Both review authors then compared the extracted data and resolved any discrepancies by discussion. In the event that the review authors disagreed on the abstraction of study details, we contacted a third review author to resolve the disagreement. We attempted to contact the principal investigators of the included trials in the case of any missing data or if we required clarification about the included trials.
Assessment of risk of bias in included studies
We assessed the risk of bias by the following criteria.
-
Sequence generation: how the allocation sequence was generated and whether it was adequate.
-
Allocation concealment: how the allocation sequence was concealed and whether it was adequate.
-
Blinding of participants, personnel, and outcome assessors.
-
The description of the completeness of outcome data for each main outcome.
-
Selective outcome reporting.
-
Other potential sources of bias (for example, funding).
-
Baseline data reported.
We rated studies as being at either high, low, or unclear risk of bias. At least two review authors independently completed the 'Risk of bias' tables (see Appendix 5).
Measures of treatment effect
We used Review Manager (RevMan) 5 for statistical analyses (RevMan 2014). We presented the results with 95% confidence intervals (CIs). We calculated the risk ratio (RR) and the odds ratio (OR) for binary data, the weighted mean difference (WMD) for continuous data measured on the same scale, and the standardized mean difference (SMD) for continuous data measured on different scales.
Unit of analysis issues
The unit of analysis was the individual participant.
Dealing with missing data
We analysed the data according to the intention‐to‐treat (ITT) principle, with participants analysed in the groups to which they were randomized. We did not make any assumptions regarding the outcomes of participants who were lost to follow‐up and we conducted complete case analyses. We also attempted to contact the trial authors for missing data.
Assessment of heterogeneity
We assessed statistical heterogeneity by inspecting the forest plots for overlap in the confidence intervals (CIs) and by applying the Chi2 test of homogeneity (P < 0.10 was the threshold for statistical significance) and the I2 statistic, with values of less than 50% denoting moderate heterogeneity.
Assessment of reporting biases
We used funnel plots to explore publication bias.
Data synthesis
We analysed the data using RevMan 5 (RevMan 2014). We used a random‐effect model to account for heterogeneity.
Subgroup analysis and investigation of heterogeneity
First we assessed the included trials for clinical heterogeneity. If we found that trials were similar enough to combine, we performed a meta‐analysis and assessed statistical heterogeneity. If there was significant unexplained statistical heterogeneity, we conducted a meta‐analysis using a random‐effects model.
If there was clinical heterogeneity and the data were available, we planned to explore this using the following subgroup analyses: age (children/adolescents/adults), sex (male/ female), baseline CD4 count, dosage, concurrent illness (hepatitis, tuberculosis) and study design. The efficacy of NVP may be associated with dosage (Veldkamp 2001).
For the purposes of this Cochrane Review, undetectable plasma HIV RNA (viral load) served as the primary endpoint. For the meta‐analyses, we defined an undetectable viral load as less than 500 copies/mL cut‐off, in order to include as many trials as possible.
Sensitivity analysis
We pooled the results from the included trials to determine the RR of achieving undetectable viral load. We planned to perform a sensitivity analysis to evaluate bias introduced by variability in study design, threshold of undetectable viral load, and specification of the two NRTIs. Finally, we conducted a test for homogeneity to ensure that the differences among the results of each trial could be expected by chance. We also performed a sensitivity analysis for studies with a high risk of bias.
When interventions and study populations were sufficiently similar across different studies, we pooled the outcomes and examined the differences between the two models using both fixed‐effect and random‐effects models. Since there were no significant differences between the two models, we presented the final results using a random‐effects model.
Quality of the evidence
We assessed the quality of the body of evidence using the GRADE approach (Guyatt 2008), which defines the quality of evidence for each outcome as the extent to which one can be confident that an estimate of effect or association is close to the quantity of specific interest (Higgins 2008). The quality rating across studies has four levels: high, moderate, low, or very low. RCTs are categorized as high quality but can be downgraded; similarly, other types of controlled trials and observational studies are categorized as low quality but can be upgraded. Factors that decrease the quality of evidence include limitations in design, indirectness of evidence, unexplained heterogeneity or inconsistency of results, imprecision of results, or high probability of publication bias. Factors that can increase the quality level of a body of evidence include having a large magnitude of effect, whether plausible confounding would reduce a demonstrated effect, and if there is a dose‐response gradient. We used GRADEpro Guideline Development Tool (GDT) to construct 'Summary of findings' tables (GRADEpro 2014).
Results
Description of studies
Results of the search
We conducted the literature searches up to 12 August 2016, which yielded an additional 1232 titles. Three review authors (LM, AS, and GR) independently screened the titles, abstracts, and descriptor terms of all downloaded material from the electronic searches to identify potentially relevant studies. We discarded reports that were irrelevant to this Cochrane Review, and we obtained the full‐text articles of all potentially relevant or uncertain reports. Three review authors (LM, AS and GR) independently assessed the full‐text articles. A fourth review author, NS, acted as arbiter where there was disagreement. The review authors LM, AS, GR, and JI independently extracted data from trials that met the inclusion criteria. Finally, where resolution was not possible because we required further information, we assigned the study to the list of those awaiting classification. We attempted to contact the trial authors for further clarification of data. We had previously identified seven randomized trials as meeting inclusion criteria. From the updated searches, we screened 1176 articles for eligibility after removal of duplicates. Agreement on screening for full text appraisal in this update was moderate (Ƙ 0.52; 95% CI 0.26 to 0.76; P < 0.001). We selected 16 full‐text articles for detailed appraisal, of which we identified six new studies. Agreement on inclusion/exclusion in this update was very good (Ƙ 0.86; 85% CI 0.59 to 1.00; P < 0.001) One of these was the full text publication of a study previously included as an abstract (Swaminathan 2011), so only five trials were newly published studies, giving a total of 12 studies. We have presented a PRISMA diagram, which illustrates the study selection process, in Figure 1.
Included studies
Twelve trials met the inclusion criteria of this Cochrane Review. We included seven RCTs in Mbuagbaw 2010, the previous version of this review (Ayala Gaytán 2004; Manosuthi 2009a; Núñez 2002; Sow 2006; Swaminathan 2011; van den Berg‐Wolf 2008; van Leth 2004). In this review update five articles that reported on five trials met the inclusion criteria (Bonnet 2013a; Landman 2014; Mateelli 2013; Sinha 2013; Wester 2010). The findings reported here are from published papers.
See the 'Characteristics of included studies' table.
Locations
One trial was a multinational trial that included 17 countries (van Leth 2004). Five trials were conducted in Africa: one in Botswana (Wester 2010), one in Mozambique (Bonnet 2013a), one in Burkina Faso (Mateelli 2013), one in Senegal (Sow 2006), and one in both Senegal and Cameroon (Landman 2014). There were two trials from India (Sinha 2013; Swaminathan 2011) and one trial each: from Mexico (Bonnet 2013a), Spain (Núñez 2002), Thailand (Manosuthi 2009a), and the USA (van den Berg‐Wolf 2008).
Interventions
All included trials used EFV 600 mg and compared it to either NVP 400 mg once daily (Núñez 2002; Swaminathan 2011; van Leth 2004), or NVP 200 mg twice daily (Ayala Gaytán 2004; Bonnet 2013a; Landman 2014; Manosuthi 2009a; Mateelli 2013; Sinha 2013; Sow 2006; van den Berg‐Wolf 2008; van Leth 2004; Wester 2010). The 2NN trial, van Leth 2004, had trial arms that used NVP 400 mg once daily and NVP 200 mg twice daily.
Outcomes
Ten trials reported virological success (Ayala Gaytán 2004; Bonnet 2013a; Landman 2014; Manosuthi 2009a; Mateelli 2013; Núñez 2002; Sinha 2013; Swaminathan 2011; van den Berg‐Wolf 2008; van Leth 2004). Eight trials reported mortality (Ayala Gaytán 2004; Bonnet 2013a; Landman 2014; Manosuthi 2009a; Sinha 2013; Swaminathan 2011; van den Berg‐Wolf 2008; van Leth 2004). Five trials reported progression to AIDS (Ayala Gaytán 2004; Bonnet 2013a; Manosuthi 2009a; van den Berg‐Wolf 2008; van Leth 2004). Eight trials reported adverse events (Ayala Gaytán 2004; Bonnet 2013a; Manosuthi 2009a; Núñez 2002; Sinha 2013; Swaminathan 2011; van den Berg‐Wolf 2008; van Leth 2004). Nine trials reported a discontinuation rate (Ayala Gaytán 2004; Bonnet 2013a; Landman 2014; Manosuthi 2009a; Núñez 2002; Sinha 2013; Swaminathan 2011; van den Berg‐Wolf 2008; van Leth 2004). Nine trials reported change in CD4 count (Ayala Gaytán 2004; Bonnet 2013a; Manosuthi 2009a; Mateelli 2013; Núñez 2002; Sow 2006; Swaminathan 2011; van den Berg‐Wolf 2008; van Leth 2004). Five trials reported treatment failure (Landman 2014; Núñez 2002; Sinha 2013; Swaminathan 2011; van Leth 2004), and four reported development of drug resistance (Bonnet 2013a; Landman 2014; van den Berg‐Wolf 2008; Wester 2010). None of the included trials reported on sexual transmission of HIV.
Co‐morbidities
In five included trials, the participants were concurrently receiving treatment for tuberculosis (Bonnet 2013a; Manosuthi 2009a; Mateelli 2013; Sinha 2013; Swaminathan 2011). Only one trial reported baseline co‐infection with hepatitis B and C virus (van Leth 2004).
Length of follow‐up
The shortest length of follow‐up was 24 weeks (Swaminathan 2011), and the longest was 156 weeks (Wester 2010). Five trials ran for 48 weeks (Ayala Gaytán 2004; Bonnet 2013a; Manosuthi 2009a; Mateelli 2013; van Leth 2004), two trials for 96 weeks (Landman 2014; Sinha 2013), one for 36 weeks (Sinha 2013), and one for 72 weeks (Sow 2006).
We have provided further details on the included studies in an additional table (Table 1).
| Trial ID | Location | NVP dosage | NRTI combination drugs | Co‐infection with tuberculosis | Virological success cut‐off point |
| Mexico | 200 mg twice daily | AZT 300 mg and 3TC 150 mg | No | < 400 copies/mL | |
| Mozambique | 200 mg twice daily | 3TC and d4T/AZT1 | No | < 50 copies/mL | |
| Cameroon and Senegal | 200 mg twice daily | TDF 300 mg and FTC 200 mg | No | < 50 copies/mL | |
| Thailand | 400 mg once daily | 3TC 150 mg and D4T 30 or 40 mg | Yes | < 50 copies/mL | |
| Burkina Faso | 200 mg twice daily | D4T and 3TC1 | Yes | Not reported | |
| Spain | 400 mg once daily | D4T 40 mg and DDI 400 mg | No | < 50 copies/mL | |
| India | 200 mg twice daily | AZT, d4T, 3TC1 | Yes | < 400 copies/mL | |
| Senegal | 200 mg twice daily | AZT 300 mg and 3TC 150 mg | No | Not reported | |
| India | 400 mg once daily | DDI 250 mg or 400 mg and 3TC 300 mg | Yes | Not reported | |
| USA | 200 mg twice daily | ABC/3TC, DDI/d4T, AZT/3TC, d4T/3TC1 | No | < 50 copies/mL | |
| North/South America, Australia, Europe, South Africa, and Thailand | 200 mg twice daily and 400 mg twice daily | D4T 40 mg and 3TC 150 mg | No | < 50 copies/mL | |
| Botswana | Not reported | AZT or d4T/3TC or DDI1 | No | Not reported |
1Dosage not specified.
Abbreviations: NRTI: Nucleoside Reverse Transcriptase Inhibitor; ART: antiretroviral therapy; AZT: zidovudine; d4T: stavudine; 3TC: lamivudine; NVP: nevirapine; DDI: didanosine; ABC: abacavir; FTC: Emtricitabine; TDF: Tenofovir.
Excluded studies
We have provided our reasons for excluding 26 potentially relevant studies in the 'Characteristics of excluded studies' table. In this update, 11/26 studies were excluded: 5 did not have the comparison of interest (Antela 2004; He 2011; Musiime 2012; PENPACT 2011; Prendergast 2011), 4 were sub‐studies of already included studies (Bonnet 2013b; Mankhatitham 2011; Mankhatitham 2012; Padmapriyadarsini 2013), 1 was not an RCT(Puthanakit 2009b) and another was a duplicate (Swaminathan 2009).
Risk of bias in included studies
We assessed the risk of bias in each included study using the Cochrane 'Risk of bias' assessment tool (Appendix 5). We assessed the risk of bias in individual trials across six domains: sequence generation, allocation concealment, blinding, incomplete outcome data, selective outcome reporting, and other potential biases. See the 'Risk of bias' summary (Figure 2) and 'Risk of bias' graph (Figure 3).
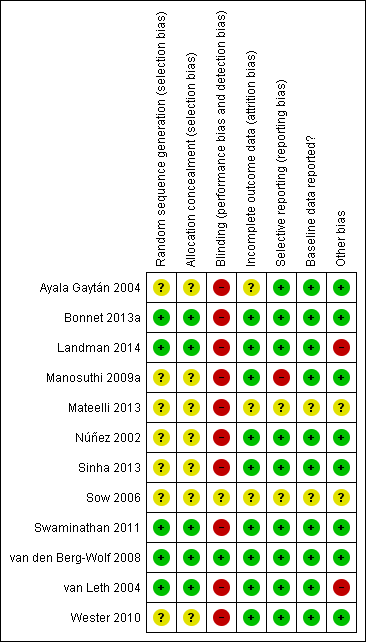
'Risk of bias' summary: review authors' judgements about each 'Risk of bias' item for each included trial.

'Risk of bias' graph: review authors' judgements about each 'Risk of bias' item presented as percentages across all included studies.
Allocation
Generation of allocation sequence
Only five trials reported how the allocation sequence was generated. (Bonnet 2013a; Landman 2014; Swaminathan 2011; van den Berg‐Wolf 2008; van Leth 2004). The other included trials did not report how they generated the allocation sequence (Ayala Gaytán 2004; Sinha 2013; Manosuthi 2009a; Mateelli 2013; Núñez 2002; Sow 2006; Wester 2010).
Allocation concealment
Only five trials reported that allocation was concealed (Bonnet 2013a; Landman 2014; Swaminathan 2011; van den Berg‐Wolf 2008; van Leth 2004). In seven trials, allocation concealment was unclear (Ayala Gaytán 2004; Manosuthi 2009a; Mateelli 2013; Núñez 2002; Sinha 2013; Sow 2006; Wester 2010).
Blinding
Ten trials were reported as open‐label studies and we judged them to be at high risk of bias (Ayala Gaytán 2004; Bonnet 2013a; Landman 2014; Mateelli 2013; Núñez 2002; Sinha 2013; Swaminathan 2011; van Leth 2004; Wester 2010; Manosuthi 2009a). Only one was blinded (van den Berg‐Wolf 2008). Sow 2006 did not report blinding and therefore we considered it to be at unclear risk of bias.
Incomplete outcome data
We judged three trials as having unclear risk of attrition bias (Ayala Gaytán 2004; Mateelli 2013; Sow 2006). The other nine included trials were at low risk of bias.
Selective reporting
One trial did not report all outcomes (Manosuthi 2009a). Two studies did not provide sufficient information to enable us to make a judgement (Mateelli 2013; Sow 2006).
Reporting of baseline data
Two trials, Sow (Sow 2006) and Mateelli (Mateelli 2013,) did not report baseline data, and we considered them as being at unclear risk of bias.
Other potential sources of bias
Funding
Eight trials received funding from governmental sources (Ayala Gaytán 2004; Bonnet 2013a; Manosuthi 2009a; Núñez 2002; Sinha 2013; Swaminathan 2011; van den Berg‐Wolf 2008; Wester 2010) and were judged as low risk of bias. The 2NN study, van Leth 2004, was funded by Boehringer‐Ingelheim. Landman 2014 also received funding from Gilead Sciences, Merck, Sharp & Dome, and Abbott Laboratories. We judged them as high risk of bias. Mateelli 2013 and Sow 2006 did not report any source of funding. We judged them as unclear risk of bias.
Publication bias
We designed our search strategy to detect both published and unpublished studies. We appraised publication bias for our primary outcome of virologic suppression using a funnel plot and found no evidence of publication bias (Egger 1997). See Figure 4.
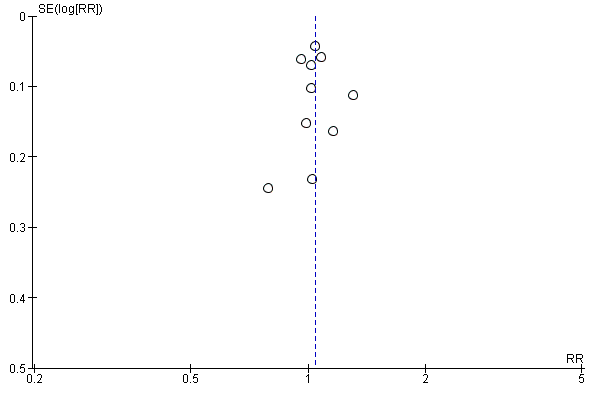
Funnel plot of comparison: 1 Efavirenz 600 mg versus Nevirapine all doses, outcome: 1.1 Virological success.
Effects of interventions
See: Summary of findings for the main comparison 'Summary of findings' table 1; Summary of findings 2 'Summary of findings' table 2
All included trials compared EFV 600 mg once daily to NVP 200 mg twice daily or 400 mg once daily.
We performed a primary meta‐analysis to compare EFV 600 mg versus all dosages of NVP. We then conducted subgroup analyses to investigate the effect of NVP dosage (200 mg twice daily versus 400 mg once daily) and concurrent treatment for tuberculosis.
Efavirenz 600 mg versus nevirapine at any dosage
These results are summarized in 'Summary of findings' table 1 (summary of findings Table for the main comparison).
Virological success
Virological success was comparable in both treatment groups (risk ratio (RR) 1.04, 95% confidence interval (CI) 0.99 to 1.09; 10 trials, 2438 participants; P = 0.11; Analysis 1.1).
Mortality
There were no differences in mortality between the EFV‐ and NVP‐containing regimens (RR 0.84, 95% CI 0.59 to 1.19; 8 trials, 2317 participants; P = 0.32; Analysis 1.2).
Progression to AIDS
In both EFV‐ and NVP‐containing regimens progression to AIDS was comparable (RR 1.23, 95% CI 0.72 to 2.11; 5 trials, 2005 participants; P = 0.46). Statistical heterogeneity was moderate (I2 statistic = 33%, P = 0.22; Analysis 1.3).
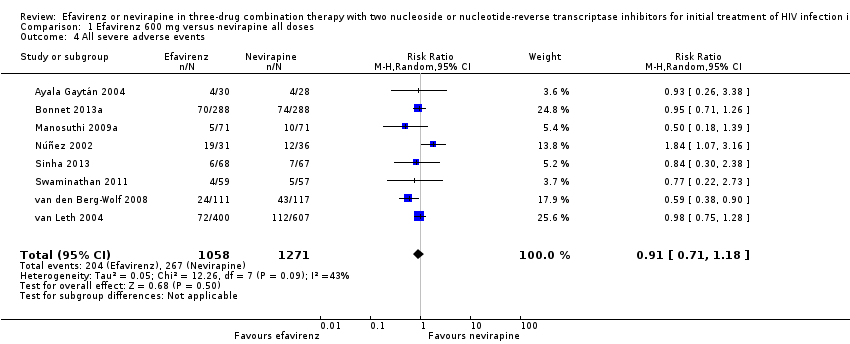
All severe adverse events
Severe adverse events were comparable in both treatment groups (RR 0.91, 95% CI 0.71 to 1.18; 8 trials, 2329 participants; P = 0.48). Statistical heterogeneity was moderate (I2 statistic = 43%, P = 0.11; Analysis 1.4).
Discontinuation rate
There was no difference in discontinuation rate between treatment groups (RR 0.93, 95% CI 0.69 to 1.25; 9 trials, 2384 participants; P = 0.62). Statistical heterogeneity was moderate (I2statistic = 35%, P = 0.14; Analysis 1.5).
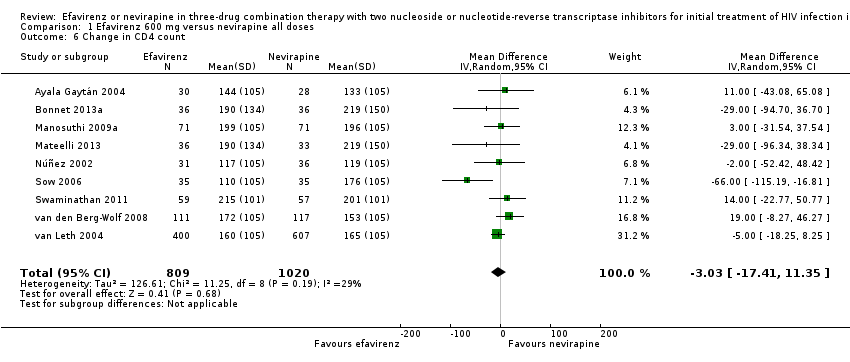
Change in CD4 count/immunological response
Change in CD4 count was comparable in both EFV‐ and NVP‐containing regimens (MD −3.03; 95% CI −17.41 to 11.35; 9 trials, 1829 participants; P = 0.68). Statistical heterogeneity was moderate (I2 statistic = 29%, P = 0.19; Analysis 1.6).
Treatment failure
Treatment failure was comparable in both treatment groups (RR 0.97, 95% CI 0.76 to 1.24; 5 trials, 737 participants; P = 0.82; Analysis 1.7).
Sexual transmission of HIV
None of the included studies reported on this outcome.
Development of drug resistance
Four studies (988 participants) reported this outcome. Development of drug resistance was lower in the EFV arm (RR 0.76, 95% CI 0.60 to 0.95; 4 trials, 988 participants; P = 0.02; Analysis 1.8).
Individual adverse events
Individual comparisons for each of the adverse events: gastrointestinal (Analysis 2.2), pyrexia (Analysis 2.3), raised alkaline phosphatases (Analysis 2.5), elevated amylase (Analysis 2.6), elevated triglycerides (Analysis 2.7), elevated SGOT (Analysis 2.10), elevated SGPT (Analysis 2.11) and elevated cholesterol (Analysis 2.12) did not reveal any differences. Central nervous system adverse events were higher in the EFV arm (RR 4.46, 95% CI 1.65 to 12.03; 6 trials, 2049 participants; P = 0.003). Statistical heterogeneity was moderate (I2 statistic = 44%, P = 0.13; Analysis 2.1). Participants in the EFV arm were less likely to have raised transaminases than those in the NVP arm (RR 0.52, 95% CI 0.35 to 0.78; 3 trials, 1799 participants; P = 0.001; Analysis 2.4). Participants in the EFV arm were less likely to have neutropenia (RR 0.48, 95% CI 0.28 to 0.82; 3 trials, 1799 participants; P = 0.007; Analysis 2.8). Participants in the EFV arms were also less likely to have a rash (RR 0.58, 95% CI 0.34 to 1.00; 7 trials, 2277 participants; P = 0.05; Analysis 2.9). We have summarized the findings for the individual adverse events in 'Summary of findings' table 2 (summary of findings Table 2).
Subgroup analyses
Hepatitis co‐morbidity
There were insufficient data to explore this subgroup.
Concurrent treatment for tuberculosis
There were no significant subgroup effects for tuberculosis treatment: virological success (Analysis 3.1), mortality (Analysis 3.2), progression to AIDS (Analysis 3.3), discontinuation rate (Analysis 3.4).
Dosage
We found that mortality was lower in the EFV arm than in the NVP 400 mg subgroup (RR 0.34, 95% CI 0.13 to 0.90; P = 0.03; Analysis 4.2). One study did not report the dosage of NVP used (Wester 2010), and we excluded it from this analysis. Virological success (Analysis 4.1), progression to AIDS (Analysis 4.3) and discontinuation rate (Analysis 4.4) were similar for both dosages.
Discussion
Summary of main results
Twelve randomized controlled trials (RCTs) that included 3278 participants met the inclusion criteria of this Cochrane Review.
There was little or no difference between EFV and NVP in virological success (high quality evidence), probably little or no difference in mortality (moderate quality evidence) and progression to AIDS (moderate quality evidence). We are uncertain whether there is a difference in all severe adverse events (very low quality evidence). There is probably little or no difference in discontinuation rate (moderate quality evidence) and change in CD4 count (moderate quality evidence). There may be little or no difference in treatment failure (low quality evidence). Development of drug resistance is probably slightly less in the EFV arms (moderate quality evidence). No studies were found that looked at sexual transmission of HIV.
When we examined the adverse events individually, EFV probably increased impaired mental function (moderate quality evidence) but reduced elevated transaminases (high quality evidence), reduced cases of neutropenia (high quality evidence), and probably reduced cases of rash (moderate quality evidence). We found that there may be little or no difference in gastrointestinal adverse events (low quality evidence), pyrexia (low quality evidence), raised alkaline phosphatase (low quality evidence), raised amylase (low quality evidence) and raised triglycerides (low quality evidence). There was probably little or no difference in serum glutamic oxaloacetic transaminase (moderate quality evidence), serum glutamic‐ pyruvic transaminase (moderate quality evidence) and raised cholesterol (moderate quality evidence). NVP slightly increases mortality when given once daily (high quality evidence). There were little or no differences in the primary outcomes for patients who were concurrently receiving treatment for tuberculosis.
This literature is dominated by the landmark 2NN study, van Leth 2004, which found no difference between EFV and NVP in a non‐inferiority randomized open‐label, industry‐funded, four‐arm trial. Overall van Leth 2004 accounted for 1007 (31%) of the 3278 participants randomized.
We did not conduct subgroup analyses by NRTI combination drugs even though of the nine trials that had a NVP 200 mg twice daily arm (Ayala Gaytán 2004; Bonnet 2013a; Landman 2014; Manosuthi 2009a; Mateelli 2013; Sinha 2013; Sow 2006; van den Berg‐Wolf 2008; van Leth 2004); five used a 3TC/AZT (Ayala Gaytán 2004; Manosuthi 2009a; Sow 2006; van den Berg‐Wolf 2008; van Leth 2004), one trial used the 3TC/d4Tand switched to the 3TC/AZT backbone in the last year (Bonnet 2013a), and three trials (Sinha 2013; van den Berg‐Wolf 2008; Wester 2010) used at least two NRTI combinations including 3TC/AZT, 3TC/ABC, 3TC/d4T, or ddI/d4T. Moreover, all of the trials using NVP 400 mg once daily had different NRTI combination drugs. None of the included trials reported the outcome of sexual transmission of HIV. The length of follow‐up time, cut‐off point for undetectable viral load, dosage of NVP, and study settings varied greatly. We did not find any statistically significant heterogeneity for any of the key outcomes, and the I2 statistic value ranged from 0% to 40%.
Overall completeness and applicability of evidence
We identified literature that met the inclusion criteria of this Cochrane Review that clearly highlights the clinical equivalence of EFV and NVP based on RCTs.
This update includes studies from a wide variety of settings including a large multicentre trial with participants from the USA, Europe, Australia, Thailand, and South Africa (van Leth 2004), but also trials with participants from Mexico (Ayala Gaytán 2004), Senegal (Landman 2014; Sow 2006), Cameroon (Landman 2014), Thailand (Manosuthi 2009a), Spain (Núñez 2002), India (Sinha 2013; Swaminathan 2011), USA (van den Berg‐Wolf 2008), Mozambique (Bonnet 2013a) and Botswana (Mateelli 2013). These diverse populations support the applicability and generalizability of our findings.
Given optimal adherence, EFV, NVP 200 mg, and NVP 400 mg once daily may result in comparable virological suppression. However, there is a increased risk of mortality in the patients receiving the once‐daily NVP regimen. There is insufficient evidence to recommend the use of once daily NVP in regular clinical practice (Cooper 2007), and our findings do not support its use.
Quality of the evidence
This body of evidence includes twelve RCTs (3278 participants). The main methodological limitation in the included studies was the lack of blinding. Only one study was blinded (van den Berg‐Wolf 2008). In most instances, this did not affect our rating of the quality of evidence for outcomes unlikely to be affected by a lack of blinding such as virological success, mortality and progression to AIDS. In two studies reported as abstracts, risk of bias was unclear in almost all the domains (Mateelli 2013; Sow 2006). The cut‐off point used to define virological success also differed across studies, but this was related to the quality of the equipment available and did not seem to introduce any heterogeneity in measures of virological success. We did not downgraded for this. We downgraded when adverse events were graded using different scales, the definition of treatment failure varied across studies, industry funded studies contributed most of the data for certain outcomes and confidence intervals were too wide. Overall the quality of the evidence ranged from high to very low.
Potential biases in the review process
We minimized biases in the review process by not limiting the literature search by language, by performing a comprehensive search of databases and conference proceedings, and by contacting experts in the field for unpublished and ongoing studies. However, we were unable to fully appraise the trials published only as abstracts and is it unclear what methodological or data items were not captured in this review. We used a funnel plot and found no evidence of publication bias.
Agreements and disagreements with other studies or reviews
A systematic review that compared EFV to NVP in patients co‐infected with TB found superior virologic suppression in the EFV arm at the 400 copies/mL cut‐off point (but not at the 50 copies/mL cut‐off point). Mortality was comparable, but more participants in the NVP arm discontinued treatment (Jiang 2014). We found comparable effective of EFV and NVP (using all cut‐off points), comparable mortality and no differences in our subgroup analysis of participants on treatment for TB. Another systematic review found EFV to be less likely to lead to virological failure and more likely to induce virological success (Pillay 2013). A systematic review of adverse events found EFV to be less likely to be associated with hepatic and cutaneous adverse events, but more likely to be associated with central nervous system adverse events (Shubber 2013). The main difference between these systematic reviews and ours is their use of non‐randomized studies which may lead to differences in estimates. More so, the apparent poorer performance of NVP might also be induced by the once daily 400 mg regimen, which we found to be inferior to EFV with regard to mortality.

Flow diagram of study screening and selection

'Risk of bias' summary: review authors' judgements about each 'Risk of bias' item for each included trial.

'Risk of bias' graph: review authors' judgements about each 'Risk of bias' item presented as percentages across all included studies.

Funnel plot of comparison: 1 Efavirenz 600 mg versus Nevirapine all doses, outcome: 1.1 Virological success.

Comparison 1 Efavirenz 600 mg versus nevirapine all doses, Outcome 1 Virological success.

Comparison 1 Efavirenz 600 mg versus nevirapine all doses, Outcome 2 Mortality.

Comparison 1 Efavirenz 600 mg versus nevirapine all doses, Outcome 3 Progression to AIDS.
Comparison 1 Efavirenz 600 mg versus nevirapine all doses, Outcome 4 All severe adverse events.

Comparison 1 Efavirenz 600 mg versus nevirapine all doses, Outcome 5 Discontinuation rate.
Comparison 1 Efavirenz 600 mg versus nevirapine all doses, Outcome 6 Change in CD4 count.
Comparison 1 Efavirenz 600 mg versus nevirapine all doses, Outcome 7 Treatment failure.

Comparison 1 Efavirenz 600 mg versus nevirapine all doses, Outcome 8 Development of drug resistance.
Comparison 2 Efavirenz 600 mg versus nevirapine all doses: adverse events, Outcome 1 Severe adverse events: central nervous system.

Comparison 2 Efavirenz 600 mg versus nevirapine all doses: adverse events, Outcome 2 Severe adverse events: gastrointestinal tract.

Comparison 2 Efavirenz 600 mg versus nevirapine all doses: adverse events, Outcome 3 Severe adverse events: pyrexia.
Comparison 2 Efavirenz 600 mg versus nevirapine all doses: adverse events, Outcome 4 Severe adverse events: elevated transaminases.

Comparison 2 Efavirenz 600 mg versus nevirapine all doses: adverse events, Outcome 5 Severe adverse events: elevated alkaline phosphatase.

Comparison 2 Efavirenz 600 mg versus nevirapine all doses: adverse events, Outcome 6 Severe adverse events: elevated amylase.

Comparison 2 Efavirenz 600 mg versus nevirapine all doses: adverse events, Outcome 7 Severe adverse events: elevated triglycerides.
Comparison 2 Efavirenz 600 mg versus nevirapine all doses: adverse events, Outcome 8 Severe adverse events: neutropenia.

Comparison 2 Efavirenz 600 mg versus nevirapine all doses: adverse events, Outcome 9 Severe adverse events: rash.

Comparison 2 Efavirenz 600 mg versus nevirapine all doses: adverse events, Outcome 10 Severe adverse events: elevated SGOT.

Comparison 2 Efavirenz 600 mg versus nevirapine all doses: adverse events, Outcome 11 Severe adverse events: elevated SGPT.

Comparison 2 Efavirenz 600 mg versus nevirapine all doses: adverse events, Outcome 12 Severe adverse events: elevated cholesterol.
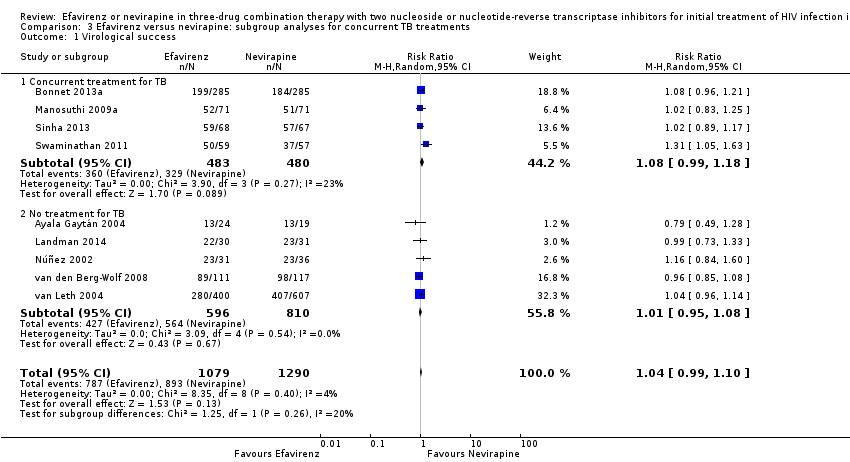
Comparison 3 Efavirenz versus nevirapine: subgroup analyses for concurrent TB treatments, Outcome 1 Virological success.

Comparison 3 Efavirenz versus nevirapine: subgroup analyses for concurrent TB treatments, Outcome 2 Mortality.
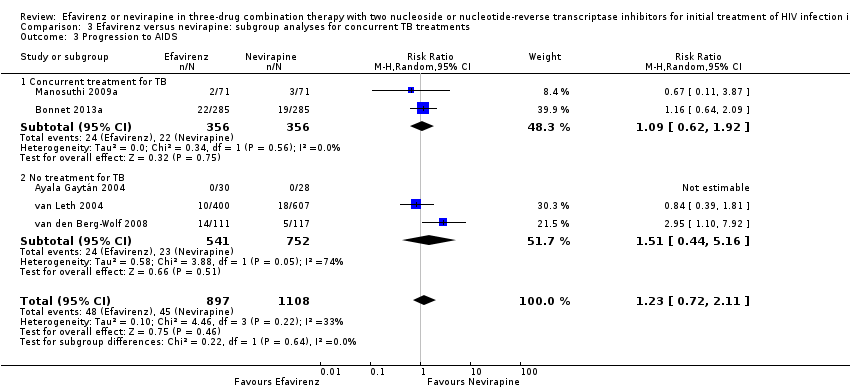
Comparison 3 Efavirenz versus nevirapine: subgroup analyses for concurrent TB treatments, Outcome 3 Progression to AIDS.
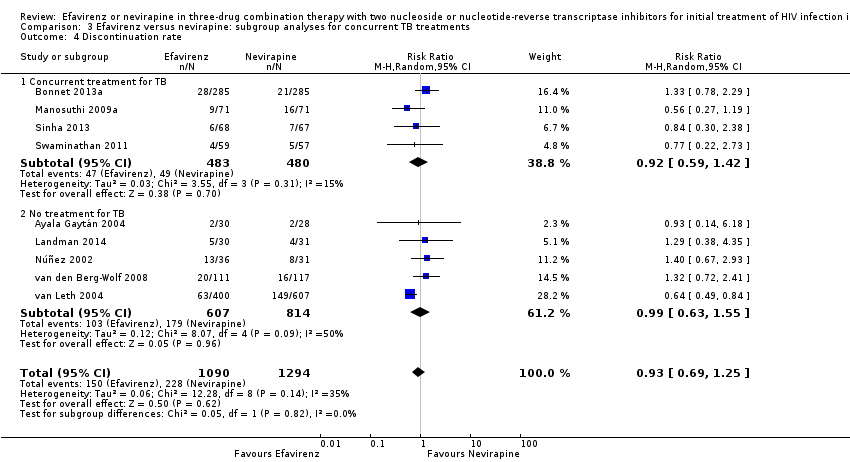
Comparison 3 Efavirenz versus nevirapine: subgroup analyses for concurrent TB treatments, Outcome 4 Discontinuation rate.

Comparison 4 Efavirenz 600 mg versus nevirapine: subgroup analyses for dosage, Outcome 1 Virological success.
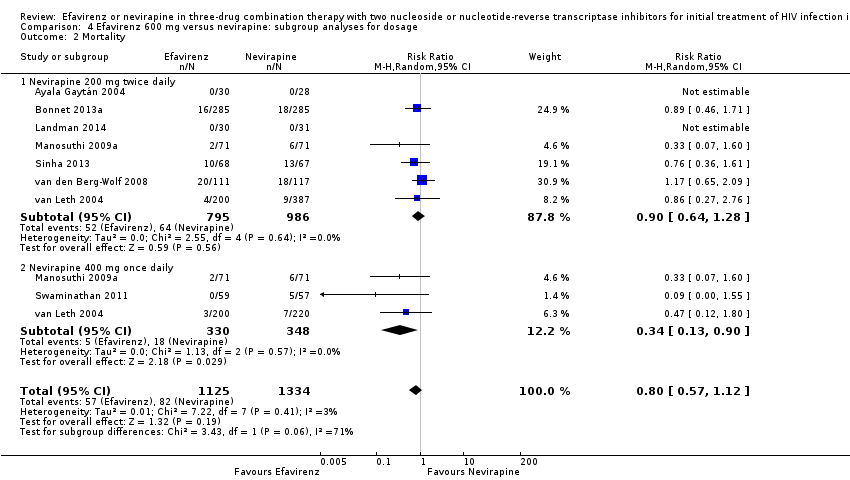
Comparison 4 Efavirenz 600 mg versus nevirapine: subgroup analyses for dosage, Outcome 2 Mortality.
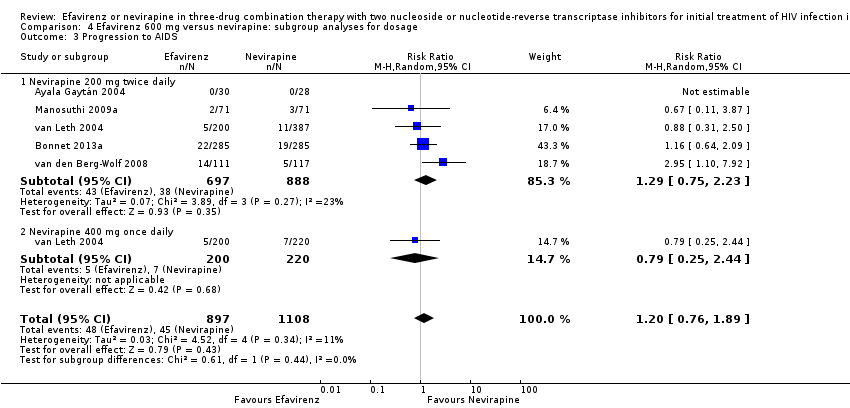
Comparison 4 Efavirenz 600 mg versus nevirapine: subgroup analyses for dosage, Outcome 3 Progression to AIDS.

Comparison 4 Efavirenz 600 mg versus nevirapine: subgroup analyses for dosage, Outcome 4 Discontinuation rate.
| Efavirenz (600 mg) versus nevirapine (all doses) for three‐drug combination therapy with two nucleoside‐reverse transcriptase inhibitors for initial treatment of HIV infection in antiretroviral‐naïveindividuals | |||||
| Patient or population: antiretroviral‐naïve individuals | |||||
| Outcomes | Anticipated absolute effects* (95% CI) | Relative effect | Number of participants | Quality of the evidence | |
| Risk with nevirapine all doses | Risk with efavirenz 600 mg | ||||
| Virological success | 688 per 1000 | 715 per 1000 | RR 1.04 | 2438 | ⊕⊕⊕⊕ |
| Mortality | 64 per 1000 | 54 per 1000 | RR 0.84 | 2317 | ⊕⊕⊕⊝ |
| Progression to AIDS | 41 per 1000 | 50 per 1000 | RR 1.23 | 2005 | ⊕⊕⊕⊝ |
| All severe adverse events | 192 per 1000 | 216 per 1000 | RR 0.91 | 2329 | ⊕⊝⊝⊝ |
| Discontinuation rate | 176 per 1000 | 164 per 1000 | RR 0.93 | 2384 | ⊕⊕⊕⊝ |
| Change in CD4 count | The mean change in CD4 count was 0 | MD 3.03 lower | — | 1829 | ⊕⊕⊕⊝ |
| Treatment failure | 249 per 1000 | 242 per 1000 | RR 0.97 | 737 | ⊕⊕⊝⊝ |
| *The risk in the intervention group (and its 95% CI) is based on the assumed risk in the comparison group and the relative effect of the intervention (and its 95% CI). | |||||
| GRADE Working Group grades of evidence | |||||
| 1Three trials used a cut‐off point of 400 copies/mL (Ayala Gaytán 2004; Swaminathan 2011; Sinha 2013), but we did not downgrade for this. | |||||
| Efavirenz (600 mg) versus nevirapine (all doses): adverse events for three‐drug combination therapy with two nucleoside‐reverse transcriptase inhibitors for initial treatment of HIV infection in antiretroviral‐naïveindividuals | |||||
| Patient or population: antiretroviral‐naïve individuals | |||||
| Outcomes | Anticipated absolute effects* (95% CI) | Relative effect | Number of participants | Quality of the evidence | |
| Risk with nevirapine all doses: adverse events | Risk with efavirenz 600 mg | ||||
| Severe adverse events: central nervous system | 2 per 1000 | 7 per 1000 | RR 4.46 | 2049 | ⊕⊕⊕⊝ |
| Severe adverse events: gastrointestinal | 18 per 1000 | 14 per 1000 | RR 0.76 | 2049 | ⊕⊕⊝⊝ |
| Severe adverse events: pyrexia | 0 per 1000 | 0 per 1000 | RR 0.65 | 1799 | ⊕⊕⊝⊝ |
| Severe adverse events: raised transaminases | 257 per 1000 | 134 per 1000 | RR 0.52 | 1299 | ⊕⊕⊕⊕ |
| Severe adverse events: raised alkaline phosphatase | 12 per 1000 | 7 per 1000 | RR 0.65 | 1007 | ⊕⊕⊝⊝ |
| Severe adverse events: raised amylase | 14 per 1000 | 20 per 1000 | RR 1.40 | 1071 | ⊕⊕⊝⊝ |
| Severe adverse events: raised triglycerides | 7 per 1000 | 7 per 1000 | RR 1.10 | 1071 | ⊕⊕⊝⊝ |
| Severe adverse events: neutropenia | 38 per 1000 | 18 per 1000 | RR 0.48 | 1799 | ⊕⊕⊕⊕ |
| Severe adverse events: rash | 229 per 1000 | 133 per 1000 | RR 0.58 | 2277 | ⊕⊕⊕⊝ |
| Severe adverse events: serum glutamic oxaloacetic transaminase (SGOT) | The mean severe adverse events: SGOT was 0 | MD 3.3 higher | — | 135 | ⊕⊕⊕⊝ |
| Severe adverse events: serum glutamic‐ pyruvic transaminase (SGPT) | The mean severe adverse events: SGPT was 0 | MD 5.7 higher | — | 135 | ⊕⊕⊕⊝ |
| Raised cholesterol | 29 per 1000 | 172 per 1000 | RR 6.03 | 64 | ⊕⊕⊕⊝ |
| *The risk in the intervention group (and its 95% CI) is based on the assumed risk in the comparison group and the relative effect of the intervention (and its 95% CI). | |||||
| GRADE Working Group grades of evidence | |||||
| 1Five trials (Manosuthi 2009a; Núñez 2002; Swaminathan 2011; van Leth 2004; Wester 2010) were open‐label. One trial did not report blinding (Sow 2006). We downgraded by 1 for this. | |||||
| Trial ID | Location | NVP dosage | NRTI combination drugs | Co‐infection with tuberculosis | Virological success cut‐off point |
| Mexico | 200 mg twice daily | AZT 300 mg and 3TC 150 mg | No | < 400 copies/mL | |
| Mozambique | 200 mg twice daily | 3TC and d4T/AZT1 | No | < 50 copies/mL | |
| Cameroon and Senegal | 200 mg twice daily | TDF 300 mg and FTC 200 mg | No | < 50 copies/mL | |
| Thailand | 400 mg once daily | 3TC 150 mg and D4T 30 or 40 mg | Yes | < 50 copies/mL | |
| Burkina Faso | 200 mg twice daily | D4T and 3TC1 | Yes | Not reported | |
| Spain | 400 mg once daily | D4T 40 mg and DDI 400 mg | No | < 50 copies/mL | |
| India | 200 mg twice daily | AZT, d4T, 3TC1 | Yes | < 400 copies/mL | |
| Senegal | 200 mg twice daily | AZT 300 mg and 3TC 150 mg | No | Not reported | |
| India | 400 mg once daily | DDI 250 mg or 400 mg and 3TC 300 mg | Yes | Not reported | |
| USA | 200 mg twice daily | ABC/3TC, DDI/d4T, AZT/3TC, d4T/3TC1 | No | < 50 copies/mL | |
| North/South America, Australia, Europe, South Africa, and Thailand | 200 mg twice daily and 400 mg twice daily | D4T 40 mg and 3TC 150 mg | No | < 50 copies/mL | |
| Botswana | Not reported | AZT or d4T/3TC or DDI1 | No | Not reported | |
| 1Dosage not specified. | |||||
| Outcome or subgroup title | No. of studies | No. of participants | Statistical method | Effect size |
| 1 Virological success Show forest plot | 10 | 2438 | Risk Ratio (M‐H, Random, 95% CI) | 1.04 [0.99, 1.09] |
| 2 Mortality Show forest plot | 8 | 2317 | Risk Ratio (M‐H, Random, 95% CI) | 0.84 [0.59, 1.19] |
| 3 Progression to AIDS Show forest plot | 5 | 2005 | Risk Ratio (M‐H, Random, 95% CI) | 1.23 [0.72, 2.11] |
| 4 All severe adverse events Show forest plot | 8 | 2329 | Risk Ratio (M‐H, Random, 95% CI) | 0.91 [0.71, 1.18] |
| 5 Discontinuation rate Show forest plot | 9 | 2384 | Risk Ratio (M‐H, Random, 95% CI) | 0.93 [0.69, 1.25] |
| 6 Change in CD4 count Show forest plot | 9 | 1829 | Mean Difference (IV, Random, 95% CI) | ‐3.03 [‐17.41, 11.35] |
| 7 Treatment failure Show forest plot | 5 | 737 | Risk Ratio (M‐H, Random, 95% CI) | 0.97 [0.76, 1.24] |
| 8 Development of drug resistance Show forest plot | 4 | 988 | Risk Ratio (M‐H, Random, 95% CI) | 0.76 [0.60, 0.95] |
| Outcome or subgroup title | No. of studies | No. of participants | Statistical method | Effect size |
| 1 Severe adverse events: central nervous system Show forest plot | 6 | 2049 | Risk Ratio (M‐H, Random, 95% CI) | 4.46 [1.65, 12.03] |
| 2 Severe adverse events: gastrointestinal tract Show forest plot | 6 | 2049 | Risk Ratio (M‐H, Random, 95% CI) | 0.76 [0.48, 1.21] |
| 3 Severe adverse events: pyrexia Show forest plot | 3 | 1799 | Risk Ratio (M‐H, Random, 95% CI) | 0.65 [0.15, 2.73] |
| 4 Severe adverse events: elevated transaminases Show forest plot | 3 | 1299 | Risk Ratio (M‐H, Random, 95% CI) | 0.52 [0.35, 0.78] |
| 5 Severe adverse events: elevated alkaline phosphatase Show forest plot | 1 | 1007 | Risk Ratio (M‐H, Random, 95% CI) | 0.65 [0.17, 2.50] |
| 6 Severe adverse events: elevated amylase Show forest plot | 2 | 1071 | Risk Ratio (M‐H, Random, 95% CI) | 1.40 [0.72, 2.73] |
| 7 Severe adverse events: elevated triglycerides Show forest plot | 2 | 1071 | Risk Ratio (M‐H, Random, 95% CI) | 1.10 [0.39, 3.13] |
| 8 Severe adverse events: neutropenia Show forest plot | 3 | 1799 | Risk Ratio (M‐H, Random, 95% CI) | 0.48 [0.28, 0.82] |
| 9 Severe adverse events: rash Show forest plot | 7 | 2277 | Risk Ratio (M‐H, Random, 95% CI) | 0.58 [0.34, 1.00] |
| 10 Severe adverse events: elevated SGOT Show forest plot | 1 | 135 | Mean Difference (IV, Random, 95% CI) | 3.30 [‐2.06, 8.66] |
| 11 Severe adverse events: elevated SGPT Show forest plot | 1 | 135 | Mean Difference (IV, Random, 95% CI) | 5.70 [‐4.23, 15.63] |
| 12 Severe adverse events: elevated cholesterol Show forest plot | 1 | 64 | Risk Ratio (M‐H, Random, 95% CI) | 6.03 [0.75, 48.78] |
| Outcome or subgroup title | No. of studies | No. of participants | Statistical method | Effect size |
| 1 Virological success Show forest plot | 9 | 2369 | Risk Ratio (M‐H, Random, 95% CI) | 1.04 [0.99, 1.10] |
| 1.1 Concurrent treatment for TB | 4 | 963 | Risk Ratio (M‐H, Random, 95% CI) | 1.08 [0.99, 1.18] |
| 1.2 No treatment for TB | 5 | 1406 | Risk Ratio (M‐H, Random, 95% CI) | 1.01 [0.95, 1.08] |
| 2 Mortality Show forest plot | 8 | 2317 | Risk Ratio (M‐H, Random, 95% CI) | 0.84 [0.59, 1.19] |
| 2.1 Concurrent treatment for TB | 4 | 963 | Risk Ratio (M‐H, Random, 95% CI) | 0.69 [0.40, 1.19] |
| 2.2 No treatment for TB | 4 | 1354 | Risk Ratio (M‐H, Random, 95% CI) | 1.01 [0.62, 1.64] |
| 3 Progression to AIDS Show forest plot | 5 | 2005 | Risk Ratio (M‐H, Random, 95% CI) | 1.23 [0.72, 2.11] |
| 3.1 Concurrent treatment for TB | 2 | 712 | Risk Ratio (M‐H, Random, 95% CI) | 1.09 [0.62, 1.92] |
| 3.2 No treatment for TB | 3 | 1293 | Risk Ratio (M‐H, Random, 95% CI) | 1.51 [0.44, 5.16] |
| 4 Discontinuation rate Show forest plot | 9 | 2384 | Risk Ratio (M‐H, Random, 95% CI) | 0.93 [0.69, 1.25] |
| 4.1 Concurrent treatment for TB | 4 | 963 | Risk Ratio (M‐H, Random, 95% CI) | 0.92 [0.59, 1.42] |
| 4.2 No treatment for TB | 5 | 1421 | Risk Ratio (M‐H, Random, 95% CI) | 0.99 [0.63, 1.55] |
| Outcome or subgroup title | No. of studies | No. of participants | Statistical method | Effect size |
| 1 Virological success Show forest plot | 9 | 2369 | Risk Ratio (M‐H, Random, 95% CI) | 1.04 [0.99, 1.09] |
| 1.1 Nevirapine 200 mg twice daily | 7 | 1766 | Risk Ratio (M‐H, Random, 95% CI) | 1.03 [0.97, 1.09] |
| 1.2 Nevirapine 400 mg once daily | 3 | 603 | Risk Ratio (M‐H, Random, 95% CI) | 1.12 [0.94, 1.35] |
| 2 Mortality Show forest plot | 8 | 2459 | Risk Ratio (M‐H, Random, 95% CI) | 0.80 [0.57, 1.12] |
| 2.1 Nevirapine 200 mg twice daily | 7 | 1781 | Risk Ratio (M‐H, Random, 95% CI) | 0.90 [0.64, 1.28] |
| 2.2 Nevirapine 400 mg once daily | 3 | 678 | Risk Ratio (M‐H, Random, 95% CI) | 0.34 [0.13, 0.90] |
| 3 Progression to AIDS Show forest plot | 5 | 2005 | Risk Ratio (M‐H, Random, 95% CI) | 1.20 [0.76, 1.89] |
| 3.1 Nevirapine 200 mg twice daily | 5 | 1585 | Risk Ratio (M‐H, Random, 95% CI) | 1.29 [0.75, 2.23] |
| 3.2 Nevirapine 400 mg once daily | 1 | 420 | Risk Ratio (M‐H, Random, 95% CI) | 0.79 [0.25, 2.44] |
| 4 Discontinuation rate Show forest plot | 9 | 2384 | Risk Ratio (M‐H, Random, 95% CI) | 0.87 [0.66, 1.14] |
| 4.1 Nevirapine 200 mg twice daily | 7 | 1781 | Risk Ratio (M‐H, Random, 95% CI) | 0.92 [0.71, 1.21] |
| 4.2 Nevirapine 400 mg once daily | 3 | 603 | Risk Ratio (M‐H, Random, 95% CI) | 0.79 [0.40, 1.57] |