Scolaris Content Display Scolaris Content Display

Study flow diagram
Figuras y tablas -
Figure 1

Study flow diagram

Methodological quality graph: review authors' judgements about each methodological quality item presented as percentages across all included studies.
Figuras y tablas -
Figure 2

Methodological quality graph: review authors' judgements about each methodological quality item presented as percentages across all included studies.

Methodological quality summary: review authors' judgements about each methodological quality item for each included study.
Figuras y tablas -
Figure 3

Methodological quality summary: review authors' judgements about each methodological quality item for each included study.

Forest plot of comparison: 1 Exercise versus no treatment, outcome: 1.1 Menstrual pain intensity.
Figuras y tablas -
Figure 4

Forest plot of comparison: 1 Exercise versus no treatment, outcome: 1.1 Menstrual pain intensity.

Comparison 1 Exercise versus no treatment, Outcome 1 Menstrual pain intensity.
Figuras y tablas -
Analysis 1.1

Comparison 1 Exercise versus no treatment, Outcome 1 Menstrual pain intensity.

Comparison 1 Exercise versus no treatment, Outcome 2 Overall menstrual symptoms.
Figuras y tablas -
Analysis 1.2

Comparison 1 Exercise versus no treatment, Outcome 2 Overall menstrual symptoms.

Comparison 1 Exercise versus no treatment, Outcome 3 Quality of life.
Figuras y tablas -
Analysis 1.3

Comparison 1 Exercise versus no treatment, Outcome 3 Quality of life.

Comparison 2 Exercise versus NSAIDs, Outcome 1 Menstrual pain intensity.
Figuras y tablas -
Analysis 2.1

Comparison 2 Exercise versus NSAIDs, Outcome 1 Menstrual pain intensity.

Comparison 2 Exercise versus NSAIDs, Outcome 2 Use of rescue analgesic medication.
Figuras y tablas -
Analysis 2.2

Comparison 2 Exercise versus NSAIDs, Outcome 2 Use of rescue analgesic medication.

Comparison 2 Exercise versus NSAIDs, Outcome 3 Absence from work or school.
Figuras y tablas -
Analysis 2.3

Comparison 2 Exercise versus NSAIDs, Outcome 3 Absence from work or school.

Summary of findings for the main comparison. Exercise compared to no treatment for dysmenorrhoea

Exercise compared to no treatment for dysmenorrhoea

Patient or population: young women with suspected primary dysmenorrhoea
Setting: school, university or outpatient setting
Intervention: exercise
Comparison: no treatment

Outcomes

Anticipated absolute effects* (95% CI)

Relative effect
(95% CI)

№ of participants
(studies)

Quality of the evidence
(GRADE)

Comments

Risk with no treatment

Risk with exercise

Menstrual pain intensity,
measured by various outcome measures including VAS, MPQ and NRS at the end of the intervention

Lower scores indicate less intense menstrual pain

The mean menstrual pain intensity was 6.76

SMD 1.86 lower
(2.06 lower to 1.66 lower)

632
(9 RCTs)

⊕⊕⊝⊝
Lowab

Exercise may provide a large reduction in menstrual pain intensity compared to no treatment.

Adverse events

0 per 1000

0 per 1000
(0 to 0)

Not estimable

36
(1 RCT)

⊕⊝⊝⊝
Very lowcd

Due to the very low‐quality evidence, we are uncertain whether there is any difference in risk for adverse events between exercise and no treatment control.

Overall menstrual symptoms ,
measured by the MMDQ at the end of the intervention.

Lower scores indicates lower menstrual symptom severity

The mean overall menstrual symptoms was 99

MD 33.16 lower
(40.45 lower to 25.87 lower)

120
(1 RCT)

⊕⊝⊝⊝
Very lowef

Due to the very low‐quality evidence, we are uncertain whether exercise reduces overall menstrual symptoms compared to a no treatment control.

Use of rescue analgesic medication ‐ not reported

No studies reported on this outcome.

Restriction of daily life activities ‐ not reported

No studies reported on this outcome.

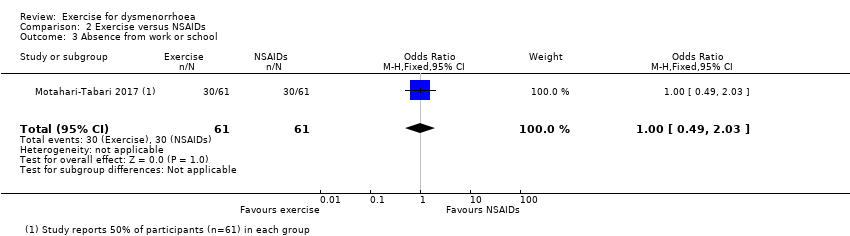
Absence from work or school ‐ not reported

No studies reported on this outcome.

Quality of life,
assessed with: physical and mental component summary scores measured by the SF‐12 at the end of the intervention

Higher scores indicate higher quality of life

Mean postintervention score for the mental component in the no treatment group was 37.6

Mean postintervention score for the physical component in the no treatment group was 44.4

Mental component: MD 4.40 higher
(1.59 higher to 7.21 higher)

Physical component: MD 3.40 higher
(1.68 lower to 8.48 higher)

55
(1 RCT)

⊕⊝⊝⊝
Very lowgh

Due to the very low‐quality evidence, we are uncertain whether exercise improves quality of life compared to a no treatment control.

*The risk in the intervention group (and its 95% CI) is based on the assumed risk in the comparison group and the relative effect of the intervention (and its 95% CI).

CI: confidence interval; MD: mean difference; MMDQ: Moos Menstrual Distress Questionnaire; MPQ: McGil Pain Questionnaire; NRS: numeric rating scale; RCT: randomised controlled trial; SF‐12: 12‐Item Short Form Health Survey; SMD: standardised mean difference; VAS: visual analogue scale

GRADE Working Group grades of evidence
High quality: further research is very unlikely to change our confidence in the estimate of effect.
Moderate quality: further research is likely to have an important impact on our confidence in the estimate of effect and may change the estimate.
Low quality: further research is very likely to have an important impact on our confidence in the estimate of effect and is likely to change the estimate.
Very low quality: we are very uncertain about the estimate.

aDowngraded one level for serious risk of bias: all included trials are at a high risk of bias for performance and detection bias.
bDowngraded one level for serious inconsistency: while heterogeneity is very high (I2= 91%), all effects are in the same direction, favouring exercise.
cDowngraded one level for serious risk of bias: single included trial has a high risk of performance and detection bias and this may affect the adverse event reporting.
dDowngraded two levels for very serious imprecision: very small sample size (36 participants) and rare adverse events.
eDowngraded two levels for very serious risk of bias: the single included study is at high risk of bias for three domains and unclear for the remainder.
fDowngraded one level for serious imprecision: one small study.
gDowngraded one level for serious risk of bias: the single included study is at high risk of bias for two domains.
hDowngraded two levels for very serious imprecision: one small study (55 participants).

Figuras y tablas -
Summary of findings for the main comparison. Exercise compared to no treatment for dysmenorrhoea
Summary of findings 2. Exercise compared to non‐steroidal anti‐inflammatory drugs (NSAIDs) for dysmenorrhoea

Exercise compared to non‐steroidal anti‐inflammatory drugs (NSAIDs) for dysmenorrhoea

Patient or population: young women with suspected primary dysmenorrhoea
Setting: university or school
Intervention: exercise
Comparison: NSAIDs

Outcomes

Anticipated absolute effects* (95% CI)

Relative effect
(95% CI)

№ of participants
(studies)

Quality of the evidence
(GRADE)

Comments

Risk with NSAIDs

Risk with exercise

Menstrual pain intensity,
measured by 100 mm VAS at the end of the intervention

Higher scores indicate greater reductions in pain intensity from baseline

The mean menstrual pain intensity was ‐21.3 change in VAS score from baseline

MD 7.4 lower change in VAS score from baseline
(8.36 lower to 6.44 lower)

122
(1 RCT)

⊕⊝⊝⊝
Very lowab

Due to the very low‐quality evidence, we are uncertain whether exercise improves menstrual pain severity compared to NSAIDs.

Adverse events ‐ not reported

No studies reported on this outcome.

Overall menstrual symptoms ‐ not reported

No studies reported on this outcome.

Use of rescue analgesic medication

assessed by: number of women who took rescue/additional analgesics during the last cycle

Greater numbers indicate more women needed additional analgesics

361 per 1000

638 per 1000
(436 to 938)

RR 1.77
(1.21 to 2.60)

122
(1 RCT)

⊕⊝⊝⊝
Very lowab

Due to the very low‐quality evidence, we are uncertain whether exercise changes the amount of additional medication needed compared to NSAIDs.

Restriction of daily life activities ‐ not reported

No studies reported on this outcome.

Absence from work or school

492 per 1000

492 per 1000
(322 to 663)

OR 1.00
(0.49 to 2.03)

122
(1 RCT)

⊕⊝⊝⊝
Very lowab

Due to the very low‐quality evidence, we are uncertain whether exercise changes absenteeism compared to NSAIDs.

Quality of life ‐ not reported

No studies reported on this outcome.

*The risk in the intervention group (and its 95% CI) is based on the assumed risk in the comparison group and the relative effect of the intervention (and its 95% CI).

CI: confidence interval; MD: mean difference; NSAID: non‐steroidal anti‐inflammatory drug; OR: odds ratio; RCT: randomised controlled trial; RR: risk ratio; VAS: visual analogue scale

GRADE Working Group grades of evidence
High quality: further research is very unlikely to change our confidence in the estimate of effect.
Moderate quality: further research is likely to have an important impact on our confidence in the estimate of effect and may change the estimate.
Low quality: further research is very likely to have an important impact on our confidence in the estimate of effect and is likely to change the estimate.
Very low quality: we are very uncertain about the estimate.

aDowngraded two levels for very serious risk of bias: the single included study was at high risk of bias for performance and detection bias and unclear risk of bias for all other domains.
bDowngraded one level for serious imprecision: one small study (122 participants) reported on this outcome.

Figuras y tablas -
Summary of findings 2. Exercise compared to non‐steroidal anti‐inflammatory drugs (NSAIDs) for dysmenorrhoea
Comparison 1. Exercise versus no treatment

Outcome or subgroup title

No. of studies

No. of participants

Statistical method

Effect size

1 Menstrual pain intensity Show forest plot

9

632

Std. Mean Difference (IV, Fixed, 95% CI)

‐1.86 [‐2.06, ‐1.66]

1.1 High‐intensity exercise

4

213

Std. Mean Difference (IV, Fixed, 95% CI)

‐2.51 [‐2.89, ‐2.13]

1.2 Low‐intensity Exercise

6

419

Std. Mean Difference (IV, Fixed, 95% CI)

‐1.62 [‐1.85, ‐1.38]

2 Overall menstrual symptoms Show forest plot

1

120

Mean Difference (IV, Fixed, 95% CI)

‐33.16 [‐40.45, ‐25.87]

3 Quality of life Show forest plot

1

110

Mean Difference (IV, Fixed, 95% CI)

4.17 [1.71, 6.62]

3.1 Mental

1

55

Mean Difference (IV, Fixed, 95% CI)

4.40 [1.59, 7.21]

3.2 Physical

1

55

Mean Difference (IV, Fixed, 95% CI)

3.40 [‐1.68, 8.48]

Figuras y tablas -
Comparison 1. Exercise versus no treatment
Comparison 2. Exercise versus NSAIDs

Outcome or subgroup title

No. of studies

No. of participants

Statistical method

Effect size

1 Menstrual pain intensity Show forest plot

1

122

Mean Difference (IV, Fixed, 95% CI)

‐7.40 [‐8.36, ‐6.44]

2 Use of rescue analgesic medication Show forest plot

1

122

Risk Ratio (M‐H, Fixed, 95% CI)

1.77 [1.21, 2.60]

3 Absence from work or school Show forest plot

1

122

Odds Ratio (M‐H, Fixed, 95% CI)

1.0 [0.49, 2.03]

Figuras y tablas -
Comparison 2. Exercise versus NSAIDs