Acupuntura para la depresión
Resumen
Antecedentes
La depresión es reconocida como un importante problema de salud pública, con una repercusión significativa sobre las personas y la sociedad. Los pacientes con depresión pueden considerar la posibilidad de utilizar terapias complementarias como la acupuntura, y se ha producido un incremento en el grupo de estudios de investigación para evaluar la efectividad de la acupuntura para el tratamiento de los pacientes con depresión. Ésta es la segunda actualización de esta revisión.
Objetivos
Examinar la efectividad y los efectos adversos de la acupuntura para el tratamiento de los pacientes con depresión.
Determinar:
• Si la acupuntura es más efectiva que el tratamiento habitual/ningún tratamiento/control en lista de espera para tratar y mejorar la calidad de vida de los pacientes con depresión.
• Si la acupuntura es más efectiva que la acupuntura control para tratar y mejorar la calidad de vida de los pacientes con depresión.
• Si la acupuntura es más efectiva que los tratamientos farmacológicos para tratar y mejorar la calidad de vida de los pacientes con depresión.
• Si la acupuntura más tratamiento farmacológico es más efectiva que el tratamiento farmacológico solo para tratar y mejorar la calidad de vida de los pacientes con depresión.
• Si la acupuntura es más efectiva que las terapias psicológicas para tratar y mejorar la calidad de vida de los pacientes con depresión.
• Los efectos adversos de la acupuntura comparada con el tratamiento habitual/ningún tratamiento/control en lista de espera, la acupuntura control, los tratamientos farmacológicos y las terapias psicológicas para el tratamiento de los pacientes con depresión.
Métodos de búsqueda
Se hicieron búsquedas en las siguientes bases de datos hasta junio de 2016: registro de ensayos controlados del Grupo Cochrane de Trastornos Mentales Comunes (Cochrane Common Mental Disorders Group Controlled Trials Register (CCMD‐CTR)), Korean Studies Information Service System (KISS), DBPIA (sitio web de la base de datos de artículos coreana), Korea Institute of Science and Technology Information, Research Information Service System (RISS), Korea Med, Korean Medical Database (KM base) y en el Oriental Medicine Advanced Searching Integrated System (OASIS), así como en varias revistas médicas coreanas.
Criterios de selección
Los criterios de la revisión requirieron la inclusión de todos los ensayos controlados aleatorios publicados y no publicados que compararon acupuntura versus acupuntura control, ningún tratamiento, medicación, otras psicoterapias estructuradas (terapia cognitivo‐conductual, psicoterapia o asistencia psicológica) o la atención estándar. Las modalidades de tratamiento incluyeron acupuntura, electroacupuntura y acupuntura láser. Entre los participantes se incluyeron hombres y mujeres adultos con depresión diagnosticada mediante el Diagnostic and Statistical Manual of Mental Disorders Fourth Edition (DSM‐IV), los Research Diagnostic Criteria (RDC), la International Statistical Classification of Diseases and Related Health Problems (ICD), o la Chinese Classification of Mental Disorders Third Edition Revised (CCMD‐3‐R). De ser necesario, se utilizaron las definiciones de los autores de los ensayos de trastorno depresivo.
Obtención y análisis de los datos
Para realizar los metanálisis se utilizaron los cocientes de riesgos (CR) para los resultados dicotómicos y las diferencias de medias estandarizadas (DME) para los resultados continuos, con los intervalos de confianza (IC) del 95%. Los resultados primarios fueron: la reducción de la gravedad de la depresión, medida con escalas calificadas por el paciente o por un médico, y una mejoría de la depresión definida como remisión versus ninguna remisión. Se evaluó la calidad de la evidencia mediante el método GRADE.
Resultados principales
Esta revisión es una actualización de versiones anteriores e incluye 64 estudios (7104 participantes). La mayoría de los estudios tuvieron alto riesgo de sesgo de realización, riesgo alto o incierto de sesgo de detección y riesgo bajo o incierto de sesgo de selección, sesgo de desgaste, sesgo de informe y otros sesgos.
Acupuntura versus ningún tratamiento/control en lista de espera/tratamiento habitual
Se encontró evidencia de baja calidad que indicó que la acupuntura (manual y electroacupuntura) puede reducir de forma moderada la gravedad de la depresión al final del tratamiento (DME ‐0,66; IC del 95%: ‐1,06 a ‐0,25; cinco ensayos, 488 participantes). No está claro si los datos muestran diferencias entre los grupos en cuanto al riesgo de eventos adversos (CR 0,89; IC del 95%: 0,35 a 2,24; un ensayo, 302 participantes; evidencia de baja calidad).
Acupuntura versus acupuntura control (controles invasivos, simulados no invasivos)
La acupuntura se puede asociar con una reducción pequeña de la gravedad de la depresión de 1,69 puntos en la Hamilton Depression Rating Scale (HAMD) al final del tratamiento (IC del 95%: ‐3,33 a ‐0,05; 14 ensayos, 841 participantes; evidencia de baja calidad). No está claro si los datos muestran diferencias entre los grupos en cuanto al riesgo de eventos adversos (CR 1,63; IC del 95%: 0,93 a 2,86; cinco ensayos, 300 participantes; evidencia de calidad moderada).
Acupuntura versus medicación
Se encontró evidencia de muy baja calidad que indicó que la acupuntura puede brindar efectos beneficiosos pequeños en la reducción de la gravedad de la depresión al final del tratamiento (DME ‐0,23; IC del 95%: ‐0,40 a ‐0,05; 31 ensayos, 3127 participantes). Los estudios muestran una variación significativa como resultado de la administración de diferentes clases de fármacos y diferentes modalidades de estimulación de la acupuntura. Evidencia de muy baja calidad indicó calificaciones inferiores de los eventos adversos después de la acupuntura en comparación con la medicación sola, medidos a través de la Montgomery‐Asberg Depression Rating Scale (MADRS) (diferencia de medias [DM] ‐4,32; IC del 95%: ‐7,41 a ‐1,23; tres ensayos, 481 participantes).
Acupuntura más medicación versus medicación sola
Se encontró evidencia de muy baja calidad que indicó que la acupuntura es muy beneficiosa para la reducción de la gravedad de la depresión al final del tratamiento (DME ‐1,15; IC del 95%: ‐1,63 a ‐0,66; 11 ensayos, 775 participantes). Los estudios muestran una variación significativa como resultado del uso de diferentes modalidades de estimulación de la acupuntura. No está claro si las diferencias en los eventos adversos se asocian con las diferentes modalidades de la acupuntura (DME ‐1,32; IC del 95%: ‐2,86 a 0,23; tres ensayos, 200 participantes; evidencia de muy baja calidad).
Acupuntura versus terapia psicológica
No está claro si los datos muestran diferencias entre la acupuntura y la terapia psicológica en cuanto a la gravedad de la depresión al final del tratamiento (DME ‐0,5; IC del 95%: ‐1,33 a 0,33; dos ensayos, 497 participantes; evidencia de baja calidad). Evidencia de baja calidad no indicó diferencias entre los grupos en cuanto a las tasas de eventos adversos (CR 0,62; IC del 95%: 0,29 a 1,33; un ensayo, 452 participantes).
Conclusiones de los autores
La reducción de la gravedad de la depresión fue menor cuando la acupuntura se comparó con la acupuntura control, que cuando la acupuntura se comparó con ningún tratamiento control aunque, en ambos casos, se consideró que los resultados aportaron evidencia de baja calidad. La reducción de la gravedad de la depresión con la acupuntura administrada sola o junto con medicación versus medicación sola no está clara debido a la evidencia de muy baja calidad. No está claro el efecto de la acupuntura comparada con la terapia psicológica. El riesgo de eventos adversos con la acupuntura tampoco está claro, ya que la mayoría de los ensayos no informaron de manera adecuada los eventos adversos. Pocos estudios incluyeron períodos de seguimiento o evaluaron resultados importantes como la calidad de vida. Se necesitan con urgencia ensayos controlados aleatorios de alta calidad para examinar la eficacia clínica y la aceptabilidad de la acupuntura, así como su efectividad, en comparación con la acupuntura control, la medicación o las terapias psicológicas.
PICOs
Resumen en términos sencillos
Acupuntura para la depresión
¿Por qué es importante esta revisión?
La depresión es muy frecuente en nuestras sociedades. Los pacientes con depresión clínica informan falta de interés en la vida y en actividades que en otras condiciones normalmente disfrutarían. Algunos pacientes con depresión utilizan terapias complementarias y algunos prefieren estas terapias a la medicación. La acupuntura se realiza mediante la inserción de agujas finas en diferentes partes del cuerpo para corregir el desequilibrio de energía en el mismo.
¿A quién le interesará esta revisión?
Adolescentes y adultos; profesionales sanitarios, incluidos médicos generales que trabajan con o están involucrados en el tratamiento de pacientes con depresión; así como profesionales y responsables de servicios de asistencia sanitaria, estarán interesados en esta revisión.
¿Qué preguntas pretende contestar esta revisión?
Esta revisión, que es una actualización de una revisión Cochrane previa (publicada en 2010), tiene como objetivo responder las siguientes preguntas.
• ¿La acupuntura es mejor que ningún tratamiento o la atención habitual?
• ¿La acupuntura es mejor que la acupuntura control (un tratamiento que parece similar a la acupuntura)?
• ¿La acupuntura es mejor que los tratamientos farmacológicos como la medicación antidepresiva?
• ¿La acupuntura combinada con la medicación antidepresiva es mejor que la medicación antidepresiva sola?
• ¿La acupuntura es mejor que las terapias psicológicas?
• ¿La acupuntura es más segura que otros tipos de tratamiento para la depresión?
¿Qué estudios se incluyeron en la revisión?
Se incluyeron 64 ensayos controlados aleatorios (con 7104 participantes) que midieron los cambios en los síntomas de depresión.
¿Qué dice la evidencia de la revisión?
Los autores de la revisión calificaron la calidad de la evidencia de la mayoría de los estudios incluidos como muy baja o baja, y los efectos descritos a continuación deben interpretarse con precaución.
La acupuntura puede dar lugar a una reducción moderada de la gravedad de la depresión en comparación con tratamiento habitual/ningún tratamiento. El uso de la acupuntura puede dar lugar a una reducción pequeña en la gravedad de la depresión en comparación con la acupuntura control. Los efectos de la acupuntura versus la medicación y la terapia psicológica no están claros debido a la calidad muy baja de la evidencia. Los riesgos de eventos adversos con la acupuntura tampoco están claros, ya que la mayoría de los ensayos no informaron los eventos adversos.
¿Qué debería suceder a continuación?
Los autores de la revisión recomiendan que se deben realizar ensayos controlados aleatorios adicionales de alta calidad. Estos ensayos deben utilizar un cegamiento apropiado (mediante el cual los pacientes no sepan qué tratamiento reciben) cuando sea apropiado y deben incorporar medidas de calidad de vida, evaluación de la aceptabilidad del tratamiento y el seguimiento a un plazo intermedio y a largo plazo.
Conclusiones de los autores
Summary of findings
| Acupuncture compared with no treatment/wait list/treatment as usual for depression | ||||||
| Patient or population: clinical diagnosis of depression | ||||||
| Outcomes | Anticipated absolute effects* (95% CI) | Relative effect | No. of participants | Quality of the evidence | Comments | |
| Risk with no treatment/wait list/treatment as usual | Risk with acupuncture | |||||
| Severity of depression at the end of treatment | SMD 0.66 lower | ‐ | 488 | ⊕⊕⊝⊝ | As a rule of thumb, 0.2 SMD represents a small difference, 0.5 moderate, and 0.8 large. | |
| Adverse events | Study population | RR 0.89 | 302 | ⊕⊕⊝⊝ | ||
| 60 per 1000 | 53 per 1000 | |||||
| Quality of life (physical) | ‐ | ‐ | ‐ | ‐ | ‐ | Cannot estimate the effect of acupuncture as no studies reported on this outcome |
| Quality of life (emotional) | ‐ | ‐ | ‐ | ‐ | ‐ | Cannot estimate the effect of acupuncture as no studies reported on this outcome |
| *The risk in the intervention group (and its 95% confidence interval) is based on the assumed risk in the comparison group and the relative effect of the intervention (and its 95% CI). | ||||||
| GRADE Working Group grades of evidence. | ||||||
| aDowngraded one level owing to high risk of performance bias across most included studies. bDowngraded one level owing to substantial heterogeneity (I2 = 64%, Tau2 = 0.14, P = 0.02). cDowngraded one level owing to high risk of performance bias. dDowngraded one level owing to small sample size for detecting relatively rare events. | ||||||
| Acupuncture compared with control acupuncture for depression | ||||||
| Patient or population: clinical diagnosis of depression | ||||||
| Outcomes | Anticipated absolute effects* (95% CI) | Relative effect | No. of participants | Quality of the evidence | Comments | |
| Risk with control acupuncture | Risk with acupuncture | |||||
| Severity of depression at the end of the intervention as measured by the Hamilton Depression Rating Scale (HAMD) scored from 0 to 54 (lower score indicates less severe depression) | In the study population, average severity of depression at the end of treatment was 11.4 in clinician‐rated HAMD scores. | MD 1.69 lower | ‐ | 841 | ⊕⊕⊝⊝ | |
| Adverse events | Study population | RR 1.63 | 300 | ⊕⊕⊕⊝ | ||
| 162 per 1000 | 264 per 1000 | |||||
| Quality of life (physical) at the end of treatment (higher scores indicate greater quality of life) | Mean quality of life (physical) at the end of treatment was 37. | MD 5.12 lower | ‐ | 150 | ⊕⊕⊝⊝ | |
| Quality of life (emotional) at the end of treatment (higher scores indicate greater quality of life) | Mean quality of life (emotional) at the end of treatment was 44.6. | MD 2.25 lower | ‐ | 167 | ⊕⊕⊕⊝ | |
| *The risk in the intervention group (and its 95% confidence interval) is based on the assumed risk in the comparison group and the relative effect of the intervention (and its 95% CI). | ||||||
| GRADE Working Group grades of evidence. | ||||||
| aDowngraded one level owing to high risk of bias in performance bias in five of the included studies and high risk of bias in at least one domain in most studies. bDowngraded one level owing to substantial heterogeneity (I2 = 80%, Tau2 = 7.80, P < 0.001). cDowngraded one level owing to small sample size for relatively rare events. dDowngraded one level because only one small study contributed to this outcome. eDowngraded one level for imprecision due to small sample size. | ||||||
| Acupuncture compared with medication for depression | ||||||
| Patient or population: clinical diagnosis of depression | ||||||
| Outcomes | Anticipated absolute effects* (95% CI) | Relative effect | No. of participants | Quality of the evidence | Comments | |
| Risk with medication | Risk with acupuncture | |||||
| Severity of depression at the end of treatment | SMD 0.23 lower | ‐ | 3127 | ⊕⊝⊝⊝ | As a rule of thumb, 0.2 SMD represents a small difference, 0.5 moderate, and 0.8 large. | |
| Adverse events (measured with Asberg Antidepressant Side Effect Scale) | Mean number of adverse events was 6.2. | MD 4.32 lower | ‐ | 481 | ⊕⊝⊝⊝ | |
| Quality of life (physical) | ‐ | ‐ | No studies reported on this outcome. | ‐ | Cannot estimate the effect of acupuncture as no studies reported on this outcome | |
| Quality of life (emotional) | ‐ | ‐ | No studies reported on this outcome. | ‐ | Cannot estimate the effect of acupuncture as no studies reported on this outcome | |
| *The risk in the intervention group (and its 95% confidence interval) is based on the assumed risk in the comparison group and the relative effect of the intervention (and its 95% CI). | ||||||
| GRADE Working Group grades of evidence. | ||||||
| aDowngraded two levels owing to very serious risk of bias. Of 31 trials, 30 were at high risk of bias owing to lack of blinding of participants, and 12 were at high risk of bias owing to lack of blinding of outcome assessors. bDowngraded one level owing to substantial heterogeneity (I2 = 80%, Tau2 = 0.19, P < 0.0001). cDowngraded two levels owing to very serious risk of bias in all three studies. dDowngraded two levels owing to considerable heterogeneity (I2 = 97%, Tau2 = 7.22, P < 0.001). | ||||||
| Acupuncture plus medication compared with medication for depression | ||||||
| Patient or population: clinical diagnosis of depression | ||||||
| Outcomes | Anticipated absolute effects* (95% CI) | Relative effect | No. of participants | Quality of the evidence | Comments | |
| Risk with medication | Risk with acupuncture plus medication | |||||
| Severity of depression at the end of treatment | SMD 1.15 lower | ‐ | 813 | ⊕⊝⊝⊝ | As a rule of thumb, 0.2 SMD represents a small difference, 0.5 moderate, and 0.8 large. | |
| Adverse events (measured with Asberg Antidepressant Side Effect Scale and Toxic Exposure Surveillance System) | SMD 1.32 lower | ‐ | 200 | ⊕⊝⊝⊝ | As a rule of thumb, 0.2 SMD represents a small difference, 0.5 moderate, and 0.8 large. | |
| Quality of life (physical) at the end of treatment (higher scores indicate greater quality of life) | Quality of life (physical) score in the single included study was 14.9. | MD 1.19 higher | ‐ | 127 | ⊕⊝⊝⊝ | |
| Quality of life (emotional) at the end of treatment (higher scores indicate greater quality of life) | Mean quality of life (emotional) score was 17.2. | MD 0.25 higher | ‐ | 219 | ⊕⊝⊝⊝ | |
| *The risk in the intervention group (and its 95% confidence interval) is based on the assumed risk in the comparison group and the relative effect of the intervention (and its 95% CI). | ||||||
| GRADE Working Group grades of evidence. | ||||||
| aDowngraded two levels owing to very serious risk of bias. Of 11 trials, nine were at high risk of bias owing to lack of blinding of participants, and 6 were at high risk of bias owing to lack of blinding of outcome assessors. bDowngraded two levels owing to considerable heterogeneity (I2 = 89%, Tau2 = 0.70, P < 0.001). fDowngraded two levels owing to very serious risk of bias. | ||||||
| Acupuncture compared with psychological therapy for depression | ||||||
| Patient or population: clinical diagnosis of depression | ||||||
| Outcomes | Anticipated absolute effects* (95% CI) | Relative effect | No. of participants | Quality of the evidence | Comments | |
| Risk with psychological therapy | Risk with acupuncture | |||||
| Severity of depression at the end of treatment as measured by self‐rated depression scores (lower score indicates less severe depression) | SMD 0.5 lower | ‐ | 497 | ⊕⊕⊝⊝ | As a rule of thumb, 0.2 SMD represents a small difference, 0.5 moderate, and 0.8 large. | |
| Adverse events measured during study treatment | Study population | RR 0.62 | 453 | ⊕⊕⊝⊝ | ||
| 86 per 1000 | 53 per 1000 | |||||
| Quality of life (physical) | ‐ | ‐ | ‐ | No studies reported on this outcome. | ‐ | Cannot estimate the effect of acupuncture as no studies reported on this outcome |
| Quality of life (emotional) | ‐ | ‐ | ‐ | No studies reported on this outcome. | ‐ | Cannot estimate the effect of acupuncture as no studies reported on this outcome |
| *The risk in the intervention group (and its 95% confidence interval) is based on the assumed risk in the comparison group and the relative effect of the intervention (and its 95% CI). | ||||||
| GRADE Working Group grades of evidence. | ||||||
| aDowngraded one level for serious risk of bias; both included trials have high risk of performance bias. dDowngraded one level owing to high risk of performance bias. | ||||||
Antecedentes
Descripción de la afección
La depresión clínica tiene características conductuales, cognitivas y emocionales. Los pacientes con depresión a menudo presentan signos de estado de ánimo disfórico, pérdida de interés en las actividades normalmente placenteras, descuido de su persona y aislamiento social, pérdida de apetito o alimentación excesiva, insomnio o hipersomnia, fatiga o pérdida de energía, autoestima baja, alteración de la concentración o dificultad para tomar decisiones y sentimientos de desesperanza.
La depresión es reconocida como un importante problema de salud pública, con una repercusión significativa sobre las personas y la sociedad. Los trastornos depresivos son frecuentes en la población en general. En los Estados Unidos se ha informado que la prevalencia durante toda la vida de un trastorno depresivo mayor (TDM) es del 16,2% (Kessler 2007). La Organización Mundial de la Salud describió la depresión como una "carga oculta" (Murray 1996). El TDM se asocia con una pérdida significativa de días laborales (Kessler 2007), así como una deficiencia importante en las funciones relacionadas con las responsabilidades domésticas, la vida social y las relaciones personales (Kessler 2003). A nivel comunitario, se ha demostrado que quienes padecen trastornos depresivos presentan una menor funcionalidad física y mental, similar a los pacientes con enfermedades crónicas como la diabetes (Hays 1995; Wells 1989). Además, los trastornos del estado de ánimo han mostrado tener una mayor repercusión sobre la calidad de vida en comparación con enfermedades como la hipertensión y la enfermedad cardíaca (Spitzer 1995). La depresión se asocia con considerables costos financieros para los servicios sanitarios y para la sociedad. Se calcula que en Inglaterra la carga económica excede los £9 000 000 000 por año con cerca de £370 000 000 debidos a los costos directos del tratamiento (Thomas 2003).
Descripción de la intervención
La depresión mayor es un episodio diferenciado de la depresión grave; cuando desaparece, se describe que el paciente está en remisión y se siente completamente normal. La distimia es una depresión generalizada "de bajo nivel" que dura mucho tiempo, con frecuencia unos pocos años. Los enfoques terapéuticos son los mismos para ambas afecciones. La mayoría de los pacientes con depresión se tratan en la atención primaria y no requieren hospitalización. En la atención primaria, la mayoría de las veces la depresión se trata con fármacos antidepresivos (Goldman 1999). También hay varias intervenciones psicológicas disponibles como las terapias cognitivo‐conductuales, la terapia interpersonal, la psicoterapia y la asistencia psicológica. Las encuestas han indicado que los australianos prefieren la autoayuda y las terapias complementarias para la depresión (Jorm 1997; Jorm 2000) y en los Estados Unidos los pacientes con depresión informan un mayor uso de las terapias complementarias (Kessler 2000).
La acupuntura tiene una larga historia de uso en China, Japón y Corea. La práctica de acupuntura contemporánea se realiza de manera habitual como parte del sistema médico hospitalario en la China moderna (Robinson 2012), como parte de la medicina coreana tradicional en Corea del Sur (Woo 2014) y como una mezcla de prácticas hospitalarias y privadas en el Reino Unido (Hopton 2012). La teoría de la Medicina tradicional china describe que el estado de salud se mantiene por un equilibrio de energía en el cuerpo. La acupuntura se realiza mediante la inserción de agujas finas en diferentes partes del cuerpo para corregir el desequilibrio de energía en el mismo. Los estilos de la acupuntura varían desde la acupuntura tradicional/clásica a la acupuntura auricular, a la acupuntura de estimulación de puntos gatillo y a la acupuntura de un punto único. La acupuntura se practica bajo varios marcos teóricos. La Medicina tradicional china (MTC) y la Acupuntura clásica se basan en los conceptos teóricos del Yin y el Yang, y los Cinco Elementos, y explican las funciones fisiológicas y patológicas. Una aplicación médica occidentalizada de la acupuntura incluye el uso de la misma mediante el uso de puntos gatillo, puntos segmentarios y los puntos convencionales comunes. La acupuntura médica puede consistir de la aplicación de la acupuntura basada en los principios de la neurofisiología y la anatomía, en lugar de los principios y la filosofía de la MTC. El tratamiento auricular implica el estudio del oído para realizar un diagnóstico y, posteriormente, insertar agujas en puntos del mismo. La electroacupuntura se define como la aplicación de una pequeña corriente mediante agujas de acupuntura. La acupuntura láser es una forma no invasiva de acupuntura que emplea la luz láser de baja potencia para estimular los puntos de acupuntura. La justificación para el tratamiento determinará los detalles de la inserción de las agujas (p.ej. la selección de los puntos, el número de agujas utilizadas) y el método de estimulación (p.ej. acupuntura manual, electroacupuntura, acupuntura láser). Los diferentes estilos de la acupuntura pueden diferir en su efectividad, pero se han realizado pocos estudios de investigación que examinen directamente los efectos sobre los resultados clínicos cuando se cambian estos parámetros (Armour 2016; Lin 2016).
La acupuntura no está completamente libre de eventos adversos. En el Reino Unido se han realizado dos grandes encuestas prospectivas (MacPherson 2004; White 2001). White 2001 informó una incidencia de 684 eventos adversos por 10 000 consultas. En su mayoría fueron eventos leves como sangrado, dolor al insertar las agujas o empeoramiento de los síntomas, y los investigadores informaron una tasa baja de eventos adversos significativos (14 por 10 000). MacPherson 2004 informó una tasa de 107 eventos adversos por 1000 participantes (intervalo de confianza [IC] del 95%: 100 a 115). Tres participantes informaron un evento adverso grave. Los eventos informados con más frecuencia fueron agotamiento y cansancio grave, dolor en el sitio de inserción de la aguja y cefalea. White 2004 resumió la variedad y la incidencia de los eventos adversos asociados con la acupuntura. En 12 estudios prospectivos realizados en el Reino Unido, Alemania, Singapur, Japón y Suecia, que consideraron más de un millón de tratamientos, encontraron que el riesgo de un evento adverso grave con la acupuntura se calculó en 0,05 por 10 000 tratamientos, y 0,55 por 10 000 pacientes individuales. Los datos de estos estudios indican que los riesgos asociados con la acupuntura son pocos, lo que fue reforzado por Vincent 2001, que concluyó que la acupuntura es segura en manos competentes.
De qué manera podría funcionar la intervención
La causa de la depresión parece ser multifactorial e involucra factores biológicos y psicosociales (Davidson 2002). Diversos componentes biológicos interdependientes se han implicado en el comienzo y el mantenimiento del TDM. Los modelos actuales indican que los cambios en el eje hipotalámico‐hipofisiario‐suprarrenal (HHS), la disfunción entre las hormonas responsables del estrés y el desequilibrio en neurotransmisores como noradrenalina, serotonina y dopamina pueden ser factores clave (Hou 2016).
Varios mecanismos pueden explicar los efectos terapéuticos de la acupuntura dentro del modelo actual de la depresión. Evidencia sólida obtenida durante las últimas tres décadas indican que los efectos de la acupuntura están mediados por diversos neurotransmisores, predominantemente el mecanismo de opioides endógenos (MOE), las catecolaminas y la serotonina, y que están afectados otros 20 a 30 neuropéptidos (Leung 2014). Los resultados de experimentos en animales indican que, al igual que los fármacos antidepresivos, la acupuntura es capaz de afectar los niveles de los neurotransmisores serotonina y noradrenalina, junto con la cascada adenil ciclasa‐adenosina cíclica monofosfato‐proteína quinasa A (AC‐AMPc‐PQA) dentro del sistema nervioso central (Leung 2014). Además, la acupuntura produce cambios estructurales y de la imagenología de resonancia magnética funcional (IRMf) (como describe Huang 2012) en la red de modalidad por defecto, la corteza cingulada anterior y la formación amígdala‐hipocampo (Liu 2009). La disfunción en estas áreas del cerebro se ha implicado previamente en los trastornos depresivos (Hamilton 2015). La acupuntura manual causa una amplia gama de respuestas del sistema nervioso central que incluyen la amígdala, el hipocampo, el hipotálamo, el cerebelo y otras estructuras límbicas observadas por IRMf y electroencefalografía (EEG) (Napadow 2005). Se considera que la electroacupuntura administra una mayor "dosis" de acupuntura en comparación con la acupuntura manual como resultado de la duración y la intensidad de la estimulación, y causa una mayor activación de los mecanismos de opioides endógenos (Mayor 2013). Lo anterior puede o no dar lugar a mayores efectos clínicos en las afecciones no relacionadas con el dolor (Langevin 2015; Mayor 2013). El mecanismo de la acupuntura láser aún no está claro, pero los modelos propuestos incluyen cambios en la expresión de los genes mediada por cambios en el óxido nítrico (Chung 2012).
Por qué es importante realizar esta revisión
Un mayor grupo de estudios de investigación se ha centrado en evaluar la efectividad de la acupuntura. En 2005 se publicó la primera versión de esta revisión sistemática que concluyó que no había evidencia suficiente para determinar la eficacia de la acupuntura. Se publicó una actualización en 2010. Desde entonces se han publicado nuevos ensayos y se ha obtenido acceso completo a un gran grupo de bibliografía relevante de China.
Objetivos
Examinar la efectividad y los efectos adversos de la acupuntura para el tratamiento de los pacientes con depresión.
-
Determinar si la acupuntura es más efectiva que el tratamiento habitual/ ningún tratamiento/control en lista de espera para tratar y mejorar la calidad de vida de los pacientes con depresión.
-
Determinar si la acupuntura es más efectiva que la acupuntura control para tratar y mejorar la calidad de vida de los pacientes con depresión.
-
Determinar si la acupuntura es más efectiva que los tratamientos farmacológicos para tratar y mejorar la calidad de vida de los pacientes con depresión.
-
Determinar si la acupuntura más tratamiento farmacológico es más efectiva que el tratamiento farmacológico solo para tratar y mejorar la calidad de vida de los pacientes con depresión.
-
Determinar si la acupuntura es más efectiva que las terapias psicológicas para tratar y mejorar la calidad de vida de los pacientes con depresión.
-
Determinar los efectos adversos de la acupuntura en comparación con el tratamiento habitual/ningún tratamiento/control en lista de espera, la acupuntura control, los tratamientos farmacológicos y las terapias psicológicas para el tratamiento de los pacientes con depresión.
Métodos
Criterios de inclusión de estudios para esta revisión
Tipos de estudios
Se intentó incluir todos los ensayos controlados aleatorios (ECA) relevantes publicados y no publicados. Se excluyeron los ensayos cruzados (crossover) debido a la incertidumbre con respecto al período de lavado permitido antes del tratamiento con acupuntura. Se incluyeron los ensayos aleatorios grupales y se excluyeron los ensayos cuasialeatorios que utilizaron métodos no aleatorios de asignación a los tratamientos como la fecha de ingreso (ver "Diferencias entre el protocolo y la revisión").
Tipos de participantes
Características
Se incluyeron los estudios en pacientes de cualquier sexo y de cualquier grupo étnico, con 16 años o más, con depresión diagnosticada clínicamente como afección primaria o como comorbilidad.
Diagnóstico
Se incluyeron los estudios en los que los investigadores diagnosticaron la depresión mediante uno o más de los siguientes criterios: depresión definida mediante el Diagnostic and Statistical Manual of Mental Disorders (Third Edition (DSM‐III), Fourth Edition (DSM‐IV), o Fifth Edition (DSM‐5); APA 2015), o los Research Diagnostic Criteria (RDC; Spitzer 1977), o la International Statistical Classification of Diseases and Related Health Problems (ICD; WHO 1993), o la Chinese Classification of Mental Disorders (Second Edition (CCMD‐2) o Third Edition (CCMD‐3); Chinese Psychiatric Society 2001). De ser necesario, se utilizaron las definiciones de los autores de los ensayos de trastorno depresivo. Se incluyeron la depresión mayor y la distimia.
Comorbilidades
Siempre que la depresión fuera el objetivo de interés principal del ensayo, los estudios que incluyeran a participantes con comorbilidades físicas o trastornos mentales comunes fueron elegibles para inclusión.
Lugar del tratamiento
Todos los ámbitos (primario, secundario, terciario y comunitario) fueron elegibles para inclusión.
Tipos de intervenciones
Intervenciones experimentales
-
Acupuntura manual: incluye la estimulación de los puntos anatómicos del cuerpo por la penetración de la piel con agujas delgadas, sólidas, metálicas que son manipuladas con las manos. También se incluye la acupuntura auricular (inserción de agujas en puntos localizados del oído)
-
Electroacupuntura: consiste en pasar una corriente pulsátil a través del cuerpo con las agujas de acupuntura
-
Acupuntura láser: la acupuntura láser es el uso de una emisión láser de bajo nivel en lugar de la aguja de acupuntura para estimular un punto de acupuntura
Intervenciones de comparación
Se incluyeron en esta revisión cinco categorías principales de grupos de comparación de ensayos. Se excluyeron los ensayos que no incluyeron uno de los siguientes grupos de comparación. El grupo de comparación en cada estudio se clasificó de la siguiente manera.
-
Control en lista de espera/tratamiento habitual/ningún tratamiento.
-
Acupuntura control.
-
Control con acupuntura invasiva.
-
Acupuntura simulada, que consiste de la inserción de una aguja en un punto que no es de acupuntura.
-
Acupuntura mínima, en la cual las agujas se insertan en puntos que no son de acupuntura pero de forma más superficial, sin estimulación ni manipulación, para evitar la sensación de la inserción de la aguja conocida como "de qi".
-
-
Control de acupuntura no invasiva: incluye el uso de una aguja placebo, una aguja sin filo, que parece como si perforara la piel aunque no lo hace; hay dos formas disponibles (Park 2002; Streitberger 1998).
-
Electroacupuntura falsa: incluye utilizar una unidad de estimulación de acupuntura y fijar los electrodos a la piel con el interruptor apagado.
-
Acupuntura láser falsa.
-
-
Antidepresivos: organizados en clases para esta revisión.
-
Inhibidores selectivos de la recaptación de serotonina (ISRS): zimelidina, fluoxetina, fluvoxamina, paroxetina, sertralina, citalopram, escitalopram.
-
Antidepresivos tetracíclicos (ATC): amitriptilina, imipramina, trimipramina, doxepina, desipramina, protriptilina, nortriptilina, clomipramina, dotiepina, lofepramina.
-
Antidepresivos heterocíclicos: mianserina, trazodona, amoxapina, maprotilina.
-
Inhibidores de la monoaminoxidasa (IMAO): irreversibles: fenelzina, tranilcipromina, izocarboxazida; reversibles: brofaromina, moclobemida, tirima.
-
Otros antidepresivos: inhibidores de la recaptación de noradrenalina (IRNA): reboxetina, atomoxetina; inhibidores de la recaptación de norepinefrina‐dopamina (IRND): amineptina, bupropión; inhibidores de la recaptación de serotonina y norepinefrina (IRSN): trazodona; no clasificados: agomelatina, vilazodona.
-
-
Tratamiento combinado mediante el cual se aplicó el mismo tratamiento conjunto a todos los grupos de estudio.
-
Acupuntura más medicación versus medicación.
-
-
Terapias psicológicas.
-
Terapia cognitivo‐conductual (TCC).
-
Terapia conductual (TC).
-
Psicoterapia.
-
Asistencia psicológica.
-
Tipos de medida de resultado
Resultados primarios
-
Reducción de la gravedad de la depresión, medida al final de la intervención principalmente como una variable continua en escalas de autoevaluación como el Beck Depression Inventory (BDI) (Beck 1961), o mediante escalas calificadas por los médicos, como la Hamilton Depression Rating Scale (HAMD), como se analiza en Hamilton 1960
-
Número total de eventos adversos
Resultados secundarios
-
Remisión de la depresión como se define en los informes de los ensayos y en base a la HAMD u otra escala calificada por los médicos de la gravedad de depresión e informada como resultado binario
-
Índices de calidad de vida (p.ej. Short‐Form Health Survey (SF‐36); Ware 1994), con dominios individuales relacionados con la calidad de vida, por ejemplo, el bienestar físico y emocional, informado
-
Cambio en el uso de la medicación o administración de otros sistemas de apoyo, medido como tratamiento adicional proporcionado, número de consultas a las que asistió, etc.
-
Abandonos del tratamiento, definidos como imposibilidad de completar, que incluye el número de pacientes que abandonaron temprano cada estudio y los motivos para el abandono temprano
Momento de evaluación de los resultados
El marco de tiempo principal para informar los resultados primarios y secundarios fue al finalizar la intervención. Si un estudio informó varios puntos temporales durante el marco de tiempo (es decir, durante el tratamiento), se informó la última observación antes de finalizar el tratamiento. Se incluyeron todos los marcos de tiempo y se agruparon de la siguiente manera.
-
Durante el período de tratamiento.
-
Al finalizar el período de tratamiento.
-
Entre cero y seis meses después de finalizar el período de tratamiento (corto plazo).
-
Entre seis y 12 meses después de finalizar el período de tratamiento (plazo intermedio).
-
Más de 12 meses después de finalizar el período de tratamiento (largo plazo).
Jerarquía de las medidas de resultado
Se trataron por igual cinco escalas utilizadas habitualmente para la evaluación de la depresión: el Beck Depression Inventory (BDI; Beck 1961); la Hamilton Depression Rating Scale (HAMD; Hamilton 1960); el Patient Health Questionnaire (PHQ; Spitzer 1999); la Montgomery and Asberg Depression Rating Scale (MADRS; Montgomery 1979); y la Clinical General Impression‐Severity Scale (CGI‐S). Todas las otras escalas de depresión tuvieron una calificación menor. Si los investigadores utilizaron dos o más de estas escalas, se aplicó la siguiente jerarquía: (1) HAMD; (2) MADRS; (3) CGI‐S; (4) BDI; (5) PHQ; y (6) todas las otras escalas de depresión. Debido a la dificultad para cegar al participante que a menudo se observa en los ensayos de acupuntura, se le dio preferencia a las escalas calificadas por los médicos cuando se proporcionaron los resultados calificados por los médicos y los autoinformados.
Si un estudio utilizó más de una medida de calidad de vida, se le aplicó la siguiente jerarquía a las escalas: (1) World Health Organization Quality of Life (WHOQOL; WHO 1998); (2) Short‐Form Health Survey (SF‐36; Ware 1994); y (3) cualquier otra medida de calidad de vida utilizada.
Se incluyeron los resultados calificados por los médicos y los autoinformados en el mismo análisis; sin embargo, si los investigadores informaron ambos, se utilizaron de preferencia las escalas calificadas por los médicos. Si los investigadores no presentaron resultados calificados por los médicos, se utilizaron los resultados autoinformados. Cada grupo no incluyó suficientes ensayos para que estos resultados se informaran por separado mediante análisis de subgrupos.
Métodos de búsqueda para la identificación de los estudios
Cochrane Specialised Registers: Cochrane Common Mental Disorders Clinical Trials Register (CCMD‐CTR)
The Cochrane Common Mental Disorders Group maintains a specialised register of randomised controlled trials ‐ the CCMD‐CTR. This register contains more than 39,000 reference records (reports of RCTs) on depression, anxiety, and other common mental disorders. A percentage of the reference records have been tagged to 12,500 individual, PICO‐coded study records (with coding based on the EU‐PSI (Evidence‐Based Treatment in Mental Health and Optimised Use of Databases) Coding Manual). Reports of RCTs for inclusion in the Register are collated from (weekly) generic searches of MEDLINE, Embase, and PsycINFO; quarterly searches of the Cochrane Central Register of Controlled Trials (CENTRAL); and review‐specific searches of additional databases. Reports of trials were also derived from international trial registries and drug companies; through handsearching of key journals; and via electronic searches of conference proceedings and other (non‐Cochrane) systematic reviews and meta‐analyses. Details of core CCMD search strategies can be found on the CCMD Group website.
Búsquedas electrónicas
We searched the CCMD‐CTR (studies and references) (all years to 10 June 2016) using the following terms:
((acupunct* or acupress* or acupoints* or electroacupunct* or electro‐acupunct* or auriculotherap* or auriculoacupunct* or moxibust*) and (depress* or "affective disorder*" or "affective symptoms" or mood)):ti,ab,kw,ky,emt,mh,mc.
We did not systematically search Chinese language‐only databases for this version of the review; therefore trials meeting our selection criteria beyond those identified may exist. We identified a significant number of Chinese language trials through other search strategies (reported above), and a large number did not meet the inclusion criteria.
We searched the following eight electronic Korean medical databases using the same terms as above, without restricting language, from their respective inceptions up to June 2016: the Korean Studies Information Service System (KISS), Korean article database website (DBPIA), Korea Institute of Science and Technology Information, the Research Information Service System (RISS), Korea Med, the Korean Medical Database (KM Base), and the Oriental Medicine Advanced Searching Integrated System (OASIS). In addition, we searched the following Korean language journals: Journal of Korean Medicine, Korean Journal of Acupuncture, Journal of Pharmacopuncture, Journal of Acupuncture and Meridian Studies, Korean Journal of Joongpoong, Journal of Korean Acupuncture & Moxibustion Medicine Society, Journal of Korean Oriental Internal Medicine, Journal of Oriental Obstetrics and Gynecology, Journal of Society of Korean Medicine for Obesity Research, Journal of Oriental Neuropsychiatry, and Journal of Sasang Constitutional Medicine.
We applied no restrictions on publication date or status when conducting these searches.
We searched international trial registries via the World Health Organization trials portal (ICTRP), the Chinese clinical trial registry (www.chictr.org.cn), and the US National Library of Medicine database (ClinicalTrials.gov) to identify unpublished and ongoing studies.
Búsqueda de otros recursos
Grey literature
We searched sources of grey literature including dissertations and theses, clinical guidelines, and reports from regulatory agencies (when appropriate).
-
ProQuest Dissertations and Theses Database.
-
National Guideline Clearing House (http://guideline.gov).
-
OpenGrey (http://www.opengrey.eu/).
Handsearching
We handsearched relevant conference proceedings by referring to lists of publications in manuscripts.
Reference lists
We checked the reference lists of all included studies and relevant systematic reviews to identify additional studies missed by the original electronic searches (e.g. unpublished or in‐press citations). We conducted a cited reference search on the Web of Science.
Correspondence
We contacted trialists and subject experts to ask for information on unpublished or ongoing studies, or to request additional trial data.
Obtención y análisis de los datos
Selección de los estudios
Two review authors (of CS, MA, PH, HM, MS, L‐QW) reviewed all articles. Review authors independently screened titles and abstracts for potential inclusion of all studies identified as a result of the search and coded them as 'retrieve' (eligible or potentially eligible) or 'do not retrieve'. We retrieved full‐text study reports/publications, and two review authors (for all authors of the review) independently screened full‐texts, identified studies for inclusion, and identified and recorded reasons for exclusion of ineligible studies. We resolved disagreements through discussion or, if required, consulted a third review author (of PH, HM, CS). We identified and excluded duplicate records and collated multiple reports related to the same study, so that each study rather than each report is the unit of interest in the review. We recorded the selection process in sufficient detail to complete a PRISMA flow diagram.
Extracción y manejo de los datos
Following assessment for inclusion, we assessed the methods used by each trial. All review authors independently extracted onto hard copy data sheets trial data on participants, methods, interventions, outcomes, and results. We sought missing data or clarification of study details from respective trial authors by mail or by email.
Main planned comparisons
-
Acupuncture versus wait list control/treatment as usual/no treatment
-
Acupuncture versus control acupuncture
-
Acupuncture versus pharmacological therapies
-
Acupuncture plus medication versus medication alone
-
Acupuncture versus psychological therapies (including counselling)
Evaluación del riesgo de sesgo de los estudios incluidos
Two or more review authors independently assessed risk of bias for each study using the criteria outlined in the Cochrane Handbook for Systematic Reviews of Interventions (Higgins 2011). We resolved disagreements by discussion or by consultation with a third party, when necessary. We assessed risk of bias according to the following domains.
-
Random sequence generation.
-
Allocation concealment.
-
Blinding of participants and personnel.
-
Blinding of outcome assessment.
-
Incomplete outcome data.
-
Selective outcome reporting.
-
Other bias.
We judged each potential source of bias as high, low, or unclear and provided a supporting quotation from the study report together with a justification for our judgement in the 'Risk of bias' table. We summarised risk of bias judgements across different studies for each of the domains listed. We considered blinding separately for different key outcomes when necessary (e.g. for unblinded outcome assessment). When information on risk of bias was related to unpublished data or correspondence with a trialist, we noted this in the 'Risk of bias' table.
When considering treatment effects, we took into account the risk of bias for studies that contributed to that outcome. For assessments of overall quality of the evidence for each outcome that included pooled data, we used the GRADE method to determine evidence quality, downgrading evidence from high quality by one level for serious (or two for very serious) issues with risk of bias, indirectness of evidence, serious inconsistency, imprecision of effect estimates, or potential publication bias.
Medidas del efecto del tratamiento
We performed statistical analysis using Review Manager 5 (Revman 2014) software.
We undertook a statistical summary of the data and expressed dichotomous data as risk ratios (RRs) with corresponding 95% confidence intervals (95% CIs). We expressed continuous data as mean differences (MDs) with 95% CIs, or as standardised mean differences (SMDs) if outcomes were conceptually the same but were measured in different ways, for example, by using different instruments (e.g. BDI, HAMD).
Cuestiones relativas a la unidad de análisis
Trials with multiple groups
We included trials with multiple groups and described them in the Characteristics of included studies table. For example, acupuncture might be compared with sham acupuncture, and with no acupuncture in another study group. If investigators included two acupuncture groups, we combined data from both treatment groups. For studies using a sham control and including no treatment control group, we evenly divided shared interventions between groups, as described in the Cochrane Handbook for Systematic Reviews of Interventions (Higgins 2011). When outcomes were repeated measures, we conducted analysis of outcomes at completion of the intervention.
Cluster‐randomised trials
We included cluster‐randomised trials in analyses along with individually randomised trials. We adjusted their [sample sizes or standard errors] using methods described in the Cochrane Handbook for Systematic Reviews of Interventions[Section 16.3.4 or 16.3.6] and provided an estimate of the intracluster correlation coefficient (ICC) derived from trial data (if possible), from a similar trial, or from a study of a similar population. If we used ICCs from other sources, we reported this and conducted sensitivity analyses to investigate effects of variation in the ICC. If we identified both cluster‐randomised and individually randomised trials, we planned to synthesise relevant information. We considered it reasonable to combine results from both types of trials if we noted little heterogeneity between study designs, and if we considered interaction between effects of the intervention and choice of the randomisation unit unlikely. We also acknowledged heterogeneity in the randomisation unit and performed a subgroup analysis to investigate effects of the randomisation unit.
Manejo de los datos faltantes
We contacted investigators or study sponsors to verify key study characteristics and to obtain missing numerical outcome data when possible (e.g. when we identified a study in abstract format only). We documented all correspondence with trialists and reported in the full report which trialists responded. When it was unclear whether an intention‐to‐treat (ITT) analysis was performed, we contacted trial authors to request confirmation. In most cases, we obtained extracted data directly from the study itself; these data may represent available case data only. If possible, we calculated data using methods that enable this (e.g. if standard deviations are missing, it may be possible to calculate these from confidence intervals, standard errors, t values, or the like, using methods outlined in Higgins 2011, Section(s) 7.7.3.2 and 7.7.3.3). We sought statistical advice on imputation and attempted this only if most trials in the meta‐analysis provided complete statistics (Higgins 2011).
Evaluación de la heterogeneidad
We investigated heterogeneity between studies by using the I2 statistic (I2 greater than or equal to 50% was considered indicative of heterogeneity). We formally tested heterogeneity by examining the P value of the I2 statistic. When determining the importance of heterogeneity, we took into account the magnitude and direction of effects; and the strength of evidence for heterogeneity (the P value from the Chi2 test or the width of the confidence interval for the I2 statistic).
We interpreted the I2 statistic as follows.
-
10% to 40%: might not be important.
-
30% to 60%: may represent moderate heterogeneity.
-
50% to 90%: may represent substantial heterogeneity.
-
75% to 100%: considerable heterogeneity.
When we detected heterogeneity greater than 75%, we rechecked the data and if necessary contacted study authors to confirm the accuracy of data as reported in the journal article.
Evaluación de los sesgos de notificación
Reporting biases arise when dissemination of research findings is influenced by the nature and direction of results (Higgins 2011). We investigated potential biases of publication using the funnel plot or another analytical method (Egger 1997). If we included 10 or more studies in the meta‐analysis, we investigated reporting biases (such as publication bias) by assessing funnel plot asymmetry visually. If asymmetry was suggested by visual assessment, we explored possible reasons by performing the tests proposed in the Cochrane Handbook for Systematic Reviews of Interventions (Higgins 2011).
Síntesis de los datos
We used a random‐effects model to pool the results of all studies because this model is more conservative than a fixed‐effect model, and it incorporates both within‐study and between‐study variance. This change from the original protocol was due to the heterogeneity of studies.
If data were not reported in a form that would allow inclusion in the meta‐analysis, we reported the findings narratively.
Análisis de subgrupos e investigación de la heterogeneidad
Effects of acupuncture may be influenced by mode of stimulation and style of acupuncture administered. We planned to undertake prespecified subgroup analysis to examine effects of the mode of acupuncture stimulation used (i.e. manual, electro‐acupuncture, or laser); and different acupuncture styles applied (e.g. classical/traditional acupuncture vs single‐point therapy, auricular acupuncture). We also planned to conduct a subgroup analysis of different forms of acupuncture by using a classification of invasive and non‐invasive controls that may be influenced by bias derived from unblinding and physiological activity.
When we identified other psychological and pharmacological interventions, we planned to conduct subgroup analysis for the control groups (i.e. CBT vs BT or TCA vs SSRI). We planned to conduct other subgroup analyses to explore effects of treatment among people with different diagnoses (e.g. major depression, dysthymia) and people of different ages (< 65 years and ≥ 65 years).
We planned to conduct an a posteriori subgroup analysis to examine effects of the number of acupuncture treatment sessions provided (< 20 sessions and ≥ 20 sessions) and another analysis to examine outcomes of clinician‐rated versus self‐rated depression scales. We were unable to perform any of the subgroup analyses planned, as all subgroups included too few studies (fewer than five studies).
Análisis de sensibilidad
A priori, we planned to perform sensitivity analyses of results to look at the possible contribution of:
-
excluding trials that did not clearly report the randomisation process;
-
excluding trials with unclear concealment of random allocation; and
-
excluding trials reporting dropout greater than 20%.
We planned to perform an a posteriori sensitivity analysis to examine the contribution of overall trial quality by excluding trials rated as having overall high risk. We defined trials as having overall high risk if they had high risk of bias in any two or more domains. We defined trials as having overall low risk if they had low risk of bias for randomisation, allocation, and both performance and detection blinding.
'Summary of findings' tables
We prepared 'Summary of findings' tables using GRADEproGDT. These tables present the overall quality of the body of evidence for five comparisons reporting on primary review outcomes at completion of the intervention (severity of depression, adverse events), according to GRADE criteria (study limitations, consistency of effect, imprecision, indirectness, and publication bias). We justified, documented, and incorporated into reporting of results judgements about evidence quality (high, moderate, low) for each outcome.
Results
Description of studies
Results of the search
In total, we retrieved 559 articles through updated searches, and 559 remained after de‐duplication. Two review authors (CS, HM) read the titles and abstracts of all articles retrieved in English, one review author read those provided in Korean (MSL), and another review author read those written in Chinese (LQW). Another review author (PH) resolved discrepancies. We excluded 268 articles on the basis of title or abstract and retained 291 articles for inspection of the full‐text article for eligibility. We excluded a total of 227 studies after reading the full text; we have included in the Excluded studies section only studies reviewed on the basis of title or abstract that did not meet the review inclusion criteria. We included 34 new trials and excluded another 42 studies.
The previous version of this review included 30 trials and excluded 11 trials. See Characteristics of included studies, Characteristics of excluded studies, Characteristics of studies awaiting classification, and Characteristics of ongoing studies. This update includes 64 studies with 7104 participants and excludes 53 studies. See Figure 1.

Study flow diagram.
Included studies
Design
All trials used a parallel‐group design, 43 trials included two groups (acupuncture plus a control group), and 21 trials included three groups. We adjusted the unit of analysis for trials including multiple groups on the basis of the description of study methods provided.
Control groups varied between studies according to the research question. A total of 43 trials used medication alone, and four used control acupuncture combined with medication. Two trials used counselling, one trial usual care, and three trials a wait list. Control acupuncture groups included in four trials used sham inactive laser or electro‐acupuncture technique, four used the non‐invasive placebo sham needle, and three used both minimal and sham types of acupuncture.
Sample size
Sample sizes of studies included in this review ranged from 19 in Whiting 2008 to 755 in MacPherson 2013, with a median of 75 participants in each study.
Setting
A total of 51 studies were undertaken in China, three in the USA, three in Hong Kong, three in Germany, two in Australia, and two in the United Kingdom. Eleven studies recruited participants from both inpatient and outpatient hospital settings, 20 from inpatient settings, 16 from outpatient settings only, and six from the community via advertising or primary care settings; in 11 trials, the setting was unclear.
Participants
Trials recruited participants who met the diagnostic criteria for depression, or who had a clinical presentation of depression as defined by trial authors. Thirteen trials used the DSM (II, III, IV, or V), 33 used the CCMD (2 or 3), and eight used ICD Tenth Revision (ICD‐10) criteria. Ten trials recruited participants on the basis of a clinical presentation of depression. Two trials recruited participants only on the basis of BDI scores ≥ 12, and four used HAMD scores alone. Two trials used the Zung Self‐rating Depression Scale (SDS), one used the Clinical Interview Schedule Revised (CIS‐R; Whiting 2008), and one used Chinese Neuroscience Society diagnostic guidelines (He 2005). Inclusion criteria in addition to ICD‐10, DSM, or CCMD diagnosis were specified as HAMD score > 18 in 29 trials and HAMD score < 18 in five trials; remaining trials did not report a specific required HAMD score for entry.
Interventions
Trials delivered acupuncture that varied in terms of point selection, frequency of treatment, and total number of treatments administered. Most trials (46) used a standardised treatment protocol with a fixed selection of points administered at each acupuncture session. Selection of points varied and included acupuncture points located on arms, legs, abdomen, and head. Fourteen trials used a semi‐standardised treatment protocol consisting of a predefined set of acupuncture points used in combination with acupuncture points selected on the basis of diagnosis and identification of symptomatic patterns. Four trials administered individualised treatment for study participants on the basis of their diagnosis.
A total of 42 trials reported needling duration between 20 and 30 minutes. Needling duration was 30 to 60 minutes in 10 trials. Twelve trials provided no or unclear details.
Three trials provided fewer than 10 sessions, 19 trials between 12 and 18 sessions, and 38 trials between 21 and 60 sessions; four trials did not report the number of sessions. Included trials provided a median of 30 sessions.
One trial provided twice‐daily treatment (He 2007), and 12 trials reported daily treatment. Nineteen trials treated participants five or six days per week. Twenty‐six trials treated participants one to three times a week, and in six trials, treatment frequency was unclear. Some trials started with more frequent treatments before reducing frequency to weekly sessions.
Twenty‐five trials were of six weeks' duration, 17 were of six and a half to 12 weeks' duration, and 17 were of less than six weeks' duration. Duration of treatment was unclear in five trials.
Most trials (42) used manual acupuncture, 13 used electro‐acupuncture, seven used a combination of manual and electro‐acupuncture, and two used laser acupuncture.
Outcomes
Most trials assessed depression using HAMD as the primary outcome measure. Fifty‐four trials used HAMD as the primary outcome measure. Two trials used BDI as the primary outcome, two used CGI‐S, two used SDS, one used Symptom Checklist‐90 (SCL‐90), one used PHQ‐9, and two used a custom scale.
Excluded studies
We excluded 53 trials (see Characteristics of excluded studies). Fourteen studies did not meet the inclusion criteria for the control group (as specified in the methods) owing to a suboptimal dose of medication, lack of a suitable comparison group (as outlined under Types of interventions), or the fact that a non‐specified control group was used. Twenty trials provided data from participants who did not meet the diagnosis for depression. Three trials were duplicate publications in another language or used the same data set as included trials. One trial examined the effect of acupuncture on autonomic function in patients with depression or anxiety, and one trial examined the effect of acupuncture on menopausal symptoms in women with depression. Neither of these studies treated or evaluated the effect of acupuncture on depression. Three trials were quasi‐randomised; five used an intervention that was combined with another active intervention such as herbs; and six were identified as not randomised. We have presented further background information on these trials in the Characteristics of excluded studies section.
Ongoing studies
We identified 14 trials from clinical trial registries as ongoing (see Characteristics of ongoing studies).
Studies awaiting classification
We classified 17 trials as awaiting classification. Fourteen trials were awaiting confirmation of randomisation details, results of two studies were not available, the diagnosis was unclear in one study, and details of treatment required clarification in another trial (see Studies awaiting classification).
New studies found at this update
This update includes 34 new trials (Andreescu 2011;Bosch 2015;Chung 2015;Du 2005;Duan 2011;Fan 2013;Feng 2011;Fu 2006;He 2012;Huang 2013;Li 2008;Li 2011b;Lin 2012;Liu 2006;Liu 2013a; Liu 2015;Lv 2015;Ma 2011;Ma 2012;MacPherson 2013;Pei 2006;Qiao 2007;Qu 2013;Quah‐Smith 2013;Sun 2010;Sun 2013;Sun 2015b;Wang 2014;Wang 2015;Xiao 2014;Xu 2011;Yeung 2011b;Zhang 2005a;Zhang 2007a;Zhang 2009;Zhang 2012), for a total of 64 included trials. We excluded 42 trials since the last update (Arvidsdotter 2014; Bennett 1997; Bergmann 2014; Bin 2007; Carvalho 2013; Chang 2009; Chang 2010, Cocchi 1977; Deng 2013; Dormaemen 2011; Duan 2009;Fan 2015b;Guo 2009;He 2011; Hmwe 2015; Honda 2012; Hou 1996; Hu 2013; Huang 2003;Huo 2013; Khang 2002; Kim 2015; Li 2011; Liu 2013;Man 2014; Mischoulon 2012; Niu 2006; Shi 2014;Sun 2012; Tang 2003b; Tse 2010; Wang 2003; Wang 2006; Wang 2015; Wu 2010; Xie 2009; Xie 2012; Yeung 2011; Zhang 2004; Zhang 2004b; Zhao 2014; Zhou 2015), for a total of 53 excluded trials.
Risk of bias in included studies
See Figure 2 and Figure 3 for a graphical summary of risk of bias assessments performed by review authors for the 64 included studies, based on the seven risk of bias domains. Trial authors described three trials as having low risk of bias for all domains (Andreescu 2011;Chung 2015; Yeung 2011b). Four trials were at low risk of bias for five domains.

Methodological quality graph: review authors' judgements about each methodological quality item presented as percentages across all included studies.

Review authors' judgements about each 'risk of bias' domain for each included study.
Investigators described all trials as randomised.
Allocation
Using Cochrane criteria that rate the adequacy of random allocation concealment, we rated most trials as having low risk (75%; n = 48) and rated no trials as having high risk of bias.
A total of 22 trials used a randomisation sequence that was computer generated, 30 used random tables, two used lot drawing, and Quah‐Smith 2005 used coded beans.
A total of 18 trials assessed allocation concealment as being at low risk of bias; in most trials (46), this was unclear. Five trials performed central randomisation, and 11 trials reported using sealed opaque envelopes. Forty‐six trials did not report the method of allocation, or we assessed their risk as unclear.
Blinding
We assessed blinding as providing low risk of performance bias in 14 trials. Most trials involved comparisons of acupuncture versus medication and could not be blinded; this contributed to assessment of high risk. We assessed a total of 48 trials as having high risk for performance bias. For studies comparing acupuncture versus a sham or placebo acupuncture control, we sought evidence of verification of blinding of participants. We rated 10 trials as having low risk of detection bias. Most trials (35) did not report on blinding of the assessor/clinician or the analyst or used patient‐reported outcome measures.
Incomplete outcome data
We assessed most (37) trials as having low risk of bias for outcome reporting. Eight trials were at high risk owing to dropout or incomplete data ,and reporting bias was unclear in 19 trials. We rated trials as having high risk of bias if dropout rates were uneven between groups and the reason for dropout was related or suspected to be related to group allocation. We also rated trials as having high risk for bias if investigators reported a dropout rate > 20% and did not report how they dealt with this (e.g. ITT analysis, last observation carried forward).
Selective reporting
We rated risk of bias from selective reporting as unclear for most trials owing to no available study protocol. We rated two trials as having high risk of bias and found that Li 2007 did not report data on all included outcomes.
Other potential sources of bias
Risk of bias was unclear for most trials (31). We rated risk from other sources of bias as low for 29 trials. We assessed an imbalance at randomisation in eight trials (Allen 1998;Ding 2003;Fan 2005;Fu 2008;Luo 1988;Luo 1998;Whiting 2008;Xiujuan 1994). We rated trials at high risk of bias if we noted significant baseline imbalance between groups, and at unclear risk if trial authors did not report a baseline analysis.
Effects of interventions
See: Summary of findings for the main comparison Acupuncture compared with no treatment/wait list/treatment as usual for depression; Summary of findings 2 Acupuncture compared with control acupuncture for depression; Summary of findings 3 Acupuncture compared with medication for depression; Summary of findings 4 Acupuncture plus medication compared with medication for depression; Summary of findings 5 Acupuncture compared with psychological therapy for depression
Within each comparison, for each outcome, the overall treatment effect for acupuncture versus control is followed by the individual treatment effect for each mode of stimulation, presented as a series of subcomparisons. Primary endpoint data at the end of the intervention are presented. Data are presented for severity of depression during treatment, at the end of the intervention, and at follow‐up at zero to six months and at six to 12 months.
Comparison 1. Acupuncture versus no treatment/wait list/treatment as usual
Primary outcomes
1.1 Outcome: reduction in the severity of depression at the end of treatment

Forest plot of comparison: 1 Acupuncture versus no treatment/wait list/TAU, outcome: 1.1 Severity of depression at the end of treatment.
Overall six trials of acupuncture provided low‐quality evidence that acupuncture reduced the severity of depression at the end of treatment (SMD ‐0.66, 95% CI ‐1.06 to ‐0.25, six trials, 488 participants, I2 = 64%). We downgraded the evidence for this comparison by two levels owing to high risk of performance bias in most included trials and substantial heterogeneity.
We explored possible reasons for substantial heterogeneity by examining the contributions of clinician‐rated versus self‐rated outcome measures. We found that two trials used self‐rated outcomes. Bosch 2015 and MacPherson 2013 contributed to a significant proportion of this heterogeneity; therefore we analysed clinician‐rated versus self‐reported outcomes separately. The three trials using clinician‐rated outcomes provided evidence of a reduction in the severity of depression at the end of the trial (SMD ‐0.97, 95% CI ‐1.34 to ‐0.60, three trials, 144 participants, I2 = 5%), and the two trials using self‐reported outcomes provided no evidence of a reduction in the severity of depression at the end of the trial (SMD ‐0.23, 95% CI ‐0.73 to 0.27, two trials, 334 participants, I2 = 68%).
Evidence suggested a reduction in depression for manual acupuncture compared with control (SMD ‐0.56, 95% CI ‐0.98 to ‐0.15, five trials, 458 participants, I2 = 62%) and electro‐acupuncture (SMD ‐1.26, 95% ‐2.10 to ‐0.43, one trial, 30 participants).
1.2 Outcome: adverse events
One study reported this outcome. This trial of manual acupuncture found low‐quality evidence of no difference in adverse event rates between groups (RR 0.89, 95% 0.35 to 2.24, one trial, 302 participants). We downgraded the evidence for this comparison by two levels owing to high risk of performance bias and the fact that only one trial reported on these relatively rare events.
Secondary outcomes
1.3 Outcome: reduction in the severity of depression during treatment
Data show some evidence of reduction in the severity of depression during treatment (MD ‐6.75, 95% CI ‐9.12 to ‐4.38, two trials, 137 participants, I2 = 21%).
A trial of manual acupuncture found a reduction in the severity of depression (MD ‐7.04, 95% ‐11.08 to ‐3.00, two trials, 107 participants, I2 = 58%), as did a small trial of electro‐acupuncture (MD ‐6.24, 95% CI ‐9.12 to ‐4.38, one trial, 30 participants).
1.4 Outcome: reduction in the severity of depression zero to six months after treatment
Data show a reduction in depression from manual acupuncture at six months following completion of treatment (MD ‐1.90, 95% CI ‐3.01 to ‐0.79, one trial, 237 participants).
1.5 Outcome: reduction in the severity of depression six to 12 months after treatment
Researchers found no evidence of a reduction in depression from manual acupuncture at 12 months (MD ‐1.00, 95% CI ‐2.53 to 0.53, one trial, 235 participants).
1.6 Outcome: remission of depression
Two small trials found no evidence of a difference in remission of depression from manual acupuncture (RR 1.67, 95% CI 0.77 to 3.65, two trials, 94 participants, I2 = 0%) (Allen 1998; Allen 2006).
1.7 Outcome: change in medication
One trial found no evidence of a difference in medication change from manual acupuncture compared with control (RR 0.91, 95% CI 0.73 to 1.14, one trial, 302 participants) (MacPherson 2013).
1.8 Dropout from treatment
One trial found no difference in dropout at the end of manual acupuncture treatment compared with control (RR 1.00, 95% CI 0.21 to 4.88, one trial, 302 participants) (MacPherson 2013).
Comparison 2. Acupuncture versus control acupuncture
Comparisons are made between invasive and non‐invasive controls. Invasive controls included non‐channel points (Andreescu 2011; Fan 2005; Fu 2006; Li 2008; Li 2011b), needling acupuncture points unrelated to depression (Allen 1998; Allen 2006), minimal insertion just into the skin layer (Fan 2013), different acupuncture points (Sun 2010; Sun 2013), and minimal insertion on specific non‐depression points (Chung 2015; Whiting 2008; Yeung 2011b). Non‐invasive controls included placebo needles (Chung 2015; Fan 2013; Yeung 2011b), mock electro‐acupuncture (Andreescu 2011; Yeung 2011b), and mock laser acupuncture (Quah‐Smith 2005; Quah‐Smith 2013).
Primary outcomes
2.1 Severity of depression at the end of treatment

Forest plot of comparison: 2 Acupuncture versus control acupuncture, outcome: 2.1 Severity of depression at the end of the intervention.
Low‐quality evidence suggests a reduction in the severity of depression between acupuncture and control at the end of the trial; however, substantial heterogeneity can likely be explained by the mode of stimulation and activity from the control (MD ‐1.69, 95% CI ‐3.33 to ‐0.05, 14 trials, 841 participants, I2 = 80%). We downgraded evidence by one level in most studies for high risk of performance bias and high risk of bias in at least one other domain. We also downgraded evidence by one level on the basis of substantial heterogeneity.
2.1.1 Manual acupuncture versus invasive control
We found no evidence of a reduction in the severity of depression in the acupuncture group compared with an invasive control group (MD ‐2.97, 95% CI ‐6.26 to 0.31, seven trials, 418 participants, I2 = 81%). Clinical heterogeneity among types of invasive controls is likely a contributing factor. Fan 2013, using SCL‐90, found evidence suggesting that acupuncture reduced the severity of depression to a greater extent than the invasive control (MD ‐0.44, 95% CI ‐0.58 to ‐0.30, 95 participants).
2.1.2 Electro‐acupuncture versus invasive control
Trials provided no evidence of a difference between groups (MD 0.43, 95% ‐0.54 to 1.4, five trials, 251 participants, I2 = 0%).
2.1.3 Electro‐acupuncture versus non‐invasive control
Data show no evidence of a reduction in depression between groups (MD 0.17, 95% CI ‐2.14 to 2.48, two trials, 99 participants, I2 = 35%).
2.1.4 Laser acupuncture versus non‐invasive control
Researchers found evidence of reduced depression in the laser acupuncture group compared with the control group (MD ‐5.51, 95% CI ‐8.30 to ‐2.73, two trials, 73 participants, I2 = 0%).
2.2 Adverse events
Overall moderate‐quality evidence shows no difference in the rate of adverse events between acupuncture groups and control groups (RR 1.63, 95% 0.93 to 2.86, five trials, 300 participants, I2 = 10%). We downgraded this evidence by one level owing to the small sample size and the relatively rare nature of adverse events.
2.2.1 Manual acupuncture versus invasive control
One trial reported on this outcome (Whiting 2008), providing no evidence of a difference between groups (RR 2.50, 95% CI 0.15 to 40.37, one trial,17 participants). One additional trial reported on this outcome using continuous data suggesting increased risk of adverse events from acupuncture (MD 8.30, 95% CI 6.88 to 9.72, one trial, 43 participants) (Li 2011b).
2.2.2 Electro‐acupuncture versus invasive control
Investigators found no evidence of a difference between groups (RR 1.79, 95% CI 0.99 to 3.25, four trials, 245 participants, I2 = 16%).
2.2.3 Electro‐acupuncture versus non‐invasive control
One trial reported on this outcome and provided no evidence of differences between groups (RR 0.40, 95% CI 0.05 to 3.08, one trial, 39 participants) (Yeung 2011b).
2.2.4 Laser acupuncture versus non‐invasive control
Quah‐Smith 2013 reported no difference in the rate of adverse events between laser and sham laser acupuncture. Researchers collected adverse event data on dizziness, aches, transient fatigue, prolonged fatigue, vagueness, and nausea. On a 0 to 6 scale (6 indicating maximum intensity), mean scores were as follows: minimal transient fatigue in the laser group ‐ 0.67, and in the sham laser group, aches 0.11, transient fatigue 1.0, days of fatigue 0.71, and vagueness 0.52.
Secondary outcomes
2.3 Severity of depression during treatment
Data show no evidence of a difference between groups in the severity of depression during treatment (MD 0.04, 95% CI ‐0.81 to 0.90, six trials, 413 participants, I2 = 0%).
2.3.1 Manual acupuncture versus invasive control
We found no evidence of a difference between manual acupuncture and control (MD 0.09, 95% CI ‐2.55 to 2.74, two trials, 117 participants, I2 = 2%).
2.3.2 Electro‐acupuncture versus invasive control
Trials provided no evidence of a difference between electro‐acupuncture and control (MD 0.16, 95% CI ‐0.92 to 1.24, four trials, 197 participants, I2 = 0%).
2.3.3 Electro‐acupuncture versus non‐invasive control
Data show no evidence of a difference between electro‐acupuncture and control (MD ‐0.45, 95% CI ‐2.71 to 1.80, two trials, 99 participants, I2 = 37%).
2.4 Severity of depression at zero to six months' follow‐up
2.4.1 Manual acupuncture versus invasive control
One trial reported on this outcome (Fan 2013), providing evidence of benefit at six months (MD ‐0.85, 95% CI ‐0.98 to ‐0.72, one trial, 95 participants).
2.5 Remission of depression
Overall evidence showed a greater remission rate following acupuncture (RR 1.91, 95% 1.14 to 3.21, 10 trials, 601 participants, I2 = 48%).
2.5.1 Manual acupuncture versus invasive control
Data show no evidence of improvement in remission rates between groups (RR 1.89, 95% CI 0.75 to 4.75, five trials, 368 participants, I2 = 63%).
2.5.2 Electro‐acupuncture versus invasive control
Trials provided no evidence of improvement in remission rates between groups (RR 1.23, 95% 0.35 to 4.29, two trials, 87 participants, I2 = 20%).
2.5.3 Electro‐acupuncture versus non‐invasive control
We found no evidence of improvement in remission rates between groups (RR 2.15, 95% CI 0.60 to 7.67, one trial, 73 participants).
2.5.4 Laser acupuncture versus non‐invasive control
Evidence suggests greater remission from laser acupuncture compared with control (RR 3.00, 95% CI 1.48 to 6.09, two trials, 73 participants, I2 = 0%).
2.6 Quality of life (emotional) during treatment
One trial reported on this outcome (Chung 2015), providing no evidence of a difference between groups (MD ‐1.98, 95% CI ‐5.41 to 1.45, one trial, 150 participants).
2.6.1 Electro‐acupuncture versus invasive control
Investigators provided no evidence of a difference between groups (MD ‐2.09, 95% CI ‐6.54 to 2.36, one trial, 90 participants).
2.6.2 Electro‐acupuncture versus non‐invasive control
Data show no evidence of a difference between groups (MD ‐1.81, 95% CI ‐7.18 to 3.56, one trial, 60 participants).
2.7 Quality of life (emotional) at the end of treatment
Two trials reported on this outcome and provided moderate evidence of no difference in emotional quality of life between groups (MD ‐2.25, 95% CI ‐5.89 to 1.39, two trials, 167 participants, I2 = 0%). We downgraded the evidence for this comparison by one level owing to the small sample size.
2.7.1 Manual acupuncture versus invasive control
Researchers provided no evidence of a difference between groups (MD ‐5.0, 95% CI ‐36.47 to 26.47, one trial, 17 participants). One trial reported on changes from baseline between groups and described no difference between groups (acupuncture 6.2 (13.6) vs control 14.1 (17.5)) (Andreescu 2011).
2.7.2 Electro‐acupuncture versus invasive control
Data show no evidence of a difference between groups (MD ‐2.55, 95% CI ‐7.38 to 2.28, one trial, 90 participants).
2.7.3 Electro‐acupuncture versus non‐invasive control
We found no evidence of a difference between groups (MD ‐1.76, 95% CI ‐7.38 to 3.86, one trial, 60 participants).
2.8 Quality of life (physical) during treatment
One trial reported on this outcome and found no differences between groups (MD ‐0.99, 95% CI ‐4.74 to 2.77, 150 participants) (Chung 2015).
2.8.1 Electro‐acupuncture versus invasive control
Investigators provided no evidence of a difference between groups (MD ‐2.62, 95% CI ‐7.07 to 1.83, one trial, 90 participants).
2.8.2 Electro‐acupuncture versus non‐invasive control
Data show no evidence of a difference between groups (MD 1.26, 95% CI ‐4.12 to 6.64, one trial, 60 participants).
2.9 Quality of life (physical) at the end of treatment
One trial reported on this outcome (Chung 2015), revealing that at the end of treatment, low‐quality evidence suggested no differences between groups in quality of life (MD ‐5.12, 95% CI ‐10.30 to 0.13, one trial, 150 participants). We downgraded the evidence for this comparison by one level because only one small study contributed data for this outcome.
2.9.1 Electro‐acupuncture versus invasive control
Trialists provided evidence of improved quality of life for the control group (MD ‐7.61, 95% CI ‐12.38 to ‐2.38, one trial, 90 participants). One trial reported on changes from baseline between groups and described no differences between groups (acupuncture 0.5 (6.9) vs control ‐1.7 (8.0)) (Andreescu 2011).
2.9.2 Electro‐acupuncture versus non‐invasive control
Data show no evidence of a difference between groups (MD ‐2.23, 95% ‐7.81 to 3.35, one trial, 60 participants).
2.10 Change in medication
2.10.1 Electro‐acupuncture versus non‐invasive control
Investigators provided no evidence of a difference between groups (MD ‐0.39, 95% CI ‐1.71 to 0.93, one trial, 70 participants).
2.11 Dropout from treatment
We found no difference in dropout between groups (RR 1.04, 95% CI 0.62 to 1.75, seven trials, 501 participants, I2 = 0%).
2.11.1 Manual acupuncture versus invasive control
Researchers presented no evidence of a difference between groups (RR 0.60, 95% CI 0.16 to 2.29, one trial, 60 participants).
2.11.2 Electro‐acupuncture versus invasive control
Data show no evidence of a difference between groups (RR 1.01, 95% CI 0.51 to 2.02, four trials, 224 participants, I2 = 0%).
2.11.3 Electro‐acupuncture versus non‐invasive control
Investigators provided no evidence of a difference between groups (RR 1.48, 95% CI 0.56 to 3.91, four trials, 217 participants, I2 = 0%).
Comparison 3. Acupuncture versus medication
Primary outcomes
3.1 Severity of depression at the end of treatment
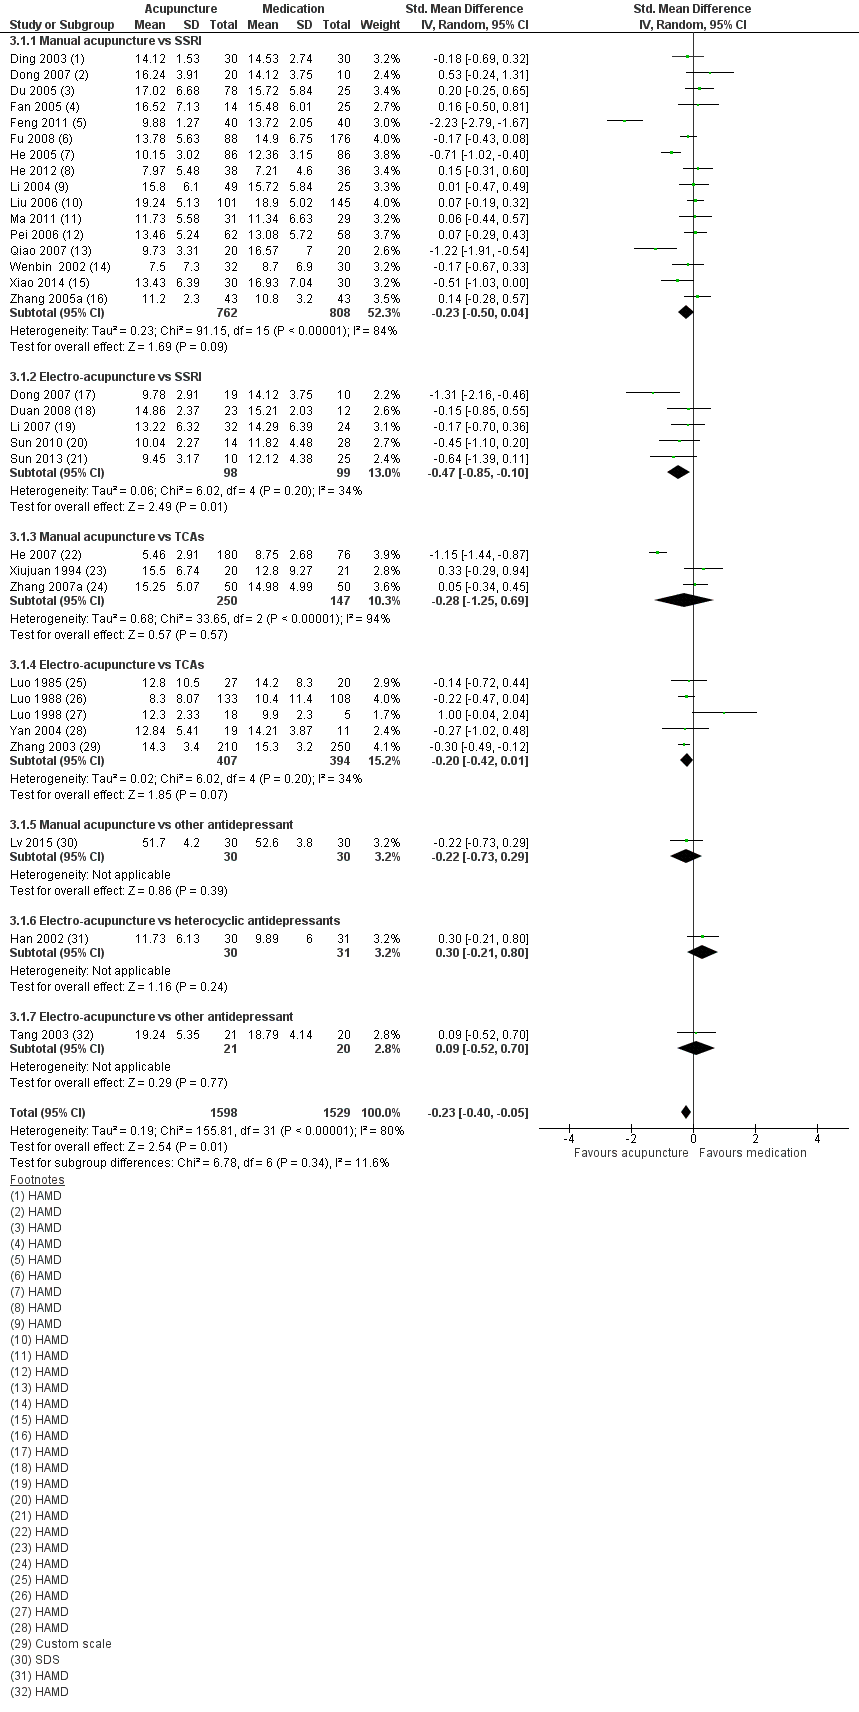
Forest plot of comparison: 3 Acupuncture versus medication, outcome: 3.1 Severity of depression at the end of treatment.
Overall very low‐quality evidence suggests small benefit from acupuncture compared with medication (SMD ‐0.23, 95% CI ‐0.40 to ‐0.05, 31 trials, 3127 participants, I2 = 80%). We explored possible reasons for substantial heterogeneity by examining the contribution of clinician‐rated versus self‐reported outcome measures. Only one study used a self‐reported outcome measure (Lv 2015). Removing this study from the analysis did not significantly reduce heterogeneity nor change the effect size (SMD ‐0.23, 95% CI ‐0.41 to ‐0.05, 30 trials, 3067 participants, I2 = 81%). We downgraded evidence for this comparison by two levels owing to very serious risk of bias, with 30 trials having high risk of bias owing to lack of blinding and 12 trials having high risk of bias owing to lack of blinding of outcome assessors. We also downgraded the evidence by one level because substantial heterogeneity was present.
3.1.1 Manual acupuncture versus SSRI
We found no evidence of benefit among groups (SMD ‐0.23, 95% CI ‐0.50 to 0.04, 16 trials, 1570 participants, I2 = 84%).
3.1.2 Electro‐acupuncture versus SSRI
Data show evidence of benefit from electro‐acupuncture compared with SSRI medication (SMD ‐0.47, 95% CI ‐0.85 to ‐0.10, five trials, 197 participants, I2 = 34%).
3.1.3 Manual acupuncture versus TCAs
Researchers provided no evidence of a reduction in the severity of depression between groups (SMD ‐0.28, 95% CI ‐1.25 to 0.69, three trials, 397 participants, I2 = 94%).
3.1.4 Electro‐acupuncture versus TCAs
Trials presented no evidence of a reduction in the severity of depression between groups (SMD ‐0.20, 95% CI ‐0.42 to 0.01, five trials, 801 participants, I2 = 34%).
3.1.5 Manual acupuncture versus other antidepressant
We found no evidence of a difference between groups (SMD ‐0.22, 95% CI ‐0.73 to 0.29, one trial, 60 participants).
3.1.6 Electro‐acupuncture versus heterocyclic antidepressants
Investigators provided no evidence of a difference between groups (SMD 0.30, 95% CI ‐0.21 to 0.80, one trial, 62 participants).
3.1.7 Electro‐acupuncture versus other antidepressant
We found no evidence of a difference between groups (SMD 0.09, 95% CI ‐0.52 to 0.70, one trial, 41 participants).
3.2 Adverse events
3.2.1 Manual acupuncture versus SSRI
All included studies used the Asberg side effect rating scale (SES). Data show very low‐quality evidence of an increase in adverse events reported by those taking SSRIs compared with manual acupuncture (MD ‐4.32, 95% CI ‐7.41 to ‐1.23, three trials, 481 participants, I2 = 97%). We downgraded the evidence by two levels owing to very serious risk of bias in all three studies, and by two levels owing to considerable heterogeneity.
Secondary outcomes
3.3 Severity of depression during treatment
Overall evidence suggests benefit from acupuncture during treatment regardless of mode of stimulation, and reduced depression compared with medication (MD ‐1.67, 95% CI ‐2.91 to ‐0.43, nine trials, 552 participants, I2 = 55%).
3.3.1 Manual acupuncture versus SSRIs
Investigators provided no evidence of a difference between groups (MD ‐1.38, 95% CI ‐3.2 to ‐0.45, five trials, 340 participants, I2 = 66%).
3.3.2 Electro‐acupuncture versus SSRIs
Data show evidence of a reduction in the severity of depression during treatment from electro‐acupuncture compared with SSRIs (MD ‐2.58, 95% CI ‐4.38 to ‐0.78, three trials, 112 participants, I2 = 29%).
3.3.3 Manual acupuncture versus TCAs
Researchers provided no evidence of a reduction in the severity of depression between groups (MD ‐0.80, 95% CI ‐3.65 to 2.05, one trial, 100 participants).
3.4 Severity of depression zero to six months after treatment
3.4.1 Manual acupuncture versus other antidepressant
We found evidence of benefit derived from manual acupuncture compared with other antidepressant (MD ‐5.60, 95% CI ‐7.60 to ‐3.60, one trial, 60 participants).
3.5 Remission of depression
Evidence suggests remission from acupuncture treatment when compared with medication only (RR 1.16, 95% CI 1.05 to 1.29, 27 trials, 2918 participants, I2 = 24%).
3.5.1 Manual acupuncture versus SSRI
Trialists reported no differences between groups (RR 1.16, 95% CI 0.98 to 1.37, 14 trials, 1332 participants, I2 = 11%).
3.5.2 Electro‐acupuncture versus SSRIs
Researchers described no differences between groups (RR 1.28, 95% CI 0.94 to 1.75, four trials, 188 participants, I2 =0 %).
3.5.3 Manual acupuncture versus TCAs
Investigators provided evidence of benefit in remission from manual acupuncture compared with TCAs (RR 1.32, 95% CI 1.03 to 1.69, four trials, 620 participants, I2 = 39%).
3.5.4 Electro‐acupuncture versus TCAs
Data show no evidence of differences between groups (RR 1.03, 95% CI 0.88 to 1.21, four trials, 778 participants, I2 = 25%).
3.6 Dropout from treatment
Overall no evidence suggests differences in dropout between groups (RR 0.87, 95% CI 0.20 to 3.71, five trials, 246 participants, I2 = 43%).
3.6.1 Manual acupuncture versus SSRIs
Data show no evidence of differences in dropout between groups (RR 0.27, 95% CI 0.03 to 2.47, two trials, 134 participants, I2 = 41%).
3.6.2 Electro‐acupuncture versus SSRIs
Researchers provided no evidence of differences in dropout between groups (RR 1.82, 95% CI 0.43 to 7.79, three trials, 112 participants, I2 = 3%).
Comparison 4. Acupuncture and medication versus medication
Primary outcomes
4.1 Severity of depression at the end of treatment
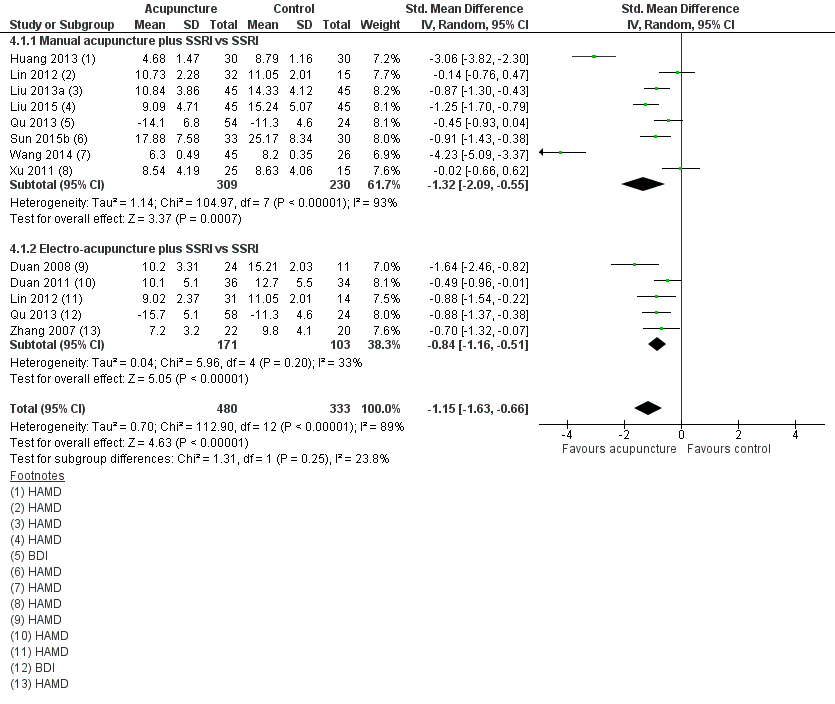
Forest plot of comparison: 4 Acupuncture plus medication vs medication, outcome: 4.1 Severity of depression at the end of treatment.
Overall very low‐quality evidence suggests benefit from acupuncture plus medication compared with medication alone (SMD ‐1.15, 95% CI ‐1.63 to ‐0.66, 12 trials, 813 participants, I2 = 89%).
We explored another possible contribution to the considerable heterogeneity by examining the contributions of clinician‐rated versus self‐reported outcome measures. One study used a self‐rated scale (Qu 2013). Removing this study from analysis did not reduce heterogeneity, which remained considerable (SMD ‐1.25, 95% CI ‐1.83 to ‐0.67, 11 trials, 653 participants, I2 = 91%). We downgraded the evidence for this comparison by two levels owing to the very serious risk of bias present in most trials, and by another two levels for considerable heterogeneity.
4.1.1 Manual acupuncture plus SSRI versus SSRI
We found evidence of a reduction in the severity of depression at the end of treatment from manual acupuncture plus SSRIs compared with SSRIs alone (SMD ‐1.32, 95% CI ‐2.09 to ‐0.55, eight trials, 539 participants, I2 = 93%). We conducted a sensitivity analysis owing to high heterogeneity, possibly resulting from the very small standard deviations reported in one study (Wang 2014). We contacted the trial authors, who confirmed that the standard deviations were accurate. Removal of Wang 2014 from analysis resulted in no change in the direction of benefit but altered the effect size. Heterogeneity remained substantial (SMD ‐0.93, 95% CI ‐1.52 to ‐0.35, seven trials, 468 participants, I2 = 88%).
4.1.2 Electro‐acupuncture plus SSRIs versus SSRIs
Investigators provided evidence of a large effect reduction in the severity of depression during treatment from electro‐acupuncture plus SSRI compared with SSRIs alone (SMD ‐0.84, 95% CI ‐1.16 to ‐0.51, five trials, 274 participants, I2 = 33%).
4.1.3 Manual acupuncture plus TCAs versus TCAs
Trials provided evidence of a reduction in the severity of depression during treatment from manual acupuncture plus TCAs compared with TCAs alone (SMD ‐3.06, 95% CI ‐3.82 to ‐2.30, one trial, 60 participants).
4.2 Adverse events
Two studies used the Asberg side effect scale (SES) (Huang 2013; Liu 2013a), and one study used the Toxic Exposure Surveillance System (TESS) (Duan 2008). We found very low‐quality evidence of no differences between groups in the numbers of adverse events recorded (SMD ‐1.32, 95% CI ‐2.86 to 0.23, three trials, 200 participants, I2 = 95%). We downgraded the evidence for this comparison by two levels owing to very serious risk of bias, and by another two levels owing to considerable heterogeneity.
4.2.1 Manual acupuncture plus SSRIs versus SSRis alone
We found no evidence of a difference between groups (SMD ‐0.37, 95% CI ‐1.20 to 0.47, two trials, 150 participants).
4.2.2 Electro‐acupuncture plus SSRIs versus SSRIs alone
Data provide evidence of a reduction in adverse events for electro‐acupuncture (SMD ‐3.39, 95% CI ‐4.27, to ‐2.50, one trial, 60 participants).
Secondary outcomes
4.3 Severity of depression during treatment
Overall evidence suggests a reduction in the severity of depression from acupuncture (SMD ‐1.60, 95% CI ‐2.45, to ‐0.76, six trials, 514 participants, I2 = 95%).
4.3.1 Manual acupuncture plus SSRIs versus SSRIs
Evidence suggests a reduction in the severity of depression during treatment from manual acupuncture plus SSRIs compared with SSRIs alone (SMD ‐1.81, 95% CI ‐2.83 to ‐0.80, six trials. 432 participants, I2 = 95%). We performed a sensitivity analysis owing to high heterogeneity, possibly resulting from the very small standard deviations presented in one study (Wang 2014). We contacted the trial authors, who confirmed that the standard deviations were accurate. Removal of Wang 2014 resulted in no change in the direction of benefit but altered effect size and heterogeneity (SMD ‐0.80, 95% CI ‐1.02 to ‐0.58, five trials, 361 participants, I2 = 0%).
4.3.2 Electro‐acupuncture plus SSRIs versus SSRIs
Overall data show evidence of a reduction in the severity of depression during treatment from electro‐acupuncture plus SSRIs compared with medication alone (SMD ‐0.70, 95% CI ‐1.19 to ‐0.21, one trial, 82 participants).
4.4 Remission of depression
Data show no evidence of a difference between groups (RR 1.21, 95% CI 0.85 to 1.73, nine trials, 618 participants, I2 = 61%).
4.4.1 Manual acupuncture plus SSRIs versus SSRIs
Data show no evidence of a difference between groups (RR 1.33, 95% CI 0.65 to 2.73, five trials, 299 participants, I2 = 76%).
4.4.2 Electro‐acupuncture plus SSRIs versus SSRIs
Researchers provided no evidence of a difference between groups (RR 1.17, 95% CI 0.75 to 1.80, four trials, 120 participants, I2 = 49%).
4.4.3 Manual acupuncture plus heterocyclic antidepressant versus heterocyclic antidepressant alone
Investigators provided evidence of an increase in remission in the acupuncture plus medication group (RR 4.36, 95% CI 0.53 to 36.12, one trial, 46 participants).
4.5 Quality of life (physical)
4.5.1 Manual acupuncture plus SSRIs versus SSRIs
Very low‐quality evidence suggests benefit from manual acupuncture in one small trial (MD 1.4, 95% CI 0.15 to 2.65, 64 participants). We downgraded the evidence for this comparison by one level because only one small study reported this outcome, and by two levels owing to very serious risk of bias.
4.5.2 Electro‐ acupuncture plus SSRIs versus SSRIs
Data show no differences between groups (MD 1.0, 95% CI ‐0.18 to 2.18, 63 participants).
4.6 Quality of life (emotional)
Very low‐quality evidence suggests no differences between groups (MD 0.25, 95% CI ‐0.9 to 1.4, two trials, 219 participants, I2 = 71%). We downgraded the evidence for this comparison by two levels owing to very serious risk of bias, and by one level because of substantial heterogeneity.
4.6.1 Manual acupuncture plus SSRIs versus SSRIs
We found no evidence of a difference between groups (MD 0.10, 95% CI ‐1.46 to 1.65, two trials, 111 participants, I2 = 66%).
4.6.2 Electro‐acupuncture plus SSRIs versus SSRIs
Investigators provided no evidence of a difference between groups (MD 0.35, 95% CI ‐2.0 to 2.7, two trials, 108 participants, I2 = 86%).
4.7 Change in medication
We found evidence of reduced risk of using medication in the acupuncture and SSRI group compared with the SSRI alone group (RR 0.39, 95% CI 0.22 to 0.67, three trials, 236 participants, I2 = 0%).
4.7.1 Manual acupuncture plus SSRIs versus SSRIs
Evidence suggests reduced medication use in the manual acupuncture plus medication group (RR 0.38, 95% CI 0.20 to 0.72, two trials, 154 participants, I2 = 0%).
4.7.2 Electro‐acupuncture plus SSRIs versus SSRIs
Data show no evidence of a difference between groups (RR 0.41, 95% CI 0.13 to 1.30, one trial, 82 participants).
4.8 Dropout from treatment
Trials provided no evidence of a difference between groups (RR 0.70, 95% 0.35 to 1.42, six trials, 426 participants, I2 = 0%).
4.8.1 Manual acupuncture plus SSRIs versus SSRIs
Investigators provided no evidence of a difference between groups (RR 0.45, 95% CI 0.18 to 1.15, three trials, 234 participants, I2 = 0%).
4.8.2 Electro‐ acupuncture plus SSRIs versus SSRIs
Data show no differences between groups (RR 1.23, 95% CI 0.43 to 3.51, three trials, 192 participants, I2 = 0%).
Comparison 5. Acupuncture versus psychological treatment
Two trials reported on this outcome (MacPherson 2013;Wang 2015). Owing to significant differences in the psychological treatment delivered in these two trials, we did not combine them in the meta‐analysis. MacPherson 2013 used counselling, as delivered by a member of the British Association for Counselling and Psychotherapy, and Wang 2015 delivered an educational intervention with some participants receiving psychological guidance, but investigators did not specify the number or duration of sessions nor the content of these sessions.
Primary outcomes
5.1 Severity of depression at the end of treatment
5.1.1 Manual acupuncture
MacPherson 2013 found no evidence of a difference when comparing acupuncture with counselling alone (MD ‐0.80, 95% CI ‐1.92 to 0.32, one trial, 453 participants). Wang 2015 found evidence of benefit of acupuncture compared with the educational and psychological control (MD ‐6.49, 95% CI ‐10.33 to ‐2.65, one trial, 44 participants). Overall the quality of evidence for this comparison was low. We downgraded the evidence for this comparison by one level because both trials had high risk of performance bias, and by one level because results show substantial heterogeneity. However results for both studies show the same direction of effect.
5.2 Adverse events
5.2.1 Manual acupuncture
Trials provided low‐quality evidence suggesting no differences between groups (RR 0.62, 95% CI 0.29 to 1.33, one trial, 453 participants). We downgraded the evidence for this comparison by one level for risk of bias due to performance bias, and by one level because only one study contributed to this outcome.
Secondary outcomes
5.3 Severity of depression at zero to six months' follow‐up
5.3.1 Manual acupuncture
Data show no differences between groups (MD 0.50, 95% ‐0.51 to 1.51, one trial, 453 participants).
5.4 Severity of depression at six to 12 months
5.4.1 Manual acupuncture
Trialists found no differences between groups (MD 0.60, 95% CI ‐0.80 to 2.00, one trial, 453 participants).
5.5 Remission of depression
(Analysis 5.5)
5.5.1 Manual acupuncture
Data show no evidence of differences between groups (RR 1.50, 95% CI 0.81 to 2.79, one trial, 25 participants).
5.6 Change in use of medication
5.6.1 Manual acupuncture
Researchers provided no evidence of a difference between groups (RR 0.82, 95% CI 0.61 to 1.1, 453 participants).
5.7 Dropout
5.7.1 Manual acupuncture
Evidence shows greater dropout from psychological treatment than from acupuncture (RR 0.27, 95% CI 0.08 to 0.90, one trial, 453 participants).
Comments on heterogeneity
Overall, the acupuncture trials were clinically highly heterogeneous and used a diverse range of acupuncture dosages. Electro‐acupuncture treatment duration ranged from three to six weeks, and treatment was administered two days per week to daily in treatment sessions lasting from 30 to 60 minutes, with a total course of treatment ranging from nine to 42 sessions. Ten trials used a standard point prescription, and four were semistandardised, allowing some variation based on diagnosis. Manual acupuncture trials were equally diverse, treatment duration ranged from two to 12 weeks, and acupuncture was administered from once a week to twice daily in treatment sessions lasting from 20 to 60 minutes, with a total course of treatment lasting 12 to 60 sessions. Twenty‐six trials used a standardised point prescription and eight used a semistandardised prescription; only three trials provided individualised treatment. Control acupuncture was also highly heterogeneous, with controls ranging from non‐channel points, to points unrelated to depression, minimal insertion, placebo needles, mock electro‐acupuncture, and mock laser acupuncture. Medication comparisons were less heterogeneous, with most trials describing administration of fluoxetine as the SSRI medication; however, investigators occasionally used other SSRIs such as paroxetine.
Sensitivity analysis
We proposed to undertake a sensitivity analysis of results to look at possible contributions of differences in risk of bias to robustness of the results, for example, by excluding trials with unclear concealment of random allocation; or excluding trials with greater than 20% dropout. Overall, we could not perform a sensitivity analysis for most comparisons because of lack of studies (fewer than five) in each group. When acupuncture was compared with medication, data show no significant change in the severity of depression when we removed studies unclearly describing randomisation (SMD ‐0.25, 95% CI ‐0.46 to ‐0.03, 21 trials, 1853 participants, I2 = 78%). Only two trials reported dropout greater than 20% (Allen 2006; Whiting 2008), and we could not perform a sensitivity analysis. We planned an a posteriori sensitivity analysis to examine the effects of studies undertaken in China; however, removal of these studies left one or two trials remaining in each comparison and therefore would not provide any additional useful information. We had also planned an a posteriori analysis on the effect of risk of bias (high‐risk vs low‐risk studies); however we identified insufficient trials with low risk of bias in each comparison to obtain any useful information.
Subgroup analyses
We planned several subgroup analyses to explore differences in effects of treatment among people with different diagnoses (e.g. major depression, dysthymia) and of different ages (< 65 years and ≥ 65 years) between psychological therapies and pharmacological interventions, effects of clinician‐rated versus self‐reported scales for depression, and effects of differing numbers of treatment sessions (< 20 and ≥ 20 sessions). We undertook none of these analyses because of paucity of data resulting in fewer than five studies in each subgroup.
Reporting bias
We inspected funnel plots for asymmetry in either of the primary outcome measures when 10 or more trials were included in the meta‐analysis (see Figure 8; Figure 9; Figure 10). We found no evidence of major asymmetry suggesting publication bias, especially in the light of true heterogeneity resulting from significantly different study interventions.

Funnel plot of comparison: 2 Acupuncture versus control acupuncture, outcome: 2.1 Severity of depression at the end of the intervention.

Funnel plot of comparison: 3 Acupuncture versus medication, outcome: 3.1 Severity of depression at the end of treatment.

Funnel plot of comparison: 4 Acupuncture plus medication vs medication, outcome: 4.1 Severity of depression at the end of treatment.
Discusión
Resumen de los resultados principales
Se incluyeron en el metanálisis 63 ensayos con 7060 participantes. Los datos muestran una amplia diversidad entre las intervenciones de acupuntura y los comparadores utilizados para evaluar la acupuntura para el tratamiento de los pacientes con depresión.
Acupuntura comparada con ningún tratamiento/control en lista de espera/tratamiento habitual
Para el resultado primario gravedad de la depresión, se encontró evidencia de baja calidad de cinco ensayos de una reducción en la gravedad de la depresión al final del tratamiento con la acupuntura comparada con ningún tratamiento/control en lista de espera/tratamiento habitual. Los investigadores encontraron una reducción significativa en la gravedad de la depresión durante el tratamiento para la acupuntura comparada con ningún tratamiento/control en lista de espera/tratamiento habitual y un ensayo informó que el efecto beneficioso se mantuvo a los seis meses. No se encontró evidencia de diferencias en los eventos adversos entre la acupuntura y la atención y el tratamiento habituales.
Acupuntura comparada con acupuntura control
Catorce ensayos examinaron la eficacia de la acupuntura comparada con acupuntura control y encontraron una reducción en la gravedad de la depresión al final de la intervención de acupuntura (evidencia de baja calidad). Los investigadores no encontraron diferencias en la gravedad de la depresión durante el tratamiento cuando la acupuntura se comparó con acupuntura control, ni evidencia de diferencias en los eventos adversos entre la acupuntura y la acupuntura control. Los datos muestran evidencia de un efecto beneficioso de la acupuntura, con un aumento en las tasas de remisión en comparación con la acupuntura control.
Acupuntura comparada con medicación sola
La acupuntura sola comparada con medicación sola redujo la depresión durante y al final del tratamiento (evidencia de muy baja calidad). Se encontró evidencia de mayores efectos secundarios de la medicación que los observados con la acupuntura. Sin embargo, este resultado no se informó con frecuencia. La acupuntura comparada con la medicación sola aumentó las tasas de remisión de la depresión.
Acupuntura más medicación comparada con medicación sola
La acupuntura más medicación comparada con medicación sola redujo la depresión durante y al final del tratamiento (evidencia de muy baja calidad). Se encontró evidencia de mayores efectos secundarios de la medicación sola que los informados con una combinación de acupuntura más medicación. Sin embargo, este resultado no se informó con frecuencia. Los datos proporcionan evidencia de una reducción en el uso de medicación y mejoría en aspectos de la calidad de vida en los grupos de acupuntura más medicación, aunque solo un número pequeño de estudios informó estos resultados.
Acupuntura comparada con terapia psicológica
Los investigadores no proporcionaron evidencia de diferencias en la gravedad de la depresión entre la acupuntura y una intervención de asistencia psicológica (evidencia de baja calidad). A la terapia psicológica le siguió una tasa mayor de abandonos que la informada con la acupuntura, pero los datos no proporcionan evidencia de un efecto sobre otros resultados. El efecto de la acupuntura sobre resultados secundarios como la remisión de los síntomas, los abandonos, la reducción del uso de medicación y la calidad de vida, es limitado porque pocos estudios informaron estos resultados.
Para los resultados primarios y secundarios, la calidad de la evidencia fue moderada a muy baja cuando se evaluó con el enfoque GRADE y los resultados de los ensayos fueron heterogéneos. Muchas comparaciones se caracterizan por tener heterogeneidad clínica significativa o heterogeneidad estadística significativa o considerable. Lo anterior se relaciona con las características de la dosis de la intervención y la heterogeneidad de los controles, que incluye las dosis de la medicación y el grado de actividad fisiológica de los controles de acupuntura. Dentro de las comparaciones, se presentan los datos según la modalidad de la estimulación de acupuntura (acupuntura manual, electroacupuntura y acupuntura láser). La dirección de los efectos dentro de las comparaciones fue similar, lo que posiblemente indica que los efectos de los tratamientos específicos pueden ser similares. Aunque las comparaciones entre la acupuntura y los diferentes controles no son consistentes en sus hallazgos, la mayoría de las comparaciones indican un efecto beneficioso de la acupuntura, aunque existe la posibilidad de sesgo. Debido al número pequeño de estudios identificados, no se han podido identificar los parámetros de dosis de los tratamientos que pueden modificar e influir en los resultados del tratamiento.
En toda la revisión se han puesto de relieve las fuentes adicionales de sesgo, pero las expectativas de los participantes y su estado a menudo no cegado puede tener una función. En los ensayos que informaron que no hubo cegamiento, la expectativa de los efectos puede ser mayor y el efecto placebo más grande. En los ensayos de depresión con un efecto placebo conocido en la depresión leve a moderada, los efectos placebo más grandes que se podrían esperar con la acupuntura pueden dar lugar a retos metodológicos y a una mayor conciencia sobre la necesidad de diseñar estudios que puedan detectar un efecto beneficioso del tratamiento de la verdadera acupuntura. En general no se encontró evidencia de diferencias en la gravedad de la depresión cuando los médicos calificaron la depresión, en lugar de los participantes, excepto en una comparación en la cual los participantes no estaban cegados al tratamiento entre acupuntura y ningún tratamiento/control en lista de espera/atención habitual. La influencia de la falta de cegamiento y las expectativas pueden contribuir a estos hallazgos. Pocos estudios examinaron la función de la acupuntura comparada con un control como un procedimiento o dispositivo simulado. Los ensayos controlados con placebo incluidos en esta revisión muestran un efecto beneficioso pequeño general derivado de la acupuntura comparada con este control; sin embargo, la heterogeneidad es alta y los diferentes controles pueden diferir en cuanto a cuán inertes o creíbles son, o en si producen un efecto placebo. Abordar estas diferencias es una prioridad recomendada para los estudios futuros.
Compleción y aplicabilidad general de las pruebas
Es posible proporcionar muchos estilos de acupuntura, incluida la Medicina tradicional china individualizada y los enfoques de acupuntura que utilizan puntos de acupuntura estandarizados, como se utilizaron en la mayoría de los ensayos incluidos en esta revisión. Esta revisión sistemática ha documentado la amplia variación en las modalidades de estimulación, la duración de la inserción de las agujas, el número de puntos utilizados, la profundidad de la inserción de las agujas y la duración del ensayo. Muchos estudios administraron dosis de tratamiento subóptimas de acupuntura. También se observó diversidad en los ámbitos clínicos de los que se reclutaron los participantes y en los criterios de inclusión y exclusión de los ensayos. La mayoría de los ensayos incluidos se informaron en China y otros en Australia, Alemania, el Reino Unido y los Estados Unidos. Los ensayos de China reclutaron a los participantes principalmente de ámbitos de hospitalización o mixtos, y la mayoría de los estudios realizados fuera de China reclutaron a los participantes de ámbitos de atención primaria y comunitaria. No está claro cómo los protocolos de tratamiento utilizados en esta investigación se pueden generalizar a la acupuntura tal como se practica habitualmente. Se encontró que el informe de la justificación para el uso de la acupuntura en el ámbito de investigación no fue suficiente. La variación puede reflejar el contexto en el que se practica la acupuntura. Sin embargo, un ensayo pragmático administró una intervención de tratamiento con validez externa alta y evidencia de generalizabilidad (MacPherson 2013).
Los metanálisis de los ensayos clínicos de medicación antidepresiva, en particular los antidepresivos de nueva generación, muestran que los efectos del tratamiento fueron clínicamente significativos solo en los pacientes muy deprimidos (Kirsch 2008), e indican que el modelo de respuesta al tratamiento se le puede atribuir a una disminución en la respuesta al placebo en lugar de al aumento en la respuesta a la medicación. Una revisión sistemática y metanálisis reciente confirmaron que la respuesta placebo en el trastorno depresivo mayor es grande, independientemente de la intervención administrada (Brunoni 2009). La acupuntura se ha descrito como una intervención compleja, y algunos de los componentes incidentales de los efectos del tratamiento pueden contribuir al efecto placebo. Lo anterior se analiza con más detalle en la sección que describe la Calidad de la evidencia.
También debe observarse que en los estudios primarios de las comparaciones entre la acupuntura y la medicación ninguno de estos estudios informó que la finalidad de la investigación era examinar la equivalencia o la no inferioridad, o la superioridad. Muchos ensayos no informaron resultados diferentes de la depresión y no informaron de manera consistente los eventos adversos; entre estos estudios, se encontró que el seguimiento a largo plazo fue escaso.
Muchos estudios chinos se informaron de manera deficiente, y a pesar de los muchos intentos, no fue posible obtener los detalles completos de las características del diseño de los estudios relevantes para la evaluación del riesgo de sesgo. El informe sobre el resultado primario gravedad de la depresión fue alto, aunque la inclusión y el informe de otras medidas de resultado fueron bajos. En pocas ocasiones se proporcionaron datos del seguimiento después de finalizar los ensayos. Es importante que los ensayos futuros incluyan el seguimiento a plazo intermedio y a largo plazo, debido a la carga de morbilidad y los costos para el paciente y la sociedad como resultado de la depresión. Debido al efecto placebo asociado con la depresión y su tratamiento, que surgen a partir de la atención, es importante que los ensayos futuros incluyan el seguimiento y proporcionen datos de los períodos de seguimiento.
Los ensayos que incluyen comparaciones con medicación no han proporcionado datos sobre el cumplimiento; por lo tanto, no está claro si los resultados de estos grupos de estudio podrían haber estado afectados por las dosis subóptimas de la medicación. En algunos casos los ensayos utilizaron fármacos que en la actualidad están retirados del mercado en algunos países debido problemas de seguridad y dudas acerca de la falta de eficacia (Lv 2015; Tang 2003).
Calidad de la evidencia
En general, la calidad de la evidencia para la mayoría de las comparaciones fue muy baja a moderada, lo que limita la confianza en los resultados de los ensayos. Pocos ensayos se consideraron con bajo riesgo de sesgo, y a la mayoría de los ensayos se les asignó una clasificación de alto riesgo de sesgo en al menos un dominio.
El 75% de los ensayos se consideró con bajo riesgo de sesgo relacionado con la generación de la secuencia, aunque la mayoría de los ensayos se consideraron con riesgo incierto de sesgo en cuanto a la ocultación de la asignación.
El alto riesgo de sesgo se relacionó con mayor frecuencia con los dominios del cegamiento. Sin embargo, en muchas comparaciones es probable que el sesgo de realización y detección sea alto porque no fue factible el cegamiento de los pacientes a las intervenciones proporcionadas. Lo anterior provocó que los autores de la revisión disminuyeran la calidad de la evidencia en al menos un nivel para la mayoría de las comparaciones y en dos niveles cuando los dos dominios del cegamiento se consideraron con alto riesgo en al menos un tercio de los estudios incluidos. En varias comparaciones solo se incluyó un ensayo clínico, lo que provocó la disminución de la calidad debido a la falta de precisión.
Más de la mitad de los ensayos se consideraron con bajo riesgo de sesgo en el dominio de sesgo de desgaste. Menos de la mitad de los ensayos se consideraron con bajo riesgo de sesgo de selección y solo fue posible acceder a los protocolos publicados de unos pocos ensayos. El cumplimiento del tratamiento no se informó de manera adecuada, y solo algunos ensayos evaluaron la integridad del cegamiento en los controles de acupuntura.
Muchas comparaciones mostraron heterogeneidad significativa (I2 > 50%) y varias tuvieron I2 > 90%. Aunque parte de la heterogeneidad se puede deber a la heterogeneidad entre las propias intervenciones, así como entre los controles, a menudo este hallazgo fue suficientemente significativo para dar lugar a la disminución del nivel de calidad de la evidencia. No fue posible examinar el efecto de la calidad de los estudios mediante un análisis de sensibilidad porque se encontraron muy pocos estudios con bajo riesgo de sesgo. La calidad del informe fue deficiente en muchos ensayos.
La calidad de la evidencia evaluada mediante GRADE fue muy baja a baja para la gravedad de la depresión y muy baja a moderada para los eventos adversos (ver Resumen de los hallazgos tabla 1; Resumen de los hallazgos tabla 2; Resumen de los hallazgos tabla 4; y Resumen de los hallazgos tabla 5).
Sesgos potenciales en el proceso de revisión
Los ensayos cruzados se excluyeron de esta revisión debido a la falta de transparencia con respecto al período apropiado de lavado para los ensayos de acupuntura. En esta versión de la revisión no se buscó de forma sistemática en las bases de datos que solo estaban en idioma chino; por lo tanto, pueden existir ensayos que cumplían los criterios de selección además de los identificados. Se intentó disminuir el sesgo de publicación, pero dicho sesgo aún es posible porque no se identificaron para inclusión ensayos de China que mostraran un efecto negativo del tratamiento. En esta actualización de la revisión se excluyeron los ensayos controlados cuasialeatorios (que se incluyeron en las versiones anteriores) porque ha aumentado el grupo de ensayos publicados.
Un autor de la versión anterior de esta revisión fue autor de un ensayo incluido. Otros autores de la revisión extrajeron los datos y evaluaron la calidad de este ensayo.
Acuerdos y desacuerdos con otros estudios o revisiones
Se utilizó una estrategia extensa de búsqueda y se identificaron e incluyeron un mayor número de ensayos (64) en la revisión actualizada que los identificados en otras cinco revisiones sistemáticas, que incluyeron entre siete y 35 ensayos. La actualización de la presente revisión representa una evaluación integral de la evidencia actual y es la revisión más grande hasta la fecha. Otras cinco revisiones sistemáticas han examinado la acupuntura para el tratamiento de los pacientes con depresión (Chan 2015; Leo 2007; Mukaino 2005; Wang 2008; Zhang 2010). Los hallazgos de la presente revisión reflejan una gama más amplia de comparaciones que los incluidos en las revisiones Wang 2008 y Leo 2007, que combinaron todas las modalidades de estimulación con acupuntura en sus metanálisis y excluyeron todas las comparaciones con medicación. Los hallazgos actualizados difieren significativamente de los de Mukaino 2005, que incluyó siete ensayos y no encontró diferencias entre acupuntura y una comparación de lista de espera, entre acupuntura y acupuntura simulada, ni entre electroacupuntura y medicación antidepresiva. Esta diferencia se puede explicar probablemente por el grupo mayor de ensayos controlados aleatorios informados con el transcurso del tiempo y por las diferencias entre los ensayos que cumplieron los criterios de inclusión para la presente revisión.
Una revisión sistemática (Zhang 2010) encontró que la acupuntura fue superior a la medicación antidepresiva en pacientes que presentaban depresión posterior a un accidente cerebrovascular. En la presente revisión no se examinó esta comparación específica. Sin embargo, cuando los autores de la revisión Zhang 2010 compararon acupuntura más medicación versus medicación sola o monoterapia con acupuntura versus medicación sola, no encontraron un efecto beneficioso en los pacientes con un trastorno depresivo mayor en las comparaciones con fármacos inhibidores selectivos de la recaptación de serotonina (ISRS). La presente revisión incluye 11 estudios disponibles después de la publicación de Zhang 2010 y proporciona evidencia actualizada.
Sus hallazgos son muy similares a los de la revisión más reciente (Chan 2015), que incluyó un metanálisis de ensayos que compararon acupuntura más medicación versus medicación sola. Este metanálisis indicó que la acupuntura combinada con fármacos ISRS fue superior a los fármacos ISRS solos.
Methodological quality graph: review authors' judgements about each methodological quality item presented as percentages across all included studies.
Review authors' judgements about each 'risk of bias' domain for each included study.
Forest plot of comparison: 1 Acupuncture versus no treatment/wait list/TAU, outcome: 1.1 Severity of depression at the end of treatment.
Forest plot of comparison: 2 Acupuncture versus control acupuncture, outcome: 2.1 Severity of depression at the end of the intervention.
Forest plot of comparison: 3 Acupuncture versus medication, outcome: 3.1 Severity of depression at the end of treatment.
Forest plot of comparison: 4 Acupuncture plus medication vs medication, outcome: 4.1 Severity of depression at the end of treatment.
Funnel plot of comparison: 2 Acupuncture versus control acupuncture, outcome: 2.1 Severity of depression at the end of the intervention.
Funnel plot of comparison: 3 Acupuncture versus medication, outcome: 3.1 Severity of depression at the end of treatment.
Funnel plot of comparison: 4 Acupuncture plus medication vs medication, outcome: 4.1 Severity of depression at the end of treatment.

Comparison 1 Acupuncture versus no treatment/wait list/TAU, Outcome 1 Severity of depression at the end of treatment.

Comparison 1 Acupuncture versus no treatment/wait list/TAU, Outcome 2 Adverse events.

Comparison 1 Acupuncture versus no treatment/wait list/TAU, Outcome 3 Severity of depression during treatment.
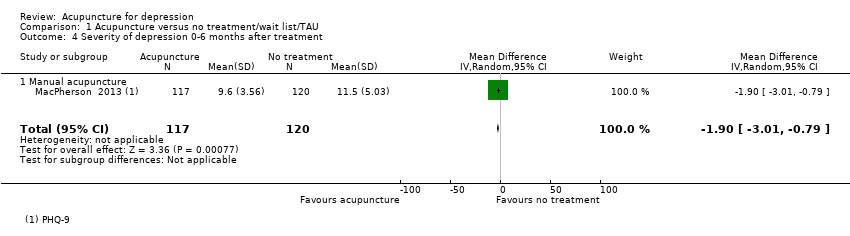
Comparison 1 Acupuncture versus no treatment/wait list/TAU, Outcome 4 Severity of depression 0‐6 months after treatment.

Comparison 1 Acupuncture versus no treatment/wait list/TAU, Outcome 5 Severity of depression 6‐12 months after treatment.
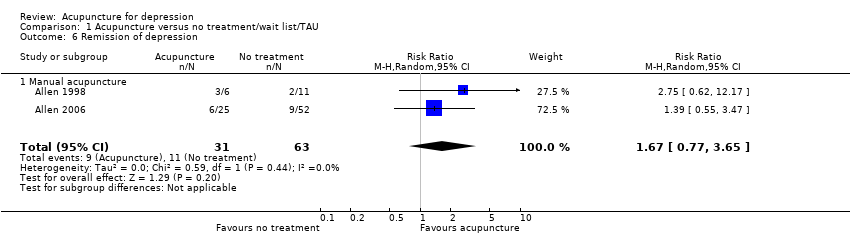
Comparison 1 Acupuncture versus no treatment/wait list/TAU, Outcome 6 Remission of depression.

Comparison 1 Acupuncture versus no treatment/wait list/TAU, Outcome 7 Change in use of medication at the end of treatment.

Comparison 1 Acupuncture versus no treatment/wait list/TAU, Outcome 8 Dropout from treatment.

Comparison 2 Acupuncture versus control acupuncture, Outcome 1 Severity of depression at the end of the intervention.
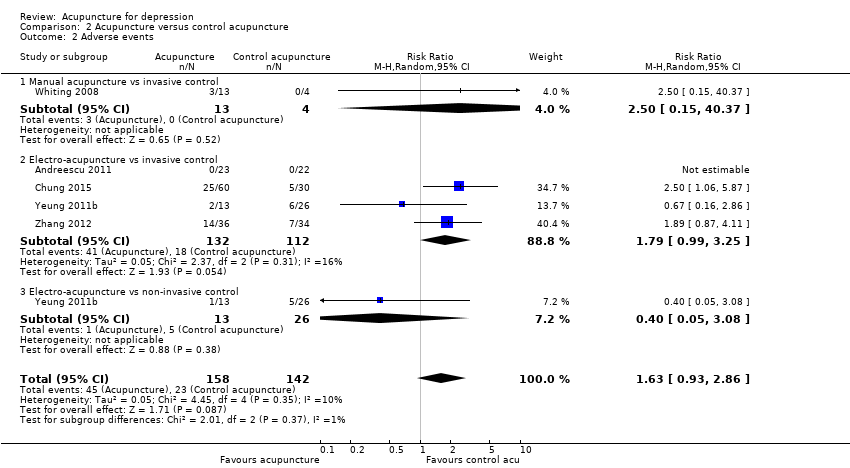
Comparison 2 Acupuncture versus control acupuncture, Outcome 2 Adverse events.

Comparison 2 Acupuncture versus control acupuncture, Outcome 3 Severity of depression during treatment.

Comparison 2 Acupuncture versus control acupuncture, Outcome 4 Severity of depression at 0‐6 months' follow‐up.

Comparison 2 Acupuncture versus control acupuncture, Outcome 5 Remission of depression.

Comparison 2 Acupuncture versus control acupuncture, Outcome 6 Quality of life (emotional) during treatment.
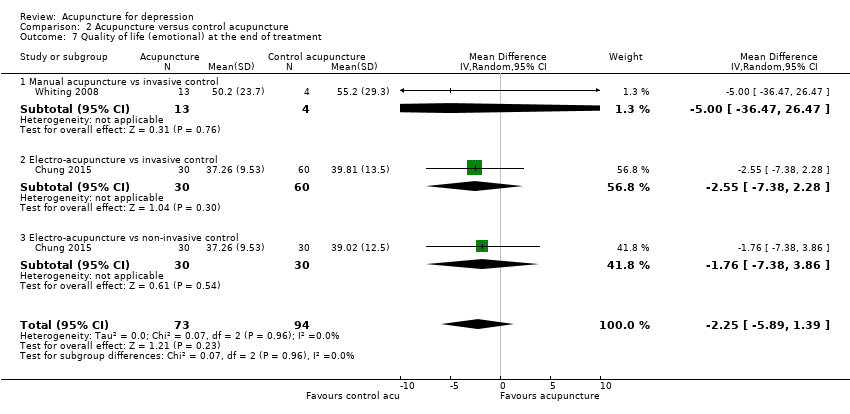
Comparison 2 Acupuncture versus control acupuncture, Outcome 7 Quality of life (emotional) at the end of treatment.
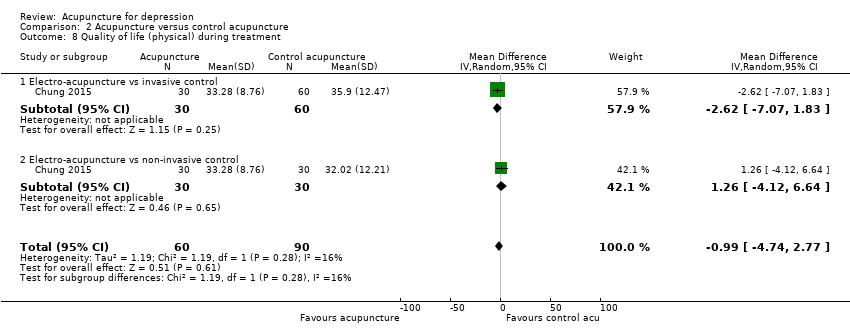
Comparison 2 Acupuncture versus control acupuncture, Outcome 8 Quality of life (physical) during treatment.

Comparison 2 Acupuncture versus control acupuncture, Outcome 9 Quality of life (physical) at the end of treatment.
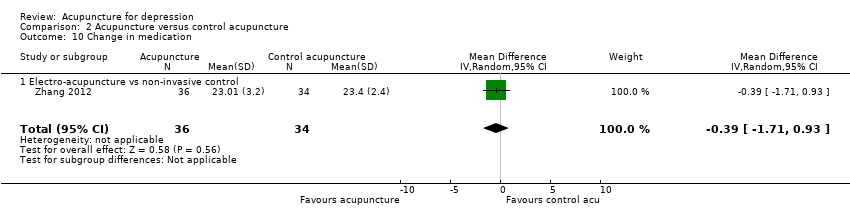
Comparison 2 Acupuncture versus control acupuncture, Outcome 10 Change in medication.

Comparison 2 Acupuncture versus control acupuncture, Outcome 11 Dropout from treatment.

Comparison 3 Acupuncture versus medication, Outcome 1 Severity of depression at the end of treatment.
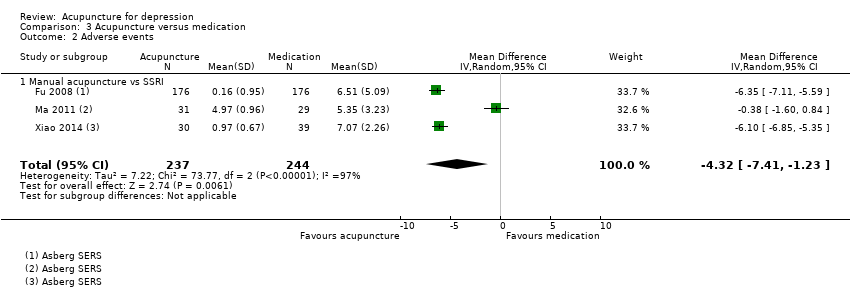
Comparison 3 Acupuncture versus medication, Outcome 2 Adverse events.

Comparison 3 Acupuncture versus medication, Outcome 3 Severity of depression during treatment.

Comparison 3 Acupuncture versus medication, Outcome 4 Severity of depression 0‐6 months after treatment.

Comparison 3 Acupuncture versus medication, Outcome 5 Remission of depression.

Comparison 3 Acupuncture versus medication, Outcome 6 Dropout from treatment.

Comparison 4 Acupuncture plus medication versus medication, Outcome 1 Severity of depression at the end of treatment.
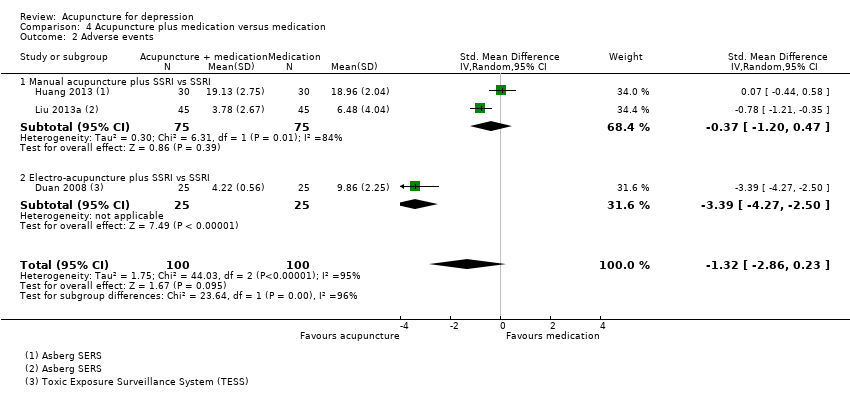
Comparison 4 Acupuncture plus medication versus medication, Outcome 2 Adverse events.
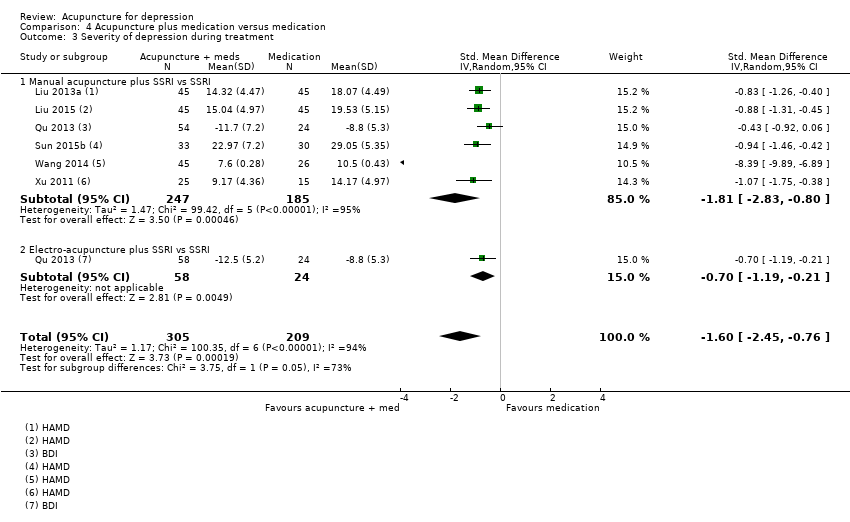
Comparison 4 Acupuncture plus medication versus medication, Outcome 3 Severity of depression during treatment.
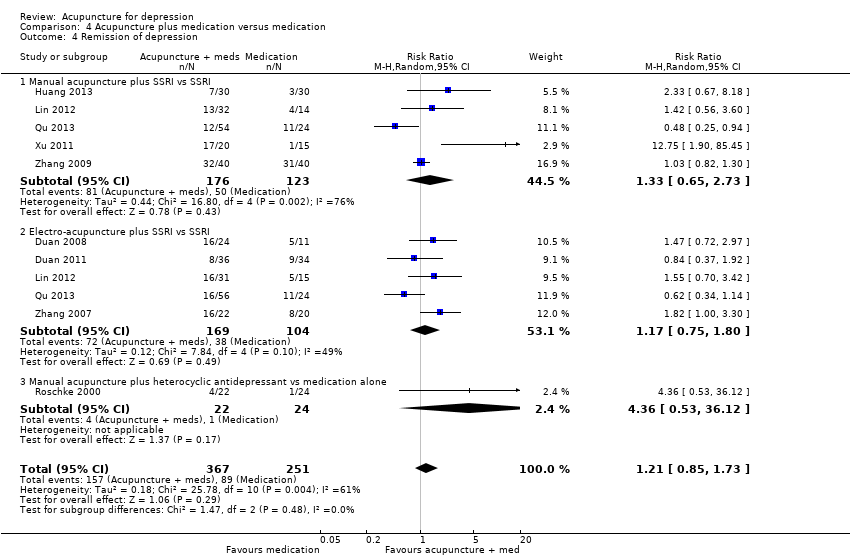
Comparison 4 Acupuncture plus medication versus medication, Outcome 4 Remission of depression.
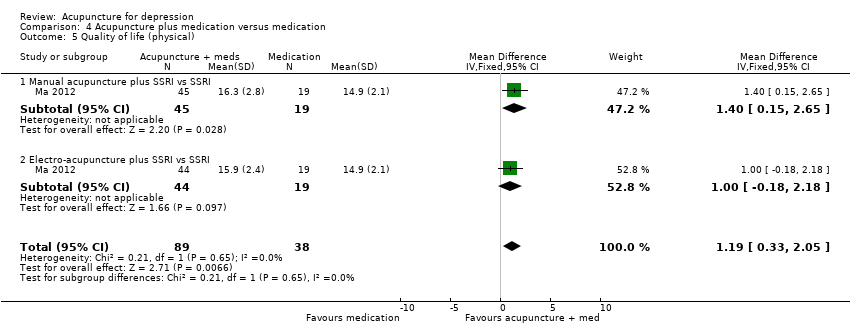
Comparison 4 Acupuncture plus medication versus medication, Outcome 5 Quality of life (physical).

Comparison 4 Acupuncture plus medication versus medication, Outcome 6 Quality of life (emotional).

Comparison 4 Acupuncture plus medication versus medication, Outcome 7 Change in use of medication.

Comparison 4 Acupuncture plus medication versus medication, Outcome 8 Dropout from treatment.

Comparison 5 Acupuncture versus psychological therapy, Outcome 1 Severity of depression at the end of treatment.
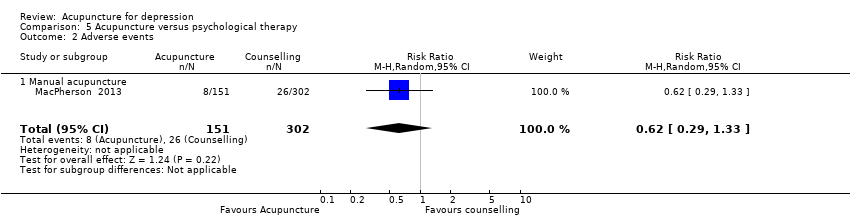
Comparison 5 Acupuncture versus psychological therapy, Outcome 2 Adverse events.

Comparison 5 Acupuncture versus psychological therapy, Outcome 3 Severity of depression 0‐6 months after treatment.

Comparison 5 Acupuncture versus psychological therapy, Outcome 4 Severity of depression 6‐12 months.

Comparison 5 Acupuncture versus psychological therapy, Outcome 6 Change in use of medication.

Comparison 5 Acupuncture versus psychological therapy, Outcome 7 Dropout from treatment.
| Acupuncture compared with no treatment/wait list/treatment as usual for depression | ||||||
| Patient or population: clinical diagnosis of depression | ||||||
| Outcomes | Anticipated absolute effects* (95% CI) | Relative effect | No. of participants | Quality of the evidence | Comments | |
| Risk with no treatment/wait list/treatment as usual | Risk with acupuncture | |||||
| Severity of depression at the end of treatment | SMD 0.66 lower | ‐ | 488 | ⊕⊕⊝⊝ | As a rule of thumb, 0.2 SMD represents a small difference, 0.5 moderate, and 0.8 large. | |
| Adverse events | Study population | RR 0.89 | 302 | ⊕⊕⊝⊝ | ||
| 60 per 1000 | 53 per 1000 | |||||
| Quality of life (physical) | ‐ | ‐ | ‐ | ‐ | ‐ | Cannot estimate the effect of acupuncture as no studies reported on this outcome |
| Quality of life (emotional) | ‐ | ‐ | ‐ | ‐ | ‐ | Cannot estimate the effect of acupuncture as no studies reported on this outcome |
| *The risk in the intervention group (and its 95% confidence interval) is based on the assumed risk in the comparison group and the relative effect of the intervention (and its 95% CI). | ||||||
| GRADE Working Group grades of evidence. | ||||||
| aDowngraded one level owing to high risk of performance bias across most included studies. bDowngraded one level owing to substantial heterogeneity (I2 = 64%, Tau2 = 0.14, P = 0.02). cDowngraded one level owing to high risk of performance bias. dDowngraded one level owing to small sample size for detecting relatively rare events. | ||||||
| Acupuncture compared with control acupuncture for depression | ||||||
| Patient or population: clinical diagnosis of depression | ||||||
| Outcomes | Anticipated absolute effects* (95% CI) | Relative effect | No. of participants | Quality of the evidence | Comments | |
| Risk with control acupuncture | Risk with acupuncture | |||||
| Severity of depression at the end of the intervention as measured by the Hamilton Depression Rating Scale (HAMD) scored from 0 to 54 (lower score indicates less severe depression) | In the study population, average severity of depression at the end of treatment was 11.4 in clinician‐rated HAMD scores. | MD 1.69 lower | ‐ | 841 | ⊕⊕⊝⊝ | |
| Adverse events | Study population | RR 1.63 | 300 | ⊕⊕⊕⊝ | ||
| 162 per 1000 | 264 per 1000 | |||||
| Quality of life (physical) at the end of treatment (higher scores indicate greater quality of life) | Mean quality of life (physical) at the end of treatment was 37. | MD 5.12 lower | ‐ | 150 | ⊕⊕⊝⊝ | |
| Quality of life (emotional) at the end of treatment (higher scores indicate greater quality of life) | Mean quality of life (emotional) at the end of treatment was 44.6. | MD 2.25 lower | ‐ | 167 | ⊕⊕⊕⊝ | |
| *The risk in the intervention group (and its 95% confidence interval) is based on the assumed risk in the comparison group and the relative effect of the intervention (and its 95% CI). | ||||||
| GRADE Working Group grades of evidence. | ||||||
| aDowngraded one level owing to high risk of bias in performance bias in five of the included studies and high risk of bias in at least one domain in most studies. bDowngraded one level owing to substantial heterogeneity (I2 = 80%, Tau2 = 7.80, P < 0.001). cDowngraded one level owing to small sample size for relatively rare events. dDowngraded one level because only one small study contributed to this outcome. eDowngraded one level for imprecision due to small sample size. | ||||||
| Acupuncture compared with medication for depression | ||||||
| Patient or population: clinical diagnosis of depression | ||||||
| Outcomes | Anticipated absolute effects* (95% CI) | Relative effect | No. of participants | Quality of the evidence | Comments | |
| Risk with medication | Risk with acupuncture | |||||
| Severity of depression at the end of treatment | SMD 0.23 lower | ‐ | 3127 | ⊕⊝⊝⊝ | As a rule of thumb, 0.2 SMD represents a small difference, 0.5 moderate, and 0.8 large. | |
| Adverse events (measured with Asberg Antidepressant Side Effect Scale) | Mean number of adverse events was 6.2. | MD 4.32 lower | ‐ | 481 | ⊕⊝⊝⊝ | |
| Quality of life (physical) | ‐ | ‐ | No studies reported on this outcome. | ‐ | Cannot estimate the effect of acupuncture as no studies reported on this outcome | |
| Quality of life (emotional) | ‐ | ‐ | No studies reported on this outcome. | ‐ | Cannot estimate the effect of acupuncture as no studies reported on this outcome | |
| *The risk in the intervention group (and its 95% confidence interval) is based on the assumed risk in the comparison group and the relative effect of the intervention (and its 95% CI). | ||||||
| GRADE Working Group grades of evidence. | ||||||
| aDowngraded two levels owing to very serious risk of bias. Of 31 trials, 30 were at high risk of bias owing to lack of blinding of participants, and 12 were at high risk of bias owing to lack of blinding of outcome assessors. bDowngraded one level owing to substantial heterogeneity (I2 = 80%, Tau2 = 0.19, P < 0.0001). cDowngraded two levels owing to very serious risk of bias in all three studies. dDowngraded two levels owing to considerable heterogeneity (I2 = 97%, Tau2 = 7.22, P < 0.001). | ||||||
| Acupuncture plus medication compared with medication for depression | ||||||
| Patient or population: clinical diagnosis of depression | ||||||
| Outcomes | Anticipated absolute effects* (95% CI) | Relative effect | No. of participants | Quality of the evidence | Comments | |
| Risk with medication | Risk with acupuncture plus medication | |||||
| Severity of depression at the end of treatment | SMD 1.15 lower | ‐ | 813 | ⊕⊝⊝⊝ | As a rule of thumb, 0.2 SMD represents a small difference, 0.5 moderate, and 0.8 large. | |
| Adverse events (measured with Asberg Antidepressant Side Effect Scale and Toxic Exposure Surveillance System) | SMD 1.32 lower | ‐ | 200 | ⊕⊝⊝⊝ | As a rule of thumb, 0.2 SMD represents a small difference, 0.5 moderate, and 0.8 large. | |
| Quality of life (physical) at the end of treatment (higher scores indicate greater quality of life) | Quality of life (physical) score in the single included study was 14.9. | MD 1.19 higher | ‐ | 127 | ⊕⊝⊝⊝ | |
| Quality of life (emotional) at the end of treatment (higher scores indicate greater quality of life) | Mean quality of life (emotional) score was 17.2. | MD 0.25 higher | ‐ | 219 | ⊕⊝⊝⊝ | |
| *The risk in the intervention group (and its 95% confidence interval) is based on the assumed risk in the comparison group and the relative effect of the intervention (and its 95% CI). | ||||||
| GRADE Working Group grades of evidence. | ||||||
| aDowngraded two levels owing to very serious risk of bias. Of 11 trials, nine were at high risk of bias owing to lack of blinding of participants, and 6 were at high risk of bias owing to lack of blinding of outcome assessors. bDowngraded two levels owing to considerable heterogeneity (I2 = 89%, Tau2 = 0.70, P < 0.001). fDowngraded two levels owing to very serious risk of bias. | ||||||
| Acupuncture compared with psychological therapy for depression | ||||||
| Patient or population: clinical diagnosis of depression | ||||||
| Outcomes | Anticipated absolute effects* (95% CI) | Relative effect | No. of participants | Quality of the evidence | Comments | |
| Risk with psychological therapy | Risk with acupuncture | |||||
| Severity of depression at the end of treatment as measured by self‐rated depression scores (lower score indicates less severe depression) | SMD 0.5 lower | ‐ | 497 | ⊕⊕⊝⊝ | As a rule of thumb, 0.2 SMD represents a small difference, 0.5 moderate, and 0.8 large. | |
| Adverse events measured during study treatment | Study population | RR 0.62 | 453 | ⊕⊕⊝⊝ | ||
| 86 per 1000 | 53 per 1000 | |||||
| Quality of life (physical) | ‐ | ‐ | ‐ | No studies reported on this outcome. | ‐ | Cannot estimate the effect of acupuncture as no studies reported on this outcome |
| Quality of life (emotional) | ‐ | ‐ | ‐ | No studies reported on this outcome. | ‐ | Cannot estimate the effect of acupuncture as no studies reported on this outcome |
| *The risk in the intervention group (and its 95% confidence interval) is based on the assumed risk in the comparison group and the relative effect of the intervention (and its 95% CI). | ||||||
| GRADE Working Group grades of evidence. | ||||||
| aDowngraded one level for serious risk of bias; both included trials have high risk of performance bias. dDowngraded one level owing to high risk of performance bias. | ||||||
| Outcome or subgroup title | No. of studies | No. of participants | Statistical method | Effect size |
| 1 Severity of depression at the end of treatment Show forest plot | 5 | 488 | Std. Mean Difference (IV, Random, 95% CI) | ‐0.66 [‐1.06, ‐0.25] |
| 1.1 Manual acupuncture | 5 | 458 | Std. Mean Difference (IV, Random, 95% CI) | ‐0.56 [‐0.98, ‐0.15] |
| 1.2 Electro‐acupuncture | 1 | 30 | Std. Mean Difference (IV, Random, 95% CI) | ‐1.26 [‐2.10, ‐0.43] |
| 2 Adverse events Show forest plot | 1 | 302 | Risk Ratio (M‐H, Random, 95% CI) | 0.89 [0.35, 2.24] |
| 2.1 Manual acupuncture | 1 | 302 | Risk Ratio (M‐H, Random, 95% CI) | 0.89 [0.35, 2.24] |
| 3 Severity of depression during treatment Show forest plot | 2 | 137 | Mean Difference (IV, Random, 95% CI) | ‐6.75 [‐9.12, ‐4.38] |
| 3.1 Manual acupuncture | 2 | 107 | Mean Difference (IV, Random, 95% CI) | ‐7.04 [‐11.08, ‐3.00] |
| 3.2 Electro‐acupuncture | 1 | 30 | Mean Difference (IV, Random, 95% CI) | ‐6.24 [‐9.86, ‐2.62] |
| 4 Severity of depression 0‐6 months after treatment Show forest plot | 1 | 237 | Mean Difference (IV, Random, 95% CI) | ‐1.90 [‐3.01, ‐0.79] |
| 4.1 Manual acupuncture | 1 | 237 | Mean Difference (IV, Random, 95% CI) | ‐1.90 [‐3.01, ‐0.79] |
| 5 Severity of depression 6‐12 months after treatment Show forest plot | 1 | 235 | Mean Difference (IV, Random, 95% CI) | ‐1.0 [‐2.53, 0.53] |
| 5.1 Manual acupuncture | 1 | 235 | Mean Difference (IV, Random, 95% CI) | ‐1.0 [‐2.53, 0.53] |
| 6 Remission of depression Show forest plot | 2 | 94 | Risk Ratio (M‐H, Random, 95% CI) | 1.67 [0.77, 3.65] |
| 6.1 Manual acupuncture | 2 | 94 | Risk Ratio (M‐H, Random, 95% CI) | 1.67 [0.77, 3.65] |
| 7 Change in use of medication at the end of treatment Show forest plot | 1 | 302 | Risk Ratio (M‐H, Random, 95% CI) | 0.91 [0.73, 1.14] |
| 7.1 Manual acupuncture | 1 | 302 | Risk Ratio (M‐H, Random, 95% CI) | 0.91 [0.73, 1.14] |
| 8 Dropout from treatment Show forest plot | 1 | 302 | Risk Ratio (M‐H, Random, 95% CI) | 1.0 [0.21, 4.88] |
| 8.1 Manual acupuncture | 1 | 302 | Risk Ratio (M‐H, Random, 95% CI) | 1.0 [0.21, 4.88] |
| Outcome or subgroup title | No. of studies | No. of participants | Statistical method | Effect size |
| 1 Severity of depression at the end of the intervention Show forest plot | 14 | 841 | Mean Difference (IV, Random, 95% CI) | ‐1.69 [‐3.33, ‐0.05] |
| 1.1 Manual acupuncture vs invasive control | 7 | 418 | Mean Difference (IV, Random, 95% CI) | ‐2.97 [‐6.26, 0.31] |
| 1.2 Electro‐acupuncture vs invasive control | 5 | 251 | Mean Difference (IV, Random, 95% CI) | 0.43 [‐0.54, 1.40] |
| 1.3 Electro‐acupuncture vs non‐invasive electro‐control | 2 | 99 | Mean Difference (IV, Random, 95% CI) | 0.17 [‐2.14, 2.48] |
| 1.4 Laser acupuncture vs non‐invasive control | 2 | 73 | Mean Difference (IV, Random, 95% CI) | ‐5.51 [‐8.30, ‐2.73] |
| 2 Adverse events Show forest plot | 5 | 300 | Risk Ratio (M‐H, Random, 95% CI) | 1.63 [0.93, 2.86] |
| 2.1 Manual acupuncture vs invasive control | 1 | 17 | Risk Ratio (M‐H, Random, 95% CI) | 2.5 [0.15, 40.37] |
| 2.2 Electro‐acupuncture vs invasive control | 4 | 244 | Risk Ratio (M‐H, Random, 95% CI) | 1.79 [0.99, 3.25] |
| 2.3 Electro‐acupuncture vs non‐invasive control | 1 | 39 | Risk Ratio (M‐H, Random, 95% CI) | 0.4 [0.05, 3.08] |
| 3 Severity of depression during treatment Show forest plot | 6 | 413 | Mean Difference (IV, Random, 95% CI) | 0.04 [‐0.81, 0.90] |
| 3.1 Manual acupuncture vs invasive control | 2 | 117 | Mean Difference (IV, Random, 95% CI) | 0.09 [‐2.55, 2.74] |
| 3.2 Electro‐acupuncture vs invasive control | 4 | 197 | Mean Difference (IV, Random, 95% CI) | 0.16 [‐0.92, 1.24] |
| 3.3 Electro‐acupuncture vs non‐invasive control | 2 | 99 | Mean Difference (IV, Random, 95% CI) | ‐0.45 [‐2.71, 1.80] |
| 4 Severity of depression at 0‐6 months' follow‐up Show forest plot | 1 | Mean Difference (IV, Random, 95% CI) | Subtotals only | |
| 4.1 Manual acupuncture vs invasive control | 1 | 95 | Mean Difference (IV, Random, 95% CI) | ‐0.85 [‐0.98, ‐0.72] |
| 5 Remission of depression Show forest plot | 10 | 601 | Risk Ratio (M‐H, Random, 95% CI) | 1.91 [1.14, 3.21] |
| 5.1 Manual acupuncture vs invasive control | 5 | 368 | Risk Ratio (M‐H, Random, 95% CI) | 1.89 [0.75, 4.75] |
| 5.2 Electro‐acupuncture vs invasive control | 2 | 87 | Risk Ratio (M‐H, Random, 95% CI) | 1.23 [0.35, 4.29] |
| 5.3 Electro‐acupuncture vs non‐invasive electro‐control | 1 | 73 | Risk Ratio (M‐H, Random, 95% CI) | 2.15 [0.60, 7.67] |
| 5.4 Laser acupuncture vs non‐invasive control | 2 | 73 | Risk Ratio (M‐H, Random, 95% CI) | 3.00 [1.48, 6.09] |
| 6 Quality of life (emotional) during treatment Show forest plot | 1 | 150 | Mean Difference (IV, Random, 95% CI) | ‐1.98 [‐5.41, 1.45] |
| 6.1 Electro‐acupuncture vs invasive control | 1 | 90 | Mean Difference (IV, Random, 95% CI) | ‐2.09 [‐6.54, 2.36] |
| 6.2 Electro‐acupuncture vs non‐invasive control | 1 | 60 | Mean Difference (IV, Random, 95% CI) | ‐1.81 [‐7.18, 3.56] |
| 7 Quality of life (emotional) at the end of treatment Show forest plot | 2 | 167 | Mean Difference (IV, Random, 95% CI) | ‐2.25 [‐5.89, 1.39] |
| 7.1 Manual acupuncture vs invasive control | 1 | 17 | Mean Difference (IV, Random, 95% CI) | ‐5.0 [‐36.47, 26.47] |
| 7.2 Electro‐acupuncture vs invasive control | 1 | 90 | Mean Difference (IV, Random, 95% CI) | ‐2.55 [‐7.38, 2.28] |
| 7.3 Electro‐acupuncture vs non‐invasive control | 1 | 60 | Mean Difference (IV, Random, 95% CI) | ‐1.76 [‐7.38, 3.86] |
| 8 Quality of life (physical) during treatment Show forest plot | 1 | 150 | Mean Difference (IV, Random, 95% CI) | ‐0.99 [‐4.74, 2.77] |
| 8.1 Electro‐acupuncture vs invasive control | 1 | 90 | Mean Difference (IV, Random, 95% CI) | ‐2.62 [‐7.07, 1.83] |
| 8.2 Electro‐acupuncture vs non‐invasive control | 1 | 60 | Mean Difference (IV, Random, 95% CI) | 1.26 [‐4.12, 6.64] |
| 9 Quality of life (physical) at the end of treatment Show forest plot | 1 | 150 | Mean Difference (IV, Random, 95% CI) | ‐5.12 [‐10.38, 0.13] |
| 9.1 Electro‐acupuncture vs invasive control | 1 | 90 | Mean Difference (IV, Random, 95% CI) | ‐7.61 [‐12.38, ‐2.84] |
| 9.2 Electro‐acupuncture vs non‐invasive control | 1 | 60 | Mean Difference (IV, Random, 95% CI) | ‐2.23 [‐7.81, 3.35] |
| 10 Change in medication Show forest plot | 1 | 70 | Mean Difference (IV, Random, 95% CI) | ‐0.39 [‐1.71, 0.93] |
| 10.1 Electro‐acupuncture vs non‐invasive control | 1 | 70 | Mean Difference (IV, Random, 95% CI) | ‐0.39 [‐1.71, 0.93] |
| 11 Dropout from treatment Show forest plot | 7 | 501 | Risk Ratio (M‐H, Random, 95% CI) | 1.04 [0.62, 1.75] |
| 11.1 Manual acupuncture vs invasive control | 1 | 60 | Risk Ratio (M‐H, Random, 95% CI) | 0.6 [0.16, 2.29] |
| 11.2 Electro‐acupuncture vs invasive control | 4 | 224 | Risk Ratio (M‐H, Random, 95% CI) | 1.01 [0.51, 2.02] |
| 11.3 Electro‐acupuncture vs non‐invasive control | 4 | 217 | Risk Ratio (M‐H, Random, 95% CI) | 1.48 [0.56, 3.91] |
| Outcome or subgroup title | No. of studies | No. of participants | Statistical method | Effect size |
| 1 Severity of depression at the end of treatment Show forest plot | 31 | 3127 | Std. Mean Difference (IV, Random, 95% CI) | ‐0.23 [‐0.40, ‐0.05] |
| 1.1 Manual acupuncture vs SSRI | 16 | 1570 | Std. Mean Difference (IV, Random, 95% CI) | ‐0.23 [‐0.50, 0.04] |
| 1.2 Electro‐acupuncture vs SSRI | 5 | 197 | Std. Mean Difference (IV, Random, 95% CI) | ‐0.47 [‐0.85, ‐0.10] |
| 1.3 Manual acupuncture vs TCAs | 3 | 397 | Std. Mean Difference (IV, Random, 95% CI) | ‐0.28 [‐1.25, 0.69] |
| 1.4 Electro‐acupuncture vs TCAs | 5 | 801 | Std. Mean Difference (IV, Random, 95% CI) | ‐0.20 [‐0.42, 0.01] |
| 1.5 Manual acupuncture vs other antidepressant | 1 | 60 | Std. Mean Difference (IV, Random, 95% CI) | ‐0.22 [‐0.73, 0.29] |
| 1.6 Electro‐acupuncture vs heterocyclic antidepressants | 1 | 61 | Std. Mean Difference (IV, Random, 95% CI) | 0.30 [‐0.21, 0.80] |
| 1.7 Electro‐acupuncture vs other antidepressant | 1 | 41 | Std. Mean Difference (IV, Random, 95% CI) | 0.09 [‐0.52, 0.70] |
| 2 Adverse events Show forest plot | 3 | 481 | Mean Difference (IV, Random, 95% CI) | ‐4.32 [‐7.41, ‐1.23] |
| 2.1 Manual acupuncture vs SSRI | 3 | 481 | Mean Difference (IV, Random, 95% CI) | ‐4.32 [‐7.41, ‐1.23] |
| 3 Severity of depression during treatment Show forest plot | 9 | 552 | Mean Difference (IV, Random, 95% CI) | ‐1.67 [‐2.91, ‐0.43] |
| 3.1 Manual acupuncture vs SSRI | 5 | 340 | Mean Difference (IV, Random, 95% CI) | ‐1.38 [‐3.20, 0.45] |
| 3.2 Electro‐acupuncture vs SSRI | 3 | 112 | Mean Difference (IV, Random, 95% CI) | ‐2.58 [‐4.38, ‐0.78] |
| 3.3 Manual acupuncture vs TCAs | 1 | 100 | Mean Difference (IV, Random, 95% CI) | ‐0.80 [‐3.65, 2.05] |
| 4 Severity of depression 0‐6 months after treatment Show forest plot | 1 | 60 | Mean Difference (IV, Random, 95% CI) | ‐5.60 [‐7.60, ‐3.60] |
| 4.1 Manual acupuncture vs other antidepressant medication | 1 | 60 | Mean Difference (IV, Random, 95% CI) | ‐5.60 [‐7.60, ‐3.60] |
| 5 Remission of depression Show forest plot | 25 | 2918 | Risk Ratio (M‐H, Random, 95% CI) | 1.16 [1.05, 1.29] |
| 5.1 Manual acupuncture vs SSRI | 14 | 1332 | Risk Ratio (M‐H, Random, 95% CI) | 1.16 [0.98, 1.37] |
| 5.2 Electro‐acupuncture vs SSRI | 4 | 188 | Risk Ratio (M‐H, Random, 95% CI) | 1.28 [0.94, 1.75] |
| 5.3 Manual acupuncture vs TCAs | 4 | 620 | Risk Ratio (M‐H, Random, 95% CI) | 1.32 [1.03, 1.69] |
| 5.4 Electro‐acupuncture vs TCAs | 4 | 778 | Risk Ratio (M‐H, Random, 95% CI) | 1.03 [0.88, 1.21] |
| 6 Dropout from treatment Show forest plot | 5 | 246 | Risk Ratio (M‐H, Random, 95% CI) | 0.87 [0.20, 3.71] |
| 6.1 Manual acupuncture vs SSRI | 2 | 134 | Risk Ratio (M‐H, Random, 95% CI) | 0.27 [0.03, 2.47] |
| 6.2 Electro‐acupuncture vs SSRI | 3 | 112 | Risk Ratio (M‐H, Random, 95% CI) | 1.82 [0.43, 7.79] |
| Outcome or subgroup title | No. of studies | No. of participants | Statistical method | Effect size |
| 1 Severity of depression at the end of treatment Show forest plot | 11 | 813 | Std. Mean Difference (IV, Random, 95% CI) | ‐1.15 [‐1.63, ‐0.66] |
| 1.1 Manual acupuncture plus SSRI vs SSRI | 8 | 539 | Std. Mean Difference (IV, Random, 95% CI) | ‐1.32 [‐2.09, ‐0.55] |
| 1.2 Electro‐acupuncture plus SSRI vs SSRI | 5 | 274 | Std. Mean Difference (IV, Random, 95% CI) | ‐0.84 [‐1.16, ‐0.51] |
| 2 Adverse events Show forest plot | 3 | 200 | Std. Mean Difference (IV, Random, 95% CI) | ‐1.32 [‐2.86, 0.23] |
| 2.1 Manual acupuncture plus SSRI vs SSRI | 2 | 150 | Std. Mean Difference (IV, Random, 95% CI) | ‐0.37 [‐1.20, 0.47] |
| 2.2 Electro‐acupuncture plus SSRI vs SSRI | 1 | 50 | Std. Mean Difference (IV, Random, 95% CI) | ‐3.39 [‐4.27, ‐2.50] |
| 3 Severity of depression during treatment Show forest plot | 6 | 514 | Std. Mean Difference (IV, Random, 95% CI) | ‐1.60 [‐2.45, ‐0.76] |
| 3.1 Manual acupuncture plus SSRI vs SSRI | 6 | 432 | Std. Mean Difference (IV, Random, 95% CI) | ‐1.81 [‐2.83, ‐0.80] |
| 3.2 Electro‐acupuncture plus SSRI vs SSRI | 1 | 82 | Std. Mean Difference (IV, Random, 95% CI) | ‐0.70 [‐1.19, ‐0.21] |
| 4 Remission of depression Show forest plot | 9 | 618 | Risk Ratio (M‐H, Random, 95% CI) | 1.21 [0.85, 1.73] |
| 4.1 Manual acupuncture plus SSRI vs SSRI | 5 | 299 | Risk Ratio (M‐H, Random, 95% CI) | 1.33 [0.65, 2.73] |
| 4.2 Electro‐acupuncture plus SSRI vs SSRI | 5 | 273 | Risk Ratio (M‐H, Random, 95% CI) | 1.17 [0.75, 1.80] |
| 4.3 Manual acupuncture plus heterocyclic antidepressant vs medication alone | 1 | 46 | Risk Ratio (M‐H, Random, 95% CI) | 4.36 [0.53, 36.12] |
| 5 Quality of life (physical) Show forest plot | 1 | 127 | Mean Difference (IV, Fixed, 95% CI) | 1.19 [0.33, 2.05] |
| 5.1 Manual acupuncture plus SSRI vs SSRI | 1 | 64 | Mean Difference (IV, Fixed, 95% CI) | 1.40 [0.15, 2.65] |
| 5.2 Electro‐acupuncture plus SSRI vs SSRI | 1 | 63 | Mean Difference (IV, Fixed, 95% CI) | 1.0 [‐0.18, 2.18] |
| 6 Quality of life (emotional) Show forest plot | 2 | 219 | Mean Difference (IV, Random, 95% CI) | 0.25 [‐0.90, 1.40] |
| 6.1 Manual acupuncture plus SSRI vs SSRI | 2 | 111 | Mean Difference (IV, Random, 95% CI) | 0.10 [‐1.46, 1.65] |
| 6.2 Electro‐acupuncture plus SSRI vs SSRI | 2 | 108 | Mean Difference (IV, Random, 95% CI) | 0.35 [‐2.00, 2.70] |
| 7 Change in use of medication Show forest plot | 2 | 236 | Risk Ratio (M‐H, Random, 95% CI) | 0.39 [0.22, 0.67] |
| 7.1 Manual acupuncture plus SSRI vs SSRI | 2 | 154 | Risk Ratio (M‐H, Random, 95% CI) | 0.38 [0.20, 0.72] |
| 7.2 Electro‐acupuncture plus SSRI vs SSRI | 1 | 82 | Risk Ratio (M‐H, Random, 95% CI) | 0.41 [0.13, 1.30] |
| 8 Dropout from treatment Show forest plot | 5 | 426 | Risk Ratio (M‐H, Random, 95% CI) | 0.70 [0.35, 1.42] |
| 8.1 Manual acupuncture plus SSRI vs SSRI | 3 | 234 | Risk Ratio (M‐H, Random, 95% CI) | 0.45 [0.18, 1.15] |
| 8.2 Electro‐acupuncture plus SSRI vs SSRI | 3 | 192 | Risk Ratio (M‐H, Random, 95% CI) | 1.23 [0.43, 3.51] |
| Outcome or subgroup title | No. of studies | No. of participants | Statistical method | Effect size |
| 1 Severity of depression at the end of treatment Show forest plot | 2 | 497 | Std. Mean Difference (IV, Random, 95% CI) | ‐0.50 [‐1.33, 0.33] |
| 1.1 Manual acupuncture | 2 | 497 | Std. Mean Difference (IV, Random, 95% CI) | ‐0.50 [‐1.33, 0.33] |
| 2 Adverse events Show forest plot | 1 | 453 | Risk Ratio (M‐H, Random, 95% CI) | 0.62 [0.29, 1.33] |
| 2.1 Manual acupuncture | 1 | 453 | Risk Ratio (M‐H, Random, 95% CI) | 0.62 [0.29, 1.33] |
| 3 Severity of depression 0‐6 months after treatment Show forest plot | 1 | 453 | Mean Difference (IV, Random, 95% CI) | 0.5 [‐0.51, 1.51] |
| 3.1 Manual acupuncture | 1 | 453 | Mean Difference (IV, Random, 95% CI) | 0.5 [‐0.51, 1.51] |
| 4 Severity of depression 6‐12 months Show forest plot | 1 | 453 | Mean Difference (IV, Random, 95% CI) | 0.60 [‐0.80, 2.00] |
| 4.1 Manual acupuncture | 1 | 453 | Mean Difference (IV, Random, 95% CI) | 0.60 [‐0.80, 2.00] |
| 5 Remission of depression | 0 | Risk Ratio (M‐H, Random, 95% CI) | Subtotals only | |
| 5.1 Manual acupuncture | 0 | 0 | Risk Ratio (M‐H, Random, 95% CI) | 0.0 [0.0, 0.0] |
| 6 Change in use of medication Show forest plot | 1 | 453 | Risk Ratio (M‐H, Random, 95% CI) | 0.82 [0.61, 1.10] |
| 6.1 Manual acupuncture | 1 | 453 | Risk Ratio (M‐H, Random, 95% CI) | 0.82 [0.61, 1.10] |
| 7 Dropout from treatment Show forest plot | 1 | 453 | Risk Ratio (M‐H, Random, 95% CI) | 0.27 [0.08, 0.90] |
| 7.1 Manual acupuncture | 1 | 453 | Risk Ratio (M‐H, Random, 95% CI) | 0.27 [0.08, 0.90] |